 Jie Lou1,2†Bingxin Gong2,3†Yi Li2,3†Yusheng Guo2,3Lin Li2,3
 Jing Wang2,3Weiwei Liu2,3Ziang You2,3
 Hongyong Zhang4
 Feng Pan2,3
 Bo Liang2,3
 Lian Yang2,3*
 Guofeng Zhou2,3*
- 1Department of Ultrasound Medicine, Union Hospital, Tongji Medical College, Huazhong University of Science and Technology, Wuhan, China
- 2Hubei Key Laboratory of Molecular Imaging, Wuhan, China
- 3Department of Radiology, Union Hospital, Tongji Medical College, Huazhong University of Science and Technology, Wuhan, China
- 4Department of Hematology, Union Hospital, Tongji Medical College, Huazhong University of Science and Technology, Wuhan, China
Background: Immune checkpoint inhibitors (ICIs) have left a deep impression in the treatment of non-small cell lung cancer (NSCLC), however, not all patients benefit from it. The purpose of this study was to investigate the prognostic value of baseline bone mineral density (BMD) derived from chest computed tomography (CT) scans in NSCLC patients treated with ICIs.
Methods: This study included patients with advanced NSCLC who underwent ICI treatment at the Wuhan Union Hospital from March 2020 to October 2022. Baseline BMD was evaluated at non-contrast chest CT at the level of first lumbar vertebra. Patients were divided into BMD-lower group and BMD-higher group according to the optimal cutoff value calculated by X-tile software. Baseline characteristics of the two groups were compared and variables between the two groups were balanced by propensity score matching (PSM) analysis. We calculated the objective response rate (ORR) and disease control rate (DCR) of the two groups and analyzed overall survival (OS) and progression-free survival (PFS) using BMD and other clinical indexes through Cox regression models and Kaplan-Meier survival curves.
Results: A total of 479 patients were included in this study, and all patients were divided into BMD-lower group (n=270) and BMD-higher group (n=209). After PSM analysis, each group consisted of 150 patients. ORR (43.3% vs. 43.5% before PSM, P = 0.964; 44.7% vs. 44.7% after PSM, P = 1.000) and DCR (91.1% vs. 94.3% before PSM, P = 0.195; 93.3% vs. 96.7% after PSM, P =0.190) were similar in two groups. There was no statistically significant relationship between BMD degree and PFS before (16.0 months vs. 18.0 months, P = 0.067) and after PSM analysis (17.0 months vs. 19.0 months, P = 0.095). However, lower BMD was associated with shorter OS both before (20.5 months vs. 23.0 months, P< 0.001) and after PSM analysis (20.0 months vs. 23.0 months, P = 0.008).
Conclusion: Lower baseline BMD is associated with worse clinical outcomes in NSCLC patients treated with ICIs. As a reliable and easily obtained individual prognostic biomarker, BMD can become a routine detection indicator before immunotherapy.
Introduction
Lung cancer is the leading cause of cancer death worldwide and non-small cell lung cancer (NSCLC) accounts for approximately 85% of all lung cancers (1). Unprecedented advances have been made in the treatment of lung cancer, such as new targeted therapies and immunotherapies (2). Immune Checkpoint Inhibitors (ICIs), including anti-programmed cell death protein 1 (PD-1), anti-programmed death-ligand 1 (PD-L1), and anti-cytotoxic T-lymphocyte-associated protein 4 (CTLA-4), could block inhibitory signals of T cell activation to promote anti-tumor immune response (3). ICIs have greatly prolonged survival for patients with advanced or metastatic NSCLC (4). However, a subset of patients do not derive clinical benefit and may even develop disease progression with ICIs due to systemic factors (5). Therefore, there is an urgent need for reliable predictive biomarkers to identify patients who are suitable for immune checkpoint therapy.
As a chronic wasting disease, malignant tumors cause the prevalence of osteopenia and sarcopenia to be significantly higher than that in people of the same age (6, 7). As a result of malnutrition, these protracted musculoskeletal disorders negatively influence the quality of life ultimately resulting in a poor prognosis. Notably, a number of studies have reported that sarcopenia was significantly associated with increased mortality in patients with NSCLC (8, 9), however, the association between osteopenia and the prognosis of NSCLC has been less frequently reported, especially among patients receiving immunotherapy. T-score evaluated by dual-energy X-ray absorptiometry (DXA) was the gold standard for osteoporosis diagnosis (10). Currently, computed tomography (CT)-derived bone mineral density (BMD) was reported to be correlated with T-score and has been widely used to evaluate preoperative osteopenia in patients with digestive tract cancers (11). Patients with lung cancer routinely receive chest CT scans, and BMD can be obtained non-invasively through measuring the HU value at the level of the first lumbar vertebra.
To the best of our knowledge, there are no studies reporting the impact of baseline BMD on the efficacy of immunotherapy and clinical prognosis in patients with NSCLC. Therefore, we evaluated the objective response rate (ORR) and disease control rate (DCR) after the treatment of ICIs in NSCLC patients with low baseline BMD and high baseline BMD and tried to analyze overall survival (OS) and progression-free survival (PFS) using BMD and other clinical indexes through Cox regression models and Kaplan-Meier survival curves.
Materials and methods
The local ethics committee and the institutional review board of the Tongji Medical College have approved this retrospective cohort study (Institutional Review Board No. S054), and they waived the requirement for informed consent. Clinical data were analyzed retrospectively and anonymously.
Study design and patients selection
Consecutive advanced NSCLC patients treated with ICIs between March 2020 to October 2022 at Wuhan Union Hospital were reviewed retrospectively. The diagnosis of NSCLC was based on radiological imaging, medical history, and/or lung biopsy.
Inclusion criteria were as follows: (1) Patients diagnosed with advanced NSCLC according to the NCCN Clinical Practice Guidelines in Oncology: Non-Small Cell Lung Cancer (2); (2) Patients older than 18 years; (3) The follow-up duration was more than 12 months; (4) Performing non-contrast chest CT before initial ICIs; (5) Patient received ICI treatment for the first time and for more than 4 cycles. Exclusion criteria were as follows: (1) Patients who did not undergo baseline CT; (2) Patients combined with other malignant tumors; (3) Patients with incomplete clinical information.
Procedures
Covariates of interest were collected retrospectively, including patient demographics (age, sex, body mass index, ECOG status, diabetes, hypertension, smoking, hyperlipidemia, COPD), biochemical data (alkaline phosphatase, lactic dehydrogenase, Ca, blood urea nitrogen, hemoglobin, albumin-globulin ratio, neutrophil to lymphocyte ratio, platelet to lymphocyte ratio), tumor-related information (pathological types, stages) and further disease specific information (type of ICIs, prior radiation therapy, occurrence of vertebral bone metastasis, corticosteroid application and osteopenia treatment). All baseline data are derived from the first admission and discharge medical records of patients.
Bone mineral density measurement and assessment
The CT examinations were performed on the 128-section CT scanner (SIEMENS SOMATOM Definition AS+, Siemens Healthcare Erlangen, Germany) using the same parameters. Tube voltage: 120kVp. Tube current: automatically adjusted. Reconstruction method: standard soft convolution kernel. Slice thickness: 1 mm. Slice interval: 1 mm. Two independent radiologists (L.B. and P.F. with 26 and 15 years of thoracic imaging experience, respectively) analyzed images and calculated the BMD independently on the Phillips Intelli Space Portal workstation (version 10.1, Best, the Netherlands), blinded to the clinical data. The average BMD from two independent radiologists was calculated for subsequent analysis and any disagreements were resolved by consensus. BMD was calculated as the average pixel density (HU) within a circle in the mid vertebral core at the bottom of the first lumbar vertebra on non-contrast chest CT (Figure 1). Draw three regions of interest (ROIs) repeatedly and average them to reduce errors. If the difference in HU values among them is greater than 30, another observer would repeat the drawing and calculation. Evaluations were repeated using the same method after two weeks, and intraobserver and interobserver agreements were 0.94 (95% CI, 0.89 to 0.97) and 0.90 (95% CI, 0.84 to 0.93), respectively. Using the X-tile software (version 3.6.1) to obtain the optimal cutoff value, all patients were divided into the BMD-lower group and BMD-higher group. To demonstrate osteopenia, this study also measured BMD at the tenth thoracic vertebra and performed correlation analysis between two BMD measurements from the first lumbar vertebra and the tenth thoracic vertebra. Age-adjusted standard BMD was calculated by the following formulae (12):
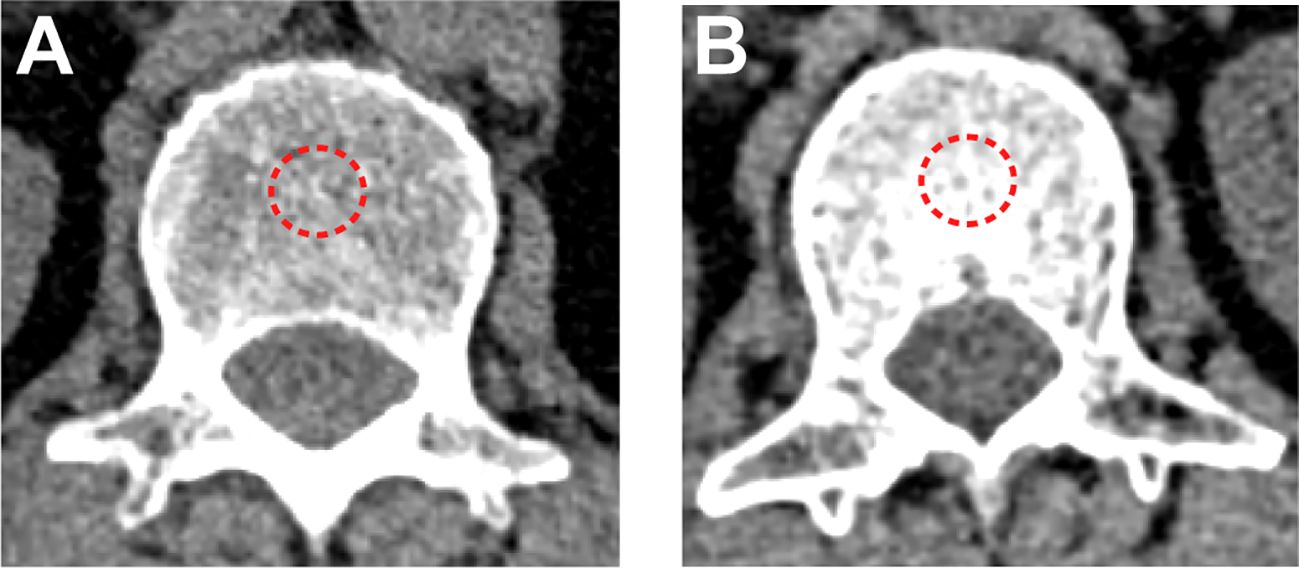
Figure 1 BMD measured by non-contrast chest CT scan. (A) A patient in the BMD-lower group (BMD=83 HU). (B) A patient in the BMD-higher group (BMD=190 HU). The red dotted line represents the outlined regions of interest.
Definition and evaluation of data
All patients underwent follow-up until October 2023. Follow-up chest CT was compared to the baseline imaging to determine the time of PFS and the ratio of ORR and DCR between the two groups based on the Response Evaluation Criteria in Solid Tumors, version 1.1 (13). ORR and DCR were calculated based on the number of complete response (CR), partial response (PR), and stable disease (SD). PFS was defined as the time elapsed between initial ICI treatment and the onset of tumor progression or patient death. OS was defined as the period from the initial ICI treatment to the last follow-up or patient death.
In addition, we calculated the incidences of skeletal-related events (SRE) in the BMD-lower group and BMD-higher group. SRE include pathologic fracture, need for surgery/radiation therapy to bone and spinal cord compression (14, 15).
Statistical analysis
The mean and standard deviation of continuous variables were compared using the paired or independent student’s t-test, and the percentages of discrete variables were calculated using the Chi-square test. Correlation was performed using Pearson’s correlation analysis and Spearman’s correlation analysis. The cut-off values (BMD-related indexes) were determined using the X-tile software (Yale University School of Medicine, New Haven, Connecticut, USA). This software provided a comprehensive approach to dividing a cohort into low-level and high-level marker expressions based on survival curves (16). Propensity score matching (PSM) analysis was performed with a caliper value of 0.05 to reduce patient selection bias and to balance the variables between the BMD-lower and BMD-higher groups. One-to-one matching based on baseline characteristics of patients. The Kaplan-Meier method and the log-rank test were used to compare the differences in PFS, and OS in two groups. In the Cox regression analysis, variables with a univariate P value less than 0.1 were included in the multivariable Cox regression model. PFS and OS hazard ratios for each subgroup were calculated using unstratified univariate Cox models and presented as forest plots. All the tests were two-tailed; a P-value of less than 0.05 denoted statistical significance. All analyses were performed with SPSS version 26.0 software (IBM, Armonk, NY, USA), and R version 4.3.0 (R Foundation).
Results
Patient characteristics
This study included 479 patients with advanced NSCLC (270 in the BMD-lower group and 209 in the BMD-higher group), and all of these underwent the treatment of ICIs. Table 1 shows the baseline demographic and clinical characteristics of patients before and after PSM analysis. Compared with the BMD-higher group, the BMD-lower group had a higher proportion of patients older than 65 years old and a higher prevalence of hypertension. In addition, the BMD-lower group had a higher proportion of patients with ECOG ≥1. These differences were reduced after PSM analysis and reached balance. After PSM analysis, both the BMD-lower group and the BMD-higher group consist of 150 patients (Table 1). Baseline characteristics of patients excluded by PSM are shown in Supplementary Table 1. Histogram of propensity scores showed a closer distribution of propensity scores between the BMD-lower and BMD-higher groups after matching (Supplementary Figures 1A, B).
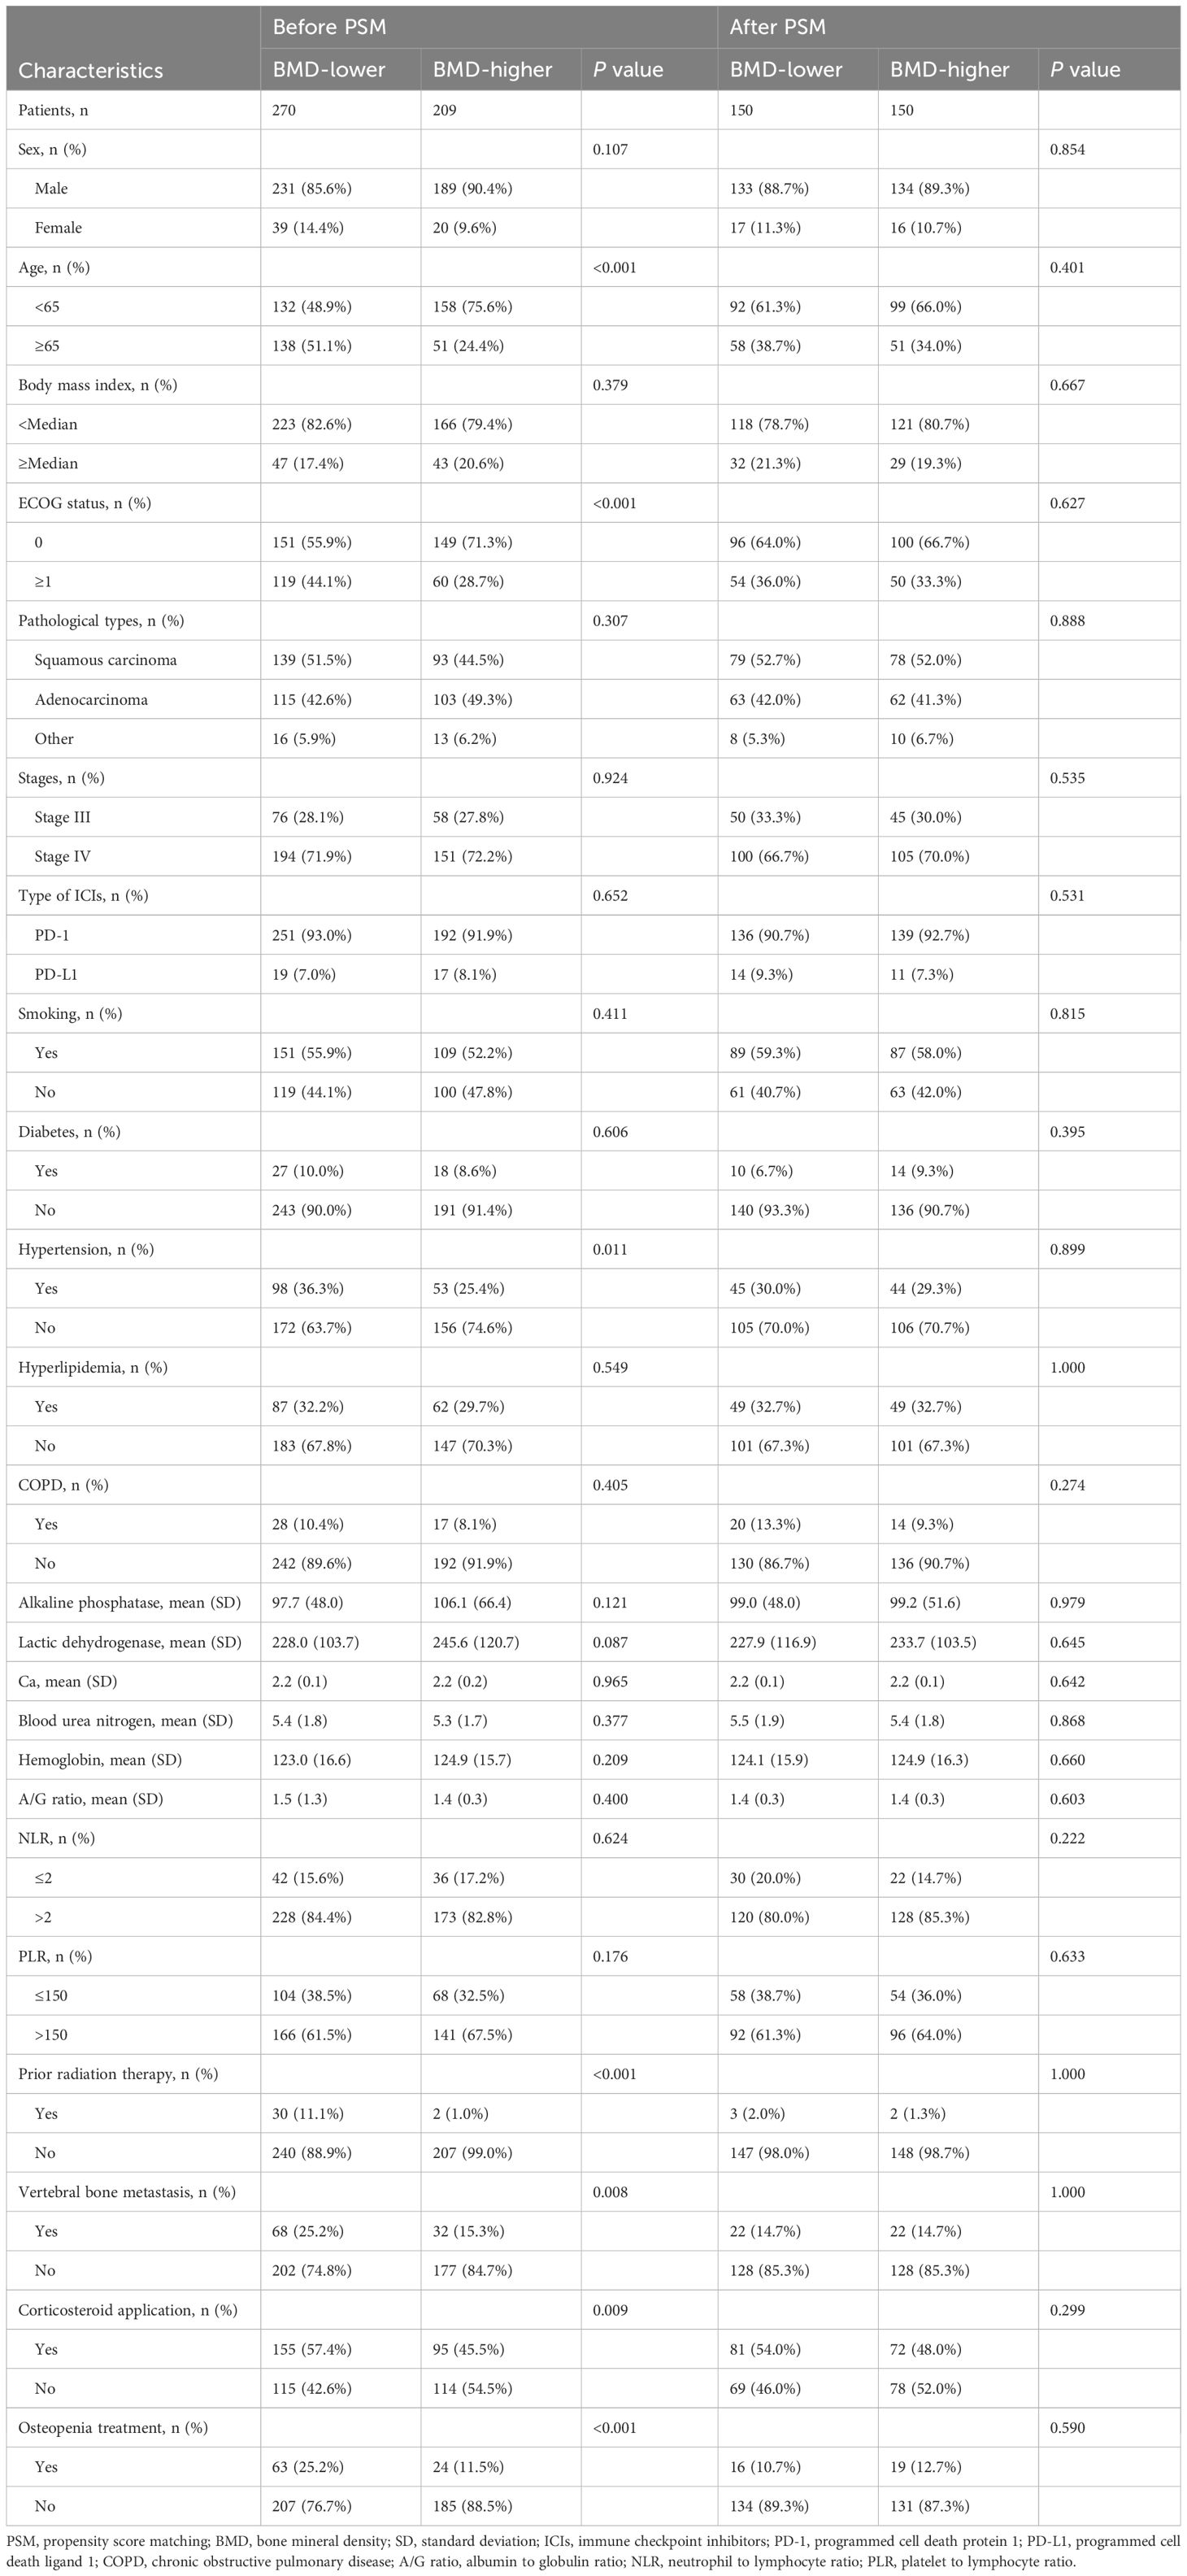
Table 1 Baseline characteristics of patients before and after PSM analysis.
The optimum cutoff value of BMD
The X-tile software was used to determine the optimal cutoff value for BMD classification (Supplementary Figures 2A, B). Specifically, we used the OS outcome as a reference, and on the basis of ensuring that the OS of the two groups of patients were in the same trend at all cutoff points, we selected the point with the most significant difference in the outcomes of the two groups of patients. Finally, the cutoff value was determined to be 138 HU, and 270 patients were classified into the BMD-lower group and 209 patients were classified into the BMD-higher group.
To demonstrate osteopenia, this study performed a correlation analysis between two BMD measurements taken from the first lumbar vertebra and the tenth thoracic vertebra in the same subject. Scatter plots showed significant correlations between the two BMD measurements before (R=0.947, P<0.001) and after PSM analysis (R=0.955, P<0.001) (Supplementary Figures 3A, B).
Tumor response
The tumor responses of the BMD-lower group and BMD-higher group before and after PSM analysis are shown in Supplementary Tables 2, 3. Overall, short-term therapeutic effects were similar between the two groups. Before PSM analysis, the ORR and DCR of the BMD-lower group were 43.3% and 91.1%, respectively, and were 43.5% and 94.3% in the BMD-higher group, with no statistical difference (ORR, P = 0.964; DCR, P = 0.195). Similarly, there were also no statistically significant differences in ORR (44.7% vs. 44.7%, P ;= 1.000) and DCR (93.3% vs. 96.7%, P = 0.190) between the two groups after PSM analysis. It is worth noting that before PSM analysis, compared with the BMD-higher group, the proportion of patients in the BMD-lower group reaching PD was higher (8.9% vs. 5.7%). After PSM analysis, the difference was still existed (6.6% vs. 3.3%).
SRE
The incidences of SRE in the BMD-lower group and BMD-higher group are shown in Supplementary Table 4. Compared with the BMD-higher group, the incidences of SRE in the BMD-lower group was higher (17.4% vs. 4.8%, P<0.001).
Survival analysis
The median follow-up time was 22.0 months (IQR, 17.0-29.0 months), and during follow-up, 88 of 270 (32.6%) patients died in the BMD-lower group and 40 of 209 (19.1%) patients died in the BMD-higher group. Kaplan‐Meier survival curves of PFS and OS were conducted between patients with baseline BMD ≤ 138 HU and with baseline BMD > 138 HU. The log-rank tests indicated that the BMD-lower group had the shorter PFS (16.0 months vs. 18.0 months, P = 0.067) and OS (20.5 months vs. 23.0 months, P< 0.001) than the BMD-higher group before the PSM analysis (Figures 2A, B). Likewise, after the PSM analysis, the BMD-lower group still had a shorter PFS (17.0 months vs. 19.0 months, P = 0.095) than the BMD-higher group, although there is no statistical difference (Figure 2C). And the OS (20.0 months vs. 23.0 months, P = 0.008) of the BMD-lower group was significantly shorter than that of the BMD-higher group, reaching statistical significance (Figure 2D).
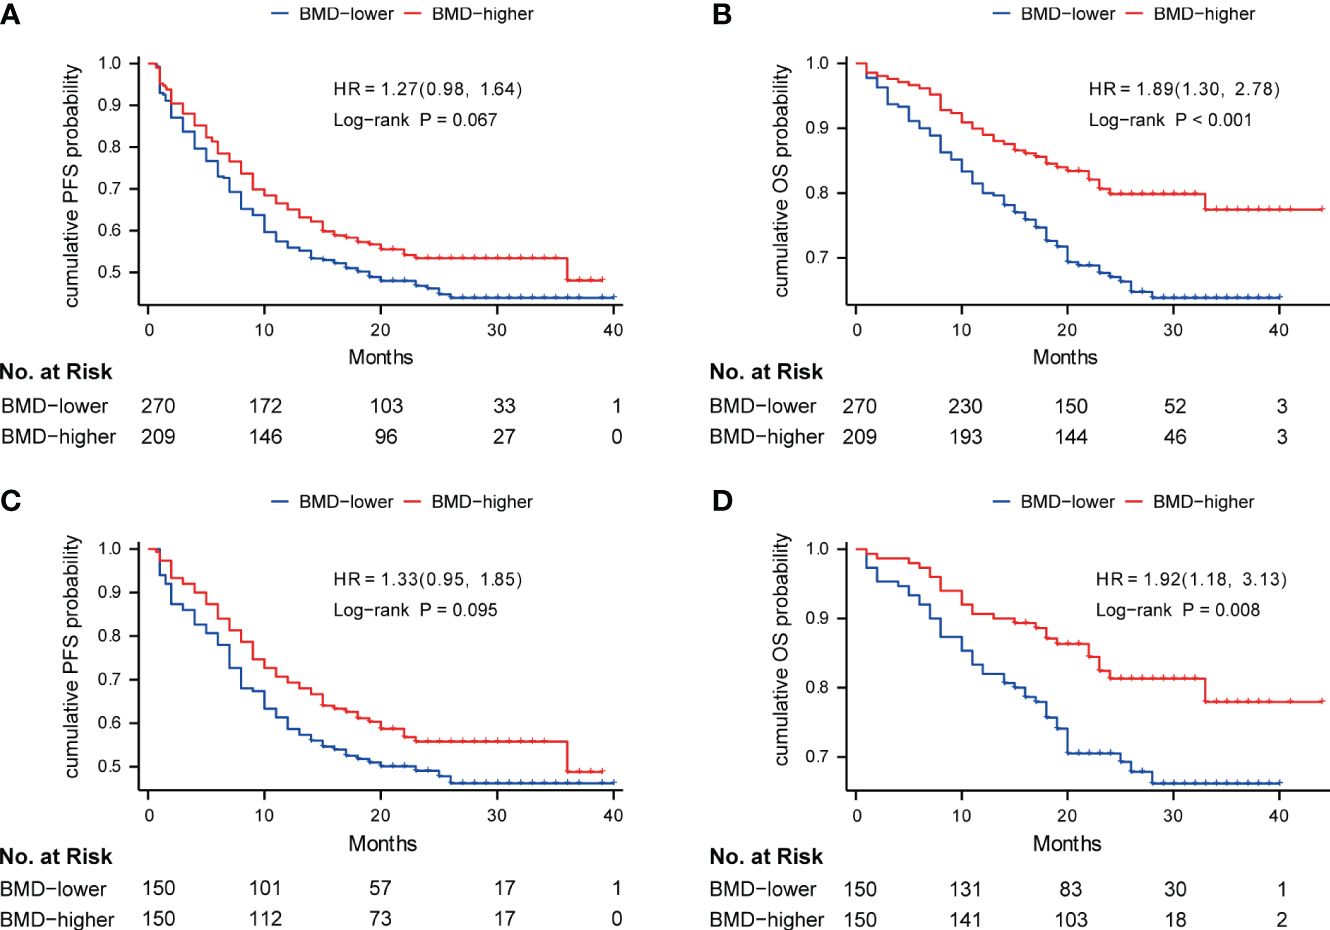
Figure 2 Kaplan-Meier curve of PFS (A) and OS (B) in the BMD-lower group (blue) and BMD-higher group (red) before PSM analysis; Kaplan-Meier curve of PFS (C) and OS (D) in two groups after PSM analysis. Analyses were conducted using LogRank tests. BMD, bone mineral density; PFS, progression-free survival; OS, overall survival; PSM, propensity score matching.
Patients were divided into 3 groups according to the tertiles of BMD. Kaplan–Meier curves showed patients in the highest tertile of BMD had better OS compared to those in the lowest tertile before PSM analysis (P = 0.030) (Supplementary Figure 4A). This trend was still significant after PSM analysis (P = 0.042) (Supplementary Figure 4B). Meanwhile, we performed a correlation analysis to determine if an association existed between BMD and OS. Scatter plots showed the correlation between BMD and OS before (R=0.325, P< 0.001) and after PSM analysis (R=0.337, P< 0.001) (Supplementary Figures 5A, B). Furthermore, the relationship of BMD, clinical features and survival of patients in different BMD groups before and after PSM analysis are shown in heat maps (Figures 3A, B).
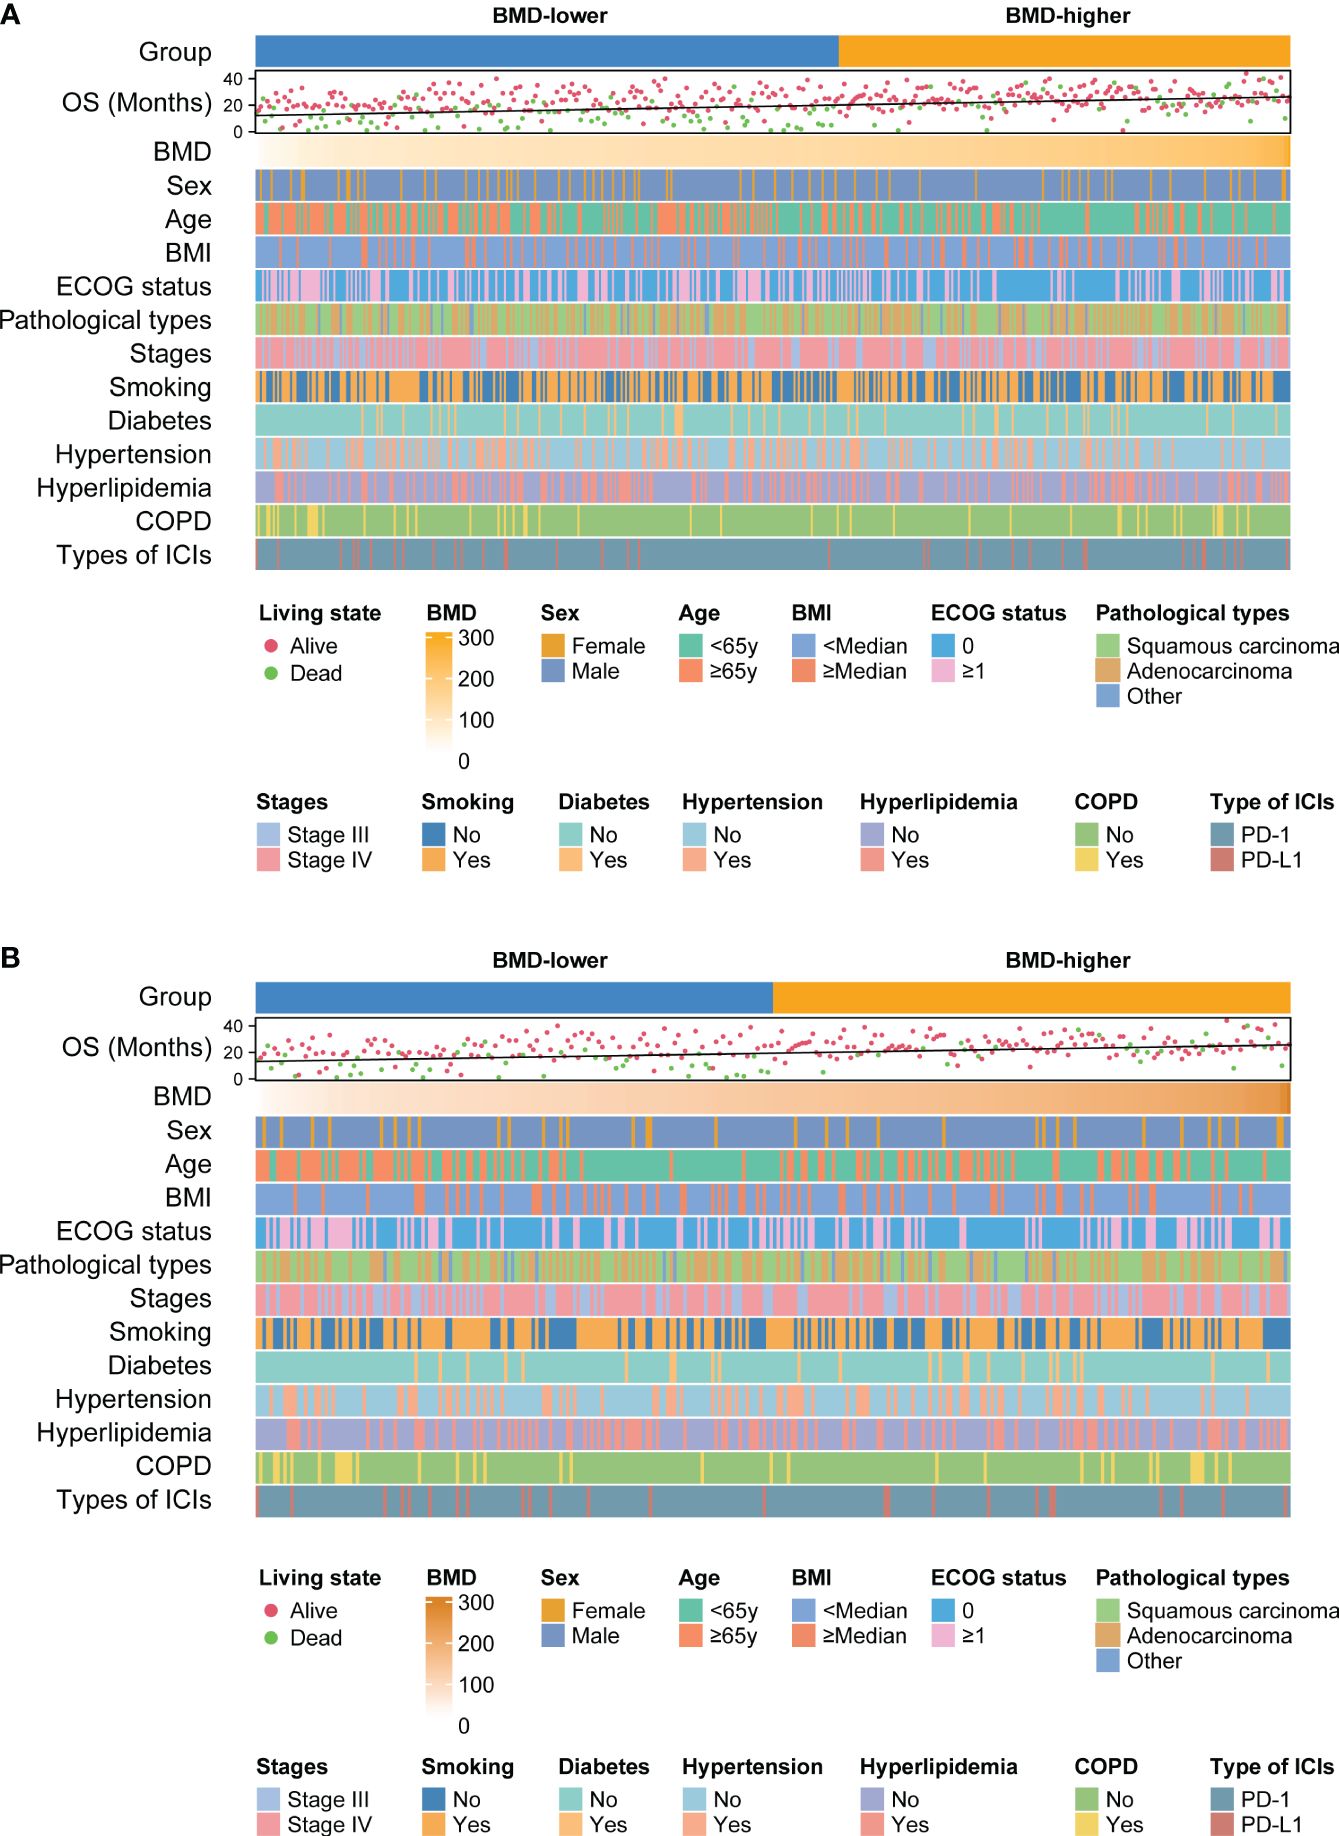
Figure 3 Heat maps shows the relationship between BMD, clinical features of patients and survival outcomes before (A) and after (B) PSM analysis. BMD, bone mineral density; OS, overall survival; COPD, chronic obstructive pulmonary disease; ICIs, immune checkpoint inhibitors; PD-1, programmed cell death protein 1; PD-L1, programmed cell death ligand 1; PSM, propensity score matching.
To decrease the influence of age on our findings, we calculated each patient’s age-adjusted standard BMD and divided patients into the osteopenia group (n=314) and the non-osteopenia group (n=165) based on the standard BMD. Notably, the OS of the non-osteopenia group was better than that of the osteopenia group (P = 0.019) and a similar trend was found in the PFS of the two groups (P =0.059) (Supplementary Figures 6A, B).
In addition, to explore the predictive value of BMD in non-immunotherapy patients, we randomly selected 100 patients with NSCLC who receive standard chemotherapy at the same time. Patients were divided into the low group (n=65) and the high group (n=35) based on calculated age-adjusted standard BMD values. We found that there were no significant differences in the PFS between the two groups (P =0.671) (Supplementary Figure 7A). The high group had a longer OS than the low group, although there is no statistical difference (P =0.063) (Supplementary Figure 7B).
It is worth noting that some patients in the BMD-lower group received osteopenia treatment. After analysis, there were no significant differences in the PFS between the two groups (P =0.429) (Supplementary Figure 8A). Patients who received osteopenia treatment had a longer OS than those who did not, although the difference did not reach statistical significance (P =0.097) (Supplementary Figure 8B).
Cox regression analysis and subgroup analysis
Before PSM analysis, ECOG status, stages, alkaline phosphatase, blood urea nitrogen, albumin to globulin ratio, neutrophil to lymphocyte ratio, platelet to lymphocyte ratio, vertebral bone metastasis, corticosteroid application, skeletal-related events and group were identified as potential predictors for PFS, and age, ECOG status, stages, hypertension, alkaline phosphatase, albumin to globulin ratio, neutrophil to lymphocyte ratio, platelet to lymphocyte ratio, vertebral bone metastasis, corticosteroid application, and group were identified as potential predictors for OS in the univariable regression analysis. These covariates were further included in the multivariate regression analysis. In the multivariate analyses, stage IV (HR, 1.72[95%Cl, 1.21 to 2.46]; P =0.003), lower albumin to globulin ratio (HR, 1.75 [95%Cl, 1.12 to 2.70]; P = 0.013)and corticosteroid application (HR, 1.39 [95%Cl, 1.06 to 1.81]; P = 0.017) were significantly associated with shorter PFS (Supplementary Table 5), and aged over 65 years old (HR, 1.53[95%Cl, 1.04 to 2.24]; P =0.029), ECOG status ≥1 (HR, 1.43 [95%Cl, 1.00 to 2.05]; P = 0.048), stage IV (HR, 1.64[95%Cl, 1.00 to 2.70]; P =0.049), higher alkaline phosphatase (HR, 1.00 [95%Cl, 1.00 to 1.01]; P = 0.006)and BMD-lower group (HR, 1.60[95%Cl,1.07 to 2.40]; P = 0.022) were significantly associated with shorter OS (Supplementary Table 6). After PSM analysis, higher albumin to globulin ratio (HR, 1.00 [95%Cl, 1.00 to 1.01]; P =0.049) and stage IV (HR, 2.13[95%Cl, 1.35 to 3.33]; P<0.001) were significant risk factors associated with a shorter PFS (Table 2), and aged over 65 years old (HR, 1.81[95%Cl, 1.10 to 2.97]; P = 0.020), stage IV (HR, 1.97 [95%Cl, 1.06 to 3.66]; P =0.032), higher alkaline phosphatase (HR, 1.00 [95%Cl, 1.00 to 1.01]; P = 0.025), lower albumin to globulin ratio (HR, 2.38 [95%Cl, 1.00 to 5.56]; P = 0.044), and BMD-lower group (HR, 1.90 [95%Cl, 1.16 to 3.12]; P = 0.011) were significant risk factors associated with a shorter OS (Table 3).
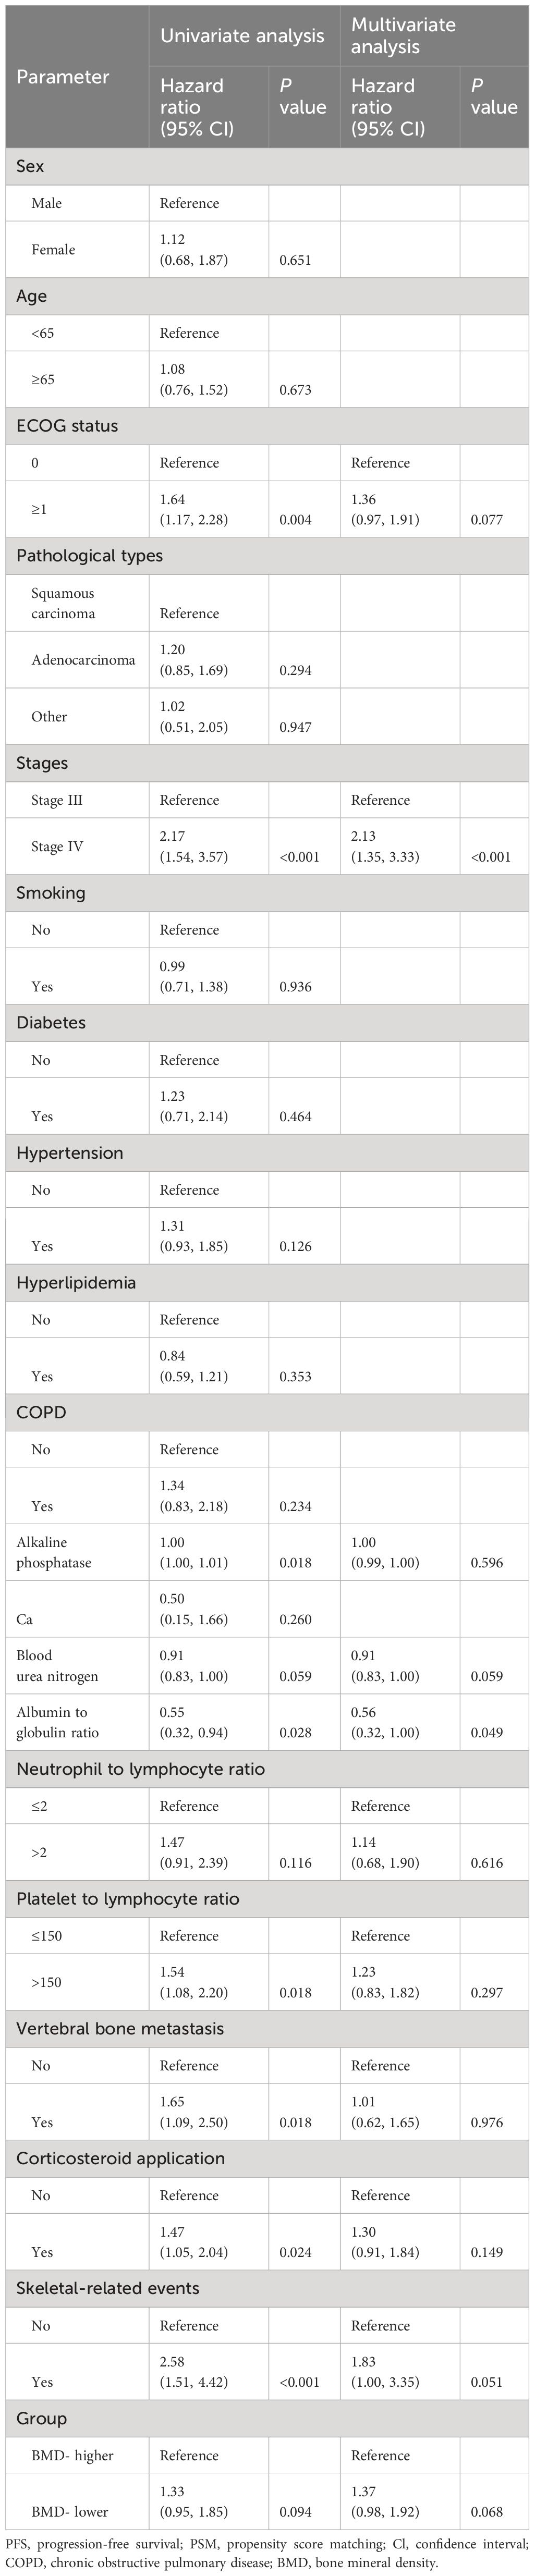
Table 2 Univariate and multivariate Cox proportional hazards analyses for PFS after PSM analysis.
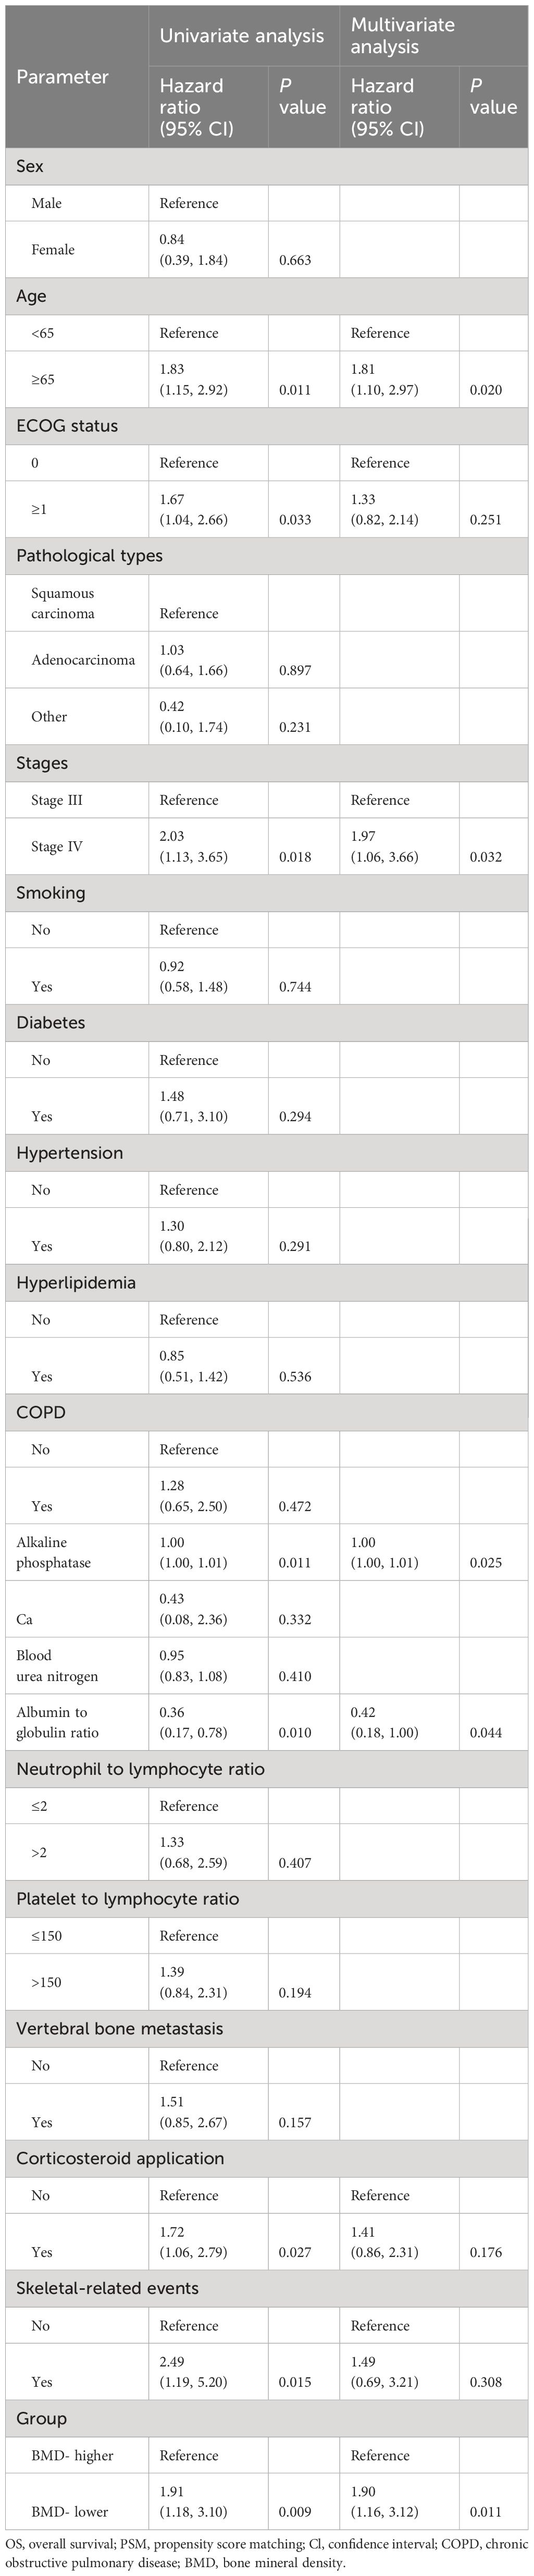
Table 3 Univariate and multivariate Cox proportional hazards analyses for OS after PSM analysis.
We performed a subgroup analysis of patients after PSM analysis based on baseline characteristics and observed relatively consistent results for PFS and OS, and hazard ratios for each subgroup were derived from the univariate Cox model. Among each subgroup of PFS (Figure 4), we found an interaction between age and ICI use. Except for the subgroup aged ≥ 65 years, the risk of PFS in the BMD-lower group was higher than that in the BMD-higher group. In the subgroup analysis of OS (Figure 5), the BMD-lower group showed a higher risk in all subgroups, including those aged ≥ 65 years, although some subgroups did not reach statistical differences.
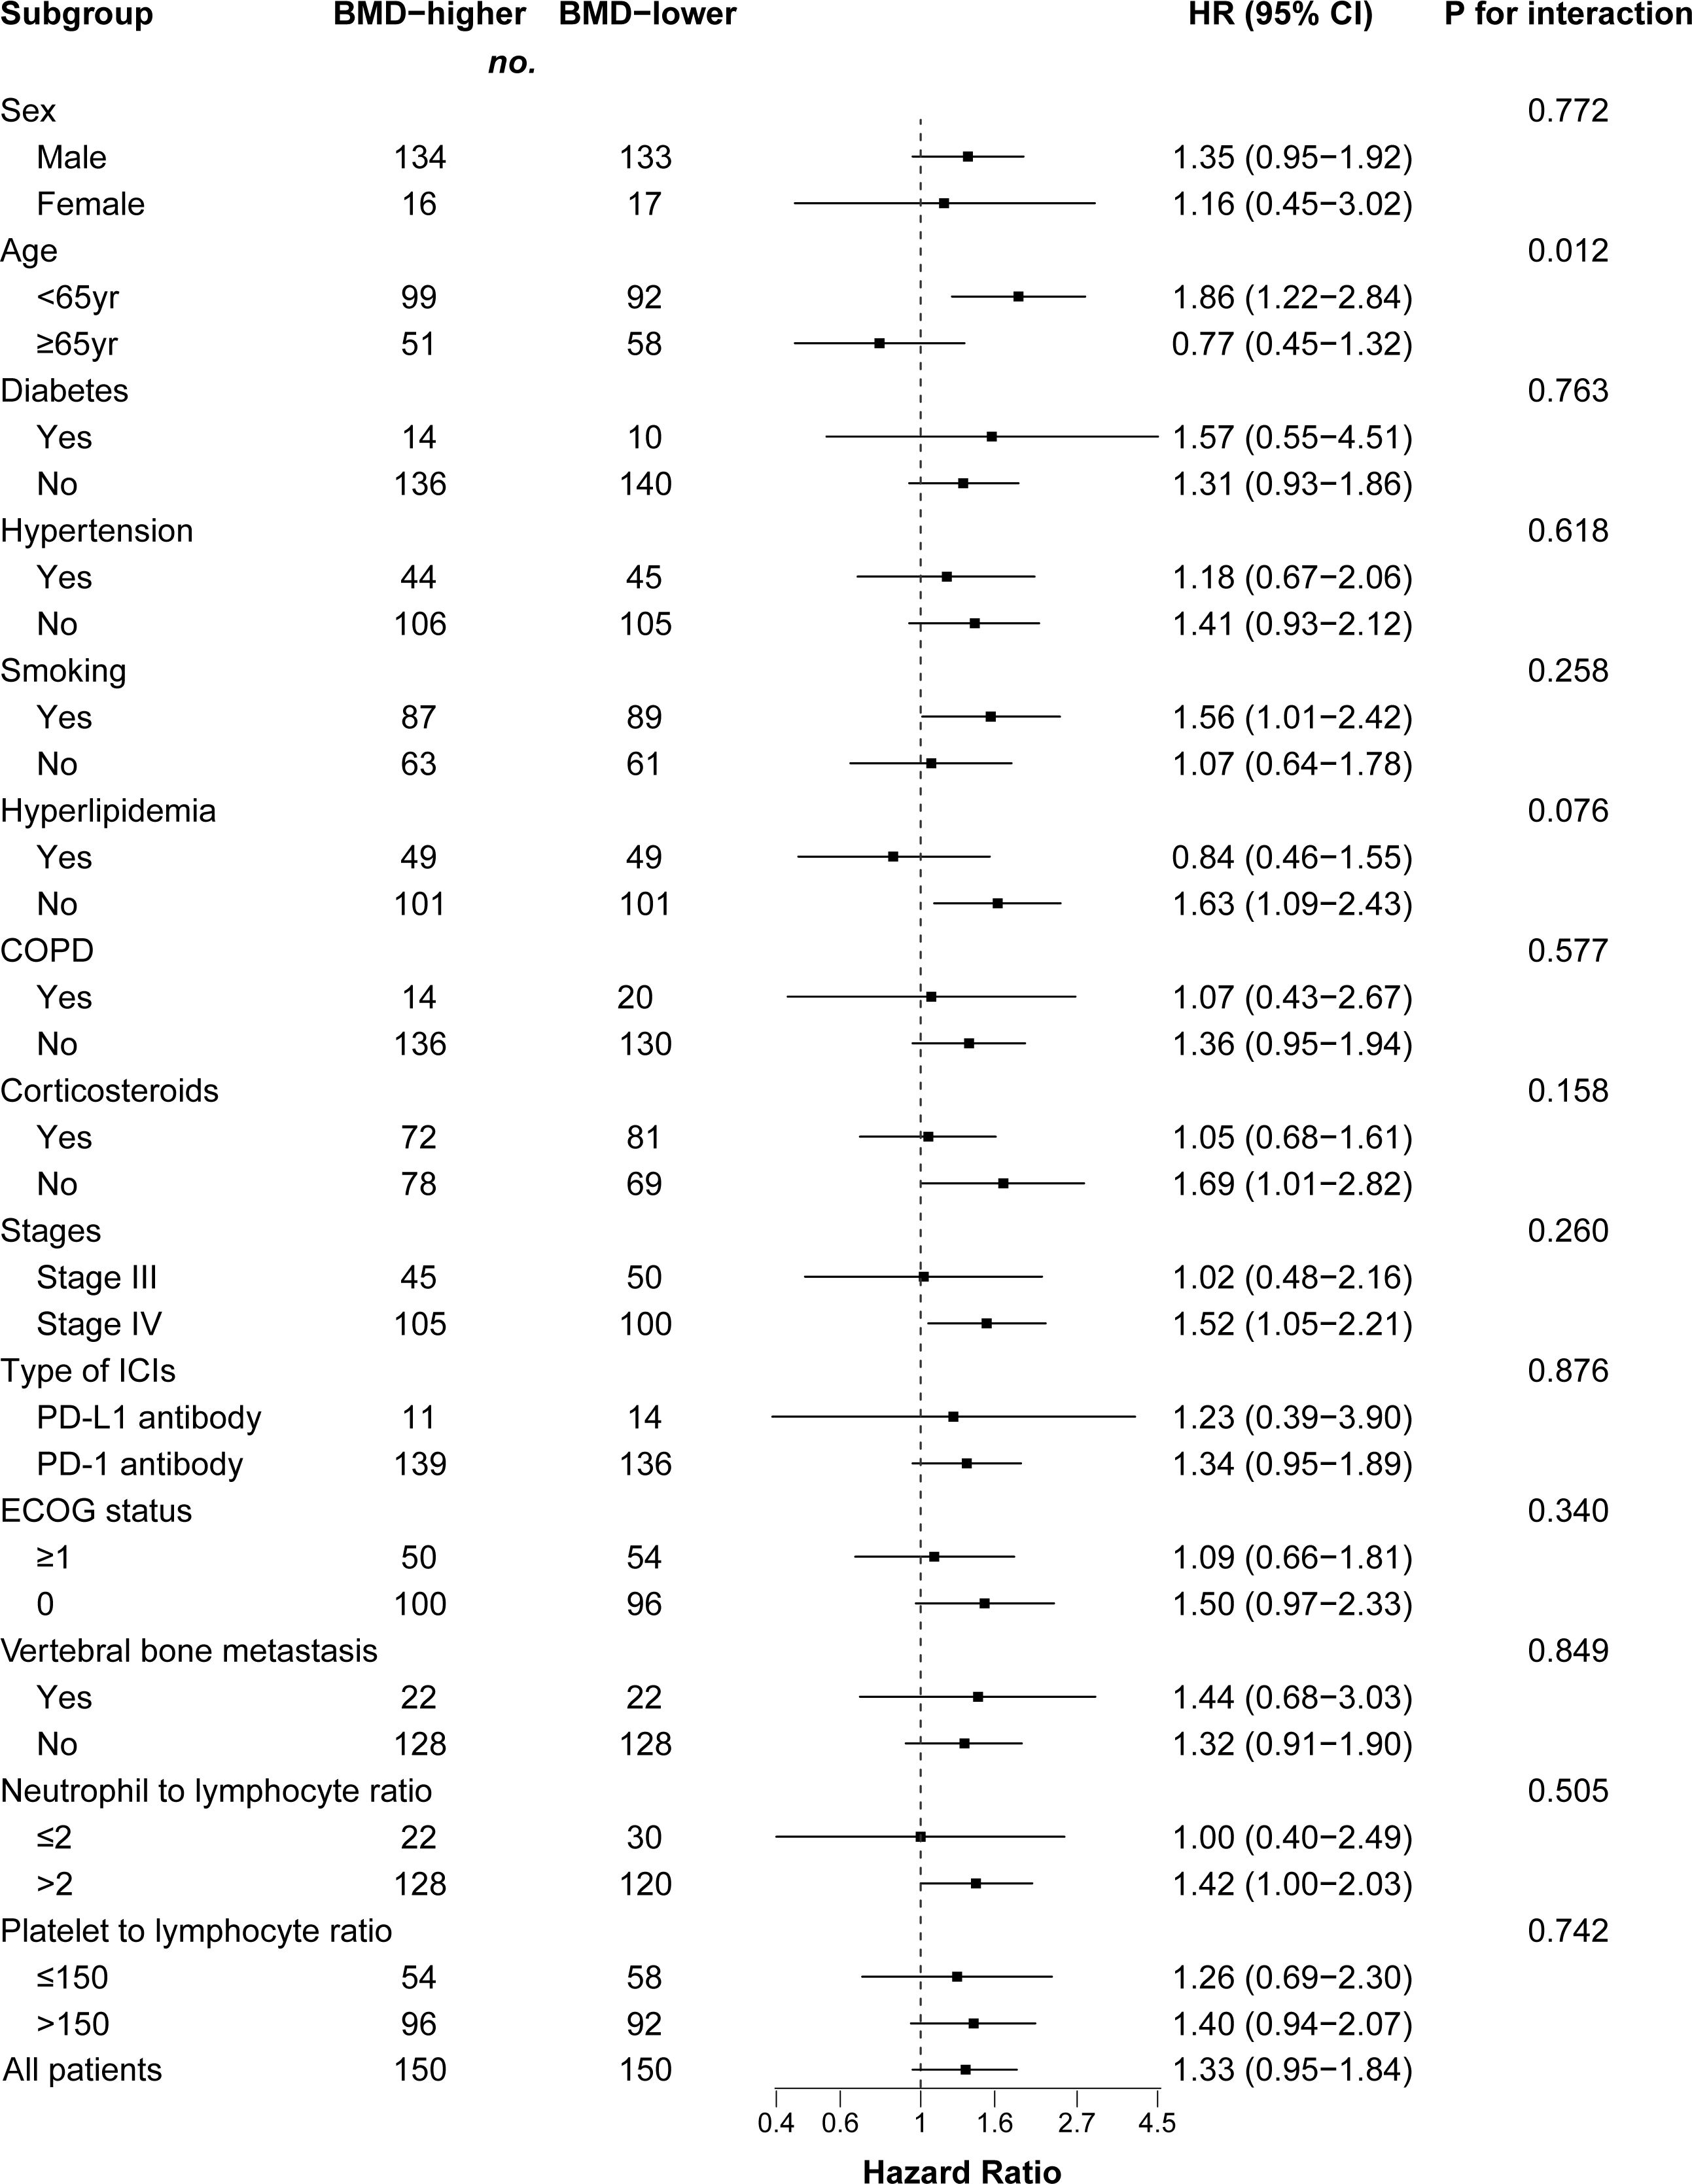
Figure 4 Forest plot of subgroup analysis in progression-free survival between the BMD-lower group and BMD-higher group. Dashed line indicates Hazard ratio of 1. BMD, bone mineral density; HR, hazard ratio; CI, confidence interval; COPD, chronic obstructive pulmonary disease; ICIs, immune checkpoint inhibitors; PD-1, programmed cell death protein 1; PD-L1, programmed cell death ligand 1.
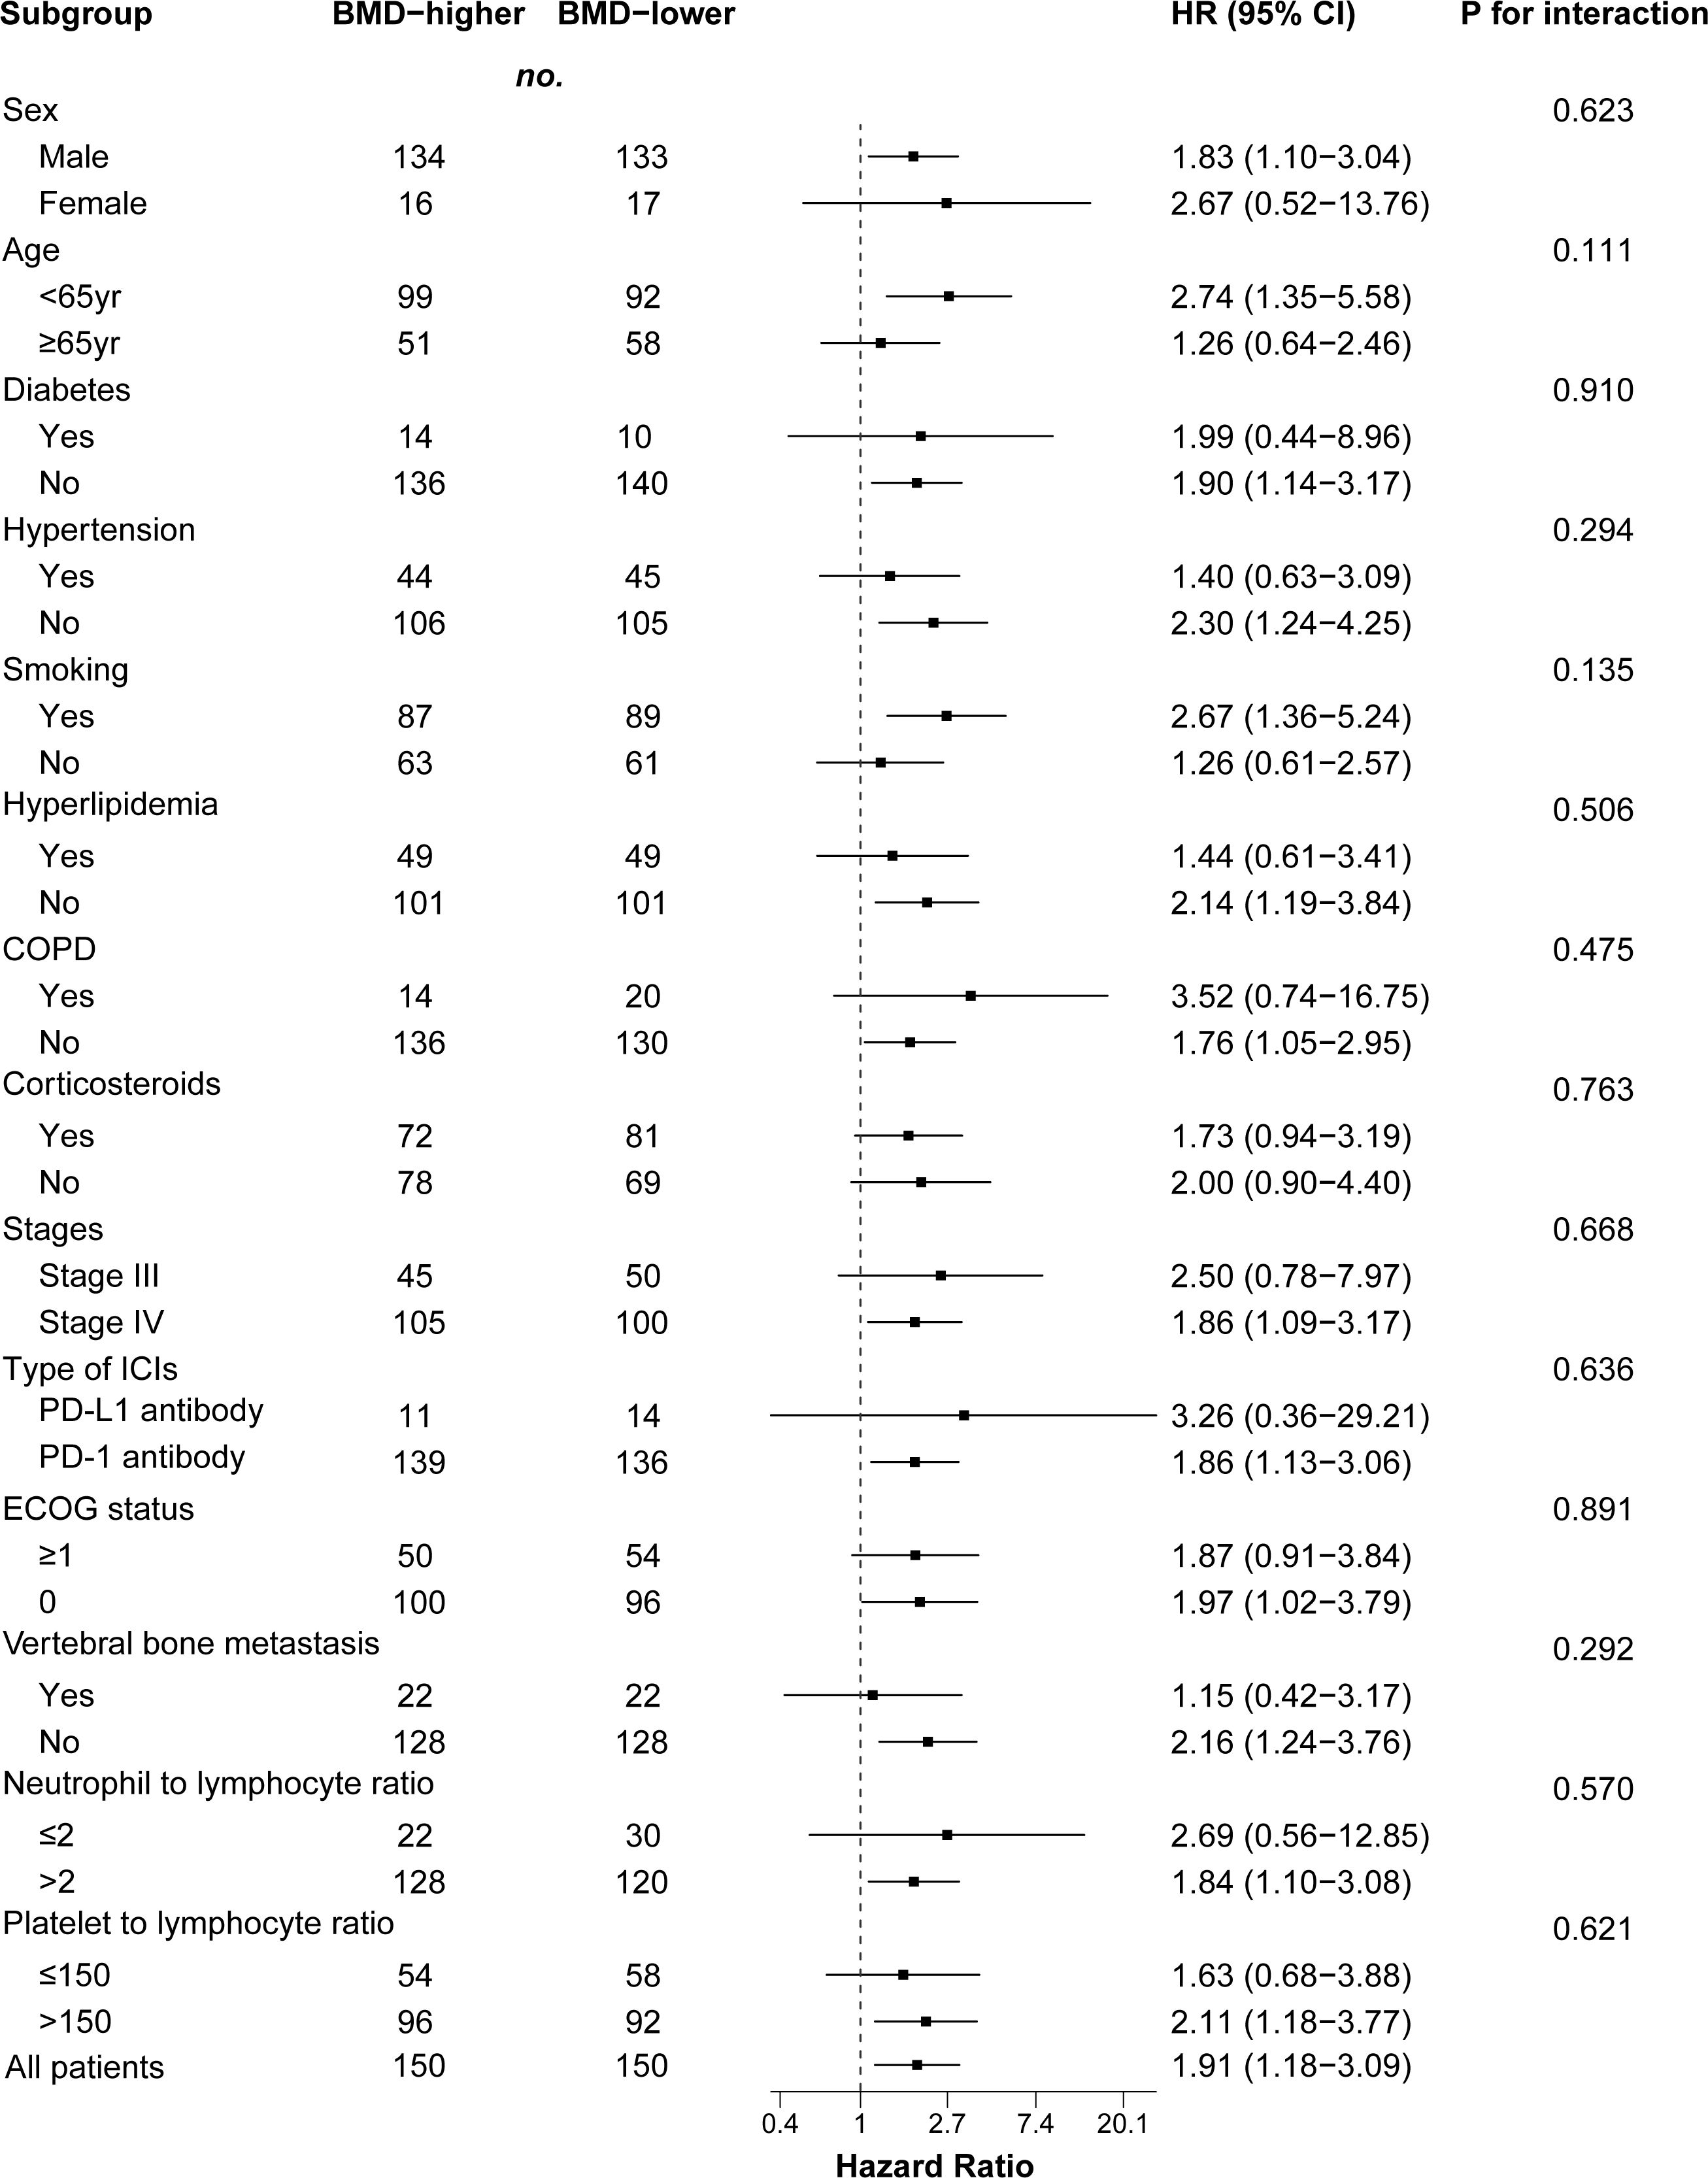
Figure 5 Forest plot of subgroup analysis in overall survival between the BMD-lower group and BMD-higher group. Dashed line indicates Hazard ratio of 1. BMD, bone mineral density; HR, hazard ratio; CI, confidence interval; COPD, chronic obstructive pulmonary disease; ICIs, immune checkpoint inhibitors; PD-1, programmed cell death protein 1; PD-L1, programmed cell death ligand 1.
Discussion
BMD, as an imaging marker, has been shown to provide potential predictive value for various cancer entities, such as breast cancer and hepatocellular carcinoma (17, 18). This is the first study to report the association between baseline BMD and the short-term efficacy and long-term prognosis in NSCLC patients treated with ICIs. We used X-tile software to scientifically determine the optimal cutoff value. At the same time, considering the impact of factors such as age and sex on BMD and prognosis, we balanced the baseline characteristics of the two groups through PSM, and further analyzed possible influencing factors through Cox regression and subgroup analysis. To reduce the effect of age on study results, we grouped patients again based on the age-adjusted standard BMD. We further explored the predictive value of BMD in non-immunotherapy patients. In this study, CT-derived BMD was used to evaluate baseline BMD. Although DXA was the standard for assessing BMD, more and more studies indicated that CT scans were suitable for predicting vertebral fractures and consecutive measurements of bone loss, correlating well with BMD measured by DXA (19–21). Our results showed that lower baseline BMD was associated with shorter OS, both before and after PSM. Moreover, we found that patients with lower baseline BMD had a higher incidence of SRE. Ilic et al. (22) reported that low preoperative BMD was the independent predictor of patients with NSCLC-related brain metastasis (BM) post-surgical mortality. They measured the BMD value of the first lumbar vertebra in preoperative CT scans and divided it into pathological BMD (median, 99 HU; IQR, 75 to 195 HU) and physiological BMD (median, 140 HU; IQR, 113 to 159 HU) (22). The results showed that pathological BMD was associated with shorter OS (6.0 months vs. 15.0 months, P = 0.002) and higher 1-year mortality (OR, 0.5 [95%Cl, 0.2 to 1.0]; P = 0.03), which was similar to the results of our study. Similar findings have been reported in other tumors. Watanabe et al. (11) summarized and analyzed 11 studies (2330 patients) on the relationship between gastrointestinal cancer and BMD and found that osteopenia is independently associated with poor prognosis in these patients. The above studies have shown the unique role of BMD in predicting tumor progression. In addition, recent studies and case reports have found that cancer patients have an increased risk of early fractures after starting ICIs, which may be related to reduced bone density and osteoporosis caused by T cell activation (23–25). This suggests that ICIs also promote bone loss and thus affect clinical outcomes, although we did not follow up the changes in BMD after ICI treatment. Due to the double blow of immunotherapy and tumors to bone loss, we should pay more attention to the bone condition of patients before treatment and intervene accordingly.
Our finding suggest that OS was better in patients initially presenting with higher BMD, however there is no difference concerning PFS, ORR or DCR between the two groups. PFS, ORR and DCR have been implemented as early clinical end points and have been extensively used in the evaluation of anti-tumor therapy. However, the relationship between these early end points and OS has not been formally established, which may be influenced by multiple factors (26). Notably, several immunotherapy trials demonstrated improvements in OS without improvements in PFS and/or ORR (27, 28). The ICIs may alter tumor growth kinetics rather than solely act via direct cytotoxicity, which may be the reason for the divorce between ORR, PFS and OS. Furthermore, our study found that corticosteroid application was associated with shorter PFS and was a potential risk factor for OS, although statistical differences were not reached after PSM. Corticosteroids, as immunosuppressive drugs, could exert several mechanisms to reduce immune activity. However, ICIs are designed to enhance the immune system’s inherent antitumor activity (29). Based on our results, we speculate that there may be an antagonistic effect between corticosteroids and ICIs. However, more research is needed to further verify the interactions of corticosteroid use and ICI.
It is still unclear the association between the lower baseline BMD and immunotherapy efficacy and cancer progression, but increasing evidence suggests that the immune systems are closely closed to skeletal systems. Cytokines (such as PTHrP, interleukin (IL)-1, IL-6, and IL-8) derived from cancer cells could activate osteoclasts and subsequently activate the RANKL/RANK pathway which had been proven to be correlated with poor prognosis in cancer patients (30, 31). Animal experiments have shown that reduced bone mineral density, trabecular thickness, and mineralization can be observed in NSCLC mice in the absence of tumor cell metastasis (32). From another point of view, BMD not only reflected the general condition and nutritional status of patients but was also associated with tumor progression to a degree. Bisphosphonates and Denosumab, the widely-used long-term treatment of osteolytic bone diseases and bone metastasis, were reported to exert direct and indirect anti-tumor effects, including inhibition of tumor cell proliferation and adhesion, reduction tumor cells secrete factors that increase RANKL expression, enhancement of immune surveillance, and prevention of angiogenesis (33–35). Clinical and preclinical experiments have shown that they can not only inhibit the progression of bone metastases and reduce SREs, but also prevent the growth of non-small cell lung cancer (36–38).
Our study had limitations. First, this study was retrospective, and data was collected previously. Prospective multicenter clinical trials are needed to validate our results in the future. Second, it should be considered whether the evaluation of CT-derived BMD was reliable, although there have been a number of previous studies using this method. Finally, bone loss was a continuous pathological process under the long-lasting negative effects of tumor, but we did not evaluate changes in BMD during follow-up. Therefore, besides the baseline BMD, the extent of decline in BMD during ICI treatment and its association with prognosis should also be investigated with great care in the future studies. In spite of these limitations, we reported the relationship between baseline BMD and prognosis in NSCLC patients treated with ICIs for the first time.
Conclusions
In conclusion, our study found that for patients with NSCLC, baseline BMD before ICI treatment affects the long-term prognosis of them, although there is no difference in their short-term efficacy. Routine testing of BMD before receiving immunotherapy will help clinicians make better decisions.
Data availability statement
The raw data supporting the conclusions of this article will be made available by the authors, without undue reservation.
Ethics statement
The studies involving humans were approved by The Research Ethics Committee of Tongji Medical College, Huazhong University of Science and Technology (Institutional Review Board No. S054). The studies were conducted in accordance with the local legislation and institutional requirements. The ethics committee/institutional review board waived the requirement of written informed consent for participation from the participants or the participants’ legal guardians/next of kin because clinical data were analyzed retrospectively and anonymously.
Author contributions
JL: Conceptualization, Data curation, Writing – original draft. BG: Data curation, Writing – original draft. YL: Data curation, Writing – original draft. YG: Conceptualization, Data curation, Resources, Writing – original draft. LL: Data curation, Writing – original draft. JW: Investigation, Project administration, Supervision, Writing – review & editing. WL: Data curation, Resources, Validation, Writing – original draft. ZY: Data curation, Resources, Writing – original draft. HZ: Investigation, Methodology, Writing – original draft. FP: Software, Validation, Writing – review & editing. BL: Formal Analysis, Project administration, Supervision, Writing – review & editing. LY: Project administration, Supervision, Visualization, Writing – review & editing. GZ: Conceptualization, Project administration, Supervision, Writing – review & editing.
Funding
The author(s) declare financial support was received for the research, authorship, and/or publication of this article. This study was supported by grant from National Nature Science Foundation of China (No.82172034).
Acknowledgments
We would like to thank Aodong Xiao of Union Hospital, Tongji Medical College, Huazhong University of Science and Technology for helpful technical advice on this work.
Conflict of interest
The authors declare that the research was conducted in the absence of any commercial or financial relationships that could be construed as a potential conflict of interest.
Publisher’s note
All claims expressed in this article are solely those of the authors and do not necessarily represent those of their affiliated organizations, or those of the publisher, the editors and the reviewers. Any product that may be evaluated in this article, or claim that may be made by its manufacturer, is not guaranteed or endorsed by the publisher.
Supplementary material
The Supplementary Material for this article can be found online at: https://www.frontiersin.org/articles/10.3389/fimmu.2024.1332303/full#supplementary-material
Abbreviations
ICIs, immune checkpoint inhibitors; NSCLC, non-small cell lung cancer; BMD, baseline bone mineral density; CT, computed tomography; PD-1, programmed cell death 1; PD-L1, programmed cell death-ligand 1; CTLA-4, cytotoxic T-lymphocyte-associated protein 4; PSM, propensity score matching; ORR, objective response rate; DCR, disease control rate; OS, overall survival; PFS, progression-free survival; COPD, chronic obstructive pulmonary disease; SRE, skeletal-related events; DXA, X-ray absorptiometry; ROIs, regions of interest; CR, complete response; PR, partial response; SD, stable disease; BM, brain metastasis.
References
1. Sung H, Ferlay J, Siegel RL, Laversanne M, Soerjomataram I, Jemal A, et al. Global cancer statistics 2020: GLOBOCAN estimates of incidence and mortality worldwide for 36 cancers in 185 countries. CA Cancer J Clin. (2021) 71:209–49. doi: 10.3322/caac.21660
2. Ettinger DS, Wood DE, Aisner DL, Akerley W, Bauman JR, Bharat A, et al. Non-small cell lung cancer, version 3.2022, NCCN clinical practice guidelines in oncology. J Natl Compr Canc Netw. (2022) 20:497–530. doi: 10.6004/jnccn.2022.0025
3. Sharma P, Goswami S, Raychaudhuri D, Siddiqui BA, Singh P, Nagarajan A, et al. Immune checkpoint therapy-current perspectives and future directions. Cell. (2023) 186:1652–69. doi: 10.1016/j.cell.2023.03.006
4. Reck M, Remon J, Hellmann MD. First-line immunotherapy for non-small-cell lung cancer. J Clin Oncol. (2022) 40:586–97. doi: 10.1200/JCO.21.01497
5. Passaro A, Brahmer J, Antonia S, Mok T, Peters S. Managing resistance to immune checkpoint inhibitors in lung cancer: treatment and novel strategies. J Clin Oncol. (2022) 40:598–610. doi: 10.1200/JCO.21.01845
6. Huang JF, Tan QC, Bai H, Wang J, Bergman M, Wu Z. Bone mineral density, osteopenia and osteoporosis among US adults with cancer. QJM. (2022) 115:653–60. doi: 10.1093/qjmed/hcac015
7. Muqbil I, Azmi AS. Cancer cachexia research: coming of age. Trans Lung Cancer Res. (2023) 12:1163–6. doi: 10.21037/tlcr
8. Takenaka Y, Oya R, Takemoto N, Inohara H. Predictive impact of sarcopenia in solid cancers treated with immune checkpoint inhibitors: a meta-analysis. J Cachexia Sarcopenia Muscle. (2021) 12:1122–35. doi: 10.1002/jcsm.12755
9. Ashton E, Arrondeau J, Jouinot A, Boudou-Rouquette P, Hirsch L, Huillard O, et al. Impact of sarcopenia indexes on survival and severe immune acute toxicity in metastatic non-small cell lung cancer patients treated with PD-1 immune checkpoint inhibitors. Clin Nutr. (2023) 42:944–53. doi: 10.1016/j.clnu.2023.03.023
10. Kanis JA. Diagnosis of osteoporosis and assessment of fracture risk. Lancet. (2002) 359:1929–36. doi: 10.1016/S0140-6736(02)08761-5
11. Watanabe J, Saitsu A, Miki A, Kotani K, Sata N. Prognostic value of preoperative low bone mineral density in patients with digestive cancers: a systematic review and meta-analysis. Arch Osteoporos. (2022) 17:33. doi: 10.1007/s11657-022-01060-6
12. Toshima T, Yoshizumi T, Ikegami T, Harada N, Itoh S, Mano Y, et al. Impact of osteopenia in liver cirrhosis: special reference to standard bone mineral density with age. Anticancer Res. (2018) 38:6465–71. doi: 10.21873/anticanres.13009
13. Eisenhauer EA, Therasse P, Bogaerts J, Schwartz LH, Sargent D, Ford R, et al. New response evaluation criteria in solid tumours: revised RECIST guideline (version 1.1). Eur J Cancer. (2009) 45:228–47. doi: 10.1016/j.ejca.2008.10.026
14. Himelstein AL, Foster JC, Khatcheressian JL, Roberts JD, Seisler DK, Novotny PJ, et al. Effect of longer-interval vs standard dosing of zoledronic acid on skeletal events in patients with bone metastases: a randomized clinical trial. JAMA. (2017) 317:48–58. doi: 10.1001/jama.2016.19425
15. Fizazi K, Carducci M, Smith M, Damião R, Brown J, Karsh L, et al. Denosumab versus zoledronic acid for treatment of bone metastases in men with castration-resistant prostate cancer: a randomised, double-blind study. Lancet. (2011) 377:813–22. doi: 10.1016/S0140-6736(10)62344-6
16. Camp RL, Dolled-Filhart M, Rimm DL. X-tile: a new bio-informatics tool for biomarker assessment and outcome-based cut-point optimization. Clin Cancer Res. (2004) 10:7252–9. doi: 10.1158/1078-0432.CCR-04-0713
17. Sharma P, Parikh ND, Yu J, Barman P, Derstine BA, Sonnenday CJ, et al. Bone mineral density predicts posttransplant survival among hepatocellular carcinoma liver transplant recipients. Liver Transpl. (2016) 22:1092–8. doi: 10.1002/lt.24458
18. Tseng OL, Dawes MG, Spinelli JJ, Gotay CC, McBride ML. Utilization of bone mineral density testing among breast cancer survivors in British Columbia, Canada. Osteoporos Int. (2017) 28:3439–49. doi: 10.1007/s00198-017-4218-6
19. Schreiber JJ, Anderson PA, Rosas HG, Buchholz AL, Au AG. Hounsfield units for assessing bone mineral density and strength: a tool for osteoporosis management. J Bone Joint Surg Am. (2011) 93:1057–63. doi: 10.2106/JBJS.J.00160
20. Lee S, Chung CK, Oh SH, Park SB. Correlation between bone mineral density measured by dual-energy X-ray absorptiometry and hounsfield units measured by diagnostic CT in lumbar spine. J Korean Neurosurg Soc. (2013) 54:384–9. doi: 10.3340/jkns.2013.54.5.384
21. Pickhardt PJ, Pooler BD, Lauder T, del Rio AM, Bruce RJ, Binkley N. Opportunistic screening for osteoporosis using abdominal computed tomography scans obtained for other indications. Ann Intern Med. (2013) 158:588–95. doi: 10.7326/0003-4819-158-8-201304160-00003
22. Ilic I, Potthoff A-L, Borger V, Heimann M, Paech D, Giordano FA, et al. Bone mineral density as an individual prognostic biomarker in patients with surgically-treated brain metastasis from lung cancer (NSCLC). Cancers. (2022) 14(19):4633. doi: 10.3390/cancers14194633
23. Moseley KF, Naidoo J, Bingham CO, Carducci MA, Forde PM, Gibney GT, et al. Immune-related adverse events with immune checkpoint inhibitors affecting the skeleton: a seminal case series. J Immunother Cancer. (2018) 6:104. doi: 10.1186/s40425-018-0417-8
24. Filippini DM, Gatti M, Di Martino V, Cavalieri S, Fusaroli M, Ardizzoni A, et al. Bone fracture as a novel immune-related adverse event with immune checkpoint inhibitors: case series and large-scale pharmacovigilance analysis. Int J Cancer. (2021) 149:675–83. doi: 10.1002/ijc.33592
25. Ye C, Lee K, Leslie WD, Lin M, Walker J, Kolinsky M. Fracture rate increases after immune checkpoint inhibitor treatment: a potential new immune related adverse event. Osteoporos Int. (2023) 34:735–40. doi: 10.1007/s00198-023-06690-1
26. Merino M, Kasamon Y, Theoret M, Pazdur R, Kluetz P, Gormley N. Irreconcilable differences: the divorce between response rates, progression-free survival, and overall survival. J Clin Oncol. (2023) 41:2706–12. doi: 10.1200/JCO.23.00225
27. Borghaei H, Paz-Ares L, Horn L, Spigel DR, Steins M, Ready NE, et al. Nivolumab versus docetaxel in advanced nonsquamous non-small-cell lung cancer. N Engl J Med. (2015) 373:1627–39. doi: 10.1056/NEJMoa1507643
28. Mok TSK, Wu Y-L, Kudaba I, Kowalski DM, Cho BC, Turna HZ, et al. Pembrolizumab versus chemotherapy for previously untreated, PD-L1-expressing, locally advanced or metastatic non-small-cell lung cancer (KEYNOTE-042): a randomised, open-label, controlled, phase 3 trial. Lancet. (2019) 393:1819–30. doi: 10.1016/S0140-6736(18)32409-7
29. Goodman RS, Johnson DB, Balko JM. Corticosteroids and cancer immunotherapy. Clin Cancer Res. (2023) 29:2580–7. doi: 10.1158/1078-0432.CCR-22-3181
30. Jones DH, Nakashima T, Sanchez OH, Kozieradzki I, Komarova SV, Sarosi I, et al. Regulation of cancer cell migration and bone metastasis by RANKL. Nature. (2006) 440:692–6. doi: 10.1038/nature04524
31. van Dam PA, Verhoeven Y, Trinh XB, Wouters A, Lardon F, Prenen H, et al. RANK/RANKL signaling inhibition may improve the effectiveness of checkpoint blockade in cancer treatment. Crit Rev Oncol Hematol. (2019) 133:85–91. doi: 10.1016/j.critrevonc.2018.10.011
32. Berent TE, Dorschner JM, Craig TA, Drake MT, Westendorf JJ, Kumar R. Lung tumor cells inhibit bone mineralization and osteoblast activity. Biochem Biophys Res Commun. (2019) 519:566–71. doi: 10.1016/j.bbrc.2019.09.045
33. Tamura T, Shomori K, Nakabayashi M, Fujii N, Ryoke K, Ito H. Zoledronic acid, a third-generation bisphosphonate, inhibits cellular growth and induces apoptosis in oral carcinoma cell lines. Oncol Rep. (2011) 25:1139–43. doi: 10.3892/or
34. De Castro J, Garcia R, Garrido P, Isla D, Massuti B, Blanca B, et al. Therapeutic potential of denosumab in patients with lung cancer: beyond prevention of skeletal complications. Clin Lung Cancer. (2015) 16:431–46. doi: 10.1016/j.cllc.2015.06.004
35. Van Acker HH, Anguille S, Willemen Y, Smits EL, Van Tendeloo VF. Bisphosphonates for cancer treatment: Mechanisms of action and lessons from clinical trials. Pharmacol Ther. (2016) 158:24–40. doi: 10.1016/j.pharmthera.2015.11.008
36. Lipton A, Cook R, Saad F, Major P, Garnero P, Terpos E, et al. Normalization of bone markers is associated with improved survival in patients with bone metastases from solid tumors and elevated bone resorption receiving zoledronic acid. Cancer. (2008) 113:193–201. doi: 10.1002/cncr.23529
37. Scagliotti GV, Hirsh V, Siena S, Henry DH, Woll PJ, Manegold C, et al. Overall survival improvement in patients with lung cancer and bone metastases treated with denosumab versus zoledronic acid: subgroup analysis from a randomized phase 3 study. J Thorac Oncol. (2012) 7:1823–9. doi: 10.1097/JTO.0b013e31826aec2b
38. Hendriks LE, Hermans BC, van den Beuken-van Everdingen MH, Hochstenbag MM, Dingemans AM. Effect of bisphosphonates, denosumab, and radioisotopes on bone pain and quality of life in patients with non-small cell lung cancer and bone metastases: a systematic review. J Thorac Oncol. (2016) 11:155–73. doi: 10.1016/j.jtho.2015.10.001
Keywords: bone mineral density, osteoporosis, immunotherapy, immune checkpoint inhibitors, non-small cell lung cancer, prognosis
Citation: Lou J, Gong B, Li Y, Guo Y, Li L, Wang J, Liu W, You Z, Zhang H, Pan F, Liang B, Yang L and Zhou G (2024) Bone mineral density as an individual prognostic biomarker in NSCLC patients treated with immune checkpoint inhibitors. Front. Immunol. 15:1332303. doi: 10.3389/fimmu.2024.1332303
Received: 02 November 2023; Accepted: 05 April 2024;
Published: 18 April 2024.
Edited by:
Ziheng Wang, University of Macau, Macao SAR, ChinaReviewed by:
Isabel Ben-Batalla, German Cancer Research Center (DKFZ), GermanyRamon Mohanlal, Independent Researcher, New York, NY, United States
Copyright © 2024 Lou, Gong, Li, Guo, Li, Wang, Liu, You, Zhang, Pan, Liang, Yang and Zhou. This is an open-access article distributed under the terms of the Creative Commons Attribution License (CC BY). The use, distribution or reproduction in other forums is permitted, provided the original author(s) and the copyright owner(s) are credited and that the original publication in this journal is cited, in accordance with accepted academic practice. No use, distribution or reproduction is permitted which does not comply with these terms.
*Correspondence: Guofeng Zhou, emhvdWd1b2Zlbmc2OUAxMjYuY29t; Lian Yang, eWFuZ2xpYW5AaHVzdC5lZHUuY24=
†These authors have contributed equally to this work