
94% of researchers rate our articles as excellent or good
Learn more about the work of our research integrity team to safeguard the quality of each article we publish.
Find out more
ORIGINAL RESEARCH article
Front. Immunol., 31 January 2024
Sec. Cancer Immunity and Immunotherapy
Volume 15 - 2024 | https://doi.org/10.3389/fimmu.2024.1327565
This article is part of the Research TopicFrom Bench to Bedside in Gastric Cancer: Diagnosis, Prognosis, and Treatment - Volume IIView all 8 articles
 Shibo Wang1†
 Xiaojuan Huang1†Shufen Zhao1Jing Lv1Yi Li2
 Shasha Wang1
 Jing Guo1
 Yan Wang1Rui Wang1
 Mengqi Zhang1
 Wensheng Qiu1*
Background: Globally, gastric cancer (GC) is a category of prevalent malignant tumors. Its high occurrence and fatality rates represent a severe threat to public health. According to recent research, lipid metabolism (LM) reprogramming impacts immune cells’ ordinary function and is critical for the onset and development of cancer. Consequently, the article conducted a sophisticated bioinformatics analysis to explore the potential connection between LM and GC.
Methods: We first undertook a differential analysis of the TCGA queue to recognize lipid metabolism-related genes (LRGs) that are differentially expressed. Subsequently, we utilized the LASSO and Cox regression analyses to create a predictive signature and validated it with the GSE15459 cohort. Furthermore, we examined somatic mutations, immune checkpoints, tumor immune dysfunction and exclusion (TIDE), and drug sensitivity analyses to forecast the signature’s immunotherapy responses.
Results: Kaplan-Meier (K-M) curves exhibited considerably longer OS and PFS (p<0.001) of the low-risk (LR) group. PCA analysis and ROC curves evaluated the model’s predictive efficacy. Additionally, GSEA analysis demonstrated that a multitude of carcinogenic and matrix-related pathways were much in the high-risk (HR) group. We then developed a nomogram to enhance its clinical practicality, and we quantitatively analyzed tumor-infiltrating immune cells (TIICs) using the CIBERSORT and ssGSEA algorithms. The low-risk group has a lower likelihood of immune escape and more effective in chemotherapy and immunotherapy. Eventually, we selected BCHE as a potential biomarker for further research and validated its expression. Next, we conducted a series of cell experiments (including CCK-8 assay, Colony formation assay, wound healing assay and Transwell assays) to prove the impact of BCHE on gastric cancer biological behavior.
Discussion: Our research illustrated the possible consequences of lipid metabolism in GC, and we identified BCHE as a potential therapeutic target for GC. The LRG-based signature could independently forecast the outcome of GC patients and guide personalized therapy.
Global data in 2020 displays about 1.09 million new instances reported and 769,000 deaths of gastric cancer (GC), placing fifth in prevalence rate and fourth in fatality among malignant tumors (1). Although emerging treatments like targeted therapy and immunotherapy have demonstrated significant promise in improving the prognosis of advanced GC (2), their overall treatment efficacy is still lacking, and the 5-year survival rate presents a challenge (3).
Lipids, including phospholipids, fatty acids (FA), triglycerides, and cholesterol, are widely distributed in human tissues and organs (4). Lipid metabolism disorders can induce and infiltrate various chronic diseases, such as atherosclerosis, obesity, diabetes, and cancer (5–8). One of the most critical characteristics of cancer is lipid metabolic reprogramming, which is vital for encouraging the derivation and progression of cancer and remodeling TME. Among that, abnormal cholesterol metabolism is one of the most common pathways. Cholesterol can encourage tumor proliferation by activating the Hedgehog and mTORC1 signaling pathways (9), and promote tumor metastasis through epithelial-mesenchymal transition (EMT) (4). Reprogramming cholesterol metabolism in tumor cells or TIICs may influence tumor immune recognition and facilitate immune escape.
Moreover, FA metabolism reprogramming also is a significant process in cancer progression (10). The main enzymes in FA synthesis include sterol regulatory element binding protein (SREBP), fatty acid synthase (FASN), and acetyl CoA carboxylase (ACC). SREBP-1 and SREB-2 expression levels are markedly elevated in glioblastoma and prostate cancer, and ACC is upregulated in head and neck squamous cell carcinoma (11–13). Overexpression of FASN in breast cancer (BC) leads to chemoresistance, and improving chemotherapy-susceptibility can be achieved through targeted suppression of FASN (14–16). CPT1α, or carnitine palmitoyl transferase, is the primary enzyme involved in the catabolism of FA. Inhibiting the activity of CPT1α can decrease FA β- Oxidize, thereby reducing energy supply to tumor cells and exerting anti-tumor effects (17, 18). Furthermore, lipid droplets are formed in the endoplasmic reticulum when cellular lipids are excessive (19), which provide sufficient energy for cancer metastasis (20).
Over the past decade, immune checkpoint inhibitors (ICIs) have substantially improved clinical immunotherapy for GC (21, 22). There is mounting evidence that the tumor microenvironment (TME) significantly influences cancer growth and induces chemotherapy and immunotherapy resistance, and tumor-infiltrating immune cells (TIICs) have been demonstrated to assist in the advancement of cancer (23, 24). For instance, regulatory T cells (T-reg cells) have vital immunosuppressive functions, which regulate the activation and differentiation status of CD4+ or CD8+T cells and impede anti-tumor immune defenses, boosting tumor development and metastasis (25–27). Nevertheless, there is still a lack of comprehensive investigation into the relationship between gastric cancer, TME, and lipid metabolism.
This study utilized lipid metabolism-related genes (LRGs) to construct a predictive signature for GC, which has a reliable predictive effect on OS and PFS. Analyze the potential mechanism of this model through functional enrichment and further illuminate its relationship with immune infiltration characteristics. Additionally, we also forecast the immunotherapy effectiveness of GC persons. In summary, this investigation offers new directions for locating viable prognostic biomarkers and more efficient treatment options for GC.
The Cancer Genome Atlas (TCGA) database (https://portal.gdc.cancer.gov/) and the Gene Expression Omnibus (GEO) database (https://www.ncbi.nlm.nih.gov/) were the sources of the RNA-sequencing data and the associated clinicopathological data. The TCGA-STAD cohort represents 36 normal and 410 cancer specimens, and the GSE15459 cohort includes 192 cancer samples. A total of 13 gene sets, and 895 LRGs were derived from the Molecular Signatures Database (MisgDB) website (http://www.gsea-msigdb.org/gsea/msigdb/index.jsp). Supplementary Table S1 lists specific gene sets and corresponding genes. The copy number variation (CNV), somatic mutation, and RNA stemness scores (RNAss) were attained from the UCSC Xena database (https://xenabrowser.net/datapages/). Download information on immunotherapy from The Cancer Immunome Atlas (TCIA, https://tcia.at/patients). This study excluded samples from TCGA-STAD with a survival period of ≤ 30 days. Subsequently, 366 GC specimens were categorized into training and testing sets (n = 183 for each) at random (28). The lipid metabolism-based prognostic signature was constructed using the training set, while the test set and GSE15459 set were applied as the validation set.
Based on the predetermined cutoff parameters, the “limma” package determined the differentially expressed genes (DEGs) between tumor and standard specimens. Afterward, DELRGs were discovered by intersecting DEGs with LRGs. The functional and pathway enrichment analysis was also undergone on these DELRGs using the Gene Ontology (GO) and Kyoto Encyclopedia of Genes and Genomes (KEGG).
We first employed univariate Cox analysis to determine OS-related LRGs and evaluate their CNV alterations. The optimal LRGs-based signature was created using LASSO and multivariate Cox regression analyses. The following explains how the risk scores were calculated:
The terms “n,” “Coefi,” and “Expi” signify the number of signature genes, coefficients, and gene expression levels, respectively.
According to the median risk score, all specimens were separated into different risk subgroups. We plotted the K-M curves using the “survival” and “survmine” packages to demonstrate the effectiveness of the signature for forecasting OS. The reliability of the risk signature was appraised by the receiver operating characteristic (ROC) curves and validated via the testing and GSE15459 sets. Moreover, principal component analysis (PCA) was visualized for dimensionality reduction to analyze the signature’s capacity for grouping.
GO and KEGG enrichment analyses were carried out utilizing the “clusterProfiler” package to derive biological processes and signal pathways (q-value< 0.05). Gene Set Enrichment Analysis (GSEA) (29) has also been employed to screen for potential mechanistic pathways between risk categories. The reference molecular database chosen was “c2.cp.Kegg.Hs.symbols.gmt” [KEGG], and |NES| > 1 and q-value< 0.1 were deemed statistical meaningful.
In both the TCGA and GSE15459 cohorts, univariate and multivariable Cox analyses were employed to determine if risk scores could function as a meaningful predictive element (p<0.05). Utilizing the R “rms” and “regplot” packages, we designed a clinical-related nomogram according to risk signature and other clinicopathological characteristics (30). Afterward, we generated calibration and ROC curves to verify the nomogram’s capacity for prediction.
We employed the ESTIMATE algorithm (31) to determine stromal scores (the content of stromal cells), immune scores (the content of immunity cells), and tumor purity (the number of tumor cells) in the TME. Besides, the abundance of 22 different types of TIICs was measured by applying the LM22 signature and CIBERSORT algorithms (32). Single-sample gene set enrichment analysis (ssGSEA) scores were computed by the “GSVA” package (33) to gauge the level of TIICs in each tumor sample. We then employed the Wilcoxon test to explore the discrepancies in immune cell compositions between LR and HR classes. The association between risk scores and partial TIICs was performed by Spearman analysis.
We downloaded somatic mutation data and calculated tumor mutation burden (TMB) values. The somatic mutation landscape was depicted via waterfall plots. We inspected the values of immunological checkpoints, ICIs, RNAss, and TIDE (http://tide.dfci.harvard.edu/) to anticipate gastric cancer individuals’ clinical immune therapy efficacy. The “oncoPredict” package was employed to examine the sensitivity of standard chemotherapy medications. The IC50 value demonstrates drug sensitivity.
Human normal and cancerous tissue protein expression data were available in the HPA database (https://www.proteinatlas.org/) (34). This study validated the signature genes’ protein levels between gastric cancer and normal tissues through immunohistochemistry (IHC) in the HPA database.
The human gastric epithelial cell line (GSE-1) and two human GC cell lines (HGC-27, AGS) used in this study were furnished by the Chinese Academy of Sciences. Using TRIzol® reagent extract RNA from various cells and reverse transcribed into cDNA. 1 µl of reverse transcription product, 3.6µl of DEPC, 5 µl of SYBR, and 0.2 µl each of forward and reverse primer were used in the qRT-PCR procedure. The amplification program for qRT-PCR was configured as follows: 95°C 3 minutes, followed by a cycle of 95°C 30 seconds, 55°C 20 seconds, and finally 72°C 20 seconds. Draw the PCR product’s melting curve (95°C for 15 seconds, 60°C for 15 seconds, and 95°C for 15 seconds) after the amplification reaction. All samples used GAPDH as the internal reference, and the 2-ΔΔCT approach was applied to compare the expression levels of five signature genes. In GraphPad Prism 9, One-way ANOVA was utilized to detect statistical differences in five signature genes between gastric cancer and gastric epithelial cells. The primers used are as follows: APOA1-F, 5’-GACAGCGTGACCTCCACCTTC-3’ and APOA1-R, 5’-CTTCACCTCCTCCAGATCCTTGC-3’. BCHE-F, 5’-AAGCCATTCATTGTTCACCAGAGC-3’ and BCHE-R, 5’-AAAGAGATGTTACCGCCCAAGGAG’. CYP19A1-F, 5’-CACATCTGGACAGGTTGGAGGAG-3’ and CYP19A1-R, 5’-AGCATGACACGACGCAGAAGG-3’. PLA1A-F, 5’-GACGCTGTCTGGATTGCTTTAACC-3’ and PLA1A-R, 5’-CCACCTTGTTCCACCAGTCCTATC-3’. STARD5-F, 5’-GGAGGTGTGGGACTGTGTGAAG -3’ and STARD5-R, 5’-AGCGGAGGGAGTGGAGGTTC-3’. GAPDH-F, 5’-TGCACCACCAAC TGCTTAGC-3’and GAPDH-R, 5’-GGCA TGGACTGTGGTCATGAG-3’.
Construction of RNAi lentivirus vector by the Gikai gene (http://www.genechem.com.cn/). The name of the target lentiviral vector: GV493. Element sequence: hU6-MCS-CBh-gcGFP-IRES-puromycin. RNAi negative control (sh-NC) sequence: TTCTCCGAACGTGTCACGT. The shRNA sequence designed for BCHE is as follows: sh-BCHE-1: CCTTGAATACAGAGTCAACAA. sh-BCHE-2: CCAGACATATTACTTGAACTT. Transfect AGS and HGC-27 cell lines under the guidance of RNAi lentivirus vector construction and packaging manual (version 5.0).
Total proteins were extracted from corresponding cell lines using RIPA lysate (Beyotime, Shanghai, China), separated by sodium dodecyl SDS-PAGE, and transferred to the PVDF membrane. Subsequently, the membrane was incubated with 5% milk at room temperature for 1 hour and then incubated overnight with an appropriate primary antibody at four °C. Afterward, we used horseradish peroxidase-conjugated secondary antibody to visualize the target proteins. The membranes were washed with TBST both before and following antibody incubation. This article uses the antibodies listed below: BCHE (Proteintech, Wuhan, China) and β- Actin was purchased from Abcam. β- Action as the internal reference.
Inoculate GC cells transfected with sh-NC or sh-BCHE lentivirus into a 96-well plate. Measure the OD value at a wavelength of 450 nm using the Cell Counting Kit-8 (Beyotime, Shanghai, China) according to the manufacturer’s operating guidelines. Monitor cell proliferation every 24 hours for a period of 3 days used to evaluate cell proliferation.
Place AGS and HGC-27 cell lines transfected with sh-NC or sh-BCHE in 6-well plates with 1000 cell densities. Subsequently, these cells cultured in RMPI-1640 medium containing 10% fetal bovine serum for 10 days. We used methanol for fusion and colony proliferation, and stained and proliferated the colonies with 1% crystal violet (Beyotime, Shanghai, China), and finally took photos of the colonies.
We inoculated GC cells transfected with sh-NC or sh-BCHE lentivirus into a 6-well plate and cultured them to a sub-fusion state (90-100%). Create a linear scratch wound using a 200-µL pipette tip and obtain images at 0 and 24 hours. Measure the scratch area three times and evaluate the cell healing rate. For the transwell assay, we inoculated cells at a density of 2×10⁵ into the upper chamber (Corning, New York, USA) and cultured with 200μl of serum-free medium. Add 600μl medium containing 10% fetal bovine serum to the lower chamber and incubate at 5% CO2 37 °C for 24 hours. Then, the cells that migrated to the bottom of the filter were fixed with 4% paraformaldehyde for 20 minutes, stained with 0.5% crystal violet dyes, and photographed under an inverted phase contrast microscope (Motic).
We employed R software (Version 4.2.2, http://www.R-project.org) and GraphPad Prism software (Version 9.3.1, CA, USA) to conduct all statistical analyses. Partial data was processed by Perl software (Version 5.30.0.1, https://strawberryperl.com/). K-M curves were evaluated for various risk groupings’ prognoses. The ROC and DCA curves were performed to assess the pragmatic capabilities of the risk signature and nomogram model. Cox regression analyses were exploited to pursue meaningful risk factors for GC. Wilcoxon rank-sum test and Spearman analysis were applied for comparative and correlation analyses between risk subgroups. P< 0.05 was regarded as the threshold for statistical significance (ns: p > 0.05, *: p ≤ 0.05, **: p ≤ 0.01, ***: p ≤ 0.001).
Figure 1 depicts this study’s flowchart. Based on the |log FC| > 1 and p<0.05 criteria, 5814 DEGs were discovered in the TCGA-STAD database. Subsequently, we discovered 148 DELRGs (39 up-regulated and 109 down-regulated) by DEGs intersected with lipid metabolism-related genes (LRGs) (Figures 2A, B). Afterward, we further carried out GO and KEGG analyses to investigate these DELRG’s possible mechanisms. Not surprisingly, these genes were primarily implicated in fatty acid metabolic, lipid catabolic, steroid metabolic, and lipid transporter activity (Figure 2C). Furthermore, KEGG analysis displayed that these DELRGs were predominantly associated with the “PPAR signaling pathway,” “glycerophospholipid,” and “arachidonic acid “ metabolisms (Figure 2D), all of which were significantly associated with inflammation and cancer emergence.
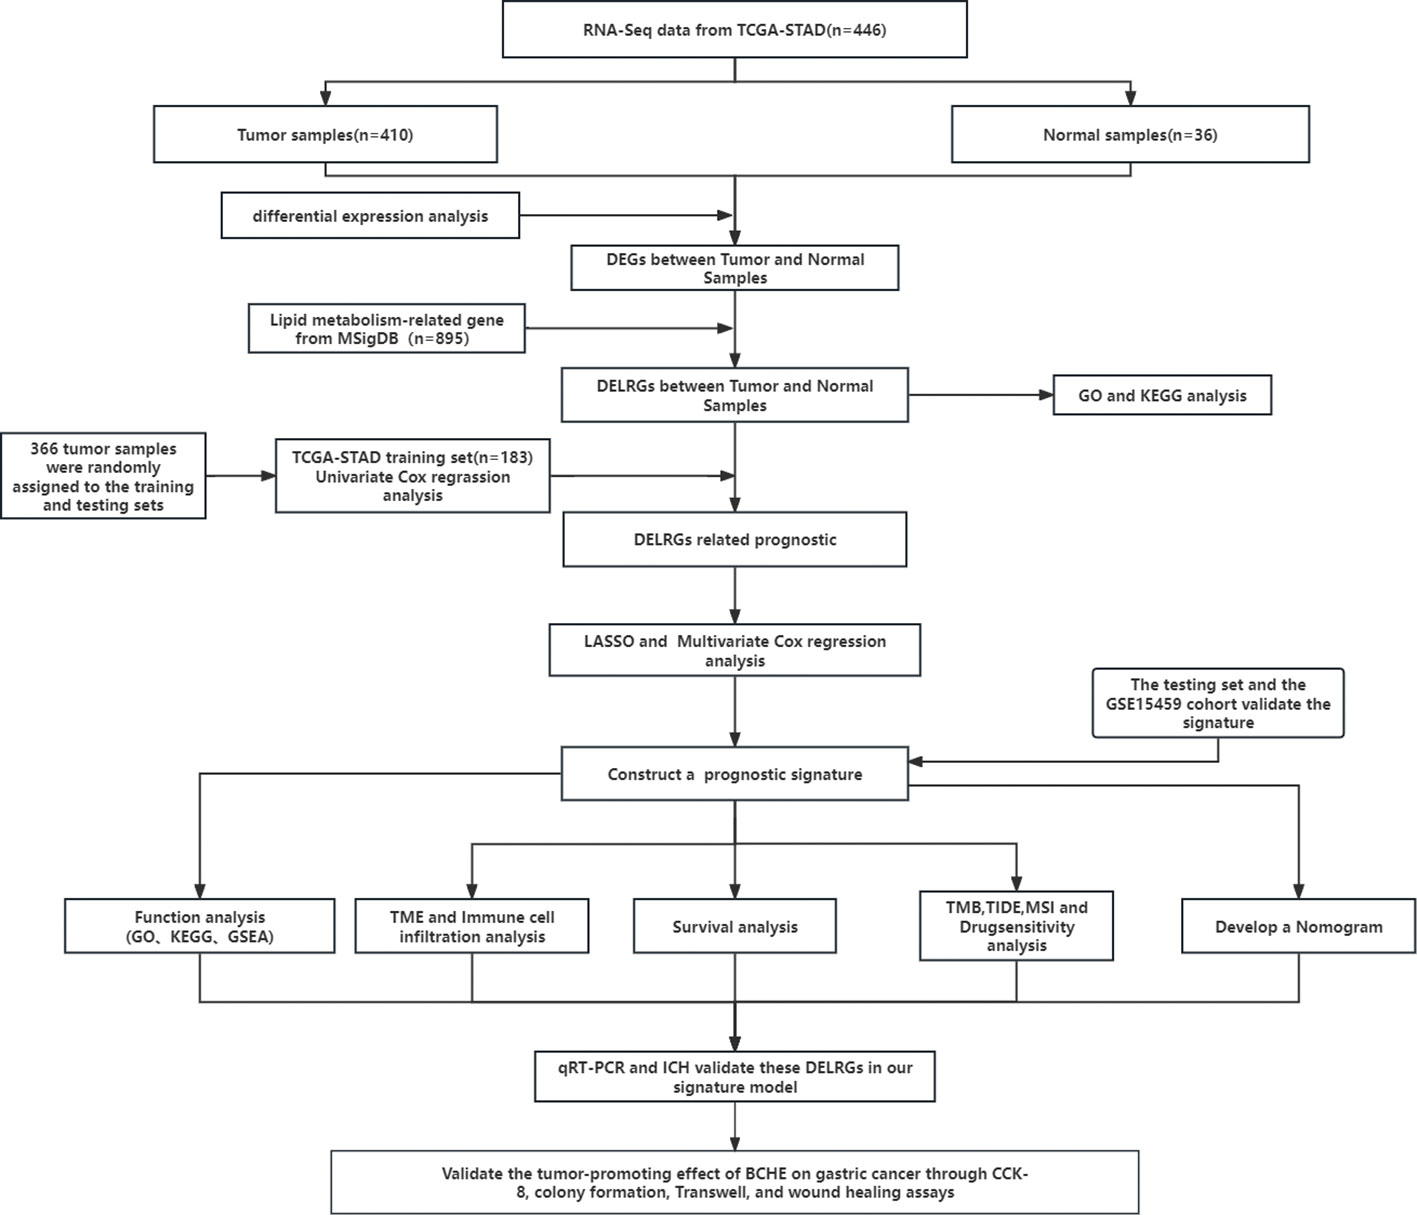
Figure 1 The flowchart of this research.
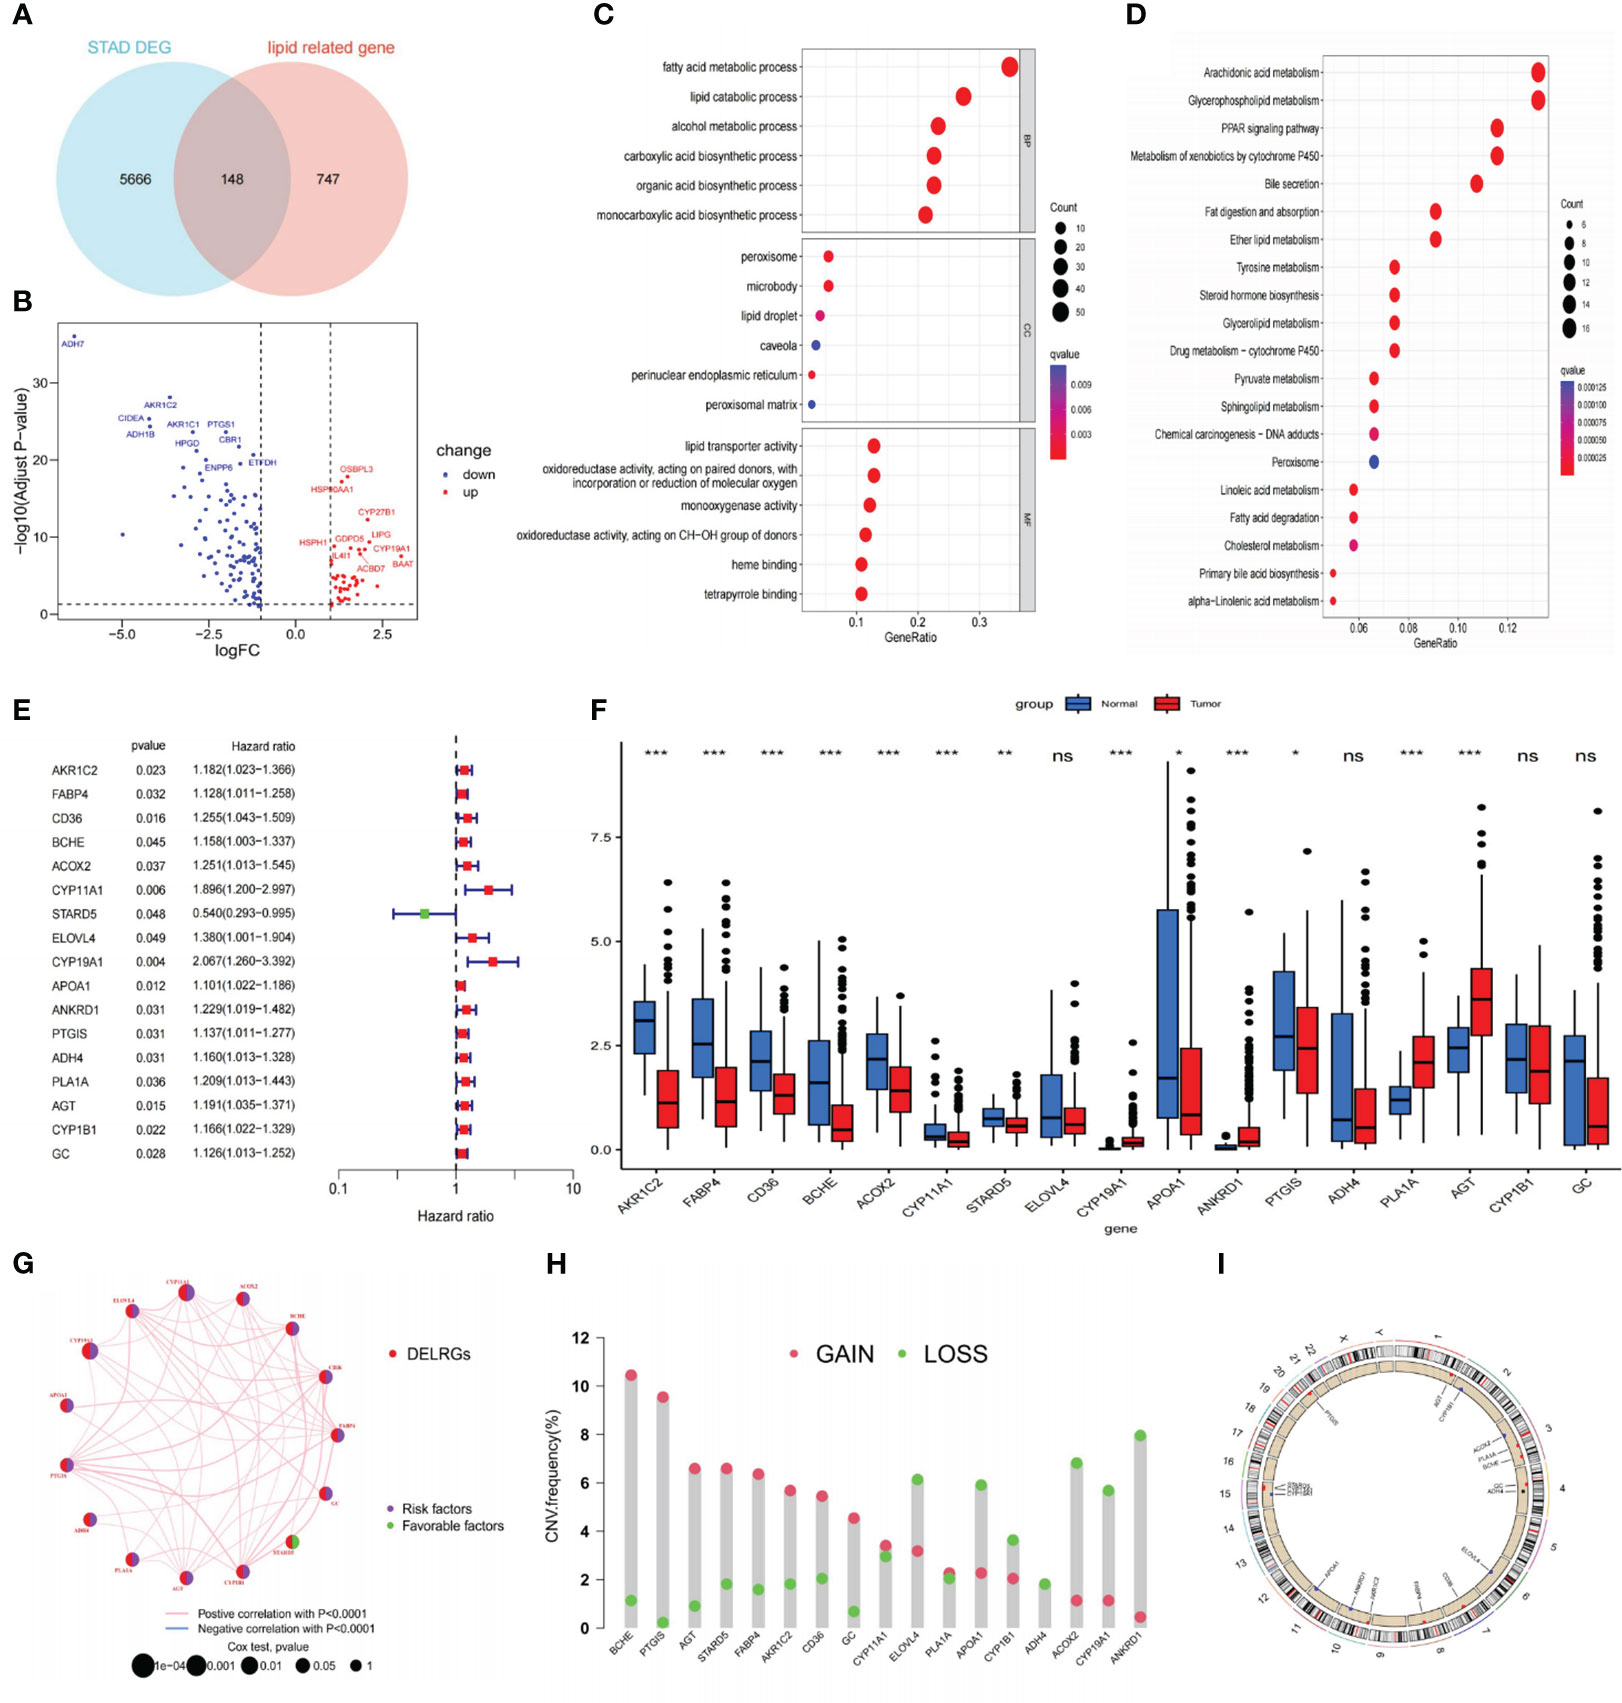
Figure 2 Identifying DELRGs with prognostic value. (A) Veen diagram between DEGs and LRGs in the TCGA cohort. (B) Volcano maps of 148 DELRGs. (C, D) GO and KEGG analyses of these DELRGs. (E) Univariate Cox regression analysis identified 17 OS-related DELRGs. (F) Expression of OS-related DELRGs in tumor and normal samples of the TCGA cohort. (G) The interaction network of these OS-related DELRG. (H) CNVs alteration in OS-related DELRGs in GC specimens. (I) Chromosomal locations of CNV alterations in OS-related DELRGs. *P< 0.05; **P< 0.01; ***P< 0.001. DEGs, differentially expressed genes; TCGA, The Cancer Genome Atlas; DELRGs, differentially expressed lipid metabolism-related genes; GO, Gene Ontology; KEGG, Kyoto Encyclopedia of Genes and Genomes; OS, overall survival; CNV, copy number variation; GC, gastric cancer. ns: p>0.05.
In the TCGA-STAD cohort, researchers collected 366 cancer samples, excluding samples with a survival period of under 30 days. They were randomly separated into training and testing sets (n = 183 for each) for further study. The LRGs-based prognostic signature model was built using the training set (Supplementary Table S2). Initially, we screened out 17 DELRGs related to OS using univariate Cox regression analysis to establish each DELRG’s potential predictive value (Figure 2E). Figure 2F displayed OS-related gene expression levels in tumor and normal tissues. CYP1B1, ADH4, ELOVL4, and GC did not differ statistically significantly. Most of these genes were risk factors for gastric cancer, and the regulatory network showed that they were generally positively associated (Figure 2G).
Moreover, these 17 genes exhibited a high frequency of CNVs, with GAIN occurring more frequently than LOSS. ANKRD1 had the most significant loss, and BCHE had the highest gain (Figure 2H). The chromosomal locations of these CNV-altered genes are shown in Figure 2I. According to Figure 3A, we performed Lasso Cox analysis and cross-validation to avoid the signature from overfitting. Ultimately, we conducted a multivariate Cox regression analysis to ensure the stability and optimality of the signature. Five pivotal lipid metabolism-related genes—APOA1, BCHE, CYP19A1, PLA1A, and STARD5—were discerned and utilized to create the prognostic signature (Figure 3B). Consequently, each sample’s risk score was determined by its Cox coefficient and gene expression as: Risk score= (0.24012*BCHE expression) +(-0.88977*STARD5 expression) +(0.52063*CYP19A1 expression) +(0.09367*APOA1 expression) +(0.15832*PLA1A expression).
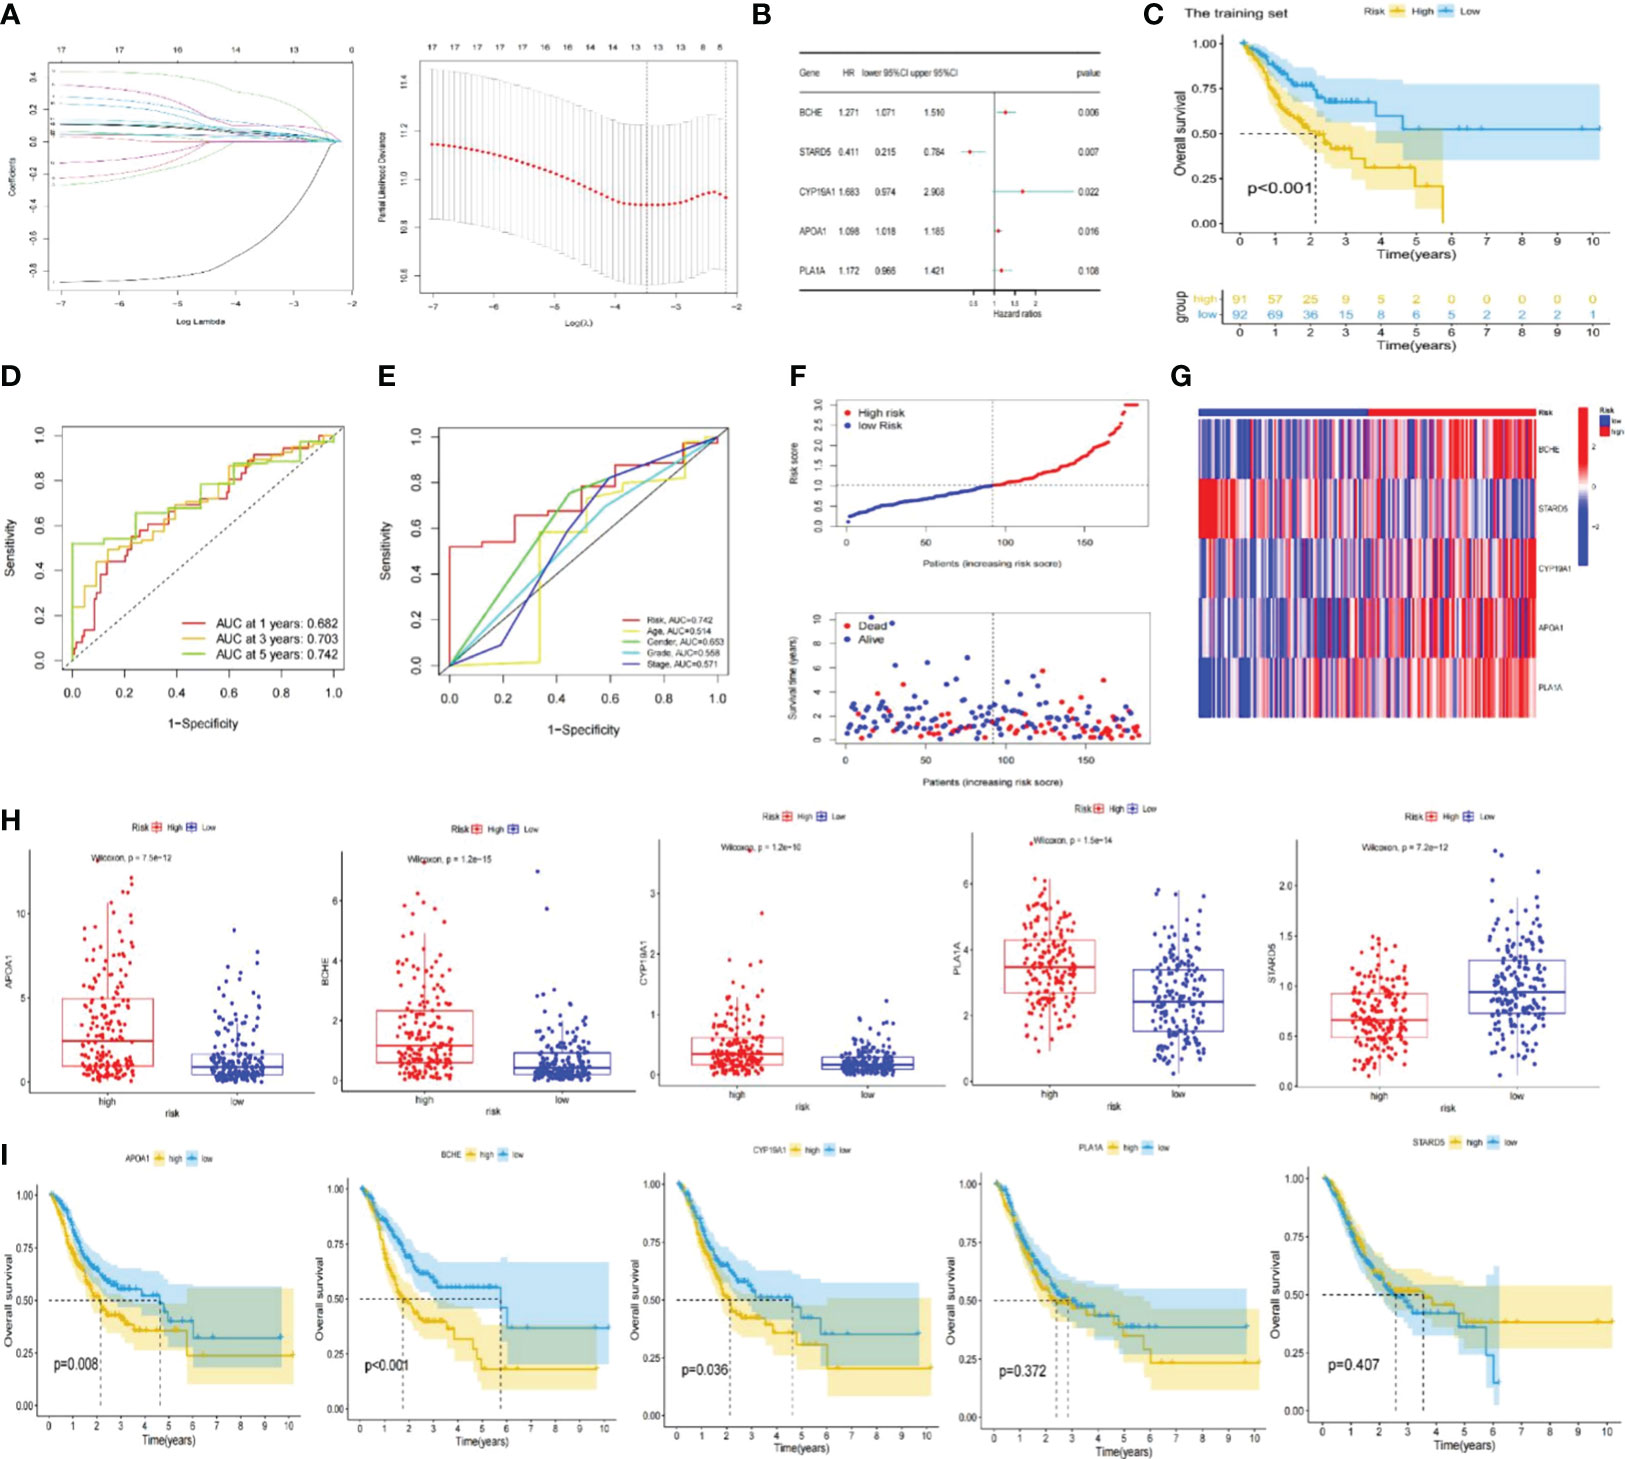
Figure 3 Construction of the lipid metabolism-based risk signature. (A) Lasso Cox regression analysis and cross-validation. (B) Multivariate Cox regression analysis for identifying the optimum signature genes. (C) Kaplan-Meier curve of high and low-risk subgroups in the training set. (D) ROC curves of the risk signature for predicting 1, 3, and 5-year survival. (E) ROC curve for predicting 5-year survival based on risk signatures and other clinical characteristics. (F, G) Distributions of risk scores, survival statuses and gene expression. (H) Expression of signature genes in high and low-risk subgroups in the entire TCGA set. (I) Kaplan-Meier curves of signature genes in the entire TCGA set. ROC; receiver operating characteristic; TCGA, The Cancer Genome Atlas.
The training set’s median risk score was employed to categorize all GC samples into high- or low-risk groupings. Supplementary Table S3 contains the risk score results.
In the TCGA-STAD and GSE 15459 cohorts, K-M analysis displayed that the OS of the LR subgroup was considerably longer than the HR subgroup (Figures 3C, 4A). Figures 3D, 4B exhibited the AUC values of risk signature 1, 3, and 5-year survival ROC curves. By contrasting the 5-year ROC curve with additional clinical characteristics, the superiority of the signature was even more evident (Figures 3E, 4C). We also plotted the distribution of risk scores, survival status, and time in the training group. The findings indicated that persons in the HR subgroup had a poor prognosis and validated in other sets (Figures 3F, 4D, E). In addition, the heatmaps manifested the expression differences of signature genes in LR and HR groups (Figures 3G, 4F). Finally, we generated boxplots and K-M curves of each signature gene to further excavate their expression levels and independent prognostic ability. As shown in Figures 3H, APOA1, BCHE, CYP19A1, and PLA1A were prominently expressed in the high-risk subgroup, while STARD5 was significantly lower. In K-M analysis, the low expression groups of APOA1, BCHE, and STARD5 exhibited longer OS, but the expression levels of PLA1A and STARD5 did not significantly impact the OS of GC patients (Figure 3I).
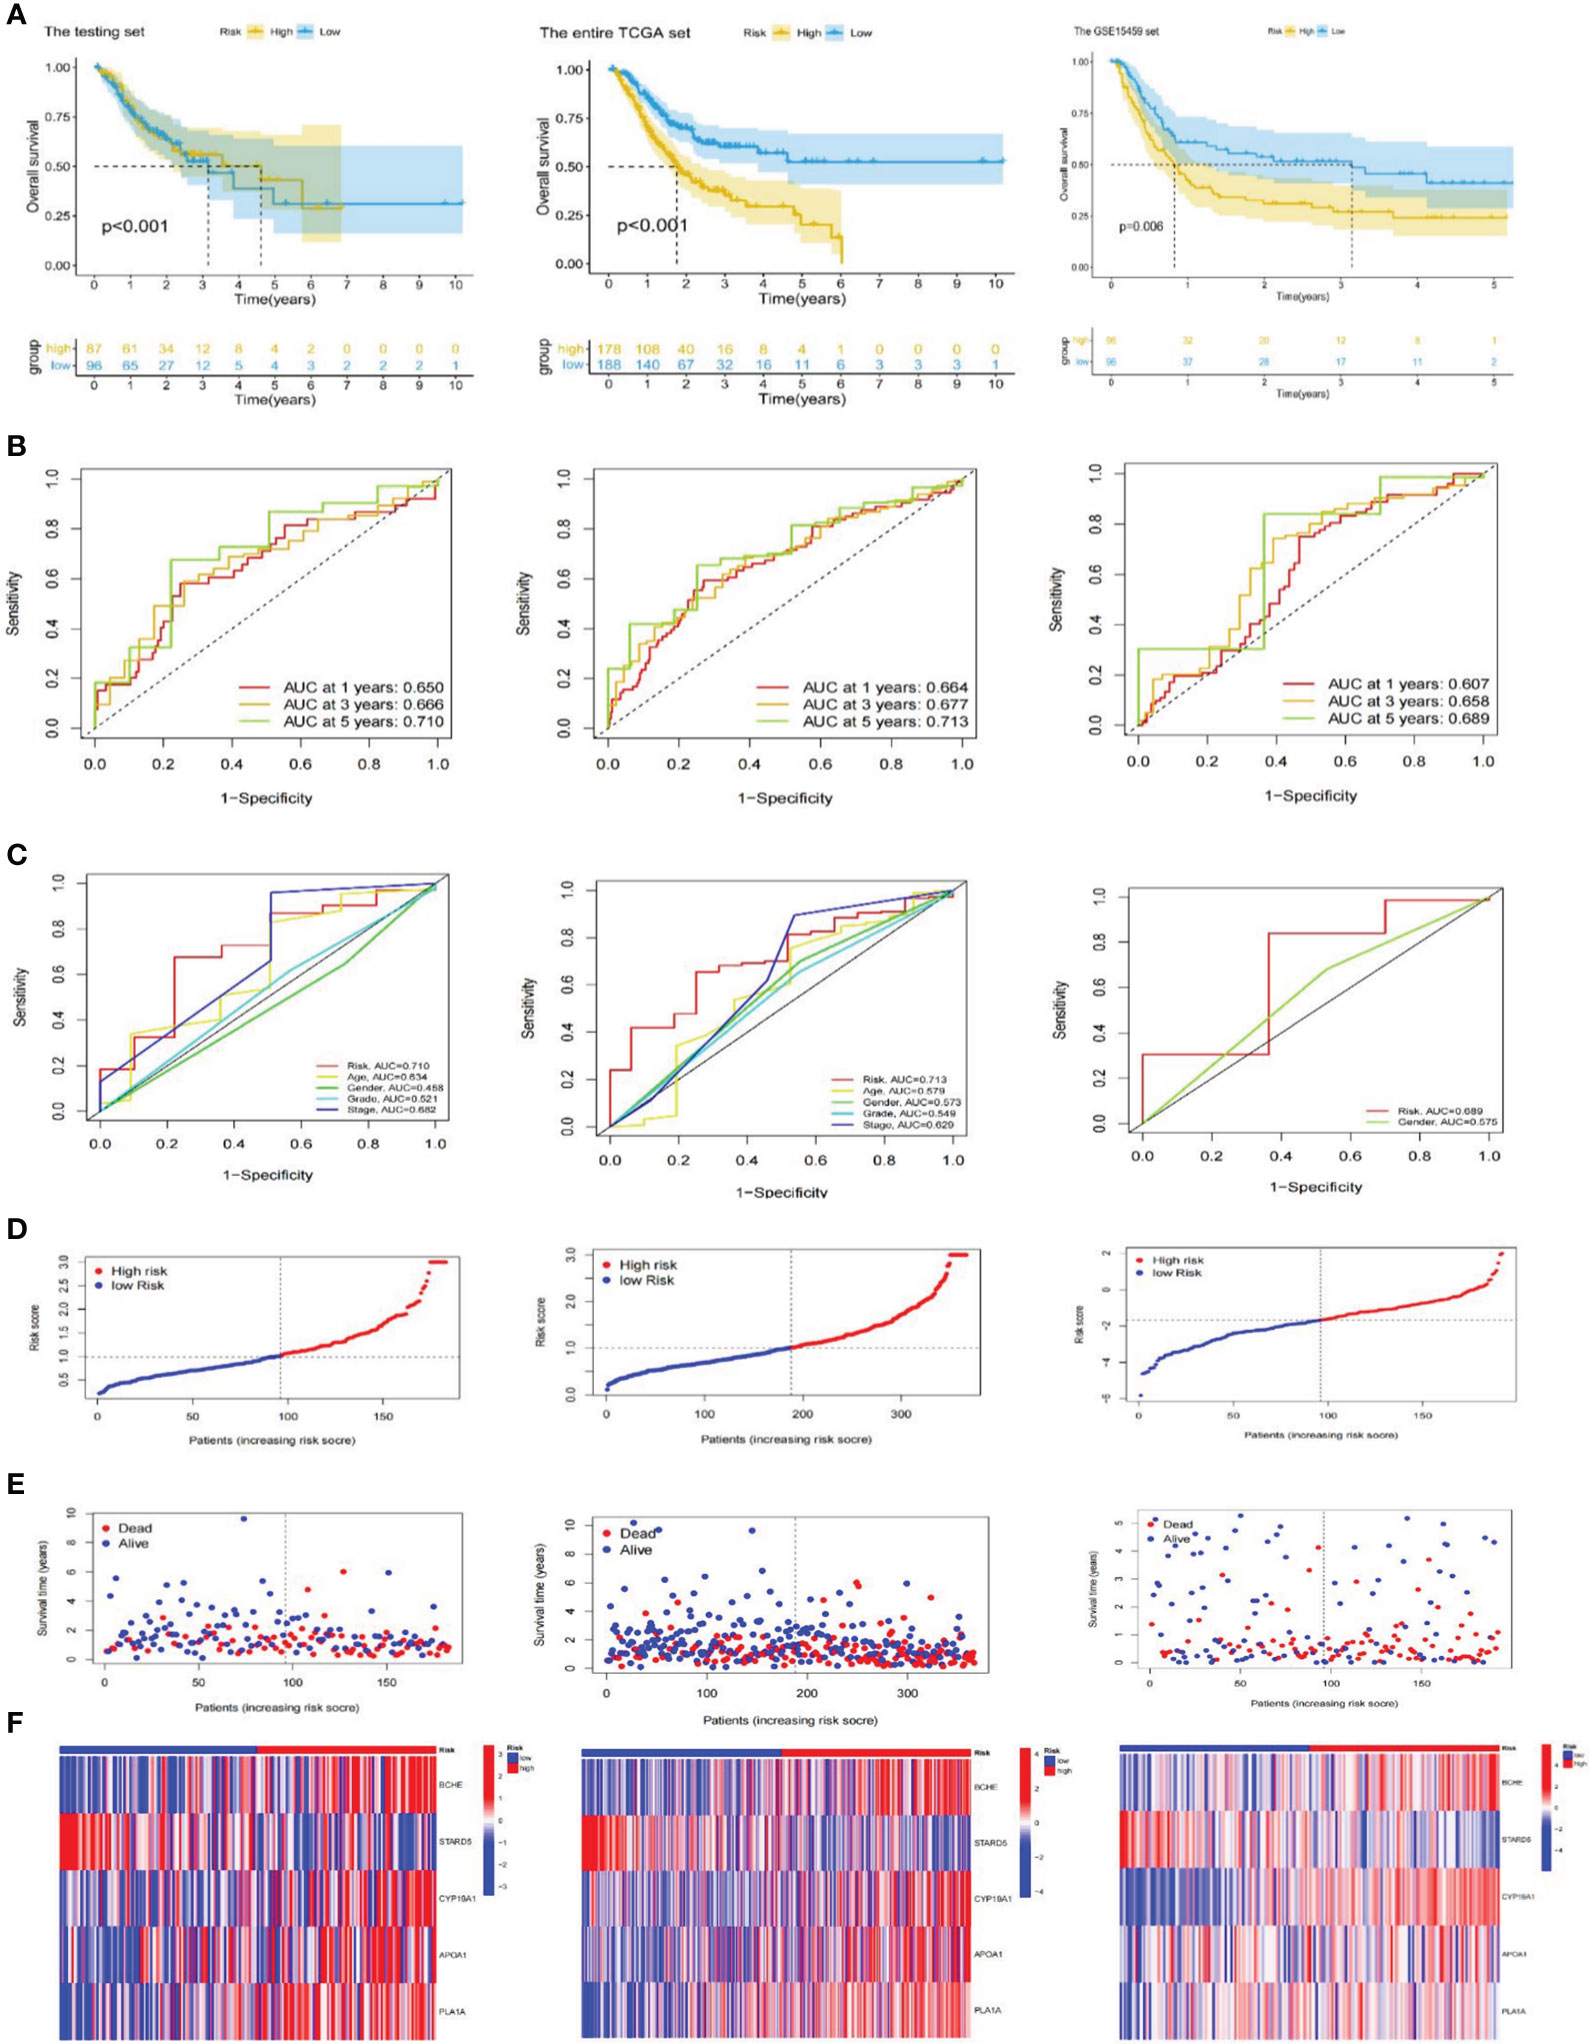
Figure 4 Validation of the risk signature. (A) Kaplan-Meier curves for high and low-risk subgroups in the testing set, the entire TCGA and GSE15459 cohorts. (B) ROC curves of the risk signature for predicting 1, 3, and 5-year survival in the testing set, the entire TCGA and GSE15459 cohorts. (C) ROC curve for predicting 5-year survival based on risk signatures and other clinical characteristics in the testing set, the entire TCGA and GSE15459 cohorts. (D–F) Distributions of risk scores, survival statuses and gene expression in the testing set, the entire TCGA and GSE15459 cohorts. TCGA, The Cancer Genome Atlas; ROC; receiver operating characteristic.
After that, we explored the LRGs-based signature’s capacity for prediction stratified based on different clinicopathological parameters in the TCGA database. The K-M curves suggested that patients in LR group had considerably better outcome than that of HR group in all categories fragmented by Age (>65/<=65; Figure 5A), Gender (female and male; Figure 5B), Grade (low/high; Figure 5C), Stage (I-II/III-IV; Figure 5D), T stage (T1-T2/T3-T4; Figure 5E), N stage (N0/N1-N3, Figure 5F), and M stage (M0, Figure 5G). Furthermore, we investigated the association between risk scores, clinicopathological features, and patient outcomes. The results exhibited that greater pathological Grade, T stage, and death (fustat=1) populations had considerably higher risk scores (Figures 5H, K, L). Nevertheless, there were no statistical differences in risk scores among Age, Gender, T-stage, and M-stage categories (Figures 5I, J, M, N).
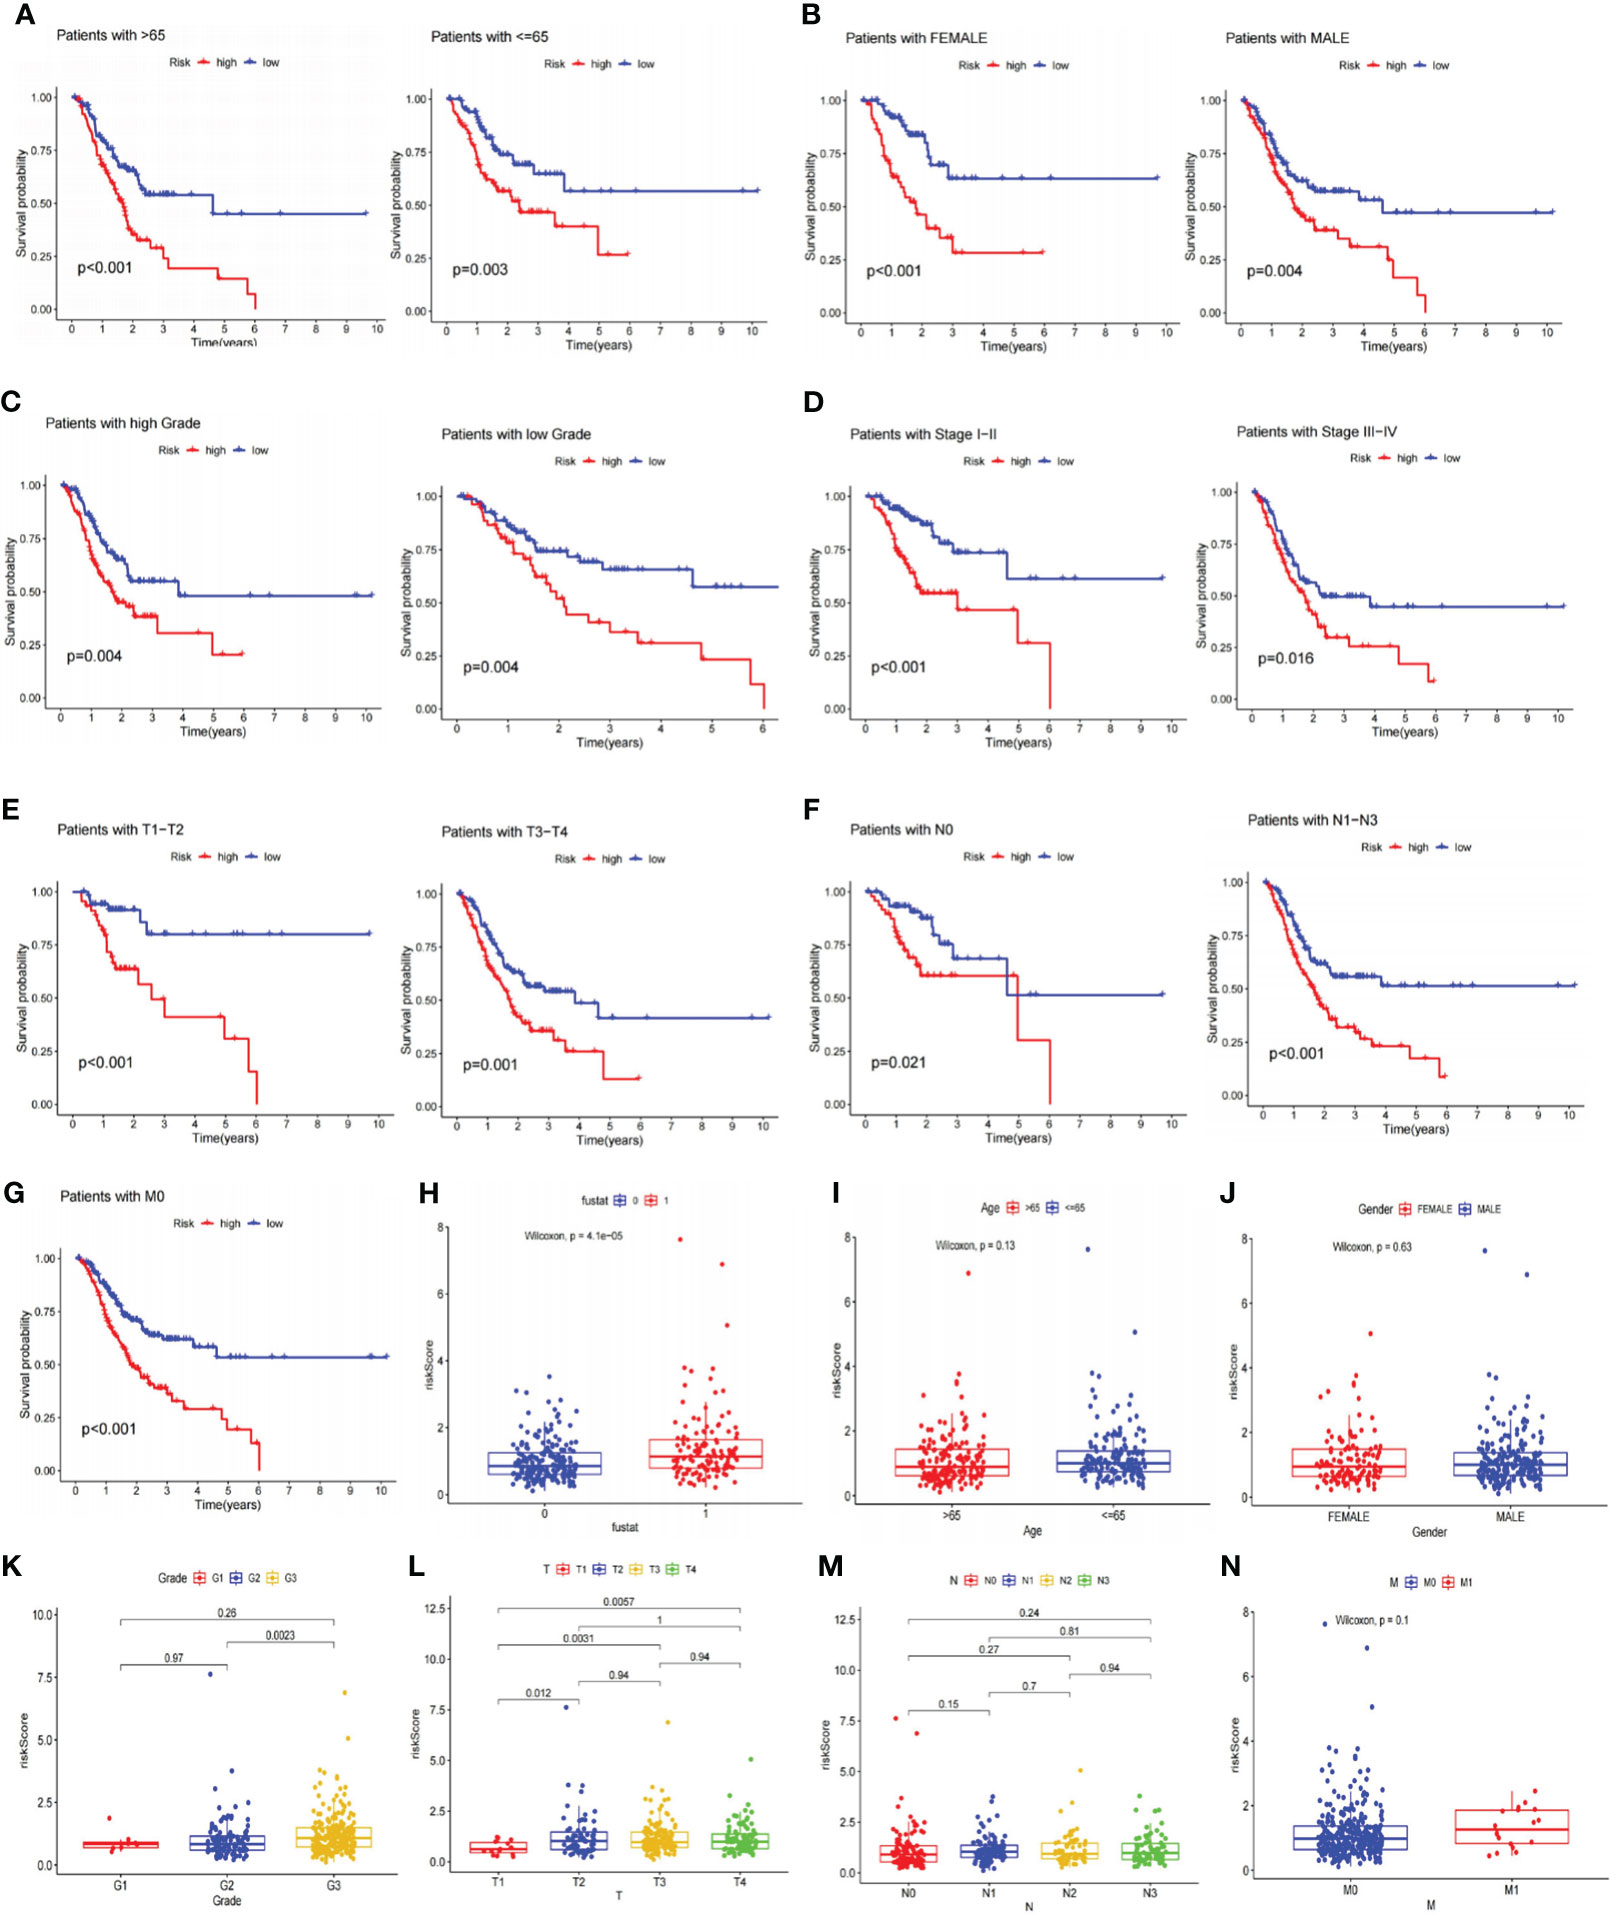
Figure 5 Analyses of the relationship between the risk signature and clinicopathological parameters. (A–G) The overall survival between the high and low-risk subgroups from the TCGA database are shown classifying patients by age, gender, tumor grade, clinical stage, T stage, N stage and M0 stage. Low-risk patients display longer overall survival than high-risk patients. (H–N) Systematic evaluation of risk scores and clinical parameters for GC samples, including survival status, age, gender, tumor grade, T stage, N stage, and M stage. TCGA, The Cancer Genome Atlas; GC, gastric cancer.
To better demonstrate risk scores could independently predict prognosis, we first performed univariate Cox analysis in the TCGA cohort, finding that Age (HR=1.018,95% CI = 1.001-1.035, p<0.05), Stage (HR=1.662,95% CI =1.331-2.075,p<0.001) and Risk Score (HR=1.426,95% CI =1.247-1.630,p<0.001) were related to OS. Multivariate regression confirmed the independence of Age (HR=1.030,95% CI =1.012−1.048,p<0.001), Stage (HR=1.775,95% CI =1.410−2.235,p<0.001), and Risk Score (HR=1.534,95% CI =1.313−1.792,p<0.001) (Figure 6A). The GSE15459 set’s risk score P-value was less than 0.01 in both univariate and multivariate Cox analyses, further supporting the viability of using risk scores to predict prognosis independently (Figure 6B). Additionally, there was a statistically significant difference (p<0.001) in PFS, with persons in the LR subgroup having noticeably longer PFS (Figure 6C). PCA analysis revealed distinct dimensions among different subgroups based on signature genes, DELRGs, all LRGs, and the whole gene expression profiles (Figures 6D-G). Among that, the substantially diverse distribution directions for HR and LR groups were observed based on the risk signature (Figure 6D), confirming the efficacy of our prognostic signature in identifying various GC patients.
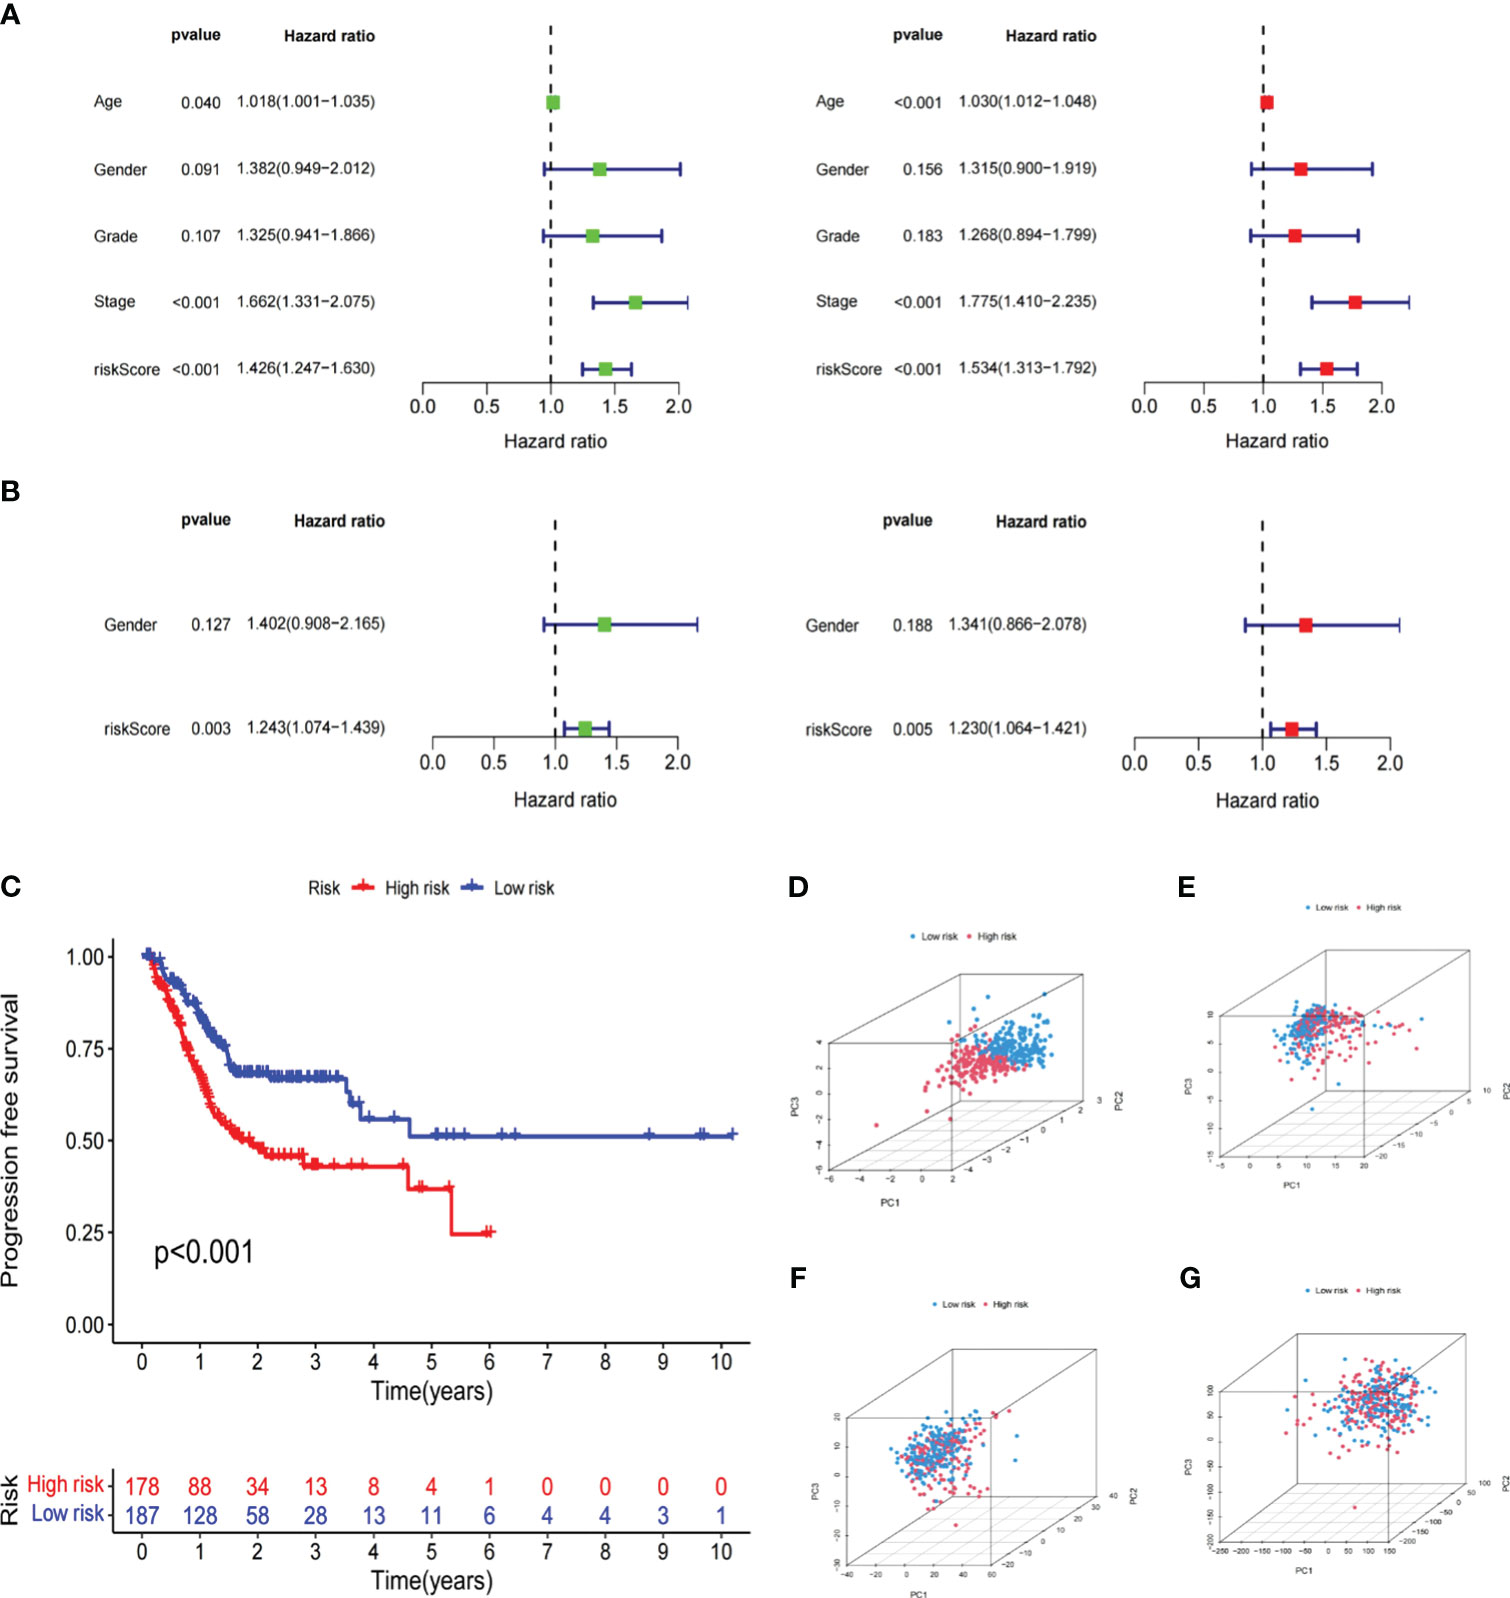
Figure 6 Independent verification of the risk signature. (A) Univariate and multivariate Cox regression analyses of the risk signature and clinical parameters in the TCGA cohort. (B) Univariate and multivariate Cox regression analyses of the risk signature and clinical parameters in the GSE15459 cohort. (C) The Kaplan-Meier curve shows the PFS of high and low-risk subgroups in the TCGA cohort. (D–G) PCA between low- and high-risk subgroups based on the lipid metabolism related signature, differently expressed lipid metabolic genes, all lipid metabolism-related genes, and the entire gene expression profiles. The Cancer Genome Atlas; PFS, progression free survival; PCA, principal components analysis.
Originally, we performed differential gene analysis (|log FC| > 1 and p< 0.05) across two risk groupings, yielding 544 DEGs (496 up-regulated and 48 down-regulated in the high-risk subgroup). In Figure 7A, we plotted a heatmap of the most prominent 100 DEGs. On these DEGs, we then carried out enrichment analyses. GO analysis demonstrated that these DEGs were predominantly abundant in the “signal release” and “hormone transport” of biological processes (BP) and the collagen−containing extracellular matrix in cellular components (CC). Regarding molecular function (MF), DEGs exhibited an enrichment in receptor-ligand activity and signaling receptor activator (Figure 7B). Following KEGG analysis, these DEGs were preponderantly concentrated in the PI3K−Akt, Calcium, cAMP, and PPAR signaling pathways (Figure 7C), all associated with tumor development and metastasis. Additionally, GSEA analysis was utilized to anatomize functional distinctions between risk subgroups (Supplementary Table S4). The findings indicated that the LR subgroup had enriched metabolic pathways, including fatty acid metabolism, citrate cycle TCA cycle, and glycolysis gluconeogenesis (Figure 7D). On the contrary, the paths remarkably situated in the HR subgroup contained PPAR, TGF-β, Calcium, and WNT signaling pathways and matrix-activated related pathways like gap junction and focal adhesion (Figure 7E). Accordingly, we speculated that the worse outcome of individuals in the HR subgroup was related to activating these carcinogenic pathways and matrix pathways leading to tumor metastasis.
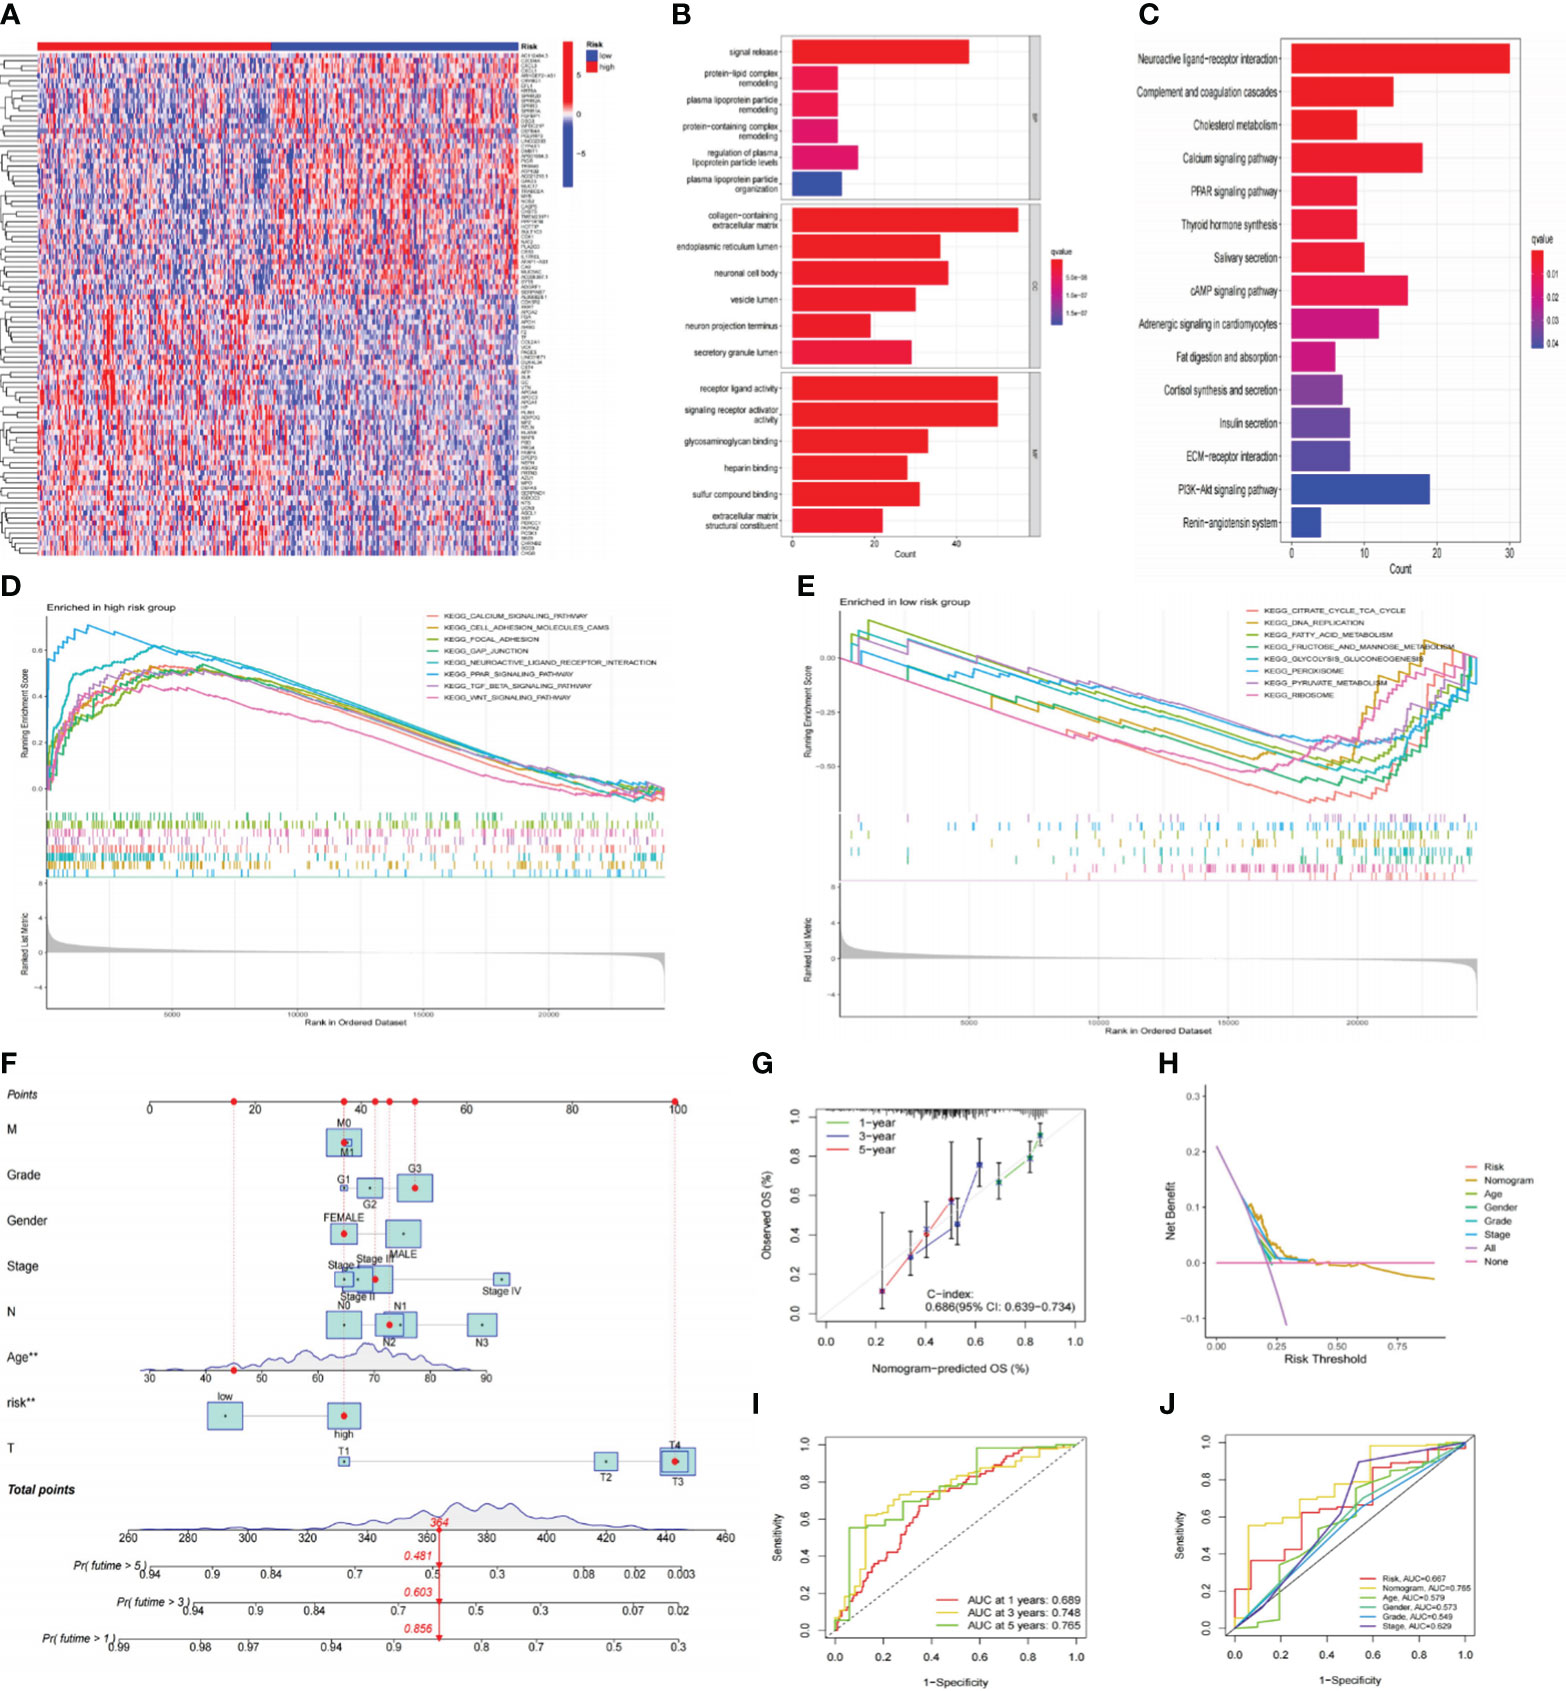
Figure 7 Functional analysis of risk signatures and construction of nomogram. (A) Heatmap of the top 100 DEGs between high and low-risk subgroups. (B, C) GO and KEGG analyses of DEGs between high and low-risk groups. (D, E) GSEA analysis of the primary enriched pathways in high and low-risk groups. (F) The nomogram constructed based on the risk signature and other clinicopathological parameters. (G) Calibration plots for nomograms at 1, 3, and 5-years. (H) DCA of the nomogram, risk signature, and other clinicopathological parameters. (I) ROC curve of the risk signature for predicting 1, 3, and 5-year survival. (J) ROC curve for predicting 5-year survival based on the nomogram and other clinical characteristics. DEGs, differentially expressed genes; GO, Gene Ontology; KEGG, Kyoto Encyclopedia of Genes and Genomes; GSEA, gene set enrichment analysis; DCA; decision curve analysis; ROC, receiver operating characteristic.
To improve the clinical practicality of our signature even more, we constructed a nomogram using risk scores and other clinicopathological characteristics to predict OS (Figure 7F). The accurate predictability of the nomogram was demonstrated by the calibration curve (C-index:0.686), consistent with its OS estimates, confirming the satisfactory predictive ability of the nomogram (Figure 7G). In order, the 1-, 3-, and 5-year ROC curves had area under the curve (AUC) values of 0.689, 0.748, and 0.765 (Figure 7I). Additionally, the DCA curve (Figure 7H) and ROC curve (Figure 7J) demonstrated that the nomogram outperformed the risk signature and other conventional clinicopathological parameters in forecasting the prognosis of GC. In conclusion, the effectiveness and reliability of our nomogram were elucidated from various aspects.
The tumor microenvironment (TME) was known for its hypoxia, chronic inflammation, and immune suppression, and it was a crucial player in tumor development. We thus employed the ESTIMATE method to ascertain the fraction of tumor, stromal, and immune cells in the TME (Supplementary Table S5). According to the findings, the LR group had greater tumor purity scores, whereas the HR group had higher stromal and estimation values. Immune score differences were not statistically significant (Figure 8A). The K-M curve revealed that individuals with low stromal scores exhibited prolonged OS (Figure 8B). Next, we employed the CIBERSORT algorithm to measure the percentage of 22 TIICs in each tumor sample of the TCGA database. As shown in Figures 8C, D, the LR subgroup observed elevated infiltration of B memory cells, activated NK cells, and activated Dendritic cells, all of which exerted anti-tumor effects. Conversely, the high-risk group had more tumor-associated macrophages (TAMs; M2 phenotype) infiltration, which could release immunosuppressive cytokines and stimulate cancer invasion. Additionally, we utilized ssGSEA to investigate the connection between the risk signature and TIICs, discovering that most immunosuppressive cells were closely associated with the HR group (Figures 8E, F). The Spearman analysis showed that risk scores had a positive correlation with regulatory T cells, MDSC, and TAMs but a negative correlation with CD4+ and type 17 helper T cells (Figure 8G). These discoveries suggested that persons in the high-risk category might promote immune escape by inducing immune suppression, resulting in a worse prognosis. The results of ESTIMATE, CIBERSORT, and ssGSEA are all summarized in Supplementary Table S5.
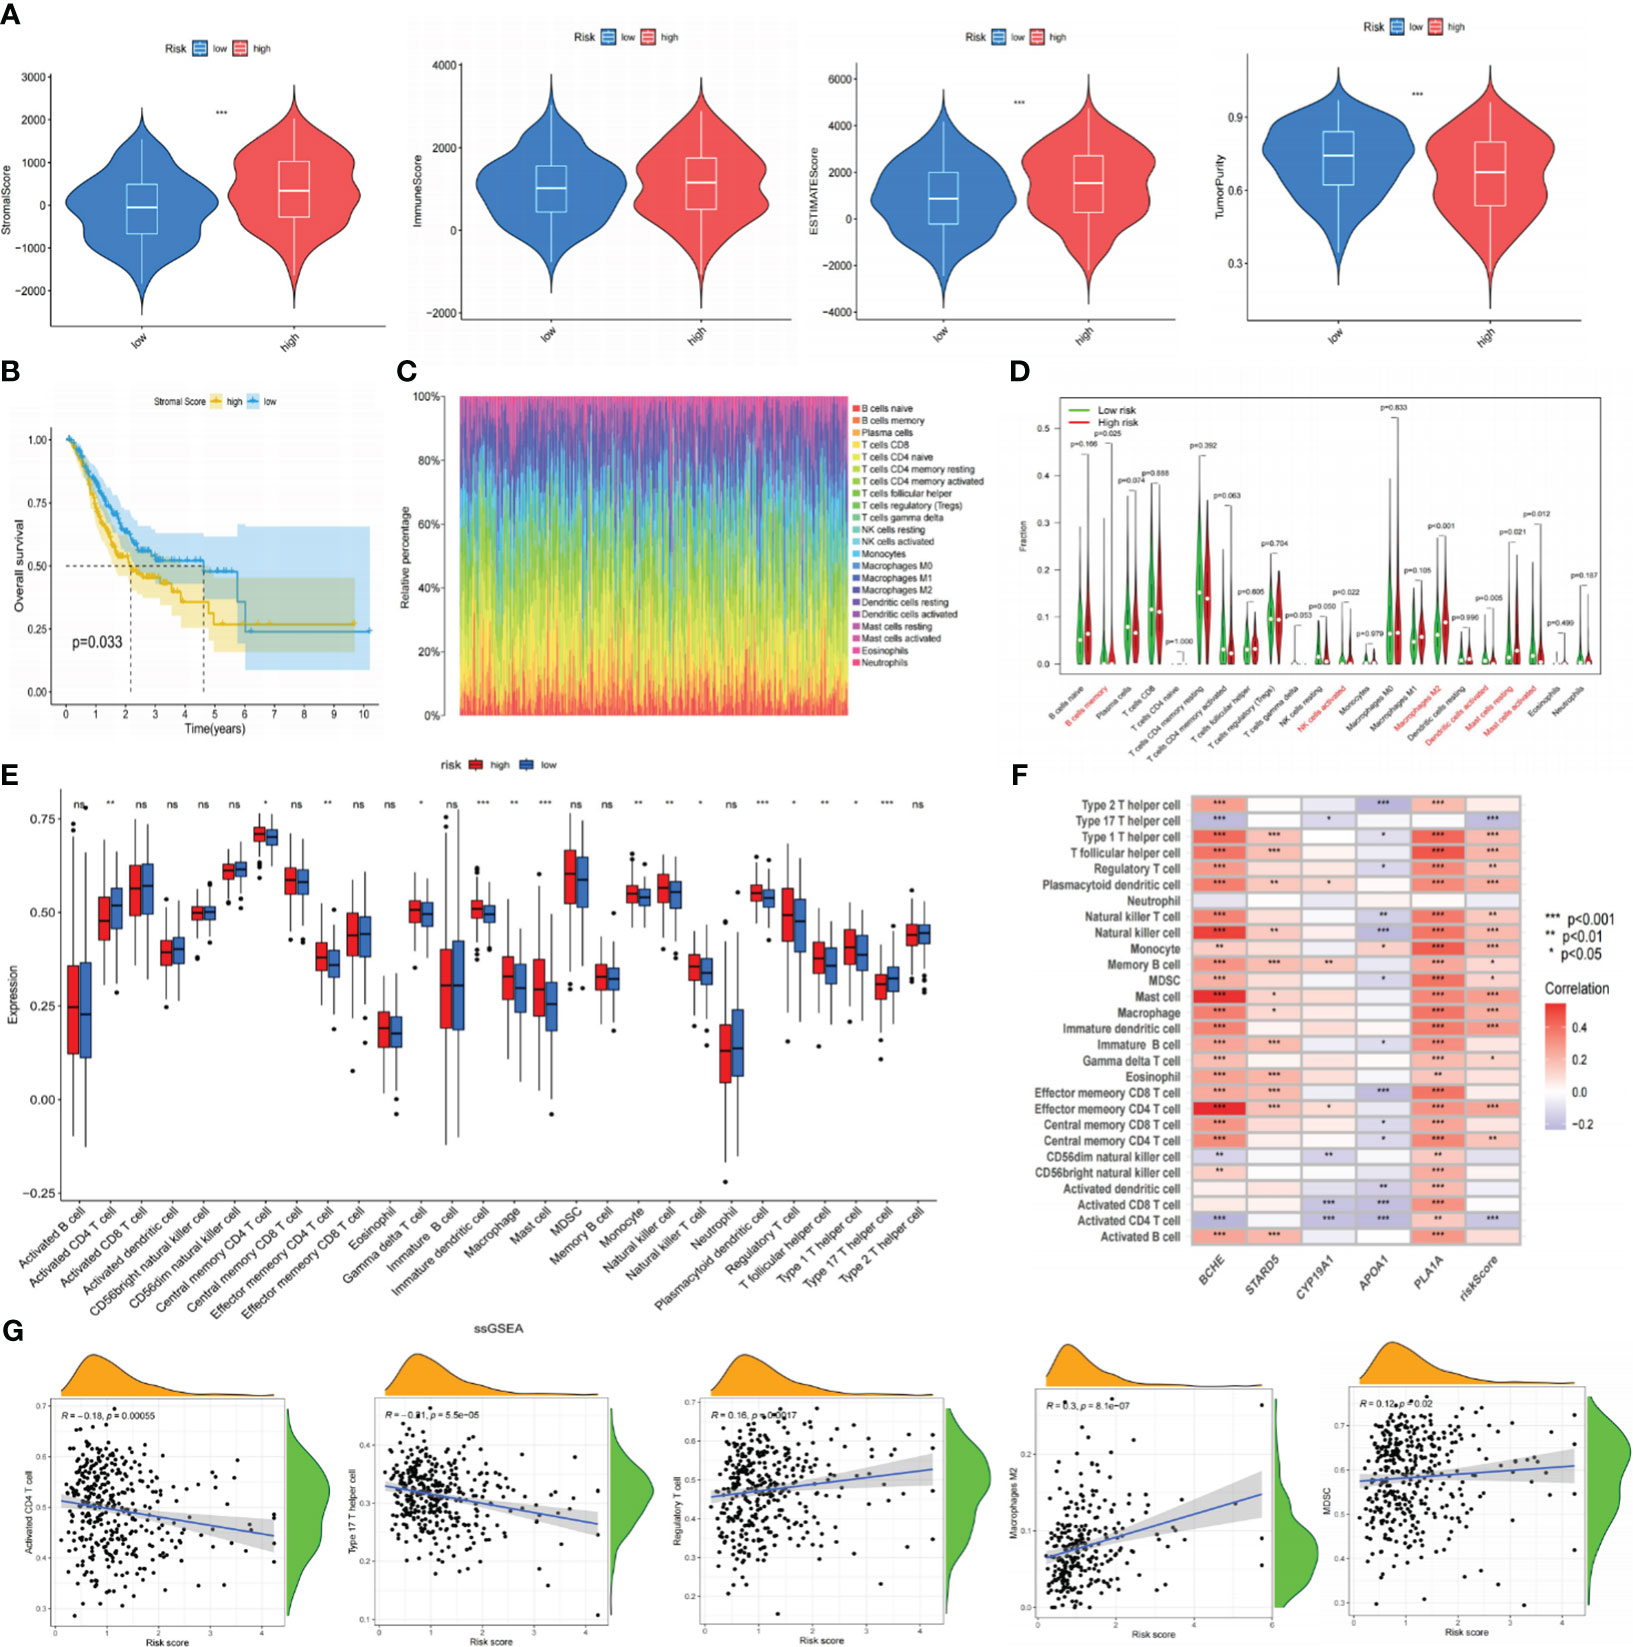
Figure 8 The correlation between immune infiltration and our risk signature. (A) The content of stromal cells, immune cells, and tumor purity in the TME of the TCGA cohort. (B) Kaplan-Meier curve indicates that patients with low stromal scores have longer OS. (C) The proportion of 22 types of TIICs in the GC population using the CIBERSORT algorithm. (D) Expression levels of 22 TIICs in high and low-risk groups. (E) Analyzing the infiltration levels of TIICs in high and low-risk groups using the ssGSEA algorithm. (F) Spearman correlation analysis between risk signature and TIICs. (G) Correlation analysis between risk scores and TIICs. *P< 0.05; **P< 0.01; ***P< 0.001. TME, tumor microenvironment; TCGA, The Cancer Genome Atlas; OS, overall survival; TIICs, tumor-infiltrating immune cells; GC, gastric cancer; ssGSEA, single-sample gene set enrichment analysis. ns: p>0.05.
Previous research has demonstrated a close correlation between somatic mutations and cancer development (35). These mutations were also crucial in formulating targeted treatments for cancer. As a result, we conducted somatic mutation analysis on the TCGA database. It was demonstrated that compared to the HR subgroup, the LR-scoring population had a greater mutation incidence (91.35% vs. 87.28%), and the most frequent mutation type was missense mutation, trailed by nonsense and frameshift deletion. The waterfall plot exhibited that TTN, TP53, MUC16, LRP1B, and ARID1A were the five most prominent genes with mutation frequency (Figure 9A). Subsequently, we calculated the TMB values for each specimen. The LR group appeared to have higher TMB scores (Figure 9B), and individuals with elevated TMB values maintained prolonged OS. Patients with low-risk and high-TMB scores had the best prognosis among the four groups, according to our analysis of the combination of TMB and risk scores (Figure 9C).
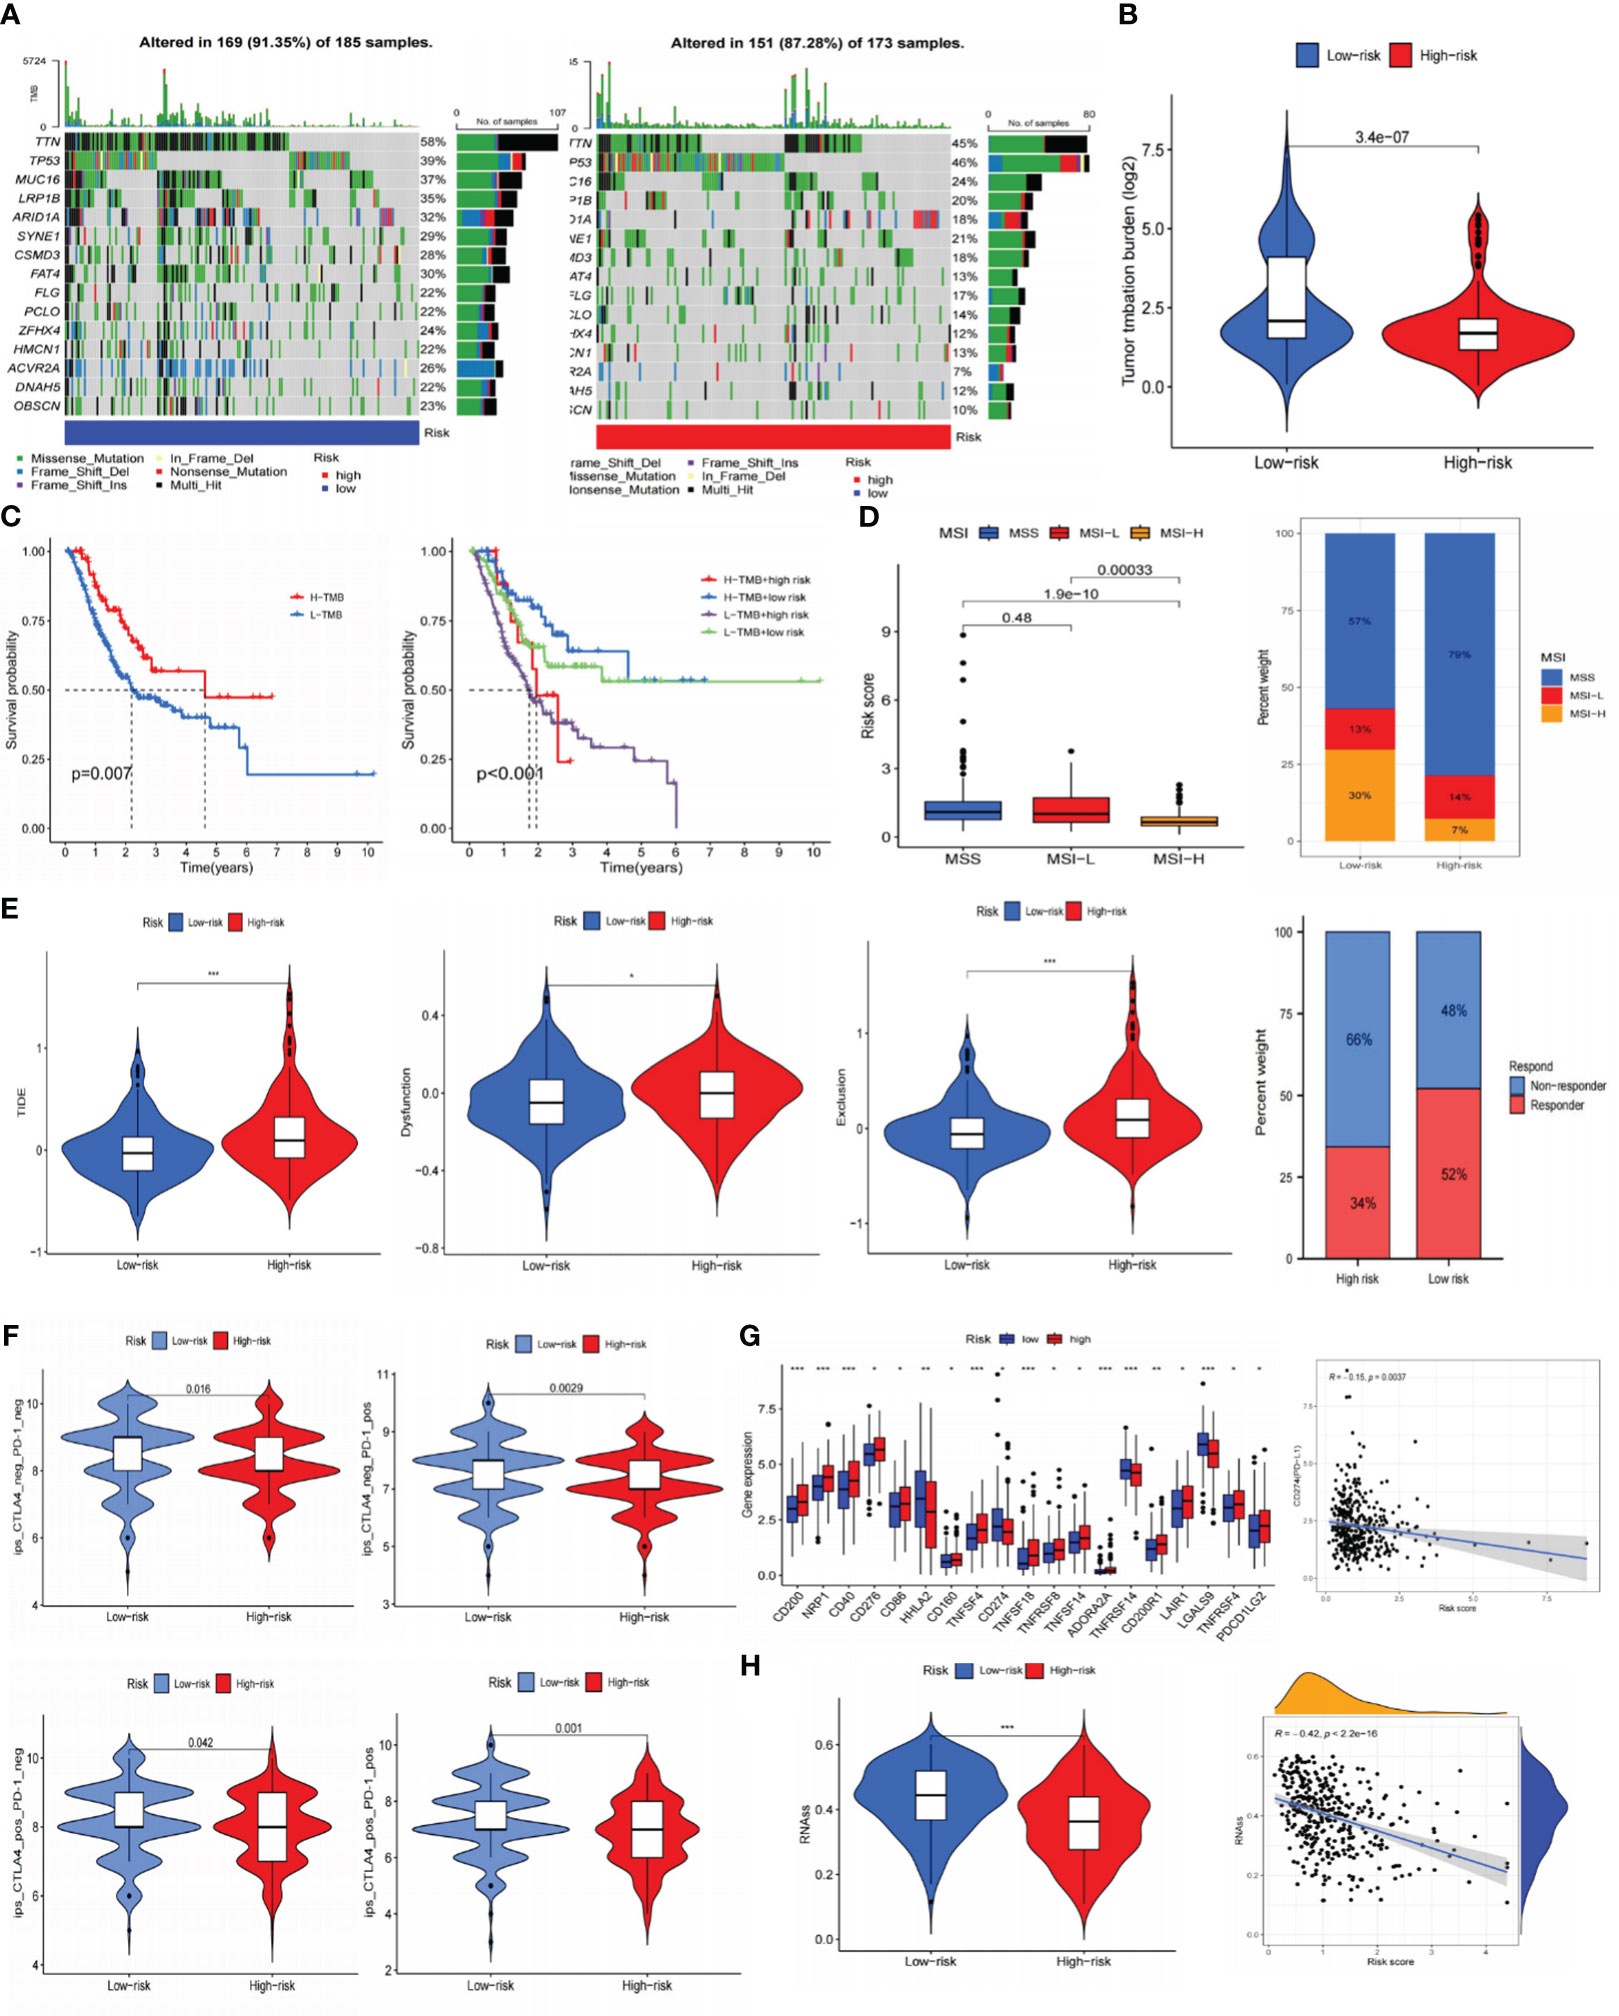
Figure 9 Prediction of immunotherapy for gastric cancer. (A) Somatic cell mutation frequencies in high and low-risk groups. (B) TMB levels in high and low-risk groups. (C) Kaplan-Meier curve of OS in high and low-TMB groups; Kaplan-Meier curve survival curves show different survival among the four groups that combined TMB with risk signature. (D) Analysis of risk signature and microsatellite state. (E) TIDE, dysfunction, exclusion, and immunotherapy response in high and low-risk groups. (F) Joint analysis of anti-PD-1 antibody and anti-CTLA-4 antibody in risk signature. (G) Expression of ICIs in high and low-risk groups, and the correlation between risk scores and PD-L1. (H) RNAss value in high and low-risk groups, and the association between risk scores and RNAss. *P< 0.05; **P< 0.01; ***P< 0.001. TMB, tumor mutational burden; OS, overall survival; TIDE, tumor immune dysfunction and exclusion; ICIs, immune checkpoint inhibitors; RNAss, RNA stemness scores.
Afterward, we predicted the immune therapy response of GC patients by analyzing several common biomarkers. Figure 9D suggested significant differences across various microsatellite groupings, where the MSI-H category had considerably lower risk scores. The overlay graph demonstrated that the microsatellite instability (MSI) percentage was more significant in the LR group (43%). Moreover, we performed TIDE analyses and discovered that the HR group displayed a more significant proportion of immunological non-responders along with higher TIDE, exclusion, and dysfunction scores (Figure 9E). This implied that the HR group may be more susceptible to immunological escape and not responsive to immunotherapy.
Using immunotherapy data from TCIA, we additionally explored the connection between the risk signature and ICIs. Programmed cell death protein 1 (PD-1) positive, cytotoxic T lymphocyte-associated antigen-4 (CTLA-4) positive, and PD-1/CTLA-4 positive groups showed greater immunotherapy efficacy in the LR subgroup (Figure 9F). According to immune checkpoints analysis, the low-risk population displayed increased programmed cell death-ligand 1 (PD-L1) expression (Figure 9G), indicating a greater chance of benefiting from immunotherapy. Furthermore, it was intriguing to note that there is a negative association between risk scores and RNAss (Figure 9H) that the lower the risk score, the more distinct the stem cell characteristics of GC cells and the lower the level of cell differentiation.
The IC50 of many common targeted drugs and standard chemotherapy drugs (such as 5-fluorouracil, oxaliplatin, cisplatin, and irinotecan) was positively correlated with risk scores based on the drug sensitivity analysis shown in Figure 10. This suggests that these drugs may benefit patients with low-risk scores more. Bioinformatics analysis revealed that APOA1, BCHE, and STARD5 were significantly expressed in normal samples, while CYP19A1 and PLA1A were considerably expressed in tumor samples in the TCGA-STAD cohort (Figure 11A). Subsequently, we employed qRT-PCR to confirm our signature’s dependability further (Supplementary Table S6). Consistent with the preceding analytical results, the expression of APOA1, BCHE, and STARD5 in human gastric cancer cells (AGC, HGC-27) was significantly lower (p<0.0001) compared to normal gastric epithelial cells (GSE-1). In contrast, the expression of CYP19A1 and PL1A1 was significantly elevated (p<0.05) (Figure 11B).
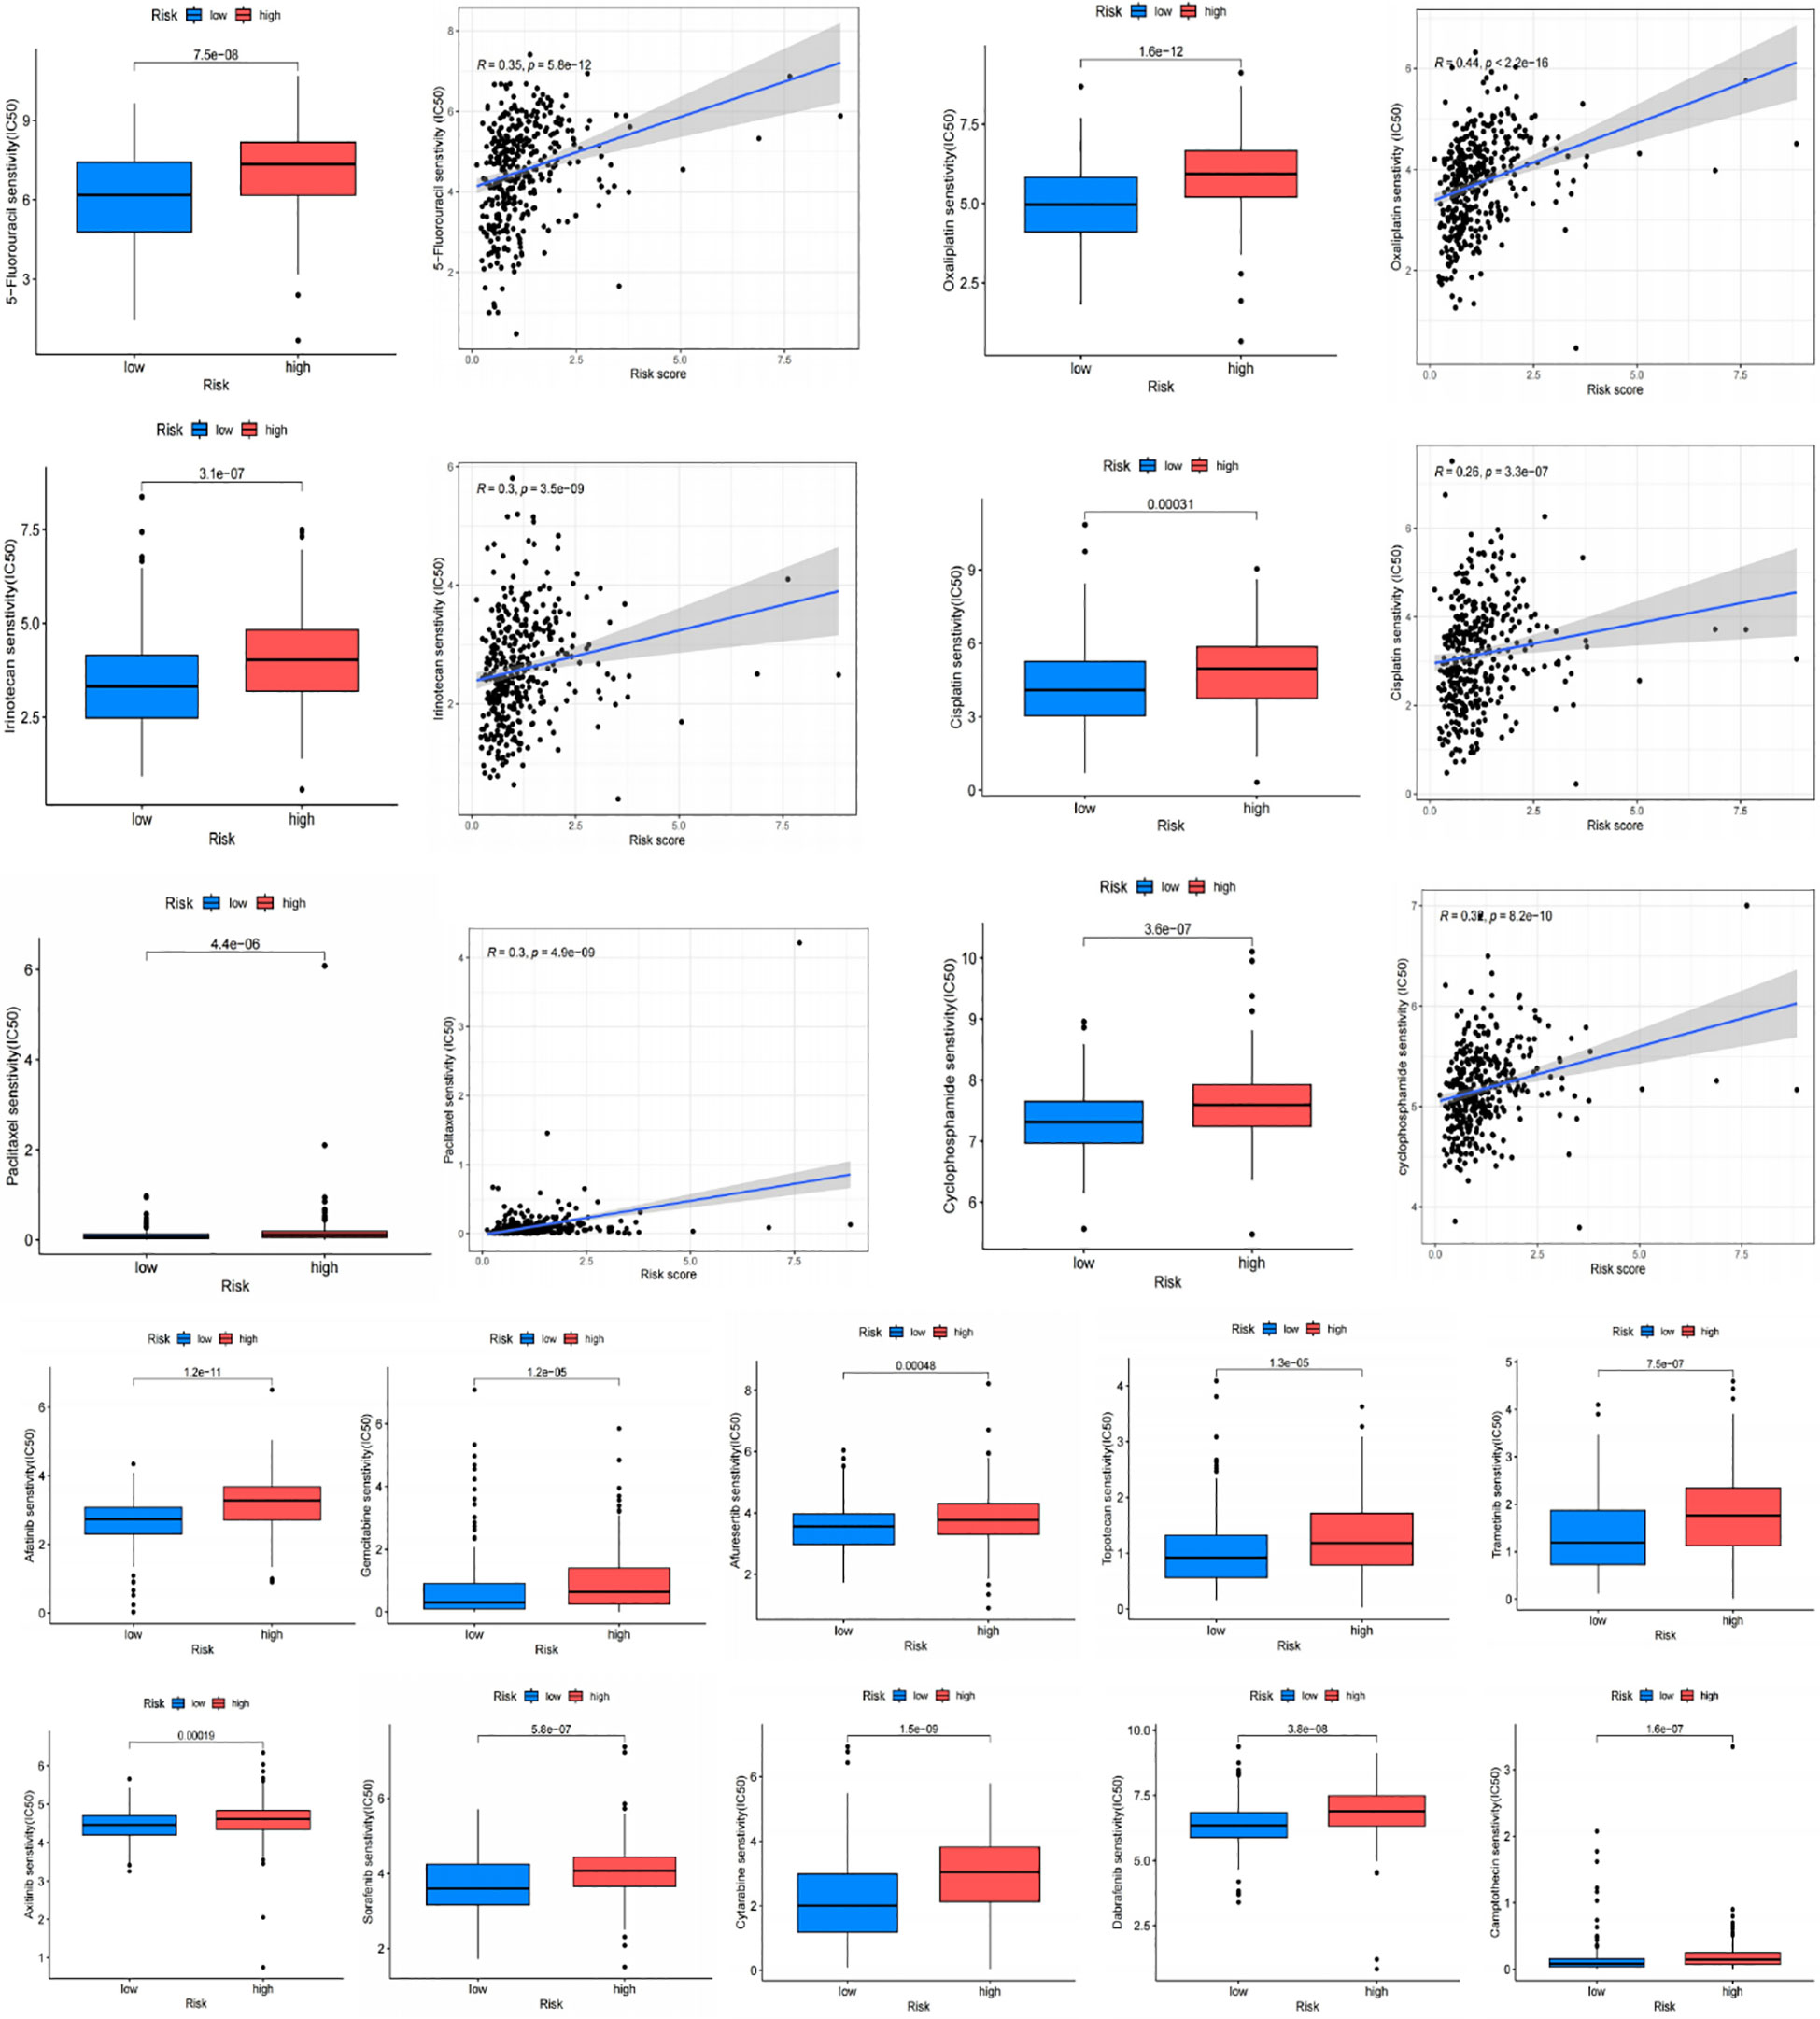
Figure 10 Drug sensitivity analysis. Chemotherapy drugs used for standard treatment of gastric cancer, such as oxaliplatin, cisplatin, paclitaxel, 5-fluorouracil, and irinotecan, are more effective in the low-risk group with lower IC50 values.
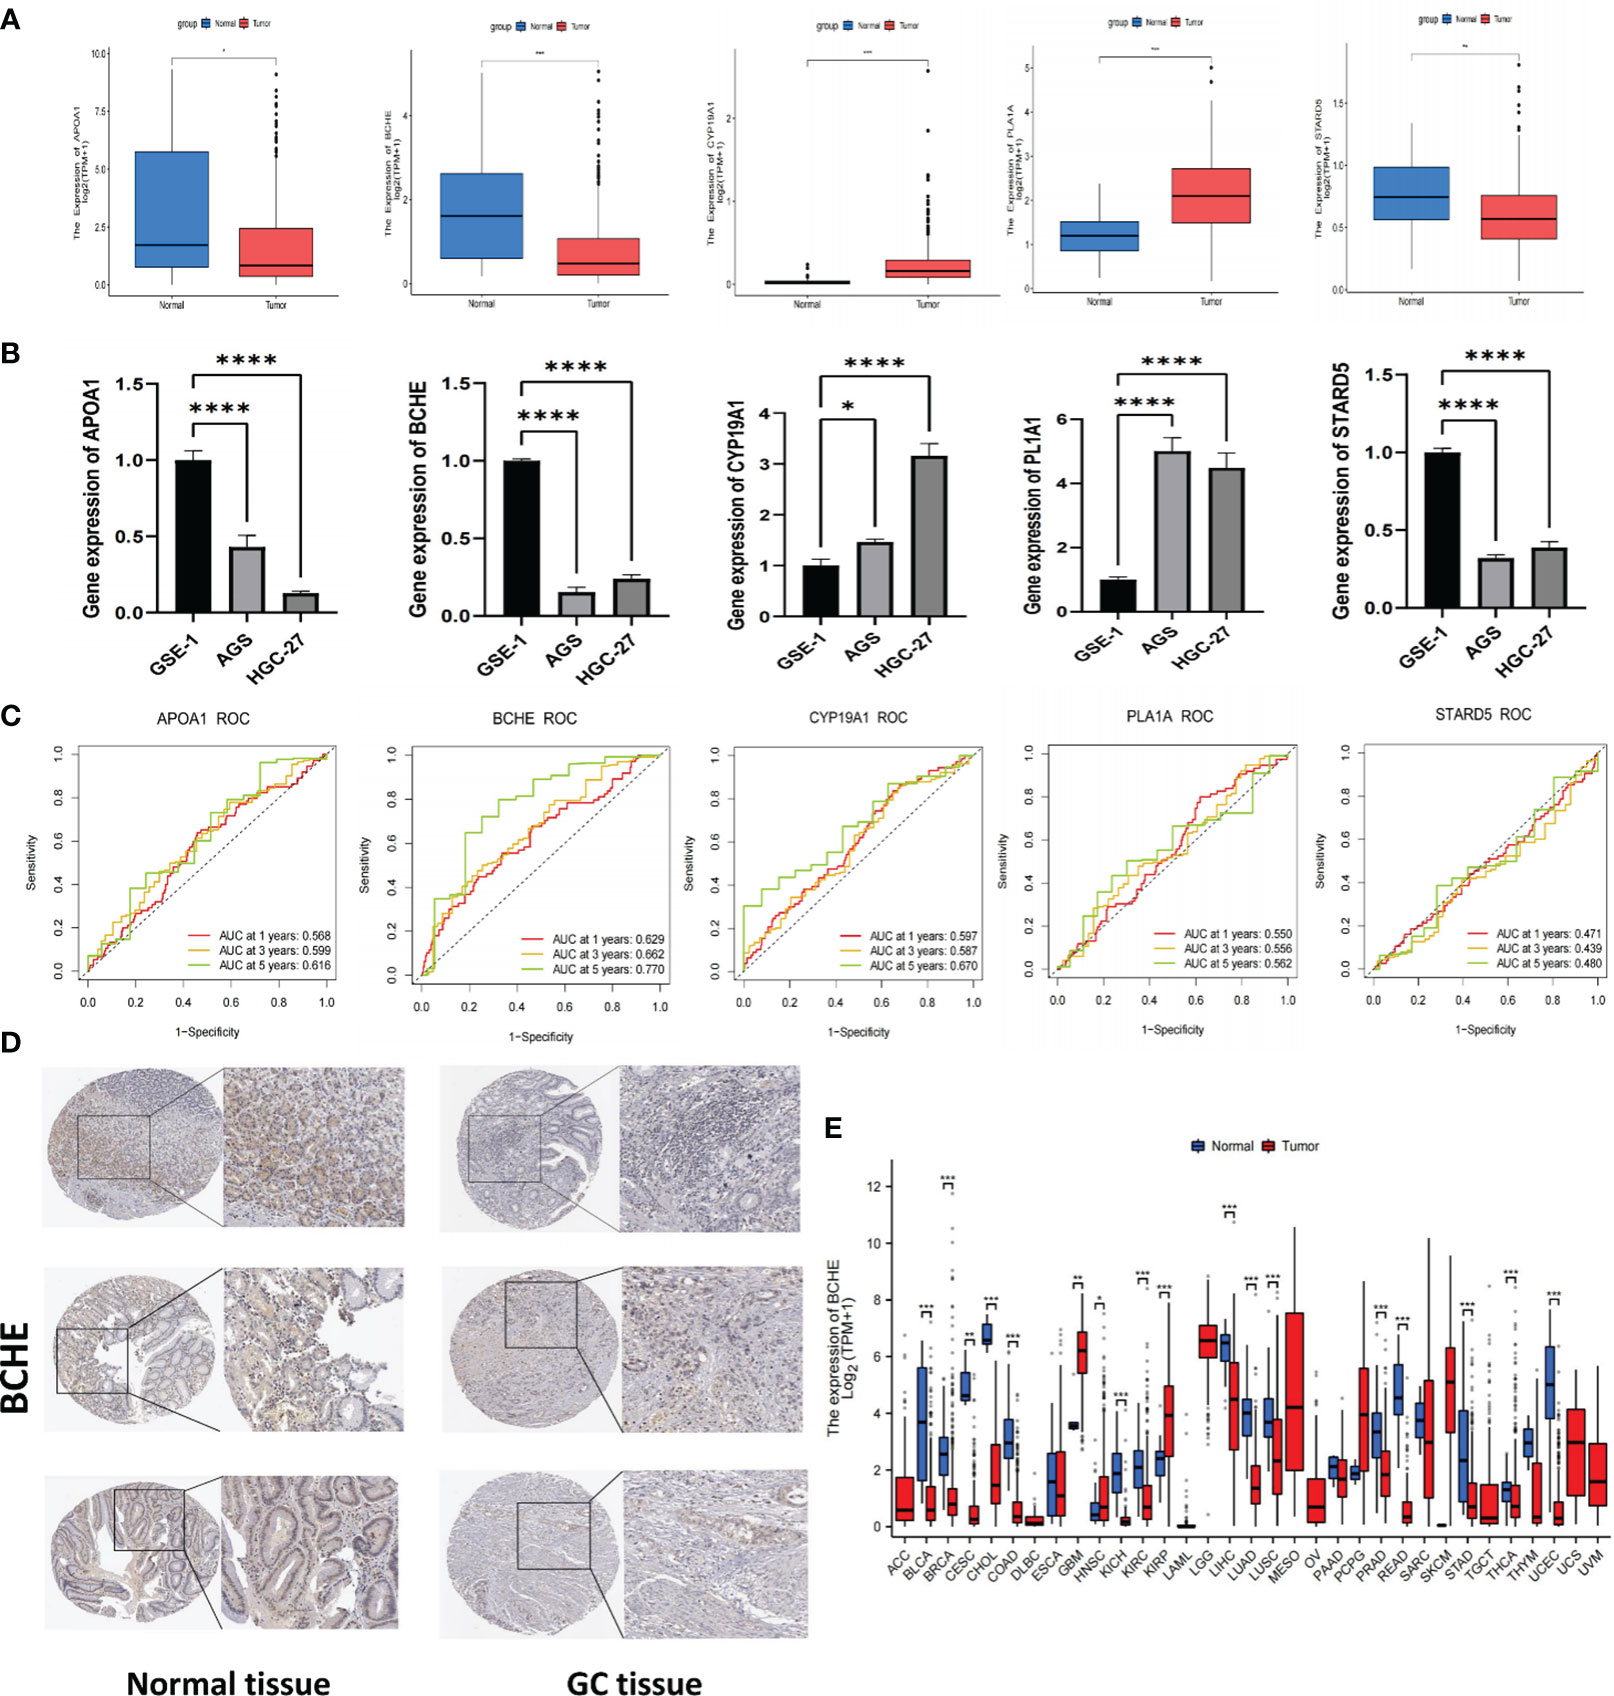
Figure 11 Verification of signature genes and Identifying BCHE as a potential biomarker. (A) Expression of APOA1, BCHE, CYP19A1, PL1A1, and STARD5 in tumor and normal samples of the TCGA cohort. (B) The qRT-PCR validation of signature genes. A human gastric epithelial cell line (GSE-1) and two human gastric cancer cell lines (AGS and HGC-27). (C) ROC curves of the five signature genes. (D) The protein expression of BCHE by HPA database. (E) Pan-cancer analysis of BCHE in TCGA database. *P< 0.05; **P< 0.01; ***P< 0.001. ****P< 0.0001. qRT-PCR, quantitative real-time polymerase chain reaction.
To investigate the five genes in our signature in more detail, we plotted their 1, 3, and 5-year ROC curves and AUC values showed BCHE as the most prominent gene in the signature (Figure 11C). Consequently, the researchers made the decision to study BCHE in-depth. We first detected the protein levels of BCHE through immunohistochemistry (ICH) in the HPA database, and the findings indicated that the ICH staining level of BCHE in normal tissue was more pronounced than in gastric cancer tissue, and the staining site was mainly located in Cytoplasmic/membranous nuclear (Figure 11D). After that, we employed the TCGA database to perform a pan-cancer analysis on BCHE. Results demonstrated that BCHE was low expressed in the tumor tissues of BLCA, BRCA, LUAD, and LIHC, but considerably expressed in the tumor tissues of GBM, HNSC, and KIRP (Figure 11E). In order to explore the clinical relevance of BCHE even further, we examined its connection to the clinicopathological features of patients with gastric cancer. As evidenced by Figures 12A, B, BCHE is more pronounced in populations with lower differentiation (G3), later clinical and T-stages, death patients, as well as subgroups with shorter PFI, DFI, and DSS, indicating that BCHE may be an oncogene that can induce cancer development and lead to poor prognosis. Likewise, we conducted functional analysis on BCHE, and GO displayed that it is primarily related to muscle system process, extracellular structure, and matrix organization, as well as the binding of some compounds (Figure 12C). Additionally, BCHE is significantly related to the majority of TIICs, according to an assessment of its immune infiltration characteristics. BCHE expression exhibits a positive relationship with other TIICs but a negative correlation with activated CD4 T cells (Figure 12D).
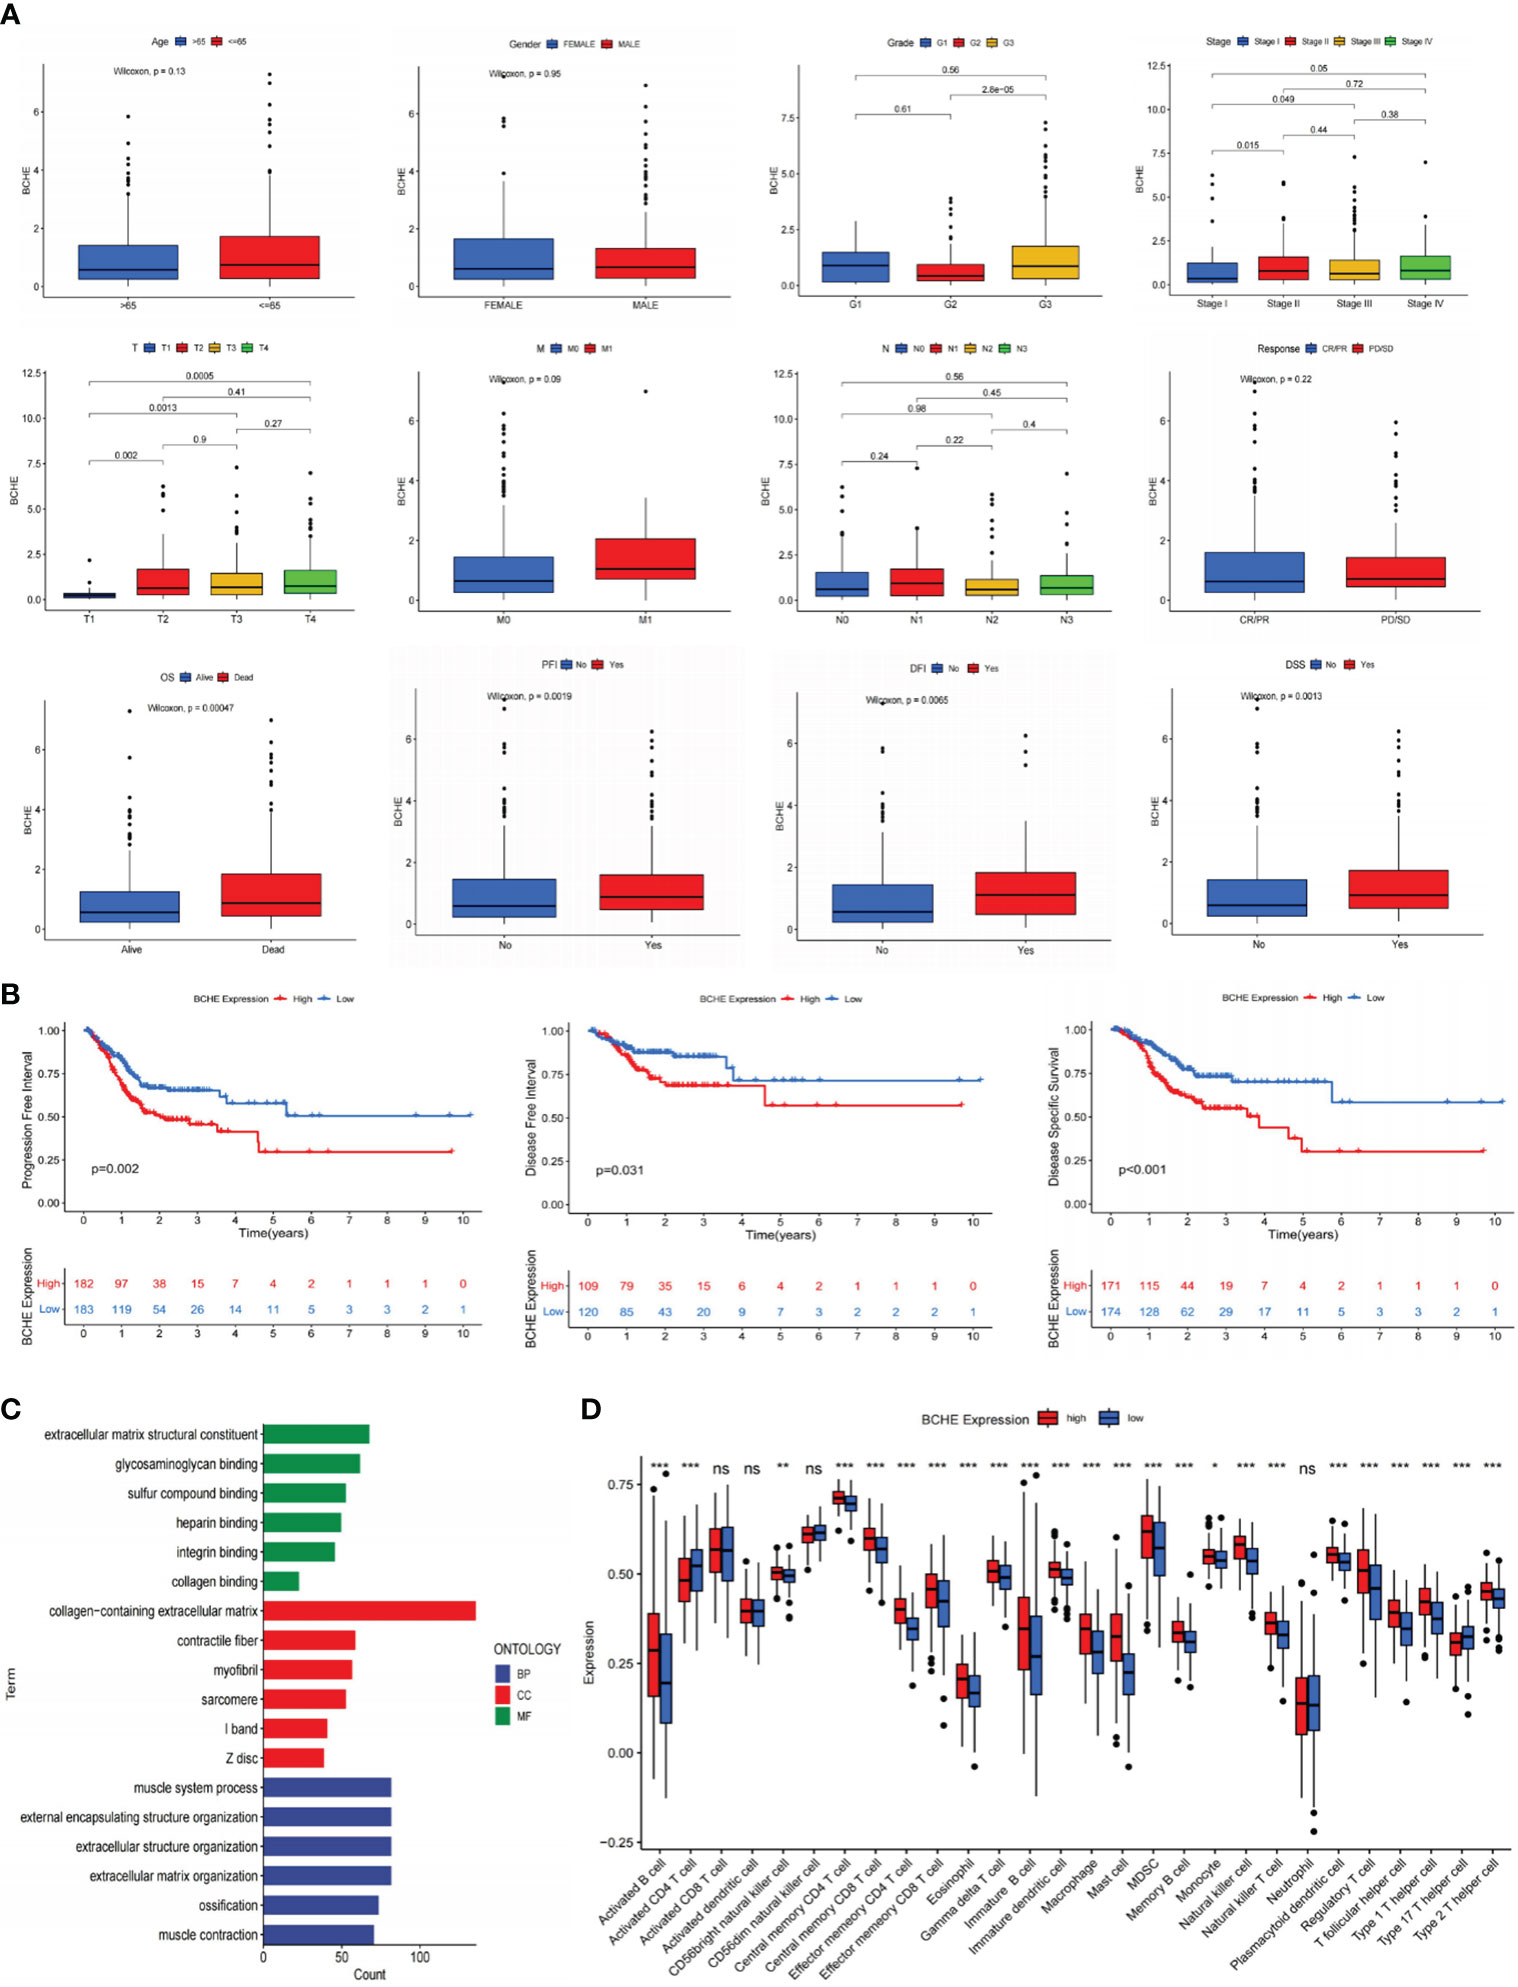
Figure 12 Clinicopathology, immune infiltration, and functional analyses of BCHE. (A) The correlation between BCHE and clinical pathological parameters of gastric cancer. (B) PFI, DFI, and DSS analyses in high- and low-BCHE expression subgroups. (C) Functional analysis of BCHE. (D) The relationship between BCHE and tumor-infiltrating immune cells. *P< 0.05; **P< 0.01; ***P< 0.001. PFI, Progression Free Interval; DFI, Disease Free Interval; DSS, Disease Specific Survival. ns: p>0.05.
To illustrate the tumor-promoting effect of BCHE in gastric cancer, we successfully constructed knockdown BCHE lentiviral vectors (sh-BCHE-1, sh-BCHE-2) and RNAi negative control (sh-NC) vectors. We transfected them into AGS and HGC-27 cell lines. The Western blot results confirmed the transfection effect and the knockdown effect of sh-BCHE-2 in AGS and sh-BCHE-1 in HGC-27 was quite substantial (Figure 13A). We next performed the CCK-8 and colony formation assays, and the findings exhibited that the viability and proliferation ability of gastric cancer cells in the knockdown (sh-BCHE) groups were considerably decreased compared to the control group (sh-NC) (Figures 13B, C). Additionally, researchers also carried out Transwell and wound healing experiments. The outcomes unambiguously indicated that the migration ability of gastric cancer cells in the sh-BCHE groups was markedly diminished (Figures 13D, E). Therefore, we can preliminarily infer that BCHE has a promoting effect on the growth and migration of gastric cancer.
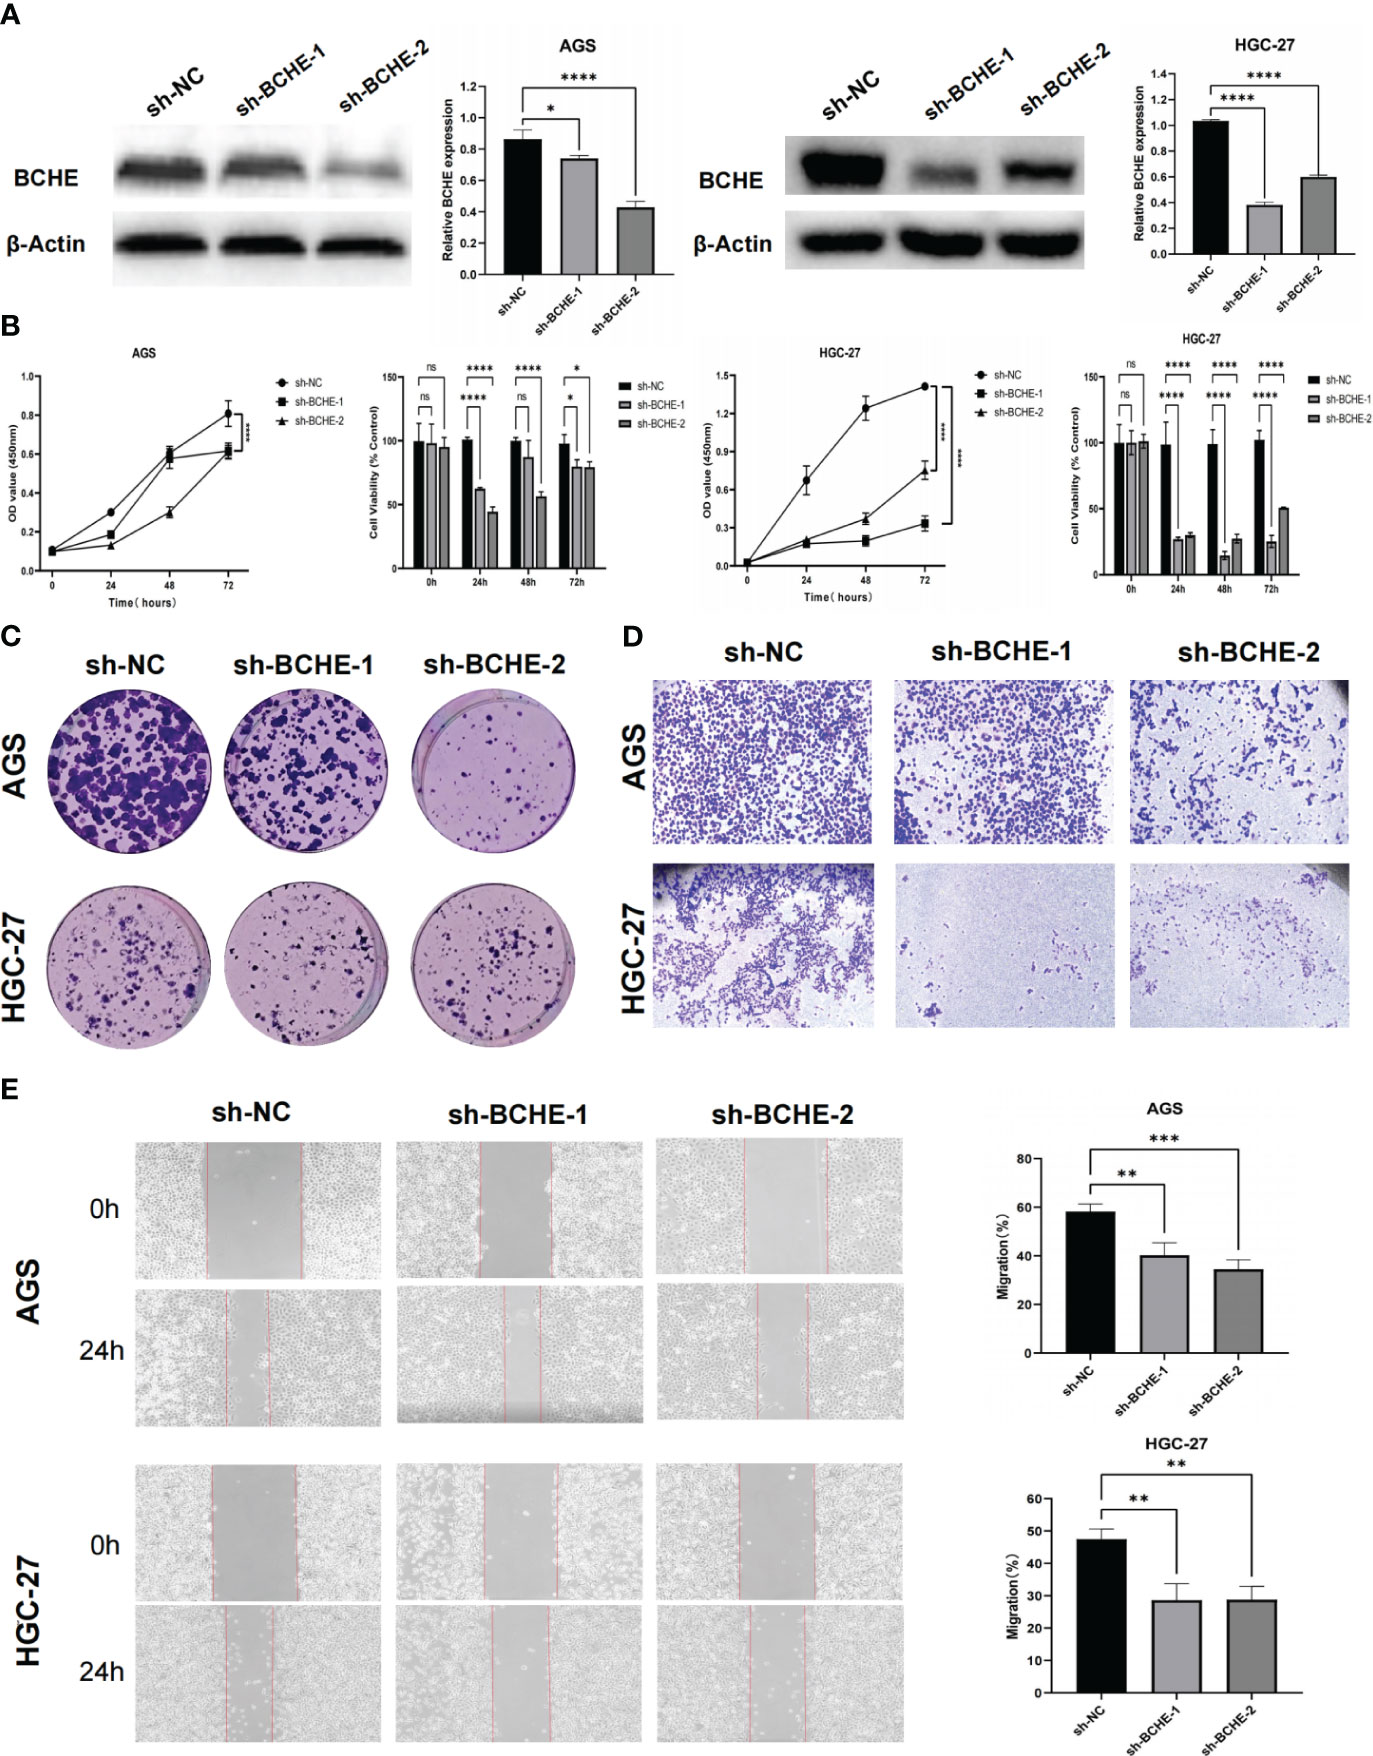
Figure 13 Verification of the tumor-promoting effect of BCHE in gastric cancer. (A) The expression level of BCHE control and knockdown groups in the AGS and HGC-27 cell lines was measured using Western blot. (B) The CCK-8 assay was used to access the proliferation and viability of BCHE in AGS and HGC-27 cell lines. (C) Using colony formation experiments to verify the effect of BCHE on the proliferation of AGS and HGC-27 cell lines. (D) Transwell assay was used to verify the role of BCHE in the migration of AGS and HGC-27 cell lines. (E) The wound healing experiments to explore the migration effect of BCHE in AGS and HGC-27 cell lines, and calculate its migration rate. *P< 0.05; **P< 0.01; ***P< 0.001. ****P< 0.0001. ns: p>0.05.
Gastric cancer is a malignant digestive tract tumor with a poor prognosis and high fatality rate. It ranks third among malignant tumors in China (36). Early-stage GC patients’ outcomes have dramatically improved in the last several years thanks to advancements in surgical and gastroscopy techniques (37). However, the primary treatment option for advanced GC is still chemotherapy, having a dismal prognosis and less than 20% survival rate for five years (38, 39). Lipid metabolic reprogramming is one of the most prominent biological processes involved in the initiation and development of cancer (40). Tumor cells modify their lipid-related metabolic pathways and nutritional structures to accommodate metastasis. Research has proclaimed that tumor cells can upregulate the PI3K/Akt/mTOR pathway, which enhances glucose uptake and aerobic glycolysis while also increasing the production of metabolites required for the synthesis of FA and cholesterol (41–43). Additionally, the PI3K/Akt/mTOR pathway upregulates SREBP-1 to promote lipogenesis gene transcription and enhance lipid metabolism (44). Moreover, tumor cells can affect the activity of stromal or immune cells through lipid metabolism (LM), forming immune escape and immunosuppression, leading to treatment resistance and cancer recurrence. All these factors encourage the development of cancer. Given this, reducing the available lipids of tumor cells and intervening in their lipid metabolism may provide new therapeutic opportunities for gastric cancer.
For several years, constructing prognostic signatures according to particular biological characteristics has become a standard method in cancer research. Therefore, in the present research, we comprehensively and systematically created a signature according to lipid metabolism-related genes, further analyzed its clinical significance, evaluated the TME landscape, and forecasted immunotherapy’s efficacy in GC patients. In the beginning, we identified 148 DELRGs using RNA-seq data from the TCGA-STAD database and LRGs from the MsigDB website. GO and KEGG analyses revealed enrichment of these genes in lipid metabolism and carcinogenesis pathways. Subsequently, we screened 17 prognostic-related genes through univariate Cox analysis and identified their frequent CNV alterations, confirming that LM plays an essential role in GC lesions. Next, LASSO and multivariate Cox analyses were employed to create a suitable prognosis signature related to LM, and its excellent reliability and stability were verified in the GSE15459 cohort. According to K-M curves, patients in the LR subgroup exhibited noticeably longer OS and PFS (p<0.001), and the 5-year ROC curve (AUC value>0.70) demonstrated that our signature was satisfactory in forecasting prognosis. In the TCGA-STAD queue, relations between the signature and specific clinicopathological parameters (like age, gender, survival status, grade, T, N, and M stages) were analyzed. The outcomes indicated that the high-risk category had more severe clinical characteristics and worse prognoses for GC patients. Both univariate and multivariate Cox analyses confirmed that LRGs-based risk scores were a reliable predictor of GC prognosis. We then developed a nomogram to improve our signature’s clinical applicability. This nomogram has a certain predictive effect on the prognosis of GC individuals at 1-, 3-, and 5- years and exhibited optimal predictive capacities. In addition, GSEA analysis applied that the LR group mainly was linked to metabolic processes, while the HR group enriched stromal-activated and tumor-associated signaling pathways more, including Focal adhesion, cell adhesion molecules CAMs, PPAR, Wnt, Calcium, and TGF beta signaling. This could be connected to the dismal prognosis for the group with high-risk scores.
Afterward, we performed landscape analysis on the signature tumor microenvironment (TME) and observed that the HR group had elevated stromal activity. Previous studies have indicated that stromal cells can accelerate the growth and dissemination of tumors by inhibiting immune cells from penetrating and entering the tumor parenchyma, preventing T cells from killing tumor cells, and inducing angiogenesis (45–48). Furthermore, our research demonstrated positive correlations between risk scores and the infiltration of most TIICs, especially regulatory T cells (Tregs), myeloid suppressor cells (MDSC), and macrophages, suggesting that high levels of infiltration of these cells exist in populations with high-risk scores. Tregs are a highly immunosuppressive subset of CD4+ T cells and as a gatekeeper for immunological homeostasis, suppressing effective anti-tumor immunity through different mechanisms (49). Notably, tumor-associated macrophages (TAMs) are typically the most abundant myeloid cells in different TMEs. TAMs have high functional plasticity and can affect many tumor processes, including immunosuppressive TME formation, tumor angiogenesis activation, and ECM remodeling (49–51). It is reported that cholesterol efflux from cells can encourage TAMs to polarize towards the M2-like phenotype, often associated with worse prognosis and poor treatment response in human malignancies (52). Besides, 27-HC (one of the primary metabolites of cholesterol) can promote the differentiation of MDSCs, inducing immune escape of tumor cells (53).
With the arrival of the era of immunotherapy, the outcome of gastric cancer individuals has significantly improved. Pembrolizumab (PD-1 inhibitor) is the world’s first immunotherapy approved for treating advanced solid tumors in the MSI-H/dMMR state. According to KEYNOTE-158 global data (K cohort), the objective response rate (ORR) of gastric or gastroesophageal junction cancer patients is 39% (54). In Chinese patients (L cohort), the ORR is as high as 63%, indicating that the MSI-H/dMMR population in China can achieve more prominent benefits from the treatment of pembrolizumab. However, the effectiveness of immunotherapy differs in various groups due to individual characteristics, and determining which populations are more probable to benefit from immunotherapy is therefore crucial. Somatic mutations have been proven to participate in immunotherapy by generating tumor-specific neoepitopes (55). After removing germline mutations, the total somatic mutations in the tumor genome are known as tumor mutation burden (TMB), which can activate CD8+cytotoxic T cells and initiate T cell-mediated anti-tumor effects (56). Theoretically, the greater the TMB values, the more neoepitopes can be identified by T cells and the superior immunotherapy efficacy. As a result, we examined somatic mutations and TMB in two risk subgroups, detecting that the LR group exhibited a significantly higher mutation rate and TMB scores. Another important discovery was that the low-risk category’s TIDE, Dysfunction, and Exclusion scores were considerably lower, while the expression of PD-L1 and MSI-H was much more remarkable. This suggested that individuals in the low-risk subgroup may experience less immune escape and be more sensitive to immunotherapy. More importantly, in the joint analysis of ICIs (anti-PD-1 and anti-CTLA-4 antibodies), immunotherapy will provide greater therapeutic benefit to low-risk GC patients, leading to superior outcomes. According to drug sensitivity analysis, the low-risk group also showed a lower IC50 for several commonly used chemotherapeutic and targeted drugs. This indicated that persons in the low-risk category were better responsive to these medications and had a greater likelihood of benefiting.
In this study, researchers recognized five genes that serve as risk signature genes- APOA1, BCHE, CYP19A1, PLA1A, and STARD5. Apolipoprotein A1 (APOA1) is a crucial component of high-density lipoprotein (HDL) and an essential cofactor of cholesterol transferase (LCAT) (57). LCAT can catalyze the production of cholesterol esters and lysophosphatidic from free cholesterol in the plasma. In addition, the increase of HDL/ApoA1 in plasma can prevent the progression of diabetes (58), nervous system disease (59), and inflammation (60, 61), as well as play a protective role in atherosclerosis and related cardiovascular diseases (62, 63). Significantly, APOA1 is specifically and negatively correlated with survival in various solid tumor forms, including colorectal, breast, and esophageal (64–66). Furthermore, research has demonstrated that APOA1 expression in small cell lung cancer (SCLC) is higher than in normal lung tissue or non-small cell lung cancer (NSCLC), and that APOA1 expression is significantly lower in patients with recurrent SCLC and those who underwent neoadjuvant chemotherapy prior to surgery (67). Consequently, APOA1 may have significant potential as an anti-tumor drug. Butyrylcholinesterase (BCHE) is a non-specific esterase synthesized by the liver. It contributes to the inactivation of the neurotransmitter acetylcholine and degrades neurotoxic organophosphate esters. Previous studies on BCHE have mostly focused on Alzheimer’s disease (AD) and inhibiting the expression of BCHE can potentially treat new symptoms of AD (68, 69). Additionally, BCHE is associated with tumorigenesis, cell proliferation, and differentiation (70). It is highly expressed in breast, oral, and ovarian cancers (70–72) but has low expression in colorectal and endometrial cancer (73, 74). In prostate cancer, BCHE expression is down-regulated early on and up-regulated in the late stage (75). Cytochrome P450 family 19 subfamily A member 1 (CYP19A1) can catalyze the conversion of androgen/testosterone to estradiol/estrone, the main enzyme involved in estrogen production (76). Breast cancer, endometrial cancer, and Alzheimer’s disease are intimately associated with CYP19A1 (77–79). The research has pointed out that it is prominently increased in human colon cancer tissue and mediated immunosuppression through the GPR30-Akt pathway, promoting colon cancer progression and chemotherapy resistance (80). Phospholipase A1 member A (PLA1A) is a type of pancreatic lipase expressed in multiple tissues and organs of the human body, which regulates the maturation and function of numerous immune cells (81). PLA1A can promote tumor progression via activating the PI3K/Akt pathway induced by GPR34 (82) or converting lysozyme PS into LPA (a lipid mediator related to cancer progression and metastasis) mediated by ATX (83, 84). The invasion, metastasis, and worse prognosis of colorectal, glioma, and prostate cancer correlate with elevated PLA1A expression (81, 85, 86). Furthermore, PLA1A is a potential diagnostic marker for advanced and BRAF mutant melanoma (87). The STARD4 subfamily, which STARD5 is a member of, consists primarily of a START domain without a specific organelle targeting sequence. Several physiological processes, including lipid transport and metabolism, signal transduction, and transcriptional control, are associated with the START domain (88). Research has shown that STARD5 expression is induced upon endoplasmic reticulum (ER) stress and participates in regulating cholesterol balance. Abnormal cholesterol metabolism is directly correlated with tumor occurrence and growth. It has been established that STARD5 is a valuable biomarker for assessing hepatocellular carcinoma (HCC) prognosis, and high expression of STARD5 implies a better prognosis (89).
Based on the comprehensive ROC curves and qRT-PCR expression, we have decided further to explore the role of BCHE in gastric cancer progression. Patients with high BCHE expression have later stages, lower differentiation (G3), shorter OS, PFS, and DFS. Through CCK-8, colony formation, Transwell, and wound healing assays, we preliminarily infer that BCHE can promote the growth and migration of gastric cancer cells.
It’s critical to recognize the limitations of this study. Even though we used bioinformatics analysis to create a prediction signature based on lipid metabolism and verified it using the GEO database and partial cell experiments, more experimental confirmation is still needed. Then, although we have preliminarily demonstrated the promoting effect of BCHE on the growth and migration of gastric cancer, further exploration of its mechanism of action is still needed. Furthermore, while this signature has demonstrated considerable promise in predicting the response to immunotherapy, it needs validation in a cohort of GC patients receiving immunotherapy. Therefore, an in-depth study is essential to comprehend the precise mechanism underlying this predictive model.
In conclusion, our study successfully constructed a risk signature based on lipid metabolism-related genes that can independently predict prognosis and develop a nomogram to improve its clinical practicality. In addition, this study elucidated the relationship between lipid metabolism and immune infiltration characteristics and predicted the immunotherapy efficacy of GC patients based on risk scores. By using bioinformatics analysis and partial cell experiments, we were able to establish that BCHE is an oncogenic gene and to identify it as a potential biomarker for gastric cancer. Briefly, this investigation offers new directions for locating viable prognostic biomarkers and more efficient treatment options for GC.
The datasets presented in this study can be found in online repositories. The names of the repository/repositories and accession number(s) can be found in the article/Supplementary Material.
Ethical approval was not required for the studies on humans in accordance with the local legislation and institutional requirements because only commercially available established cell lines were used.
SiW: Data curation, Formal analysis, Methodology, Writing – original draft, Writing – review & editing, Software. XH: Validation, Methodology, Writing – review & editing, Writing – original draft. RW: Formal analysis, Methodology, Software, Writing – review & editing, Data curation, Writing – original draft. SZ: Data curation, Funding acquisition, Writing – review & editing. JL: Data curation, Formal analysis, Writing – review & editing. YL: Resources, Visualization, Writing – review & editing. SaW: Data curation, Formal analysis, Writing – review & editing. JG: Formal analysis, Methodology, Writing – review & editing. YW: Validation, Writing – original draft. MZ: Data curation, Formal analysis, Writing – review & editing. WQ: Formal analysis, Investigation, Methodology, Writing – review & editing.
The author(s) declare financial support was received for the research, authorship, and/or publication of this article. The study was supported by Qingdao Key Clinical Specialty Elite Discipline and Beijing Xisike Clinical Oncology Research Foundation (Grant No.Y-HR2018-185, Grant No.Y2019-AZZD-0471).
We also extend our gratitude to the individuals and researchers in the public database used in this study, as well as the reviewers for their enlightening and helpful feedback.
The authors declare that the research was conducted in the absence of any commercial or financial relationships that could be construed as a potential conflict of interest.
All claims expressed in this article are solely those of the authors and do not necessarily represent those of their affiliated organizations, or those of the publisher, the editors and the reviewers. Any product that may be evaluated in this article, or claim that may be made by its manufacturer, is not guaranteed or endorsed by the publisher.
The Supplementary Material for this article can be found online at: https://www.frontiersin.org/articles/10.3389/fimmu.2024.1327565/full#supplementary-material
1. Sung H, Ferlay J, Siegel RL, Laversanne M, Soerjomataram I, Jemal A, et al. Global cancer statistics 2020: GLOBOCAN estimates of incidence and mortality worldwide for 36 cancers in 185 countries. CA Cancer J Clin (2021) 71(3):209–49. doi: 10.3322/caac.21660
2. Sekiguchi M, Oda I, Matsuda T, Saito Y. Epidemiological trends and future perspectives of gastric cancer in eastern Asia. Digestion (2022) 103(1):22–8. doi: 10.1159/000518483
3. Gao K, Wu J. National trend of gastric cancer mortality in China (2003-2015): a population-based study. Cancer Commun (Lond) (2019) 39(1):24. doi: 10.1186/s40880-019-0372-x
4. Martin-Perez M, Urdiroz-Urricelqui U, Bigas C, Benitah SA. The role of lipids in cancer progression and metastasis. Cell Metab (2022) 34(11):1675–99. doi: 10.1016/j.cmet.2022.09.023
5. Samuel VT, Petersen KF, Shulman GI. Lipid-induced insulin resistance: unravelling the mechanism. Lancet (2010) 375(9733):2267–77. doi: 10.1016/s0140-6736(10)60408-4
6. Goldstein JL, Brown MS. A century of cholesterol and coronaries: from plaques to genes to statins. Cell (2015) 161(1):161–72. doi: 10.1016/j.cell.2015.01.036
7. Rosen ED, Spiegelman BM. What we talk about when we talk about fat. Cell (2014) 156(1-2):20–44. doi: 10.1016/j.cell.2013.12.012
8. Menendez JA, Lupu R. Fatty acid synthase and the lipogenic phenotype in cancer pathogenesis. Nat Rev Cancer (2007) 7(10):763–77. doi: 10.1038/nrc2222
9. Ding X, Zhang W, Li S, Yang H. The role of cholesterol metabolism in cancer. Am J Cancer Res (2019) 9(2):219–27.
10. Currie E, Schulze A, Zechner R, Walther TC, Farese RV Jr. Cellular fatty acid metabolism and cancer. Cell Metab (2013) 18(2):153–61. doi: 10.1016/j.cmet.2013.05.017
11. Guo D, Prins RM, Dang J, Kuga D, Iwanami A, Soto H, et al. EGFR signaling through an Akt-SREBP-1-dependent, rapamycin-resistant pathway sensitizes glioblastomas to antilipogenic therapy. Sci Signal (2009) 2(101):ra82. doi: 10.1126/scisignal.2000446
12. Li X, Wu JB, Li Q, Shigemura K, Chung LW, Huang WC. SREBP-2 promotes stem cell-like properties and metastasis by transcriptional activation of c-Myc in prostate cancer. Oncotarget (2016) 7(11):12869–84. doi: 10.18632/oncotarget.7331
13. Su YW, Lin YH, Pai MH, Lo AC, Lee YC, Fang IC, et al. Association between phosphorylated AMP-activated protein kinase and acetyl-CoA carboxylase expression and outcome in patients with squamous cell carcinoma of the head and neck. PLoS One (2014) 9(4):e96183. doi: 10.1371/journal.pone.0096183
14. Wu X, Dong Z, Wang CJ, Barlow LJ, Fako V, Serrano MA, et al. FASN regulates cellular response to genotoxic treatments by increasing PARP-1 expression and DNA repair activity via NF-κB and SP1. Proc Natl Acad Sci U S A (2016) 113(45):E6965–e73. doi: 10.1073/pnas.1609934113
15. Papaevangelou E, Almeida GS, Box C, deSouza NM, Chung YL. The effect of FASN inhibition on the growth and metabolism of a cisplatin-resistant ovarian carcinoma model. Int J Cancer (2018) 143(4):992–1002. doi: 10.1002/ijc.31392
16. Wang T, Fahrmann JF, Lee H, Li YJ, Tripathi SC, Yue C, et al. JAK/STAT3-regulated fatty acid β-oxidation is critical for breast cancer stem cell self-renewal and chemoresistance. Cell Metab (2018) 27(1):136–50.e5. doi: 10.1016/j.cmet.2017.11.001
17. Corbet C, Feron O. Emerging roles of lipid metabolism in cancer progression. Curr Opin Clin Nutr Metab Care (2017) 20(4):254–60. doi: 10.1097/mco.0000000000000381
18. Nakamura MT, Yudell BE, Loor JJ. Regulation of energy metabolism by long-chain fatty acids. Prog Lipid Res (2014) 53:124–44. doi: 10.1016/j.plipres.2013.12.001
19. Koizume S, Miyagi Y. Lipid droplets: A key cellular organelle associated with cancer cell survival under normoxia and hypoxia. Int J Mol Sci (2016) 17(9). doi: 10.3390/ijms17091430
20. Liu M, Fang X, Wang H, Ji R, Guo Q, Chen Z, et al. Characterization of lipid droplet metabolism patterns identified prognosis and tumor microenvironment infiltration in gastric cancer. Front Oncol (2022) 12:1038932. doi: 10.3389/fonc.2022.1038932
21. Jin X, Liu Z, Yang D, Yin K, Chang X. Recent progress and future perspectives of immunotherapy in advanced gastric cancer. Front Immunol (2022) 13:948647. doi: 10.3389/fimmu.2022.948647
22. Li K, Zhang A, Li X, Zhang H, Zhao L. Advances in clinical immunotherapy for gastric cancer. Biochim Biophys Acta Rev Cancer (2021) 1876(2):188615. doi: 10.1016/j.bbcan.2021.188615
23. Steidl C, Lee T, Shah SP, Farinha P, Han G, Nayar T, et al. Tumor-associated macrophages and survival in classic Hodgkin's lymphoma. N Engl J Med (2010) 362(10):875–85. doi: 10.1056/NEJMoa0905680
24. Li YW, Qiu SJ, Fan J, Zhou J, Gao Q, Xiao YS, et al. Intratumoral neutrophils: a poor prognostic factor for hepatocellular carcinoma following resection. J Hepatol (2011) 54(3):497–505. doi: 10.1016/j.jhep.2010.07.044
25. Wei J, Zheng W, Chapman NM, Geiger TL, Chi H. T cell metabolism in homeostasis and cancer immunity. Curr Opin Biotechnol (2021) 68:240–50. doi: 10.1016/j.copbio.2021.02.003
26. Tanaka A, Sakaguchi S. Regulatory T cells in cancer immunotherapy. Cell Res (2017) 27(1):109–18. doi: 10.1038/cr.2016.151
27. Ohue Y, Nishikawa H. Regulatory T (Treg) cells in cancer: Can Treg cells be a new therapeutic target? Cancer Sci (2019) 110(7):2080–9. doi: 10.1111/cas.14069
28. Hu B, Yang XB, Sang XT. Construction of a lipid metabolism-related and immune-associated prognostic signature for hepatocellular carcinoma. Cancer Med (2020) 9(20):7646–62. doi: 10.1002/cam4.3353
29. Subramanian A, Tamayo P, Mootha VK, Mukherjee S, Ebert BL, Gillette MA, et al. Gene set enrichment analysis: a knowledge-based approach for interpreting genome-wide expression profiles. Proc Natl Acad Sci U.S.A. (2005) 102(43):15545–50. doi: 10.1073/pnas.0506580102
30. Tang Y, Tian W, Xie J, Zou Y, Wang Z, Li N, et al. Prognosis and dissection of immunosuppressive microenvironment in breast cancer based on fatty acid metabolism-related signature. Front Immunol (2022) 13:843515. doi: 10.3389/fimmu.2022.843515
31. Yoshihara K, Shahmoradgoli M, Martínez E, Vegesna R, Kim H, Torres-Garcia W, et al. Inferring tumour purity and stromal and immune cell admixture from expression data. Nat Commun (2013) 4:2612. doi: 10.1038/ncomms3612
32. Newman AM, Liu CL, Green MR, Gentles AJ, Feng W, Xu Y, et al. Robust enumeration of cell subsets from tissue expression profiles. Nat Methods (2015) 12(5):453–7. doi: 10.1038/nmeth.3337
33. Du P, Chai Y, Zong S, Yue J, Xiao H. Identification of a prognostic model based on fatty acid metabolism-related genes of head and neck squamous cell carcinoma. Front Genet (2022) 13:888764. doi: 10.3389/fgene.2022.888764
34. Pontén F, Schwenk JM, Asplund A, Edqvist PH. The Human Protein Atlas as a proteomic resource for biomarker discovery. J Intern Med (2011) 270(5):428–46. doi: 10.1111/j.1365-2796.2011.02427.x
35. Martincorena I, Campbell PJ. Somatic mutation in cancer and normal cells. Science (2015) 349(6255):1483–9. doi: 10.1126/science.aab4082
36. Feng RM, Zong YN, Cao SM, Xu RH. Current cancer situation in China: good or bad news from the 2018 Global Cancer Statistics? Cancer Commun (Lond) (2019) 39(1):22. doi: 10.1186/s40880-019-0368-6
37. Li GZ, Doherty GM, Wang J. Surgical management of gastric cancer: A review. JAMA Surg (2022) 157(5):446–54. doi: 10.1001/jamasurg.2022.0182
38. Wang FH, Shen L, Li J, Zhou ZW, Liang H, Zhang XT, et al. The Chinese Society of Clinical Oncology (CSCO): clinical guidelines for the diagnosis and treatment of gastric cancer. Cancer Commun (Lond) (2019) 39(1):10. doi: 10.1186/s40880-019-0349-9
39. Karimi P, Islami F, Anandasabapathy S, Freedman ND, Kamangar F. Gastric cancer: descriptive epidemiology, risk factors, screening, and prevention. Cancer Epidemiol Biomarkers Prev (2014) 23(5):700–13. doi: 10.1158/1055-9965.Epi-13-1057
40. Cheng C, Geng F, Cheng X, Guo D. Lipid metabolism reprogramming and its potential targets in cancer. Cancer Commun (Lond) (2018) 38(1):27. doi: 10.1186/s40880-018-0301-4
41. Chen XS, Li LY, Guan YD, Yang JM, Cheng Y. Anticancer strategies based on the metabolic profile of tumor cells: therapeutic targeting of the Warburg effect. Acta Pharmacol Sin (2016) 37(8):1013–9. doi: 10.1038/aps.2016.47
42. Luo X, Zheng E, Wei L, Zeng H, Qin H, Zhang X, et al. The fatty acid receptor CD36 promotes HCC progression through activating Src/PI3K/AKT axis-dependent aerobic glycolysis. Cell Death Dis (2021) 12(4):328. doi: 10.1038/s41419-021-03596-w
43. Catalina-Rodriguez O, Kolukula VK, Tomita Y, Preet A, Palmieri F, Wellstein A, et al. The mitochondrial citrate transporter, CIC, is essential for mitochondrial homeostasis. Oncotarget (2012) 3(10):1220–35. doi: 10.18632/oncotarget.714
44. Tian LY, Smit DJ, Jücker M. The role of PI3K/AKT/mTOR signaling in hepatocellular carcinoma metabolism. Int J Mol Sci (2023) 24(3). doi: 10.3390/ijms24032652
45. Wang G, Xiao R, Zhao S, Sun L, Guo J, Li W, et al. Cuproptosis regulator-mediated patterns associated with immune infiltration features and construction of cuproptosis-related signatures to guide immunotherapy. Front Immunol (2022) 13:945516. doi: 10.3389/fimmu.2022.945516
46. Chen DS, Mellman I. Elements of cancer immunity and the cancer-immune set point. Nature (2017) 541(7637):321–30. doi: 10.1038/nature21349
47. Zhang B, Wu Q, Li B, Wang D, Wang L, Zhou YL. m(6)A regulator-mediated methylation modification patterns and tumor microenvironment infiltration characterization in gastric cancer. Mol Cancer (2020) 19(1):53. doi: 10.1186/s12943-020-01170-0
48. Moserle L, Casanovas O. Anti-angiogenesis and metastasis: a tumour and stromal cell alliance. J Intern Med (2013) 273(2):128–37. doi: 10.1111/joim.12018
49. de Visser KE, Joyce JA. The evolving tumor microenvironment: From cancer initiation to metastatic outgrowth. Cancer Cell (2023) 41(3):374–403. doi: 10.1016/j.ccell.2023.02.016
50. Long KB, Collier AI, Beatty GL. Macrophages: Key orchestrators of a tumor microenvironment defined by therapeutic resistance. Mol Immunol (2019) 110:3–12. doi: 10.1016/j.molimm.2017.12.003
51. DeNardo DG, Ruffell B. Macrophages as regulators of tumour immunity and immunotherapy. Nat Rev Immunol (2019) 19(6):369–82. doi: 10.1038/s41577-019-0127-6
52. Goossens P, Rodriguez-Vita J, Etzerodt A, Masse M, Rastoin O, Gouirand V, et al. Membrane cholesterol efflux drives tumor-associated macrophage reprogramming and tumor progression. Cell Metab (2019) 29(6):1376–89.e4. doi: 10.1016/j.cmet.2019.02.016
53. He S, Ma L, Baek AE, Vardanyan A, Vembar V, Chen JJ, et al. Host CYP27A1 expression is essential for ovarian cancer progression. Endocr Relat Cancer (2019) 26(7):659–75. doi: 10.1530/erc-18-0572
54. Marabelle A, Le DT, Ascierto PA, Di Giacomo AM, De Jesus-Acosta A, Delord JP, et al. Efficacy of pembrolizumab in patients with noncolorectal high microsatellite instability/mismatch repair-deficient cancer: results from the phase II KEYNOTE-158 study. J Clin Oncol (2020) 38(1):1–10. doi: 10.1200/jco.19.02105
55. Lang F, Schrörs B, Löwer M, Türeci Ö, Sahin U. Identification of neoantigens for individualized therapeutic cancer vaccines. Nat Rev Drug Discovery (2022) 21(4):261–82. doi: 10.1038/s41573-021-00387-y
56. Jardim DL, Goodman A, de Melo Gagliato D, Kurzrock R. The challenges of tumor mutational burden as an immunotherapy biomarker. Cancer Cell (2021) 39(2):154–73. doi: 10.1016/j.ccell.2020.10.001
57. Cochran BJ, Ong KL, Manandhar B, Rye KA. APOA1: a protein with multiple therapeutic functions. Curr Atheroscler Rep (2021) 23(3):11. doi: 10.1007/s11883-021-00906-7
58. Drew BG, Duffy SJ, Formosa MF, Natoli AK, Henstridge DC, Penfold SA, et al. High-density lipoprotein modulates glucose metabolism in patients with type 2 diabetes mellitus. Circulation (2009) 119(15):2103–11. doi: 10.1161/circulationaha.108.843219
59. Fernández-de Retana S, Montañola A, Marazuela P, de la Cuesta M, Batlle A, Fatar M, et al. Intravenous treatment with human recombinant ApoA-I Milano reduces beta amyloid cerebral deposition in the APP23-transgenic mouse model of Alzheimer's disease. Neurobiol Aging (2017) 60:116–28. doi: 10.1016/j.neurobiolaging.2017.08.028
60. Pan B, Kong J, Jin J, Kong J, He Y, Dong S, et al. A novel anti-inflammatory mechanism of high density lipoprotein through up-regulating annexin A1 in vascular endothelial cells. Biochim Biophys Acta (2016) 1861(6):501–12. doi: 10.1016/j.bbalip.2016.03.022
61. Theofilatos D, Fotakis P, Valanti E, Sanoudou D, Zannis V, Kardassis D. HDL-apoA-I induces the expression of angiopoietin like 4 (ANGPTL4) in endothelial cells via a PI3K/AKT/FOXO1 signaling pathway. Metabolism (2018) 87:36–47. doi: 10.1016/j.metabol.2018.06.002
62. Rubin EM, Krauss RM, Spangler EA, Verstuyft JG, Clift SM. Inhibition of early atherogenesis in transgenic mice by human apolipoprotein AI. Nature (1991) 353(6341):265–7. doi: 10.1038/353265a0
63. Kaul S, Xu H, Zabalawi M, Maruko E, Fulp BE, Bluemn T, et al. Lipid-free apolipoprotein A-I reduces progression of atherosclerosis by mobilizing microdomain cholesterol and attenuating the number of CD131 expressing cells: monitoring cholesterol homeostasis using the cellular ester to total cholesterol ratio. J Am Heart Assoc (2016) 5(11). doi: 10.1161/jaha.116.004401
64. Quan Q, Huang Y, Chen Q, Qiu H, Hu Q, Rong Y, et al. Impact of serum apolipoprotein A-I on prognosis and bevacizumab efficacy in patients with metastatic colorectal cancer: a propensity score-matched analysis. Transl Oncol (2017) 10(2):288–94. doi: 10.1016/j.tranon.2017.01.006
65. His M, Zelek L, Deschasaux M, Pouchieu C, Kesse-Guyot E, Hercberg S, et al. Prospective associations between serum biomarkers of lipid metabolism and overall, breast and prostate cancer risk. Eur J Epidemiol (2014) 29(2):119–32. doi: 10.1007/s10654-014-9884-5
66. Wang XP, Li XH, Zhang L, Lin JH, Huang H, Kang T, et al. High level of serum apolipoprotein A-I is a favorable prognostic factor for overall survival in esophageal squamous cell carcinoma. BMC Cancer (2016) 16:516. doi: 10.1186/s12885-016-2502-z
67. Shi J, Yang H, Duan X, Li L, Sun L, Li Q, et al. Apolipoproteins as differentiating and predictive markers for assessing clinical outcomes in patients with small cell lung cancer. Yonsei Med J (2016) 57(3):549–56. doi: 10.3349/ymj.2016.57.3.549
68. Jasiecki J, Wasąg B. Butyrylcholinesterase protein ends in the pathogenesis of Alzheimer's disease-could BCHE genotyping be helpful in Alzheimer's therapy? Biomolecules (2019) 9(10). doi: 10.3390/biom9100592
69. Wang L, Sun T, Wang Z, Liu H, Qiu W, Tang X, et al. Design, synthesis, and proof of concept of balanced dual inhibitors of butyrylcholinesterase (BChE) and histone deacetylase 6 (HDAC6) for the treatment of Alzheimer's disease. ACS Chem Neurosci (2023) 14(17):3226–48. doi: 10.1021/acschemneuro.3c00358
70. Kumar R, Razab S, Prabhu K, Ray S, Prakash B. Serum butyrylcholinesterase and zinc in breast cancer. J Cancer Res Ther (2017) 13(2):367–70. doi: 10.4103/0973-1482.165869
71. Jaiswal SG, Jaiswal GR. Butyrylcholinesterase: An economical marker of disease activity in oral squamous cell carcinoma before and after therapy. J Cancer Res Ther (2020) 16(Supplement):S39–s42. doi: 10.4103/jcrt.JCRT_207_16
72. Willis S, Villalobos VM, Gevaert O, Abramovitz M, Williams C, Sikic BI, et al. Single gene prognostic biomarkers in ovarian cancer: A meta-analysis. PLoS One (2016) 11(2):e0149183. doi: 10.1371/journal.pone.0149183
73. Montenegro MF, Ruiz-Espejo F, Campoy FJ, Muñoz-Delgado E, de la Cadena MP, Cabezas-Herrera J, et al. Acetyl- and butyrylcholinesterase activities decrease in human colon adenocarcinoma. J Mol Neurosci (2006) 30(1-2):51–4. doi: 10.1385/jmn:30:1:51
74. Liu J, Tian T, Liu X, Cui Z. BCHE as a prognostic biomarker in endometrial cancer and its correlation with immunity. J Immunol Res (2022) 2022:6051092. doi: 10.1155/2022/6051092
75. Gu Y, Chow MJ, Kapoor A, Mei W, Jiang Y, Yan J, et al. Biphasic alteration of butyrylcholinesterase (BChE) during prostate cancer development. Transl Oncol (2018) 11(4):1012–22. doi: 10.1016/j.tranon.2018.06.003
76. Wang N, Huang X, Long Q. Lipid metabolic-related signature CYP19A1 is a potential biomarker for prognosis and immune cell infiltration in gastric cancer. J Inflammation Res (2022) 15:5075–88. doi: 10.2147/jir.S378212
77. Yang L, Wang XY, Li YT, Wang HL, Wu T, Wang B, et al. CYP19 gene polymorphisms and the susceptibility to breast cancer in Xinjiang Uigur women. Genet Mol Res (2015) 14(3):8473–82. doi: 10.4238/2015.July.28.15
78. Yang HP, Gonzalez Bosquet J, Li Q, Platz EA, Brinton LA, Sherman ME, et al. Common genetic variation in the sex hormone metabolic pathway and endometrial cancer risk: pathway-based evaluation of candidate genes. Carcinogenesis (2010) 31(5):827–33. doi: 10.1093/carcin/bgp328
79. Chace C, Pang D, Weng C, Temkin A, Lax S, Silverman W, et al. Variants in CYP17 and CYP19 cytochrome P450 genes are associated with onset of Alzheimer's disease in women with down syndrome. J Alzheimers Dis (2012) 28(3):601–12. doi: 10.3233/jad-2011-110860
80. Liu L, Mo M, Chen X, Chao D, Zhang Y, Chen X, et al. Targeting inhibition of prognosis-related lipid metabolism genes including CYP19A1 enhances immunotherapeutic response in colon cancer. J Exp Clin Cancer Res (2023) 42(1):85. doi: 10.1186/s13046-023-02647-8
81. Zhao Y, Hasse S, Bourgoin SG. Phosphatidylserine-specific phospholipase A1: A friend or the devil in disguise. Prog Lipid Res (2021) 83:101112. doi: 10.1016/j.plipres.2021.101112
82. Iida Y, HT N, Kishikawa J, Kaneko K, Murono K, Kawai K, et al. Lysophosphatidylserine stimulates chemotactic migration of colorectal cancer cells through GPR34 and PI3K/Akt pathway. Anticancer Res (2014) 34(10):5465–72.
83. Emoto S, Kurano M, Kano K, Matsusaki K, Yamashita H, Nishikawa M, et al. Analysis of glycero-lysophospholipids in gastric cancerous ascites. J Lipid Res (2017) 58(4):763–71. doi: 10.1194/jlr.P072090
84. Lee SC, Dacheux MA, Norman DD, Balázs L, Torres RM, Augelli-Szafran CE, et al. Regulation of tumor immunity by lysophosphatidic acid. Cancers (Basel) (2020) 12(5). doi: 10.3390/cancers12051202
85. Iida Y, Sunami E, Yamashita H, Hiyoshi M, Ishihara S, Yamaguchi H, et al. Phosphatidylserine-specific phospholipase A1 (PS-PLA1) expression in colorectal cancer correlates with tumor invasion and hematogenous metastasis. Anticancer Res (2015) 35(3):1459–64. doi: 10.1158/1538-7445.AM2014-31
86. Righi V, Roda JM, Paz J, Mucci A, Tugnoli V, Rodriguez-Tarduchy G, et al. 1H HR-MAS and genomic analysis of human tumor biopsies discriminate between high and low grade astrocytomas. NMR BioMed (2009) 22(6):629–37. doi: 10.1002/nbm.1377
87. Yang G, Liu S, Maghsoudloo M, Shasaltaneh MD, Kaboli PJ, Zhang C, et al. PLA1A expression as a diagnostic marker of BRAF-mutant metastasis in melanoma cancer. Sci Rep (2021) 11(1):6056. doi: 10.1038/s41598-021-85595-7
88. Létourneau D, Lefebvre A, Lavigne P, LeHoux JG. STARD5 specific ligand binding: comparison with STARD1 and STARD4 subfamilies. Mol Cell Endocrinol (2013) 371(1-2):20–5. doi: 10.1016/j.mce.2013.01.004
Keywords: gastric cancer, lipid metabolism, prognostic signature, TIICs, BChE, immunotherapy
Citation: Wang S, Huang X, Zhao S, Lv J, Li Y, Wang S, Guo J, Wang Y, Wang R, Zhang M and Qiu W (2024) Progressions of the correlation between lipid metabolism and immune infiltration characteristics in gastric cancer and identification of BCHE as a potential biomarker. Front. Immunol. 15:1327565. doi: 10.3389/fimmu.2024.1327565
Received: 25 October 2023; Accepted: 17 January 2024;
Published: 31 January 2024.
Edited by:
Avtar Singh Meena, All India Institute of Medical Sciences, IndiaReviewed by:
Johid Malik, University of Nebraska Medical Center, United StatesCopyright © 2024 Wang, Huang, Zhao, Lv, Li, Wang, Guo, Wang, Wang, Zhang and Qiu. This is an open-access article distributed under the terms of the Creative Commons Attribution License (CC BY). The use, distribution or reproduction in other forums is permitted, provided the original author(s) and the copyright owner(s) are credited and that the original publication in this journal is cited, in accordance with accepted academic practice. No use, distribution or reproduction is permitted which does not comply with these terms.
*Correspondence: Wensheng Qiu, d3NxaXVxZGZ5QHFkdS5lZHUuY24=
†These authors have contributed equally to this work
Disclaimer: All claims expressed in this article are solely those of the authors and do not necessarily represent those of their affiliated organizations, or those of the publisher, the editors and the reviewers. Any product that may be evaluated in this article or claim that may be made by its manufacturer is not guaranteed or endorsed by the publisher.
Research integrity at Frontiers
Learn more about the work of our research integrity team to safeguard the quality of each article we publish.