 Victoria Kulesh
 Kirill Peskov
 Gabriel Helmlinger
 Gennady Bocharov
- 1Research Center of Model-Informed Drug Development, I.M. Sechenov First Moscow State Medical University, Moscow, Russia
- 2Marchuk Institute of Numerical Mathematics of the Russian Academy of Sciences (RAS), Moscow, Russia
- 3Modeling & Simulation Decisions FZ - LLC, Dubai, United Arab Emirates
- 4Sirius University of Science and Technology, Sirius, Russia
- 5Biorchestra US Inc., Cambridge, MA, United States
- 6Institute for Computer Science and Mathematical Modelling, I.M. Sechenov First Moscow State Medical University, Moscow, Russia
- 7Moscow Center of Fundamental and Applied Mathematics at INM Russian Academy of Sciences (RAS), Moscow, Russia
Background: The thymus plays a central role in shaping human immune function. A mechanistic, quantitative description of immune cell dynamics and thymic output under homeostatic conditions and various patho-physiological scenarios are of particular interest in drug development applications, e.g., in the identification of potential therapeutic targets and selection of lead drug candidates against infectious diseases.
Methods: We here developed an integrative mathematical model of thymocyte dynamics in human. It incorporates mechanistic features of thymocyte homeostasis as well as spatial constraints of the thymus and considerations of age-dependent involution. All model parameter estimates were obtained based on published physiological data of thymocyte dynamics and thymus properties in mouse and human. We performed model sensitivity analyses to reveal potential therapeutic targets through an identification of processes critically affecting thymic function; we further explored differences in thymic function across healthy subjects, multiple sclerosis patients, and patients on fingolimod treatment.
Results: We found thymic function to be most impacted by the egress, proliferation, differentiation and death rates of those thymocytes which are most differentiated. Model predictions also showed that the clinically observed decrease in relapse risk with age, in multiple sclerosis patients who would have discontinued fingolimod therapy, can be explained mechanistically by decreased thymic output with age. Moreover, we quantified the effects of fingolimod treatment duration on thymic output.
Conclusions: In summary, the proposed model accurately describes, in mechanistic terms, thymic output as a function of age. It may be further used to perform predictive simulations of clinically relevant scenarios which combine specific patho-physiological conditions and pharmacological interventions of interest.
1 Introduction
The thymus is a primary lymphoid organ in the chest cavity, where immature T cells, known as thymocytes, differentiate into functional T cells. Structurally, the thymus is surrounded by a fibrous capsule and consists of multiple lobes which are separated into two main regions, the outer cortex and the inner medulla (1). According to their developmental origin, thymic cells are subdivided into hematopoietic cells (CD45-positive) and stromal cells (CD45-negative); the non-hematopoietic components are further divided into cortical and medullary thymic epithelial cells (cTEC and mTEC, respectively) and various mesenchymal cells (fibroblasts, capsule- and septae-forming connective tissue cells, as well as endothelial cells) (2). Functionally, the thymus comprises the true thymic epithelial space (TES), where thymopoiesis occurs, and the non-epithelial, non-thymopoietic perivascular space (3).
The T-cell developmental process starts when T-cell precursors from the bone marrow transfer into the thymus via blood vessels at the corticomedullary junction. T-cell precursors are also known as bone marrow-derived thymus-seeding progenitors (TSPs) and most likely comprise multiple cell types: IL-7R+ common lymphoid progenitors (CLPs), Flt3+ lymphoid primed multipotent progenitors (LMPPs) and other T-cell precursors (4). Once in the thymus, the T-cell developmental process proceeds with two phases: 1. Initiation of antigen receptor gene rearrangement and β-selection; 2. Positive and negative selection and further differentiation to specific effector cell lineages, i.e., CD4+ helper T cells, CD8+ cytotoxic T cells, or CD4+ regulatory T cells (1).
TSPs proliferate in the subcapsular cortex and differentiate into double negative (DN) thymocytes. Further DN differentiation includes several sequential cellular sub-types: DN1, DN2, DN3 and DN4, differing by various cell surface markers and related functions, i.e., DN1 thymocytes (CD177+ CD44+ CD25- CD4- CD8-) migrate to the cortex and actively proliferate; DN2 thymocytes (CD177+ CD44+ CD25+ CD4- CD8-) rearrange their γ-, δ-, and β-chains of T-cell receptor (TCR); DN3 thymocytes (CD177+ CD44- CD25- CD4- CD8-) perform β-selection, whereby cells failing to produce a functional TCR β-chain undergo apoptosis (5). Those cells that successfully complete β-selection initiate rearrangement of the TCR α-chain, yielding DN4 thymocytes (CD177- CD44- CD25- CD4- CD8-), which may further differentiate into a double-positive CD4+ CD8+ (DP) phenotype. DP thymocytes undergo a two-stage selection process in the thymic cortex. Positive selection is responsible for survival of cells whose T-cell receptor can bind major histocompatibility complexes (MHC) I or II, with at least a weak affinity. During negative selection, thymocytes that bind self-peptides or MHC with high affinity undergo apoptosis. Successfully selected DP cells further differentiate into single-positive (SP) cells, which express either CD4 (CD4+ CD8-) or CD8 (CD4- CD8+) markers. SP cells reside in the thymic medulla and, upon a final maturation stage, leave the thymus and migrate as recent thymic emigrant (RTE) cells to peripheral lymphoid tissues such as the spleen, gut, and lymph nodes. In secondary lymphoid organs, RTE cells differentiate into naïve cells, with a full potential to initiate an immune response.
It is well-known that the efficiency of the T-cell developmental process in the thymus is crucial for the ability of the immune system to perform its function in controlling antigenic homeostasis, e.g., to prevent the host from severe forms of infections or cancers. This function gradually decreases with age, starting during the first year of life (3, 6). Unfortunately, the exact mechanisms underlying this process are still poorly understood (7). Several hypotheses of thymus involution have been proposed, including the aging of hematopoietic progenitors, dysfunctioning in the thymic microenvironment, or elevation in the levels of sex hormones (8, 9). It is also known that the expansion of the perivascular space - mainly due to adipogenesis and shrinkage of the thymic epithelial space - results in a decreased thymic output (3, 6). Moreover, the cortex involutes more rapidly than the medulla, according to experimental findings (10).
An integrative mathematical modeling of T-cell development may allow for a better quantitative understanding of mechanisms affecting thymocytes dynamics and the ability of the immune system in fighting infections. Several models of thymopoiesis, using various modeling techniques, have been developed in the literature (4). These models may be categorized into three types:
● Models of thymocyte population dynamics formulated with linear ordinary differential equations (ODE) (11–14). These models describe, mathematically, basic cellular turnover processes, such as proliferation, differentiation, and death.
● Models based on the logistic growth equation, to account for a maximal carrying capacity of certain structural niches in thymus, for specific cell populations (13) and/or for the total number of thymocytes (13, 15). Such models typically consider the descriptor of growth control as an important physiological component in mathematical modeling, as it limits excessive, non-physiological cell proliferation.
● ODE-based generation-structured models, which account for cell number dynamics at each stage of cell division (16).
However, there is no general agreement on an optimal model structure, to adequately describe thymus dynamics (4). Moreover, the majority of existing models feature definite limitations associated with physiological background and constraints underlying the described processes, such as cell proliferation dynamics, realistic anatomical and physiological descriptors of a niche, etc.
Similarly to thymopoiesis, various modeling approaches have been published to quantitatively describe thymus involution. In one approach, thymus function decline was modeled phenomenologically by decreasing the overall thymic output proportionally to the TES volume (17). In another approach, TES involution with age was modeled using a modified exponential decay function (6). While it is not possible to directly measure thymic function, various surrogate measures have been used, such as signal joint TCR excision circles (signal joint TRECs), to assess thymic output, or the level of expression of the proliferation marker Ki67, to assess the T-cell proliferation rate (18). Thymus involution has also been described using an age-dependent function of TES as a carrying capacity of the thymus (15). In yet another approach, exponentially decreasing proliferation rates for each modeled cell population were utilized (19). Although these modeling approaches may allow one to predict thymic output as a function of age, the respective models do not consider the effects of age on thymocyte populations (6, 18) and/or lack a solid biological basis for mechanistically describing the thymus function, since there are no experimental data on the age-related decrease in proliferative activity for each thymocyte population (19).
Historically, research on thymopoiesis dynamics has been hampered by a lack of longitudinal data on specific thymocyte types in humans; a majority of physiological studies have indeed been conducted in mouse. Challenges relating to an adequate translation or scaling of data from mouse to human are still unresolved. In general, conventional empirical models for cross-species translation are oversimplified and not suitable to address practical questions related to, for example, preclinical-to-clinical drug development. In the modern paradigm of model-informed drug discovery and development (MID3), the value of integrative, mechanistic, quantitative systems pharmacology (QSP) models has been well-recognized (20). QSP models are based on a mechanistic and quantitative description of operating biological and patho-physiological processes, with an opportunity to integrate experimental data over multiple scales of biological organization (20). Importantly, mechanistic QSP models of the immune system have been used to support decisions not only in basic research, but also in regulatory assessments. For instance, regulatory approval of the first CAR-T cell product, tisagenlecleucel, was supported by a mechanistic model describing murine immune responses to a lymphocytic choriomeningitis virus and characterizing the expansion and persistence of tisagenlecleucel, as a substitute for traditional, semi-empirical compartmental pharmacokinetic modeling (21–23).
The primary objective of the present study was to develop a mechanistic mathematical model of thymopoiesis which integrates a substantial amount of realistic, physiologically-relevant, biological details which are most crucial to thymopoiesis, such as thymus spatial structure, specific physiological cell niches, physiological homeostasis, and age-related thymus involution. An integrative model of this nature is expected to describe thymocyte numbers at quasi steady-state and to address issues relevant to the development and efficacy evaluation of novel medicines – for example, the observed changes in immune homeostasis under pathological conditions and specific effects of therapeutic interventions that modulate thymic function.
The paper is organized as follows: Section 2 describes the model development workflow, with an overview of relevant experimental data and details of the model equations used. Section 3 presents model calibration and validation results, a sensitivity analysis, and novel predictions on thymic function. Finally, Sections 4 to 5 provide, respectively, a discussion and conclusions.
2 Materials and methods
2.1 Data
2.1.1 Experimental and clinical data
A systematic review of the literature has been performed, to identify all relevant sources with experimental and clinical data. The PubMed database and Google Scholar were searched using the keywords “thymocytes”, “thymus”, “human” and “flow cytometry” to identify pertinent data sources. Quantitative information on dynamic and kinetic characteristics of various thymocyte sub-populations, as well as thymic weight and cellularity during age-dependent involution was assessed from peer-reviewed articles presenting clear tables, figures, and experiments of adequate quality, ensuring the validity of the published cell phenotypes. Additionally, references from listed review papers were examined. Multiple sets of mouse and human data spanning diverse age groups were thus curated and used for model parameter estimation and model validation (Table 1).
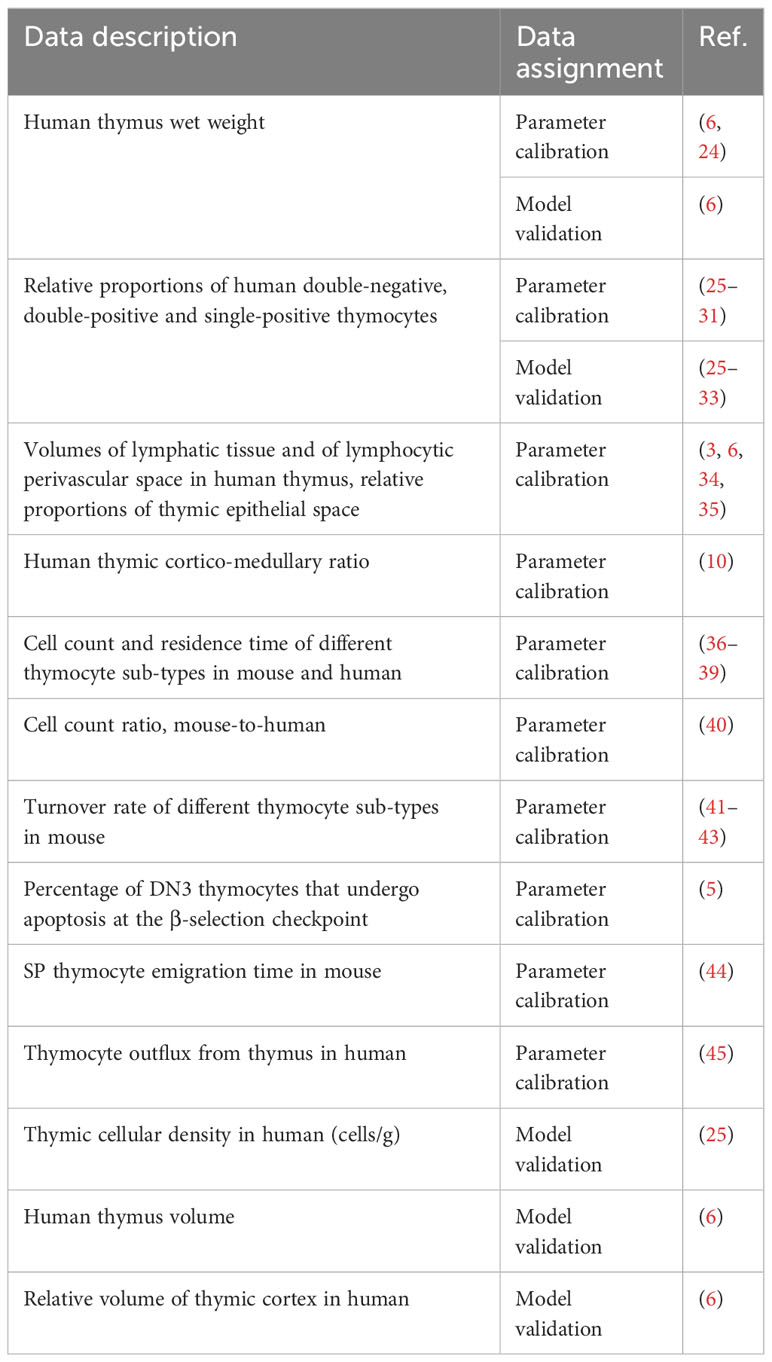
Table 1 Experimental and clinical data used for model development.
2.1.2 Physiological parameter ranges
Physiological ranges of DN, DP and SP thymocytes were derived based on the curated data, for model calibration and validation purposes. The total thymocyte count was calculated based on thymus wet weight and thymic cell density per gram of thymus tissue, among individuals and across an age range (6, 25). As data for each thymocyte population were limited, model calibration was performed on the 0-to-1 year old group data. Thymocyte counts for each cell population (DN, DP, SP4, and SP8 cells) in the 0-to-1 year old group were derived by multiplying the total thymocyte count range by the median relative proportion of each thymocyte population for the respective age group (25–31). Details on data transformation and related calculations are summarized in the Supplementary Materials (Supplementary Tables 1, 2).
2.2 Model formulation
2.2.1 Model structure
The schematic structure of the human thymocyte dynamic model that characterizes DN (CD4- CD8-), DP (CD4+ CD8+), SP4 (CD4+ CD8-) and SP8 (CD4- CD8+) thymocyte homeostasis is shown in Figure 1A. The respective time-dependent cell populations which are considered in the model are denoted as , , and .
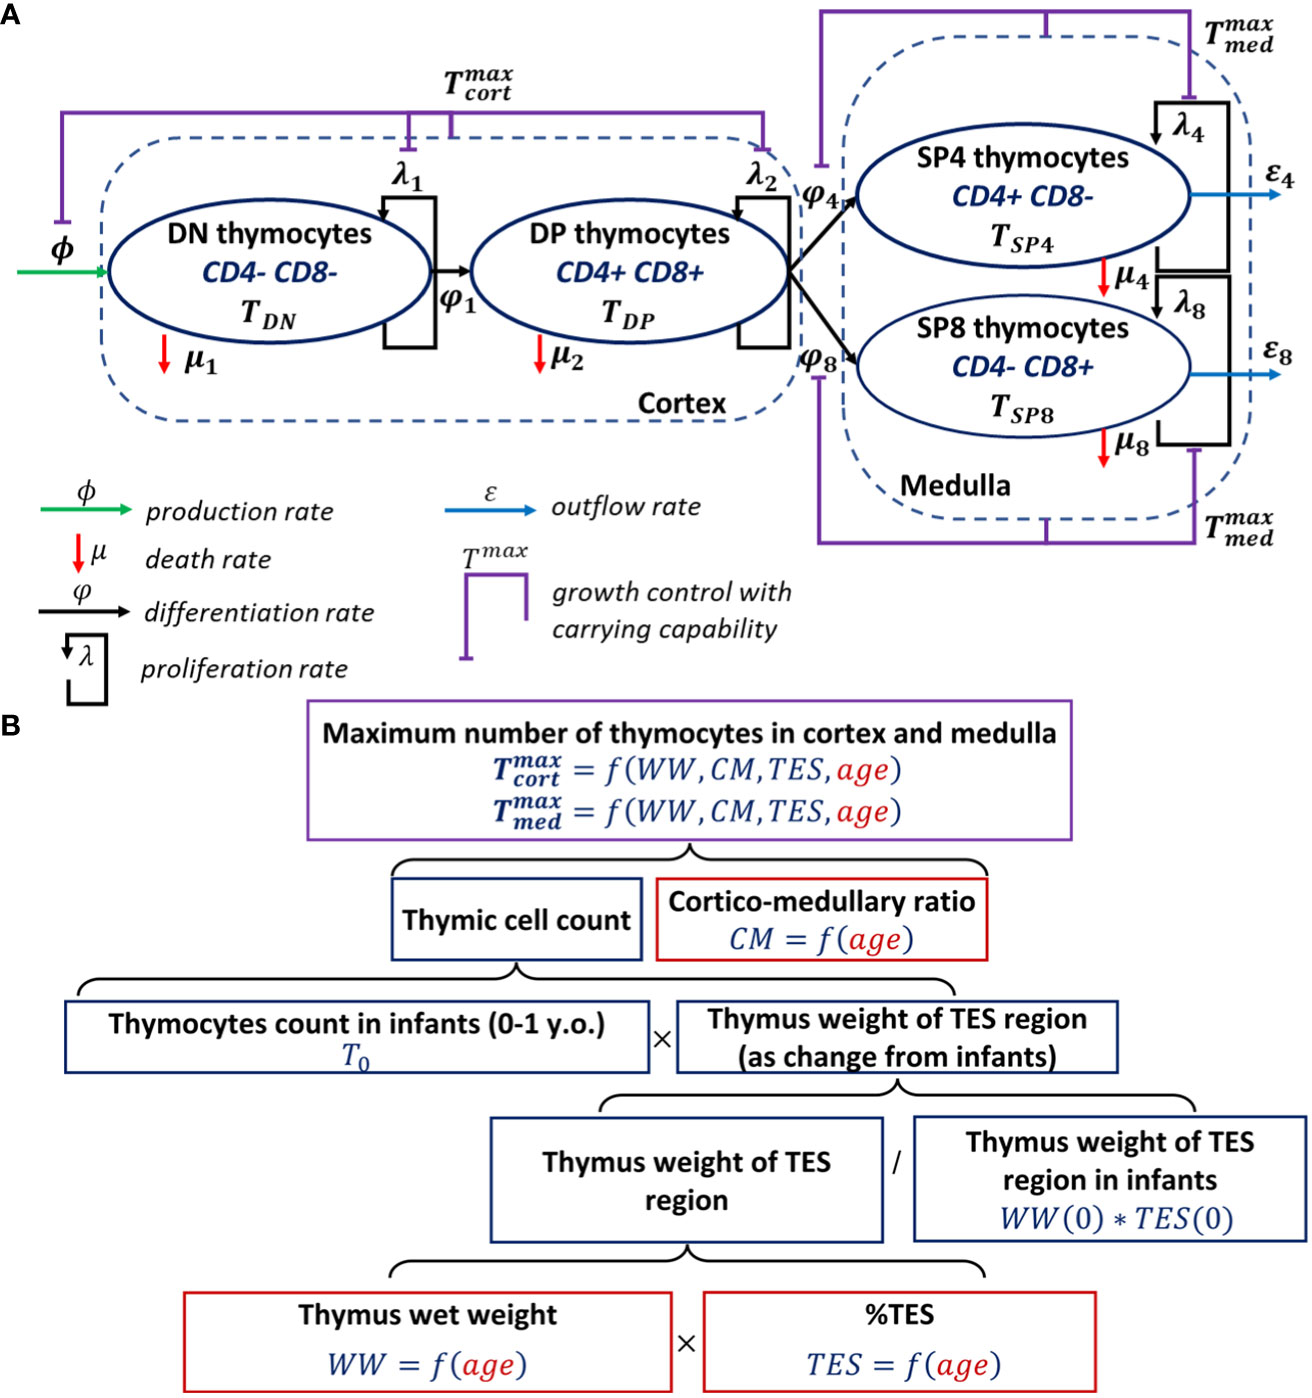
Figure 1 Scheme of the mechanistic model describing human thymocyte dynamics. (A) Model scheme, thymocyte homeostasis; (B) Model development steps describing thymus involution.
The model was initially built based on a model proposed by Ye et al. (15). The inflow to the DN compartment represents thymic-seeding progenitors, which enter the thymus from the blood. The death rates of cells represent net apoptosis due to T-cell commitment and β-selection for the DN population, as well as positive and negative selections for the DP population. A death rate for SP cells was also included in the model, due to the negative selection that occurs at the SP stage, yet at a slower rate as compared to the overall death rate due to positive and negative selection in the cortex at the DP stage (36). Cell proliferation was implemented for each cell population (DN, DP, SP4 and SP8) (1, 46). Distinct maximal allowable numbers of thymocytes in the cortex and medulla were introduced, to prevent excessive proliferation of certain thymocytes in these areas, given that DN and DP cells primarily reside in the cortex and SP cells in the medulla. The maximal allowable number of thymocytes in the medulla was also set to reflect the differentiation process of DP into SP cells and the subsequent migration of cells into the medulla. In contrast to the Ye et al. structural model, we: (i) included only one compartment for DN cells; and (ii) implemented growth controls separately in the thymic cortex and medulla vs. the entire thymus (15, 36).
Thymus involution was modeled with an age-dependent function describing the maximal allowable number of cells in the cortex and medulla, in agreement with existing experimental data (6). To quantify such an age-dependent function, the respective data were processed as shown in the flow diagram (Figure 1B).
2.2.2 Model equations
The mathematical model describing thymocyte dynamics consisted of a system of ordinary differential equations (ODEs), with parametrization of the growth control and age-dependent functions describing decreases in cortex and medulla cell counts.
The dynamics of DN thymocytes () was described using the following equation:
where represents an age-dependent function for the maximal thymocyte numbers (i.e., carrying capacity) in the thymic cortex; represents the inflow of thymocyte precursors; is the differentiation rate of DN cells to DP cells; represents a logistic growth function for the DN cell proliferation in the thymic cortex; represents the DN cell death; is the thymocyte precursor inflow rate (cells*d-1); is the rate constant of DN-to-DP differentiation (d-1); is the DN cell proliferation rate constant (d-1); and is the DN cell death rate constant (d-1).
The dynamics of DP thymocytes () was described by the following equation:
where represents a logistic growth function for the DP cell proliferation in the thymic cortex; represents an age-dependent function for the maximal thymocyte number (i.e., carrying capacity) in the thymic medulla; is a logistic growth function in the thymic medulla; is the DN-to-DP differentiation; represents the DP-to-SP4/SP8 differentiation; is the DP cell death rate; is the DN-to-DP differentiation rate constant (d-1); is the per capita DP cell proliferation rate constant (d-1); and are rate constants of DP-to-SP4 and DP-to-SP8 differentiations, respectively (d-1); and is the DP cell death rate constant (d-1).
The dynamics of SP4 () and SP8 () thymocytes were described by the following equations:
where and represent DP-to-SP4 and DP-to-SP8 differentiation rate constants, respectively; and represent SP4 and SP8 outflux rates, respectively; and are the logistic growth functions for SP4 and SP8 proliferation in the thymic medulla, respectively; and represent, respectively, SP4 and SP8 cell deaths; and are rate constants of DP-to-SP4 and DP-to-SP8 differentiation, respectively (d-1); and are rate constants of SP4 and SP8 outflows, respectively (d-1); and are rate constants of SP4 and SP8 proliferation, respectively (d-1); and and are SP4 and SP8 cell death rate constants, respectively (d-1).
The age-dependent functions and were parameterized using a combination of different factors such as thymus weight loss (relatively to thymus weight in infants), the relative proportion of TES, the cortico-medullary ratio and the total thymic cell count in infants (Figure 1B). Linear and nonlinear forms were tested to describe the age-related changes in the thymic wet weight [], the relative proportion of TES [], and the cortico-medullary ratio []. A nonlinear model based on the Hill equation for and nonlinear exponential models for and were finally selected, to quantitatively account for age-related changes in the respective variables.
Overall, the age-dependent functions of maximal thymocyte number in the thymic cortex [] and medulla [] were described by the following equations:
where represents the age-dependent thymus wet weight function; represents the age-dependent relative proportion of TES function; represents the age-dependent cortico-medullary ratio function; is the absolute total number of thymocytes in infants (0- to-1 year of age); stands for the thymus wet weight in infants; is the age corresponding to the 50% of the maximum decrease in thymus wet weight; is a Hill coefficient; and are regression coefficients representing the relative proportion of TES and cortico-medullary ratio in infants; and are regression coefficients representing the slope of the relative proportion of TES and cortico-medullary ratio decrease functions.
2.3 Quantitative analysis workflow
Model analysis was performed in three sequential steps: model calibration, model validation, and simulations including sensitivity analyses. Model performance was evaluated using multiple criteria including diagnostic plots, uncertainty of parameter estimates, and values of objective function.
2.3.1 Model calibration
Parameters related to thymocytes homeostasis and age-dependent thymus involution were estimated separately. The thymus involution sub-model was calibrated using the data on thymus wet weight (24), data on the relative proportion of TES [derived from total thymus, lymphatic tissue and lymphocytic perivascular space volume data in human thymus (3, 6, 34, 35)], the total number of thymocytes in infants [derived from (6) and (25)], and data on the thymic cortico-medullary ratio (10). Parameter values in Equations 5, 6 were estimated via nonlinear regression on the respective data (Table 1). Parameter uncertainty was assessed through a Standard Error (SE) and Relative Standard Error (RSE) calculation for each parameter in the thymus involution sub-model, with an RSE< 50% being considered as acceptable.
The thymocyte homeostasis sub-model was calibrated using derived physiological ranges of DN, DP, SP4 and SP8 cells in 0-to-1 year old infants (Section 2.1.2) and the available information on thymocyte kinetics (Table 1). For calibration purposes, the maximal numbers of thymocytes in the cortex () and the medulla () in infants were fixed using mean predicted values from the thymus involution model for the 0-to-1 year of age group. In particular, parameter values were adjusted to reproduce the quasi steady-state turnover of DN, DP, SP4 and SP8 thymocytes within observed physiological ranges. An uncertainty analysis also considered the determination of admissible ranges of model parameters (generalized estimates), which were initially quantified via a local sensitivity analysis (model-based estimates) and further adjusted according to published experimental data (experimental estimates).
A further model analysis was performed on physiologically plausible parameter sets which satisfied the condition of quasi steady-state levels of thymocytes, within their physiological ranges (47). A Latin hypercube sampling (LHS) method with a uniform distribution was used for parameter value sampling in the thymocyte homeostasis model (Equations 1–4). Generalized estimates were used to run the LHS (Table 2). Calculated quasi steady-state levels of DN, DP, SP4 and SP8 cells for each of the 150,000 parameter sets were then verified to fall within their respective physiological ranges.

Table 2 Estimates of the calibrated parameters in the thymus involution model.
2.3.2 Sensitivity analysis
Local and global sensitivity analyses were performed to define admissible parameter ranges and to quantify how an arbitrary change in model parameters would impact thymic function; parameters were then ranked with respect to the estimated impact. A partial rank correlation coefficient (PRCC) was used as a global sensitivity characteristic (48). A global sensitivity analysis was performed by sampling parameters from physiologically plausible sets. A graphical check on data linearity and heterogeneity was performed prior to the sensitivity analysis. A statistical significance threshold was defined by introducing a “dummy” parameter in the sensitivity analysis; this parameter acted as a “negative control”, as it did not appear in the model equations and thus would not have affected the model (48).
2.3.3 Model validation
Model validation was conducted for the thymus involution model, at each model development stage, using data available from literature sources (6, 25). Data on the relative thymic cortex volume vs. age were used to validate the model prediction for (6). The validation data (thymic cortex relative volume) differed from the model output (thymic cortex cell count); thus, for validation purposes, we modified Equation 5, from describing the maximal cell number in cortex (), to Equation 7 for the relative cortex volume (). Validation data and model predictions were normalized to the corresponding values for 0-to-1 year old infants, to synchronize initial conditions.
The relative thymic cortex volume () was described by the following equation:
where is the age-dependent relative TES proportion function (see Equations 5, 6 for further details); is the age-dependent thymus wet weight function (see Equations 5, 6 for further details); is the age-dependent cortico-medullary ratio function (see Equations 5, 6 for further details); is the age-dependent thymic density (g/cm3) function, estimated according to thymus wet weight and volume data (6); ; is the age-dependent thymic volume (cm3) function, estimated according to thymus volume data (6); ; where and are regression coefficients representing thymic density and thymic volume in infants, and and are regression coefficients representing, respectively, the slopes of thymic density and thymic volume decrease functions.
The predictive power of the fully-developed thymocyte dynamics model was assessed via a comparison of simulations to empirical data on the relative proportions of DN, DP and SP cells and absolute numbers of total thymocytes (6, 25–33).
2.4 Software
Data digitization was performed using WebPlotDigitizer, version 4.6 (https://apps.automeris.io/wpd/). Extracted experimental and clinical data were gathered in the database using Microsoft Excel 365 (https://office.microsoft.com/excel). Data visualization (packages: ggplot2, cowplot, gridExtra, scales), model development (packages: dplyr, tidyr, stringr, stats, nlstools, deSolve), model simulations (RxODE package) and sensitivity analyses (packages: epiR, sensitivity) were performed in the R Statistics software, version 4.0.2 (R-project, www.r-project.org).
3 Results
3.1 Integrative model development
3.1.1 Thymus involution dynamics
The range of the total number of thymocytes in 0-to-1 year old infants, , was identified as [2.2*1010; 5.8*1010] for Equations 5, 6 (see Supplementary Table 1). Model parameters for the thymus involution model are presented in Table 2.
Parameter uncertainty estimation was assessed based on the RSE and each parameter was assessed as identifiable (RSE< 50%). Goodness-of-fit plots are presented in the Supplementary Materials (Supplementary Figures 1–3).
3.1.2 Thymocyte homeostasis turnover
Physiological ranges for DN, DP, SP4 and SP8 cells were identified as, [1.3*109; 3.4*109], [1.2*1010; 3.2*1010], [6.3*109; 1.7*1010] and [2.3*109; 6.0*109], respectively. and in infants were fixed to values of 2.84*1010 and 1.05*1010, respectively, based on the mean prediction of the thymus involution model for the 0-to-1 year old infant group. Parameter estimates for the thymocyte homeostasis model are presented in Table 3.
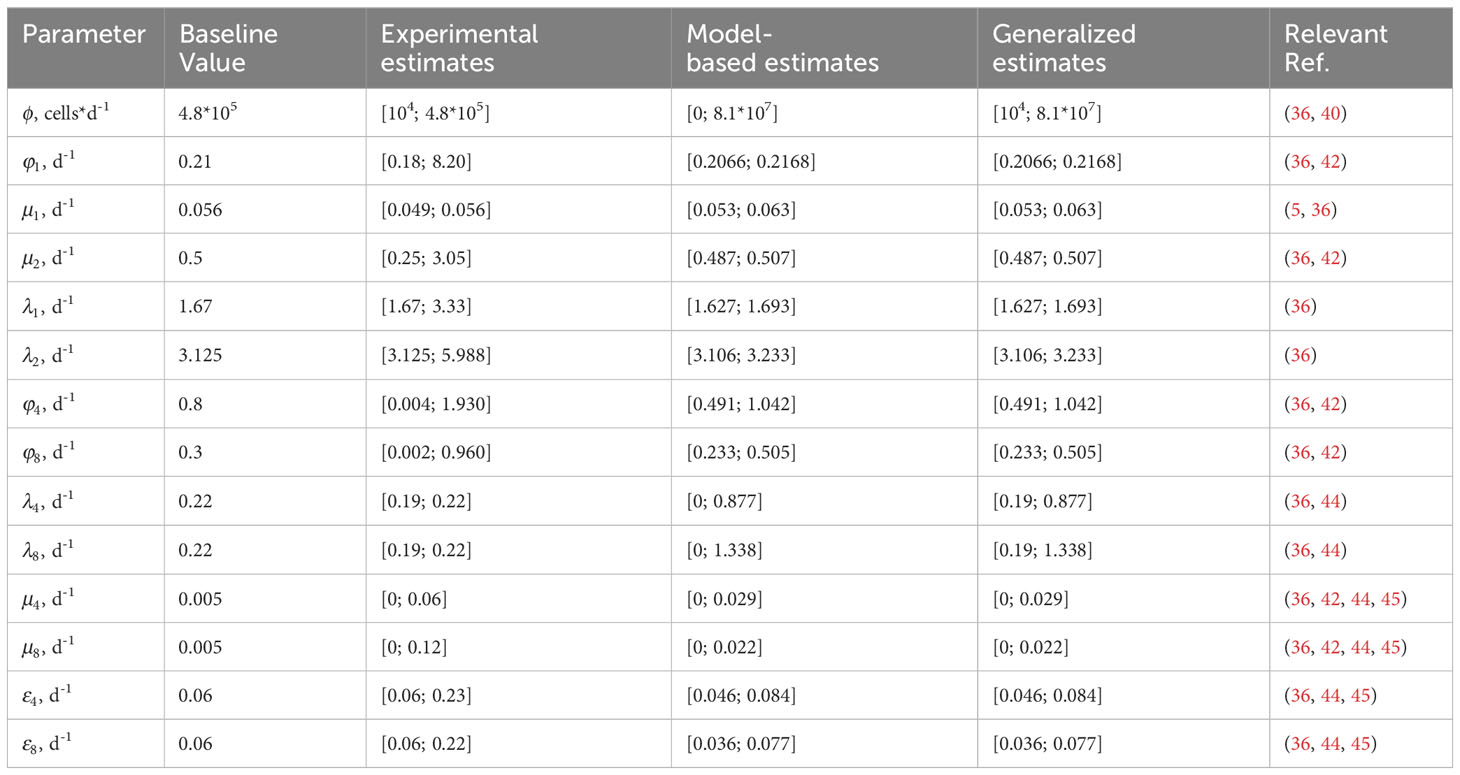
Table 3 Parameter estimates for the calibrated thymocyte homeostasis model.
Steady-state values for the DN, DP, SP4 and SP8 thymocyte populations, with the proposed set of parameters values as specified in Table 3, were ~2.72*109, ~2.12*1010, ~7.45*109 and ~2.79*109, respectively, and were in full agreement with experimentally observed physiological ranges for these variables. For further details, we refer the reader to the Supplementary Materials (Supplementary Tables 1, 2).
Based on the local sensitivity analysis, lower admissible bounds for parameters , , , , and could not be determined and were set to zero. Final generalized estimates were identified by matching the experimental and model-based estimates. As shown in Table 3, all estimated parameter values were consistent with experimentally observed physiological ranges. Derivations of all experimental estimates are presented in the Supplementary Materials (Supplementary Tables 3, 4).
3.2 Critical parameters
The resulting physiologically plausible parameter sets upon which further analyses were performed contained 3,474 sets out of 150,000 sets generated. Results from the global sensitivity analysis are presented in Figure 2. The SP thymocyte number was chosen as a key output of the model, since it reflects most closely overall thymic function. Relationships between the model output and each parameter were of a monotonic, linear nature (see Supplementary Figure 4).
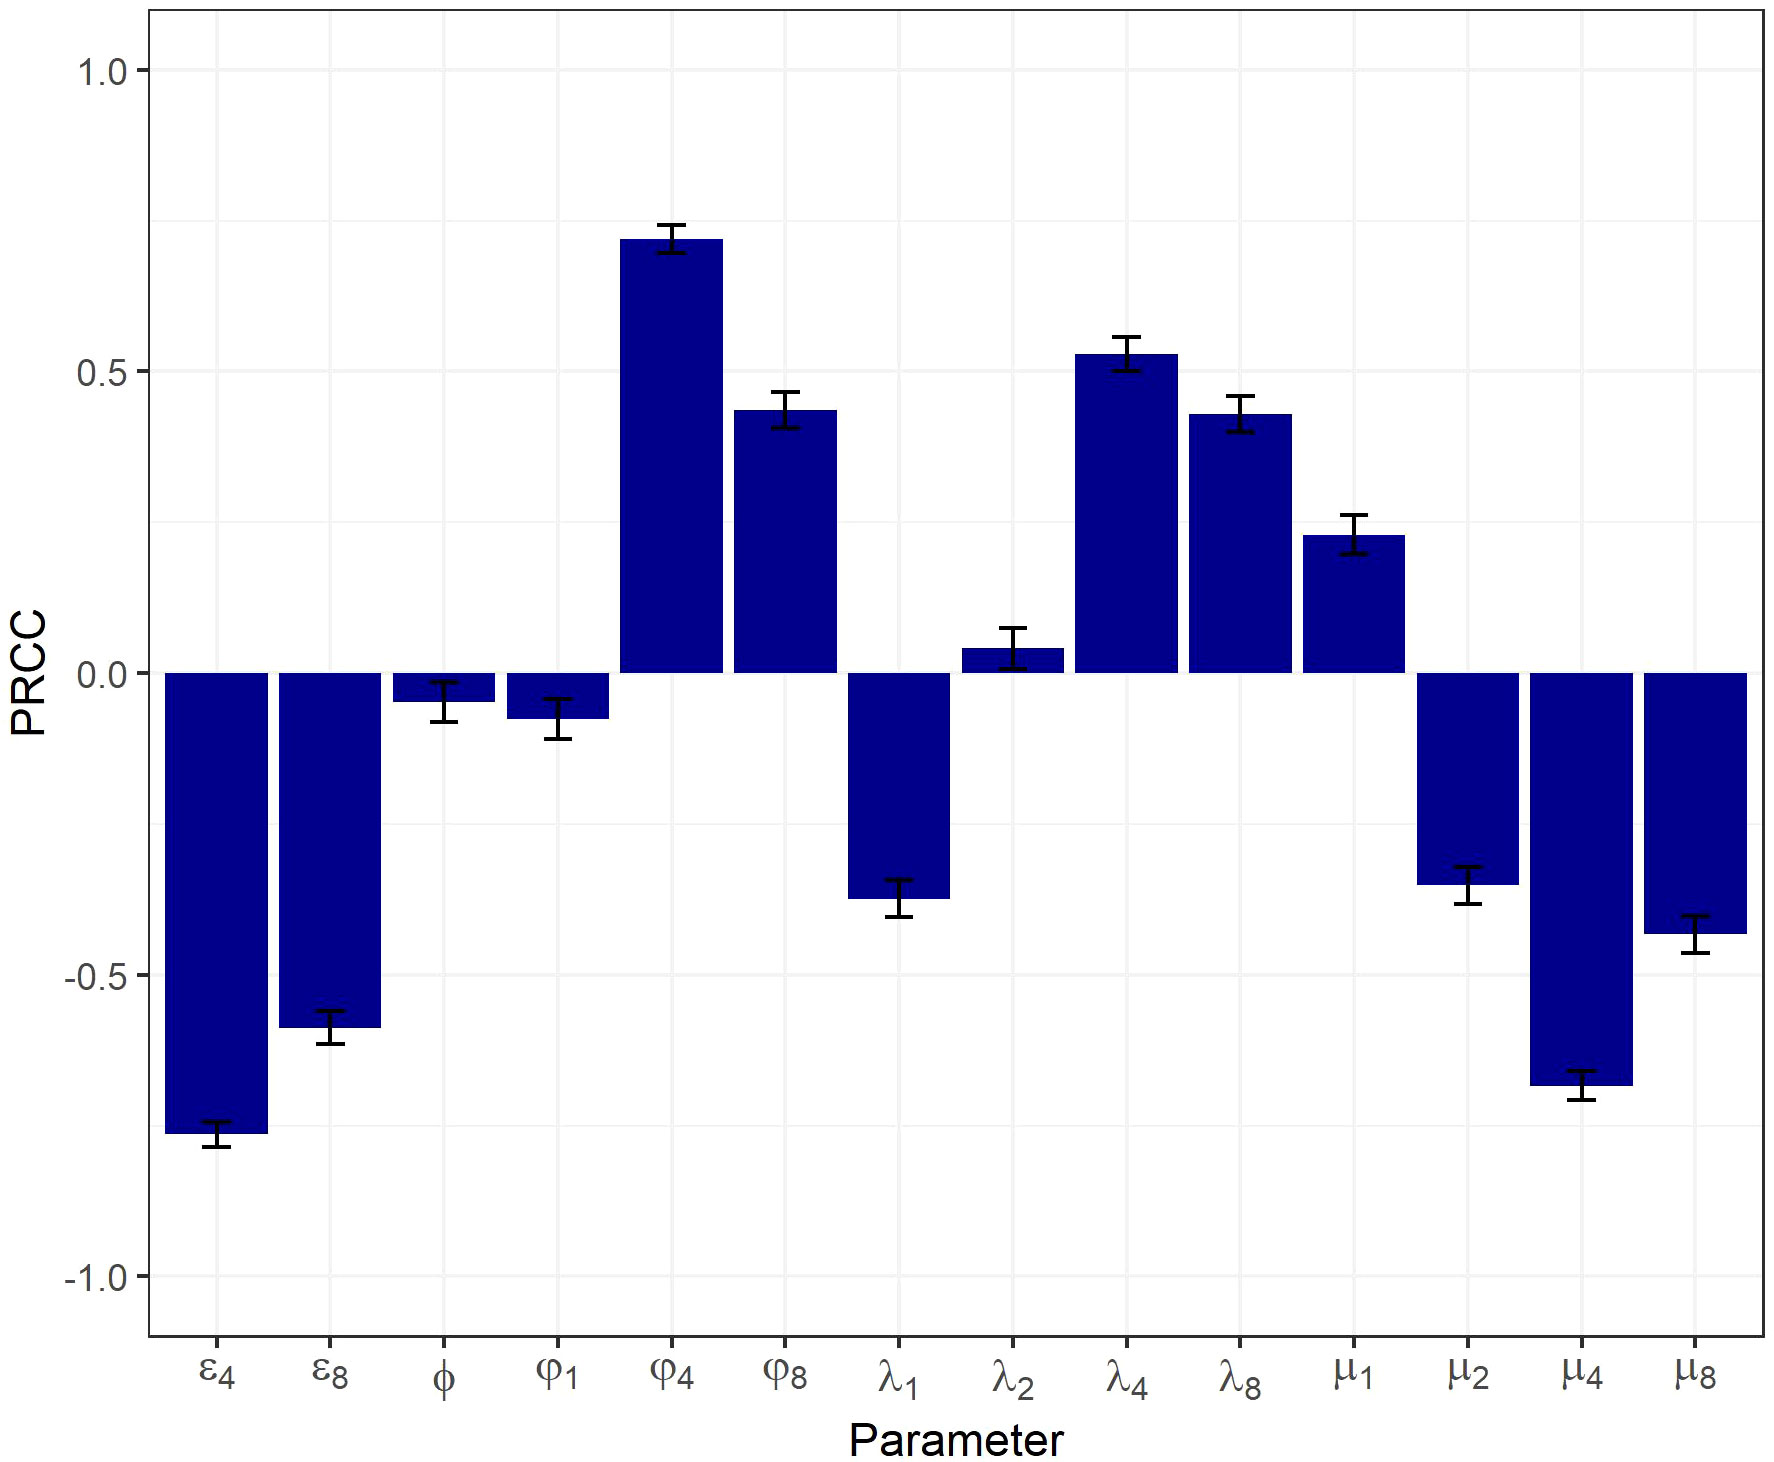
Figure 2 Global sensitivity analysis on a physiologically plausible set of parameters using a PRCC-based method.
All model parameters significantly affected the output, according to the PRCC-based sensitivity analysis. The highest PRCC coefficients were predicted for , , , and (PRCC > 0.5), indicative of these parameters being most critical in driving the system’s behavior.
3.3 Model performance evaluation
Model validation results are presented in Figure 3. The band represents the 95% uncertainty of each model-predicted solution. The function capturing the age-dependent decrease in thymus wet weight, as a part of the thymus involution model, was successfully validated based on published thymus weight data (6) (Figure 3A). Due to differences in baseline values (0-to-1 year of age group) between calibration and validation datasets, the thymus wet weight model was adjusted from the validation data to a baseline value of 27.3 g. Validation results of the composite model outcome () after adjustment (see Section 2.3.3. for further details) are shown in Figure 3B. Estimates of the calibrated parameters and goodness-of-fit plots for thymic density () and thymic volume (), which are needed for validation of the thymus involution model (Equation 7), are presented in the Supplementary Materials (Supplementary Table 5; Supplementary Figures 5, 6).
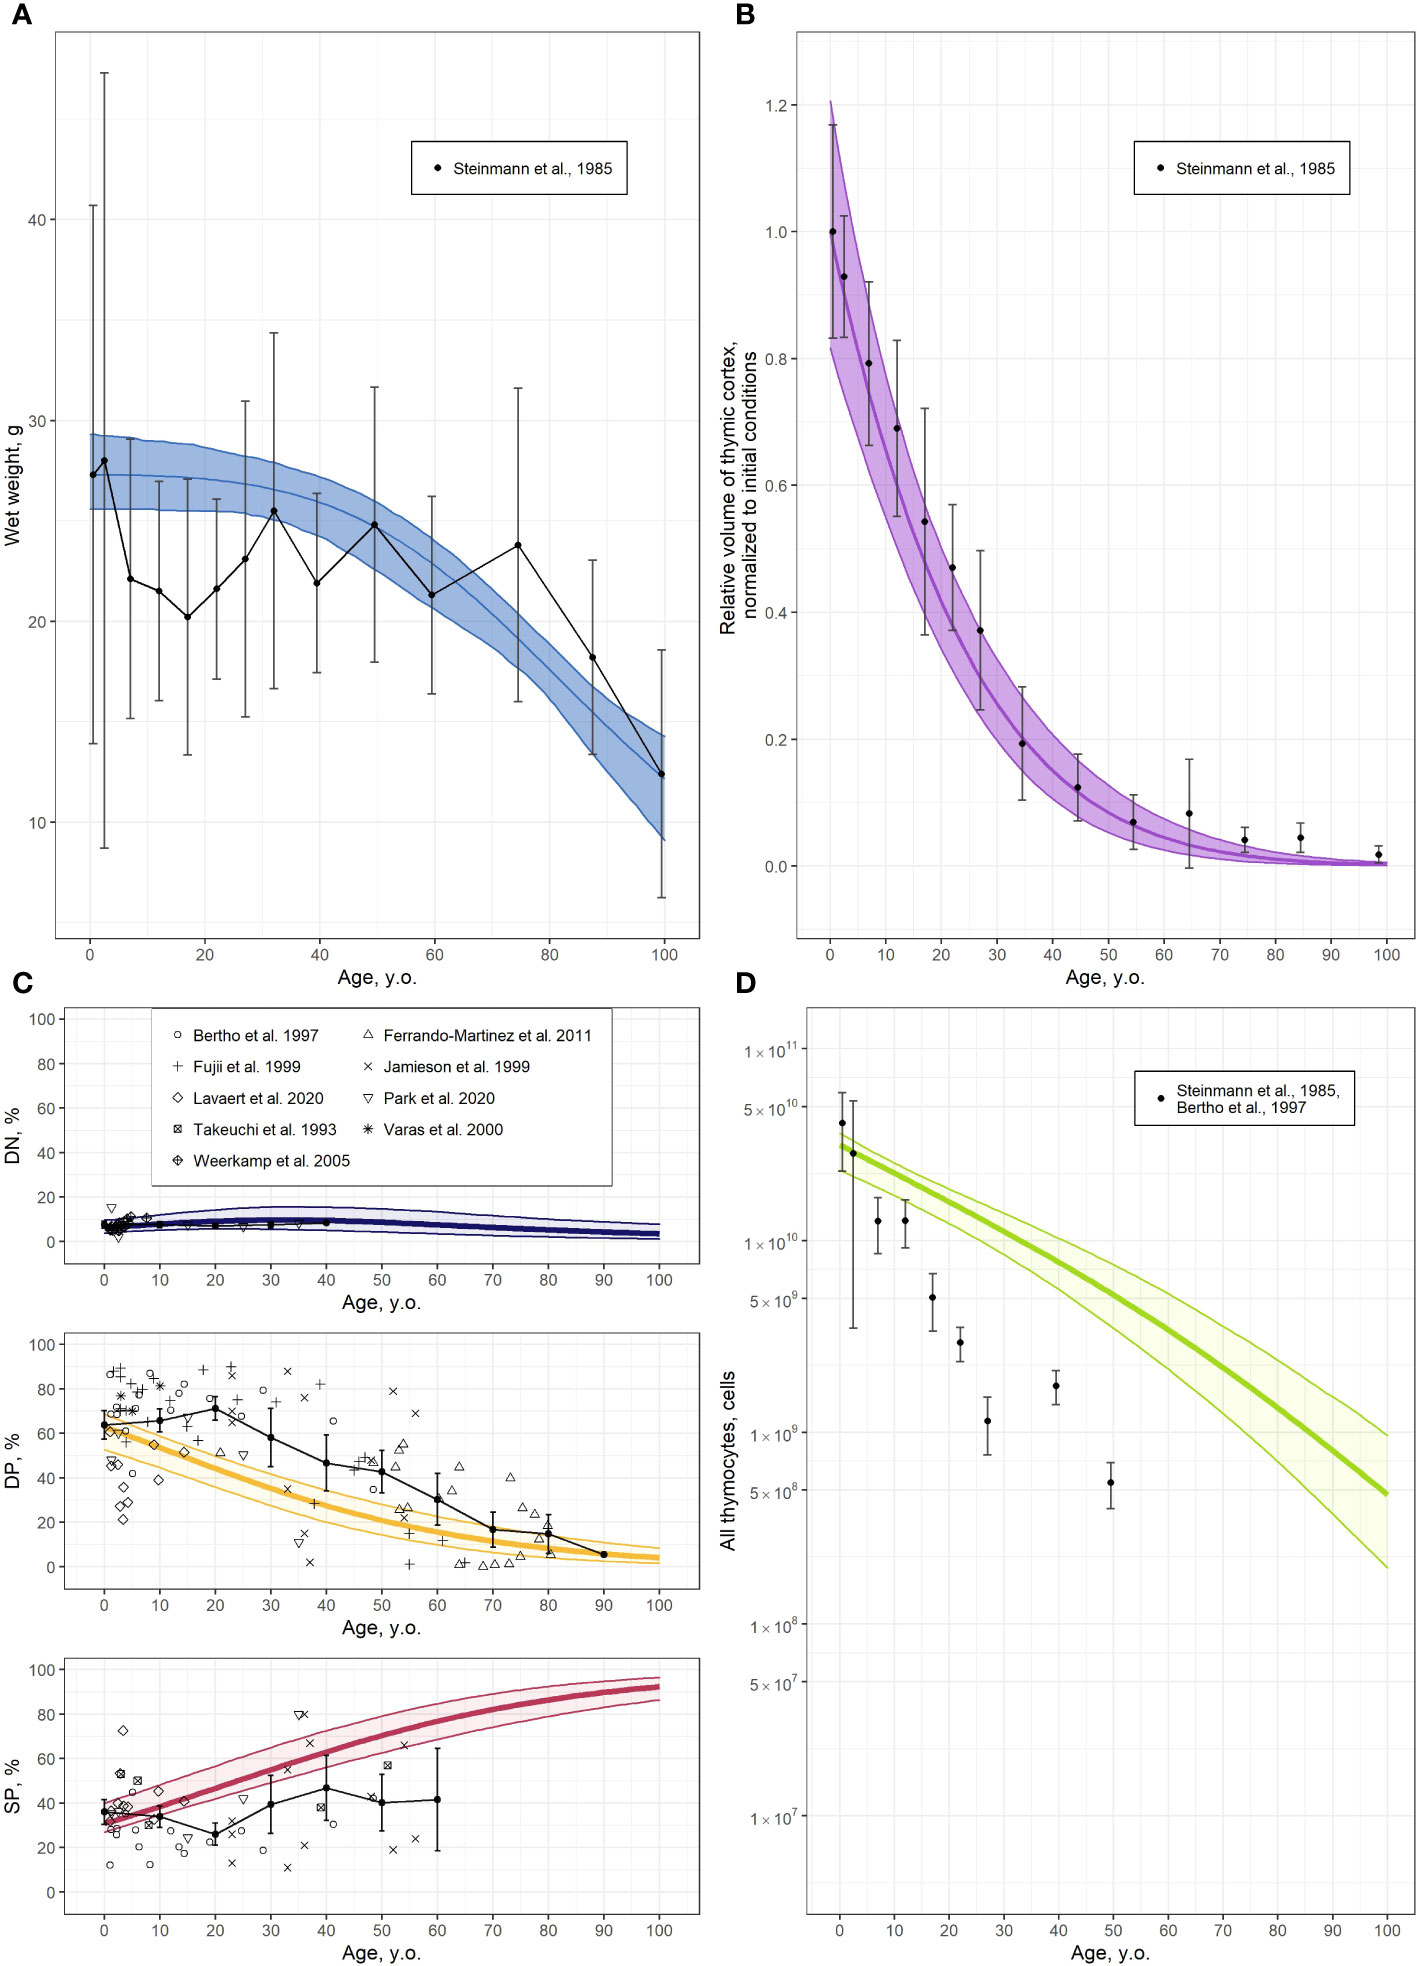
Figure 3 Validation of the thymocyte dynamics model. (A) Thymus wet weight [solid line and shaded area represents the model predicted mean with 95% CI uncertainty band, respectively, and symbols and error bars stand for the mean and 95% CI of clinical data (6)]; (B) Relative volume of thymic cortex, normalized to initial value, derived from the modified function in Equation 7 [solid line and shaded area represents the model predicted mean with 95% CI uncertainty band, respectively, and symbols and error bars stand for the mean and 95% CI of clinical data (6)]; (C) Relative proportions of DN, DP and SP cells [solid line and shaded area represents the model predicted mean with 95% CI uncertainty band, respectively, symbols stand for clinical data (25–33) and black solid line with error bars represents moving average with 95% CI (10 years step)]; (D) Absolute values of total thymocyte numbers [solid line and shaded area represents the model predicted mean with 95% CI uncertainty band, respectively, and symbols and error bars stand for mean and 95% CI of clinical data derived from (25, 6); see also Supplementary Table 1].
Combining the thymocyte homeostasis sub-model with the thymus involution sub-model provided the overall integrative model for describing thymocyte dynamics with age. The thymocyte dynamics model was validated by comparing its output to the absolute values and relative fractions of thymocyte sub-types curated from various sources, as presented in Figures 3C, D. A moving average with a 10-year step was applied to the relative proportions of thymocyte sub-type data, to visualize data variability and compare such vs. model predictions.
According to these validation results, the integrative model adequately described the age-related thymic function, both in qualitative and quantitative terms. Relative proportions of DN and DP thymocytes decreased with age, while the proportion of SP cells increased (Figure 3C). Such a process can be explained due to a faster involution of the cortex vs. the medulla. Inconsistencies arose in the predictions of DP and SP counts in the 10- to 30-year age group and the >50-year age group for the SP cell population, primarily due to the sparsity and relative lack of data for these groups (Figure 3C). The absence of data on the absolute values of total thymocyte numbers in human, combined with the necessity to merge data from various sources to calculate the absolute number of thymocytes, resulted in a partial discrepancy between model predictions and the data (Figure 3D). Nevertheless, the overall model adequately reproduced the age-dependent trends in both total thymocyte counts and all thymocyte sub-population counts.
3.4 Prediction of thymic function for clinically relevant settings
The integrated model of thymocyte dynamics was next used to perform simulations of thymus function changes with age (Figure 4), specifically, to predict thymocyte counts in the different anatomical compartments: the cortex, the medulla, and the overall thymus (Figure 4A); and of the various cell populations, including DN, DP, and SP cells (Figure 4B). The model explicitly captured the dynamics of main thymocyte populations (DN, DP, SP4 and SP8) and implicitly included various sub-populations, such as thymic-derived regulatory T-cells (tTreg) and re-entered mature lymphocytes. Given that tTreg cells constitute ∼1 – 3% of SP4 cells in the thymus, it becomes feasible to predict the absolute number of these cells (49, 50). In infants, the calculated tTreg count was 3.2*106 – 9.6*106 cells per gram of thymus, a value which roughly aligns with experimental data (14.1 ± 4.2*106 cells per gram of thymus (51)).
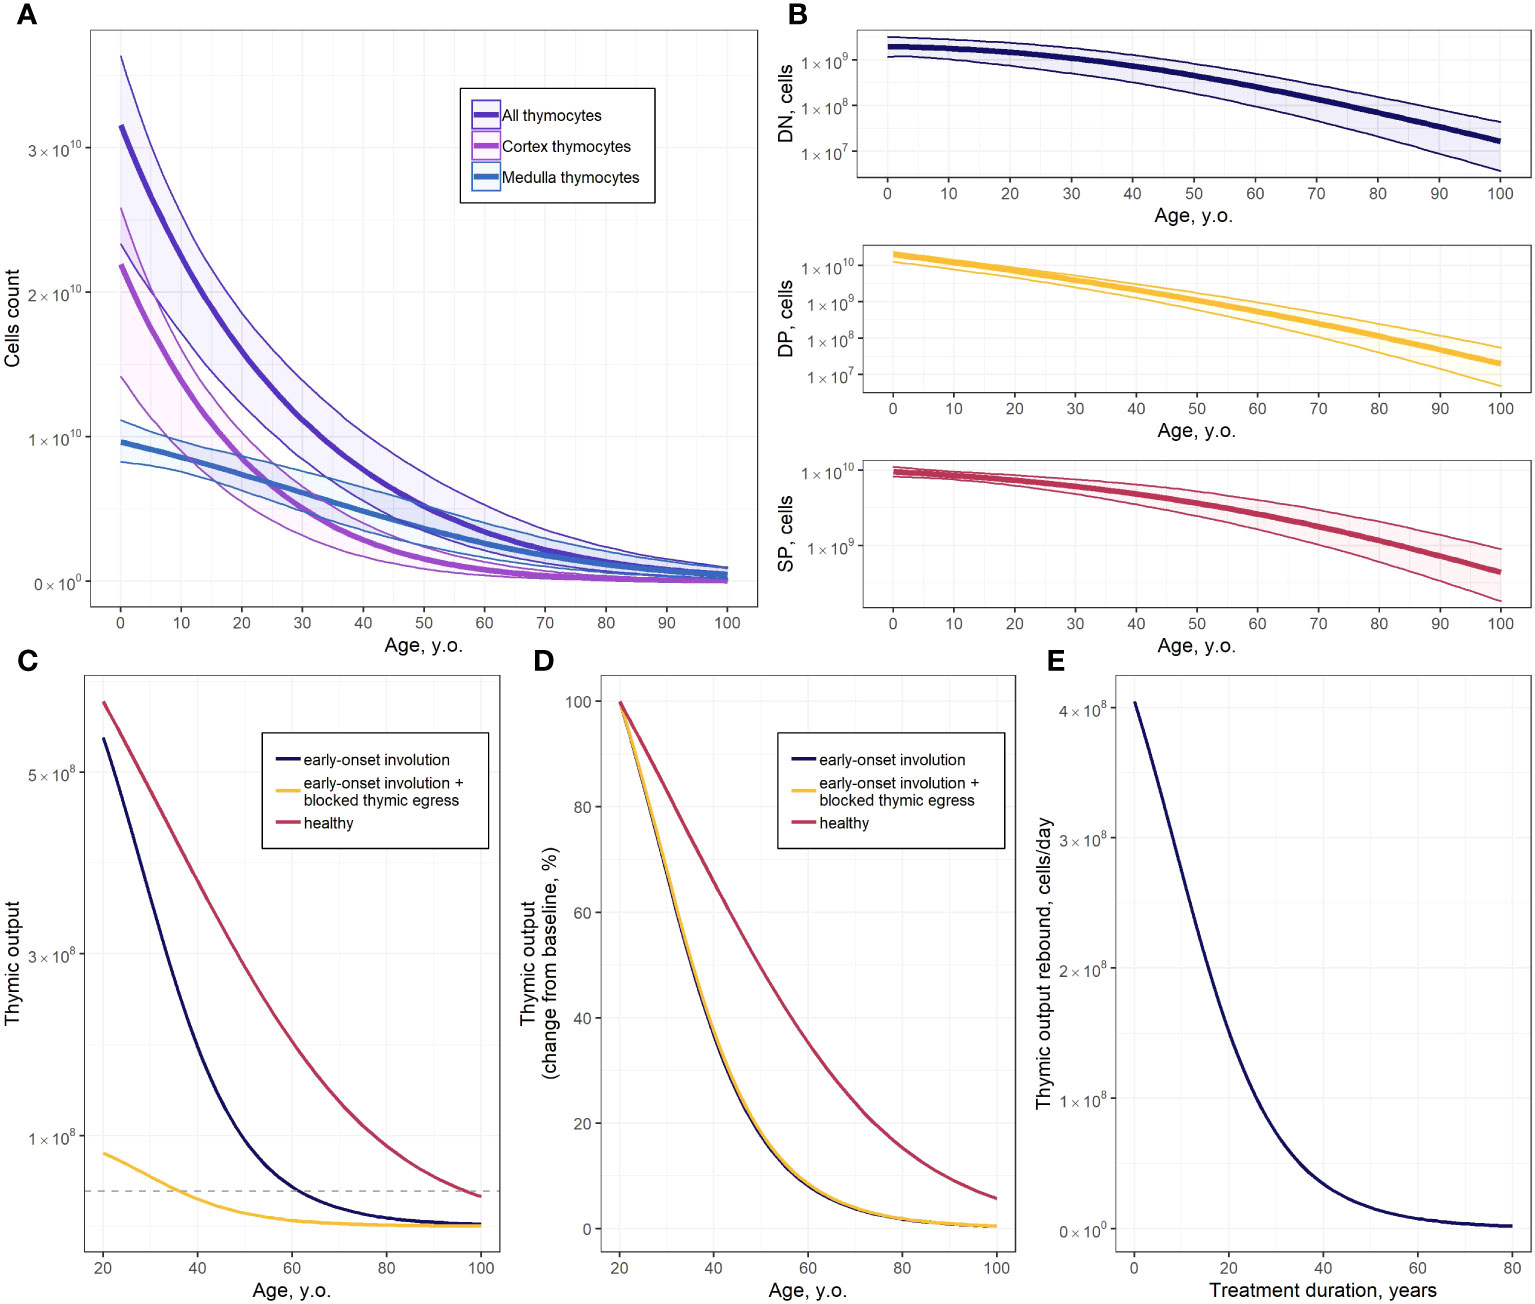
Figure 4 Predictions of the thymocyte dynamics model. (A) Absolute values of all thymocyte counts and of cortex and medulla thymocytes (solid line and shaded area represents the model predicted mean with 95% CI uncertainty band, respectively); (B) Absolute values of DN, DP and SP thymocyte populations (solid line and shaded area represents the model predicted mean with 95% CI uncertainty band, respectively); (C) Predicted mean of thymic output for healthy subjects, subjects with early-onset thymus involution, and subjects with early-onset thymus involution and blocked thymocytes egress (dashed line – thymic output threshold for fingolimod discontinuation); (D) Predicted mean of SP cell counts, expressed as changes from baseline, for healthy subjects, subjects with early-onset thymus involution, and subjects with early-onset thymus involution and blocked thymocytes egress; (E) Predicted thymic output rebound after thymocyte egress restoration in 20-year old subjects with early-onset thymus involution.
Thymic function simulations were performed for subjects under three sets of physiological conditions: healthy subjects, subjects with an early onset of thymus involution, and subjects with an early onset of thymus involution and with blocked thymocyte egress (Figures 4C, D). Early-onset thymus involution may occur under certain pathological conditions, while thymocyte egress blockage may occur under therapeutic pharmacological interventions with certain immunomodulators such as fingolimod. The corresponding model predictions were expressed as the rate of exported SP cells (cells*d-1). Average parameter values from physiologically plausible parameter sets were used to simulate healthy subjects. Early-onset thymus involution was modeled by reducing the parameter value to = 40 years. Thymocyte egress blockage was modeled by lowering the egress rates of SP4 () and SP8 () cells from 0.076 d-1 and 0.082 d-1 to 0.011 d-1 and 0.012 d-1, respectively. A detailed description of the parameter values used to simulate both early-onset thymus involution and thymocyte egress blockage scenarios is provided in the Supplementary Materials (Supplementary Table 6) (52).
One of the clinical factors limiting the use of fingolimod is the development of severe lymphopenia. According to European Medicines Agency (EMA) guidelines, fingolimod-based treatment should be discontinued when the absolute lymphocyte count in blood drops below 200 cells/mm3 (53, 54). The average duration of fingolimod treatment prior to developing severe lymphopenia was identified through simulations of the impact of fingolimod discontinuation on thymic output. A detailed description of the estimation of the average threshold of thymic output for fingolimod therapy discontinuation is presented in the Supplementary Materials (Supplementary Table 7) (41, 55–57).
We determined a model-based, ∼1.1-fold difference in absolute numbers of exported SP cells, when comparing healthy subjects vs. subjects with early-onset thymus involution in a 20 year-of-age group (Figure 4C); this difference in thymic count, however, increased with age (Figure 4D). Blockage of thymocyte egress led to a decrease in the absolute values of exported SP cell counts (Figure 4C). However, no significant differences in the rate of thymus involution were observed, with respect to subjects’ age, with or without thymocyte egress blockage (Figure 4D, blue and yellow lines). Considering the calculated thymic output threshold for fingolimod discontinuation, grade 4 lymphopenia is expected to develop after ∼19 years of continuous fingolimod, with drug treatment initiated at the age of 20 (Figure 4C). The effect of fingolimod treatment duration on the thymic output rebound after drug discontinuation in 20-year old multiple sclerosis patients is presented in Figure 4E; the shorter the treatment duration, the greater the extent of thymocyte rebound after fingolimod discontinuation (Figure 4E). However, this would also present a higher risk of severe lymphopenia development (Figure 4C).
4 Discussion
The development and validation of an integrative mechanistic model of thymocyte dynamics is a challenging task, given not only the inherent complexity of the underlying biology and physiology, but also due to intrinsic and extrinsic uncertainty and variability in the data, as can be seen in Figure 3. These challenges are further compounded by the lack of longitudinal thymocyte data in humans. Framing thymocyte homeostasis while identifying and extracting consistency across multi-source, multi-scale experimental data and biological knowledge is an essential and demanding task for the development of a quantitative, dynamic, physiologically-based mathematical model. This type of models may then be used to perform predictive simulations under scenarios of various pathophysiological conditions and/or therapeutic pharmacological interventions. The model of thymic function we proposed here is consistent with current qualitative and quantitative knowledge on homeostasis of various thymocyte populations and on age-related differences in thymic function. Furthermore, the model adequately described the changes in thymic function under certain pathological conditions, such as multiple sclerosis, and pharmacological immunomodulatory intervention, such as fingolimod administration. Finally, our model-based analysis revealed parameters (, , , and ) which are most critical in determining the system performance characteristics, which may be “targeted” to improve thymic function, e.g., under pharmacological modulation.
Model development and validation were based on a broad set of published experimental and clinical data, on thymocyte homeostasis and age-dependent thymus involution. Our model calibration approach is more exhaustive than previous thymus modeling efforts, whereby single sets of mainly murine data [thymocyte kinetic data in normal thymus (16) and in thymus with induced T-cell development abnormalities (12, 13); steady-state thymocyte counts (14)] were used for model development. Despite the heterogeneity of data sources, calibration of parameter estimates in the model resulted in a close agreement with previously published models (Supplementary Table 8). However, the inflow rate of thymocyte precursors was difficult to compare across existing mathematical models of the thymus, given that cell content within the DN compartment varied among models. Differences in underlying structures between the presently described vs. previously published models resulted in differences for several parameter estimates. Because not every published model incorporates DP cell proliferation rate or the control of cell transition from the cortex to the medulla, estimates for the DP proliferation rate and the DP-to-SP4 and DP-to-SP8 differentiation rates were approximately an order of magnitude higher than respective parameter estimates from previously published models (Supplementary Table 8).
The quality of the data used for model verification along with the utilization of mouse data may influence the reliability of the model predictions. All quantitative data identified through our systematic literature review were used for parameter estimation and model validation. No assessment was made regarding publication bias in the experimental and clinical data, and there remains a need for establishing quantitative criteria to distinguish high quality experimental immunological data from lesser quality ones. Addressing this issue involves the consideration of options proposed by the QSP community, such as focusing on parameter variability and model validation (58). Several dynamic characteristics of various thymocyte subsets were extracted from experiments conducted in mouse (Supplementary Table 3). The derivation of experimental estimates for model parameters (Table 3) involved scaling from mouse to human (36, 40), except for parameters , , , , , and (Supplementary Table 4). According to the sensitivity analysis results (Figure 2), parameters and exerted the most significant influence on thymic function. Discrepancies in the derivation of these parameters could potentially impact model performance. However, the consistency of model estimates with experimental values (Table 3), as well as the ability of the model to adequately describe human data (Figures 3C, D) provided support in using such data. Nevertheless, model verification should be refined as more human data become available.
Estimates of maximal thymocyte numbers in the cortex and the medulla were derived, both to quantify age-related thymus involution and to limit excessive, non-physiological cell proliferation and cell flow across thymus compartments. A similar approach to thymocyte growth control has been implemented in the Ye et al. model, whereby a time-dependent function of the thymus epithelial space was used to limit the proliferation of each subset of thymocytes (15). We elected to consider cortex and medulla in the thymus separately, since involution rates in these areas significantly differ from each other (10). The derived quasi steady-state values of each thymocyte subset were lower than the estimated maximal number of thymocytes in the cortex and the medulla, which provided an opportunity to allow for an increase in cell proliferation as may occur under infection or specific therapeutic intervention conditions.
The sensitivity analysis showed that the egress, differentiation, proliferation and death rates of SP (especially SP4) cells were the most critical system parameters controlling thymic function. Sensitivity analysis results were consistent with those predicted by other mathematical models, whereby the SP4 emigration rate, together with T-cell division and death rates were found to be the most important parameters affecting the concentration of TRECs and, subsequently, thymic output (15). Moreover, the sensitivity analysis revealed a low impact of thymocyte precursor inflow on thymic output, which can be explained by a limited number of TSP niches in the thymic cortex (36). While age-dependent involution is characterized by a stronger loss of cortex as compared to the medulla, parameters most critical for thymic function were those affecting SP cells, as a more rapid depletion of DP and DN cells resulted in a conditional accumulation of SP cells. The observed inconsistencies of model prediction with experimental data, particularly regarding the relative number of SP cells, can be attributed to the absence of processes in the model required to mechanistically describe other immune cell differentiation (e.g., tTreg) and the process of mature lymphocyte re-entering.
The developed model was used to simulate several clinically relevant scenarios reflective of patho-physiological conditions and specific pharmacological interventions. For example, a condition of early-onset thymus involution, through a setting of low levels of SP cells in the thymus could be implemented in the mechanistic model; such a condition may be linked to chronic autoimmune conditions, e.g. multiple sclerosis. Patients with multiple sclerosis exhibit early-onset of thymus involution, since they feature levels of TREC-containing CD4+ and CD8+ T cells which would be equivalent to those found in 30-year old healthy subjects (59). Another clinically relevant scenario which may be prospectively simulated with the present model relates to chronic treatments using pharmacological immunomodulators such as fingolimod, a small molecule drug which inhibits S1P receptors (60). S1P/S1PR1 signaling is indeed required for thymocytes to emigrate out of the thymus (61). S1P activation of S1PR1 on mature SP cells may allow thymocytes to exit the thymus and enter the circulation. Accordingly, a lack of S1PR1 would result in thymocytes being unable to leave the thymus (61). It has been shown that thymocyte egress is delayed upon fingolimod administration (60, 62).
The performed simulations provided a mechanistic basis for understanding thymic output dynamics and its dependence on age, in cases of healthy subjects, multiple sclerosis patients, and patients on fingolimod treatment. Our predictive simulations showed that thymic output significantly differed between healthy subjects and multiple sclerosis patients, even though these systemic interventions would not affect the slope (rate) of the thymus involution process. One may infer from such simulations results that, upon fingolimod discontinuation, the probability of multiple sclerosis relapse would decrease with age, since thymic output is significantly lower at more advanced ages. Such an inference is actually supported by clinical evidence, whereby patients at younger ages exhibited a higher risk of relapse following fingolimod discontinuation (63, 64). However, it is also important to note that relapse would not occur solely due to a rapid re-entry of lymphocytes into the periphery and the central nervous system; relapse has been observed even under conditions whereby lymphocyte counts remained depressed (65). It is also important to understand the effect of fingolimod treatment duration on the risk of developing severe lymphopenia (54). Our model predictions provided insights into how the duration of fingolimod use may affect thymus function. An average treatment duration of ∼19 years in 20-year old subjects, as defined by the present model, was qualitatively consistent with reports of infections (e.g., cryptococcal meningitis) which may occur after 2-3 years of treatment (54). Indeed, thymus function varies among patients, depending on their individual characteristics, and our simulation results reflected average trends. The next challenge lies in individualizing model-based simulations, based on a subject’s drug pharmacokinetics and transcriptomic and immunophenotypic data.
The proposed mechanistic model of thymocyte dynamics provides a consistent description of T-cell development, in agreement with existing clinical data – yet it also comes with a number of limitations. For example, we used a deterministic approach to quantify and extrapolate thymic function dynamics, in relation to time and age. Therefore, in order to follow the parsimony principle and to avoid overt parameter identifiability issues (66), we simplified the model structure. Specifically, we did not take into account all aspects and all intermediate stages of T-cell development. Another potential limitation is that our model did not consider the development of other immune cells that takes place in the thymus, such as tTreg, and mature re-entering lymphocytes. Although the model allows for the calculation of tTreg numbers in the thymus as a small (1 – 3%) fraction of SP4 cells (50), one of the model limitations is related to the inability to mechanistically describe tTreg development and, consequently, assess the velocity of this process, explore other paths to tTreg differentiation [such as evaluating the contribution of an alternative CD25- progenitor Treg subpopulation (49)], or investigate the impact of autoimmune diseases such as Myasthenia gravis (67). Accounting for the re-entry of mature lymphocytes may represent a priority option for model expansion (35). To address this, the model should incorporate at least one population of peripheral lymphocytes. Moreover, since the ability to re-enter differs between naïve and previously activated T-cells (68), incorporating a dynamic description of peripheral T-cell behavior could be beneficial. Capturing re-entered lymphocytes into distinct subpopulations and providing a more detailed description of the latter stages of thymocyte development may well enhance the model’s accuracy in quantitative predictions and overall performance. However, this would necessitate a more extensive dataset comprising experimental and quantitative data on corresponding cellular dynamics and remains to be systematically addressed in the future.
Nevertheless, the mechanistic model featured here may be used as a basis for further multi-scale modeling of T-cell dynamics. The current version of the model may also be extended to capture scenarios of infections (e.g., HIV) and/or drug- or stress-induced thymus atrophy processes. Such model extensions will provide a tool for further quantitative and mechanistic understanding of thymus function, under various conditions and combinations of homeostatic disruptions.
5 Conclusions
An integrative mechanistic model of thymocyte dynamics in human was developed and validated using multi-scale experimental and clinical data. The model integrated key mechanistic processes of human thymopoiesis, including homeostasis of various thymocyte populations and age-related changes in thymic function. A model-based sensitivity analysis revealed that the SP cell export, differentiation, proliferation and death were the more important processes influencing overall thymic function. Our model-based simulations suggested that the clinically observed decrease in relapse risk with age, in multiple sclerosis patients who would have discontinued fingolimod therapy, can be explained mechanistically by decreased thymic output with age. A quantitative assessment of the relationship between thymic output and duration of fingolimod treatment revealed an average therapy duration of ∼19 years until the development of grade 4 lymphopenia. The model described here may be interrogated to quantitatively explore various scenarios of pharmacological interventions and personalized treatments relevant to drug development. It may also serve as a basis for further mechanistic extensions, including consideration of additional T-cell dynamics regulation processes as well as the impact of infections and drug- or stress-induced thymus atrophy scenarios.
Data availability statement
The original contributions presented in the study are included in the article/Supplementary Material. Further inquiries can be directed to the corresponding author.
Author contributions
VK: Conceptualization, Data curation, Formal analysis, Investigation, Methodology, Validation, Visualization, Writing – original draft, Writing – review & editing. KP: Conceptualization, Methodology, Validation, Funding acquisition, Supervision, Writing – review & editing. GH: Conceptualization, Methodology, Validation, Writing – review & editing. GB: Conceptualization, Methodology, Validation, Supervision, Writing – review & editing.
Funding
The author(s) declare financial support was received for the research, authorship, and/or publication of this article. This work was supported by the Academic leadership program Priority 2030 proposed by the Federal State Autonomous Educational Institution of Higher Education I.M. Sechenov First Moscow State Medical University of the Ministry of Health of the Russian Federation (Sechenov University), the Ministry of Science and Higher Education of the Russian Federation (Agreement 075-10-2021-093, Project MMD-RND-2266) and Modeling & Simulation Decisions FZ - LLC, Dubai, UAE. GB was supported by the Moscow Center of Fundamental and Applied Mathematics (agreement with the Ministry of Education and Science of the Russian Federation No. 075-15-2022-286). VK and KP were supported by the Russian Science Foundation (Grant Number 23-71-10051).
Acknowledgments
We would like to acknowledge the contribution of all our colleagues at M&S Decisions and the MID3 Research Center at Sechenov University for their continuous support. We also would like to thank “the group of mathematical modelling in immunology” (https://immunology.pages.sirius-web.org/) for valuable discussions on various aspects reflected in this work.
Conflict of interest
Author KP is an employee and shareholder of Modeling & Simulation Decisions FZ - LLC. Author GH is an employee of Biorchestra US, Inc.
The remaining authors declare that the research was conducted in the absence of any commercial or financial relationships that could be construed as a potential conflict of interest.
The authors declare that this study received funding from Modeling & Simulation Decisions FZ - LLC. The funder was not involved in the study design, collection, analysis, interpretation of data, the writing of this article or the decision to submit it for publication.
The author(s) declared that they were an editorial board member of Frontiers, at the time of submission. This had no impact on the peer review process and the final decision.
Publisher’s note
All claims expressed in this article are solely those of the authors and do not necessarily represent those of their affiliated organizations, or those of the publisher, the editors and the reviewers. Any product that may be evaluated in this article, or claim that may be made by its manufacturer, is not guaranteed or endorsed by the publisher.
Supplementary material
The Supplementary Material for this article can be found online at: https://www.frontiersin.org/articles/10.3389/fimmu.2024.1321309/full#supplementary-material
References
1. Punt J, Owen JA, Stranford SA, Jones PP. Kuby immunology. Eighth edition. New York: W.H. Freeman/Macmillan Learning (2019). Kuby Janis.
2. Rodewald HR. Thymus organogenesis. Annu Rev Immunol (2008) 26(1):355–88. doi: 10.1146/annurev.immunol.26.021607.090408
3. Haynes BF, Sempowski GD, Wells AF, Hale LP. The human thymus during aging. Immunol Res (2000) 22(2):253–61. doi: 10.1385/IR:22:2-3:253
4. Robert PA, Kunze-Schumacher H, Greiff V, Krueger A. Modeling the dynamics of T-cell development in the thymus. Entropy. (2021) 23(4):437. doi: 10.3390/e23040437
5. Pénit C, Lucas B, Vasseur F. Cell expansion and growth arrest phases during the transition from precursor (CD4-8-) to immature (CD4+8+) thymocytes in normal and genetically modified mice. J Immunol (1995) 154(10):5103–13. doi: 10.4049/jimmunol.154.10.5103
6. Steinmann GG, Klaus B, Müller-Hermelink HK. The involution of the ageing human thymic epithelium is independent of puberty. Scand J Immunol (1985) 22(5):563–75. doi: 10.1111/j.1365-3083.1985.tb01916.x
7. Palmer D. The effect of age on thymic function. Front Immunol (2013) 4:316. doi: 10.3389/fimmu.2013.00316
8. Lynch HE, Goldberg GL, Chidgey A, Van den Brink MRM, Boyd R, Sempowski GD. Thymic involution and immune reconstitution. Trends Immunol (2009) 30(7):366–73. doi: 10.1016/j.it.2009.04.003
9. Chaudhry MS, Velardi E, Dudakov JA, van den Brink MRM. Thymus: the next (re)generation. Immunol Rev (2016) 271(1):56–71. doi: 10.1111/imr.12418
10. Tosi P, Kraft R, Luzi P, Cintorino M, Fankhauser G, Hess MW, et al. Involution patterns of the human thymus. I Size of the cortical area as a function of age. Clin Exp Immunol (1982) 47(2):497–504.
11. Cai AQ, Landman KA, Hughes BD, Witt CM. T cell development in the thymus: From periodic seeding to constant output. J Theor Biol (2007) 249(2):384–94. doi: 10.1016/j.jtbi.2007.07.028
12. Sinclair C, Seddon B. Overlapping and asymmetric functions of TCR signaling during thymic selection of CD4 and CD8 lineages. J Immunol (2014) 192(11):5151–9. doi: 10.4049/jimmunol.1303085
13. Moleriu RD, Zaharie D, Moatar-Moleriu LC, Gruia AT, Mic AA, Mic FA. Insights into the mechanisms of thymus involution and regeneration by modeling the glucocorticoid-induced perturbation of thymocyte populations dynamics. J Theor Biol (2014) 348:80–99. doi: 10.1016/j.jtbi.2014.01.020
14. Sawicka M, Stritesky G, Reynolds J, Abourashchi N, Lythe G, Molina-Paris C, et al. From pre-DP, post-DP, SP4, and SP8 Thymocyte Cell Counts to a Dynamical Model of Cortical and Medullary Selection. Front Immunol (2014) 5:19. doi: 10.3389/fimmu.2014.00019
15. Ye P, Kirschner DE. Reevaluation of T cell receptor excision circles as a measure of human recent thymic emigrants. J Immunol (2002) 168(10):4968–79. doi: 10.4049/jimmunol.168.10.4968
16. Thomas-Vaslin V, Altes HK, de Boer RJ, Klatzmann D. Comprehensive assessment and mathematical modeling of T cell population dynamics and homeostasis1. J Immunol (2008) 180(4):2240–50. doi: 10.4049/jimmunol.180.4.2240
17. Bains I, Antia R, Callard R, Yates AJ. Quantifying the development of the peripheral naive CD4+ T-cell pool in humans. Blood. (2009) 113(22):5480–7. doi: 10.1182/blood-2008-10-184184
18. Bains I, Thiébaut R, Yates AJ, Callard R. Quantifying thymic export: combining models of naive T cell proliferation and TCR excision circle dynamics gives an explicit measure of thymic output. J Immunol (2009) 183(7):4329–36. doi: 10.4049/jimmunol.0900743
19. Zaharie D, Moleriu RD, Mic FA. Modeling the development of the post-natal mouse thymus in the absence of bone marrow progenitors. Sci Rep (2016) 6(1):36159. doi: 10.1038/srep36159
20. EFPIA MID3 Workgroup, Marshall S, Burghaus R, Cosson V, Cheung S, Chenel M, et al. Good practices in model-informed drug discovery and development: practice, application, and documentation. CPT Pharmacomet Syst Pharmacol (2016) 5(3):93–122. doi: 10.1002/psp4.12049
21. Madabushi R, Seo P, Zhao L, Tegenge M, Zhu H. Review: role of model-informed drug development approaches in the lifecycle of drug development and regulatory decision-making. Pharm Res (2022) 39(8):1669–80. doi: 10.1007/s11095-022-03288-w
22. Stein AM, Grupp SA, Levine JE, Laetsch TW, Pulsipher MA, Boyer MW, et al. Tisagenlecleucel model-based cellular kinetic analysis of chimeric antigen receptor–T cells. CPT Pharmacomet Syst Pharmacol (2019) 8(5):285–95. doi: 10.1002/psp4.12388
23. De Boer RJ, Perelson AS. Quantifying T lymphocyte turnover. J Theor Biol (2013) 327:45–87. doi: 10.1016/j.jtbi.2012.12.025
24. Kendall MD, Johnson HR, Singh J. The weight of the human thymus gland at necropsy. J Anat. (1980) 131(3):483–97.
25. Bertho JM, Demarquay C, Moulian N, van der Meeren A, Berrih-Aknin S, Gourmelon P. Phenotypic and immunohistological analyses of the human adult thymus: evidence for an active thymus during adult life. Cell Immunol (1997) 179(1):30–40. doi: 10.1006/cimm.1997.1148
26. Park JE, Botting RA, Domínguez Conde C, Popescu DM, Lavaert M, Kunz DJ, et al. A cell atlas of human thymic development defines T cell repertoire formation. Science (2020) 367(6480):eaay3224. doi: 10.1126/science.aay3224
27. Varas A, Jiménez E, Sacedón R, Rodríguez-Mahou M, Maroto E, Zapata AG, et al. Analysis of the human neonatal thymus: evidence for a transient thymic involution1. J Immunol (2000) 164(12):6260–7. doi: 10.4049/jimmunol.164.12.6260
28. Lavaert M, Valcke B, Vandekerckhove B, Leclercq G, Liang KL, Taghon T. Conventional and computational flow cytometry analyses reveal sustained human intrathymic T cell development from birth until puberty. Front Immunol (2020) 11:1659. doi: 10.3389/fimmu.2020.01659
29. Fujii Y, Okumura M, Yamamoto S. Flow cytometric study of lymphocytes associated with thymoma and other thymic tumors. J Surg Res (1999) 82(2):312–8. doi: 10.1006/jsre.1998.5547
30. Takeuchi Y, Fujii Y, Okumura M, Inada K, Nakahara K, Matsuda H. Characterization of CD4+ Single positive cells that lack CD3 in the human thymus. Cell Immunol (1993) 151(2):481–90. doi: 10.1006/cimm.1993.1257
31. Weerkamp F, de Haas EFE, Naber BAE, Comans-Bitter WM, Bogers AJJC, van Dongen JJM, et al. Age-related changes in the cellular composition of the thymus in children. J Allergy Clin Immunol (2005) 115(4):834–40. doi: 10.1016/j.jaci.2004.10.031
32. Jamieson BD, Douek DC, Killian S, Hultin LE, Scripture-Adams DD, Giorgi JV, et al. Generation of functional thymocytes in the human adult. Immunity. (1999) 10(5):569–75. doi: 10.1016/S1074-7613(00)80056-4
33. Ferrando-Martínez S, Ruiz-Mateos E, Hernández A, Gutiérrez E, Rodríguez-Méndez M del M, Ordoñez A, et al. Age-related deregulation of naive T cell homeostasis in elderly humans. AGE. (2011) 33(2):197–207. doi: 10.1007/s11357-010-9170-8
34. Sempowski GD, Hale LP, Sundy JS, Massey JM, Koup RA, Douek DC, et al. Leukemia inhibitory factor, oncostatin M, IL-6, and stem cell factor mRNA expression in human thymus increases with age and is associated with thymic atrophy1. J Immunol (2000) 164(4):2180–7. doi: 10.4049/jimmunol.164.4.2180
35. Flores KG, Li J, Sempowski GD, Haynes BF, Hale LP. Analysis of the human thymic perivascular space during aging. J Clin Invest. (1999) 104(8):1031–9. doi: 10.1172/JCI7558
36. Krueger A, Ziętara N, Łyszkiewicz M. T cell development by the numbers. Trends Immunol (2017) 38(2):128–39. doi: 10.1016/j.it.2016.10.007
37. Krueger A. Thymus colonization: who, how, how many? Arch Immunol Ther Exp (Warsz) (2018) 66(2):81–8. doi: 10.1007/s00005-017-0503-5
39. Egerton M, Scollay R, Shortman K. Kinetics of mature T-cell development in the thymus. Proc Natl Acad Sci (1990) 87(7):2579–82. doi: 10.1073/pnas.87.7.2579
40. Rangarajan A, Weinberg RA. Comparative biology of mouse versus human cells: modelling human cancer in mice. Nat Rev Cancer. (2003) 3(12):952–9. doi: 10.1038/nrc1235
41. Cosgrove J, Hustin LSP, de Boer RJ, Perié L. Hematopoiesis in numbers. Trends Immunol (2021) 42(12):1100–12. doi: 10.1016/j.it.2021.10.006
42. Egerton M, Shortman K, Scollay R. The kinetics of immature murine thymocyte development in vivo. Int Immunol (1990) 2(6):501–7. doi: 10.1093/intimm/2.6.501
43. Hsu HC, Zhang HG, Li L, Yi N, Yang PA, Wu Q, et al. Age-related thymic involution in C57BL/6J × DBA/2J recombinant-inbred mice maps to mouse chromosomes 9 and 10. Genes Immun (2003) 4(6):402–10. doi: 10.1038/sj.gene.6363982
44. McCaughtry TM, Wilken MS, Hogquist KA. Thymic emigration revisited. J Exp Med (2007) 204(11):2513–20. doi: 10.1084/jem.20070601
45. Yates A. Theories and quantification of thymic selection. Front Immunol (2014) 5:13. doi: 10.3389/fimmu.2014.00013
46. Li Y, Li K, Zhu L, Li B, Zong D, Cai P, et al. Development of double-positive thymocytes at single-cell resolution. Genome Med (2021) 13(1):49. doi: 10.1186/s13073-021-00861-7
47. Allen R, Rieger T, Musante C. Efficient generation and selection of virtual populations in quantitative systems pharmacology models. CPT Pharmacomet Syst Pharmacol (2016) 5(3):140–6. doi: 10.1002/psp4.12063
48. Marino S, Hogue IB, Ray CJ, Kirschner DE. A methodology for performing global uncertainty and sensitivity analysis in systems biology. J Theor Biol (2008) 254(1):178–96. doi: 10.1016/j.jtbi.2008.04.011
49. Owen DL, Sjaastad LE, Farrar MA. Regulatory T cell development in the thymus. J Immunol (2019) 203(8):2031–41. doi: 10.4049/jimmunol.1900662
50. Santamaria JC, Borelli A, Irla M. Regulatory T cell heterogeneity in the thymus: impact on their functional activities. Front Immunol (2021) 12:643153. doi: 10.3389/fimmu.2021.643153
51. Dijke IE, Hoeppli RE, Ellis T, Pearcey J, Huang Q, McMurchy AN, et al. Discarded human thymus is a novel source of stable and long-lived therapeutic regulatory T cells. Am J Transplant. (2016) 16(1):58–71. doi: 10.1111/ajt.13456
52. Chiarini M, Sottini A, Bertoli D, Serana F, Caimi L, Rasia S, et al. Newly produced T and B lymphocytes and T-cell receptor repertoire diversity are reduced in peripheral blood of fingolimod-treated multiple sclerosis patients. Mult Scler J (2015) 21(6):726–34. doi: 10.1177/1352458514551456
53. Schweitzer F, Laurent S, Fink GR, Barnett MH, Hartung HP, Warnke C. Effects of disease-modifying therapy on peripheral leukocytes in patients with multiple sclerosis. J Neurol (2021) 268(7):2379–89. doi: 10.1007/s00415-019-09690-6
54. EMA. Gilenya—product information. Available at: https://www.ema.europa.eu/en/documents/product-information/gilenya-epar-product-information_en.pdf.
55. Common Terminology Criteria for Adverse Events (CTCAE) v5.0. Available at: https://ctep.cancer.gov/protocolDevelopment/electronic_applications/docs/CTCAE_v5_Quick_Reference_8.5x11.pdf.
56. Starr C, Taggart R. Biology: the unity and diversity of life. In: Books in the Brooks/Cole biology series. Belmont, CA: Wadsworth Publishing Company (1998). Available at: https://books.google.ru/books?id=t7IXAQAAMAAJ.
57. Ganusov VV, De Boer RJ. Do most lymphocytes in humans really reside in the gut? Trends Immunol (2007) 28(12):514–8. doi: 10.1016/j.it.2007.08.009
58. Bai JPF, Schmidt BJ, Gadkar KG, Damian V, Earp JC, Friedrich C, et al. FDA-Industry Scientific Exchange on assessing quantitative systems pharmacology models in clinical drug development: a meeting report, summary of challenges/gaps, and future perspective. AAPS J (2021) 23(3):60. doi: 10.1208/s12248-021-00585-x
59. Hug A, Korporal M, Schröder I, Haas J, Glatz K, Storch-Hagenlocher B, et al. Thymic export function and T cell homeostasis in patients with relapsing remitting multiple sclerosis1. J Immunol (2003) 171(1):432–7. doi: 10.4049/jimmunol.171.1.432
60. Brinkmann V. FTY720 (fingolimod) in Multiple Sclerosis: therapeutic effects in the immune and the central nervous system. Br J Pharmacol (2009) 158(5):1173–82. doi: 10.1111/j.1476-5381.2009.00451.x
61. Matloubian M, Lo CG, Cinamon G, Lesneski MJ, Xu Y, Brinkmann V, et al. Lymphocyte egress from thymus and peripheral lymphoid organs is dependent on S1P receptor 1. Nature. (2004) 427(6972):355–60. doi: 10.1038/nature02284
62. Metzler B, Gfeller P, Wieczorek G, Li J, Nuesslein-Hildesheim B, Katopodis A, et al. Modulation of T cell homeostasis and alloreactivity under continuous FTY720 exposure. Int Immunol (2008) 20(5):633–44. doi: 10.1093/intimm/dxn023
63. Framke E, Pontieri L, Bramow S, Sellebjerg F, Magyari M. Rebound of clinical disease activity after fingolimod discontinuation? A nationwide cohort study of patients in Denmark. J Neurol Neurosurg Amp Psychiatry (2022) 93(12):1317. doi: 10.1136/jnnp-2022-329607
64. Goncuoglu C, Tuncer A, Bayraktar-Ekincioglu A, Ayvacioglu Cagan C, Acar-Ozen P, Cakan M, et al. Factors associated with fingolimod rebound: A single center real-life experience. Mult Scler Relat Disord (2021) 56, 103278. doi: 10.1016/j.msard.2021.103278
65. Barry B, Erwin AA, Stevens J, Tornatore C. Fingolimod rebound: A review of the clinical experience and management considerations. Neurol Ther (2019) 8(2):241–50. doi: 10.1007/s40120-019-00160-9
66. Domingos P. The role of occam’s razor in knowledge discovery. Data Min Knowl Discov (1999) 3(4):409–25. doi: 10.1023/A:1009868929893
67. Gradolatto A, Nazzal D, Truffault F, Bismuth J, Fadel E, Foti M, et al. Both Treg cells and Tconv cells are defective in the Myasthenia gravis thymus: Roles of IL-17 and TNF-α. Myasthenia Gravis Compr Rev (2014) 52:53–63. doi: 10.1016/j.jaut.2013.12.015
Keywords: immune system, thymus, thymopoiesis, thymic involution, mechanistic model
Citation: Kulesh V, Peskov K, Helmlinger G and Bocharov G (2024) An integrative mechanistic model of thymocyte dynamics. Front. Immunol. 15:1321309. doi: 10.3389/fimmu.2024.1321309
Received: 06 November 2023; Accepted: 29 January 2024;
Published: 26 February 2024.
Edited by:
Geraldo Aleixo Passos, University of São Paulo, BrazilReviewed by:
Ana Rosa Pérez, National Scientific and Technical Research Council (CONICET), ArgentinaMaria Danielma dos Santos Reis, Universidade Federal de Alagoas, Brazil
Copyright © 2024 Kulesh, Peskov, Helmlinger and Bocharov. This is an open-access article distributed under the terms of the Creative Commons Attribution License (CC BY). The use, distribution or reproduction in other forums is permitted, provided the original author(s) and the copyright owner(s) are credited and that the original publication in this journal is cited, in accordance with accepted academic practice. No use, distribution or reproduction is permitted which does not comply with these terms.
*Correspondence: Victoria Kulesh, dmlrdG9yaWFhbjM3QGdtYWlsLmNvbQ==