 Joseph A. Pereira1,2,3‡
 Zachary Lanzar1‡
 Joseph T. Clark1‡
 Andrew P. Hart4‡Bonnie B. Douglas1‡
 Lindsey Shallberg1‡Keenan O’Dea1‡David A. Christian1‡
 Christopher A. Hunter1*‡
- 1Department of Pathobiology, University of Pennsylvania, Philadelphia, PA, United States
- 2Department of Immunology, Blavatnik Institute, Harvard Medical School, Boston, MA, United States
- 3Department of Medical Oncology, Dana-Farber Cancer Institute, Boston, MA, United States
- 4Department of Medicine, University of Pennsylvania, Philadelphia, PA, United States
At homeostasis, a substantial proportion of Foxp3+ T regulatory cells (Tregs) have an activated phenotype associated with enhanced TCR signals and these effector Treg cells (eTregs) co-express elevated levels of PD-1 and CTLA-4. Short term in vivo blockade of the PD-1 or CTLA-4 pathways results in increased eTreg populations, while combination blockade of both pathways had an additive effect. Mechanistically, combination blockade resulted in a reduction of suppressive phospho-SHP2 Y580 in eTreg cells which was associated with increased proliferation, enhanced production of IL-10, and reduced dendritic cell and macrophage expression of CD80 and MHC-II. Thus, at homeostasis, PD-1 and CTLA-4 function additively to regulate eTreg function and the ability to target these pathways in Treg cells may be useful to modulate inflammation.
Introduction
At homeostasis, Foxp3+ regulatory T cells (Treg) (1), have a critical role in prevention of auto-immunity and can limit the intensity and duration of inflammatory responses (2–4), Treg cells can originate from the thymus (nTreg), or naïve CD4+ T cells that receive TCR stimulation combined with signals from transforming growth factor beta (TGFβ) and IL-2 can lead to Foxp3 expression and the formation of induced Treg cells (iTreg) (5, 6). Treg cells differ from conventional CD4+ and CD8+ T cells (Tconv), in that the majority of them have a TCR that recognizes self-antigens and are specialized to preserve tolerance (7–9). It is now appreciated that Treg cells require ongoing TCR activation and costimulation to retain Foxp3 expression, suppressive capacity (10), and survival (11–13). This is illustrated by the spontaneous immunopathology in experimental models when Treg cells are absent (14–17). The clinical relevance of Treg cell mediated control of adaptive responses is illustrated by X-linked immunodysregulation polyendocrinopathy and enteropathy (IPEX). In these patients, the Foxp3 gene is mutated and has an impaired ability to drive Treg formation, resulting in autoimmune diseases such as neonatal type 1 diabetes, hemolytic anemia, eosinophilia, and hyper IgE production (18).
Given the role of Treg cells in limiting immune responses there is considerable interest in promoting their activities to limit inflammation while the ability to antagonize Treg cells is one approach to augment anti-tumor responses (19–21). There is considerable heterogeneity in Treg cell populations associated with development (iTreg versus nTreg), activation status and their responses to inflammation (22, 23). This is illustrated by the description of central Treg (cTreg) and effector Treg cells (11, 22) (eTreg) as distinct populations defined based on activation status (11). There is emerging evidence that the relative ratio of effector Tconv cells: Treg cells is an important determinant for the outcome of immunotherapy in cancer (24). However, too many Treg cells can be deleterious and lead to reduced effector responses in the context of infection or cancer (21, 25). Consequently, there need to be processes to balance Treg cell activities and IL-2 availability is one mechanism involved in modulation of the Treg cell pool (26, 27). There is also evidence that the inhibitory receptors PD-1 (28, 29) and CTLA-4 (20) restrict Treg cell activities in the setting of cancer, autoimmunity and infection (20, 21, 29).
PD-1 and CTLA-4 are expressed by activated T cells and most studies on these pathways have focused on their impact on effector responses which has formed the basis for checkpoint blockade in cancer. In this context, there is evidence that PD-1 and CTLA-4 act in cis and engage SHP2 phosphatases (30–33) which antagonize TCR signals (34–36), and thus blunt the response of effector T cells (37). In addition, the ability of the extracellular domain of CTLA-4 to sequester CD80/86 provides an additional trans mechanism to limit professional antigen presenting cell (APC) function required for optimal effector T cell activities (34). A subset of Treg cells also express these receptors (21, 29), and several reports have highlighted that effector Treg(eTreg) cells express the highest levels of PD-1 and CTLA-4 (28, 29). It appears that while eTreg cells receive continuous TCR signals, constitutive signals through PD-1 constrain the size of the eTreg cell pool (28, 29). In contrast to PD-1, Treg cell expression of CTLA-4 provides an effector mechanism that can limit autoimmune inflammation, but total loss of CTLA-4 results in enhanced Treg cell populations (38, 39) and lineage specific deletion of CTLA-4 in Treg cells results in enhanced Treg cell activities in models of autoimmunity (20). Interestingly, while CTLA-4 is a relevant target to enhance effector responses during cancer in some tumor models (33, 40), blockade of CTLA-4 results in enhanced costimulatory signals and hyperproliferation of Treg cells which drove increased immune tolerance (41).
Since a subpopulation of Treg cells co-express PD-1 and CTLA-4 (21, 29), the finding that even short-term blockade of PD-L1 result in increased eTreg cell population at homeostasis raises questions about the relationship between the PD-1 and CTLA-4 pathways. For example, it is unclear if these pathways are both constitutively active, act together or separately or are functionally redundant at stasis and whether mitigation of these checkpoint proteins would impact the ratio of cTreg: eTreg cell populations. The studies presented here reveal at homeostasis that the combined blockade of PD-1 and CTLA-4 have an additive effect on expansion of eTreg cell populations associated with reduced APC function. Thus, PD-1 and CTLA-4 have distinct but complementary roles in the tonic regulation of Treg cell homeostasis.
Materials and methods
Mice
All mice used were housed in the University of Pennsylvania Department of Pathobiology vivarium with 12 hour light and dark cycles, maintained at temperature ranges of 68°F - 77°F and humidity ranges from 35% - 55% humidity in accordance with institutional guidelines. C57BL/6 mice were purchased from Taconic (Rensselaer, NY, USA) at 6 weeks of age and housed in the University of Pennsylvania Department of Pathobiology vivarium for 2 – 4 weeks until used.
Ethical oversight of all animal use in this study was approved by the University of Pennsylvania Institutional Animal Care and Use Committee.
Homeostatic in vivo combination checkpoint blockade
In vivo blockade antibodies: Details of antibodies and reagents in blockade can be found in Supplementary Table 1.
Inhibition of PD-1/PD-L1 signaling was performed by intraperitoneal injection of 1mg/dose of αPD-L1 (clone: 10F.9G2, BioXcell) supplemented with 500μg/dose of polyclonal hamster IgG isotype (clone: polyclonal Armenian hamster, BioXcell). Inhibition of CTLA-4 signaling was performed by intraperitoneal injection of 500μg/dose of αCTLA-4 (clone: UC10-4F10-11, BioXcell) supplemented with 1mg/dose of IgG2b isotype (clone: LTF-2, BioXcell) while control mice were treated with 1mg/dose IgG2b isotype supplemented with 500μg/dose of polyclonal hamster IgG isotype. Mice were sacrificed 72 hours following treatment and splenocytes were analyzed via flow cytometry.
Vaccine-induced immune responses during checkpoint blockade
8-week-old C57BL/6 mice were treated with either αPD-L1, αCTLA-4, combination αPD-L1 and αCTLA-4, or combination isotype antibody mixes (same dosages/combinations/antibody clones used in the homeostatic blockade above). After 72 hours, congenically labeled CD45.1+ OTI cells were isolated from healthy donor spleen using an Easysep Mouse CD8+ T cell isolation kit (19853, STEMCELL Technologies). 5,000 OTI cells were injected intraperitoneally into the antibody-blockade treated hosts. After 24 hours following the transfer of OTI cells, we intraperitoneally vaccinated these mice with 200,000 tachyzoites of a non-replicating vaccination-strain of T. gondii that expresses OVA (CPS-OVA). Previous studies have shown that CPS alone does not lead to activation of OTI or P14 TCR transgenic CD8+ T cells, and expression of OVA is essential for activation and expansion of the OTI T cells (42). At 24 hours after vaccination, we re-dosed these groups of mice with the original blocking antibody they had previously received to maintain the blockade treatment. At 7 days post-vaccination, the spleen, peritoneal exudate cells (PEC), and draining lymph nodes (mediastinal LN) were analyzed via flow-cytometry to assess the impact of blockade on the formation of an OTI response, endogenous responses to the parasite itself, and the phenotypes of the Tregs in these tissues.
Tacrolimus treatment
FK506 (F4679-5MG, Sigma-Aldrich, MO, USA) was reconstituted in DMSO to 25mg/ml, and then the reconstituted stock was diluted in 1xDPBS to achieve a working concentration of 2.5mg/ml. 8-week-old C57BL/6 mice were subcutaneously injected with 50µl of FK506 at 2.5mg/ml to deliver 125µg of FK506 per dose daily of either FK506 or PBS vehicle control every 24 hours over a 96 hour period. Following 96 hours of treatment, splenocytes were then harvested and analyzed via flow cytometry.
Isolation of tissues for analysis
Tissue Preparation: Single cell suspensions were prepared from spleen for flow cytometry analysis. Spleens were mechanically processed and passed through a 70µm nylon filter and then lysed in 1ml of 0.846% solution of NH4Cl for red blood cell lysis. The cells were then washed in cRPMI and stored on ice.
Analysis by flow cytometry
Staining antibodies and staining reagents: Antibody, viability dye, Fc block, dilutions, and buffer reagent details can be found on Supplemental Table 1.
T cell staining: Aliquots consisting of 5e6 cells were washed with ice cold 1xDPBS in a 96 well round bottom plate, then incubated in in 50µl volume of viability stain reconstituted in 1xDPBS for 20 minutes on ice and then washed in 0.2% FACS buffer. The cells were then incubated in 50µl volume of Fc block for 30 minutes on ice. In the event of vaccination, the cells were washed in 0.2% FACS buffer and then stained with in 50µl volume of 0.2% FACS buffer supplemented with tetramer loaded with the parasite-specific peptide AS15 (43) for 30 minutes on ice, in non-vaccination studies this step was skipped. The cells were washed in 0.2% FACS buffer, and then incubated for 30 minutes on ice in 50µl volume of antibody cocktail composed of surface-stain antibodies in 0.2% FACS buffer supplemented with brilliant stain buffer (Supplemental Table 1). The cells were washed in 0.2% FACS buffer and re-suspended in 100µl Foxp3 Perm-fix cocktail (00-5523-00, Thermo Fisher Scientific) for 4 hours at 4°C. The cells were then washed twice in 1X permeabilization buffer, and then re-suspended in an intracellular staining cocktail composed of intracellular-stain antibodies diluted in 1x permeabilization buffer supplemented with normal goat serum of for 2 hours at 4°C. The cells were then washed with 1x permeabilization buffer twice, and then resuspended in 50µl of Goat α-Rabbit detection antibody diluted in 1X permeabilization buffer for 2 hours at 4°C. The cells were washed in 1x permeabilization buffer and resuspended in 500µl 0.2% FACS buffer for flow cytometric analysis.
Cytokine staining: To detect intracellular cytokines on T cells, cells were re-suspended in a 1X dilution of Cell Stimulation Cocktail Plus Protein Transport Inhibitors (Invitrogen, #00-4975-93, CA) in cRPMI for 2 hours at 37°C and 5% CO2. Cells were then washed, surface stained, and permeabilized as described above in the T cell panel. The cytokine stain prepped cells were then intracellularly stained with a cytokine detection panel for 2 hours on ice. The cells were washed and then resuspended in 500µl 0.2% FACS buffer for analysis.
Myeloid staining:Aliquots of 5e6 cells were washed in ice cold 0.2% FACS buffer in a 96 well and then viability stained and Fc-blocked as described in the T cell panel. The cells were surface stained in 50µl of antibody cocktail consisting diluted in 0.2% FACS buffer supplemented with brilliant stain buffer on ice for 30 minutes. The cells were washed and fixed in with 2% PFA (15710-S, Electron Microscopy Sciences) diluted in 0.2% FACS buffer for 15 minutes at room temperature. The cells were then washed and then re-suspended in 500µl 0.2% FACS buffer for analysis.
Phos-flow: Splenocyte-derived CD4+ T cells were isolated using Easysep Mouse CD4+ T cell isolation kit (19852, STEMCELL Technologies), and then 2e5 cells/well were plated in a 96 well plate, and viability stained as described above using sterile 1xDPBS. Cells were blocked for PD-1, CTLA-4, or combination of PD-1 and CTLA-4 using anti-PD-1 (clone: RMP1-14, BioXcell), anti-CTLA-4 (clone: UC10-4F10-11, BioXcell) or isotype control antibodies (clone: 2A3, BioXcell, and clone: polyclonal Armenian hamster IgG, BioXcell). The cells were blocked in 100µl of PD-1/CTLA-4 blocking cocktails in sterile MACS buffer (2% FCS, 2mM EDTA, in 1xDPBS) at a concentration of 10µg/ml of antibody on ice for 20 minutes. The cells were washed with sterile MACS and were then resuspended in 100µl sterile RPMI containing 0.5% BSA, and then transferred to a 96 well plate that had been coated overnight at 4°C with 5µg/ml αCD3 (BE0001-1, BioXcell), 5µg/ml CD80-Fc (555404, Biolegend), and 2µg/ml PD-L1-Fc (758206, Biolegend). The cells were either incubated at 37°C for 30 minutes or one hour, and then mixed with 100µl of 5% PFA (15710-S, Electron Microscopy Sciences) diluted in ice cold 1xDPBS and incubated on ice for 20 minutes (direct exvivo phos-flow assessments were directly fixed without incubation). The cells were washed 2x in 1xDPBS, and permeabilized in 100µl Foxp3 Perm-fix cocktail (00-5523-00, Thermo Fisher Scientific) for 2 hours, and then washed as described above. The cells were re-suspended in an intracellular staining cocktail composed of intracellular-stain antibodies diluted in 1x permeabilization buffer for 2 hours at 4°C. The cells were washed twice in 1x permeabilization buffer and resuspended in 0.2% FACS buffer for flow cytometric analysis.
Data acquisition: The cells were analyzed on a FACS Symphony A5 (BD Biosciences) using BD FACSDiva v9.0 (BD Biosciences) and analysis was performed with FlowJo (10.8.1, BD biosciences).
Statistics: Statistical analysis was performed using Prism 9 for Windows (version 9.2.0). For comparison of means between two groups, either a two-tailed unpaired, or paired student’s t test was utilized with a 95% CI depending on separate treatment groups or treatments within groups. Analysis for univariate statistics comparing multiple means was performed using a one-way ANOVA (family-wise significance and confidence level of 95% CI), with post-hoc analysis consisting of Fisher’s LSD test for direct comparison of two means within the ANOVA, or Tukey’s multiple comparisons test for comparisons of all means within the test group for multiple-comparison correction. For multi-group multivariate analysis, a two-way ANOVA with post-hoc analysis utilizing Sidak’s multiple comparisons test for comparisons across two groups with two variables, or Tukey’s multiple comparisons test for comparisons across multiple groups for multiple variables (also with a 95% CI). Probability for p values <0.05 or lower were considered statistically significant. All error bars in the figures indicate standard error of the mean (SEM).
UMAP analysis: Uniform Manifold Approximation and Projection for Dimension Reduction (UMAP) analysis was performed using the UMAP plug-in using the Euclidean distance function with a nearest neighbor score of 20, and a minimum distance rating of 0.5 (version: 1802.03426, 2018, ©2017, Leland McInness) for Flowjo (Version 10.8.1). All stained parameters were included in UMAP analysis except for: Live Dead (gated out), CD4 (pre-gated), PD-L1 and CTLA-4 (avoiding grouping bias), Foxp3 (avoiding grouping bias or already pre-gated). The heatmap overlay figures for UMAP analysis presented are based on median fluorescence of each labeled stain in each figure and generated within Flowjo (Version 10.8.1).
Data availability statement: The data that support the findings of this study are available on request from the corresponding author C.A. Hunter.
Results
Preferential expression of PD-1 and CTLA-4 by eTreg cells
To compare the relative activation state of CD8+ T cells, CD4+ Foxp3- T cells (Tconv) and CD4+ Foxp3+ cells (Tregs) at homeostasis, the levels of CD69, CD11a, and CD44 (markers associated with TCR activation) were assessed. Treg cells had highest expression of CD69, CD11a, and CD44 (Figure 1A; Supplemental Figure 1A), and the highest proportion of CD11ahi CD44hi cells (Figure 1B). Likewise, Treg cells also had the largest proportion of Ki67+ and cMyc+ cells, two markers associated with proliferation (44, 45) (Figure 1C). These markers of activation and proliferation correlated with the preferential co-expression of PD-1 and CTLA-4 by Treg cells compared to non-Treg T cells (Figure 1D). Next, Treg cells were divided into PD-1- CTLA-4low and PD-1+ CTLA-4hi Treg cells (Supplemental Figure 1B), that correlate with cTreg and eTreg subsets (11, 29) respectively. Based on this division, eTreg cells had significantly greater expression of CD69, CD11a, CD44, and Helios (Figure 2A) and the eTreg subset was enriched for cells that co-expressed elevated levels of CD11a and CD44 (Figure 2B), Ki67 and cMyc (Figure 2C). In addition, this eTreg subset had an increased ability to produce IL-10 (Figure 2D). We also noted that the proportion of these proliferative eTreg cells increased with age and could be as high as 40% of the Treg cells in older mice (Supplemental Figure 1C).
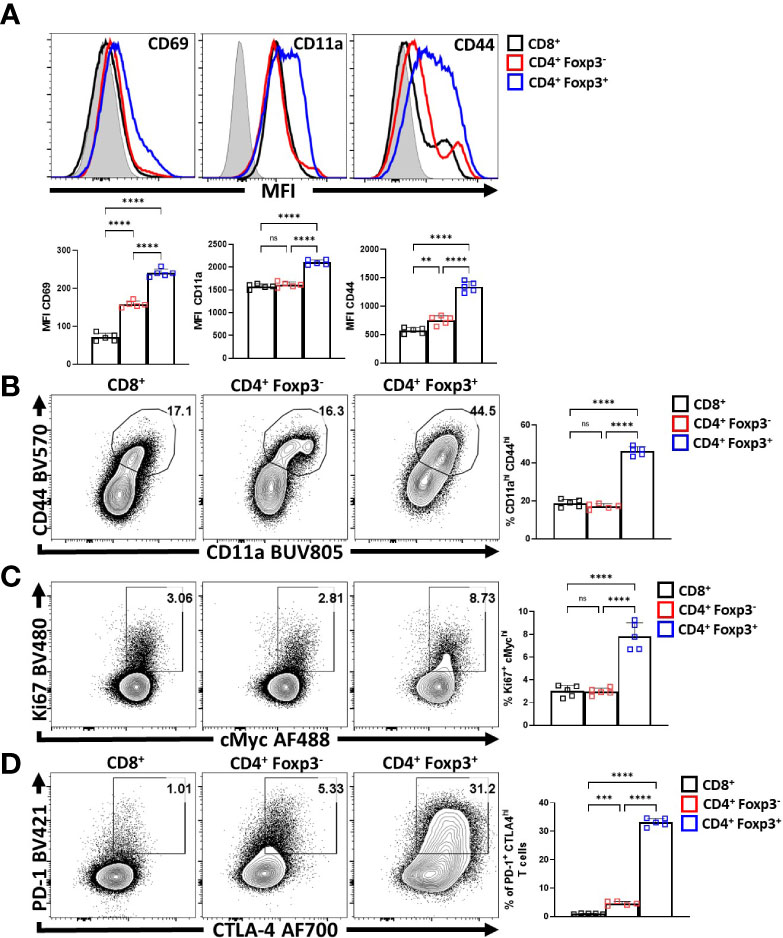
Figure 1 Treg cells are the most active and proliferative T cells at homeostasis, yet express PD-1 and CTLA-4. Splenocytes from naïve 8-week old male C57BL/6 mice were analyzed via high-parameter flow cytometry to compare the expression of activation, proliferation, and PD-1/CTLA-4 proteins CD8+, CD4+ Foxp3- (CD4 Tconv), and CD4+ Foxp3+ (Treg) cells for the following figures. (A) Histogram comparisons of gMFI of CD69, CD11a, and CD44 expression between the CD8/CD4+ Tconv and Treg compartments (n = 5/group, 1-way ANOVA with Tukey’s multiple comparisons test, **p < 0.01, ****p < 0.0001, 4 experimental replicates). (B) Flow plots of ex-vivo CD11a and CD44 staining comparing the proportion of CD11ahi CD44hi cells within each subset (n = 5/group, 1-way ANOVA with Tukey’s multiple comparisons test, ****p < 0.001, 4 experimental replicates). (C) Plots of depicting comparisons of the proportion of Ki67+ cMychi cells across these subsets (n = 5/group, 1-way ANOVA with Tukey’s multiple comparisons test, ****p < 0.0001, 4 experimental replicates). (D) Plots demonstrating proportions of PD-1+ and CTLA-4hi cells between the Tconv and Treg compartments (n = 5/group, 1-way ANOVA with Tukey’s multiple comparisons test, ***p < 0.001, ****p < 0.0001, 4 experimental replicates). All data presented are means +/- SD and show individual data points. ns, not significant.
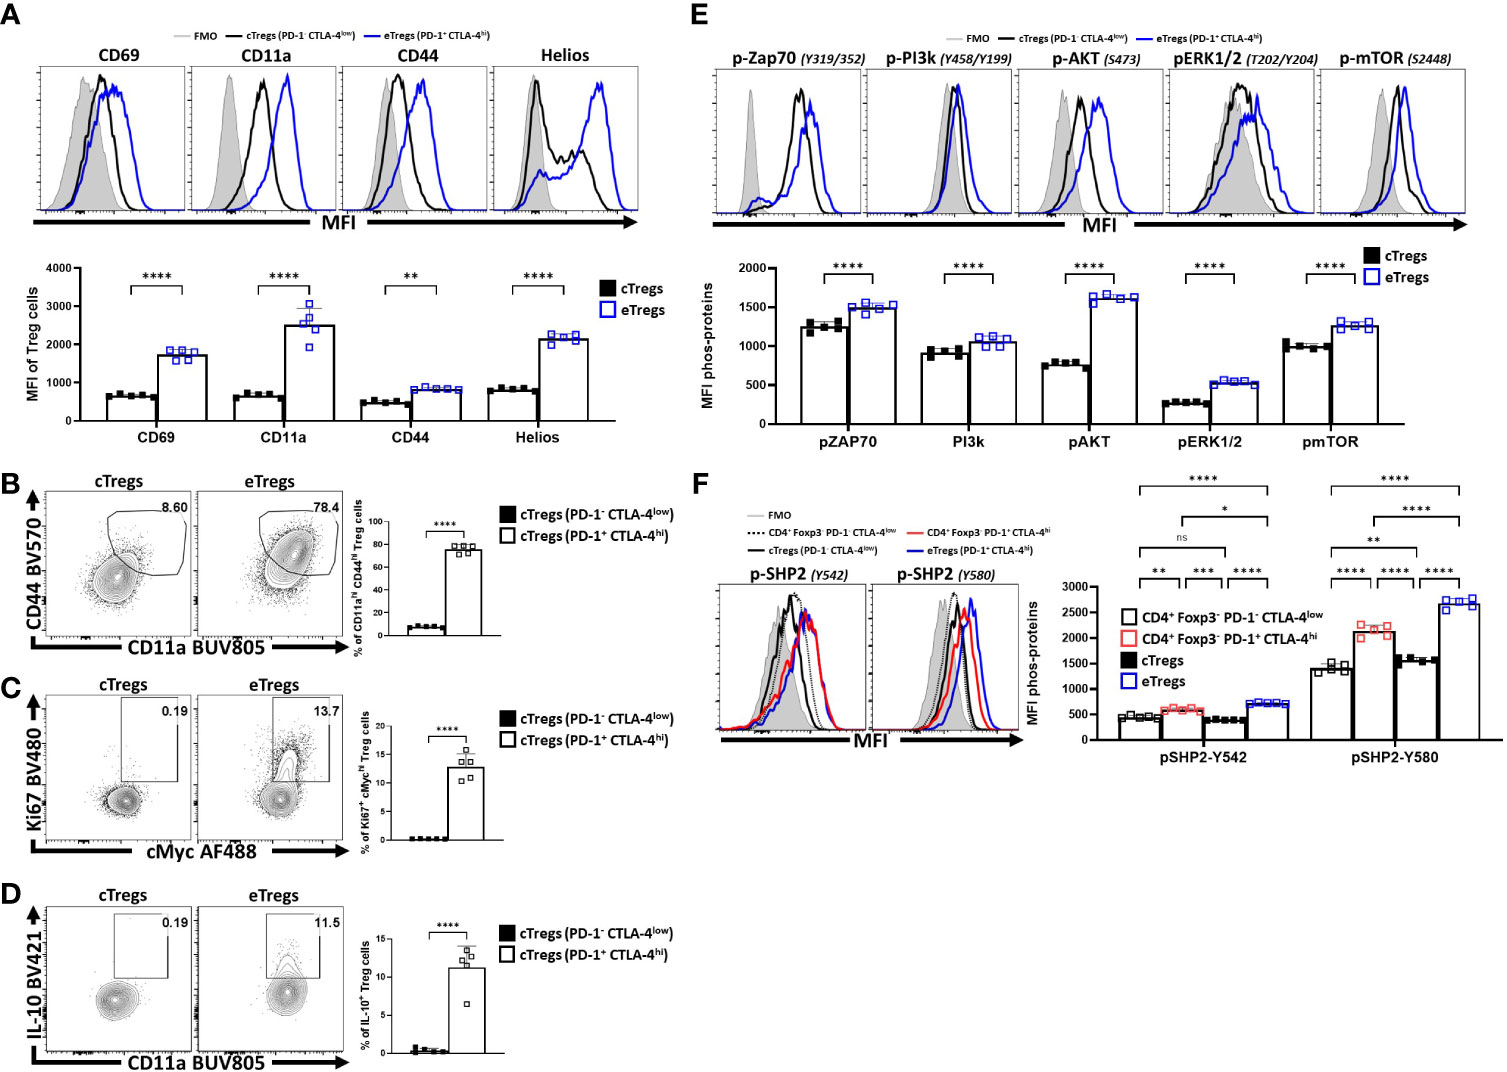
Figure 2 PD-1+ CTLA-4+ eTreg cells express Helios and have activated Treg effector phenotypes compared to PD-1- CTLA-4- cTreg cells. Splenocytes from naïve 8-week old male C57BL/6 mice were analyzed via high-parameter flow cytometry and then pre-gated (Supplemental Figure 1B) on PD-1+ CTLA-4hi (eTreg) vs PD-1- CTLA-4low (cTreg) subsets. Phenotypes were compared between the c/eTreg subsets based on the expression of proteins associated with activation, proliferation, and IL-10 production. Additionally, TCR-downstream phosphorylation potential in response to activation between Treg subsets was also evaluated. (A) Comparative histograms of CD69, CD11a, CD44, and Helios between eTreg and cTreg subsets demonstrating greater expression of activation associated proteins and Helios on eTreg cells (n = 5/group, 2-way ANOVA with Sidak’s multiple comparisons test, **p < 0.01, ****p < 0.0001, 4 experimental replicates). (B) Ex-vivo flow-plots comparing the proportion of CD44hi CD11ahi populations and Ki67+ cMychi populations (C), between cTreg and eTreg subsets (n = 5/group, two-tailed unpaired student’s t-test, ****p < 0.0001 4 experimental replicates). (D) Flow plots following PMA/Ionomycin stim comparing the proportion of IL-10+ CD11ahi cells between cTreg and eTreg subsets (n = 5/group, two-tailed unpaired student’s t-test, ****p < 0.0001 4 experimental replicates). (E) Histogram comparisons of gMFI of p-ZAP70, p-AKT, pERK1/2, and p-mTOR of cTreg and eTreg cells exvivo, demonstrating a greater magnitude of phospho-protein presence in eTreg cells comparatively (n = 5/group, 2-way ANOVA with Sidak’s multiple comparisons test, ****p < 0.0001, 2 experimental replicates). (F) Histogram comparisons of gMFI of p-SHP2 for Y580 and Y542 residues exvivo on PD-1+ CTLA-4hi and PD-1- CTLA-4low CD4+ Tconv subsets, in addition to cTreg, and eTreg cells (n = 5/group, 2-way ANOVA with Tukey’s multiple comparisons test, *p < 0.05, **p < 0.01, ***p < 0.001, ****p < 0.0001, 2 experimental replicates). All data presented are means +/- SD and show individual data points.
Next, eTreg and cTreg cells, directly isolated from spleens, without any additional TCR activation, were stained for phosphorylation of TCR-associated proteins (ZAP70, PI3k, AKT, ERK1/2, and mTOR) and the SHP2 tyrosine sites Y542 and Y580, [of which Y542 can dephosphorylate Y580 - the active tyrosine site associated with inhibition of TCR signals (32, 46)]. As expected, in this setting, cTreg cells had minimal signs of TCR activity when compared to eTreg cells (Figure 2E). Regarding SHP2-Y542 and SHP2-Y580, comparisons of phospho-protein were made between PD-1+ CTLA-4hi and PD-1- CTLA-4low subsets for both the CD4+ Tconv (Foxp3-) and Treg (Foxp3+) T cell populations (Figure 2F). For this analysis, the lowest levels of pY542 and pY580 were detected in cTreg and naïve Tconv cells whereas eTreg cells had the highest levels of pY542 and pY580 SHP2. This was apparent even when comparing effector PD-1+ CTLA-4hi CD4+ Tconv cells to eTreg cells (also defined as PD-1+ CTLA-4hi) (Figure 2F). These results suggest that at homeostasis eTreg cells receive increased constitutive TCR activation while experiencing ongoing SHP2 mediated restriction of these signals.
Homeostatic blockade of PD-L1 and CTLA-4 enhances the eTreg compartment
Previous studies showed that blockade of PD-L1 at homeostasis resulted in enhanced Treg cell responses within three days (29) that was apparent for as long as 5 days (data not shown). To determine whether CTLA-4 also plays a similar role and how it relates to PD-1, cohorts of 8-week-old C57BL/6 mice were treated with a single intraperitoneal injection of control antibodies alone or in combination with α-PD-L1, α-CTLA-4, or a combination of α-PD-L1 and α-CTLA-4. Splenocytes from these hosts were harvested 72 hours later and analyzed via flow cytometry. The blockade of PD-L1 or CTLA-4 resulted in a significant enrichment in the proportion and total number of Treg cells, yet when these blocking antibodies were combined there was an additive increase in the number of Treg cells (Figure 3A). This was accompanied by a concurrent increase in the proportion and total number of activated (CD11ahi CD44hi) eTreg-associated cells, which correlated with the observed total increase in Treg cells (Figure 3B). This short-term blockade of the PD-1 and CTLA-4 pathways did not impact the non-Treg subsets (CD4+ Tconv, and CD8+ T cells) but resulted in increases in activated (CD11ahi CD44hi) Treg cells with further increases in the co-blockade treated hosts (Figure 3B). The enrichment of activated eTreg cells correlated with increases in PD-1+ CTLA-4hi Treg cells with either blockade and when PD-1 and CTLA-4 were simultaneously blocked there was an additive increase in the ratio of eTreg cells to cTreg cells (Figure 3C).
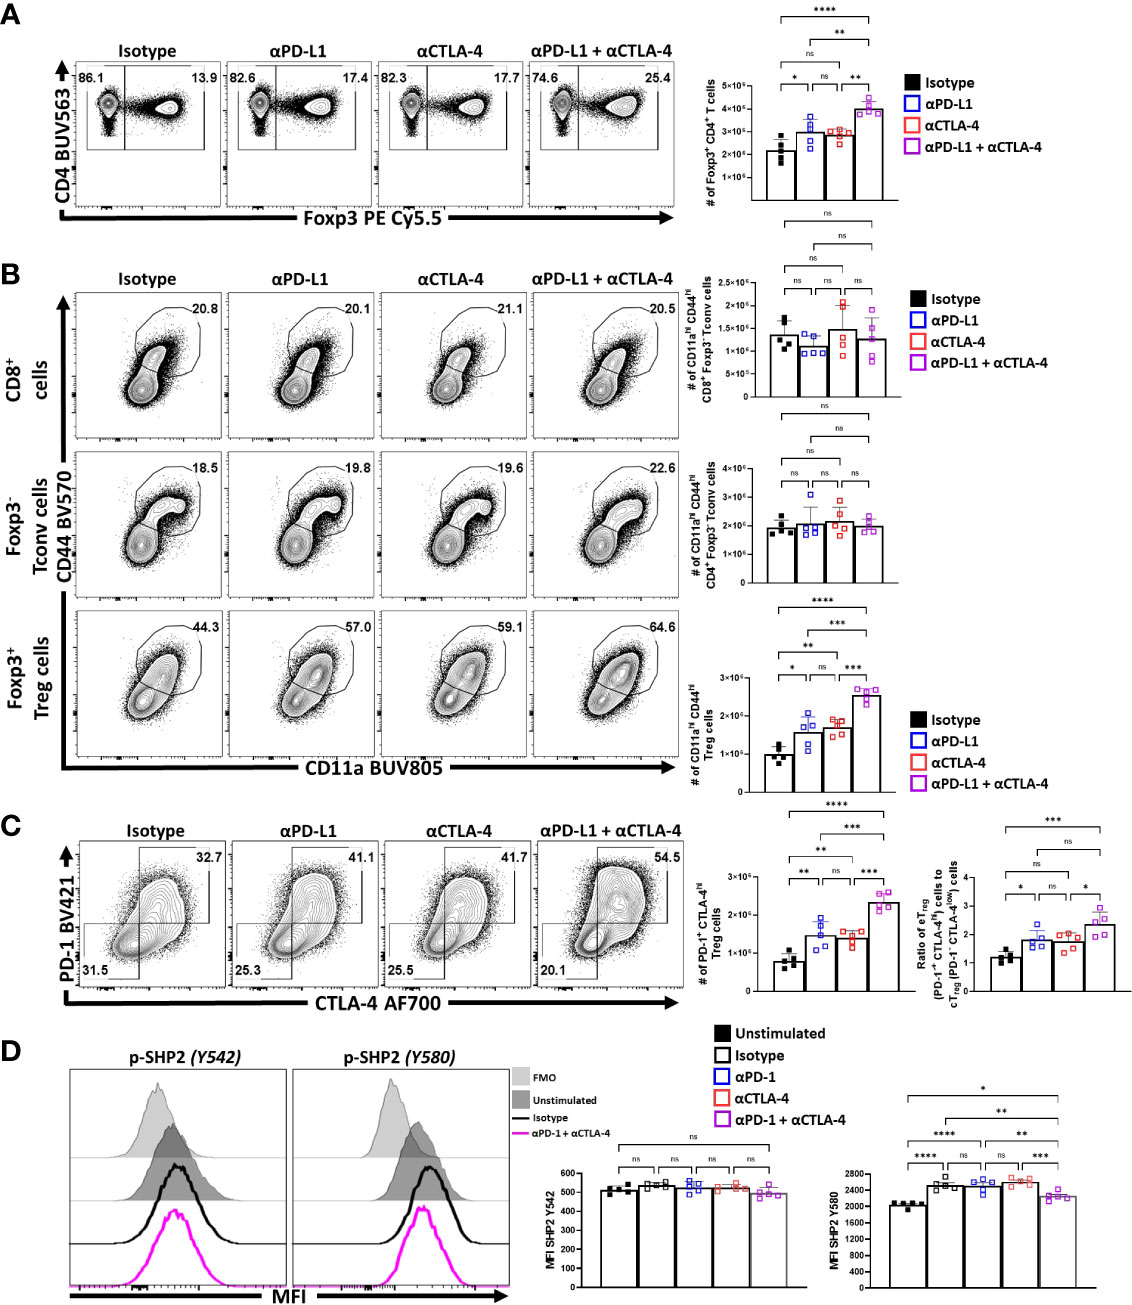
Figure 3 PD-1 and CTLA-4 additively restrict activated eTreg cells at homeostasis. Cohorts of 8 week-old male C57BL/6 mice were given a single intraperitoneal injection of either αPD-L1, or αCTLA-4, or combination αPD-L1 and αCTLA-4, or Isotype control antibody. Splenocytes were harvested for analysis 72 hours later and analyzed via high parameter flow-cytometry. (A) Flow plots of bulk CD4+ T cells demonstrating increases in the proportion and number of Treg cells following either blockade, with greatest enrichments occurring with combination blockade (n = 5/group, 1-way ANOVA with Tukey’s multiple comparisons test, *p < 0.05, **p < 0.01, ***p < 0.001, ****p < 0.0001, 3 experimental replicates). (B) Comparison of the proportions and number of CD44hi CD11ahi populations between CD8+ Tconv, CD4+ Tconv, and Treg cells following 72 hours of single or combination α-PD-L1/CTLA-4 checkpoint blockade treatment (n = 5/group, 1-way ANOVA with Tukey’s multiple comparisons test, **p < 0.01, ***p < 0.001, ****p < 0.0001, 3 experimental replicates). (C) Flow plots of cTreg (PD-1- CTLA-4low), and eTreg (PD-1+ CTLA-4hi) cells following blockade treatment, demonstrating enrichment of PD-1+ CTLA-4hi cells with either blockade, with the greatest enrichment occurring when both pathways were blocked (n = 5/group, 1-way ANOVA with Tukey’s multiple comparisons test, **p < 0.01, ***p < 0.001, ****p < 0.0001, 3 experimental replicates), and subsequent ratio of eTreg to cTreg cells that were shifted with treatment (n = 5/group, 1-way ANOVA with Tukey’s multiple comparisons test, *p< 0.05, **p < 0.01, ***p < 0.001, ****p < 0.0001, 3 experimental replicates). (D) Enriched bulk CD4+ T cells were treated with either αPD-1, or αCTLA-4, or combination αPD-1 and αCTLA-4, or Isotype control antibody, and then stimulated with plate-bound α-CD3, PD-L1-Fc, and CD80-Fc and phospho-stained. Depicted are histogram comparisons of the Treg subset (CD4+ Foxp3+) comparing gMFI of p-SHP2 at tyrosine residues Y542 and Y580 on Treg cells (n = 5/group, 1-way ANOVA with Fisher’s LSD individual comparisons test, *p < 0.05, **p < 0.01, ***p < 0.001, ****p < 0.0001, 2 experimental replicates). All data presented are means +/- SD and show individual data points.
Next, the impact of combination blockade on phosphorylation of suppressive SHP2 tyrosine phosphatases during activation was considered. SHP2 tyrosine phosphatase activity restricts CD28-mediated co-stimulation (32), and there are two tail tyrosine residues; Y542, which mitigates SHP2 phosphatase activity and Y580, which stimulates suppressive SHP2 phosphatase activity associated with signals from PD-1 and CTLA-4 (46). To evaluate whether PD-1 and CTLA-4 blockade would affect the immediate response to TCR associated SHP2 phosphorylation splenocyte-derived MACS enriched CD4+ T cells from naïve mice (Supplemental Figure 2A) were treated ex vivo with either an isotype control, α-PD-1, α-CTLA-4, or α-PD-1 plus α-CTLA-4. These cells were then transferred to plates coated with PD-L1-Fc, CD80-Fc, and α-CD3 in serum-free media. After incubating the cells for only 1 hour, to avoid complications associated with long term activation, the cells were fixed and phosphorylation of SHP2 tyrosine residues Y542 and Y580 were measured via flow cytometry. Firstly, Treg cells stimulated with plate-bound PD-L1-Fc, CD80-Fc, and α-CD3, did not demonstrate any clear differences in the amount of phosphorylated SHP2 Y542 (pY542), but did have an increase in phosphorylated SHP2 Y580 (pY580) (Figure 3D). Interestingly, cells that were pre-treated with individual blockades of α-PD-1 or α-CTLA-4 did not yield any differences in the amount of pY580 observed but, when both PD-1 and CTLA-4 were blocked, the levels of pY542 remained constant but the amount of pY580 was significantly reduced (Figure 3D; Supplemental Figure 2B). These data sets indicate that for Treg cells that PD-1 and CTLA-4 can simultaneously contribute to the phosphorylation of TCR-suppressive Y580 that is independent of changes to the Y580-disabling Y542 residue.
Another approach to depict how these treatments impacted the Treg cell populations was to utilize Uniform Manifold Approximation and Projection (UMAP) analysis of the concatenated data sets generated using an extensive panel of proteins expressed by Treg cells from each of the treated groups, excluding the expression of PD-L1 and CTLA-4 from analytical algorithms (Supplemental Figure 3A). Following UMAP analysis, the samples were then unmixed into respective treatment groups and changes in distribution density within the UMAP analysis depicted across the different treatment groups (Figure 4A). Thus, comparison of the isotype treated with the combination treatment shows a marked shift in the heat map associated with expansion of eTreg cells. The inclusion of staining for Nur77, a protein expressed proximally to TCR activation (47), allowed these events to be overlaid on respective UMAPs. This analysis illustrates how individual, or combination PD-L1/CTLA-4 blockade led to enrichment of Nur77 expression associated with eTreg cells (Figure 4B). Then, using the original concatenated UMAP (Figure 4C), median fluorescence expression heatmaps were created to show comparative expression of proliferation-associated proteins (cMyc and Ki67) (Figure 4D), and co-stimulation associated proteins (Figure 4E). Compared to isotype treated hosts, the PD-L1 and CTLA-4 blockade treated hosts had increased enrichment in regions that overlap with Foxp3 and Helios, yet no clear enrichment over the CD25hi regions of the UMAP while combination blockade hosts had even further enrichment over the Foxp3hi and Helios+ regions and a comparative reduction of CD25hi cells in addition to enrichment of CD73hi Treg cells (Supplemental Figure 3B). Likewise, either blockade resulted in enrichment in regions of the UMAP associated with activation (Figure 4B) or proliferation (Figure 4D), or expression of B7-family co-stimulation proteins (Figure 4E), with the greatest enrichments occurring in the cohort treated with the combination blockade.
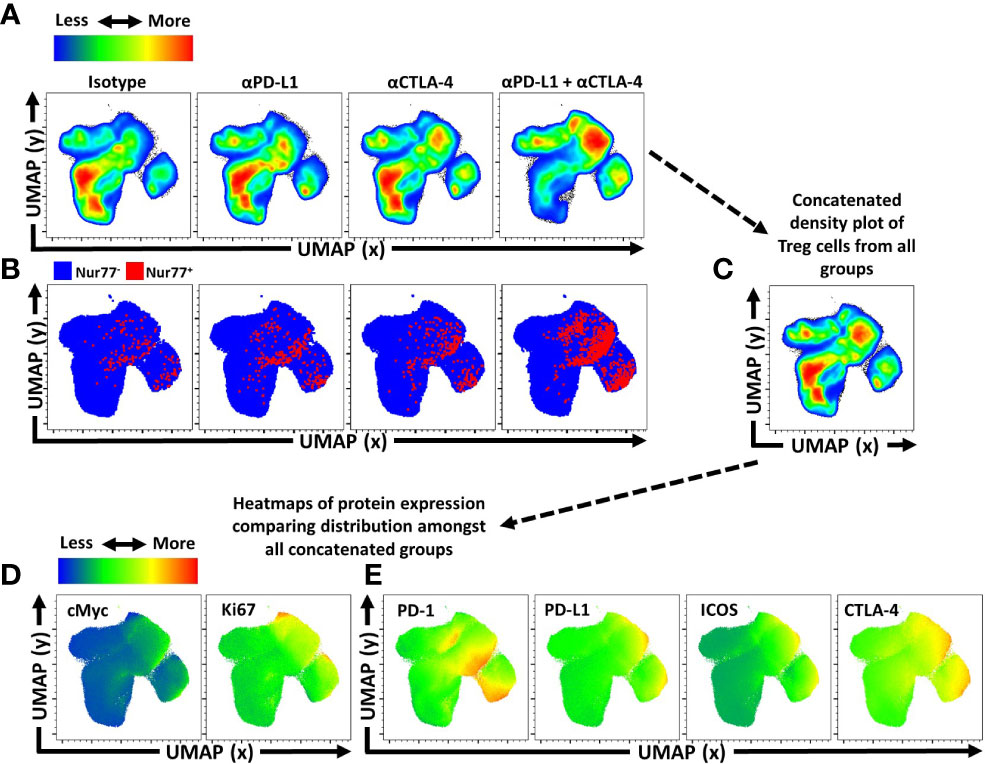
Figure 4 Activated and proliferative Treg compartment phenotypic shifts following checkpoint blockade. Cohorts of 8 week-old male C57BL/6 mice were given a single intraperitoneal injection of either αPD-L1, or αCTLA-4, or combination αPD-L1 and αCTLA-4, or Isotype control antibody. Splenocytes were harvested for analysis 72 hours later and analyzed via high parameter flow-cytometry (3 experimental replicates). (A) Bulk Treg sample data from each treatment group (n=5/group, 20 individuals total) was concatenated into a single sample and then evaluated using Uniform Manifold Approximation and Projection (UMAP) analysis (Supplemental Figure 3A for description) to produce 2-dimensional plots containing the measured parameters excluding PD-L1 and CTLA-4 from analysis to portray qualitative trends that emerged following treatment. (A) The individual UMAP analysis was then sub-divided into treatment specific UMAP sub-plots from the concatenated analysis depicting pseudo-color density distribution of Treg cells amongst each treatment group within the UMAP. (B) Nur77+ cells (red) overlaid Nur77- cells (blue) amongst the reference UMAP plots for each treatment group depicting enrichment of Nur77+ Treg cells with individual and combination blockade treatment. (C) Representation of the cumulative UMAP density plot depicting the assimilation of concatenated UMAP data from the 4 treated groups in figure (A, D, E) Median heatmap expression of proteins based on the total concatenated UMAP analysis, depicting expression of the protein labeled in each plot, allowing qualitative comparison to population density shifts demonstrated in (A). (D) Heatmap expression of proliferation associated proteins cMyc and Ki67, with extensive overlap with enriched regions following individual or combination blockade, with more activated and proliferative cells accumulating in the upper right region of the UMAP plots, and more quiescent cells in the bottom left region of the UMAP plots. (E) Heatmap expression of B7-family costimulatory proteins, PD-1, PD-L1, ICOS, and CTLA-4, with enrichment in the regions correlating to blockade treatment.
To compare the impact of inhibitory receptor blockade on the proliferative responses of conventional and Treg cells, expression of Ki67 and cMyc was assessed. In these experiments, short term blockade did not lead to increased proliferation of CD8+ T cells (Figure 5A). For CD4+ Tconv cells, a modest increase in the percentage of proliferative cells (from 2 to 4%) was only observed with treatments that included α-CTLA-4. In contrast, Treg cells demonstrated a marked increase of the Ki67+ cMychi population with either PD-L1 or CTLA-4 blockade, with the most prominent increase observed when both were blocked (Figure 5A). This observation was consistent with the increased number of the PD-1+ Treg subsets (PD-1low, PD-1hi) (Figure 5B). Additionally, TCR stimulation of Treg cells is associated with maintenance of Foxp3 expression (10), and antagonism of TCR activity by treatment of mice for 4 days with tacrolimus (FK506) (48) resulted in a reduced MFI of Foxp3 in Treg cells (Figure 5C). In contrast, the blockade of PD-L1 or CTLA-4 resulted in an overall increase in the MFI of Foxp3 amongst the bulk Treg compartment, with the combination blockade having the greatest enhancement (Figure 5D; Supplemental Figure 3C for individual eTreg blockade comparisons). Combined with the numerical, phenotypic and phos-data sets, these results highlight that PD-1 and CTLA-4 additively contribute to restrict the population of TCR-driven eTreg cells.
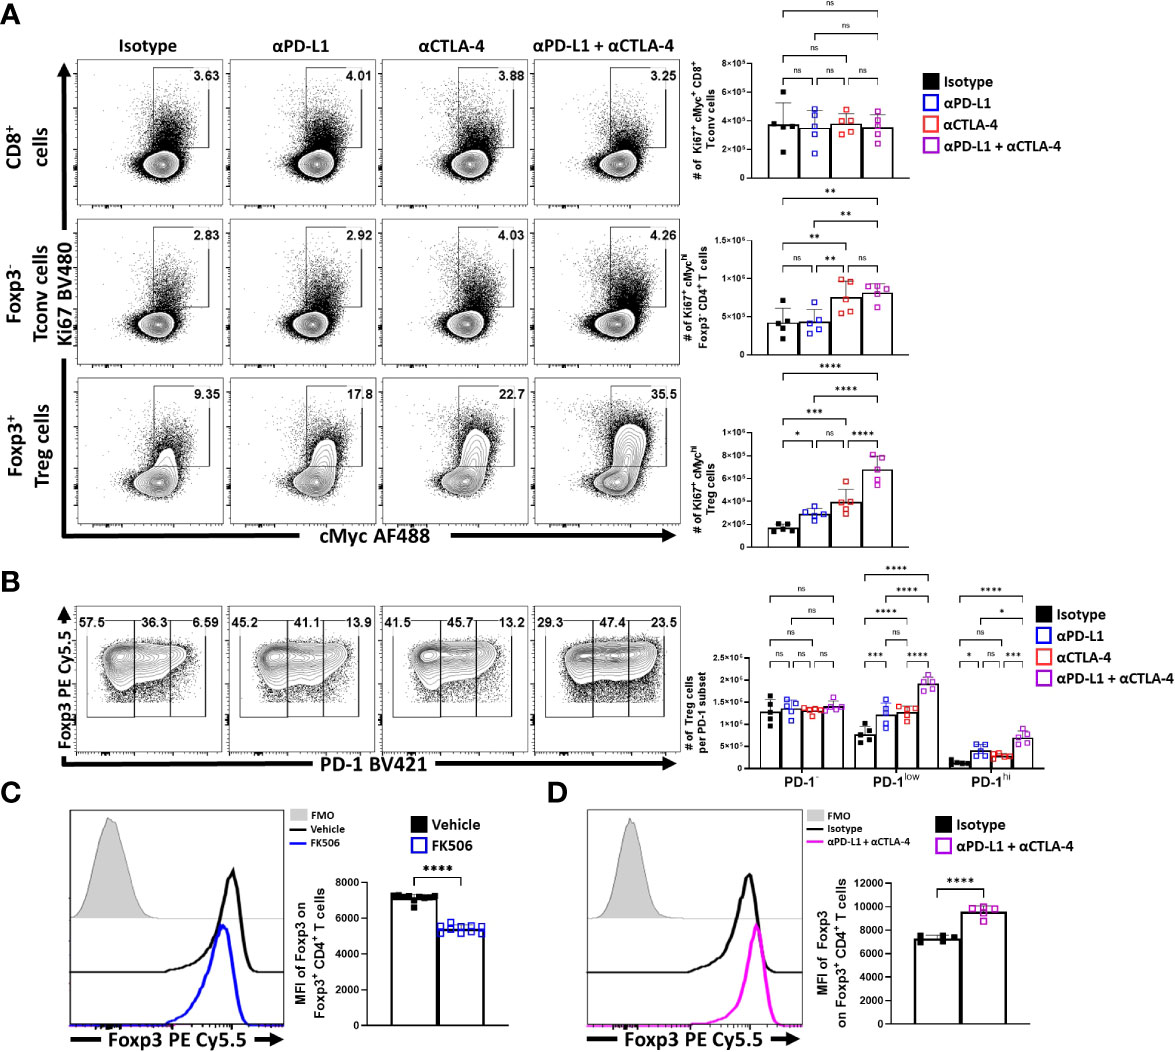
Figure 5 Blockade of PD-L1 and CTLA-4 additively drive enrichment and proliferation of the eTreg compartment. Cohorts of 8 week-old male C57BL/6 mice were given a single intraperitoneal injection of either αPD-L1, or αCTLA-4, or combination αPD-L1 and αCTLA-4, or Isotype control antibody. Splenocytes were harvested for analysis 72 hours later and analyzed via high parameter flow-cytometry. (A) Flow plots comparing the proportion and number of Ki67+ cMychi T cells cells following individual or combination PD-L1/CTLA-4 blockade treatment, subdivided into CD8+, CD4+ Tconv, and Treg cells (n = 5/group, 1-way ANOVA with Fisher’s LSD individual comparisons test, *p < 0.05, **p < 0.01, ***p < 0.001, ****p < 0.0001, 3 experimental replicates). (B) Flow plots comparing the proportions and number of PD-1-, PD-1low, and PD-1hi Treg cells following individual or combination blockade treatment, with enrichments occurring within the PD-1+ eTreg associated subsets following blockade, the greatest of which occur with combination blockade treatment (2-way ANOVA with Sidak’s multiple comparisons test, *p < 0.05, ***p < 0.001, ****p < 0.0001, 3 experimental replicates). (C) Cohorts of 8 week-old male C57BL/6 mice were treated once daily for 4 days with subcutaneous injections of PBS/vehicle or Tacrolimus (FK506), and splenocytes were harvested and analyzed via flow cytometry. Comparative histograms of Treg cells from vehicle control and FK506 treated mice demonstrating decreases in the gMFI of Foxp3 in Treg cells in FK506 treated hosts (n = 10/group two-tailed unpaired student’s t-test, ****p < 0.0001, 2 experimental replicates). (D) Comparative histograms of Treg cells from isotype and αPD-L1/αCTLA-4 combination blockade treated mice demonstrating increases in the gMFI of Foxp3 in Treg cells from blockade treated hosts (n = 5/group two-tailed unpaired student’s t-test, ****p < 0.0001, 3 experimental replicates). All data presented are means +/- SD and show individual data points.
To directly assess whether the enhanced eTreg cell populations observed after blockade of PD-L1 and/or CTLA-4 at homeostasis would impact the ability to generate de novo T cell responses, these pathways were blocked in naïve mice that were then immunized with a non-replicative form of Toxoplasma gondii that expresses OVA. This vaccine strain provides a system to assess the activities required to generate effector T cell responses (42, 49). In these studies, mice were treated with isotype, α-PD-L1 or α-CTLA-4 and three days later were recipients of OTI T cells. A day later mice were vaccinated with CPS parasites and then re-treated with the relevant antibodies. Seven days post-vaccination mice were assessed for Treg cell populations, parasite specific CD4+ T cell responses as well the OTI T cells. At this time point (11 days after initial treatment), enhanced eTreg cell responses were still obvious, indicating that the effects of CTLA-4 and PD-L1 blockade were sustained (Supplemental Figures 5A, B). However, despite this enhanced eTreg cell activity the magnitude of the CPS-induced T cell responses were not reduced (Supplemental Figures 5C, D) but they did profoundly skew the eTreg to Tconv Teff ratios (Supplemental Figures 5E, F). However, it is relevant to note that in these experiments the use of α-CTLA-4 alone resulted in heightened OTI and endogenous CD4+ T cell responses (Supplemental Figures 5C, D) but this was antagonized by the inclusion of anti-PD-L1. This antagonism of the T cell responses correlated with conditions that resulted in the presence of the highest numbers of eTreg cells across multiple experiments.
Nevertheless, to further assess the impact of IR blockade on conventional T cells and Treg cell function at homeostasis, splenocytes from naïve treated hosts were stimulated with PMA and ionomycin and the ability to produce cytokines was assessed. The Foxp3- CD4+ and CD8+ T cells readily produced TNFα, and there was a small proportion of these cells that co-expressed TNFα and IFNγ. Following solo, or combined PD-L1 and CTLA-4 blockade there were no significant increases in the production of these cytokines (Figure 6A). Likewise, a small proportion of the CD4+ T cell population produces IL-2, but this was not altered by these treatments (Figure 6B). Thus, consistent with the data in Figure 4, these short term blockades did not appear to lead to any obvious enhancement of the incipient T cell response or levels of IL-2 that might contribute to the enhanced eTreg population observed.
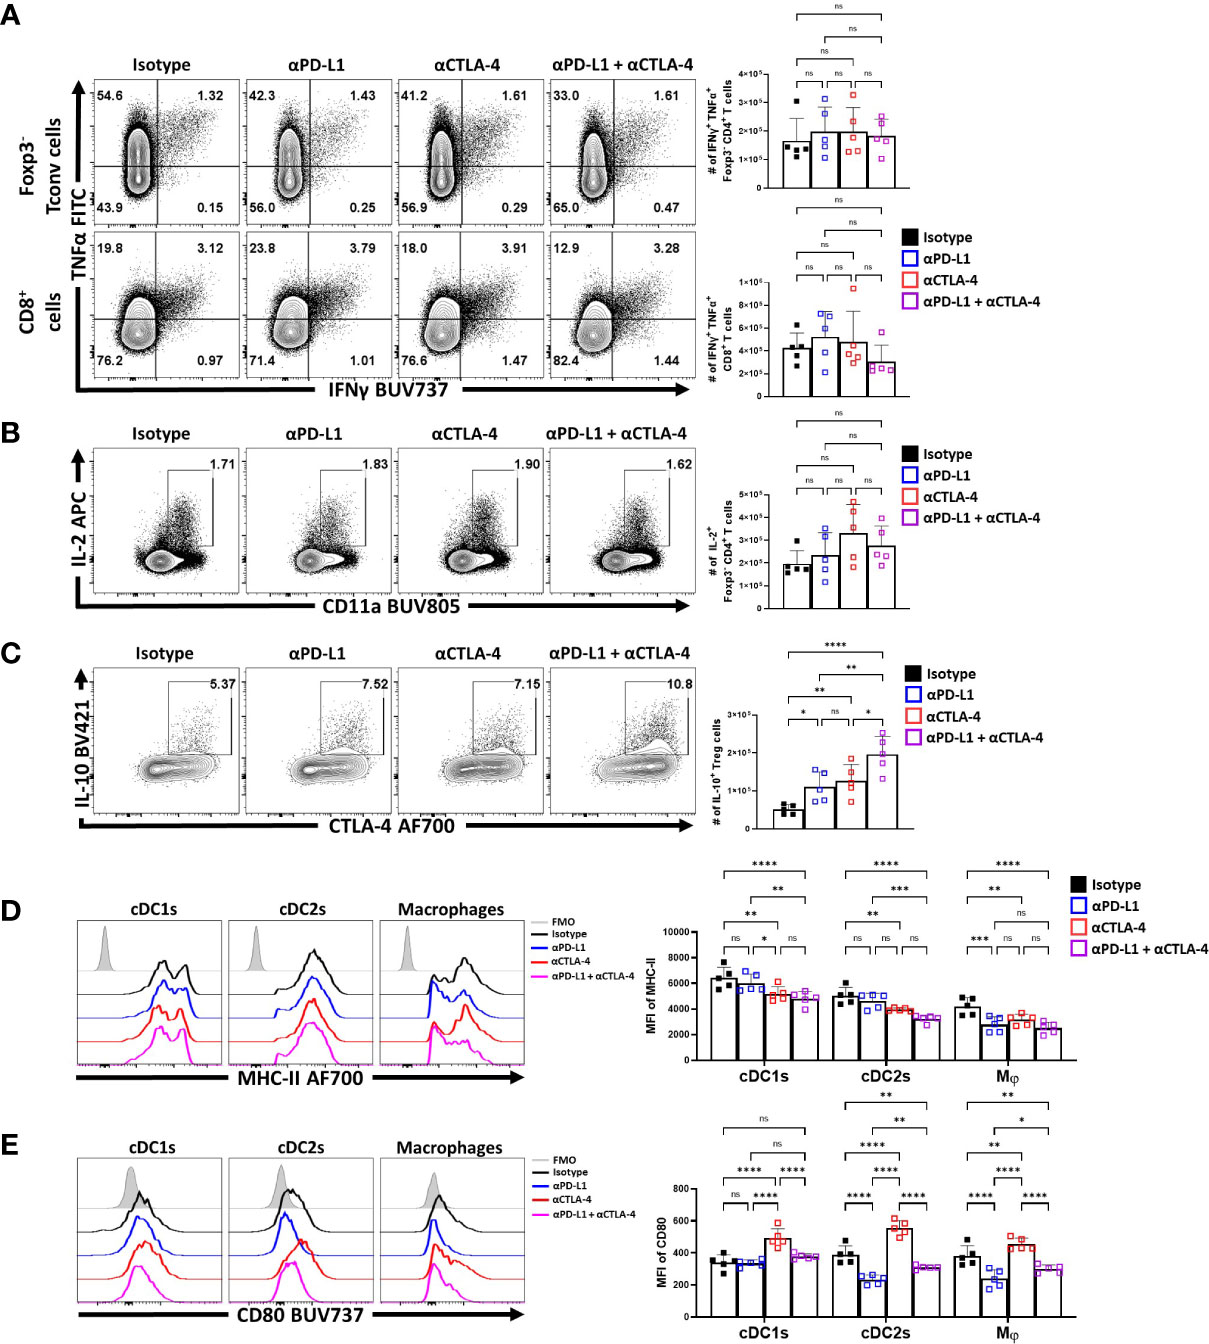
Figure 6 Combo-blockade of PD-L1 and CTLA-4 drives a myeloid-suppressive Treg environment. 8 week-old male C57BL/6 mice were given a single intraperitoneal injection of either αPD-L1, or αCTLA-4, or combination αPD-L1 and αCTLA-4, or Isotype control antibody. At 72 hours following treatment, their splenocytes were harvested, and stimulated with PMA/Ionomycin for cytokine staining and analyzed via flow cytometry. (A) Plots depicting the expression of IFNγ and TNFα on CD4+ Tconv and CD8+ cells from single and combo blockade treated hosts (n = 5/group, 1-way ANOVA with Fisher’s LSD individual comparisons test, 2 experimental replicates). (B) Plots depicting the expression of IL-2 on CD4+ Tconv cells from single and combo blockade treated hosts (n = 5/group, 1-way ANOVA with Fisher’s LSD individual comparisons test, 2 experimental replicates). (C) Plots depicting the expression of IL-10 and CTLA-4 on bulk Treg cells from each treatment group, with increases in IL-10+ CTLA-4hi Treg cells from single and combo blockade treated hosts (n = 5/group, 1-way ANOVA with Fisher’s LSD individual comparisons test, *p < 0.05, **p < 0.01, ****p < 0.0001, 2 experimental replicates). (D) Ex-vivo staining of splenocytes evaluating the expression of MHC-II on cDC1s (CD3-, B220-, CD19-, NK1.1-, Ly6G-, CD64-, CD11c+, MHC-II+, XCR1+), cDC2s (CD3-, B220-, CD19-, NK1.1-, Ly6G-, CD64-, CD11c+, MHC-II+, SIRPα+), and macrophages (CD3-, B220-, CD19-, NK1.1-, Ly6G-, CD64+, CD11b+, MHC-II+, Ly6Clow) (Supplemental Figure 4 for description) following blockade treatments, with decreasing trends MHC-II with combo blockade (n = 5/group, 2-way ANOVA with Fisher’s LSD individual comparisons test, *p < 0.05, **p < 0.01, ***p < 0.001, ****p < 0.0001, 3 experimental replicates) (E) Plots comparing CD80 expression on cDCs and Macrophages, demonstrating changes to surface CD80 based on blockade treatment (n = 5/group, 2-way ANOVA with Fisher’s LSD individual comparisons test, *p < 0.05, **p < 0.01, ****p < 0.0001, 3 experimental replicates) All data presented are means +/- SD and show individual data points.
Treg cell production of IL-10 is one important function of these cells, and this cytokine can act on APCs and limit their expression of MHC class II and CD80. In contrast, the ability of CTLA-4 to bind to and strip CD80 from these cells can reduce costimulation (34). In these in vivo studies, blockade of PD-L1 or CTLA-4 resulted in an increase in the number of IL-10+ Treg cells, with the combination blockade resulting in the greatest increase (Figure 6C). Evaluation of the splenic DC and macrophages compartments ex vivo (Supplemental Figure 4) showed that cDC2s and macrophages had varied expression of MHC class II and CD80. The blockade of PD-L1 alone resulted in modest reductions in MHC-II expression, particularly amongst macrophages (Figure 6D). Comparatively, solo CTLA-4 blockade drove reductions in MHC-II particularly on DCs while the combined blockade of both PD-L1 and CTLA-4 had consistent trends of decreasing MHC class II expression in cDCs and macrophages (Figure 6D). In context of co-stimulatory CD80, PD-L1 blockade alone reduced CD80 on cDC2s and macrophages, but not cDC1s (Figure 6E). In comparison and consistent with the ability of CTLA-4 to strip CD80 (34), CTLA-4 blockade resulted in increased CD80 expression on cDCs and macrophages (Figure 6E). When blockade treatments were combined, the effects of anti-PD-L1 were dominant with reduction in the expression of CD80. This result established that not only do these treatments favor the expansion of the eTreg compartment, but this correlates with reduced APC functions of other cell types that are known to be impacted by Treg cells.
Discussion
The focus on the role of PD-1 and CTLA-4 in limiting effector T cell responses has revealed that the expression of these molecules is a byproduct of repeated TCR stimulation over time (50–52). The studies presented here focus on the impact of these potentially overlapping pathways on Treg cell homeostasis and in particular on the differences between eTreg and cTreg cell populations. In this context, short term homeostatic blockade of PD-L1 or CTLA-4 did not result in appreciable activation of Tconv CD4+ or CD8+ T cells. Subsequent evaluation of the possible impact of these enhanced eTreg populations on the formation of T cell responses to vaccination with OVA-expressing parasites did not antagonize the expansion of transferred OTI populations or endogenous effector CD4+ T cells during this challenge. However, these vaccination studies do not distinguish the effects of blockade of CTLA-4 or PD-L1 on the Treg cell populations versus an impact on the expansion of the parasite specific effectors. For example, CTLA-4 blockade treatment alone led to an expansion in the formation of effector T cell responses. However, the observation that CTLA-4 blockade in combination with PD-L1 blockade treatment resulted in an even greater expansion of eTreg cells and antagonized the effects of solo CTLA-4 blockade on endogenous and effector T cells and transferred OTI cells, of which would be consistent with a role for these heightened eTreg populations to limit effector responses. Nevertheless, these studies need to be interpreted with care and additional studies that allow the isolation of the effects of PD-1 and CTLA-4 on activated CD4+ and CD8+ T cells versus Treg cells in the same environment would be required.
In considering these findings, Treg cells receive ongoing TCR signaling which is required to maintain expression of Foxp3 and their suppressive capacity (10). When PD-1 and CTLA-4 signaling is mitigated, there is increased overall expression of Foxp3 on Treg cells, which is directly contrasted by short-term blockade of TCR activation which results in reduced Treg Foxp3 expression. Earlier reports suggested that PD-1 and CTLA-4 are associated with the suppressive functions of Treg cells (53, 54), but a consensus is emerging that these inhibitory receptors can individually restrict Treg capacity and suppressive function during autoimmune disease (20, 28), cancer (21, 41, 55) and infection (29). Thus, co-blockade of PD-L1 and CTLA-4 resulted in increased Treg cell proliferation, percentage (but not relative levels) of cells that produced IL-10 and expressed CD73, CTLA-4, and PD-L1, and a reduction in markers of APC activation. Together, these results suggest that targeting PD-1 and CTLA-4 does not result in an increase in Treg suppressive activity per se, but rather that these pathways act to limit the size of the effector Treg pool.
We now appreciate that while the cTreg compartment makes greater use of STAT5 signaling cytokines such as IL-2 for maintenance (11, 13, 56) the eTreg compartment is more dependent on TCR-mediated activation and co-stimulation to survive. This is suggested by the finding that the eTreg subset has higher basal levels of pZAP70, pAKT, and pmTOR, than the cTreg compartment. However, eTreg cells also express PD-1 which interacts with SHP2 to antagonize T cell activation (57). In comparing PD-1 to CTLA-4 which is also expressed on eTreg cells, PD-1 has been directly implicated in binding SHP2, while CTLA-4 is missing a motif that would allow recognition of SHP2, but CTLA-4 does function as a negative regulator of T cell activation (31, 40, 58). SHP2 associates with CTLA-4 and the TCR (59, 60) and Schneider & Rudd, (2000) postulated that this activity is mediated via its impact on PI3K, of which CTLA-4 signaling does have impacts on PI3K. Notably, CTLA-4 does associate with SHP2 in T cells, and possibly has indirect interactions with SHP2 mediated by an intermediate which is still unclear (31). Here, there is an observation that the eTreg subset may have an enhanced capacity to respond to TCR signals while simultaneously being sensitive to negative SHP2-associated signals from PD-1 or CTLA-4.
There are multiple possible mechanisms whereby blockade of these IR may lead to enhanced Treg cell activities. Several imaging studies have highlighted that when compared to activated CD4+ T cells, Treg cell interactions with DC are characterized by less stable short term contacts (61, 62), and a recent report highlighted that Treg cell use CTLA-4 to disrupt these interactions (41). Whether blockade of CTLA-4 leads to enhanced DC-Treg interactions remains to be tested. Likewise, previous studies have deployed strategies to evaluate the impact of SHP2 via T cell specific SHP2-/- mice and highlighted that this pathway is redundant in exhaustion (63). However, in that report, during LCMV infection the loss of SHP2 resulted in enhanced expansion (almost 3 fold) of virus-specific effector CD8+ T cells and in a tumor model the ability of PD-1 blockade to enhance the percentage of total and IFNγ positive intra-tumoral CD8+ T cells was SHP2-dependent. While there may be SHP2-independent pathways that contribute to the activities of PD-1, these data sets remain consistent with the idea that PD-1 mediated engagement of SHP2 limits T cell activation. Indeed, this is reflected in our own data sets in which eTreg cells had enhanced levels of pSHP2 and that mitigation of both PD-1 and CTLA-4 signaling pathways reduces suppressive pSHP2-Y580, which correlated with increased Foxp3 expression and numbers of eTreg cells. Given the ubiquitous expression of SHP2 by cells of the immune system, whether this reduction in SHP2 activity in eTreg cells accounts for their expansion will require the use of lineage-specific approaches to directly address this question.
While PD-1 and CTLA-4 are related B7 family members, engage SHP2 signaling, and seem to additively limit eTreg proliferation and function, the current literature indicate that there is still distinction to their suppressive mechanisms. For example, PD-1 accumulates on the cell surface and is accessible to PD-L1 ligation (64). and thereby act in cis to limit T cell activation. For Treg cells, blockade of this pathway resulted in enhanced numbers and IL-10 production and was associated with reduced APC expression of CD80 and MHC class II. In contrast, the majority of CTLA-4 is stored intracellularly and is translocated to the surface upon TCR stimulation (65, 66) where it can provide negative costimulatory signals (67). In addition, the ability of CTLA-4 to bind with high affinity to CD80 means that it can outcompete the ability of CD28 to provide costimulation and can actively restrict APC function through CTLA-4 mediated trogocytosis of CD80 (34). Thus, CTLA-4 is an invoked off switch which can act in cis and trans to limit eTreg cells. Interestingly, this complex biology is apparent in the studies presented here: α-PD-L1 treatment alone drove a reduction in CD80 expression by cDC2s and macrophages, while α-CTLA-4 treatment still drove an enrichment of Treg cells yet resulted in a significant increase in myeloid expression of CD80 (consistent with reduced trogocytosis). Nevertheless, that combination blockade of PD-L1 and CTLA-4 resulted in a reduction of myeloid CD80 expression suggests that the increased number of Treg cells and their production of IL-10 is sufficient to exceed the effects of CTLA4 on CD80 levels.
The past twenty years has witnessed an increased utilization of immunotherapeutic drugs to enhance immune mediated control of certain cancers or to limit autoimmune inflammation. The blockade of PD-1 or CTLA-4 or the use of CTLA4-Ig are all examples of clinical interventions to impact effector T cell responses that are directly relevant to eTreg cells and the pathways that we show here. However, these treatment strategies do not always prove effective, and their impact of Treg cells may in part explain some of this heterogeneity in clinical outcome (21, 68, 69). Perhaps, the ability to specifically target these pathways (either to agonize or block) on eTreg cells can be used as an immunotherapeutic strategy to enhance Treg function to treat immunopathological diseases or select against Treg mediated suppression in the context of infection or cancer.
Data availability statement
The original contributions presented in the study are included in the article/Supplementary Material. Further inquiries can be directed to the corresponding author.
Ethics statement
The animal study was reviewed and approved by University of Pennsylvania Institutional Animal Care and Use Committee.
Author contributions
JP conceptualized the project, designed/executed all experiments, performed data analysis, figure production, and authored the paper. ZL, JC, AH, BD, LS and KO aided in data collection, provided conceptual feedback regarding experimental design, data analysis, and manuscript editing. DC directly supervised experimental execution, interpretation, and presentation of data. CH supervised the project in entirety. All authors contributed to the article and approved the submitted version.
Funding
This project was supported by NIAID R01 AI125563 and R01 AI41158, awarded to Christopher Hunter. Joseph Perry was supported by training grant: T32-CA-009140.
Acknowledgments
Thank you to Keith Burton for your patience and support.
Conflict of interest
The authors declare that the research was conducted in the absence of any commercial or financial relationships that could be construed as a potential conflict of interest.
Publisher’s note
All claims expressed in this article are solely those of the authors and do not necessarily represent those of their affiliated organizations, or those of the publisher, the editors and the reviewers. Any product that may be evaluated in this article, or claim that may be made by its manufacturer, is not guaranteed or endorsed by the publisher.
Supplementary material
The Supplementary Material for this article can be found online at: https://www.frontiersin.org/articles/10.3389/fimmu.2023.997376/full#supplementary-material
Supplementary Figure 1 | Treg subsetting. (A) Flow cytometry sub-gating example strategy identifying Treg cells, utilizing splenocytes from an 8 week-old male C57BL/6 mouse. (B) Gating strategy to identify PD-1+ CTLA-4hi (eTreg) vs PD-1- CTLA-4low (cTreg) subsets. (C) Splenocytes from an 8 week-old and 16 week-old C57BL/6 mice were evaluated for their proportions of PD-1+ CTLA-4hi eTreg cells (two-tailed unpaired student’s t-test, ** = p < 0.01). All data presented are means +/- SD and show individual data points.
Supplementary Figure 2 | CD4 T cell enrichment and SHP2 phosphorylation results. (A) Flow plots of from 8 week-old male C57BL/6 mouse splenocytes assessing CD3+ CD4+ T cell proportions following MACS enrichment (two-tailed paired student’s t-test, **** = p < 0.0001, 2 experimental replicates). (B) Enriched bulk CD4+ T cells were treated with either αPD-1, or αCTLA-4, or combination αPD-1 and αCTLA-4, or Isotype control antibody, and then stimulated with plate-bound α-CD3, PD-L1-Fc, and CD80-Fc and phospho-stained. Depicted are histogram comparisons of the Treg subset (CD4+ Foxp3+) comparing gMFI of p-SHP2 at tyrosine residues Y542 and Y580 on Treg cells (n = 5/group, 1-way ANOVA with Fisher’s LSD individual comparisons test, * = p < 0.05, ** = p < 0.01, *** = p < 0.001, **** = p < 0.0001, 2 experimental replicates). All data presented are means +/- SD and show individual data points.
Supplementary Figure 3 | UMAP and eTreg Foxp3 MFI following checkpoint blockade. (A) Flow cytometry sub-gating example strategy identifying Treg cells, utilizing splenocytes from an 8 week-old male C57BL/6 mouse. The UMAP was then generated using concatenated Treg cells from 8 week-old male C57BL/6 mice that were given a single intraperitoneal injection of either αPD-L1, or αCTLA-4, or combination αPD-L1 and αCTLA-4, or Isotype control antibody. The calculated fluorescence factors that generated the UMAP are depicted. (B) Expression trends of Treg-associated proteins Foxp3, Helios, CD25, CD73, and CD122 amongst the Treg compartment within the concatenated UMAP from Figure 4C. (C) Comparative histograms depicting the gMFI of Foxp3 on PD-1+ CTLA-4hi eTreg cells following checkpoint blockade (n = 5/group, 1-way ANOVA with Fisher’s LSD individual comparisons test, * = p < 0.05, ** = p < 0.01, **** = p < 0.0001, 2 experimental replicates). All data presented are means +/- SD and show individual data points.
Supplementary Figure 4 | Myeloid Gating. (A) Splenocytes from 8 week-old male C57BL/6 mice were analyzed via flow cytometry across multiple leukocyte populations as depicted: B cells (CD3-, B220+, CD19+, MHC-II+), cDC1s (CD3-, B220-, CD19-, NK1.1-, Ly6G-, CD64-, CD11c+, MHC-II+, XCR1+), cDC2s (CD3-, B220-, CD19-, NK1.1-, Ly6G-, CD64-, CD11c+, MHC-II+, SIRPα+), and macrophages (CD3-, B220-, CD19-, NK1.1-, Ly6G-, CD64+, CD11b+, MHC-II+, Ly6Clow).
Supplementary Figure 5 | Combination blockade does not enhance the formation of T cell immune responses to vaccination, instead results in an increase in the ratio of eTregs: Teff cells. 8 week-old male C57BL/6 mice were given a single intraperitoneal injection of either αPD-L1, or αCTLA-4, or combination αPD-L1 and αCTLA-4, or Isotype control antibody. At 72 hours following treatment, congenically labeled OTI cells were transferred IP, and the hosts were vaccinated with CPS-OVA 24 hours after OTI transfer. The mice were re-dosed with their respective blocking antibody another 24 hours after vaccination. At day 7 following vaccination, the spleens, peritoneal exudate cells (PEC), and draining lymph nodes (dLN) were harvested, and analyzed via flow cytometry. (A) Representative plots of splenocyte-derived bulk CD4+ T cells depicting the Foxp3+ subset from each blockade treatment group and statistically from each tissue harvested (n = 4-5/group, 1-way ANOVA with Fisher’s LSD individual comparisons test, * = p < 0.05, ** = p < 0.01, *** = p < 0.001, **** = p < 0.0001, 1 experimental replicate). (B) Representative plots of splenocyte-derived bulk Foxp3+ Treg cells comparing the number of PD-1+ CTLA-4hi eTreg cells between blockade treatment groups and across each tissue evaluated (n = 4-5/group, 1-way ANOVA with Fisher’s LSD individual comparisons test, * = p < 0.05, ** = p < 0.01, *** = p < 0.001, **** = p < 0.0001, 1 experimental replicate). (C) Representative plots of splenocyte-derived transferred OTI T cells (CD45.1+ CD8+) sub-gated on Tbet+ CD11ahi populations following vaccination (n = 4-5/group, 1-way ANOVA with Fisher’s LSD individual comparisons test, * = p < 0.05, 1 experimental replicate) (D) Splenocyte-derived endogenous (CD45.2+) parasite-specific CD4+ Tconv effector T cell (Teff) responses (Tetramer+ Tbet+) to vaccination (n = 4-5/group, 1-way ANOVA Fisher’s LSD individual comparisons test, * = p < 0.05, ** = p < 0.01, ** = p < 0.01, 1 experimental replicate). (E, F) Graphed ratios of splenic eTreg cells (PD-1+ CTLA-4hi) to transferred OTI Teff cells (CD8+ CD45.1+ Tbet+ CD11ahi) (Left), and eTreg cells to endogenous parasite-specific CD4+ Tconv effector T cell responses (Right) (n = 4-5/group, 1-way ANOVA Fisher’s LSD individual comparisons test, * = p < 0.05, 1 experimental replicate). All data presented are means +/- SD and show individual data points.
References
1. Fontenot JD, Gavin MA, Rudensky AY. Foxp3 programs the development and function of CD4+CD25+ regulatory T cells. Nat Immunol (2003) 4:330–6. doi: 10.1038/ni904
2. Josefowicz SZ, Lu L-F, Rudensky AY. Regulatory T cells: Mechanisms of differentiation and function. Annu Rev Immunol (2012) 30:531–64. doi: 10.1146/annurev.immunol.25.022106.141623
3. Sakaguchi S, Mikami N, Wing JB, Tanaka A, Ichiyama K, Ohkura N. Regulatory T cells and human disease. Annu Rev Immunol (2020) 38:541–66. doi: 10.1146/annurev-immunol-042718-041717
4. Sakaguchi S, Wing K, Miyara M. Regulatory T cells - a brief history and perspective. Eur J Immunol (2007) 37:116–23. doi: 10.1002/eji.200737593
5. Bilate AM, Lafaille JJ. Induced CD4 + Foxp3 + regulatory T cells in immune tolerance. Annu Rev Immunol (2012) 30:733–58. doi: 10.1146/annurev-immunol-020711-075043
6. Fan MY, Low JS, Tanimine N, Finn KK, Priyadharshini B, Germana SK, et al. Differential roles of IL-2 signaling in developing versus mature tregs. Cell Rep (2018) 25:1204–1213.e4. doi: 10.1016/j.celrep.2018.10.002
7. Kieback E, Hilgenberg E, Stervbo U, Lampropoulou V, Shen P, Bunse M, et al. Thymus-derived regulatory T cells are positively selected on natural self-antigen through cognate interactions of high functional avidity. Immunity (2016) 44:1114–26. doi: 10.1016/j.immuni.2016.04.018
8. Bautista JL, Lio CWJ, Lathrop SK, Forbush K, Liang Y, Luo J, et al. Intraclonal competition limits the fate determination of regulatory T cells in the thymus. Nat Immunol (2009) 10:610–7. doi: 10.1038/ni.1739
9. Owen DL, Sjaastad LE, Farrar MA. Regulatory T cell development in the thymus. J Immunol (2019) 203:2031–41. doi: 10.4049/jimmunol.1900662
10. Levine AG, Arvey A, Jin W, Rudensky AY. Continuous requirement for the TCR in regulatory T cell function. Nat Immunol (2014) 15:1070–8. doi: 10.1038/ni.3004
11. Smigiel KS, Richards E, Srivastava S, Thomas KR, Dudda JC, Klonowski KD, et al. CCR7 provides localized access to IL-2 and defines homeostatically distinct regulatory T cell subsets. J Exp Med (2014) 211:121–36. doi: 10.1084/jem.20131142
12. Wakamatsu E, Mathis D, Benoist C. Convergent and divergent effects of costimulatory molecules in conventional and regulatory CD4+ T cells. Proc Natl Acad Sci U. S. A. (2013) 110:1023–8. doi: 10.1073/pnas.1220688110
13. Kornete M, Mason E, Istomine R, Piccirillo CA. KLRG1 expression identifies short-lived Foxp3(+) treg effector cells with functional plasticity in islets of NOD mice. Autoimmunity (2017) 50:1–9. doi: 10.1080/08916934.2017.1364368
14. Wildin RS, Ramsdell F, Peake J, Faravelli F, Casanova JL, Buist N, et al. X-Linked neonatal diabetes mellitus, enteropathy and endocrinopathy syndrome is the human equivalent of mouse scurfy. Nat Genet (2001) 27:18–20. doi: 10.1038/83707
15. Bennett CL, Christie J, Ramsdell F, Brunkow ME, Ferguson PJ, Whitesell L, et al. The immune dysregulation, polyendocrinopathy, enteropathy, X-linked syndrome (IPEX) is caused by mutations of FOXP3. Nat Genet (2001) 27:20–1. doi: 10.1038/83713
16. Wilson EH, Wille-Reece U, Dzierszinski F, Hunter CA. A critical role for IL-10 in limiting inflammation during toxoplasmic encephalitis. J Neuroimmunol. (2005) 165:63–74. doi: 10.1016/j.jneuroim.2005.04.018
17. Warunek J, Jin RM, Blair SJ, Garis M, Marzullo B, Wohlfert EA. Tbet expression by regulatory T cells is needed to protect against Th1-mediated immunopathology during toxoplasma infection in mice. ImmunoHorizons (2021) 5:931–43. doi: 10.4049/immunohorizons.2100080
18. Husebye ES, Anderson MS, Kämpe O. Autoimmune polyendocrine syndromes. N Engl J Med (2018) 378:1132–41. doi: 10.1056/NEJMra1713301
19. Benson A, Murray S, Divakar P, Burnaevskiy N, Pifer R, Forman J, et al. Microbial infection-induced expansion of effector T cells overcomes the suppressive effects of regulatory T cells via an IL-2 deprivation mechanism. J Immunol (2012) 188:800–10. doi: 10.4049/jimmunol.1100769
20. Paterson AM, Lovitch SB, Sage PT, Juneja VR, Lee Y, Trombley JD, et al. Deletion of CTLA-4 on regulatory T cells during adulthood leads to resistance to autoimmunity. J Exp Med (2015) 212:1603–21. doi: 10.1084/jem.20141030
21. Kamada T, Togashi Y, Tay C, Ha D, Sasaki A, Nakamura Y, et al. PD-1 + regulatory T cells amplified by PD-1 blockade promote hyperprogression of cancer. Proc Natl Acad Sci (2019) 116:201822001. doi: 10.1073/pnas.1822001116
22. Liston A, Gray DHD. Homeostatic control of regulatory T cell diversity. Nat Rev Immunol (2014) 14:154–65. doi: 10.1038/nri3605
23. Campbell DJ. Control of regulatory T cell migration, function, and homeostasis. J Immunol (2015) 195:2507–13. doi: 10.4049/jimmunol.1500801
24. Xu T, Lu J, An H. The relative change in regulatory T cells/T helper lymphocytes ratio as parameter for prediction of therapy efficacy in metastatic colorectal cancer patients. Oncotarget (2017) 8:109079–93. doi: 10.18632/oncotarget.22606
25. Wang B, Zhang W, Jankovic V, Golubov J, Poon P, Oswald EM, et al. Combination cancer immunotherapy targeting PD-1 and GITR can rescue CD8+ T cell dysfunction and maintain memory phenotype. Sci Immunol (2018) 3:1–14. doi: 10.1126/sciimmunol.aat7061
26. Oldenhove G, Bouladoux N, Wohlfert EA, Hall JA, Chou D, Dos santos L, et al. Decrease of Foxp3+ treg cell number and acquisition of effector cell phenotype during lethal infection. Immunity (2009) 31:772–86. doi: 10.1016/j.immuni.2009.10.001
27. Hernandez R, Põder J, LaPorte KM, Malek TR. Engineering IL-2 for immunotherapy of autoimmunity and cancer. Nat Rev Immunol (2022) 22:614–28. doi: 10.1038/s41577-022-00680-w
28. Tan CL, Kuchroo JR, Sage PT, Liang D, Francisco LM, Buck J, et al. PD-1 restraint of regulatory T cell suppressive activity is critical for immune tolerance. J Exp Med (2020) 218. doi: 10.1084/jem.20182232
29. Perry JA, Shallberg L, Clark JT, Gullicksrud JA, DeLong JH, Douglas BB, et al. PD-L1–PD-1 interactions limit effector regulatory T cell populations at homeostasis and during infection. Nat Immunol (2022) 23:743–56. doi: 10.1038/s41590-022-01170-w
30. Simpson TR, Li F, Montalvo-Ortiz W, Sepulveda MA, Bergerhoff K, Arce F, et al. Fc-dependent depletion of tumor-infiltrating regulatory t cells co-defines the efficacy of anti-CTLA-4 therapy against melanoma. J Exp Med (2013) 210:1695–710. doi: 10.1084/jem.20130579
31. Schneider H, Rudd CE. Tyrosine phosphatase SHP-2 binding to CTLA-4: Absence of direct YVKM/YFIP motif recognition. Biochem Biophys Res Commun (2000) 269:279–83. doi: 10.1006/bbrc.2000.2234
32. Hui E, Cheung J, Zhu J, Su X, Taylor MJ, Wallweber HA, et al. T Cell costimulatory receptor CD28 is a primary target for PD-1–mediated inhibition. Sci (80-.). (2017) 355:1428–33. doi: 10.1084/jem.20130579
33. Kumagai S, Togashi Y, Kamada T, Sugiyama E, Nishinakamura H, Takeuchi Y, et al. The PD-1 expression balance between effector and regulatory T cells predicts the clinical efficacy of PD-1 blockade therapies. Nat Immunol (2020) 21:1346–58. doi: 10.1038/s41590-020-0769-3
34. Tekguc M, Wing JB, Osaki M, Long J, Sakaguchi S. Treg-expressed CTLA-4 depletes CD80/CD86 by trogocytosis, releasing free PD-L1 on antigen-presenting cells. Proc Natl Acad Sci (2021) 118. doi: 10.1073/pnas.2023739118
35. Hünig T, Beyersdorf N, Kerkau T. CD28 co-stimulation in T-cell homeostasis: a recent perspective. ImmunoTargets Ther (2015) 111:111–22. doi: 10.2147/ITT.S61647
36. Pen JJ, Keersmaecker BD, Heirman C, Corthals J, Liechtenstein T, Escors D, et al. Interference with PD-L1/PD-1 co-stimulation during antigen presentation enhances the multifunctionality of antigen-specific T cells. Br Dent. J (2014) 217:262–71. doi: 10.1038/gt.2013.80
37. Odorizzi PM, Pauken KE, Paley MA, Sharpe A, Wherry EJ. Genetic absence of PD-1 promotes accumulation of terminally differentiated exhausted CD8 + T cells. J Exp Med (2015) 212:1125–37. doi: 10.1084/jem.20142237
38. Schmidt EM, Wang CJ, Ryan GA, Clough LE, Qureshi OS, Goodall M, et al. CTLA-4 controls regulatory T cell peripheral homeostasis and is required for suppression of pancreatic islet autoimmunity. J Immunol (2009) 182:274–82. doi: 10.4049/jimmunol.182.1.274
39. Klocke K, Sakaguchi S, Holmdahl R, Wing K. Induction of autoimmune disease by deletion of CTLA-4 in mice in adulthood. Proc Natl Acad Sci (2016) 113:E2383–92. doi: 10.1073/pnas.1603892113
40. Walker LSK. PD-1 and CTLA-4: Two checkpoints, one pathway? Sci Immunol (2017) 2:1–5. doi: 10.1126/sciimmunol.aan3864
41. Marangoni F, Zhakyp A, Corsini M, Geels SN, Carrizosa E, Thelen M, et al. Expansion of tumor-associated treg cells upon disruption of a CTLA-4-dependent feedback loop. Cell (2021) 184:3998–4015.e19. doi: 10.1016/j.cell.2021.05.027
42. Christian DA, Adams TA, Shallberg LA, Phan AT, Smith TE, Abraha M, et al. cDC1 coordinate innate and adaptive responses in the omentum required for T cell priming and memory. Sci Immunol (2022) 7:eabq7432. doi: 10.1126/sciimmunol.abq7432
43. Grover HS, Blanchard N, Gonzalez F, Chan S, Robey EA, Shastri N. The toxoplasma gondii peptide AS15 elicits CD4 T cells that can control parasite burden. Infect Immun (2012) 80:3279–88. doi: 10.1128/IAI.00425-12
44. Schmidt EV. The role of c-myc in cellular growth control. Oncogene (1999) 18:2988–96. doi: 10.1038/sj.onc.1202751
45. Dose M, Khan I, Guo Z, Kovalovsky D, Krueger A, Von Boehmer H, et al. C-myc mediates pre-TCR-induced proliferation but not developmental progression. Blood (2006) 108:2669–77. doi: 10.1182/blood-2006-02-005900
46. Lu W, Gong D, Bar-Sagi D, Cole PA. Site-specific incorporation of a phosphotyrosine mimetic reveals a role for tyrosine phosphorylation of SHP-2 in cell signaling. Mol Cell (2001) 8:759–69. doi: 10.1016/S1097-2765(01)00369-0
47. Moran AE, Holzapfel KL, Xing Y, Cunningham NR, Maltzman JS, Punt J, et al. T Cell receptor signal strength in treg and iNKT cell development demonstrated by a novel fluorescent reporter mouse. J Exp Med (2011) 208:1279–89. doi: 10.1084/jem.20110308
48. Ho S, Clipstone N, Timmermann L, Northrop J, Graef I, Fiorentino D, et al. The mechanism of action of cyclosporin a and FK506. Clin Immunol Immunopathol (1996) 80:1433–9. doi: 10.1006/clin.1996.0140
49. Dupont CD, Christian DA, Selleck EM, Pepper M, Leney-Greene M, Harms Pritchard G, et al. Parasite fate and involvement of infected cells in the induction of CD4+ and CD8+ T cell responses to toxoplasma gondii. PloS Pathog (2014) 10:e1004047. doi: 10.1371/journal.ppat.1004047
50. Wherry EJ, Kurachi M. Molecular and cellular insights into T cell exhaustion. Nat Rev Immunol (2015) 15:486–99. doi: 10.1038/nri3862
51. Chemnitz JM, Parry RV, Nichols KE, June CH, Riley JL. SHP-1 and SHP-2 associate with immunoreceptor tyrosine-based switch motif of programmed death 1 upon primary human T cell stimulation, but only receptor ligation prevents T cell activation. J Immunol (2004) 173:945–54. doi: 10.4049/jimmunol.173.2.945
52. Blackburn SD, Shin H, Haining WN, Zou T, Workman CJ, Polley A, et al. Coregulation of CD8+ T cell exhaustion by multiple inhibitory receptors during chronic viral infection. Nat Immunol (2009) 10:29–37. doi: 10.1038/ni.1679
53. Keir ME, Butte MJ, Freeman GJ, Sharpe AH. PD-1 and its ligands in tolerance and immunity. Annu Rev Immunol (2008) 26:677–704. doi: 10.1146/annurev.immunol.26.021607.090331
54. Wing K, Onishi Y, Prieto-Martin P, Yamaguchi T, Miyara M, Fehervari Z, et al. CTLA-4 control over Foxp3+ regulatory T cell function. Sci (80-.). (2008) 322:271–5. doi: 10.1126/science.1160062
55. Marangoni F, Zhang R, Mani V, Thelen M, Ali Akbar NJ, Warner RD, et al. Tumor tolerance–promoting function of regulatory T cells is optimized by CD28, but strictly dependent on calcineurin. J Immunol (2018) 200:3647–61. doi: 10.4049/jimmunol.1701220
56. Sprouse ML, Shevchenko I, Scavuzzo MA, Joseph F, Lee T, Blum S, et al. Cutting edge: Low-affinity TCRs support regulatory T cell function in autoimmunity. J Immunol (2018) 200:909–14. doi: 10.4049/jimmunol.1700156
57. Yokosuka T, Takamatsu M, Kobayashi-Imanishi W, Hashimoto-Tane A, Azuma M, Saito T. Programmed cell death 1 forms negative costimulatory microclusters that directly inhibit T cell receptor signaling by recruiting phosphatase SHP2. J Exp Med (2012) 209:1201–17. doi: 10.1084/jem.20112741
58. Walunas TL, Lenschow DJ, Bakker CY, Linsley PS, Freeman GJ, Green JM, et al. CTLA-4 can function as a negative regulator of T cell activation. Immunity (1994) 1:405–13. doi: 10.1016/1074-7613(94)90071-X
59. Lee K, Chuang E, Griffin M, Khattri R, Hong DK, Zhang W, et al. Molecular basis of T cell inactivation by CTLA-4. Sci (80-.). (1998) 282:2263–6. doi: 10.1126/science.282.5397.2263
60. Marengère LEM, Waterhouse P, Duncan GS, Mittrücker H-W, Feng G-S, Mak TW. Regulation of T cell receptor signaling by tyrosine phosphatase SYP association with mittrücker, gen-sheng feng and tak w. mak. Science (80-.). (1996) 272:1170–3. doi: 10.1126/science.272.5265.1170
61. Tang Q, Adams JY, Tooley AJ, Bi M, Fife BT, Serra P, et al. Visualizing regulatory T cell control of autoimmune responses in nonobese diabetic mice. Nat Immunol (2006) 7:83–92. doi: 10.1038/ni1289
62. O’Brien CA, Overall C, Konradt C, O’Hara Hall AC, Hayes NW, Wagage S, et al. CD11c-expressing cells affect regulatory T cell behavior in the meninges during central nervous system infection. J Immunol (2017) 198:4054–61. doi: 10.4049/jimmunol.1601581
63. Rota G, Niogret C, Dang AT, Barros CR, Fonta NP, Alfei F, et al. Shp-2 is dispensable for establishing T cell exhaustion and for PD-1 signaling. In Vivo. Cell Rep (2018) 23:39–49. doi: 10.1016/j.celrep.2018.03.026
64. Horne-Debets JM, Faleiro R, Karunarathne DS, Liu XQ, Lineburg KE, Poh CM, et al. PD-1 dependent exhaustion of CD8+T cells drives chronic malaria. Cell Rep (2013) 5:1204–13. doi: 10.1016/j.celrep.2013.11.002
65. Schneider H, Rudd CE. Diverse mechanisms regulate the surface expression of immunotherapeutic target CTLA-4. Front Immunol (2014) 5:1–10. doi: 10.3389/fimmu.2014.00619
66. Rudd CE, Taylor A, Schneider H. CD28 and CTLA-4 coreceptor expression and signal transduction. Immunol Rev (2009) 229:12–26. doi: 10.1111/j.1600-065X.2009.00770.x
67. Guntermann C, Alexander DR. CTLA-4 suppresses proximal TCR signaling in resting human CD4 + T cells by inhibiting ZAP-70 tyr 319 phosphorylation: A potential role for tyrosine phosphatases. J Immunol (2002) 168:4420–9. doi: 10.4049/jimmunol.168.9.4420
68. Marin-Acevedo JA, Kimbrough EMO, Lou Y. Next generation of immune checkpoint inhibitors and beyond. J Hematol Oncol (2021) 14:1–29. doi: 10.1186/s13045-021-01056-8
Keywords: treg - regulatory T cell, checkpoint blockade immunotherapy, PD-1 - PD-L1 axis, CTLA-4 (cytotoxic T lymphocyte-associated antigen 4), homeostatic regulation, immune suppression, IL-10 (Interleukin 10), eTreg cells
Citation: Pereira JA, Lanzar Z, Clark JT, Hart AP, Douglas BB, Shallberg L, O’Dea K, Christian DA and Hunter CA (2023) PD-1 and CTLA-4 exert additive control of effector regulatory T cells at homeostasis. Front. Immunol. 14:997376. doi: 10.3389/fimmu.2023.997376
Received: 18 July 2022; Accepted: 10 February 2023;
Published: 07 March 2023.
Edited by:
Sutatip Pongcharoen, Naresuan University, ThailandReviewed by:
Francesco Marangoni, University of California, Irvine, United StatesWilliam L. Redmond, Earle A. Chiles Research Institute, United States
Copyright © 2023 Pereira, Lanzar, Clark, Hart, Douglas, Shallberg, O’Dea, Christian and Hunter. This is an open-access article distributed under the terms of the Creative Commons Attribution License (CC BY). The use, distribution or reproduction in other forums is permitted, provided the original author(s) and the copyright owner(s) are credited and that the original publication in this journal is cited, in accordance with accepted academic practice. No use, distribution or reproduction is permitted which does not comply with these terms.
*Correspondence: Christopher A. Hunter, Y2h1bnRlckB2ZXQudXBlbm4uZWR1
‡ORCID: Joseph A. Pereira, orcid.org/0000-0003-2341-8461
Zachary Lanzar, orcid.org/0000-0001-7229-0973
Joseph T. Clark, orcid.org/0000-0001-7764-6000
Andrew P. Hart, orcid.org/0000-0003-4821-7834
Bonnie B. Douglas, orcid.org/0000-0002-1039-7158
Lindsey Shallberg, orcid.org/0000-0001-6573-7327
Keenan O’Dea, orcid.org/0000-0001-9278-0697
David A. Christian, orcid.org/0000-0002-7160-9900
Christopher A. Hunter, orcid.org/0000-0003-3092-1428