 Jihao Tu
 Duo Wang†
 Bin Liu
95% of researchers rate our articles as excellent or good
Learn more about the work of our research integrity team to safeguard the quality of each article we publish.
Find out more
ORIGINAL RESEARCH article
Front. Immunol. , 06 February 2023
Sec. Cancer Immunity and Immunotherapy
Volume 14 - 2023 | https://doi.org/10.3389/fimmu.2023.911368
This article is part of the Research Topic Immunosenescence in the Cancer Microenvironment View all 15 articles
Background: Osteosarcoma is the most frequent primary bone tumor with a poor prognosis. Immune infiltration proved to have a strong impact on prognosis. We analyzed single-cell datasets and bulk datasets to confirm the main immune cell populations and their properties in osteosarcoma.
Methods: The examples in bulk datasets GSE21257 and GSE32981 from the Gene Expression Omnibus database were divided into two immune infiltration level groups, and 34 differentially expressed genes were spotted. Then, we located these genes among nine major cell clusters and their subclusters identified from 99,668 individual cells in single-cell dataset GSE152048 including 11 osteosarcoma patients. Especially, the markers of all kinds of myeloid cells identified in single-cell dataset GSE152048 were set to gene ontology enrichment. We clustered the osteosarcoma samples in the TARGET-OS from the Therapeutically Applicable Research to Generate Effective Treatments dataset into two groups by complete component 1q positive macrophage markers and compared their survival.
Results: Compared with the low-immune infiltrated group, the high-immune infiltrated group showed a better prognosis. Almost all the 34 differentially expressed genes expressed higher or exclusively among myeloid cells. A group of complete component 1q-positive macrophages was identified from the myeloid cells. In the bulk dataset TARGET-OS, these markers and the infiltration of complete component 1q-positive macrophages related to longer survival.
Conclusions: Complete component 1q-positive tumor-associated macrophages were the major immune cell population in osteosarcoma, which contributed to a better prognosis.
Osteosarcoma (OS) represents the most frequent and primary bone sarcoma, which primarily affects children, adolescents, and young adults (1). The standard therapy for OS, comprising surgery and chemotherapy, was established in the 1980s and resulted in long-term survival in >60% of patients presenting with localized disease (2); however, limited therapeutic progress has been made since that time.
Infiltrating immune and stromal cells are essential for OS progression (1). The immune infiltration level was considered an important factor in response to immunotherapy and prognosis. Analyses of the tumor microenvironment (TME) of OS consistently demonstrate an immune cell infiltration consisting of both macrophages and T cells (1, 3, 4). Primary OS is demonstrated as “immune deserts,” devoid of T cells and NK cells (5, 6). Instead, myeloid cells were observed in large quantities (7). In the OS microenvironment, tumor-associated macrophages (TAMs) play a critical role in immunoreaction (8). However, among contradictory conclusions, it is still not clear if these myeloid cells or the TAMs contribute to tumor growth or tumor limitation.
In the analysis of the public dataset GSE150248, we found that TAMs were an essential population in the TME of OS. Generally, macrophages are considered as a plastic cell type because they can be polarized into different phenotypes. M1-type macrophages (M1) and M2-type macrophages (M2) are two major kinds of them. M1 can be induced by pathogen‐associated patterns such as lipopolysaccharides and interferon‐γ. M1 highly expresses interleukin 6 (IL‐6), IL‐1β, and tumor necrosis factor, which facilitate a proinflammatory response. M2 can be induced by IL‐4 and IL‐13, which turn on the expression of anti‐inflammatory cytokines, such as IL‐10 and ARG1. These are considered immune suppression and pro-tumor signals (9). Reprograming M2-like TAMs to M1-like TAMs exerts a synergistic effect in radiotherapy and overcoming chemoresistance in breast cancer (10–12). Macrophages can also be divided by where they were produced. TAMs are proved to be of dichotomous origin, from in situ proliferation marked by FOLR2 and the differentiation of circulating monocytes marked by TREM2 (13–15). It is reported that the M1 or M2 paradigm is an oversimplification, Tissue-resident macrophages are far more complex cells with a full range of identities and activation states (16). In human breast cancer, tissue-resident FOLR2+ macrophages instead of M1 or M2 are proved to associate with CD8+ T-cell infiltration and better prognosis (17).
Complete component 1q (C1Q), one of the three first components of the classical pathway, modulates both inflammation and repair progress (18). C1Q is a marker of a particular subpopulation of tissue-resident macrophages and TAMs, which often expresses CD206, HLA-DR, SEPP1, FOLR2, and APOE (19). In cancer, C1Q is usually regarded as a cancer-promoting factor (15, 20). In the classical pathway, C1Q generates the C5a production, which was proved as an immunosuppression and angiogenesis factor in cancer progression (21–23). C1Q can function as a pattern recognition receptor to apoptotic cells and extracellular vesicles before a non-inflammatory clearance by macrophages. In this case, macrophages produce M2 markers such as IL-10 and TGFβ (24).
Here, we explored the immune-related genes of OS. Especially, we mapped these genes among all the cell populations through a combination of bulk-sequencing and single-cell sequencing technology. We found that C1Q+ TAMs are the main immune cells in the OS TME. In detail, C1Q is an obvious immune-related gene expressed exclusively by myeloid cells. Moreover, this research found that C1Q, different from its pro-tumor characteristic in other cancers (15), seems to be an antitumor factor in OS. C1Q+ TAMs promote CD8+ T-cell dysfunction and tumor growth in the Lewis lung carcinoma mouse model (25). However, we noticed that C1Q+ TAMs act as an antitumor cell population in OS.
Clinical and transcriptome data of OS patients were downloaded from the Therapeutically Applicable Research to Generate Effective Treatments (TARGET) database (https://ocg.cancer.gov/programs/target) and the Gene Expression Omnibus (GEO) database (https://www.ncbi.nlm.nih.gov/geo/). Dataset TARGET-OS contains 88 samples with both complete survival information and expression profiles. Dataset GSE21257 contains 53 OS samples with survival information and expression profiles. Dataset GSE32981 contains 23 samples with only expression profiles. Specific clinical information of 88 samples in the TARGET database and 53 samples in the GSE21257 dataset is separately listed in Supplementary Tables S7, S8. Dataset GSE152048, a single-cell dataset, contains tumor samples from 11 OS patients (five men and six women, 11–38 years old). There are eight osteoblastic OS lesions, including six primary, one recurrent, and one lung metastatic lesions, and three chondroblastic OS lesions including one primary, one recurrent, and one lung metastasis site. The workflow of this research is provided in Figure 1.
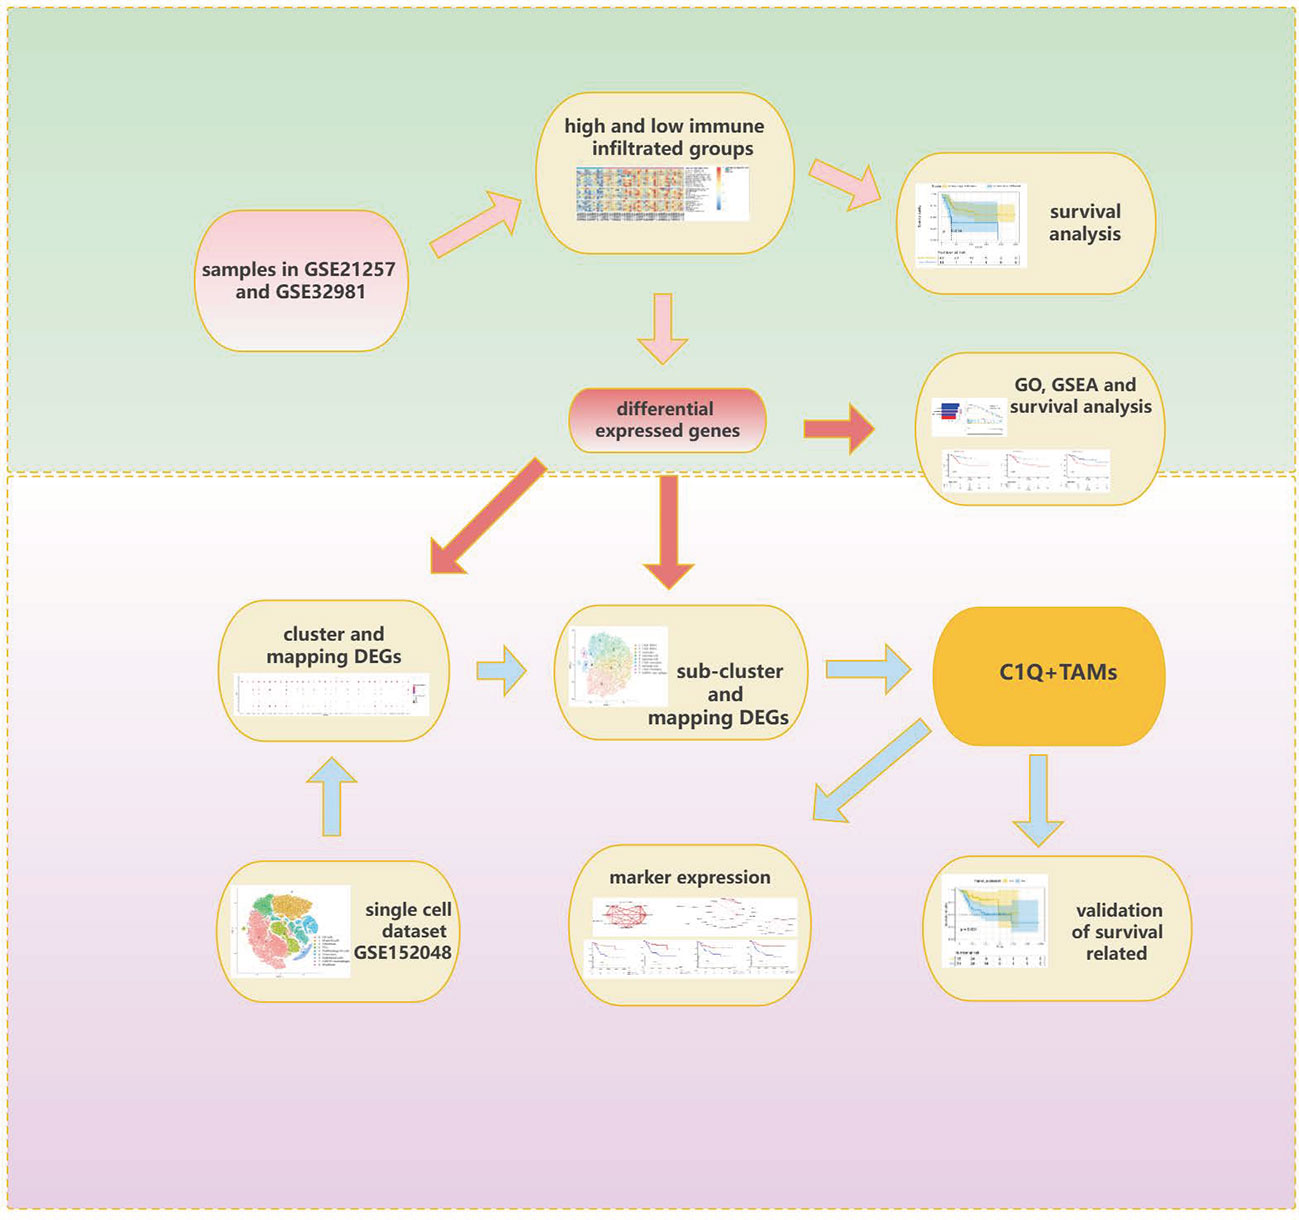
Figure 1 Workflow of this research.
The samples in datasets GSE21257 and GSE32981 were clustered into high- and low-immune infiltrated groups by R. We used identified immune metagenes (26) and function hclust(x, method = “complete”) and cutree(x, k = 2) to divide the samples into two groups. Then, the overall survival was compared between two groups by the R package survival (https://CRAN.R-project.org/package=survival) and survminer (https://CRAN.R-project.org/package=survminer). The grouping of samples in dataset TARGET-OS was almost the same, except that the immune metagenes were replaced by C1Q+ TAM markers with a fold change larger than 0.25. Based on the normalized expression matrix, immune scores across OS specimens from the GSE21257 dataset were estimated using single-sample gene set enrichment analysis (ssGSEA). This algorithm infers the overall infiltration levels of immune cells in tumor tissues using gene expression signatures. The Kaplan–Meier overall survival curves were examined between groups, and the prognosis was compared by log-rank test.
The limma, edgeR, and DESeq2 packages were applied for differential expression analysis (27–29). |Fold change (FC)| > 1.5 and adjusted p < 0.05 were set as the criteria of differentially expressed gene (DEG) identification. The enrichment analysis of DEGs was carried out via the clusterProfiler package, including Gene Ontology (GO) (30). Terms with adjusted p < 0.05 were significantly enriched. Gene set enrichment analysis (GSEA) evaluates microarray data at the level of gene sets. The DEGs identified from GSE21257 were used as the gene sets (30).
Single-cell dataset GSE152048 was processed with the Seurat package (version 4.1.0; http://satijalab.org/seurat/). Each of the 11 samples generated a Seurat object by function Read10×. Next, we filtered out the cells with less than 300 expressed genes or with mitochondrial gene expression accounting for more than 10% of total expressed genes. The top 3,000 highly variable genes were picked up for the principal component analysis. Further, the doublets in each Seurat object were cleared out by the DoubletFinder package (version 2.0.3) (31). We integrated the 11 Seurat objects into one combined Seurat object by base function merge(). The batch effects were removed by the Harmony package (version 1.0). Functions FindNeighbors(x, reduction = “harmony”), FindClusters(x, resolution = 0.1), and FindAllMarkers(x) were applied to the cell clustering and cluster annotation. Fold change (FC) > 0.25 and adjusted p < 0.05 were set as the criteria of DEGs or markers between cell groups. 2D maps of the identified clusters were generated with the distributed Stochastic Neighbor Embedding or Uniform Manifold Approximation and Projection method. A similar procedure was applied during the subclustering analysis.
CellPhoneDB 2 is a repository of ligand–receptor complexes and a statistical tool to predict the cell-type specificity of cell–cell communication via molecular interactions (32). The repository includes subunit architecture for both ligands and receptors, to accurately represent heteromeric complexes. We used CellPhoneDB 2 to calculate the interaction pairs between C1Q+ TAMs and the rest of the 13 clusters that gained after clustering and subclustering. Interaction pairs with a p-value less than 0.05 returned by CellPhoneDB 2 were picked up to draw an interaction bubble plot.
CellPhoneDB 2 was used in the python 3.7 environment; the rest of the analysis was presented using R version 4.1.2 (http://www.R-project.org) and its appropriate packages.
After clustering, 40 and 13 samples of dataset GSE21257 were divided into high- and low-immune infiltrated groups, respectively (Figure 2A). Then, we calculated the immune infiltration scores of these two groups by ssGSEA. The high-immune infiltrated group indeed showed a higher immune cell score, but it is kind of strange that all kinds of immune cell scores were lower in the low-immune infiltrated group (Figure 2B); especially, the low-immune infiltrated group indeed showed some highly expressed genes. Maybe it was one kind of immune cell that caused the highly expressed genes in both two groups. The high-immune infiltrated group had a better prognosis (Figure 2C). We performed a similar analysis progress, dividing samples and then calculating the immune scores using ssGSEA, on GSE32981 (Figure S1). There were 20 and 3 samples in GSE32981 that were divided into high- and low- immune infiltrated groups (Figure S1A). The high-immune infiltration group also showed a higher immune score (Figure S1B). A step further, DEGs between high-and low-immune infiltrated groups were respectively collected in datasets GSE21257 and GSE32981. The high-immune infiltrated group of GSE21257 got 146 higher expressed genes and 261 lower expressed genes. As for GSE32981, it got 110 higher expressed genes and 14 lower expressed genes. In a total of 240 higher expressed genes, 34 overlapped genes were picked up. We found no intersections between 275 lower expressed genes. Moreover, just like the survival plot depending on immune-related grouping, almost all of these 34 genes were bound up with better overall survival (Figures 2F, S2). GO biological process enrichment showed that those 34 gene genes were involved in the process of leukocyte and T-cell proliferation (Figure 2D). Further GSEA of DEG analyses showed the hallmarks of complement signaling, cytokine−cytokine receptor interaction, osteoclast differentiation, phagocytosis, and viral protein interaction with cytokine and cytokine receptor were highly enriched (Figure 2E).
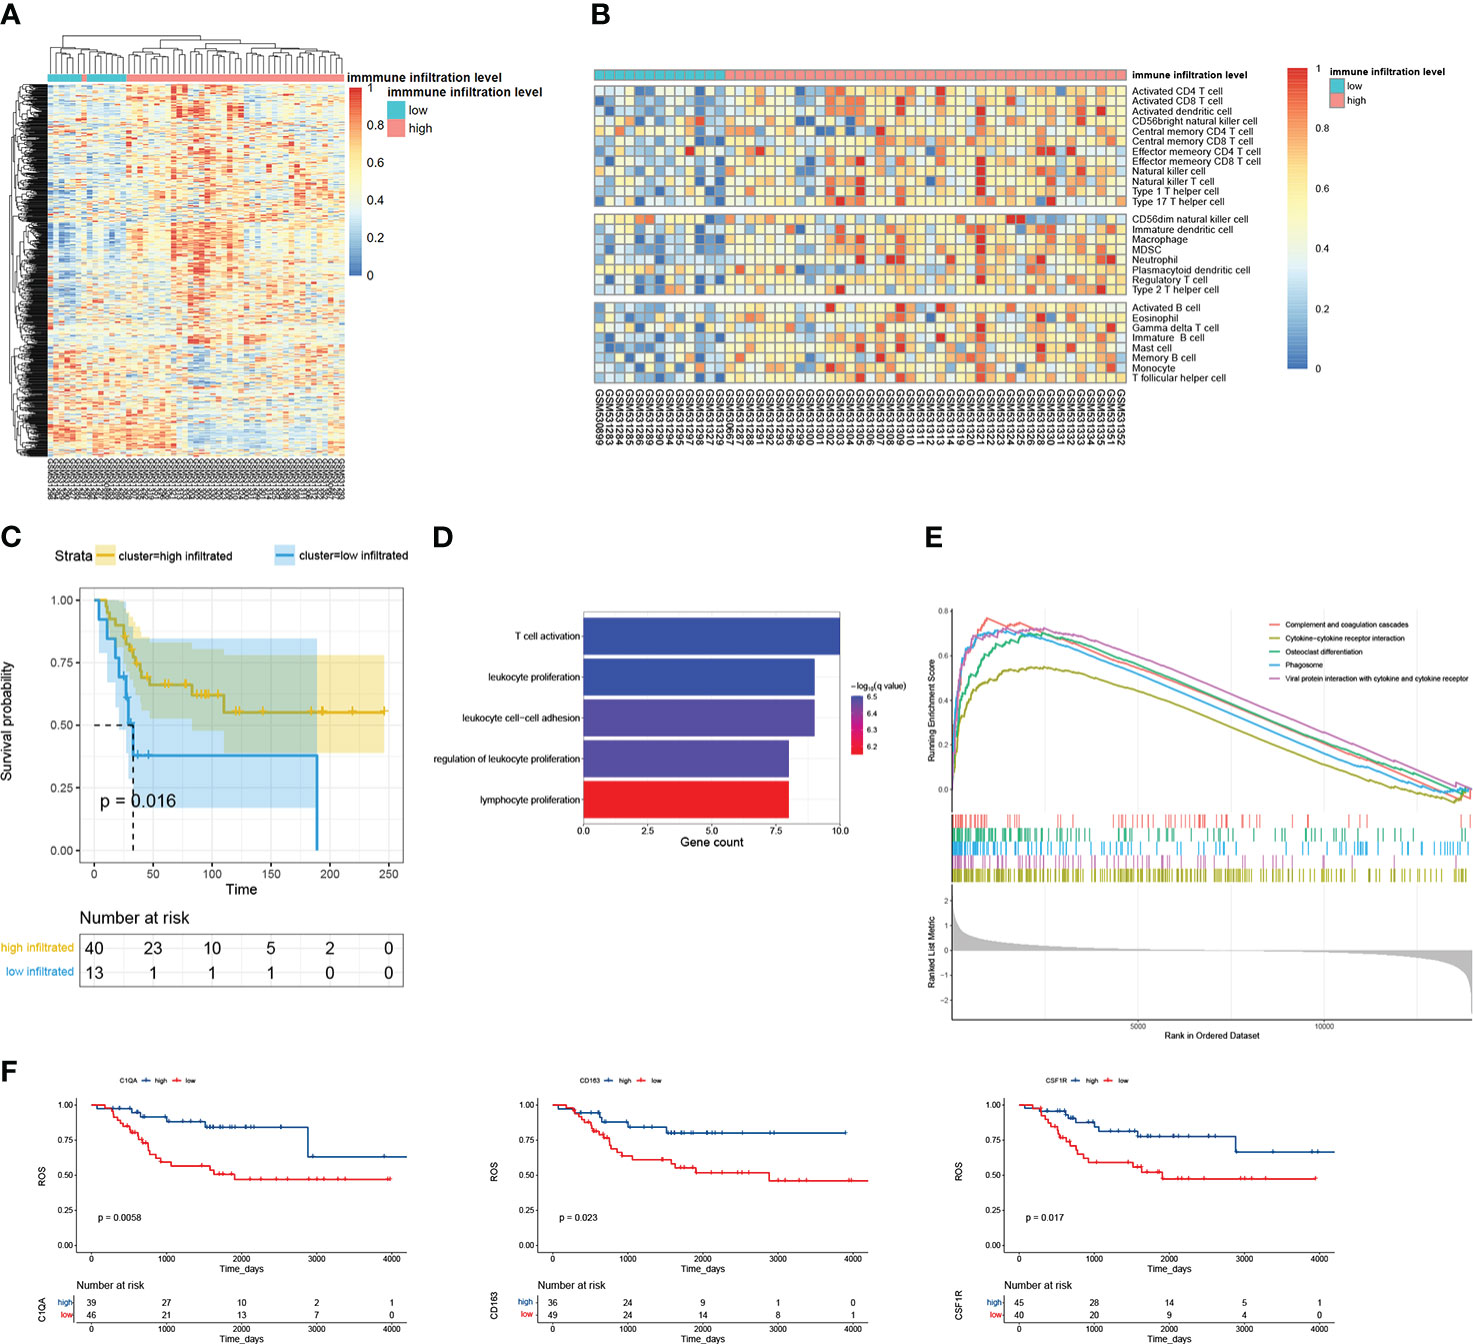
Figure 2 The overview of analyzing GSE21257. (A) There were 53 examples clustered into two groups by immune metagenes. (B) The score of 28 kinds of immune cells calculated by ssGSEA. The 53 examples were ordered by their immune groups instead of getting clustered. (C) The survival plot of high- and low- immune infiltrated groups. (D) Biological process enrichment of the 34 overlapped DEGs. (E) GSEA of the 34 overlapped genes; the top 5 terms were selected. All p-values are 1e-10, and all p.adjust are 1.447826e-09. (F) The survival plot of overlapped genes.
To explore the source of higher expressed genes, we analyzed the cell population of OS with the single-cell sequencing dataset GSE152048. After initial quality control assessment and doublet removal, we obtained single-cell transcriptomes from a total of 99,668 cells. These cells were clustered into nine groups. They are as follows: (0) 37,939 OS cells highly express SPP1, COL2A1, SOX9, and ACAN; (1) 21,067 myeloid cells highly express CD74, CD14, and FCGR3A; (2) 13,667 fibroblasts highly express COL1A1 and LUM; (3) 8,089 TILs including T and NK cells highly express IL7R, CD3D, and NKG7; (4) 7,699 proliferating OS cells highly express TOP2A, PCNA, and MKI67; (5) 7,307 osteoclasts highly express MMP9 and CTSK; (6) 3,646 endothelial cells highly express vWF, (7) 129 FABP4+ macrophages highly express FCGR3A and FABP4; and (8) 125 myoblasts highly express MYPL (Figures 3A–D). The violin plots show the expression level of one representative marker gene of each cell group, sequentially, except C1QA. It is more convenient to compare the expression of markers by dot plot (Figures 3B, C). COL1A1, a marker of fibroblasts and OS cells, is mainly expressed in fibroblasts and also in OS cells. In addition, ACAN is mainly expressed in OS cells but also in fibroblasts. First, seven clusters are distributed evenly among 11 patients (Figure 3D). The FABP4+ macrophage group and myoblast group, with very little cell number, consist mainly of cells in sample BC17. It is worth noting that the FABP4+ macrophages have an unusually high number of detected genes. We also calculated the DEGs in each cell group and the GO terms these genes enriched (Table S1). The markers in myeloid cells were enriched in immune response, myeloid cell activation, and myeloid cell differentiation (Table S2). We tried to match the 34 higher expressed DEGs to the certain cell groups identified here. The dot plot showed that these genes were largely expressed by myeloid cells and FABP4+ macrophages (Figure 3E).
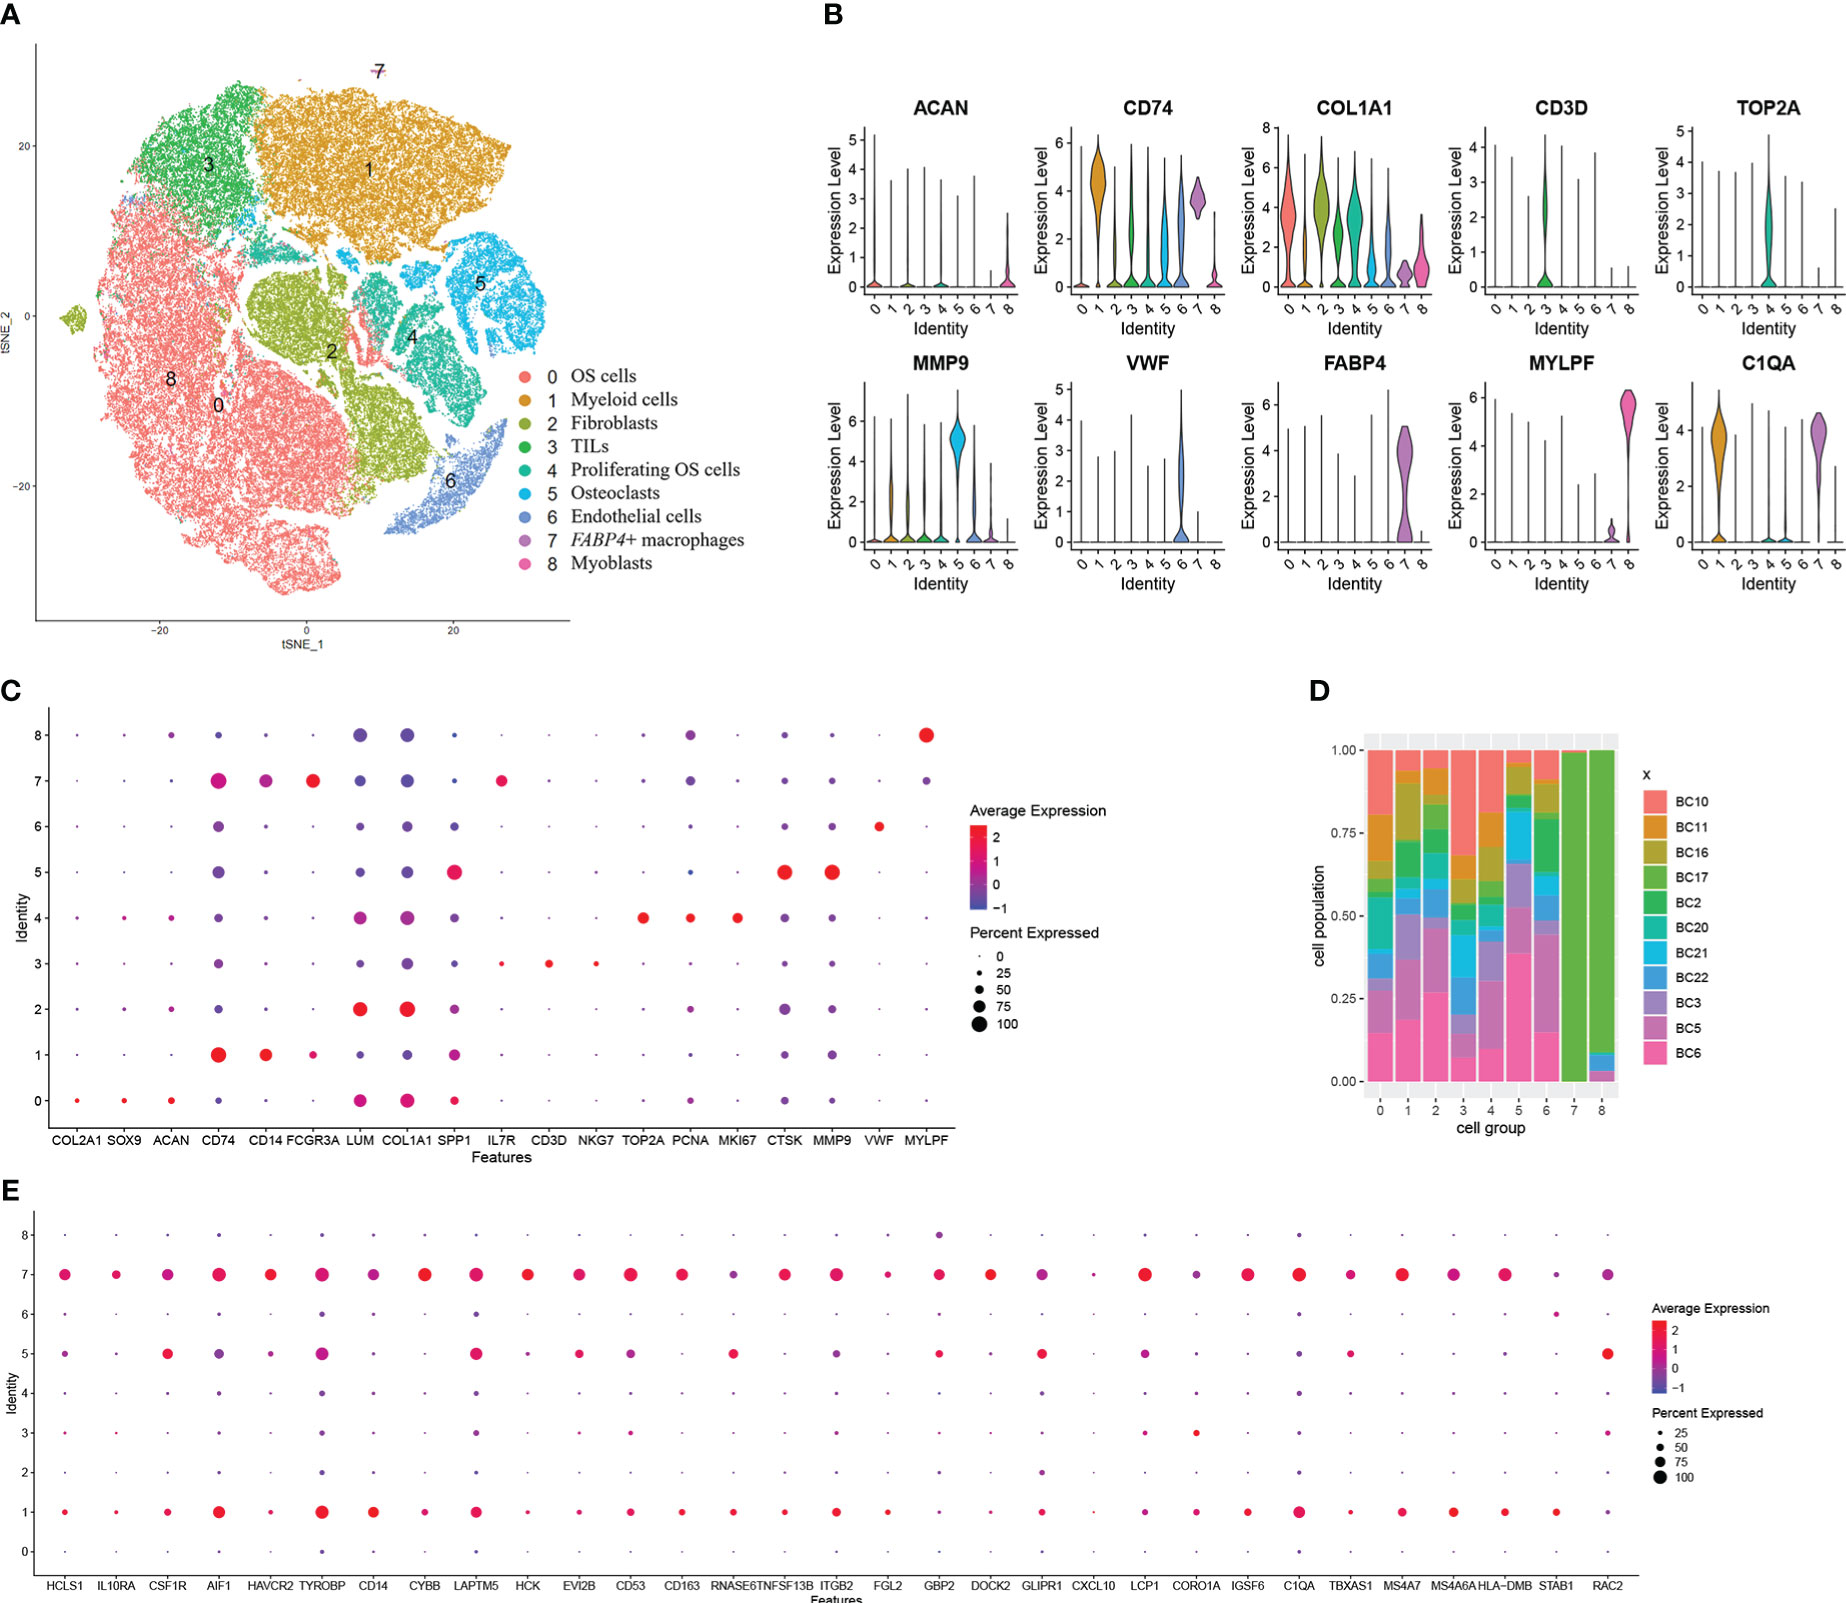
Figure 3 Single-cell transcriptomic analysis reveals the transcriptome of cells in the microenvironment of OS. (A) The t-distributed stochastic neighbor embedding (t-SNE) plot of the nine identified main cell types in OS lesions. (B) Violin plots showed the normalized expression levels of eight representative canonical markers across the nine clusters. (C) Representative marker expression in nine clusters of cells. Dot size indicates the proportion of cells expressing markers. Dot color shows the average expression level of the markers. (D) Distribution of the nine clusters among 11 patients with OS. (E) Dot plot of the 34 overlapped DEGs showing their expressing proportion and level among nine clusters.
As DEGs were expressed by myeloid cells and FABP4+ macrophages, we took the myeloid cell group to a subcluster analysis similar to the previous step. Myeloid cells were divided into nine clusters when the resolution was set as 0.5. We identified six cell groups from the nine clusters (Figures 4A–D). They are (1) 9,601 C1Q+ TAMs with high C1Q expression in clusters 0 and 1; (2) 3,516 monocytes with low C1Q expression and high G0S2 and S100A9 expression in cluster 2; (3) 1,072 C1Q+ osteoclasts with high C1Q, MMP9, and CTSK expression in cluster 5; (4) 609 C1Q+ fibroblasts with high C1Q, COL1A1, and LUM expression in cluster 7; (5) 79 FABP4+ macrophages with high FABP4 expression in cluster 8; and (6) 7,418 unknown cells in clusters 3, 4, and 6 (Figures 4A–D). The violin plot shows that CD14, CD74, and C1Q are expressed in all groups (Figure 4B). C1Q expresses the highest in C1Q+ TAMs and lower in monocytes and C1Q+ osteoclasts (Figure 4C, Table S3). Osteoclasts and fibroblasts identified previously barely express C1Q (Figure 3B). Then, we call these two groups of cells C1Q+ fibroblasts and C1Q+ osteoclasts since they express both C1Q and individual markers. They can also be special kinds of macrophages. The unknown cells have inconspicuous markers with a low fold change and uncertain gene ontology biological process (Tables S3, 4). The FABP4+ macrophages came from all 11 patients, a very small amount of which came from BC17 (Figure 4D). Figure 3D shows that the FABP4+ macrophage group mainly came from BC17. We consider that the two FABP4+ macrophage groups identified in twice clustering are the same. We compared marker genes of these cell groups and 34 DEGs obtained previously. There are 15 DEGs including C1QA found to be C1Q+ TAM markers Figure 4E, Table S3, 6 DEGs found to be monocyte markers. The GO enrichment of C1Q+ macrophage markers showed antigen processing and presentation and neutrophil activation (Figure 4F). We also set other cell groups to the GO analysis (Table S4).
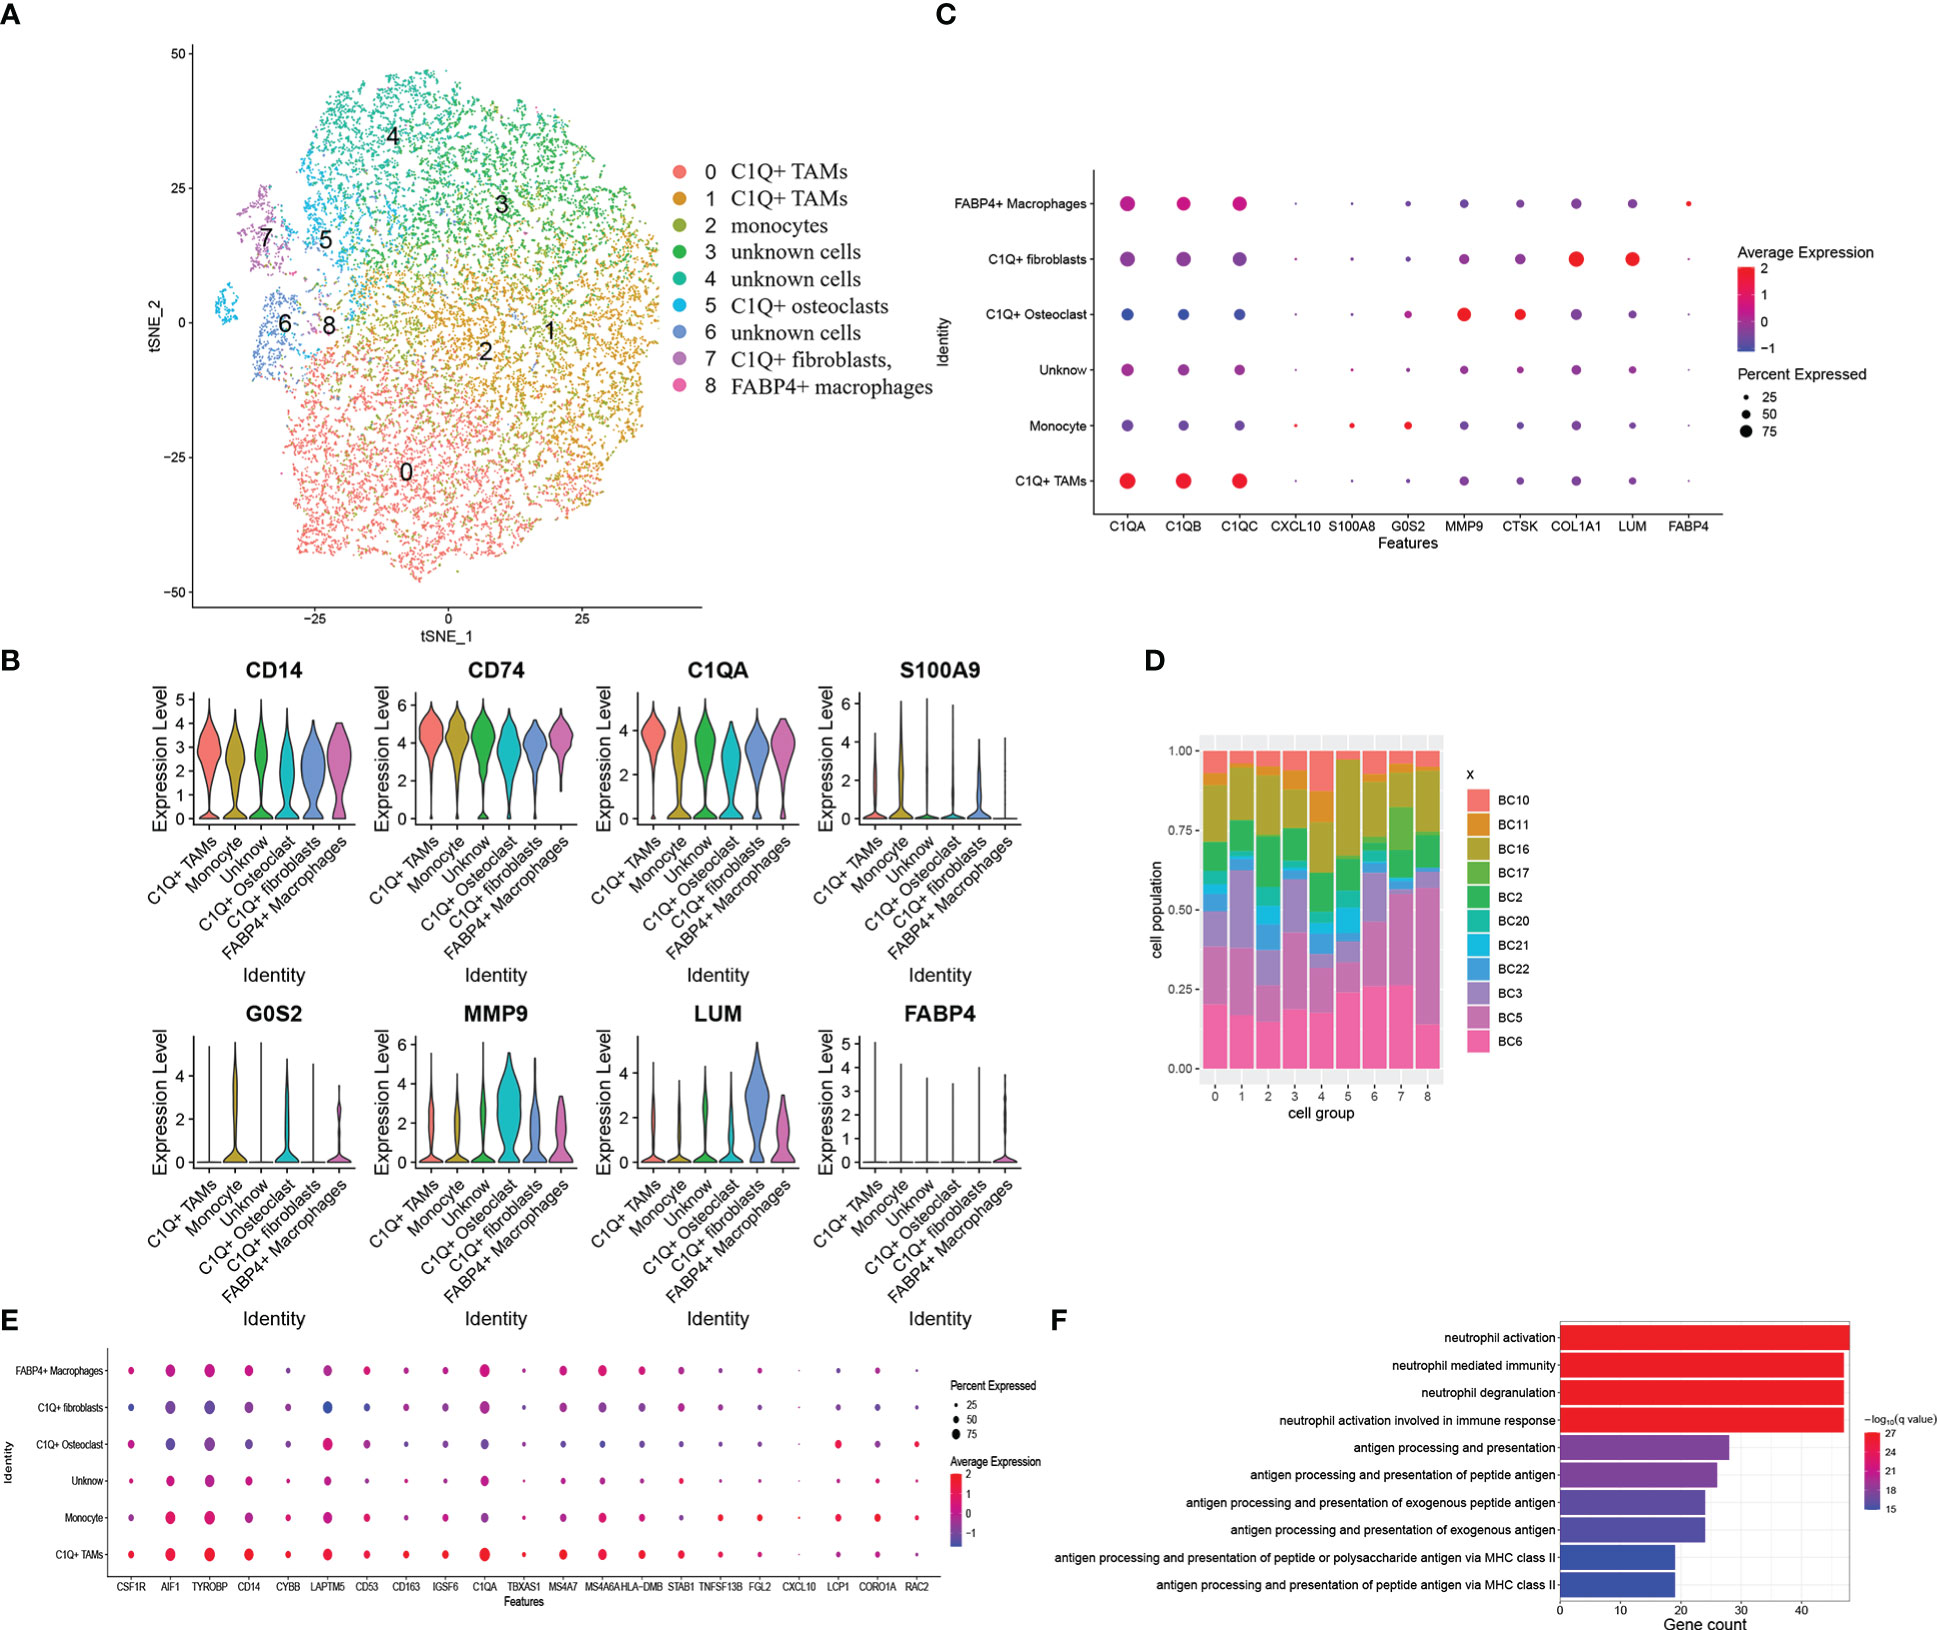
Figure 4 Myeloid cells subclustered and DEGs combined with these six cell groups. (A) The t-SNE plot of the nine identified clusters or six cell groups. (B) Violin plots showed the normalized expression levels of representative markers across the six cell groups (C) Representative markers expression in six cell groups. Dot size and color delivered the same meaning as the previous dot plot (D) Distribution of the nine clusters among 11 patients with OS. (E) Dot plot of the overlapped DEGs, which represented as C1Q+ TAM markers. The plot showed expressing proportion and level among six cell groups of these DEGs. (F) Biological process enrichment of C1Q+ TAM markers.
C1Q+ TAMs have 219 markers, we found that 5 of 10 top markers with the highest fold change were related to a better prognosis. They are C1QA, C1QB, FOLR2, LGMN, and APOE (Figure 5A). Similarly, we divided examples of dataset TARGET-OS into two groups by the result of the hierarchical cluster using the highly expressed markers of C1Q+ TAMs (Figure 5B). Moreover, the group with high C1Q+ macrophage marker expression showed a better overall survival (Figure 5C), which indicated that C1Q+ TAM infiltration plays an antitumor role. We calculated the co-expression coefficients between the 219 markers. We select C1QA, C1QB, and C1QC as a benchmark. The correlation coefficients among the three were 0.97, 0.97, and 0.98 in dataset TARGET-OS. In C1Q+ TAMs, it was 0.44. However, when we separated these C1Q+ TAMs by patients, the correlation coefficients of C1Q+ TAM markers from each patient evenly vary between 0.5 and 0.8 except BC2, BC3, and BC5 (Table S5). The difference could come from the heterogeneity of different patients’ TAMs and also the gene co-expressed between C1Q+ TAMs and other cells since other myeloid cells also express C1QA/B/C. We calculated the coefficients of the TAM markers for each patient, picked up the obvious co-expression genes, and drew the mean coefficients by Cytoscape (Figure 5D, Table S6). CD74, HLA-D, complement1, and apolipoprotein took the dominant role. Furthermore, we explored the cell–cell interactions and the ligand–receptor pairs between C1Q+ TAMs and other cell groups gained from the first clustering and subclustering (Figure 5E). Cell–cell interaction analysis by cellphone showed that C1Q+ TAMs mostly acted on endothelial cells. The ligand–receptor pairs are CCL2/CCL8-ACKR1, CXCL1/5/8-ACKR1, VEGFA-KDR/FLT1, TNF-FLT4, and CCR1–CCL14. We noticed that C1Q+ TAMs express higher CCL2 and lower VEGFA and CXCL8 (Table S3).
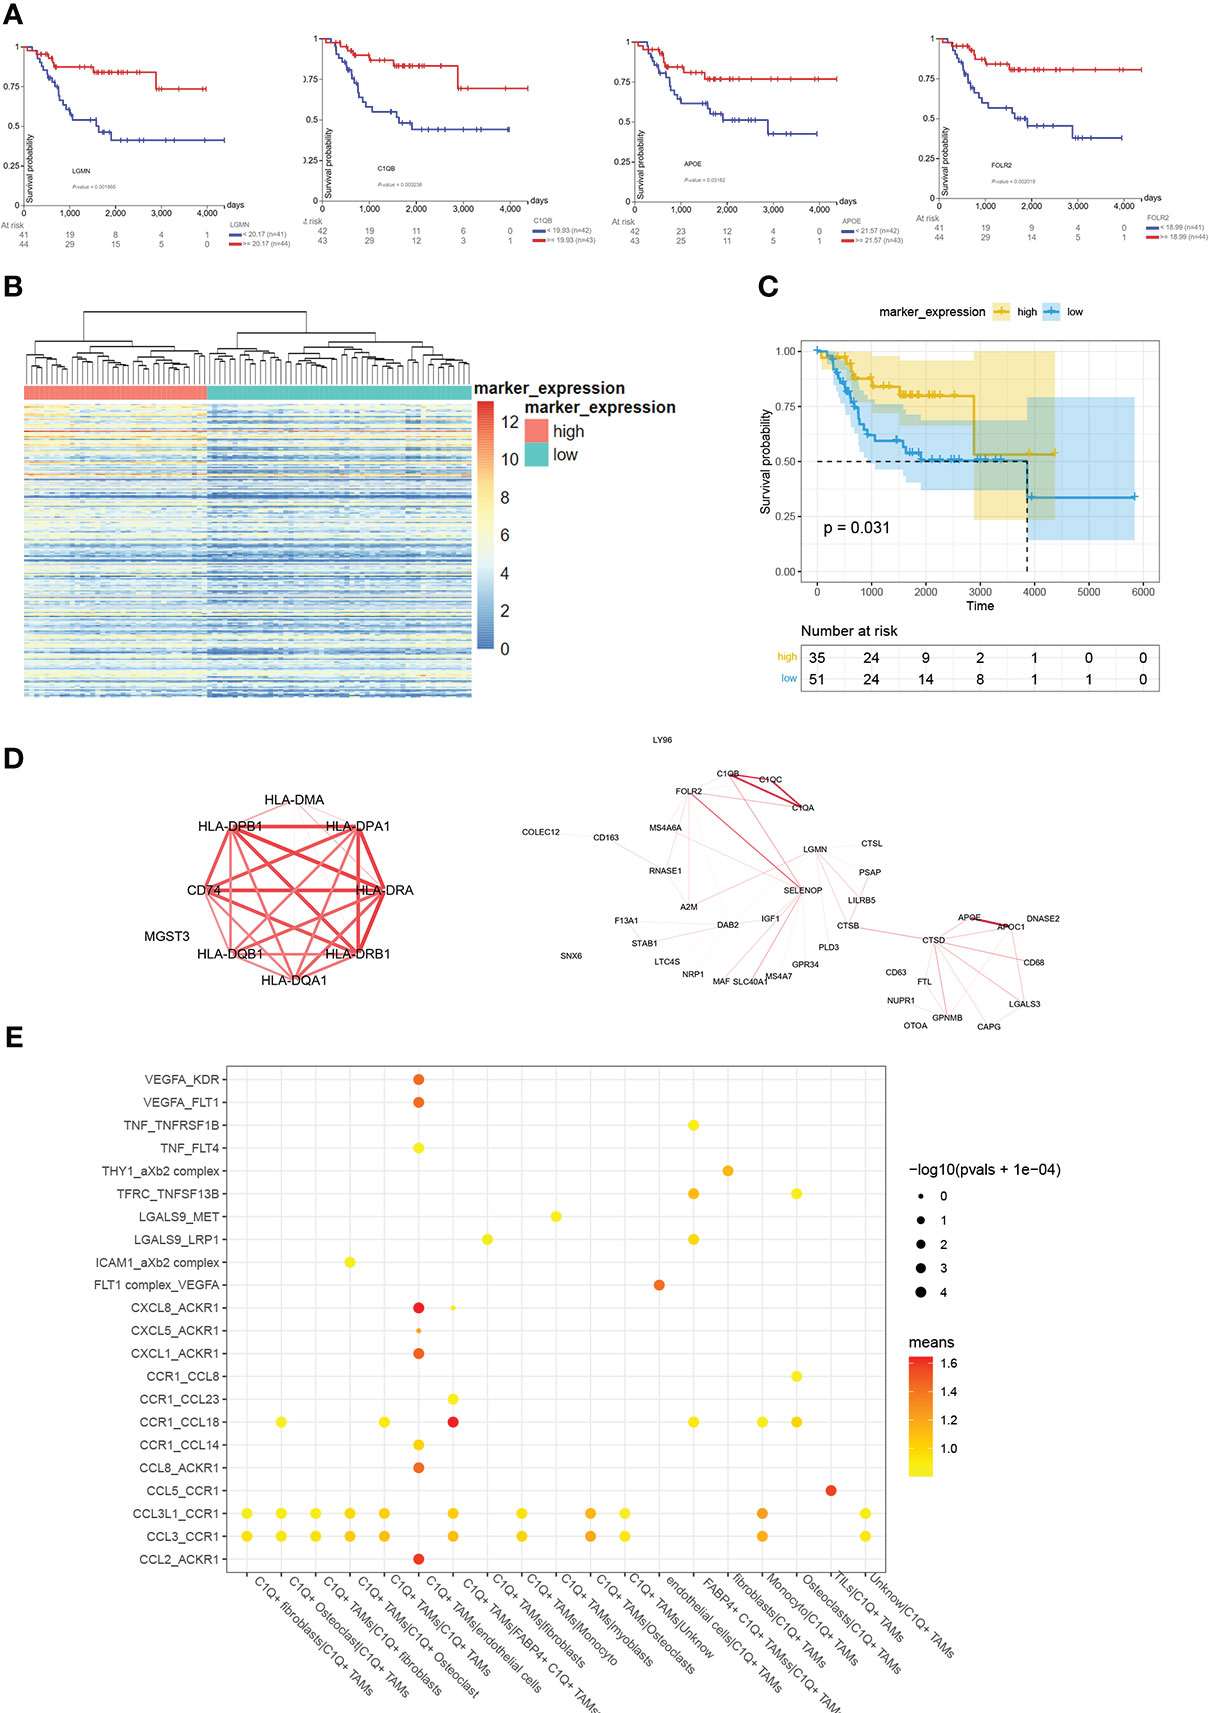
Figure 5 Overview of analyzing C1Q+ TAMs group and its marker. (A) The survival plots of C1QA, C1QB, FOLR2, LGMN, and APOE. (B) Cluster 88 examples in TARGET-OS into two groups by C1Q+ TAM markers with a fold change larger than 0.25. (C) The survival plot of high- and low- C1Q+ TAM infiltration groups. (D) The co-expression among C1Q+ TAM markers. The larger co-expression coefficient gets redder and wider lines. (E) Bubble plots show ligand–receptor pairs between C1Q+ TAMs and other cell groups.
The authors of dataset GSE21257 found that TAMs were associated with reduced metastasis and longer survival in high-grade osteosarcoma (33). We had similar findings, combining bulk datasets with a single-cell dataset. We reported more details about these TAMs in OS. Unlike many other kinds of tumors (15), we found that higher expressed C1Q was related to a better prognosis and the C1Q+ TAMs in OS were identified as an antitumor factor.
In the analysis of bulk datasets GSE21275 and GSE32981, we divided the examples into high- and low- immune infiltrated groups according to their hierarchical cluster results. Although the high-immune infiltrated groups showed that no kind of immune cell was lower infiltrated compared to the low-immune infiltrated groups, it showed better overall survival. Moreover, most of the DEGs were related to a better prognosis. These results portrayed an antitumor image of immune infiltration in OS. Next, we tried to identify immune components that play the most important role in the OS TME.
In order to minimize the error caused by the analysis method, we performed the differential expressing twice more using R packages edgeR and DESeq2 (Figure S3). We also mapped these DEGs in GSE152048 (Figure S4). They were mostly expressed by myeloid cells and C1Q+ TAMs. Then, we thought that the difference of the immune microenvironment is mainly caused by C1Q+ TAMs.
The analysis of GSE152048 showed that TAMs were the main immune cell population in OS. Further research showed that the DEGs gained from bulk datasets were enriched in C1Q+ TAMs, the markers of C1Q+ TAMs were related to a better prognosis, and the infiltration of C1Q+ TAMs went with better overall survival. These results indicated strongly that C1Q+ TAMs were just the main immune cell population against OS.
Although C1Q is regarded as a cancer-promoting factor (20), it has multiple regulatory effects on the immune system including inflammation and repair progress (18). C1Q could function as a pattern recognition receptor to opsonize apoptotic cells and extracellular vesicles. The extracellular vesicle-combined C1Q induces IL-10 and TGF-β production in macrophages (24). Moreover, IL-10 and TGF-β are known as immunosuppressive mediators and tumor promoters (34, 35). High-mobility group box 1 (HMGB1) and HMGB1 plus C1Q can respectively regulate inflammatory macrophage polarization. HMGB1 plus C1Q induced an anti-inflammatory phenotype by inhibiting IRF5, a regulator of pro-inflammatory macrophage polarization (36), when HMGB1 singly induced a pro-inflammatory phenotype by upregulating IRF5 (37). As the trigger of the classical pathway of complement, C1 can produce C3a and C5a through cascade reaction. C3a and C5a can modulate the immune microenvironment toward a pro-tumor or antitumor response. Tumor type and local concentrations of the anaphylatoxins matter in this regulation (38).
Some research depicted the possible ways that C1Q+ TAMs promote or limit tumors. In colorectal cancer, the RNA N+6-methyladenosine (m6A) program can regulate C1Q+ TAMs, which express multiple immunomodulatory ligands to modulate tumor-infiltrating CD8+ T cells. A low METTL14-m+6A level induces high levels of EBI3, a cytokine subunit, and finally leads to dysfunctional T cells (25). In clear-cell renal cell carcinoma, high densities of C1Q-producing TAMs contributed to the immunosuppressed microenvironment, in which a high expression of immune checkpoints was detected (39).
TAMs with different phenotypes could exert conversely on OS. M1 induced by interferon γ could secrete HSPA1L to promote OS cell apoptosis via IRAK1 and IRAK4 in vitro. HSPA1L can be upregulated by LGALS3BP secreted by OS cells binding to LGALS3 on M1 (40). M1 was thought to produce iNOS, oxygen intermediates, colony-stimulating factors, tumor necrosis factors, and interleukins to promote inflammation and to suppress OS. However, specific blockage of cytokines, nitric oxide, or reactive oxygen species did not inhibit the antitumor effect (41). M1 markers were found to enrich at the tumor interface region, whereas M2 markers were found to present throughout the whole tumor in OS pulmonary metastases (7). M2 could be recruited by IL34 and promote osteosarcoma growth (42). IL10-polarized M2 could suppress OS in the presence of the anti-EGFR cetuximab (41). M2 enhanced metastasis of OS cells to the lungs in mice, and all-trans retinoic acid inhibited this metastasis via inhibiting the M2 polarization (43). GNG12 was a highly effective biomarker for osteosarcoma; high GNG12 related to a better prognosis and lower M1 and M2 scores (44). the Rab22a-NeoF1 fusion protein promotes M2 polarization by activating STAT3 and subsequently facilitates lung metastases (45). In lung metastases, M2 correlated with curtailed patient survival could be induced by exosomes (4). Systemic administration of PLX3397, a CSF1R inhibitor, significantly suppressed the primary tumor growth and lung metastasis. After treatment, both M1 and M2 were depleted and the infiltration of CD8+T cells increased (46). Especially, CD163+ TAMs were reported to be crucial better prognostic biomarkers in OS (47). CD163 was also a marker of C1Q+ TAMs (Table S3). We tried to find if there was a certain subtype of TAMs such as M1 and M2 among the C1Q+ TAMs as previous research summarized several conditions of macrophages and their markers (48–50). The difference in the direction of polarization macrophages has long been found, but we could not identify subclusters from C1Q+ TAMs; the markers of M1 and M2 did not show an obvious difference among them (Figure S5). Combined with the findings in bulk data, the samples were grouped according to immune-related genes, and then the immune cells of the two groups were scored. There were no immune cells with a high score in the low-immune infiltrated group. These genes include antitumor and pro-tumor genes, and cells also include antitumor and pro-tumor cells. If there were enough tumor-suppressor immune cells except TAMs in OS, the low-immune infiltrated group should have at least one main immune cell with high score. Bulk data suggest that immunosuppressive cells in OS are not easy to be observed. In the single-cell dataset, the classical M2 macrophages and M1 macrophages could not be clearly distinguished. There might be only one major immune cell in OS. They are C1Q+ TAMs, which suppress tumors. We noticed that some other researchers had worked on the TAM population in human breast cancer, which was defined by APOE, APOC, and C1Q expression. They found that a subset of FOLR2+ TAMs correlates with increased survival in patients with breast cancer. The C1Q+ TAMs and FLOR2+ TAMs described by our research and Nalio Ramos et al. are very similar. Both of them are defined by markers such as APOE, FLOR2, CCL18, F13A1, MRC1, SLC40A1, and SELENOP (SEPP1) (17). They described FOLR2+ TAMs as tissue-resident macrophages, whereas they failed to recognize M1- or M2-polarized macrophages in their dataset.
We tried to explain the tumor-limiting function of C1Q+TAMs by cell–cell interaction. Cellphone analysis suggested that C1Q+ TAMs act mainly on endothelial cells by the ACKR1-related pathway (Figure 5E). ACKR1 or DARC is a receptor for chemokines on erythrocytes and endothelial cells. It is not clear how ACKR1 expression contributes to the development and outcome of human diseases. At first, ACKR1 was regarded as a neutralizer of chemokine instead of a signal transmitter, but now it is reported that chemokines retain their biological activity after binding to DARC [spice] (51, 52). When overexpressed in endothelial cells, ACKR1 decreased the pro-angiogenic properties of chemokines (53). Further research about the interaction between TAMs and endothelial cells is required.
Some other subclusters of myeloid cells are also worth paying attention. We detected FABP4+ macrophages just like previous authors did (54). They have a small amount of 208 cells. The mean number of detected genes of these FABP4+ macrophages roared over 3,000, whereas the mean number of the rest was lower than 2,000. We thought that these cells were homologous doublets. The subcluster monocytes highly expressed S100A8 and S100A9. S100A8 and S100A9, molecular markers promoting pre-metastatic niche formation, can cause an expansion of myeloid-derived suppressor cells, thereby contributing to an immunocompromise (55, 56). There were 1,072 myeloid cells identified as C1Q+ osteoclasts, whereas there were 7,307 normal osteoclasts. Osteoclasts are multinucleated members of the monocyte/macrophage family, working as skeletal remodelers. OS cells mediated bone destruction by activated osteoclasts and obtained higher OS aggressiveness (57). However, in advanced OS, osteoclasts were proved to prevent metastatic osteosarcomas (58). Osteoclasts can secrete C1Q just like Kupffer cells in the liver and microglia in the brain. In turn, C1Q strongly promotes osteoclasts derived from monocytes (59). We noticed that there were CD74+LUM+C1Q+ cells. It might be a distinct TAM-induced extracellular matrix molecular signature (19). In the orthotopic colorectal cancer model, monocyte-derived TAMs promote tumor development by remodeling its extracellular matrix composition and structure (19).
This analysis revealed that a higher immune infiltration level improves the overall survival of OS patients and most of the high expression of immune infiltration-related genes links to better survival. Especially, we report C1Q as an antitumor factor in osteosarcoma. C1Q+ TAMs, marked by high C1QA/B/C, APOE/C, FLOR2, SLC40A1, SEPP1, and MRC1 expression, contribute to a better prognosis in OS patients. C1Q+ TAMs are the major immune cells in the OS TME. This study provided the image of how immune cells influence prognosis in osteosarcoma and C1Q+ TAMs that can be therapeutic target cells to improve the osteosarcoma treatment.
Publicly available datasets were analyzed in this study. This data can be found here: TARGET-OS: https://portal.gdc.cancer.gov/repository GSE21257:https://www.ncbi.nlm.nih.gov/geo/query/acc.cgi?acc=GSE21257 GSE32981:https://www.ncbi.nlm.nih.gov/geo/query/acc.cgi?acc=GSE32981 GSE152048:https://www.ncbi.nlm.nih.gov/geo/query/acc.cgi?acc=GSE152048.
Ethical review and approval was not required for the study on human participants in accordance with the local legislation and institutional requirements. Written informed consent for participation was not required for this study in accordance with the national legislation and the institutional requirements.
BL, JT, DW, and XZ designed this research. JT collected and analyzed datasets. DW drafted this manuscript. XZ adapted the manuscript for final submission. All authors contributed to the article and approved the submitted version.
This work was supported by the Funds of Jilin Provincial Finance Department (grant no. JLSCZD2019-002).
The authors declare that the research was conducted in the absence of any commercial or financial relationships that could be construed as a potential conflict of interest.
All claims expressed in this article are solely those of the authors and do not necessarily represent those of their affiliated organizations, or those of the publisher, the editors and the reviewers. Any product that may be evaluated in this article, or claim that may be made by its manufacturer, is not guaranteed or endorsed by the publisher.
The Supplementary Material for this article can be found online at: https://www.frontiersin.org/articles/10.3389/fimmu.2023.911368/full#supplementary-material
1. Zheng D, Yang K, Chen X, Li Y, Chen Y. Analysis of immune-stromal score-based gene signature and molecular subtypes in osteosarcoma: Implications for prognosis and tumor immune microenvironment. Front Genet (2021) 12:699385. doi: 10.3389/fgene.2021.699385
2. Isakoff MS, Bielack SS, Meltzer P, Gorlick R. Osteosarcoma: Current treatment and a collaborative pathway to success. J Clin (2015) 33(27):3029–35. doi: 10.1200/JCO.2014.59.4895
3. Corre I, Verrecchia F, Crenn V, Redini F, Trichet V. The osteosarcoma microenvironment: A complex but targetable ecosystem. Cells (2020) 9(4). doi: 10.3390/cells9040976
4. Wolf-Dennen K, Gordon N, Kleinerman ES. Exosomal communication by metastatic osteosarcoma cells modulates alveolar macrophages to an M2 tumor-promoting phenotype and inhibits tumoricidal functions. Oncoimmunology (2020) 9(1):1747677. doi: 10.1080/2162402X.2020.1747677
5. Majzner RG, Simon JS, Grosso JF, Martinez D, Pawel BR, Santi M, et al. Assessment of programmed death-ligand 1 expression and tumor-associated immune cells in pediatric cancer tissues. Cancer (2017) 123(19):3807–15. doi: 10.1002/cncr.30724
6. Koirala P, Roth ME, Gill J, Piperdi S, Chinai JM, Geller DS, et al. Immune infiltration and PD-L1 expression in the tumor microenvironment are prognostic in osteosarcoma. Sci Rep (2016) 6(1):30093. doi: 10.1038/srep30093
7. Ligon JA, Choi W, Cojocaru G, Fu W, Hsiue EH-C, Oke TF, et al. Pathways of immune exclusion in metastatic osteosarcoma are associated with inferior patient outcomes. J Immunother Cancer (2021) 9(5):e001772. doi: 10.1136/jitc-2020-001772
8. Chen C, Xie L, Ren T, Huang Y, Xu J, Guo W. Immunotherapy for osteosarcoma.: Fundamental mechanism, rationale, and recent breakthroughs. Cancer Lett (2021) 500:1–10. doi: 10.1016/j.canlet.2020.12.024
9. Wang N, Wang S, Wang X, Zheng Y, Yang B, Zhang J, et al. Research trends in pharmacological modulation of tumor-associated macrophages. Clin Transl Med (2021) 11(1):e288–8. doi: 10.1002/ctm2.288
10. Xie R, Ruan S, Liu J, Qin L, Yang C, Tong F, et al. Furin-instructed aggregated gold nanoparticles for re-educating tumor associated macrophages and overcoming breast cancer chemoresistance. Biomaterials (2021) 275:120891. doi: 10.1016/j.biomaterials.2021.120891
11. Figueiredo P, Lepland A, Scodeller P, Fontana F, Torrieri G, Tiboni M, et al. Peptide-guided resiquimod-loaded lignin nanoparticles convert tumor-associated macrophages from M2 to M1 phenotype for enhanced chemotherapy. Acta biomaterialia (2021) 133:231–43. doi: 10.1016/j.actbio.2020.09.038
12. Cai Z, Lim D, Liu G, Chen C, Jin L, Duan W, et al. Valproic acid-like compounds enhance and prolong the radiotherapy effect on breast cancer by activating and maintaining anti-tumor immune function. Front Immunol (2021) 12:646384–4. doi: 10.3389/fimmu.2021.646384
13. Zhu Y, Herndon JM, Sojka DK, Kim K-W, Knolhoff BL, Zuo C, et al. Tissue-resident macrophages in pancreatic ductal adenocarcinoma originate from embryonic hematopoiesis and promote tumor progression. Immunity (2017) 47(2):323–338.e326. doi: 10.1016/j.immuni.2017.07.014
14. Bugatti M, Bergamini M, Missale F, Monti M, Laura A, Pezzali I, et al. A population of TIM4+FOLR2+ macrophages localized in tertiary lymphoid structures correlates to an active immune infiltrate across several cancer types. Cancer Immunol Res (2022) 10(11):1340–53. doi: 10.1158/2326-6066.CIR-22-0271
15. Revel M, Sautès-Fridman C, Fridman W-H, Roumenina LT. C1q+ macrophages: Passengers or drivers of cancer progression. Trends Cancer (2022) 8(7):517–26. doi: 10.1016/j.trecan.2022.02.006
16. Blériot C, Chakarov S, Ginhoux F. Determinants of resident tissue macrophage identity and function. Immunity (2020) 52(6):957–70. doi: 10.1016/j.immuni.2020.05.014
17. Nalio Ramos R, Missolo-Koussou Y, Gerber-Ferder Y, Bromley CP, Bugatti M, Núñez NG, et al. Tissue-resident FOLR2+ macrophages associate with CD8+ t cell infiltration in human breast cancer. Cell (2022) 185(7):1189–1207.e1125. doi: 10.1016/j.cell.2022.02.021
18. Baldwin WM III, Valujskikh A, Fairchild RL. C1q as a potential tolerogenic therapeutic in transplantation. Am J Transplant (2021) 21(11):3519–23. doi: 10.1111/ajt.16705
19. Afik R, Zigmond E, Vugman M, Klepfish M, Shimshoni E, Pasmanik-Chor M, et al. Tumor macrophages are pivotal constructors of tumor collagenous matrix. J Exp Med (2016) 213(11):2315–31. doi: 10.1084/jem.20151193
20. Bulla R, Tripodo C, Rami D, Ling GS, Agostinis C, Guarnotta C, et al. C1q acts in the tumour microenvironment as a cancer-promoting factor independently of complement activation. Nat Commun (2016) 7:10346. doi: 10.1038/ncomms10346
21. Markiewski MM, DeAngelis RA, Benencia F, Ricklin-Lichtsteiner SK, Koutoulaki A, Gerard C, et al. Modulation of the antitumor immune response by complement. Nat Immunol (2008) 9(11):1225–35. doi: 10.1038/ni.1655
22. Afshar-Kharghan V. The role of the complement system in cancer. J Clin Invest (2017) 127(3):780–9. doi: 10.1172/JCI90962
23. Reis ES, Mastellos DC, Ricklin D, Mantovani A, Lambris JD. Complement in cancer: Untangling an intricate relationship. Nat Rev Immunol (2018) 18(1):5–18. doi: 10.1038/nri.2017.97
24. Bohlson SS, O’Conner SD, Hulsebus HJ, Ho M-M, Fraser DA. Complement, C1q, and C1q-related molecules regulate macrophage polarization. Front Immunol (2014) 5. doi: 10.3389/fimmu.2014.00402
25. Dong L, Chen C, Zhang Y, Guo P, Wang Z, Li J, et al. The loss of RNA N6-adenosine methyltransferase Mettl14 in tumor-associated macrophages promotes CD8+ t cell dysfunction and tumor growth. Cancer Cell (2021) 39(7):945–957.e910. doi: 10.1016/j.ccell.2021.04.016
26. Charoentong P, Finotello F, Angelova M, Mayer C, Efremova M, Rieder D, et al. Pan-cancer immunogenomic analyses reveal genotype-immunophenotype relationships and predictors of response to checkpoint blockade. Cell Rep (2017) 18(1):248–62. doi: 10.1016/j.celrep.2016.12.019
27. Ritchie ME, Phipson B, Wu D, Hu Y, Law CW, Shi W, et al. Limma powers differential expression analyses for RNA-sequencing and microarray studies. Nucleic Acids Res (2015) 43(7):e47–7. doi: 10.1093/nar/gkv007
28. Love MI, Huber W, Anders S. Moderated estimation of fold change and dispersion for RNA-seq data with DESeq2. Genome Biol (2014) 15(12):550. doi: 10.1186/s13059-014-0550-8
29. Robinson MD, McCarthy DJ, Smyth GK. EdgeR: @ a bioconductor package for differential expression analysis of digital gene expression data. Bioinf (Oxford England) (2010) 26(1):139–40. doi: 10.1093/bioinformatics/btp616
30. Subramanian A, Tamayo P, Mootha VK, Mukherjee S, Ebert BL, Gillette MA, et al. Gene set enrichment analysis. a knowledge-based approach for interpreting genome-wide expression profiles. Proc Natl Acad Sci U.S.A. (2005) 102(43):15545–50. doi: 10.1073/pnas.0506580102
31. McGinnis CS, Murrow LM, Gartner ZJ. DoubletFinder.: Doublet detection in single-cell rna sequencing data using artificial nearest neighbors. Cell Syst (2019) 8(4):329–337.e324. doi: 10.1016/j.cels.2019.03.003
32. Vento-Tormo R, Efremova M, Botting RA, Turco MY, Vento-Tormo M, Meyer KB, et al. Single-cell reconstruction of the early maternal-fetal interface in humans. Nature (2018) 563(7731):347–53. doi: 10.1038/s41586-018-0698-6
33. Buddingh EP, Kuijjer ML, Duim RAJ, Bürger H, Agelopoulos K, Myklebost O, et al. Tumor-infiltrating macrophages are associated with metastasis suppression in high-grade osteosarcoma: A rationale for treatment with macrophage activating agents. Clin Cancer Res (2011) 17(8):2110–9. doi: 10.1158/1078-0432.CCR-10-2047
34. Locati M, Curtale G, Mantovani A. Diversity, mechanisms, and significance of macrophage plasticity. Annu Rev Pathol (2020) 15:123–47. doi: 10.1146/annurev-pathmechdis-012418-012718
35. Batlle E, Massagué J. Transforming growth factor-β signaling in immunity and cancer. Immunity (2019) 50(4):924–40. doi: 10.1016/j.immuni.2019.03.024
36. Hedl M, Yan J, Witt H, Abraham C. IRF5 is required for bacterial clearance in human M1-polarized macrophages, and IRF5 immune-mediated disease risk variants modulate this outcome. J Immunol (2019) 202(3):920–30. doi: 10.4049/jimmunol.1800226
37. Liu T, Xiang A, Peng T, Doran AC, Tracey KJ, Barnes BJ, et al. HMGB1-C1q complexes regulate macrophage function by switching between leukotriene and specialized proresolving mediator biosynthesis. Proc Natl Acad Sci U.S.A. (2019) 116(46):23254–63. doi: 10.1073/pnas.1907490116
38. Roumenina LT, Daugan MV, Petitprez F, Sautès-Fridman C, Fridman WH. Context-dependent roles of complement in cancer. Nat Rev Cancer (2019) 19(12):698–715. doi: 10.1038/s41568-019-0210-0
39. Roumenina LT, Daugan MV, Noé R, Petitprez F, Vano YA, Sanchez-Salas R, et al. Tumor cells hijack macrophage-produced complement C1q to promote tumor growth. Cancer Immunol Res (2019) 7(7):1091–105. doi: 10.1158/2326-6066.CIR-18-0891
40. Li J, Zhao C, Li Y, Wen J, Wang S, Wang D, et al. Osteosarcoma exocytosis of soluble LGALS3BP mediates macrophages toward a tumoricidal phenotype. Cancer Lett (2022) 528:1–15. doi: 10.1016/j.canlet.2021.12.023
41. Pahl JHW, Kwappenberg KMC, Varypataki EM, Santos SJ, Kuijjer ML, Mohamed S, et al. Macrophages inhibit human osteosarcoma cell growth after activation with the bacterial cell wall derivative liposomal muramyl tripeptide in combination with interferon-γ. J Exp Clin Cancer Res (2014) 33(1):27–7. doi: 10.1186/1756-9966-33-27
42. Ségaliny AI, Mohamadi A, Dizier B, Lokajczyk A, Brion R, Lanel R, et al. Interleukin-34 promotes tumor progression and metastatic process in osteosarcoma through induction of angiogenesis and macrophage recruitment. Int J Cancer (2015) 137(1):73–85. doi: 10.1002/ijc.29376
43. Zhou Q, Xian M, Xiang S, Xiang D, Shao X, Wang J, et al. All-trans retinoic acid prevents osteosarcoma metastasis by inhibiting m2 polarization of tumor-associated macrophages. Cancer Immunol Res (2017) 5(7):547–59. doi: 10.1158/2326-6066.CIR-16-0259
44. Yuan J, Yuan Z, Ye A, Wu T, Jia J, Guo J, et al. Low GNG12 expression predicts adverse outcomes: A potential therapeutic target for osteosarcoma. Front Immunol (2021) 12:758845–5. doi: 10.3389/fimmu.2021.758845
45. Zhong L, Liao D, Li J, Liu W, Wang J, Zeng C, et al. Rab22a-NeoF1 fusion protein promotes osteosarcoma lung metastasis through its secretion into exosomes. Signal Transduct Target Ther (2021) 6(1):59–9. doi: 10.1038/s41392-020-00414-1
46. Fujiwara T, Yakoub MA, Chandler A, Christ AB, Yang G, Ouerfelli O, et al. CSF1/CSF1R signaling inhibitor pexidartinib (PLX3397) reprograms tumor-associated macrophages and stimulates t-cell infiltration in the sarcoma microenvironment. Mol Cancer Ther (2021) 20(8):1388–99. doi: 10.1158/1535-7163.MCT-20-0591
47. Gomez-Brouchet A, Illac C, Gilhodes J, Bouvier C, Aubert S, Guinebretiere JM, et al. CD163-positive tumor-associated macrophages and CD8-positive cytotoxic lymphocytes are powerful diagnostic markers for the therapeutic stratification of osteosarcoma patients: An immunohistochemical analysis of the biopsies fromthe french OS2006 phase 3 trial. Oncoimmunology (2017) 6(9):e1331193. doi: 10.1080/2162402X.2017.1331193
48. Wang C, Ma C, Gong L, Guo Y, Fu K, Zhang Y, et al. Macrophage polarization and its role in liver disease. Front Immunol (2021) 12:803037–7. doi: 10.3389/fimmu.2021.803037
49. Mohapatra S, Pioppini C, Ozpolat B, Calin GA. Non-coding RNAs regulation of macrophage polarization in cancer. Mol Cancer (2021) 20(1):24–4. doi: 10.1186/s12943-021-01313-x
50. Zhou K, Cheng T, Zhan J, Peng X, Zhang Y, Wen J, et al. Targeting tumor-associated macrophages in the tumor microenvironment. Oncol Lett (2020) 20(5):234–4. doi: 10.3892/ol.2020.12097
51. Rot A. Contribution of duffy antigen to chemokine function. Cytokine Growth Factor Rev (2005) 16(6):687–94. doi: 10.1016/j.cytogfr.2005.05.011
52. Groblewska M, Litman-Zawadzka A, Mroczko B. The role of selected chemokines and their receptors in the development of gliomas. Int J Mol Sci (2020) 21(10). doi: 10.3390/ijms21103704
53. Du J, Luan J, Liu H, Daniel TO, Peiper S, Chen TS, et al. Potential role for duffy antigen chemokine-binding protein in angiogenesis and maintenance of homeostasis in response to stress. J leukocyte Biol (2002) 71(1):141–53. doi: 10.1189/jlb.71.1.141
54. Zhou Y, Yang D, Yang Q, Lv X, Huang W, Zhou Z, et al. Single-cell RNA landscape of intratumoral heterogeneity and immunosuppressive microenvironment in advanced osteosarcoma. Nat Commun (2020) 11(1):6322–2. doi: 10.1038/s41467-020-20059-6
55. Heinemann AS, Pirr S, Fehlhaber B, Mellinger L, Burgmann J, Busse M, et al. In neonates S100A8/S100A9 alarmins prevent the expansion of a specific inflammatory monocyte population promoting septic shock. FASEB J (2017) 31(3):1153–64. doi: 10.1096/fj.201601083R
56. Zhao F, Hoechst B, Duffy A, Gamrekelashvili J, Fioravanti S, Manns MP, et al. S100A9 a new marker for monocytic human myeloid-derived suppressor cells. Immunology (2012) 136(2):176–83. doi: 10.1111/j.1365-2567.2012.03566.x
57. Alfranca A, Martinez-Cruzado L, Tornin J, Abarrategi A, Amaral T, de Alava E, et al. Bone microenvironment signals in osteosarcoma development. Cell Mol Life Sci (2015) 72(16):3097–113. doi: 10.1007/s00018-015-1918-y
58. Endo-Munoz L, Cumming A, Rickwood D, Wilson D, Cueva C, Ng C, et al. Loss of osteoclasts contributes to development of osteosarcoma pulmonary metastases. Cancer Res (2010) 70(18):7063–72. doi: 10.1158/0008-5472.CAN-09-4291
Keywords: tumor-associated macrophages, osteosarcoma, immune infiltration, biomarker, single-cell sequencing technology
Citation: Tu J, Wang D, Zheng X and Liu B (2023) Single-cell RNA datasets and bulk RNA datasets analysis demonstrated C1Q+ tumor-associated macrophage as a major and antitumor immune cell population in osteosarcoma. Front. Immunol. 14:911368. doi: 10.3389/fimmu.2023.911368
Received: 02 April 2022; Accepted: 23 January 2023;
Published: 06 February 2023.
Edited by:
Giulia Accardi, University of Palermo, ItalyReviewed by:
Zheng Liu, Virginia Commonwealth University, United StatesCopyright © 2023 Tu, Wang, Zheng and Liu. This is an open-access article distributed under the terms of the Creative Commons Attribution License (CC BY). The use, distribution or reproduction in other forums is permitted, provided the original author(s) and the copyright owner(s) are credited and that the original publication in this journal is cited, in accordance with accepted academic practice. No use, distribution or reproduction is permitted which does not comply with these terms.
*Correspondence: Bin Liu, bF9iaW5AbWFpbHMuamx1LmVkdS5jbg==
†These authors have contributed equally to this work and share first authorship
Disclaimer: All claims expressed in this article are solely those of the authors and do not necessarily represent those of their affiliated organizations, or those of the publisher, the editors and the reviewers. Any product that may be evaluated in this article or claim that may be made by its manufacturer is not guaranteed or endorsed by the publisher.
Research integrity at Frontiers
Learn more about the work of our research integrity team to safeguard the quality of each article we publish.