 Heng Wei1
 Chie Naruse1
 Daisuke Takakura2Kazushi Sugihara1Xuchi Pan1Aki Ikeda1Nana Kawasaki2
 Masahide Asano1*
- 1Institute of Laboratory Animals, Graduate School of Medicine, Kyoto University, Kyoto, Japan
- 2Graduate School of Medical Life Science, Yokohama City University, Yokohama, Japan
Background: Beta-1,4-galactosyltransferase-3 (B4GALT3) belongs to the family of beta-1,4-galactosyltransferases (B4GALTs) and is responsible for the transfer of UDP-galactose to terminal N-acetylglucosamine. B4GALT3 is differentially expressed in tumors and adjacent normal tissues, and is correlated with clinical prognosis in several cancers, including neuroblastoma, cervical cancer, and bladder cancer. However, the exact role of B4GALT3 in the tumor immune microenvironment (TIME) remains unclear. Here, we aimed to elucidate the function of B4GALT3 in the TIME.
Methods: To study the functions of B4GALT3 in cancer immunity, either weakly or strongly immunogenic tumor cells were subcutaneously transplanted into wild-type (WT) and B4galt3 knockout (KO) mice. Bone marrow transplantation and CD8+ T cell depletion experiments were conducted to elucidate the role of immune cells in suppressing tumor growth in B4galt3 KO mice. The cell types and gene expression in the tumor region and infiltrating CD8+ T cells were analyzed using flow cytometry and RNA sequencing. N-glycosylated proteins from WT and B4galt3 KO mice were compared using the liquid chromatography tandem mass spectrometry (LC-MS/MS)-based glycoproteomic approach.
Results: B4galt3 KO mice exhibited suppressed growth of strongly immunogenic tumors with a notable increase in CD8+ T cell infiltration within tumors. Notably, B4galt3 deficiency led to changes in N-glycan modification of several proteins, including integrin alpha L (ITGAL), involved in T cell activity and proliferation. In vitro experiments suggested that B4galt3 KO CD8+ T cells were more susceptible to activation and displayed increased downstream phosphorylation of FAK linked to ITGAL.
Conclusion: Our study demonstrates that B4galt3 deficiency can potentially boost anti-tumor immune responses, largely through enhancing the influx of CD8+ T cells. B4GALT3 might be suppressing cancer immunity by synthesizing the glycan structure of molecules on the CD8+ T cell surface, as evidenced by the changes in the glycan structure of ITGAL in immune cells. Importantly, B4galt3 KO mice showed no adverse effects on growth, development, or reproduction, underscoring the potential of B4GALT3 as a promising and safe therapeutic target for cancer treatment.
1 Introduction
Glycosylation is a common form of post-translational modification of proteins in eukaryotes; it is estimated that more than 50% of all proteins are glycosylated (1), and mammalian glycan structures are estimated to be present in hundreds of species. The primary types of protein glycosylation are N-glycosylation and O-glycosylation. N-glycosylation occurs on residues of asparagine-X-serine/threonine (Asn-X-Ser/Thr). O-glycosylation is usually shorter but more structurally complex than N-glycosylation, and is initiated by the addition of N-acetylgalactosamine (GalNAc) to the serine/threonine (Ser/Thr) residues of the protein backbone.
N-glycosylation of glycoproteins plays an important role in the stability, degradation, solubility, and activity of proteins and has important cellular functions such as inflammatory response, immune escape, cell adhesion, protein clearance, receptor activation, endocytosis, and signal transduction (2–4). Growing evidence shows that glycosylation regulates the development, spread, invasion, metastasis, and angiogenesis of tumors (5, 6). Altered glycosylation patterns have been observed in numerous cancer cell types. A common change is the increased expression of sialylated glycan structures (7). These structures play a role in the invasion and metastasis of cancer cells by promoting adhesion to endothelial cells and inhibiting cytotoxicity mediated by immune cells (8–12). Another common change is increased expression of truncated O-glycosylation, which is associated with increased tumor invasion and poor prognosis (13, 14). These findings suggest that glycosylation is involved in many aspects of tumorigenesis, and studies on glycosylation are essential to elucidate disease mechanisms.
Beta-1,4-galactosyltransferase (B4GALT), a family that is majorly associated with galactosylation, transfers UDP-galactose to terminal N-acetylglucosamine. Numerous studies have identified associations between B4GALT family members and the proliferation, metastasis, and prognosis of various tumors. B4GALT1 is highly expressed in human glioblastoma, and its knockdown controls the growth of this cancer and affects apoptosis and autophagy (15). High expression of B4GALT4 is associated with poor prognosis in hepatocellular carcinoma (HCC). B4GALT4 knockdown downregulates lumican secretion and suppresses the expression of microtubule and spindle assembly-associated oncogenes PLK1 and RHAMM (16). B4GALT5 modulates the stemness of breast cancer cells by stabilizing FZD1 and activating Wnt/β-catenin signaling (17). A past study found that B4GALT5 was overexpressed in human HCC tissues, which was associated with poor prognosis and tumor progression. B4GALT5 knockdown significantly reduced HCC cell proliferation, migration, and invasion (18). B4GALT1 and B4GALT5 control the activity of hedgehog signaling and proportionally mutative expression of p-glycoprotein and MRP1 in the development of multidrug resistance in human leukemia cells (19). However, reports on the glycosylation of immune cells in the tumor microenvironment are rare. Moreover, B4GALTs and galactose-containing carbohydrates in the tumor immune microenvironment (TIME) have not been studied.
B4GALT3 is associated with prognosis and proliferation in various cancers. Chang et al. reported that high expression of B4GALT3 promotes tumor growth and migration in neuroblastoma, resulting in poor prognosis for patients (20). However, Chen et al. reported that in colorectal cancer, high expression of B4GALT3 inhibits cell migration, invasion, and adhesion, and is negatively correlated with poorly differentiated histology, advanced stages, regional lymph node metastasis, and distant metastasis (21). Recent studies have shown that the knockdown of B4GALT3 promotes fibroblast motility and leads to the activation of integrin beta 1 (ITGB1) via NF-κB signaling in fibroblasts, which promotes the development of lung metastases from HCC through the secretion of IL-6 and IL-8 (22). B4GALT3 is associated with various tumors; however, its role in the TIME is unclear. We examined the growth of various strongly or weakly immunogenic tumor cell lines transplanted into B4galt1, B4galt3, and B4galt4 knockout (KO) mice. This investigation aimed to elucidate the function of B4GALT3 in the TIME, and determine its potential clinical implications for cancer therapy.
2 Materials and methods
2.1 Mice
All the mice used in this study were housed in a specific pathogen-free environment at the Institute of Laboratory Animals, Graduate School of Medicine, Kyoto University. They were maintained at 22–24°C and 50–60% humidity with a 14-h light (07:00-21:00)/10-h dark cycle. For anesthesia, a combination of three drugs was administered: medetomidine (Domitor; Meiji Seika Pharma, Tokyo, Japan) at 0.3 mg/kg body weight, midazolam (Dormicum; Astellas, Tokyo, Japan) at 4 mg/kg body weight, and butorphanol (Betolfal; Meiji Seika Pharma, Tokyo, Japan) at 5 mg/kg body weight. The final volume was adjusted using physiological saline at a dosage of 10 ml/Kg. When euthanasia was deemed necessary, it was carried out using the cervical dislocation method by technically skilled personnel to ensure a humane and ethical procedure, in line with the guidelines set by the Institute of Laboratory Animals.
2.2 Generation of B4galt3 and B4galt4 KO mice by CRISPR/Cas9 genome editing
Four-week-old female C57BL/6 mice (Japan SLC Inc, Shizuoka, Japan) were superovulated by 0.1 ml of HyperOva (KYUDO, Saga, Japan), followed by 5 IU of human chorionic gonadotropin (hCG; GONATROPIN, ASKA Pharmaceutical, Tokyo, Japan) 48 h later. The following morning, the ovum was collected for in vitro fertilization with the sperm of more than 12-week-old male C57BL/6 mice (Japan SLC Inc). One-cell-stage fertilized eggs were collected by washing with M2 medium (ARK Resource, Kumamoto, Japan) and maintained in KSOM medium (ARK Resource).
The target sequences of the gRNA were designed using the online tool, Konezumi (Tsukuba University). Target-specific Alt-RTM CRISPR crRNA (IDT, Iowa, USA), tracrRNA (IDT), and Cas9 enzyme (IDT) were mixed and electroporated into zygotes using an electroporator (NEPA21; Nepagene, Tokyo, Japan) according to the manufacturer’s instructions. The gRNA sequences are listed in Supplementary Table 1. Zygotes were then transferred into the oviducts of pseudopregnant ICR female mice (Japan SLC Inc) 0.5 days post copulation. The desired mutant mice were backcrossed with C57BL/6 mice prior to the experiments.
2.3 Mice genotyping
Tail tips were cut from the mice and genotyped using genomic DNA PCR. The PCR products were purified using the NucleoSpin Gel and PCR Clean-up kit (Takara Bio Inc, Shiga, Japan) and analyzed by Sanger sequencing (Macrogen Japan, Tokyo, Japan). Primer sequences are presented in Supplementary Table 1. Heterozygous F1 mice were bred to generate homozygous F2 mice.
2.4 Cell lines and transplantation
Tumor cells were injected subcutaneously into 2-3 month-old anesthetized female mice using syringes fitted with 23G needles (Terumo, Tokyo, Japan), except that EO771 cells were injected into the fourth mammary fat pad. Tumor size was measured every two to three days using a digital caliper. The tumor volume was calculated as follows: volume = (length of longer axis) × (length of shorter axis)2 × 0.52 (23, 24). The tumor transplantation experiment had three endpoints: a tumor size of 2,000 mm3, weight loss of ≥ 20% from the start of the experiment, and debilitation. Details of the cell culture conditions and number of transplants are shown in Supplementary Table 2. All cells were cultured in a humidified incubator at 37°C with 5% CO2.
2.5 Transplantation of bone marrow cells into mice
Bone marrow cells (BMCs) were collected from thigh bones of wild-type (WT) and B4galt3 KO donor mice post-euthanasia. The erythrocytes were lysed in RBC lysis buffer (140 mM NH4Cl in 17 mM Tris-HCl, pH7.2) for 5 min and the cells were washed thoroughly with Hanks’ balanced salt solution (HBSS) buffer. The recipient mice were irradiated with 9.5 Gy gamma radiation (Nordion, Ontario, Canada), and consequently died without the transplantation of BMCs. Subsequently, 2 × 10⁶ BMCs were resuspended in 100 µL HBSS buffer and transplanted from the orbital plexus into anesthetized C57BL/6 recipient mice. MC38 and EO771 cells were transplanted into recipient mice 30 days after the transplantation of BMCs.
2.6 CD8+ T cell depletion
Relative to the tumor injection day (day 0), mice were intraperitoneally injected three times with CD8+ T cell depleting antibody (A2102, Selleck, Houston, USA) or isotype control antibody (A2116, Selleck) on days -2 (100 µg), -1 (100 µg), and 7 (250 µg). On day 21, tail vein blood was collected and CD8+ T cell depletion efficiency determined using flow cytometry.
2.7 Preparation of splenocytes and T cell activation
To prepare splenocytes from euthanized mice, spleens were cut with scissors and crushed using a plunger in a 3.5 mm dish containing 1 mL RPMI 1640 medium, then passed through a 70 µm cell strainer to form a single-cell suspension. The erythrocytes were lysed in RBC lysis buffer for 5 min, and the cells were washed thoroughly with PBS-BSA buffer. After adjusting the cell numbers, the cells were cultured in RPMI 1640 medium supplemented with 10% FBS, GlutaMAX, and penicillin-streptomycin. T cells (1 × 10⁶) in splenocytes were activated with 1 × 10⁶ Dynabeads Mouse T-Activator CD3/CD28 (Invitrogen). Membrane proteins were isolated using a Minute Plasma Membrane Protein Isolation Kit (Invent, Plymouth, USA) according to the manufacturer’s instructions. After separation, the proteins were stored at –80°C for future glycosylation analysis.
For focal adhesion kinase (FAK) phosphorylation, CD8+ T cells were isolated from splenocytes using the EasySep Mouse CD8+ T Cell Isolation Kit (STEMCELL Technologies, Vancouver, Canada). The cells were then divided into groups and, as needed, 20 µM BIRT 377, an inhibitor for LFA-1 (FUJIFILM Wako, Tokyo, Japan) was added. CD8+ T cells were activated using Dynabeads Mouse T-Activator CD3/CD28 (Invitrogen). After 6-h of stimulation, cells were subjected to flow cytometry to analyze protein phosphorylation. The preparation involved staining the cell membrane with a suitable marker followed by washing the cells with PBS. In accordance with the manufacturer’s instructions, the Cyto Fast Fix/Perm buffer set (BioLegend, San Diego, USA) was used to fix and permeabilize the cells. Subsequently, the cells were stained at room temperature for 30 min and rinsed with CSB buffer solution prior to fluorescence-activated cell sorting (FACS) analysis.
2.8 Fluorescence-activated cell sorting
Tumor tissues from the TIME with transplanted EO771 cells were dissected from the mammary fat pad and cut into pieces with a diameter of less than 1 mm in a culture dish containing 5 ml of Dulbecco’s modified Eagle medium (DMEM). Tumor tissues were dissociated using Tissue Dissociation Reagent (BD Bioscience, New Jersey, USA) according to the manufacturer’s instructions. Summarily, the excised tissues in DMEM were transferred to a 50-mL tube containing 2X TTDR and stirred gently and frequently at 37°C for 30 min. Then, 25 mL of 1% BSA/PBS/2mM EDTA was added to stop the digestion reaction. The erythrocytes were then lysed with 1X BD Pharm Lyse (BD Biosciences) for 15 min at room temperature. Finally, cells were collected through a 70 µm filter, counted, and adjusted to a density of 1 x 10⁷/ml using cell staining buffer (PBS containing 2% FBS and 2 mM EDTA). Cells were stained using the LIVE/DEAD Fixable Far Red dead cell stain (Invitrogen), and non-specific binding was blocked with anti-mouse CD16/32 (BioLegend). The cells underwent immunostaining with the use of antibodies, as shown in Supplementary Table 3. The cells were analyzed using a FACSAria IIIu (BD Bioscience). Flow cytometry data were analyzed using the FlowJo software (FlowJo, Ashland, USA).
2.9 Tumor tissue RNA sequencing and data analysis
Tumor tissues were removed from the mice on day 23 after tumor cell transplantation and total RNA was extracted using the RNAiso Plus kit (Takara Bio Inc). cDNA library building and RNA sequencing (RNA-seq) were performed using a commercially available service (BGI, Kobe, Japan). Data analysis and visualization were performed using BGI’s in-house customized data-mining system, Dr. Tom.
2.10 Tumor-infiltrating CD8+ T cell RNA sequencing and data analysis
On day 23, after tumor transplantation, CD8+ T cells were isolated from EO771 tumor-bearing mice by flow cytometry. CD8+ T cells were suspended at 200 cells/µL in 1% PBS-BSA buffer, and 1 µL of the cell suspension was added to a specially prepared lysis buffer containing 10 mM dNTP, RNase inhibitor, and 10% Triton X-100. The samples were then centrifuged gently at 4°C and stored at –80°C. RNA extraction, cDNA library construction, and RNA-seq were performed using a commercially available service (BGI). Data analysis and visualization were performed using the Dr. Tom Data Visualization Solution.
2.11 Trypsin/Lys-C digestion and glycopeptide enrichment
Glycoproteins underwent a precipitation process initiated by the addition of a triple volume of cold acetone, followed by a 16-h incubation period. Centrifugation ensued at 12,000 ×g for a 10-minute duration at 4°C. The resulting precipitate was then subject to reduction with 10 mM dithiothreitol at 56°C for 30 min and subsequent alkylation using 20 mM iodoacetamide at room temperature (25°C) in dark conditions for 40 minutes. N-glycoproteins were broken down with 1.8 µg of a trypsin/Lys-C mixture (Promega, Wisconsin, USA) for 16-h at a steady 37°C in a continuously agitating thermomixer set at 800 rpm. The glycopeptides precipitated through the addition of a quintuple volume of cold acetone, followed by a 16-h incubation period and centrifugation at 12,000 ×g for 10 minutes (25). The precipitate that formed was desalted using a GL-Tip SDB (GL Science, Tokyo, Japan) and subsequently dried utilizing a SpeedVac concentrator.
2.12 LC/MS/MS and identification of the N-glycopeptides
The dried glycopeptides were reconstituted in 12 µL of 0.1% v/v formic acid, and a 4 µL aliquot of this sample was subjected to separation using an EASY-nLC 1000 system (Thermo Fisher Scientific). The separation occurred on an Acclaim PepMap100 C18 LC column (75 µm × 20 mm, 3 µm, Thermo Fisher Scientific), paired with a nano HPLC capillary column (75 µm × 120 mm, 3 µm, C18; Nikkyo Technos, Tokyo, Japan). The elution system comprised 0.1% v/v formic acid (pump A) and acetonitrile with 0.1% v/v formic acid (pump B). With a flow rate of 0.3 µL/min, glycopeptides were eluted utilizing a linear gradient from 0 to 35% B across 120 minutes.
Subsequent mass spectra were collected on a Q Exactive mass spectrometer (Thermo Fisher Scientific), with the addition of a Nanospray Flex Ion Source (Thermo Fisher Scientific), operating in positive ion mode. An Xcalibur 4.4 workstation (Thermo Fisher Scientific) facilitated the control and acquisition of MS data. We operated with a spray voltage of 1.8 kV, maintaining the capillary temperature at 250°C, and setting the S-lens RF level at 50. Full mass spectra were gathered with an m/z range of 350–2000 at a 70,000 resolution. We used a data-dependent acquisition method to acquire product ion mass spectra against the 20 most intense ions, working with a resolution of 17,500, normalized collision energy (NCE) of 27 and 35, and an exclusion duration of 30s. All samples underwent one analytical replicate.
The Byonic search engine version 3.11 (Protein Metrics, CA, USA), incorporated into Proteome Discoverer version 2.4 (Thermo Fisher Scientific), was employed to process raw data files. For the database search, we utilized the UniProtKB database for humans (status/2022/02) and the N-glycan database (mammalian; 309 entries). Search conditions included trypsin with a maximum number of missed cleavages set at 2, static modification of carbamidomethylation (C), dynamic modifications of Gln > pyroGlu (N-term Q) and oxidation (M), precursor mass tolerance of 10 ppm, fragment mass tolerance of 20 ppm, and a maximum of 2 N-glycosylations per peptide. Following this, all identified peptides were filtered at a false discovery rate threshold of 1% through the use of a target/decoy search strategy. The reliability of the identified peptides was evaluated using the percolator node, and only high-confidence N-glycoforms were processed with Microsoft Excel version 2209 (Microsoft, Washington, USA).
For the label-free quantification of N-glycoforms, we applied a combination of the Minora Feature Detector, Feature Mapper, and Precursor Ions Quantifier nodes in Proteome Discoverer 2.4 (Thermo Fisher Scientific). The analytical conditions included selecting unique peptides for use and the area for Precursor Quantification. The normalization mode was set according to the total peptide amount.
2.13 Graphical illustrations
All graphical illustrations were created using BioRender.com.
2.14 Statistics
Statistical analyses were performed using Prism 8 for Mac (GraphPad Software Inc, San Diego, USA). Data comparison between two conditions was performed utilizing the Student’s t-test. Unless otherwise stated, data are displayed as the mean ± standard error of the mean (SEM). All figures indicate statistical significance using these designations: *p < 0.05, **p < 0.01, ***p < 0.001, ****p < 0.0001, and ns for non-significance.
3 Results
3.1 Messenger RNA expression levels of B4GALT3 in human pan-cancer
Recent studies have shown that B4GALT3 is associated with tumor proliferation and metastasis. We analyzed B4GALT3 mRNA expression levels across all tumors in The Cancer Genome Atlas (TCGA) using the TIMER2.0 database (Supplementary Figure 1A). The results showed that B4GALT3 was highly expressed in bladder urothelial carcinoma (BLCA), breast invasive carcinoma (BRCA), cervical squamous cell carcinoma and endocervical adenocarcinoma (CESC), cholangiocarcinoma (CHOL), colon adenocarcinoma (COAD), esophageal carcinoma (ESCA), glioblastoma multiforme (GBM), head and neck squamous cell carcinoma (HNSC), kidney renal clear cell carcinoma (KIRC), liver hepatocellular carcinoma (LIHC), lung adenocarcinoma (LUAD), lung squamous cell (LUSC), pheochromocytoma and paraganglioma (PCPG), prostate adenocarcinoma (PRAD), rectum adenocarcinoma (READ), stomach adenocarcinoma (STAD), thyroid carcinoma (THCA), uterine corpus endometrial carcinoma (UCEC), and lowly expressed in kidney chromophobe (KICH) and kidney renal papillary cell carcinoma (KIRP) compared with adjacent normal tissues. B4GALT3 expression was higher in metastatic skin cutaneous melanoma (SKCM-metastasis) than in primary skin cutaneous melanoma (SKCM-Primary).
High expression of B4GALT3 was associated with poor prognosis of overall survival in adenoid cystic carcinoma (ACC) (p = 0.003), CESC (p = 0.014), liver hepatocellular carcinoma (LIHC) (p = 0.0059), MESO (mesothelioma) (p = 0.02), sarcoma (SARC) (p = 0.044), and HNSC (p = 0.04) cancers based on the GEPIA2 web tool analysis (Supplementary Figures 1B–G). These findings reveal that high B4GALT3 mRNA expression is associated with poor clinical survival, which merits further investigation.
3.2 Suppression of strongly immunogenic tumor growth in B4galt3 KO mice
To explore the role of B4GALT3 in the TIME, we first investigated the growth of four C57BL/6 strain tumor models with varying immunogenicity: breast adenocarcinoma E0771, colon carcinoma MC38, melanoma B16F10, and bladder carcinoma MB49. Strongly immunogenic E0771 and MC38 tumors grew more slowly in B4galt3 KO mice (Figures 1A, B), whereas the growth rate of weakly immunogenic B16F0 and MB49 tumors was not changed by B4galt3 deficiency (Figures 1C, D). To investigate how immunogenicity influences growth kinetics, we monitored the growth of weakly immunogenic B16F10 tumors and B16F10 tumors expressing the immunogenic model antigen ovalbumin (strongly immunogenic B16F10-OVA). B4galt3 KO mice exhibited growth suppression of B16F10-OVA tumors but not B16F10 tumors (Figures 1E, F).
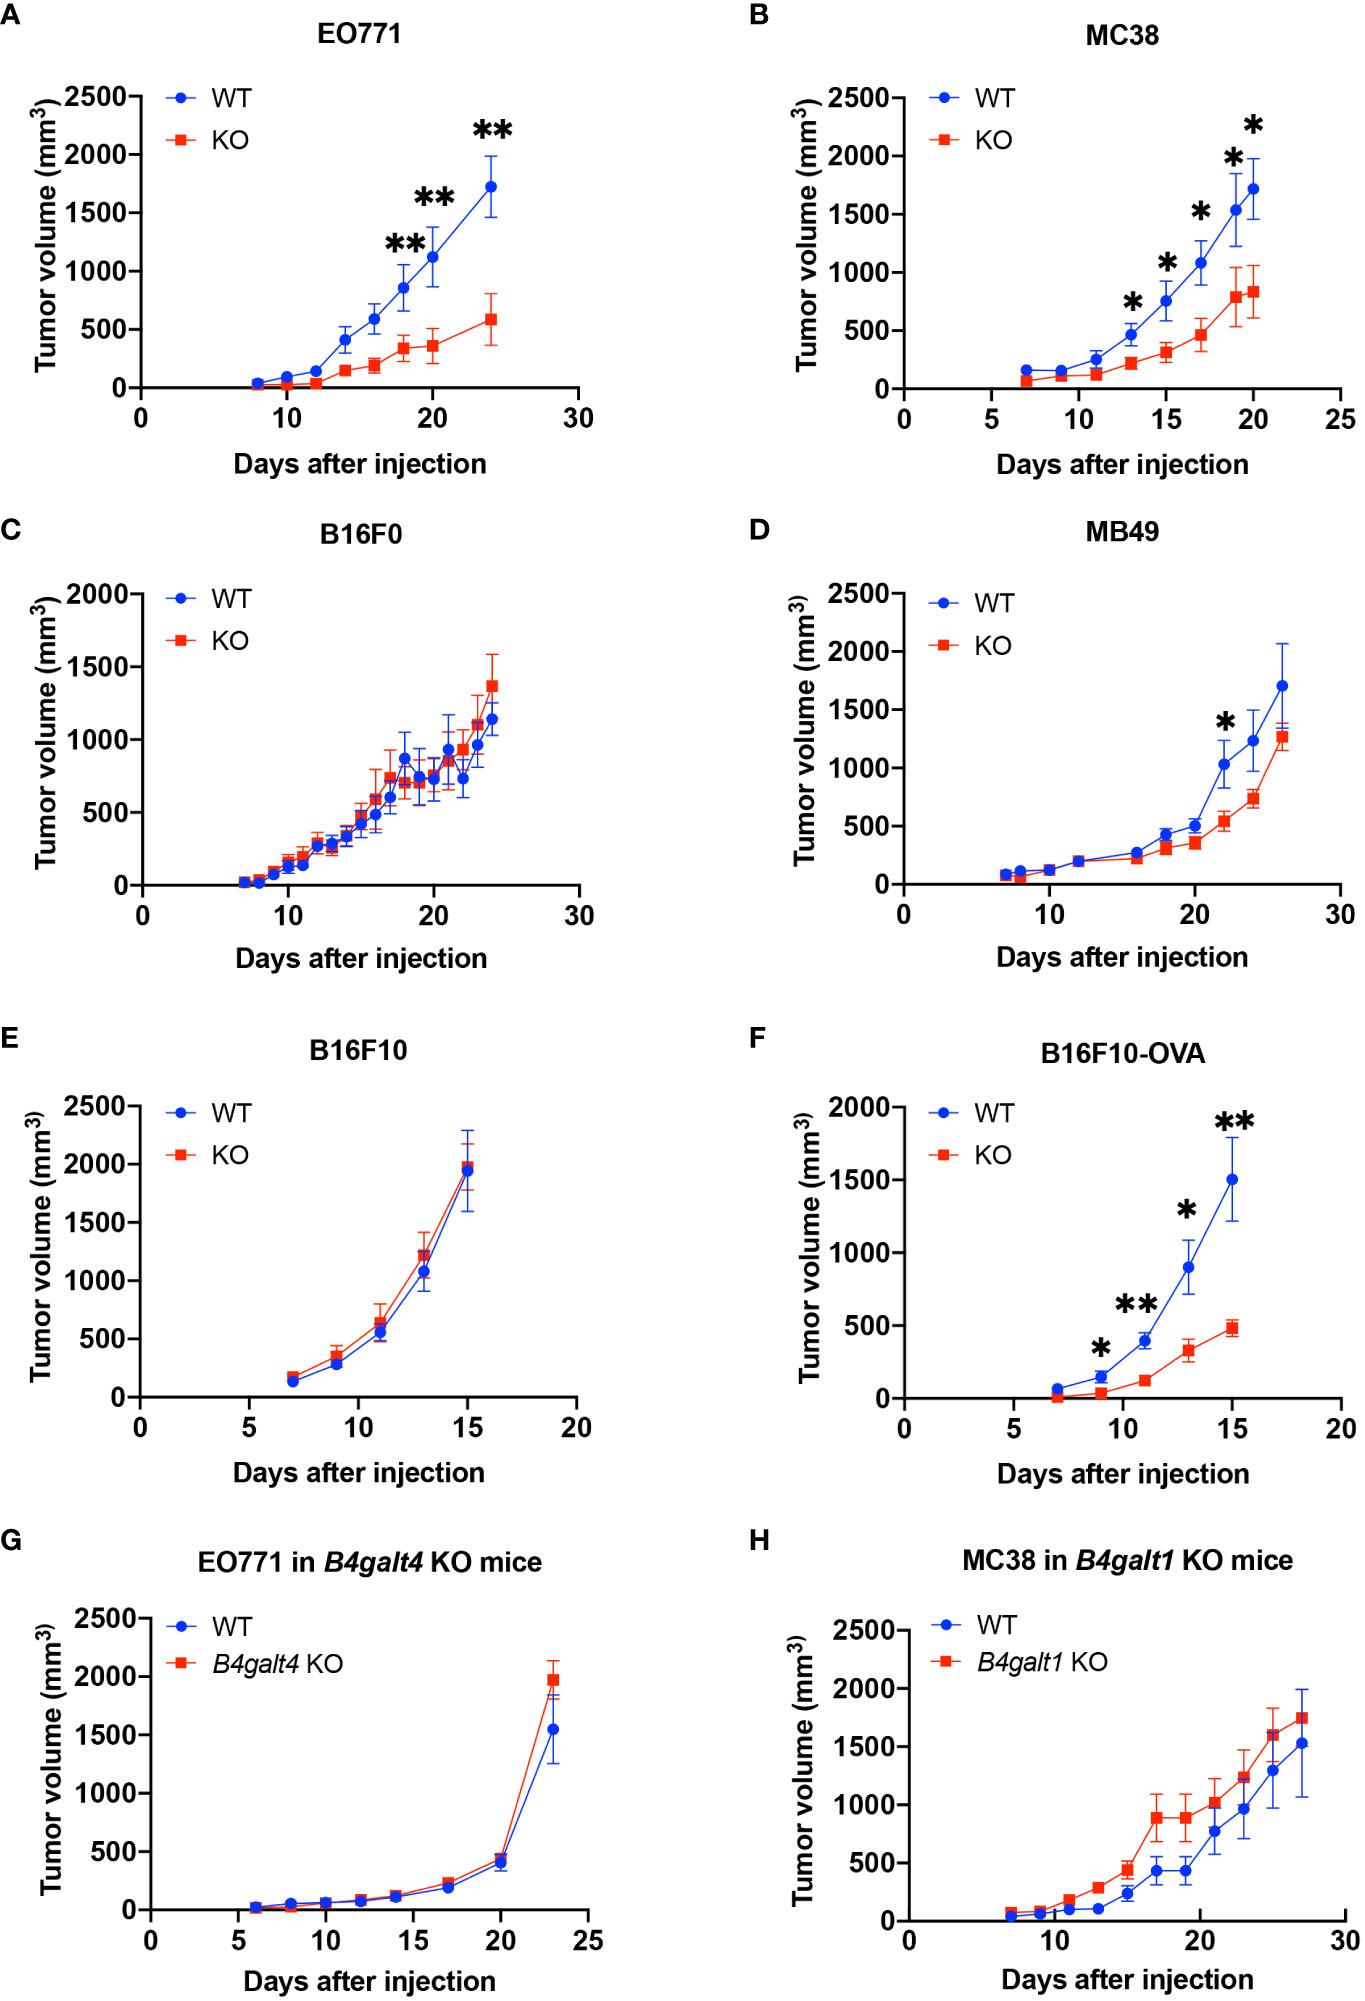
Figure 1 Tumor growth curves in WT (blue circles) or B4galt3 KO mice (red squares). (A) EO771 cells, WT, n = 6; KO, n = 5. (B) MC38 cells, WT, n = 7; KO, n = 8. (C) B16F0 cells, WT, n = 7; KO, n = 9. (D) MB49 cells, WT, n = 8; KO, n = 9. (E) B16F10 cells, WT, n = 7; KO, n = 8. (F) B16F10-OVA cells, WT, n = 7; KO, n = 6. (G) Tumor growth curves of WT (blue circles) or B4galt4 KO mice (red squares) inoculated with EO771 cells. WT, n = 8; KO, n = 7. (H) Tumor growth curves of WT (blue circles) or B4galt1 KO mice (red squares) inoculated with MC38 cells. WT, n = 6; KO, n = 7. Mean ± SEM, *p < 0.05, **p < 0.01.
We also examined tumor growth in B4galt1 or B4galt4 KO mice. B4galt4 is most homologous to the B4galt3 gene, and the growth of the strongly immunogenic E0771 breast cancer cell line in B4galt4 KO mice was unaffected (Figure 1G). B4galt1 is a widely studied gene in the B4galt gene family; however, its function in tumor immunity is unknown. We observed no difference in the growth rate of strongly immunogenic MC38 tumor cells between B4galt1 KO and WT mice (Figure 1H). These findings show that only B4galt3 deficiency can suppress the growth of strongly immunogenic tumors, whereas B4galt1 and B4galt4 deficiency cannot.
3.3 Enhancement of antitumor activity by B4galt3 deficiency through CD8+ T cells
We further investigated whether B4GALT3 controls tumor growth by modulating the immune system. We performed tumor-bearing experiments using a bone marrow (BM) transplantation mouse model (Figure 2A). WT mice engrafted with B4galt3 KO BM cells showed suppressed growth of strongly immunogenic MC38 tumors compared with WT mice engrafted with WT BM cells (Figure 2B). Therefore, B4GALT3 controls tumor growth through the immune system. Given the pivotal role of CD8+ T cells in anti-tumor activity, we sought to determine whether the tumor suppression observed in B4galt3 KO is dependent on CD8+ T cells. To this end, we conducted experiments to deplete CD8+ T cells (Figure 2C). The CD8+ T cell frequency in the peripheral blood of mice injected with the CD8+ T cell depletion antibody was below 1%, but that of mice injected with the isotype antibody exceeded 15% (Figure 2D). In mice with CD8+ T cell depletion, there was no change in the tumor growth rate between B4galt3 KO and WT mice (Figure 2E), although the tumor growth rate was suppressed in B4galt3 KO mice with isotype antibody. These data suggest that the deletion of B4galt3 suppresses the growth of strongly immunogenic tumors by controlling the antitumor activity of CD8+ T cells.
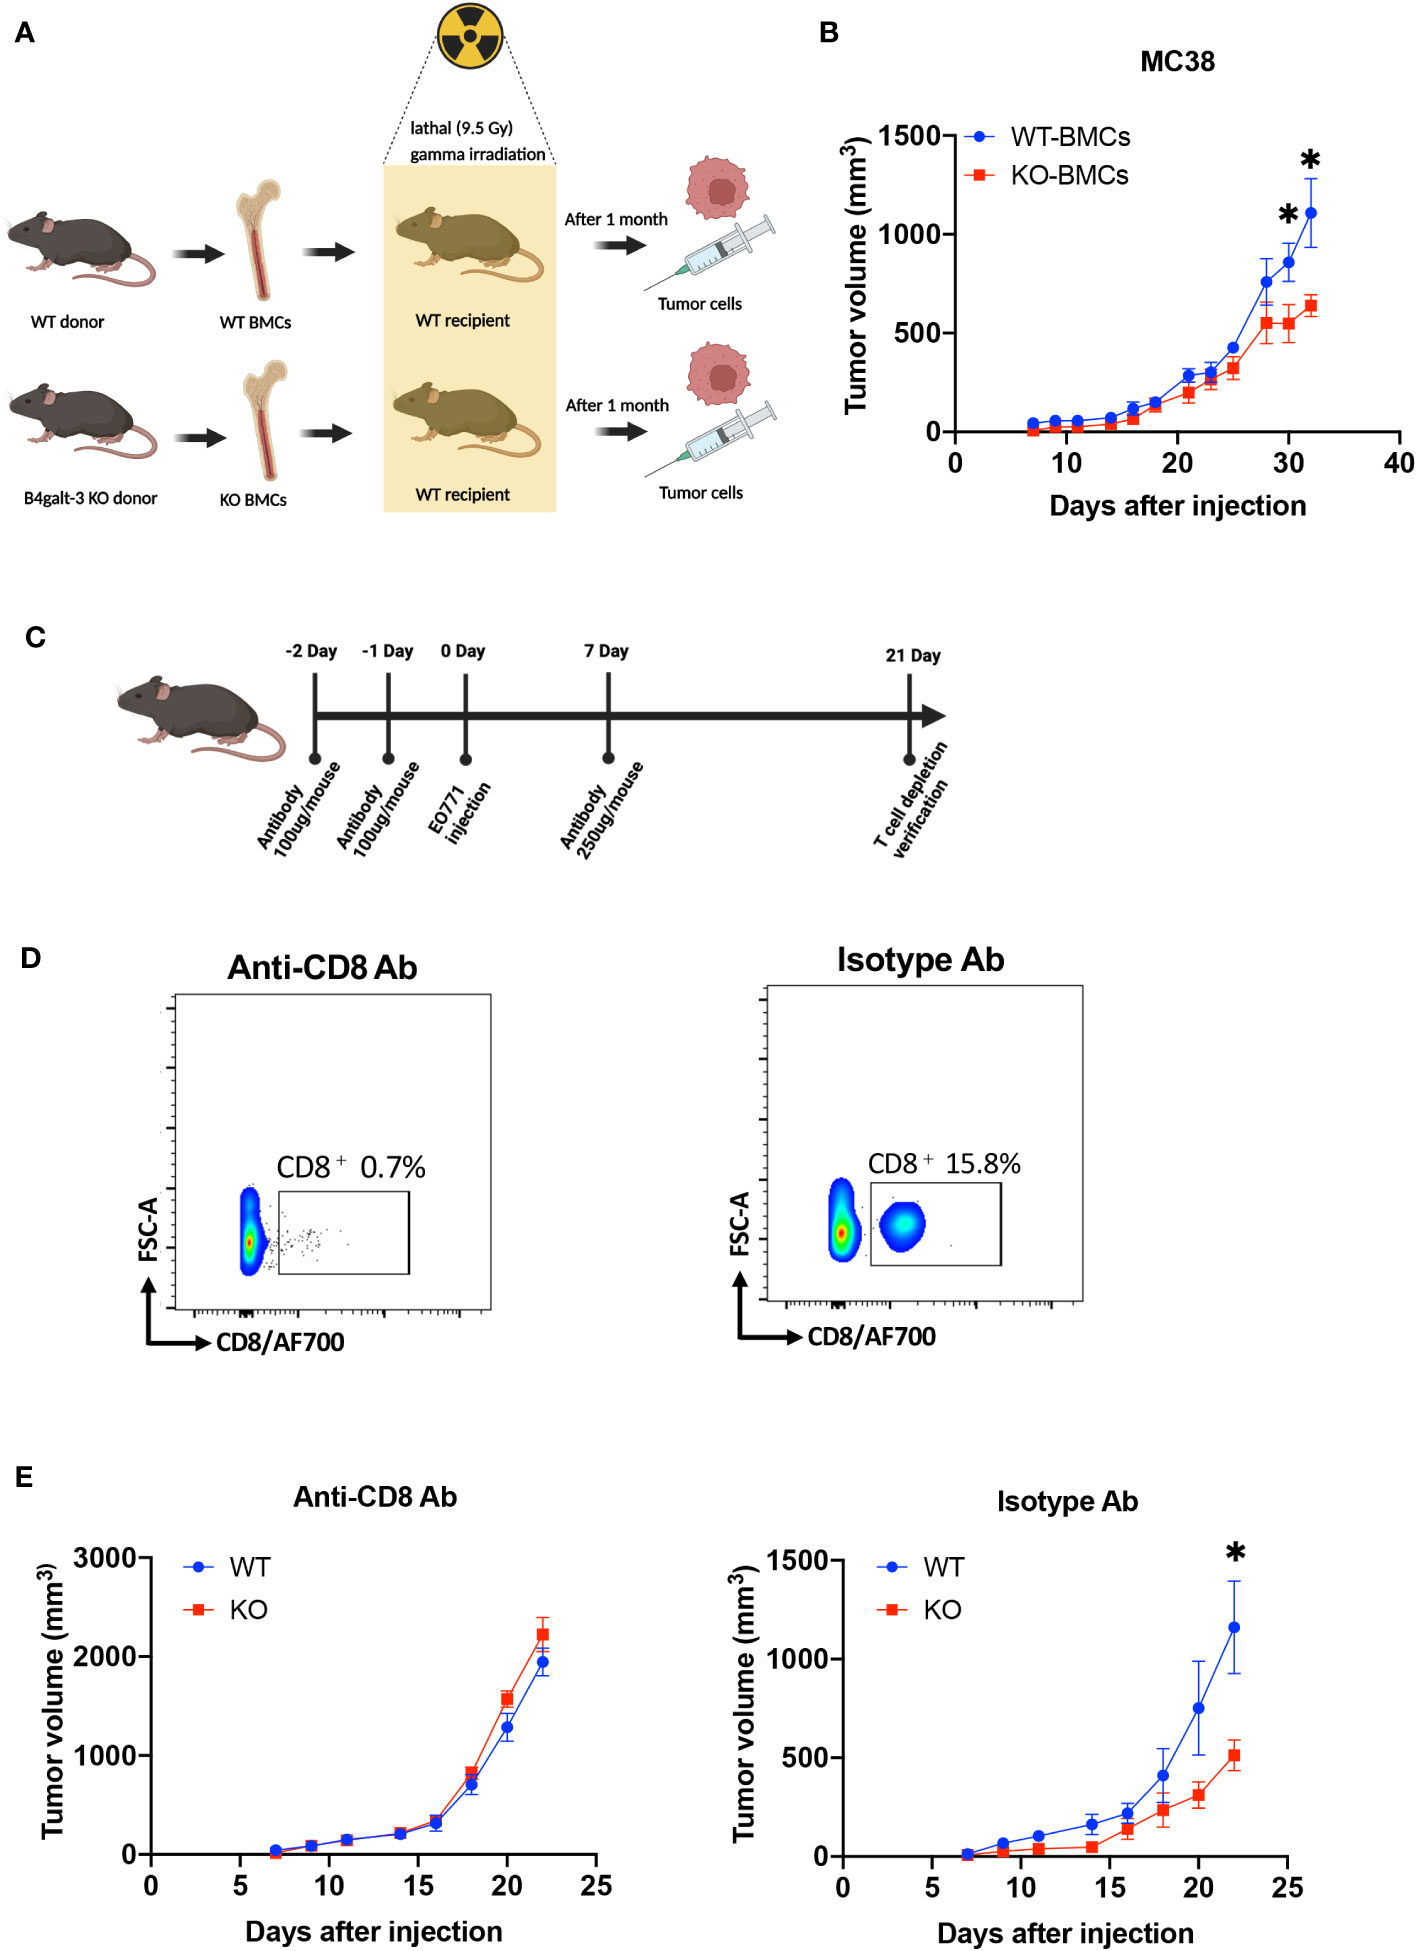
Figure 2 B4galt3 deficiency suppressed tumor growth by CD8+ T cells. (A) Schematic of BMCs transplantation and MC38 cell inoculation. (B) Tumor growth curves in WT mice with WT BMCs transplants (n = 7, blue circles) or B4galt3 KO BMCs (n = 8, red squares) inoculated with MC38 tumor cells. Mean ± SEM, *p < 0.05. (C) Schematic of CD8+ T cell depletion. (D) FACS plots of relative abundance of CD8+ T cells on day 21 treated with anti-CD8 antibody or isotype control antibody to deplete CD8+ T cells. (E) Tumor growth curves in WT (n = 6, blue circles) or B4galt3 KO mice (n = 6, red squares) inoculated with EO771 tumor cells treated with anti-CD8 antibody or isotype control antibody. Mean ± SEM, *p < 0.05.
3.4 Characterization of gene expression in the TIME
To further characterize the TIME of B4galt3 deficiency, changes in gene expression were measured using RNA-seq analysis. Based on the analysis of 4 WT and 4 KO mice, 110 upregulated, and 15 downregulated differentially expressed genes (DEGs) (|log2FC| ≥ 1 and FDR ≤ 0.05) were detected (Figure 3A). The heat map shows the expression levels of the DEGs in each sample (Figure 3B). The upregulated and downregulated genes showed similar tendencies in WT and KO mice. Gene ontology (GO) analysis revealed that the DEGs were enriched in biological processes such as positive regulation of T cell differentiation and positive regulation of interferon-gamma production (Figure 3C). The functional classification of upregulated DEGs based on GO analysis is listed (Supplementary Table 4). B4galt3 KO was found to significantly change the gene expression related to the immune system process in the TIME. To explore the mechanism of B4GALT3 function in the TIME, we analyzed our RNA-seq data using Gene Set Enrichment Analysis (GSEA) from KEGG database (Supplementary Table 5). B4galt3 KO was positively correlated with cell adhesion molecules (FDRq = 0), the T cell receptor signaling pathway (FDRq = 0.001), the C-type lectin receptor signaling pathway (FDRq = 0.019), and the NF-κB signaling pathway (FDRq = 0.011) (Figure 3D).
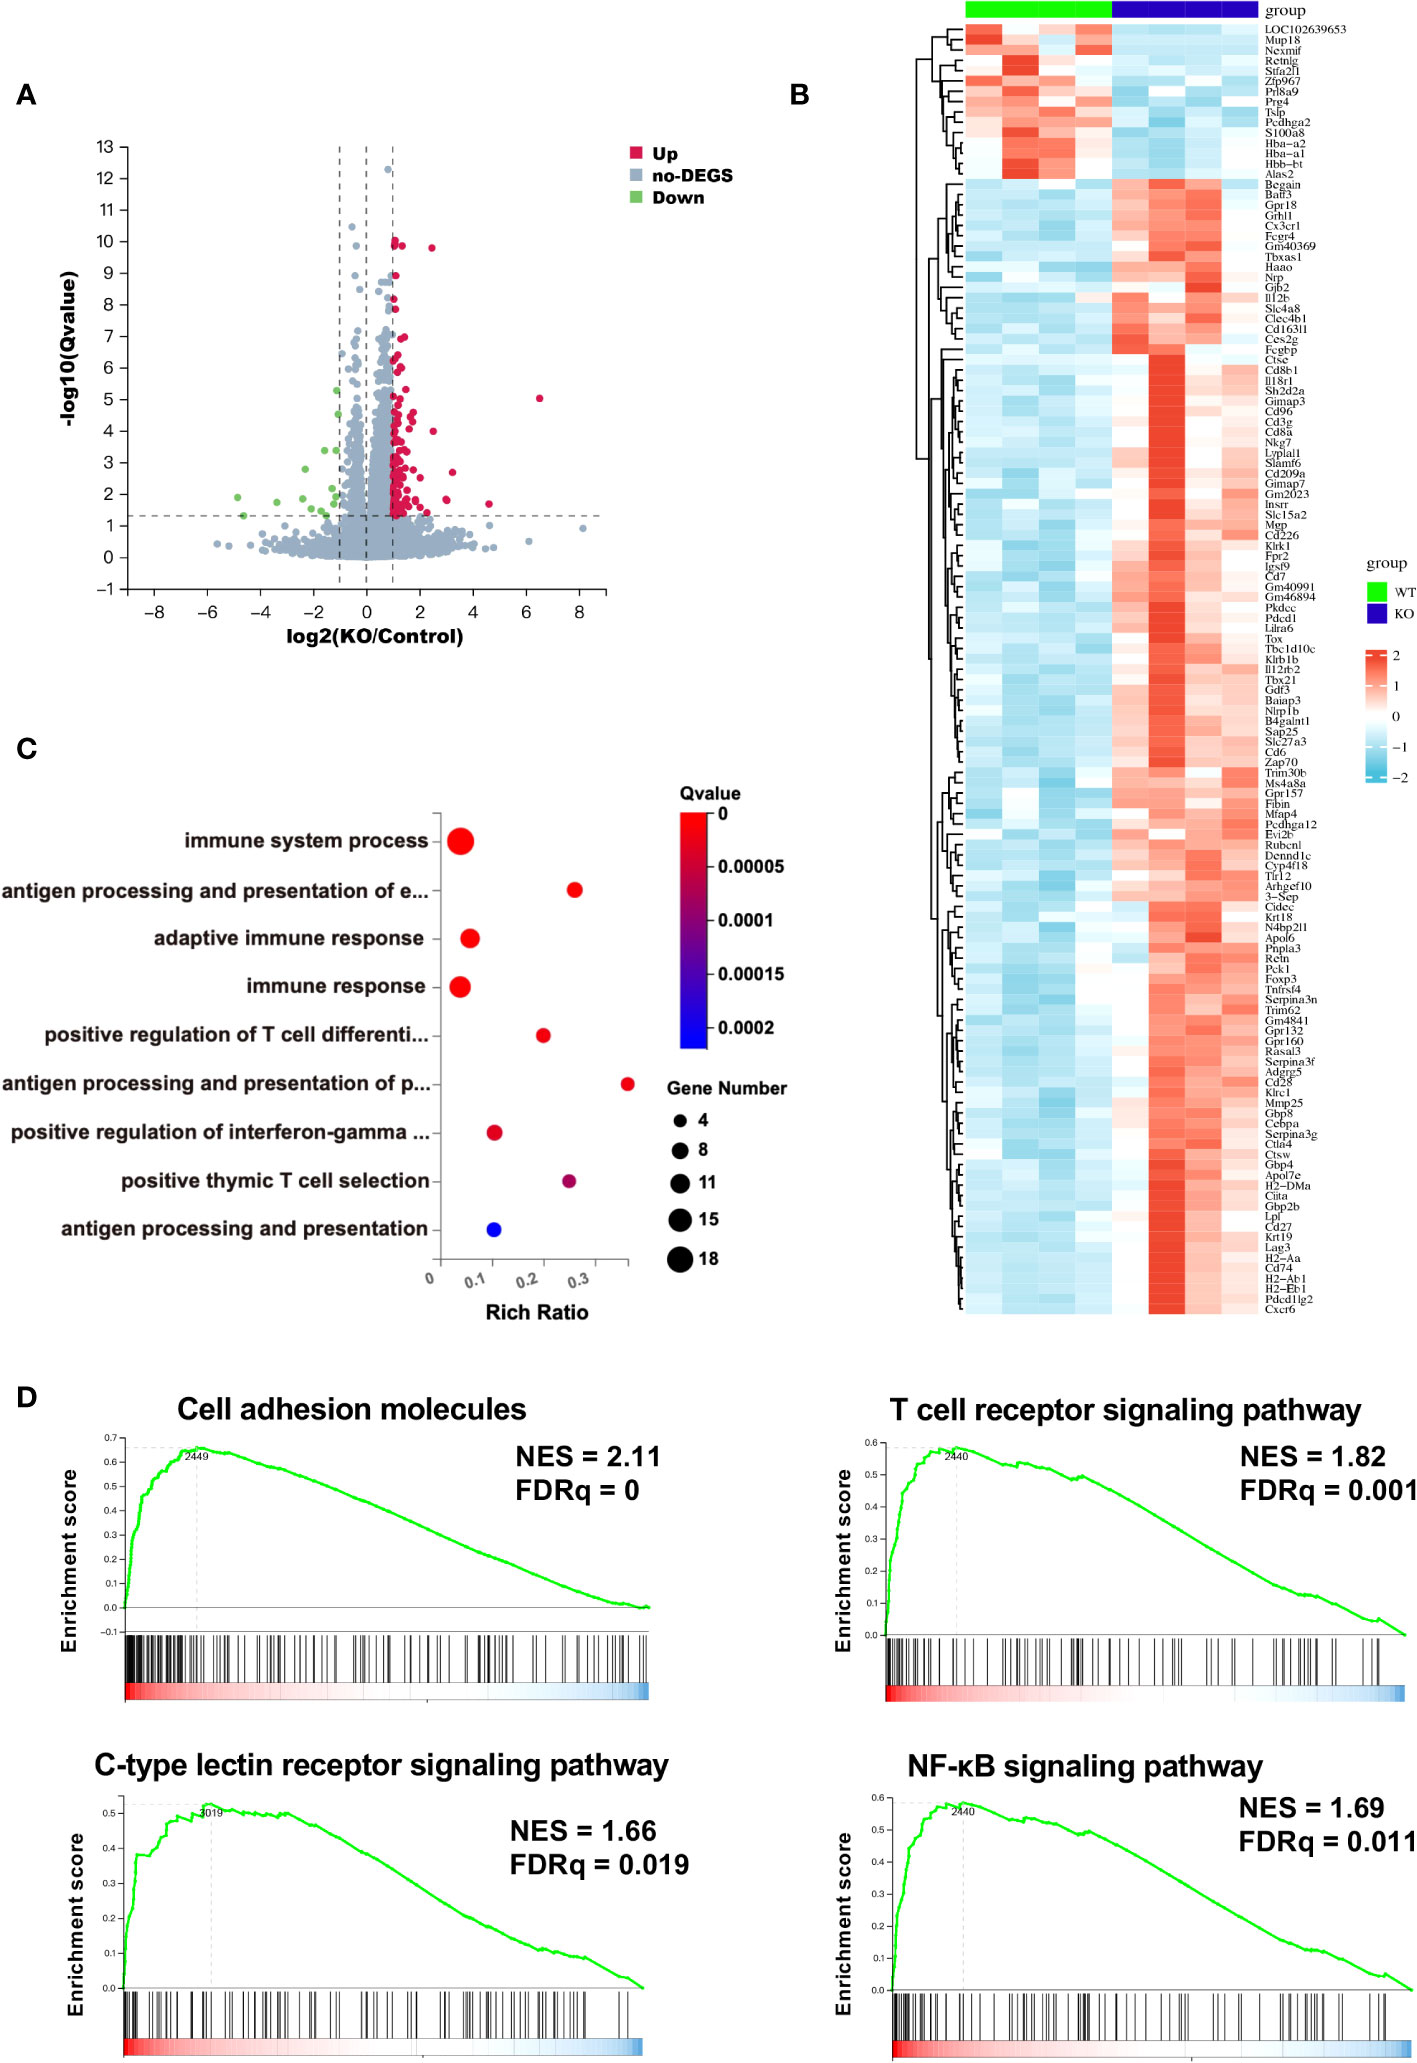
Figure 3 Changes in gene expression in the TIME measured by RNA-seq analysis. (A) Differentially expressed genes (DEGs) in B4galt3 KO mice compared to WT mice were defined as the genes with log2 (fold change) ≥ 1 and FDR < 0.05. Red dots represent up-regulated genes, and blue dots represent down-regulated genes compared to WT mice. WT, n = 4; KO, n = 4. (B) Heat map of DEGs in WT mice (left side 4 rows) and B4galt3 KO mice (right side 4 rows). (C) GO enrichment of up-regulated genes in B4galt3 KO mice compared to WT mice. (D) GSEA of the genes associated with cell adhesion molecules, T cell receptor signaling pathway, C-type lectin receptor signaling pathway, and NF-κB signaling pathway. NES, normalized enrichment score; FDR, false discovery rate. All analyses were performed by comparing the B4galt3 KO against WT counterparts, which served as the control group.
3.5 Gene expression characteristics of tumor-infiltrating CD8+ T cells
To further investigate the features of B4galt3 deficiency in the gene expression characteristics of CD8+ T cells in the TIME, FACS was used to sort CD8+ T cells from EO771 tumor-bearing mice for RNA-seq analysis (Supplementary Figure 3A). We identified 186 upregulated DEGs and 101 downregulated DEGs (|log2FC| ≥ 1 and FDR ≤ 0.05) (Supplementary Figure 3B). GO analysis revealed that the upregulated DEGs were enriched in biological processes such as regulation of cell proliferation, inflammatory response, and T cell differentiation involved in immune response (Supplementary Figure 3C, Supplementary Table 6). Interestingly, GSEA from the Wikipaths database showed that B4galt3 deficiency was positively associated with integrin-mediated cell adhesion; however, this association was not statistically significant (Supplementary Figure 3D, Supplementary Table 7).
3.6 B4galt3 deficiency enhances CD8+ T cell infiltration and cytotoxic activity in the TIME
To elucidate the characteristics of infiltrating immune cells, we used FACS to analyze the tumor tissues (Supplementary Figures 4A–G). The results showed that the TIME in the KO mice had more infiltration of CD8+ T cells compared to the TIME in the WT mice (Figure 4A) but there was no difference in CD4+ T cell infiltration (Figure 4B). The TIME of B4galt3 KO mice showed lower levels of regulatory T cells (Tregs) (Figure 4C). CD8+ T cells expressed more interferon (IFN)-γ and granzyme B in KO mice (Figures 4D, E). In contrast, we did not observe significant changes in the infiltration of myeloid-derived suppressor cells (MDSC), macrophages, NK cells, or dendritic cells (Figures 4F–I). These results showed that B4galt3 deficiency enhanced the infiltration and cytotoxic activity of CD8+ T cells in the TIME.
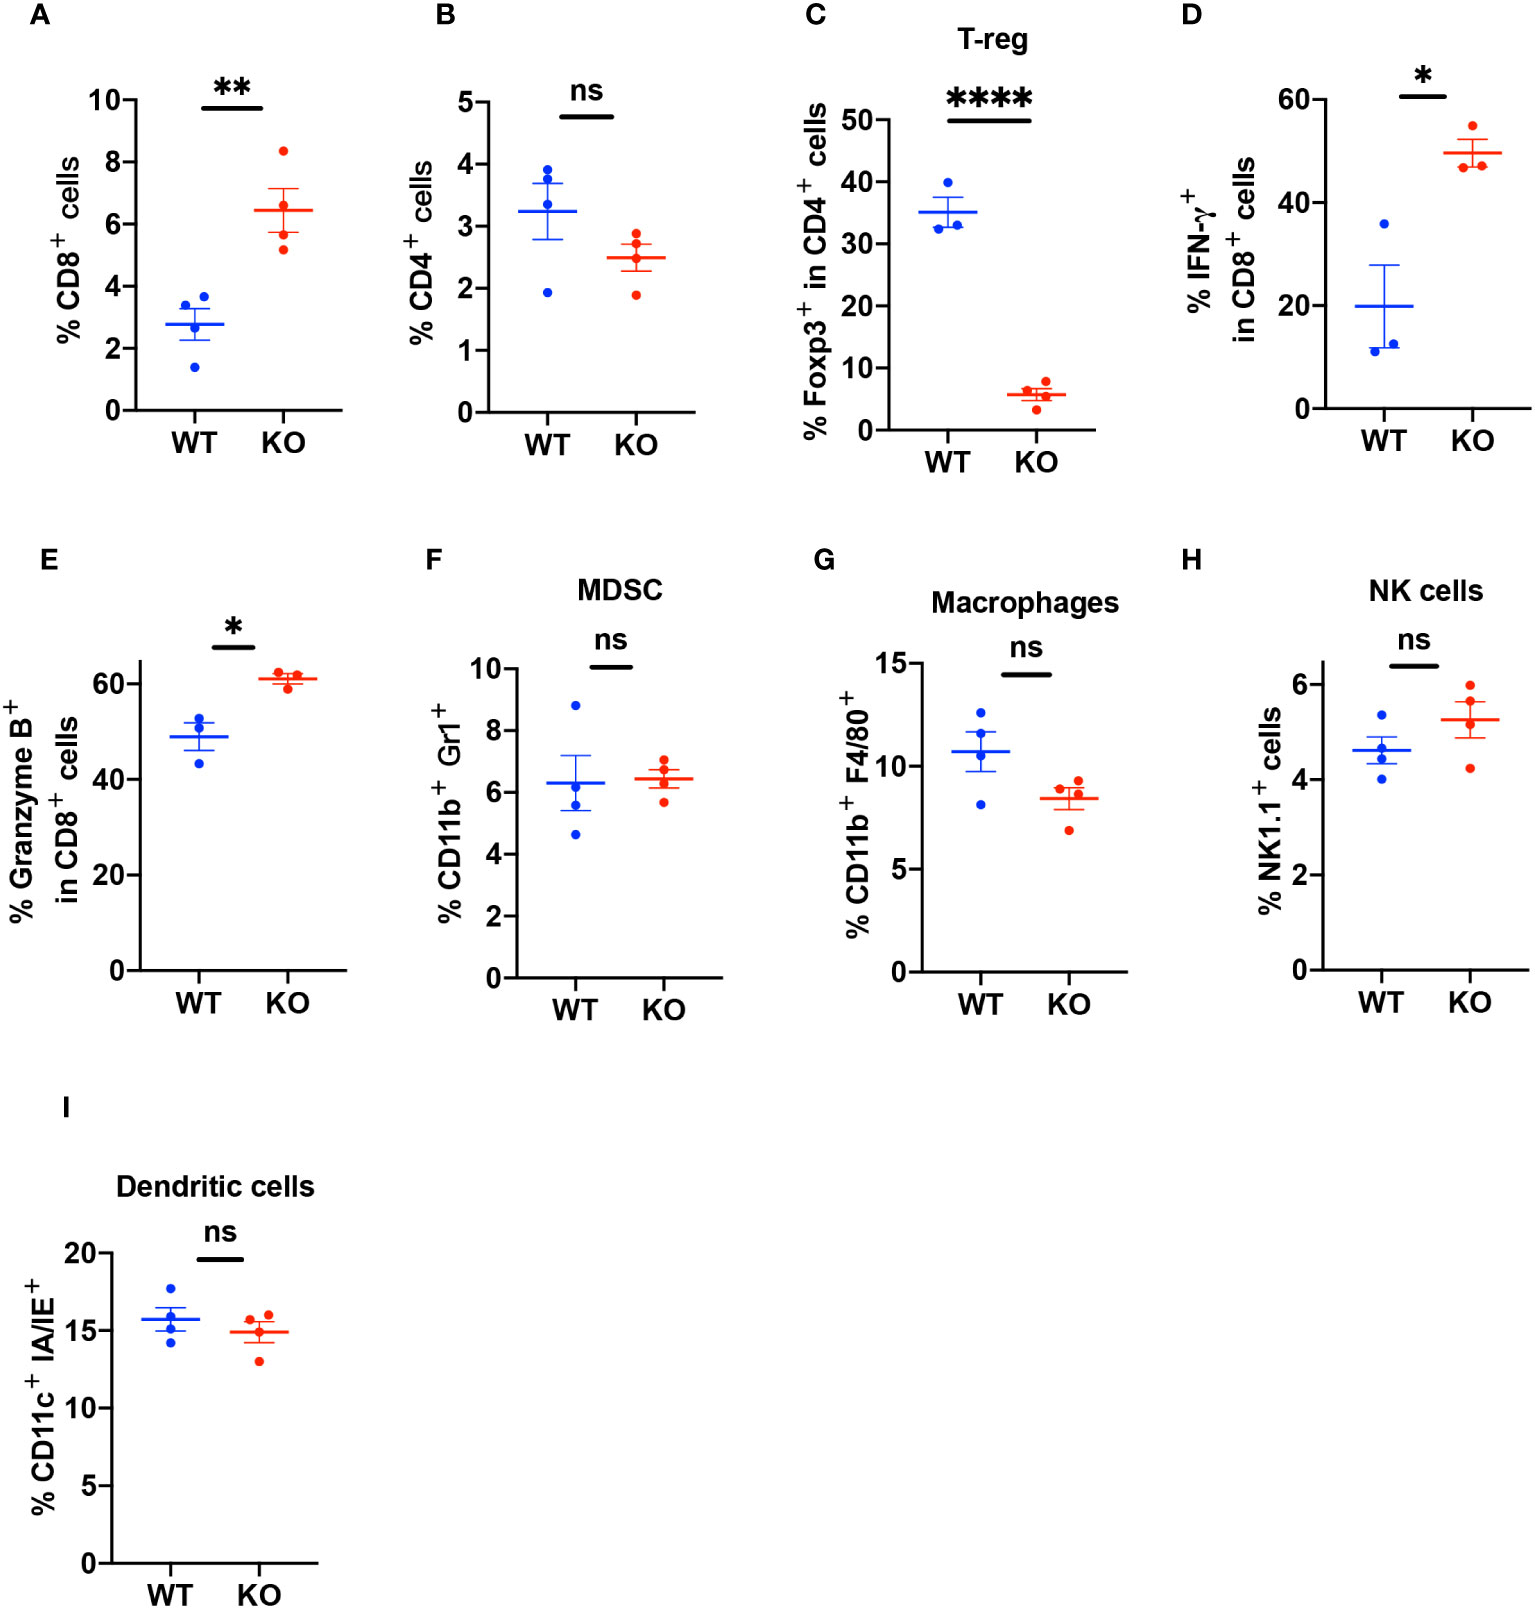
Figure 4 Quantification of the percentage of infiltrating immune cells in the TIME. (A) CD3+CD8+ T cells as a percentage of live cells in the TIME (B) CD3+CD4+ T cells as a percentage of live cells in the TIME. (C) CD3+CD4+Foxp3+ Tregs as a percentage of CD4+ T cells. (D) CD8+IFN-γ+ cells as a percentage of CD8+ T cells. (E) CD8+Granzyme B+ cells as a percentage of CD8+ T cells. (F) CD11b+Gr1+ (MDSC) cells as a percentage of live cells in the TIME. (G) CD11b+F4/80+ (macrophages) cells as a percentage of live cells in the TIME. (H) CD45+CD3-Nk1.1+ (NK cells) cells as a percentage of live cells in the TIME. (I) CD11c+ IA/IE+ (dendritic cells) as a percentage of live cells in the TIME. Representative data of experiments with n = 3 or 4 mice per experiment and group. Mean ± SEM, *p < 0.05, **p < 0.01, and ****p < 0.0001; ns = not significant.
3.7 N-glycoproteomic analysis of B4galt3 KO and WT immune cells
To investigate the effect of B4galt3 deficiency on protein glycosylation, protein samples were collected from the splenocytes of WT and KO mice (five mice per genotype) after activation by CD3/CD28 dynamic beads. Because the amount of protein obtained from CD8+ T cells infiltrated in the TIME was insufficient for glycoprotein analyses, we used stimulated spleen cells instead. Protein samples were digested with trypsin and Lys-C, and N-glycopeptides were enriched by acetone precipitation. A comprehensive label-free quantitative analysis was performed by liquid chromatography-tandem mass spectrometry (LC-MS/MS) at two different NCE of 27 and 35 (Figure 5A). Overall, 6,671 N-glycoforms were identified in 1,281 proteins. Among them, 2,685 N-glycoforms were found in the WT, 2,048 glycoforms in the B4galt3 KO, and 1,938 N-glycoforms were commonly found in both groups (Figure 5B). Our analysis yielded the first N-glycoproteomic dataset of immune cells from C57BL/6 mice.
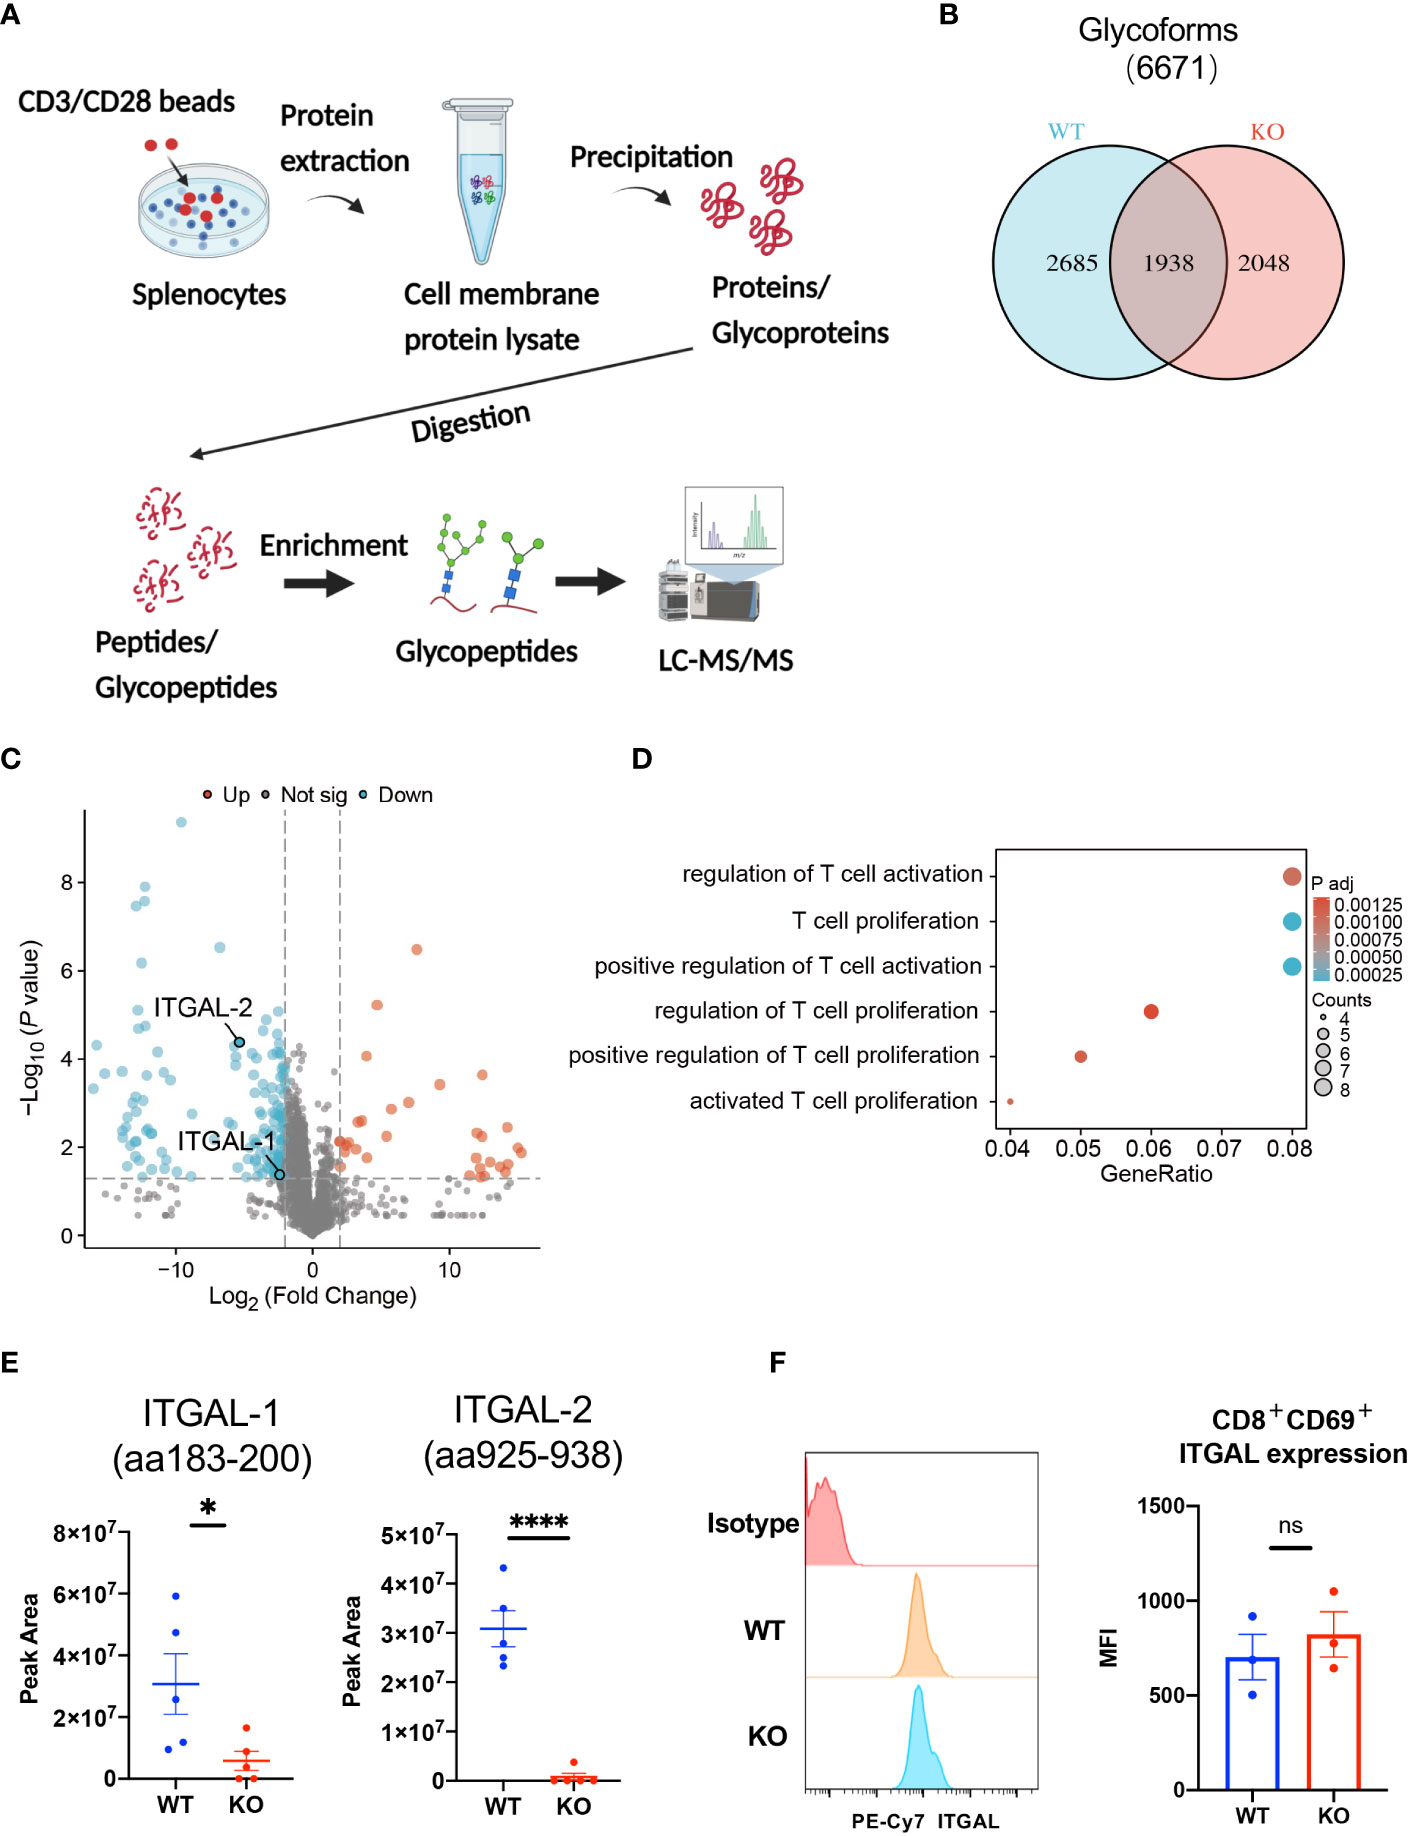
Figure 5 Glycoproteomic analysis of B4galt3 KO and WT splenocytes. (A) Schematic of glycoproteomic analysis. (B) Venn diagram representation of N-glycoforms between WT and B4galt3 KO splenocytes. (C) Volcano plot of individual N-glycopeptide abundance fold changes with |log2FC| ≥ 2 and p < 0.05 in WT and B4galt3 KO splenocytes. Red dots represent up-regulated N-glycopeptides, and blue dots represent down-regulated N-glycopeptides in B4galt3 KO mice compared to WT mice. (D) GO enrichment biological process analysis of relative abundance of N-glycoproteins. (E) Amounts of N-glycoforms of ITGAL-1 (aa183-200) and ITGAL-2 (aa925-938) in WT and B4galt3 KO splenocytes. (F) Left panel: Representative histograms of ITGAL protein expression on the surface of CD8+CD69+ T cells. Right panel: Quantification of the mean fluorescence intensity (MFI) for ITGAL. Mean ± SEM, n = 3 mice per experiment and group. *p < 0.05 and ****p < 0.0001; ns = not significant.
Subsequently, we performed differential glycoform abundance analysis, and 180 N-glycoforms showed significant changes (|log2FC| ≥ 2, p < 0.05) in KO samples compared to WT samples; of these, 32 N-glycoforms (from 25 glycoproteins) increased in abundance and 148 N-glycoforms (from 104 glycoproteins) decreased in abundance (Figure 5C). As CD8+ T cell depletion experiments (Figure 2) suggested that the suppression of tumor growth in B4galt3 KO mice may be caused by CD8+ T cells, we picked up T cell-associated GO entries and identified 14 proteins (PSAP, MMP9, MPO, HP, ITGAL, CTSZ, CD86, ITGA4, RPN2, PLD4, H2-AA, PIK3R1, ATP1B3, NGP) after GO analysis of the proteins corresponding to these glycoforms (Figure 5D, Supplementary Table 8). And because in the RNA-seq analysis of tumor-infiltrating CD8+ T cells, B4galt3 deficiency was positively associated with integrin-mediated cell adhesion (Supplementary Figure 3D). Therefore, we focused on integrin alpha-L (ITGAL), which is expressed on the T cell surface and influences T cell activity within the TIME. We noted a considerable decrease in ITGAL-1 (aa183-200) and ITGAL-2 (aa925-938) glycoforms in B4galt3 KO mice compared to their WT counterparts (Figure 5E). Both N-glycoforms of ITGAL were robustly corroborated by product ion spectra (Supplementary Figures 5A, B). Characteristic oxonium ions were annotated on the spectra, encompassing m/z values at 204.09 (HexNAc), 274.09 (NeuAc) and 290.09 (NeuGc), 366.14 (HexNAc + Hex), and 528.19 (Man + HexNAc + Hex). The ions corresponding to the peptides and peptide-associated fragments that were accurately interpreted constituted a substantial proportion of the total spectral intensity.
We used FACS to measure ITGAL protein expression on the surface of activated CD8+ T cells and confirmed that there was no change in ITGAL protein expression between KO and WT CD8+ T cells (Figure 5F), indicating that ITGAL glycoforms decreased because of glycosylation changes rather than total protein changes.
3.8 B4galt3 KO enhances downstream phospho-FAK in ITGAL
To elucidate the impact of decreased ITGAL glycoforms in CD8+ T cells on downstream signaling, we isolated CD8+ T cells from mouse spleens and stimulated them for 6-h. FACS analysis revealed that compared to WT CD8+ T cells, B4galt3 KO CD8+ T cells displayed elevated levels of FAK phosphorylation. This difference in FAK phosphorylation was negated by the LFA-1-specific inhibitor BIRT377 (Figure 6A). Concurrently, KO CD8+ T cells expressed significantly higher levels of the T-cell activation marker CD69 (Figure 6B), suggesting increased ease of activation in B4galt3 deficient CD8+ T cells.
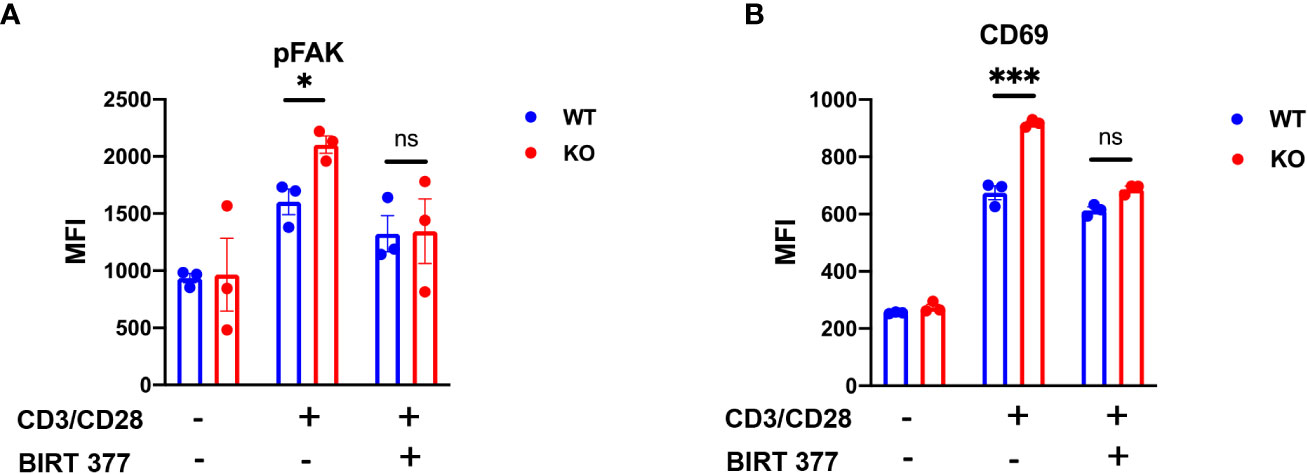
Figure 6 B4galt3 KO enhances downstream pFAK in ITGAL. (A) Phosphorylated FAK of MFI, (B) CD69 MFI after 6-h stimulation with Dynabeads Mouse T-Activator CD3/CD28. Representative data from two independent experiments with 3 mice per experiment and group. Mean ± SEM, *p < 0.05, **p < 0.01, and ***p < 0.001; ns = not significant.
4 Discussion
Over the past few decades, we have resolutely performed functional analysis of the B4GALT family (26). We generated KO mice deficient in B4galt1, B4galt2, B4galt5, and both B4galt5 and B4galt6 genes (27–30). This study primarily focused on the protein galactosyltransferase genes B4galt1, B4galt3, and B4galt4, rather than B4galt5 and B4galt6 involved in glycolipid synthesis. Our results showed that the growth of strongly immunogenic tumors was suppressed in B4galt3 KO mice but not in B4galt1 or B4galt4 KO mice. To the best of our knowledge, this phenotype has not been reported in any other galactosyltransferase-KO mice. Notably, neither B4galt1 nor B4gal4 KO mice exhibited such phenotypes. This is likely due to the specificity of each galactosyltransferase in the glycosylation of different proteins, which could result in distinct physiological impacts. Each B4GALT member may influence distinct pathways involved in tumor progression or the immune response, resulting in different phenotypes. Furthermore, the expression level, activity as a galactosyltransferase, and tissue distribution of B4GALT3 may differ from those of B4GALT1 and B4GALT4, further contributing to the observed variations. To understand these differences, more comprehensive studies are required to investigate the molecular mechanisms and roles of B4GALT in tumor development and immunity.
Recent studies have shown that B4GALT3 is associated with glioblastoma, colorectal cancer, cervical cancer, bladder cancer, and lung metastasis with liver cancer (21, 22, 31–33). Furthermore, analysis of the expression of human B4GALT3 mRNA in TCGA database revealed that B4GALT3 was differentially expressed between tumor tissues and normal tissues, and the expression of B4GALT3 was related to the prognosis of ACC, CESC, LIHC, MESO, SARC, and HNSC. Therefore, B4GALT3 plays an important role in tumorigenesis in humans. However, whether B4GALT3 is important in cancer or immune cells cannot be determined from these findings.
Owing to the selective suppression of growth in the highly immunogenic tumors observed in B4galt3 KO mice, we explored the role of immune cells. We performed BM transplantation experiments to examine whether immune cells from the BM played a role in tumor growth suppression in B4galt3 KO mice. WT mice transplanted with B4galt3 KO BM cells, but not WT BM cells, showed suppressed tumor growth, indicating that immune cells are crucial. The TIME has various kinds of immune cells, among which CD8+ T cells play a key role in the anti-tumor function. After CD8+ T cells in mice were depleted using an anti-CD8 antibody, B4galt3 KO mice did not respond to the growth inhibition of tumors with strong immunogenicity, demonstrating that CD8+ T cells are essential for suppressing tumor growth by B4galt3 deficiency. Concurrently, the upregulation of genes associated with immune system processes, T cell differentiation, and interferon-gamma production were observed. Additionally, pathways associated with cell adhesion, T-cell receptor signaling, C-type lectin receptor signaling, and NF-κB were positively correlated with B4galt3 deficiency.
We observed decreased infiltration of Tregs in the B4galt3 KO TIME. An elevated number of CD8+ T cells in the TIME is typically associated with a favorable prognosis, whereas a high presence of Tregs is associated with a poor prognosis across numerous cancer types (34–37). CD8+ T cells inhibit tumor growth by secreting cytokines, such as interferon (IFN)-γ, granzyme B, and tumor necrosis factor-α (TNFα) (38). Our findings revealed that the TIME of B4galt3 KO mice had a higher infiltration of IFN-γ+ and granzyme B+ CD8+ T cells than that of WT mice. IFN-γ and granzyme B are effective mechanisms through which CD8+ T cells kill tumor cells, which could directly contribute to the suppression of highly immunogenic tumor growth. These findings suggest the formation of a tumor-suppressive microenvironment in B4galt3 KO mice.
To characterize WT and B4galt3 KO CD8+ T cells in the TIME, we used FACS to isolate CD8+ T cells and performed RNA sequencing. GO analyses showed that the regulation of cell proliferation and inflammatory response-related genes increased. The inflammatory responses of T cells are associated with an increase in their anti-tumor effects. By increasing the inflammatory response of T cells, the immune system is better able to recognize and attack cancer cells. Recent studies report that B4GALT3 regulates the ITGB1 (20–22). Although not statistically significant, we found that B4galt3 deficiency was positively correlated with the integrin-mediated cell adhesion pathway.
Through glycoproteomic analyses, we specifically identified the ITGAL, which is part of the integrin family and associated with T cell activation. Integrins are among the family of molecules whose functions change owing to glycosylation. Integrin family members are key adhesion molecules for recruiting immune cells to the site where an immune response is taking place. Particularly, ITGAL binds to ITGB2 to generate LFA-1. LFA-1 is a mechanosensitive adhesion receptor that uses mechanical forces to regulate T cell migration, differentiation, and effector functions (39). Activating LFA-1 on tumor-infiltrating T cells to boost its binding to ICAM-1 could potentially increase tumor-specific T cell recruitment to the TIME (40). The elevated FAK phosphorylation and increased expression of T cell activation marker CD69 in B4galt3 KO CD8+ T cells suggests that B4GALT3 may play a role in regulating T cell activation. FAK is a key player in integrin-mediated signal transduction pathways and its phosphorylation is an indicator of cell activation. The increase in FAK phosphorylation in B4galt3 KO T cells could therefore reflect enhanced T cell activation, potentially contributing to the increased anti-tumor activity in B4galt3 KO mice. Certain research findings have demonstrated that the conformation of LFA-1 plays a crucial role in modulating T cell activity and cytotoxicity (41, 42). Changes in the glycosylation of ITGAL could potentially alter the extension of LFA-1 conformation. Altered conformations may enhance ITGAL’s interactions with ligands or other molecules, amplifying downstream signaling pathways like FAK phosphorylation. This could enhance the migratory and infiltrative capabilities of T cells, facilitating greater CD8+ T cell infiltration into tumors and inhibiting tumor growth. While it’s possible that altered glycosylation affects ITGAL stability, our data suggest that the changes more likely influence ITGAL-mediated signaling, as ITGAL expression levels were comparable between WT and KO after in vitro stimulation (Figure 5F). However, direct evidence supporting this hypothesis is currently lacking, underscoring the need for further research.
The elevated expression of B4GALT3 in multiple tumor types, including ACC, CESC, LIHC, MESO, SARC, and HNSC, underscores its potential as a biomarker for these cancers. Building on this, our study with B4galt3 KO mice has revealed new opportunities for therapeutic interventions. Specifically, the use of siRNA to inhibit B4GALT3 expression emerges as a promising strategy for modulating glycosylation pathways. Our research has particularly highlighted the role of ITGAL in modulating CD8+ T cell activity through glycosylation, opening avenues for the development of targeted therapies to enhance anti-tumor immunity. Importantly, our B4galt3 KO mice showed no observable health defects over a year-long observation period, supporting the idea that targeting B4GALT3 could be a therapeutic approach with a favorable safety profile.
In conclusion, our study provides new insights into the role of B4GALT3 in mediating tumor-immune interactions. We demonstrated that B4galt3 deficiency affects the TIME, leading to increased infiltration of CD8+ T cells, thereby inhibiting the growth of strongly immunogenic tumors. Interestingly, our glycoproteomic analysis suggests a potential association between B4galt3 deficiency and alterations in glycosylation of the ITGAL protein on the surface of T cells. Nevertheless, our findings present new therapeutic possibilities, particularly for tumors with high immunogenicity. Furthermore, the B4galt3 KO mouse generated in our study offers a valuable tool for future research on the complex interactions between glycosylation and immune responses in cancer.
Data availability statement
The datasets generated and/or analyzed during the current study, as well as the online tools used, are as follows: RNA-seq data of tumor tissues were deposited in the NCBI SRA repository under accession number PRJNA856497. RNA-seq data of tumor-infiltrating CD8+ T cells are also available at the NCBI SRA repository under accession number PRJNA982840. Raw data files pertaining to N-glycoproteomic analysis were lodged within the ProteomeXchange Consortium via the jPOST partner repository, bearing the dataset identifier PXD041293. The flow cytometry raw results can be accessed via https://flowrepository.org/id/, identification number FR-FCM-Z6M6, FR-FCM-Z6M7, FR-FCM-Z6M8, FR-FCM-Z6M9, FR-FCM-Z6MA, FR-FCM-Z6MB, FR-FCM-Z6MC, and FR-FCM-Z6MD. In addition to the datasets, the study also used the following online resources: The Konezumi online tool, accessible at: (https://www.md.tsukuba.ac.jp/LabAnimalResCNT/KOanimals/konezumi.html). The TIMER2.0 database, accessible at: (http://timer.cistrome.org). The GEPIA2 online tool, accessible at: (http://gepia2.cancer-pku.cn/#index).
Ethics statement
Ethical approval was not required for the study involving humans in accordance with the local legislation and institutional requirements. Written informed consent to participate in this study was not required from the participants or the participants’ legal guardians/next of kin in accordance with the national legislation and the institutional requirements. The animal study was approved by Animal Experimentation Committee of Kyoto University. The study was conducted in accordance with the local legislation and institutional requirements.
Author contributions
HW: Investigation, Resources, Software, Visualization, Writing – original draft, Writing – review & editing. CN: Project administration, Supervision, Writing – original draft, Writing – review & editing. DT: Investigation, Software, Visualization, Data curation, Methodology, Writing – original draft, Writing – review & editing. KS: Resources, Writing – review & editing. XP: Writing – review & editing. AI: Resources, Writing – review & editing. NK: Project administration, Resources, Supervision, Writing – original draft, Writing – review & editing. MA: Project administration, Supervision, Writing – original draft, Writing – review & editing.
Funding
The authors declare financial support was received for the research, authorship, and/or publication of this article. This research received partial funding from several sources, including the JSPS KAKENHI grants number JP21H02389 (MA) and JP21H02617 (DT), a 2021-2023 Strategic Research Promotion grant (SK3001) from Yokohama City University (NK), and a 2021 grant from the Shimizu Foundation for Immunology and Neuroscience (CN).
Acknowledgments
We wish to extend our sincere gratitude to Dr. Yoshihiro Hayakawa from the University of Toyama, and Dr. Shin-ichiro Fujii from the RIKEN Center for Integrative Medical Sciences. The generous provision of B16F10-OVA cells was instrumental in the progress of our research. We also thank all the members of the Institute of Laboratory Animals at Kyoto University for their excellent care and management of the mice used in this study. We appreciate the professional English language editing services provided by Editage (www.editage.com), which significantly enhanced the clarity and readability of our manuscript.
Conflict of interest
The authors declare that the research was conducted in the absence of any commercial or financial relationships that could be construed as a potential conflict of interest.
Publisher’s note
All claims expressed in this article are solely those of the authors and do not necessarily represent those of their affiliated organizations, or those of the publisher, the editors and the reviewers. Any product that may be evaluated in this article, or claim that may be made by its manufacturer, is not guaranteed or endorsed by the publisher.
Supplementary material
The Supplementary Material for this article can be found online at: https://www.frontiersin.org/articles/10.3389/fimmu.2023.1272537/full#supplementary-material
References
1. Apweiler R, Hermjakob H, Sharon N. On the frequency of protein glycosylation, as deduced from analysis of the SWISS-PROT database. Biochim Biophys Acta BBA - Gen Subj (1999) 1473:4–8. doi: 10.1016/S0304-4165(99)00165-8
2. An HJ, Froehlich JW, Lebrilla CB. Determination of glycosylation sites and site-specific heterogeneity in glycoproteins. Curr Opin Chem Biol (2009) 13:421–6. doi: 10.1016/j.cbpa.2009.07.022
3. Reily C, Stewart TJ, Renfrow MB, Novak J. Glycosylation in health and disease. Nat Rev Nephrol (2019) 15:346–66. doi: 10.1038/s41581-019-0129-4
4. Ohtsubo K, Marth JD. Glycosylation in cellular mechanisms of health and disease. Cell (2006) 126:855–67. doi: 10.1016/j.cell.2006.08.019
5. Pinho SS, Reis CA. Glycosylation in cancer: mechanisms and clinical implications. Nat Rev Cancer (2015) 15:540–55. doi: 10.1038/nrc3982
6. Fuster MM, Esko JD. The sweet and sour of cancer: glycans as novel therapeutic targets. Nat Rev Cancer (2005) 5:526–42. doi: 10.1038/nrc1649
7. Stowell SR, Ju T, Cummings RD. Protein glycosylation in cancer. Annu Rev Pathol Mech Dis (2015) 10:473–510. doi: 10.1146/annurev-pathol-012414-040438
8. Zhou X, Yang G, Guan F. Biological functions and analytical strategies of sialic acids in tumor. Cells (2020) 9:273. doi: 10.3390/cells9020273
9. Dobie C, Skropeta D. Insights into the role of sialylation in cancer progression and metastasis. Br J Cancer (2021) 124:76–90. doi: 10.1038/s41416-020-01126-7
10. Pearce OMT, Läubli H. Sialic acids in cancer biology and immunity. Glycobiology (2016) 26:111–28. doi: 10.1093/glycob/cwv097
11. van Houtum EJH, Büll C, Cornelissen LAM, Adema GJ. Siglec signaling in the tumor microenvironment. Front Immunol (2021) 12:790317. doi: 10.3389/fimmu.2021.790317
12. Mensah SA, Harding IC, Zhang M, Jaeggli MP, Torchilin VP, Niedre MJ, et al. Metastatic cancer cell attachment to endothelium is promoted by endothelial glycocalyx sialic acid degradation. Aiche J Am Inst Chem Eng (2019) 65:e16634. doi: 10.1002/aic.16634
13. Gupta R, Leon F, Rauth S, Batra SK, Ponnusamy MP. A systematic review on the implications of O-linked glycan branching and truncating enzymes on cancer progression and metastasis. Cells (2020) 9:446. doi: 10.3390/cells9020446
14. Radhakrishnan P, Dabelsteen S, Madsen FB, Francavilla C, Kopp KL, Steentoft C, et al. Immature truncated O-glycophenotype of cancer directly induces oncogenic features. Proc Natl Acad Sci (2014) 111:E4066–75. doi: 10.1073/pnas.1406619111
15. Wang P, Li X, Xie Y. B4GalT1 regulates apoptosis and autophagy of glioblastoma in vitro and in vivo. Technol Cancer Res Treat (2020) 19:153303382098010. doi: 10.1177/1533033820980104
16. Dai Z, Wang K, Gao Y. The critical role of B4GALT4 in promoting microtubule spindle assembly in HCC through the regulation of PLK1 and RHAMM expression. J Cell Physiol (2022) 237:617–36. doi: 10.1002/jcp.30531
17. Tang W, Li M, Qi X, Li J. β1,4-galactosyltransferase V modulates breast cancer stem cells through wnt/β-catenin signaling pathway. Cancer Res Treat (2020) 52:1084–102. doi: 10.4143/crt.2020.093
18. Han Y, Li Z, Wu Q, Liu H, Sun Z, Wu Y, et al. B4GALT5 high expression associated with poor prognosis of hepatocellular carcinoma. BMC Cancer (2022) 22:392. doi: 10.1186/s12885-022-09442-2
19. Zhou H, Ma H, Wei W, Ji D, Song X, Sun J, et al. B4GALT family mediates the multidrug resistance of human leukemia cells by regulating the hedgehog pathway and the expression of p-glycoprotein and multidrug resistance-associated protein 1. Cell Death Dis (2013) 4:e654–4. doi: 10.1038/cddis.2013.186
20. Chang H-H, Chen C-H, Chou C-H, Liao Y-F, Huang M-J, Chen Y-H, et al. β-1,4-galactosyltransferase III enhances invasive phenotypes via β1-integrin and predicts poor prognosis in neuroblastoma. Clin Cancer Res (2013) 19:1705–16. doi: 10.1158/1078-0432.CCR-12-2367
21. Chen C-H, Wang S-H, Liu C-H, Wu Y-L, Wang W-J, Huang J, et al. β-1,4-Galactosyltransferase III suppresses β1 integrin-mediated invasive phenotypes and negatively correlates with metastasis in colorectal cancer. Carcinogenesis (2014) 35:1258–66. doi: 10.1093/carcin/bgu007
22. Fang T, Lv H, Lv G, Li T, Wang C, Han Q, et al. Tumor-derived exosomal miR-1247-3p induces cancer-associated fibroblast activation to foster lung metastasis of liver cancer. Nat Commun (2018) 9:191. doi: 10.1038/s41467-017-02583-0
23. Tomayko MM, Reynolds CP. Determination of subcutaneous tumor size in athymic (nude) mice. Cancer Chemother Pharmacol (1989) 24:148–54. doi: 10.1007/BF00300234
24. Euhus DM, Hudd C, Laregina MC, Johnson FE. Tumor measurement in the nude mouse. J Surg Oncol (1986) 31:229–34. doi: 10.1002/jso.2930310402
25. Takakura D, Harazono A, Hashii N, Kawasaki N. Selective glycopeptide profiling by acetone enrichment and LC/MS. J Proteomics (2014) 101:17–30. doi: 10.1016/j.jprot.2014.02.005
26. Asano M. Various biological functions of carbohydrate chains learned from glycosyltransferase-deficient mice. Exp Anim (2020) 69:261–8. doi: 10.1538/expanim.20-0013
27. Asano M, Furukawa K, Kido M, Matsumoto S, Umesaki Y, Kochibe N, et al. Growth retardation and early death of beta-1,4-galactosyltransferase knockout mice with augmented proliferation and abnormal differentiation of epithelial cells. EMBO J (1997) 16:1850–7. doi: 10.1093/emboj/16.8.1850
28. Yoshihara T, Sugihara K, Kizuka Y, Oka S, Asano M. Learning/memory impairment and reduced expression of the HNK-1 carbohydrate in β4-galactosyltransferase-II-deficient mice. J Biol Chem (2009) 284:12550–61. doi: 10.1074/jbc.M809188200
29. Nishie T, Hikimochi Y, Zama K, Fukusumi Y, Ito M, Yokoyama H, et al. β4-Galactosyltransferase-5 is a lactosylceramide synthase essential for mouse extra-embryonic development. Glycobiology (2010) 20:1311–22. doi: 10.1093/glycob/cwq098
30. Yoshihara T, Satake H, Nishie T, Okino N, Hatta T, Otani H, et al. Lactosylceramide synthases encoded by B4galt5 and 6 genes are pivotal for neuronal generation and myelin formation in mice. PloS Genet (2018) 14:e1007545. doi: 10.1371/journal.pgen.1007545
31. Wu T, Li Y, Chen B. B4GALT3 promotes cell proliferation and invasion in glioblastoma. Neurol Res (2020) 42:463–70. doi: 10.1080/01616412.2020.1740465
32. Sun Y, Yang X, Liu M, Tang H. B4GALT3 up-regulation by miR-27a contributes to the oncogenic activity in human cervical cancer cells. Cancer Lett (2016) 375:284–92. doi: 10.1016/j.canlet.2016.03.016
33. Liu H, Chen D, Bi J, Han J, Yang M, Dong W, et al. Circular RNA circUBXN7 represses cell growth and invasion by sponging miR-1247-3p to enhance B4GALT3 expression in bladder cancer. Aging (2018) 10:2606–23. doi: 10.18632/aging.101573
34. Luo CT, Liao W, Dadi S, Toure A, Li MO. Graded Foxo1 activity in Treg cells differentiates tumour immunity from spontaneous autoimmunity. Nature (2016) 529:532–6. doi: 10.1038/nature16486
35. Desbois M, Udyavar AR, Ryner L, Kozlowski C, Guan Y, Dürrbaum M, et al. Integrated digital pathology and transcriptome analysis identifies molecular mediators of T-cell exclusion in ovarian cancer. Nat Commun (2020) 11:5583. doi: 10.1038/s41467-020-19408-2
36. Chevrier S, Levine JH, Zanotelli VRT, Silina K, Schulz D, Bacac M, et al. An immune atlas of clear cell renal cell carcinoma. Cell (2017) 169:736–49.e18. doi: 10.1016/j.cell.2017.04.016
37. Nishikawa H, Sakaguchi S. Regulatory T cells in tumor immunity. Int J Cancer (2010) 127:759–67. doi: 10.1002/ijc.25429
38. Martínez-Lostao L, Anel A, Pardo J. How do cytotoxic lymphocytes kill cancer cells? Clin Cancer Res (2015) 21:5047–56. doi: 10.1158/1078-0432.CCR-15-0685
39. Gérard A, Cope AP, Kemper C, Alon R, Köchl R. LFA-1 in T cell priming, differentiation, and effector functions. Trends Immunol (2021) 42:706–22. doi: 10.1016/j.it.2021.06.004
40. Franciszkiewicz K, Le Floc’h A, Boutet M, Vergnon I, Schmitt A, Mami-Chouaib F. CD103 or LFA-1 engagement at the immune synapse between cytotoxic T Cells and tumor cells promotes maturation and regulates T-cell effector functions. Cancer Res (2013) 73:617–28. doi: 10.1158/0008-5472.CAN-12-2569
41. Lötscher J, Martí i Líndez A-A, Kirchhammer N, Cribioli E, Giordano Attianese GMP, Trefny MP, et al. Magnesium sensing via LFA-1 regulates CD8+ T cell effector function. Cell (2022) 185:585–602.e29. doi: 10.1016/j.cell.2021.12.039
Keywords: galactosyltransferase, tumor immune microenvironment, N-glycosylation, glycoproteomics, immunogenicity
Citation: Wei H, Naruse C, Takakura D, Sugihara K, Pan X, Ikeda A, Kawasaki N and Asano M (2023) Beta-1,4-galactosyltransferase-3 deficiency suppresses the growth of immunogenic tumors in mice. Front. Immunol. 14:1272537. doi: 10.3389/fimmu.2023.1272537
Received: 04 August 2023; Accepted: 18 September 2023;
Published: 09 October 2023.
Edited by:
Raghavendra Kikkeri Venkatanarayan, Indian Institute of Science Education and Research, IndiaCopyright © 2023 Wei, Naruse, Takakura, Sugihara, Pan, Ikeda, Kawasaki and Asano. This is an open-access article distributed under the terms of the Creative Commons Attribution License (CC BY). The use, distribution or reproduction in other forums is permitted, provided the original author(s) and the copyright owner(s) are credited and that the original publication in this journal is cited, in accordance with accepted academic practice. No use, distribution or reproduction is permitted which does not comply with these terms.
*Correspondence: Masahide Asano, YXNhbm8ubWFzYWhpZGUuNXVAa3lvdG8tdS5hYy5qcA==