
94% of researchers rate our articles as excellent or good
Learn more about the work of our research integrity team to safeguard the quality of each article we publish.
Find out more
ORIGINAL RESEARCH article
Front. Immunol. , 08 January 2024
Sec. Viral Immunology
Volume 14 - 2023 | https://doi.org/10.3389/fimmu.2023.1268510
This article is part of the Research Topic Systemic Cellular Immune Responses and Immunological Biomarkers in Emerging and Re-emerging Viral Infections: An Evolving Landscape View all 9 articles
 Hyundong Yoon1†Logan S. Dean2,3†
 Boonyanudh Jiyarom2
 Vedbar S. Khadka4
 Youping Deng4
 Vivek R. Nerurkar3
 Dominic C. Chow2,5
 Cecilia M. Shikuma2,3,5
 Gehan Devendra5,6
 Youngil Koh1,7*
 Juwon Park2,3*
Background: Although our understanding of the immunopathology and subsequent risk and severity of COVID-19 disease is evolving, a detailed account of immune responses that contribute to the long-term consequences of pulmonary complications in COVID-19 infection remains unclear. Few studies have detailed the immune and cytokine profiles associated with post-acute sequelae of SARS-CoV-2 infection (PASC) with persistent pulmonary symptoms. The dysregulation of the immune system that drives pulmonary sequelae in COVID-19 survivors and PASC sufferers remains largely unknown.
Results: To characterize the immunological features of pulmonary PASC (PPASC), we performed droplet-based single-cell RNA sequencing (scRNA-seq) to study the transcriptomic profiles of peripheral blood mononuclear cells (PBMCs) from a participant naïve to SARS-CoV-2 (Control) (n=1) and infected with SARS-CoV-2 with chronic pulmonary symptoms (PPASC) (n=2). After integrating scRNA-seq data with a naïve participant from a published dataset, 11 distinct cell populations were identified based on the expression of canonical markers. The proportion of myeloid-lineage cells ([MLCs]; CD14+/CD16+monocytes, and dendritic cells) was increased in PPASC (n=2) compared to controls (n=2). MLCs from PPASC displayed up-regulation of genes associated with pulmonary symptoms/fibrosis, while glycolysis metabolism-related genes were downregulated. Similarly, pathway analysis showed that fibrosis-related (VEGF, WNT, and SMAD) and cell death pathways were up-regulated, but immune pathways were down-regulated in PPASC. Further comparison of PPASC with scRNA-seq data with Severe COVID-19 (n=4) data demonstrated enrichment of fibrotic transcriptional signatures. In PPASC, we observed interactive VEGF ligand-receptor pairs among MLCs, and network modules in CD14+ (cluster 4) and CD16+ (Cluster 5) monocytes displayed a significant enrichment for biological pathways linked to adverse COVID-19 outcomes, fibrosis, and angiogenesis. Further analysis revealed a distinct metabolic alteration in MLCs with a down-regulation of glycolysis/gluconeogenesis in PPASC compared to SARS-CoV-2 naïve samples.
Conclusion: Analysis of a small scRNA-seq dataset demonstrated alterations in the immune response and cellular landscape in PPASC. The presence of elevated MLC levels and their corresponding gene signatures associated with fibrosis, immune response suppression, and altered metabolic states suggests a potential role in PPASC development.
Three years have passed since the outbreak of the novel coronavirus disease 19 [COVID-19], caused by severe acute respiratory syndrome virus 2 [SARS-CoV-2] (1). COVID-19 is a global public health crisis and has had profound impacts on economic growth and social structures (2–4). The advent of COVID-19 vaccines has effectively reduced the risk of SARS-CoV-2 infection and prevented death and severe illness following acute infection (5, 6). However, approximately 10-30% of COVID-19 survivors experience chronic health conditions (‘sequelae’) that persist longer than 3 months and develop within 28 days of acute illness (7–10). These ongoing health problems are termed Long COVID or Post-COVID Syndrome, but also referred to as “post-acute sequelae of SARS-CoV-2” (PASC). PASC symptoms reported by survivors vary, but common symptoms include fatigue, insomnia, dyspnea, and coughing (11). A subset of PASC continues to experience persistent pulmonary symptoms even after recovery from the acute infection (described hereafter as PPASC [pulmonary PASC]) (11). Recent large cohort studies demonstrated that COVID-19 survivors have a greater risk of developing comorbidities, particularly diabetes (12), as well as cardiovascular (13) and kidney (14) diseases. Considering the global prevalence of PASC cases (15–17) and the impact of sequelae on COVID-19 survivors’ quality of life and disability-adjusted life years (18–21), PASC continues to present a significant global burden to healthcare infrastructure.
The etiology of PASC, and therefore PPASC, is not yet known, but ongoing studies have provided risk factors and potential predictors of PASC development. Factors, such as female sex, age, comorbidities, smoking, and social determinants of health (low socioeconomic status and racial/ethnic minority) are associated with an increased risk of PASC development (22–24). While the severity of COVID-19 is suspected to be a risk factor for PASC (25), evidence continues to present mixed conclusions (26–32).
Investigations into the immunopathology associated with PASC have revealed that aberrant cellular and humoral immune responses are drivers of PASC (33–36). Comparison of the circulating proteome between individuals with acute COVID-19, COVID-19-recovered, and PASC demonstrates no significant differences in most cytokines related to inflammation, nor a disease-specific signature among the groups (33, 37). However, a consensus of studies has demonstrated that IL-6, TNF, and IL-1β are commonly elevated in individuals with PASC (38–40), suggesting a pro-inflammatory etiology.
Cellular metabolic dysregulation is one of the major features of SARS-CoV-2 infection and a key determinant of disease severity (41, 42). Furthermore, epidemiological observations demonstrated that individuals who had metabolic comorbidities, such as diabetes mellitus, hyperglycemia, or obesity, were at a significantly increased risk of severe COVID-19 (43). Lung epithelial cells and monocytes infected with SARS-CoV-2 demonstrate lipid dysregulation with excessive lipid droplet accumulation within the cells (44–46). Inhibition of lipid droplet biogenesis was demonstrated to inhibit the proinflammatory response and replication of SARS-CoV-2 within infected monocytes (44), suggesting a metabolic rearrangement toward lipid use for viral replication. Investigations into glycolysis metabolic pathways reveal a strong propensity for upregulation within macrophages, monocytes, and T cells, consistent with altered cell activation and attenuated T cells’ effector functionality (47, 48). Recent evidence demonstrates a metabolic shift toward a pro-resolution and remodeling phenotype in macrophages isolated from PASC patients (49), indicating changes in plasma metabolites after SARS-CoV-2 infection led to profound and prolonged cellular metabolic disruption and subsequent cell dysfunction.
The persistence of SARS-CoV-2 protein and RNA in both immune cells and tissues (50, 51) has arisen as potential factors for PASC development (52). The persistence of viral components is well documented to have prolonged impacts on immune cell functionality and polarization (53–55) and, therefore, likely influences PASC etiology. It is likely a combination of a multitude of the aforementioned factors driving PASC development. As such, each avenue of investigation remains a viable option for discovery, with the goal of predictive and/or therapeutic intervention innovations for PASC.
Recent single‐cell RNA sequencing (scRNA‐seq) data has demonstrated profound phenotypic alteration of immune cells in COVID-19 convalescents with persistent symptoms. Innate and adaptive immune cell perturbations are evident by 12 weeks post-infection and sustained within individuals who develop PASC (56). Another large-scale scRNA-seq endeavor revealed the predictive value of cortisol levels as well as circadian rhythm-related gene signatures as predictive of PASC development (57). Although ongoing PASC studies are focused on advancing our understanding of its' pathophysiology, the mechanisms underlying persistent pulmonary sequelae secondary to SARS-CoV-2 infection remain largely unexplored. The mechanism in which key immune cell subsets change their functionalities in PASC with sustained pulmonary symptoms has remained undefined. Therefore, the identification of primary cell types associated with PPASC and signaling pathways mediated by immune cell alteration and activation are crucial to obtaining insights into immune cell perturbation that contributes to prolonged pulmonary sequelae in PASC.
In this study, we analyzed Peripheral blood mononuclear cells (PBMC) PBMC from individuals who had developed PPASC after SARS-CoV-2 infection and uninfected controls. The immune profiling and transcriptomic data revealed alterations of myeloid lineage immune cells, notably monocytes and dendritic cells in PPASC. We further explored individual cell-cell interactions on immune cell types and performed metabolic analyses, demonstrating a profound association with fibrosis, vascularization, and characteristics of a reparative immune environment. Together, our results provide evidence that perturbations undergone within the myeloid lineage of immune cells are likely associated with ongoing pro-fibrotic processes that may therefore be contributing specifically to PPASC development. This provides valuable insight into the utility of targeting immune cell populations to ameliorate pulmonary sequelae among PPASC individuals.
Human venous peripheral blood samples were taken at the state’s main tertiary care hospital-Ambulatory Post-COVID Clinic (Queen’s Medical Center, Honolulu, Hawaii) and collected in ethylenediaminetetraacetic acid (EDTA) tubes (BD, Vacutainer) by venipuncture. In brief, venous blood was diluted with an equal volume of phosphate-buffered saline (PBS) and layered on top of Ficoll-Paque Plus (GE Healthcare Biosciences, Piscataway, NJ) following the manufacturer’s protocol. PBMC were separated by centrifugation at 400 × g for 30 minutes at room temperature (RT). PBMCs were collected from the buffy coat, red blood cells were lysed, and the remaining pellet was washed twice in PBS supplemented with 2% fetal bovine serum (FBS). Cells were then counted, viability determined, and cryopreserved at 5 million cells/vial. One participant naïve to SARS-CoV-2 infection and two participants with prolonged COVID-19 pulmonary symptoms, confirmed via pulmonary function tests (PFTs), were selected for single-cell sequencing analysis. This study was approved by the Queen’s Medical Center Research & Institutional Review Committee RA-2020-053 and by the University of Hawaii Institutional Review Board 2020-00406. Written informed consent was obtained from all participants and all assays were performed according to institutional guidelines and regulations.
PFTs was performed on individuals with PPASC. All PPASC participants underwent PFTs (Vyaire) with the measurements of forced vital capacity (FVC), forced expiratory volume in 1 second (FEV1), total lung capacity (TLC), and diffusion capacity corrected for hemoglobin percent predicted (DLCOc%) interpreted in accordance with American Thoracic Society (ATS) guidelines (58).
For live PBMC purification for scRNA-seq, PBMC were stained with BV711-CD45 (Clone H130, 1:200 dilution, Biolegend, San Diego, CA) for 30 minutes at RT after adding Human TruStain FcX (1:200 dilution, Biolegend, San Diego, CA) for 15 minutes. Propidium iodide (PI) was added just before cell acquisition to assess cell viability. UltraComp eBeads Compensation Beads (Thermo Fisher Scientific, 01-2222-42) were used for compensation. Approximately 98-99% of total PBMC were identified as live and CD45+ and were sorted into 1% bovine serum albumin (BSA) in DPBS by a FACSAria IIu Cell Sorter (BD Biosciences, Franklin Lakes, NJ). Sorted cell suspensions were pelleted at 350 x g for 5 minutes at 4°C, and cells were resuspended in 0.1% BSA in Dulbecco's Phosphate Buffered Saline (DPBS) to approximately 1,000 cells/μl.
Cell concentration and viability were confirmed using an automated cell counter Countess II (Thermo Fisher Scientific) with 0.4% trypan blue solution and samples with viability > 70% were further processed. To obtain single-cell gel beads-in-emulsion (GEM), cell suspension was pelleted by 400 x g for 5 minutes at 4°C, and cells were resuspended at a concentration of 1,000 cells/μl in 0.1% BSA in DPBS. scRNA-seq libraries were prepared using Chromium Next GEM Single-Cell 5’ Reagent Kit (10x Genomics). Briefly, GEMs were generated in Chromium Controller by combining barcoded Single-Cell VDJ 5’ Gel Beads v1.1, a Master Mix with mixture of single cells, and Partitioning Oil on Chromium Next GEM Chip G. To achieve single-cell resolution, cells were delivered at a limiting dilution, such that the majority (~90-99%) of generated GEMs contains no cell, while the remainder largely contain a single cell.
Immediately following GEM generation, the Gel Beads were dissolved and any co-partitioned cell was lysed. Oligonucleotides containing (i) an Illumina R1 sequence (read 1 primer sequence), (ii) a 16 nucleotide (nt) 10x Barcode, (iii) a 10 nt unique molecular identifier (UMI), and (iv) 13 nt template switch oligo (TSO) were released and mixed with the cell lysate and a Master Mix containing reverse transcription (RT) reagents and poly(dT) RT primers, resulting in full-length cDNA from poly-adenylated mRNA. GEMs were broken and pooled after GEM-RT reaction mixtures were recovered. Silane magnetic beads were used to purify the 10x Barcoded first-strand cDNA from the post-GEM-RT reaction mixture, which includes leftover biochemical reagents and primers. After cleanup, 10x Barcoded, full-length cDNA was amplified via PCR with primers (Forward primer [P5]: 5’-AATGATACGGCGACCACCGAGA-3’ and Reverse primer [P7]: 5’-CAAGCAGAAGACGGCATACGAGAT-3’against common 5’ and 3’ ends added during GEM-RT). Amplification generated sufficient material to construct 5’ Gene Expression libraries. Enzymatic fragmentation and size selection were used to optimize the cDNA amplicon size prior to the 5’ Gene Expression library construction. P5, P7, a sample index, and Illumina R2 sequence (read 2 primer sequence) were added via End Repair, A-tailing, Adaptor Ligation, and Sample Index PCR. The final libraries contain the P5 and P7 priming sites used in Illumina sequencers. Library quality and size distribution were confirmed on Agilent Bioanalyzer High Sensitivity DNA chips (Agilent). Library quantification was performed with qPCR using the KAPA Library Quantification Kit for Illumina Platforms (KAPA/Roche). Libraries were normalized, denatured, and diluted to obtain 1.5 pM molarity. Libraries were sequenced on the NextSeq500 instrument at a depth of a minimum of 20,000 reads/cell using 26 x 91 bp read settings.
The scRNA-seq raw fastq files were aligned to the human reference genome (ver. GRch38) using the Cell Ranger pipeline (59) to generate a raw gene-by-cell count matrix. To integrate scRNA data generated from different batches, Harmony (60) was used to mitigate batch effects by merging and integrating the data. We chose a publicly available scRNA-seq dataset (GSM4509024) (61) that contained SARS-CoV-2 naïve and Severe COVID-19 PBMC samples with the study participants of similar age to our own samples. Our scRNA-seq data of PBMC (PPASC; n=2, Control; n=1) or PPASC data were combined with a naïve participant and then severe COVID-19 patients (n=4). DropletUtils was utilized to assess deviations from the ambient cell profile and empty droplets were identified (62), and cells with an FDR < 0.01 were considered statistically significant and retained as “real cells,” while those with an false discovery rates (FDR) > 0.01 were deemed “empty droplets” and removed. The Scater package was used for the calculation of quality control (QC) metrics, visualized through principal component analysis (PCA) (63). A total of 34,139 cells passed quality control (QC) for the integrated data of PPASC and Controls. A total of 34,070 cells passed QC for the integrated data of PPASC and Severe (QC; Removing empty droplets, cells with low UMI/feature counts, high mitochondrial gene expression indicative of dying cells). Via these methods, 5,861 cells were removed (Supplementary Figures 1-4). The Seurat package’s merge function was used to combine individual samples and remove cell-specific biases. The scran package’s quickCluster function was utilized for grouping cells. Cell-specific size factors were calculated using the computeSumFactors function within scran. Raw counts of each cell were normalized by cell-specific size factor and log2-transformed with a pseudo-count of 1; highly variable genes (HVG) were defined based on the variance of the log expression profiles of each gene for decomposed technical and biological components by fitted mean-variance trends through the modelGeneVar function within scran. HVG were defined as those with FDR < 0.05. Downstream analysis involved computing 20 principal components (PCs), constructing a shared nearest neighbor (SNN) graph, and performing cell clustering using the Seurat package. Batch effects in the combined individual samples were addressed by applying 50 PCs and the RunHarmony function from the Harmony package. The detailed pipeline code is available on GitHub (https://github.com/lagom2728/PPASC-SARS-CoV-2-Paper-2023).
Cells were identified based on differential expressions of canonical marker genes and clustered accordingly (64). Additionally, cell types were confirmed by visual confirmation of the average expression values of canonical marker genes (64). Cell proportions were confirmed by generating cell type percentages, followed by a permutation test and bootstrapping to validate the statistically significant differences in proportions. As a result, cells were categorized into statistically significant groups based on an increase or decrease in the proportion of cells meeting the following criteria: relative differences in cell proportions for Log2 Fold Distribution (FD) in each group > 0.3, Log2FD < -0.3, and FDR < 0.05.
To assess the differential gene expression in the scRNA data of two groups (each PPASC and Control), we conducted differential expressed gene analysis with the built-in framework of MAST (65). In the analysis results, significant up- and down-regulated genes were classified based on statistical criteria of avg_log2FC > 0.25, < -0.25, and p-value < 0.05.
To conduct the analysis, Hallmark gene sets (H), Curated gene sets (C2), and Ontology gene sets (C5) databases of MsigDB (66) were selectively used and analyzed (67). Significant regulated pathways were categorized by their normalized enrichment score (NES) as enriched (>0) or depleted (<0), and p-values < 0.05.
The DoRothEA database (68) was used to identify transcription factors for differentially expressed target genes. The transcription factors from DoRothEA are complemented by an empirical measure of confidence, reflecting the certainty in their regulons. This confidence level is categorized into grades ranging from A (highest confidence) to E. In this particular benchmark, we specifically considered only the transcription factors (TFs) with confidence levels A and B, collectively referred to as DoRothEA (AB), used for transcription factor enrichment analysis.
TF enrichment analysis was performed using the msviper function within the viper package (69). Using the control patient as a reference, genes that were differentially expressed in each cell type via the Log2FD were identified and NES was calculated. TFs were classified as statistically significantly upregulated or downregulated according to the NES criteria and p-adjusted value thresholds (NES > 0, < 0, p-value < 0.05).
The human ligand-receptor (only Secreted signaling) database was used to analyze the ligand-receptor interaction between cells (70). Cells expressing less than 5% of genes were excluded, and only interactions with statistical significance (p-value < 0.05) among autocrine or paracrine interactions were classified. To compare the interaction signals between the two groups, the communication probability value was calculated based on the geometric mean expression level.
To make scRNA into pseudo-bulk RNA, we aggregated transcript count tables of all single-cells per sample to verify possible false positives in single-cell differentially expressed genes (DEGs). Differential expression analysis was performed (71), and genes satisfying LogFC > 0.25 or < -0.25, along with a p-value < 0.05 were classified as up- or down-regulated genes, respectively.
Integrated scRNA data was utilized to calculate Pearson correlation values (72). Subsequently, correlation networks were created for specific cell types, and the identification and validation of differentially expressed network modules were accomplished through enrichment analysis (73).
For metabolic analysis, we utilized the pipeline provided by the Compass package (74), specifically employing Single-Cell Flux Estimation Analysis and Single-Cell Flux Balance Analysis. These analytical tools were used to estimate cell-specific metabolic flux to infer the metabolic states of immune cells. For analysis of metabolite communication, we employed MEBOCOST (67). This model estimates the relative abundance of metabolic products based on the expression of genes encoding metabolic reaction enzymes. It additionally identifies cell-to-cell communication of metabolites and sensors by gathering enzyme-related genes from the Human Metabolome Database (75) across different cells.
Circulating immune cell levels and their functional status hold promise as biomarkers for assessing the severity of COVID-19. Analysis of blood immune cells in COVID-19 convalescents has been used to provide insight into the long-term consequences of host immune responses after SARS-CoV-2 infection. To explore immune system alteration associated with persistent lung sequelae after recovery from acute illness of SARS-CoV-2, we selected two participants who had reduced DLCOc% (<80%) by PFT among individuals with PPASC. They had persistent pulmonary symptoms greater than 5 months after onset of SARS-CoV-2 infection, were hospitalized for COVID-19 disease, and were fully vaccinated against SARS-CoV-2 (Supplementary Table 1). PASC symptoms included shortness of breath, chest pain, joint pain, brain fog, and depression. As a comparator, an age-matched participant naïve to SARS-CoV-2 infection (Control) was selected and confirmed negative via a SARS-CoV-2 nucleocapsid antibody test (Supplementary Table 1). Live CD45+ cells from two PPASC patients and this SARS-CoV-2 naïve individual were subjected to scRNAseq analysis utilizing the 10X Genomics Chromium system which yielded an integrated object of 34,139 cells after QC.
We integrated our scRNA-seq data with a naïve participant from a public scRNA-seq dataset (GSM4509024) (61) to compare the transcriptome of PPASC (n=2) and controls (n=2). Each of the four independent scRNA-seq samples was subjected to uniform manifold approximation and projection (UMAP) based on RNA expression (Figure 1A). A total of 11 cell types were identified, including CD4+/CD8+ T cells, natural killer (NK) and natural killer T (NKT) cells, CD14+ and CD16+ monocytes, dendritic cells, platelets, hematopoietic stem cells (HSC), B cells, and erythrocytes (Figure 1A). Canonical marker genes of known cell types were enriched in each cluster and the marker expressions were used to annotate the clusters (Figure 1B). All identified immune cell populations were present in both SARS-CoV-2-infected and naïve participants (Supplementary Figure 5), albeit in differing proportions between PPASC and controls (Figure 1C). We further attempted to determine a vital feature for reflecting immune cell alterations associated with PPASC via the relative proportions of peripheral immune cells. We observed significant increases in myeloid cells (CD14+/CD16+ monocytes and dendritic cells), and NKT cells and B cells, whereas the proportions of NK cells, HSC, and erythrocytes were significantly decreased in PPASC compared to controls (Figure 1D).
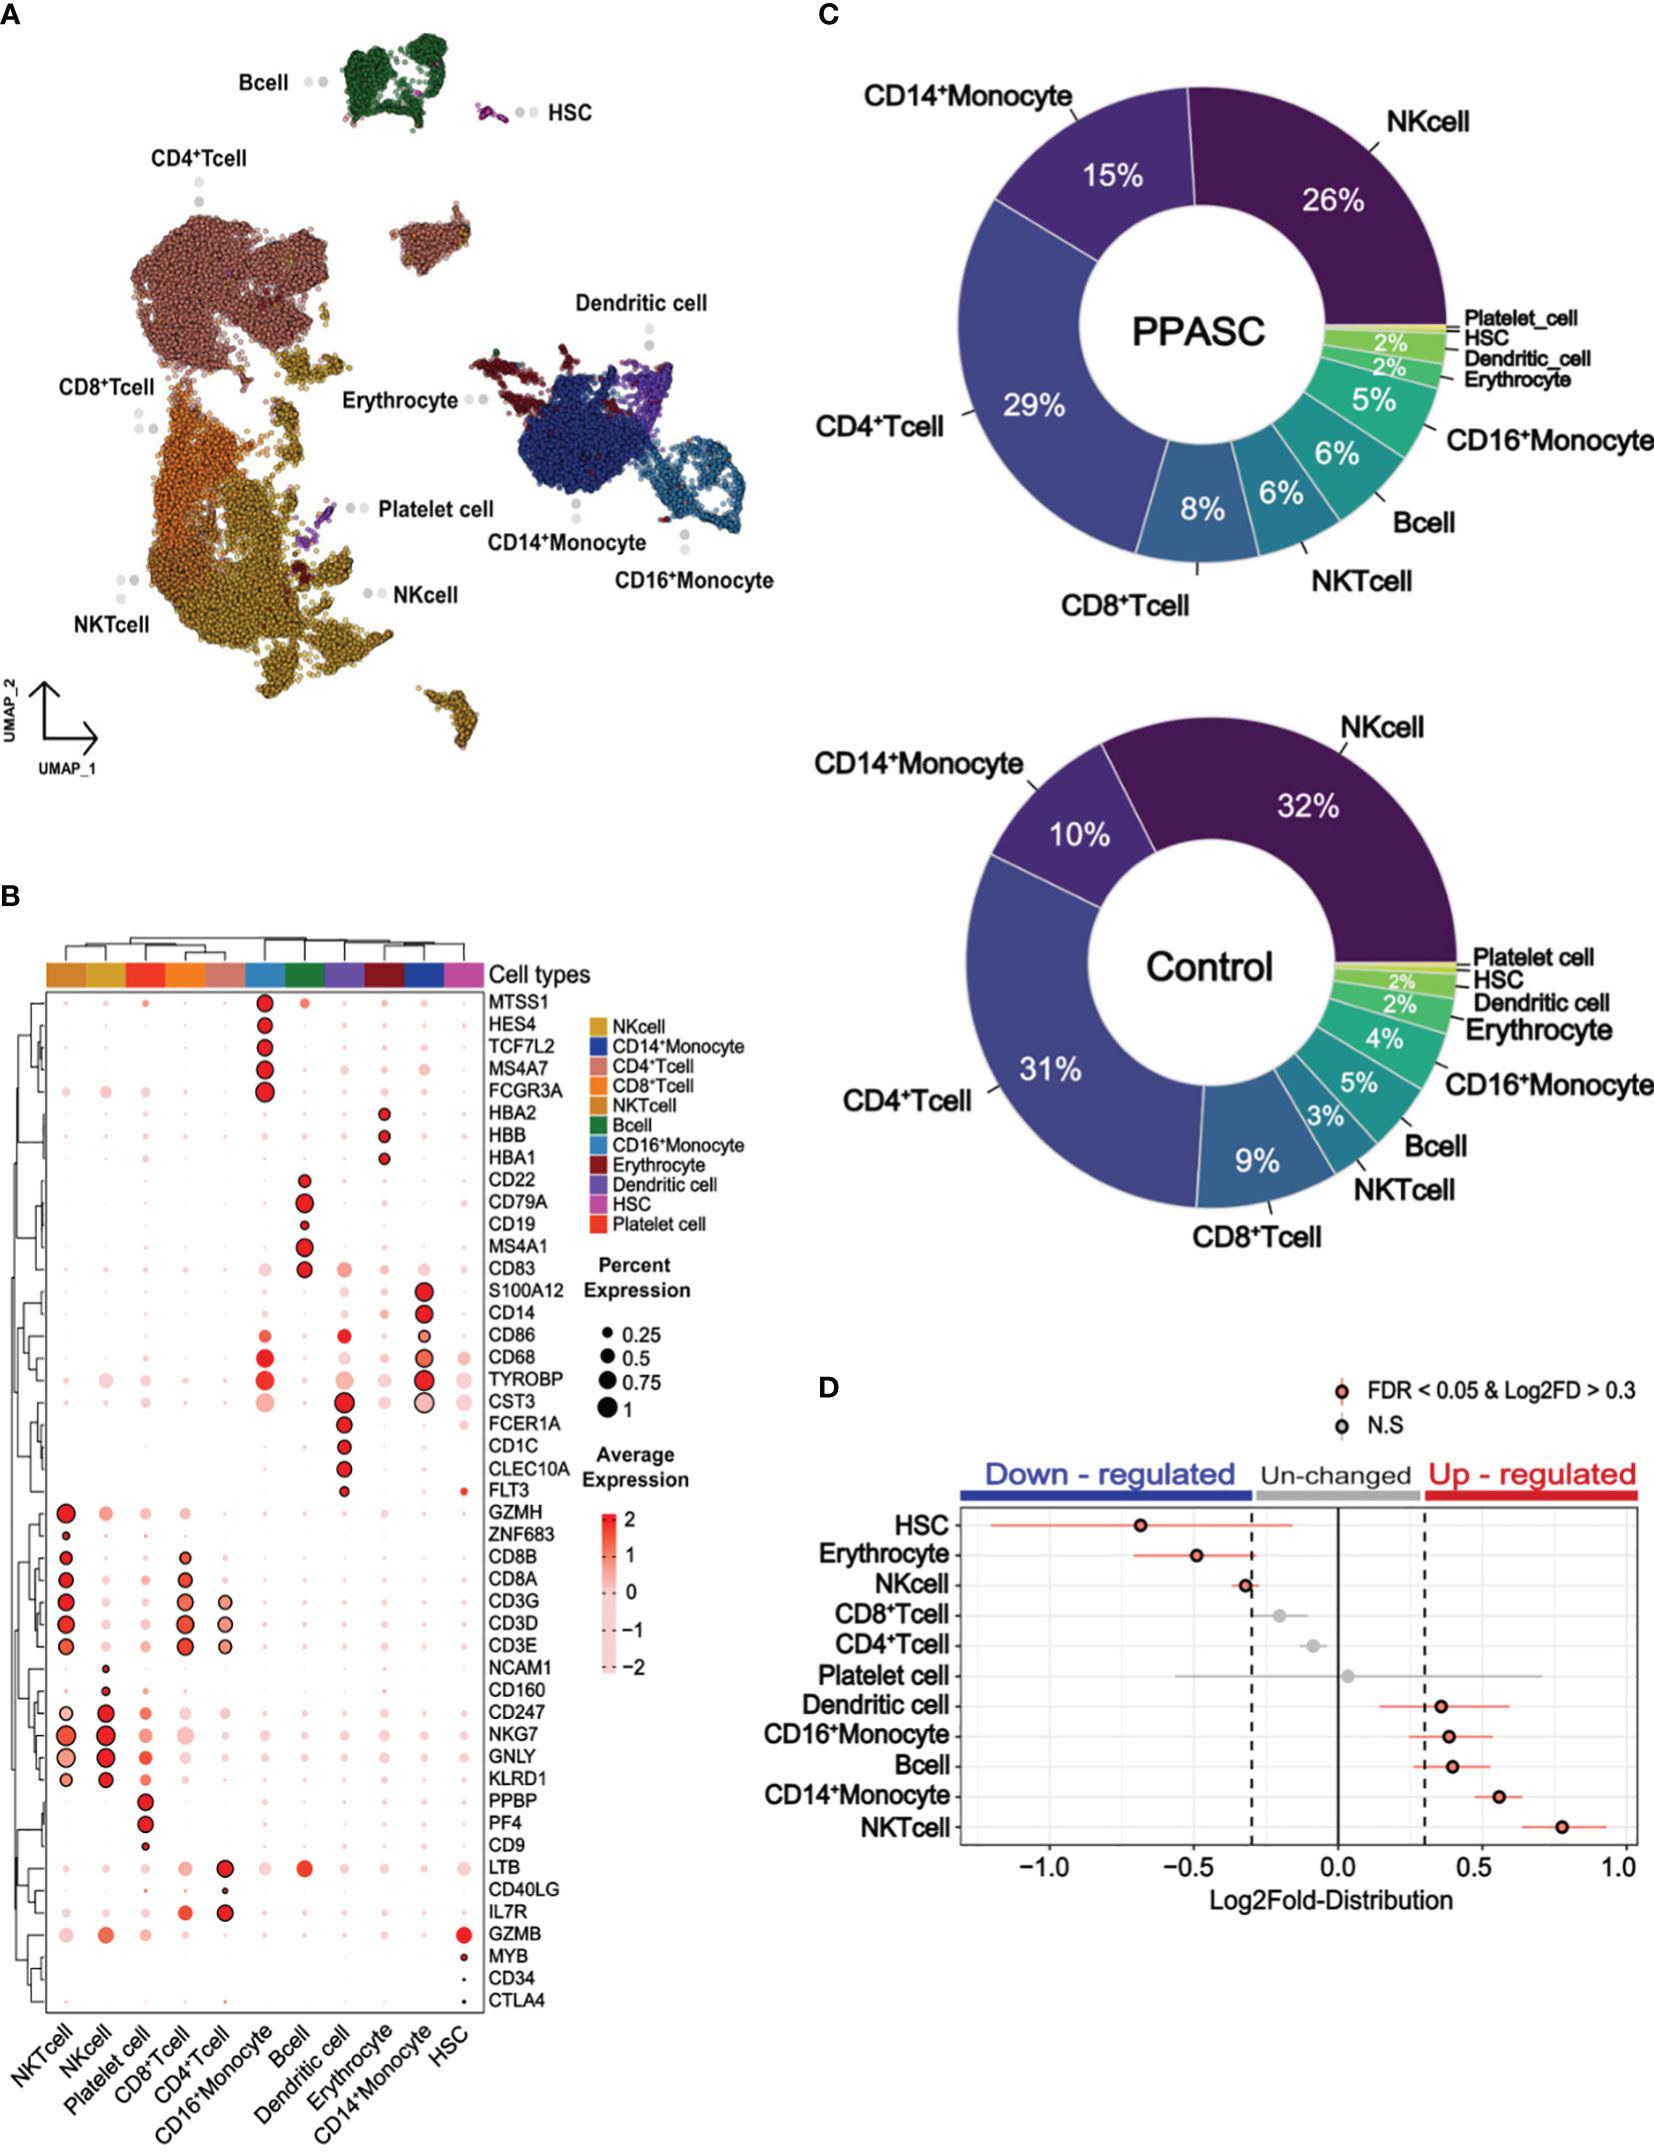
Figure 1 Cell type profile and differential cell type proportion analysis of PPASC and control participants. (A) scRNA data obtained from PBMCs with a total of 34,319 integrated cells within PPASC (n=2) and controls (n=2). The uniform manifold approximation and projection (UMAP) presentation of all merged samples and 11 cell types were clustered by gene signature. Each dot corresponds to a single cell and is colored according to cell type. (B) The annotation of clusters in the UMAP plot utilizing the expression of canonical marker genes from the Cell Marker Database 2.0. Dot plots present the average expression levels and the percentage of cells expressing each marker gene within the labeled cell types. The rows in the dot plots correspond to selected marker genes highly expressed in each cell cluster. (C) Cell type proportions for each cell type were manually calculated from samples of PPASC (n=2) and control (n=2) groups. The results were visualized through pie charts. (D) To detect statistical differences in cell proportions, a permutation test and bootstrapping approach were employed to compare the proportions of each cell type between the PPASC (n=2) and control (n=2) groups. The dot plot illustrates statistically significant relative differences in cell proportions, presenting the distribution of Log2FD in PPASC compared to controls.
To explore the characteristics of immune cells and identify the molecular changes associated with PPASC, we performed a detailed analysis of the DEGs of immune cells from PPASC compared with those from the controls. Our scRNA-seq analysis identified pronounced alterations in myeloid cells. Furthermore, we found that elevated circulating monocyte levels and their activation were observed in COVID-19 convalescents (76). Thus, we focused our attention on myeloid cells, particularly CD14+ and CD16+ monocytes, as well as dendritic cells, for downstream analysis hereafter referred to as myeloid-lineage cells (MLCs). We found a total of 872 DEGs in monocytes and dendritic cells: CD14+ monocytes (228 upregulated and 132 downregulated), CD16+ monocytes (303 upregulated and 226 downregulated), and dendritic cells (332 upregulated and 217 downregulated) (Supplementary Figures 6A, B). In addition, we demonstrated shared DEGs across three cell types (118 upregulated and 54 downregulated) (Supplementary Figures 6A, B). Interestingly, our data showed that genes known to be associated with pulmonary fibrosis (ANKRD11, CTNNB1, CXCR4, HIF1A, HMGB1, ITSN2, LITAF, NEAT1, VEGFA, and DSE) (77–84) were upregulated in MLCs. However, genes associated with glycolytic metabolism (ALDOA, PGK1, TPI1, and MYL6) were downregulated in these cell populations (Figures 2A, B).
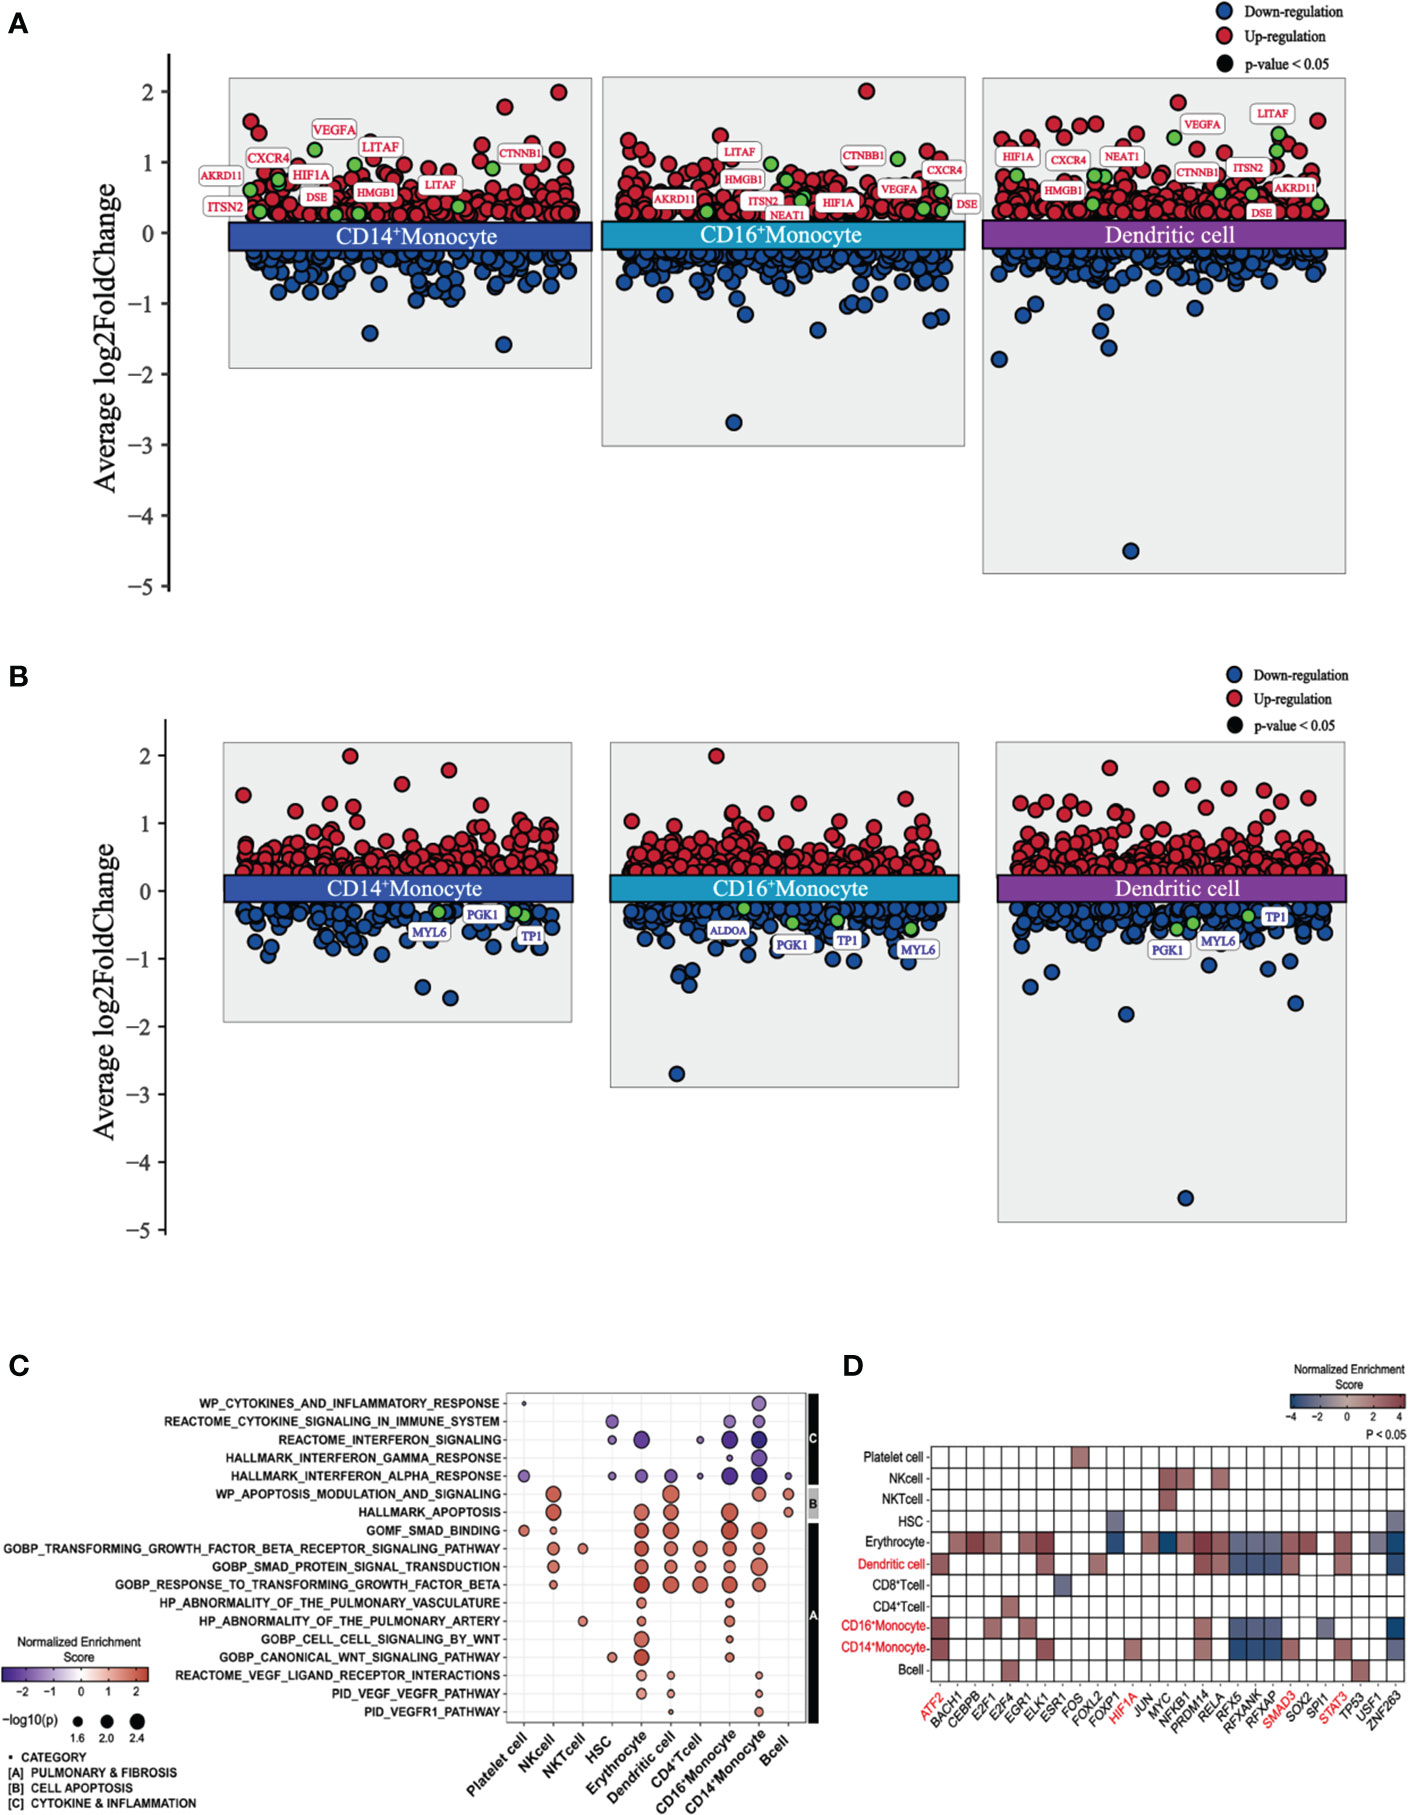
Figure 2 Differential gene expression, pathway enrichment, and transcription factor enrichment analysis of PPASC compared to controls. (A) Differentially expressed and upregulated genes with selective labeling of fibrosis-related genes in CD14+ and CD16+ monocytes and dendritic cell populations in PPASC (n=2) compared to controls (n=2), visualized as scatter plots. (B) Differentially expressed and downregulated genes with glycolysis-related genes in CD14+ and CD16+ monocytes and dendritic cell populations in PPASC compared to controls, visualized as scatter plots. Statistically significant up-regulated genes are illustrated with red dots and statistically significant down-regulated genes are illustrated with blue dots for both (A, B). (C) Comparative analysis of functional pathways between PPASC and control groups. Gene set enriched pathways in PPASC compared to controls across all immune cell types visualized by dot plot and grouped by selective pathway category. Up-regulated pathways are represented by red dots and down-regulated pathways by blue dots (D) Inferred differentially enriched transcription factors in PPASC compared to control groups across all cell types based on DoRothEA’s target genes database, visualized as a heatmap (Red; up-regulation, Blue; down-regulation). Transcription factors related to fibrosis that were found consistently enriched in MLCs are highlighted in red.
Next, we performed gene set enrichment analysis (GSEA) across each cell type and conducted direct comparisons of the PPASC versus the control groups, respectively. Overall, compared to controls, PPASC displayed upregulated pathways related to pulmonary fibrosis, such as VEGF, WNT, and TGF-β and cell apoptosis, while pathways related to cytokine/inflammation (including interferon) were downregulated in MLCs (Figure 2C). The VEGF pathway was upregulated in CD14+ monocytes and dendritic cells, while the WNT pathway was upregulated only in CD16+ monocytes (Figure 2C).
To identify potential direct targets involved in the induction of profibrotic features in myeloid cells, we performed transcription factor enrichment analysis (TFEA) to identify transcription factors inferred from the perturbation of gene signatures between PPASC and controls. We found that a total of 27 transcription factors were significantly dysregulated in individual cell types between groups (Figure 2D). Consistent with earlier analyses, we found that the downstream transcription factors of VEGFR (HIF1A; CD14+ monocytes) and TGFBR (SMAD and STAT3; CD14+ monocytes and dendritic cells, ATF2; CD14+/CD16+ monocytes and dendritic cells) signaling were upregulated in MLCs (Figure 2D). These observations demonstrate that PPASC display enriched genes driving pulmonary symptoms and profibrotic features in MLCs and that increased MLC proportions and the altered gene signatures likely contribute to development of pulmonary sequelae after SARS-CoV-2 infection.
We were intrigued as to how our findings in PPASC patients, who had recovered from acute COVID-19 disease and suffered ongoing symptoms, compared with patients who suffered severe COVID-19. We integrated a publicly available scRNA-seq dataset from severe COVID-19 patients, hereafter referred to as severe COVID-19 (n=4) (Supplementary Figures 7A-F) and observed 10 of the previously identified cell types via UMAP visualization of the combined dataset; however, HSCs were unidentifiable (Supplementary Figures 8A, B). The cell proportion makeup differed drastically between PPASC and severe COVID-19, with CD16+ monocytes and dendritic cells found to be significantly increased and CD14+ monocytes significantly decreased in PPASC compared to severe COVID-19 (Supplementary Figures 8C, D). MLCs demonstrated an up-regulation of fibrosis-associated genes, such as VEGFA and HIF1A in PPASC compared to severe COVID-19 (Supplementary Figure 9A). However, genes involved in glycolytic metabolism were not found to be downregulated in PPASC, compared to severe COVID-19 (Supplementary Figure 9B). Pulmonary fibrosis-related pathways and cell apoptosis and stress-related pathways were found to be upregulated in PPASC compared to severe MLCs (Supplementary Figure 9C). Immune response pathways were found to be downregulated in CD14+ monocytes but not in CD16+ monocytes or dendritic cells in PPASC compared to severe COVID-19 (Supplementary Figure 9C). TF enrichment analysis revealed upregulation of fibrotic-associated ATF2, STAT3, and SMAD family TFs across MLCs in PPASC compared to severe COVID-19. STAT3 was specifically upregulated in CD16+ monocytes, while ATF2 was upregulated in CD14+ monocytes (Supplementary Figure 9D). DEGs in MLCs of PPASC compared to the severe COVID-19 demonstrated a larger overlapping proportion of up-regulated genes (Supplementary Figure 10A). Few overlapping downregulated DEGs were noted in MLC populations (Supplementary Figure 10B) and were not inclusive of glycolytic genes as found in PPASC vs control MLCs (Data not shown). Specifically, via analysis of cell-to-cell interactions in MLCs, we found that VEGF-VEGFR interaction was only found in PPASC but not in severe COVID-19 (Supplementary Figure 11A). VEGFA and its ligand expression was minimal in CD14+ and CD16+ monocytes in the severe COVID-19 but was over 40% in dendritic cells (Supplementary Figure 11B). Pseudo-bulk DEG revealed no differential expression of VEGF in CD16+ monocytes but confirmed up-regulation of VEGF in CD14+ monocytes and dendritic cells in PPASC (Supplementary Figure 11C). These data suggest that VEGF expression patterns in MLCs clearly distinguished PPASC from severe COVID-19.
To gain a comprehensive view of how the inferred targets may interact regarding PPASC development, we then identified potential cell–cell interactions and differential ligand-receptor interactions that are conserved in PPASC. The pathway of VEGF interaction (VEGFA-FLT1/KDR) was increased among MLCs, compared to controls (Figure 3A). We observed high-fidelity communications via VEGF pathways in MLCs via an autocrine or paracrine manner (Figure 3A). Furthermore, using pseudo-bulk single-cell data, we validated the expression of genes identified from ligand-receptor interaction analysis. VEGFA percent expression was increased in MLCs from PPASC compared to those cells from controls (Figure 3B). Notably, VEGFA was highly expressed in CD14+ and CD16+ monocytes, as well as dendritic cells (Figures 3B, C).
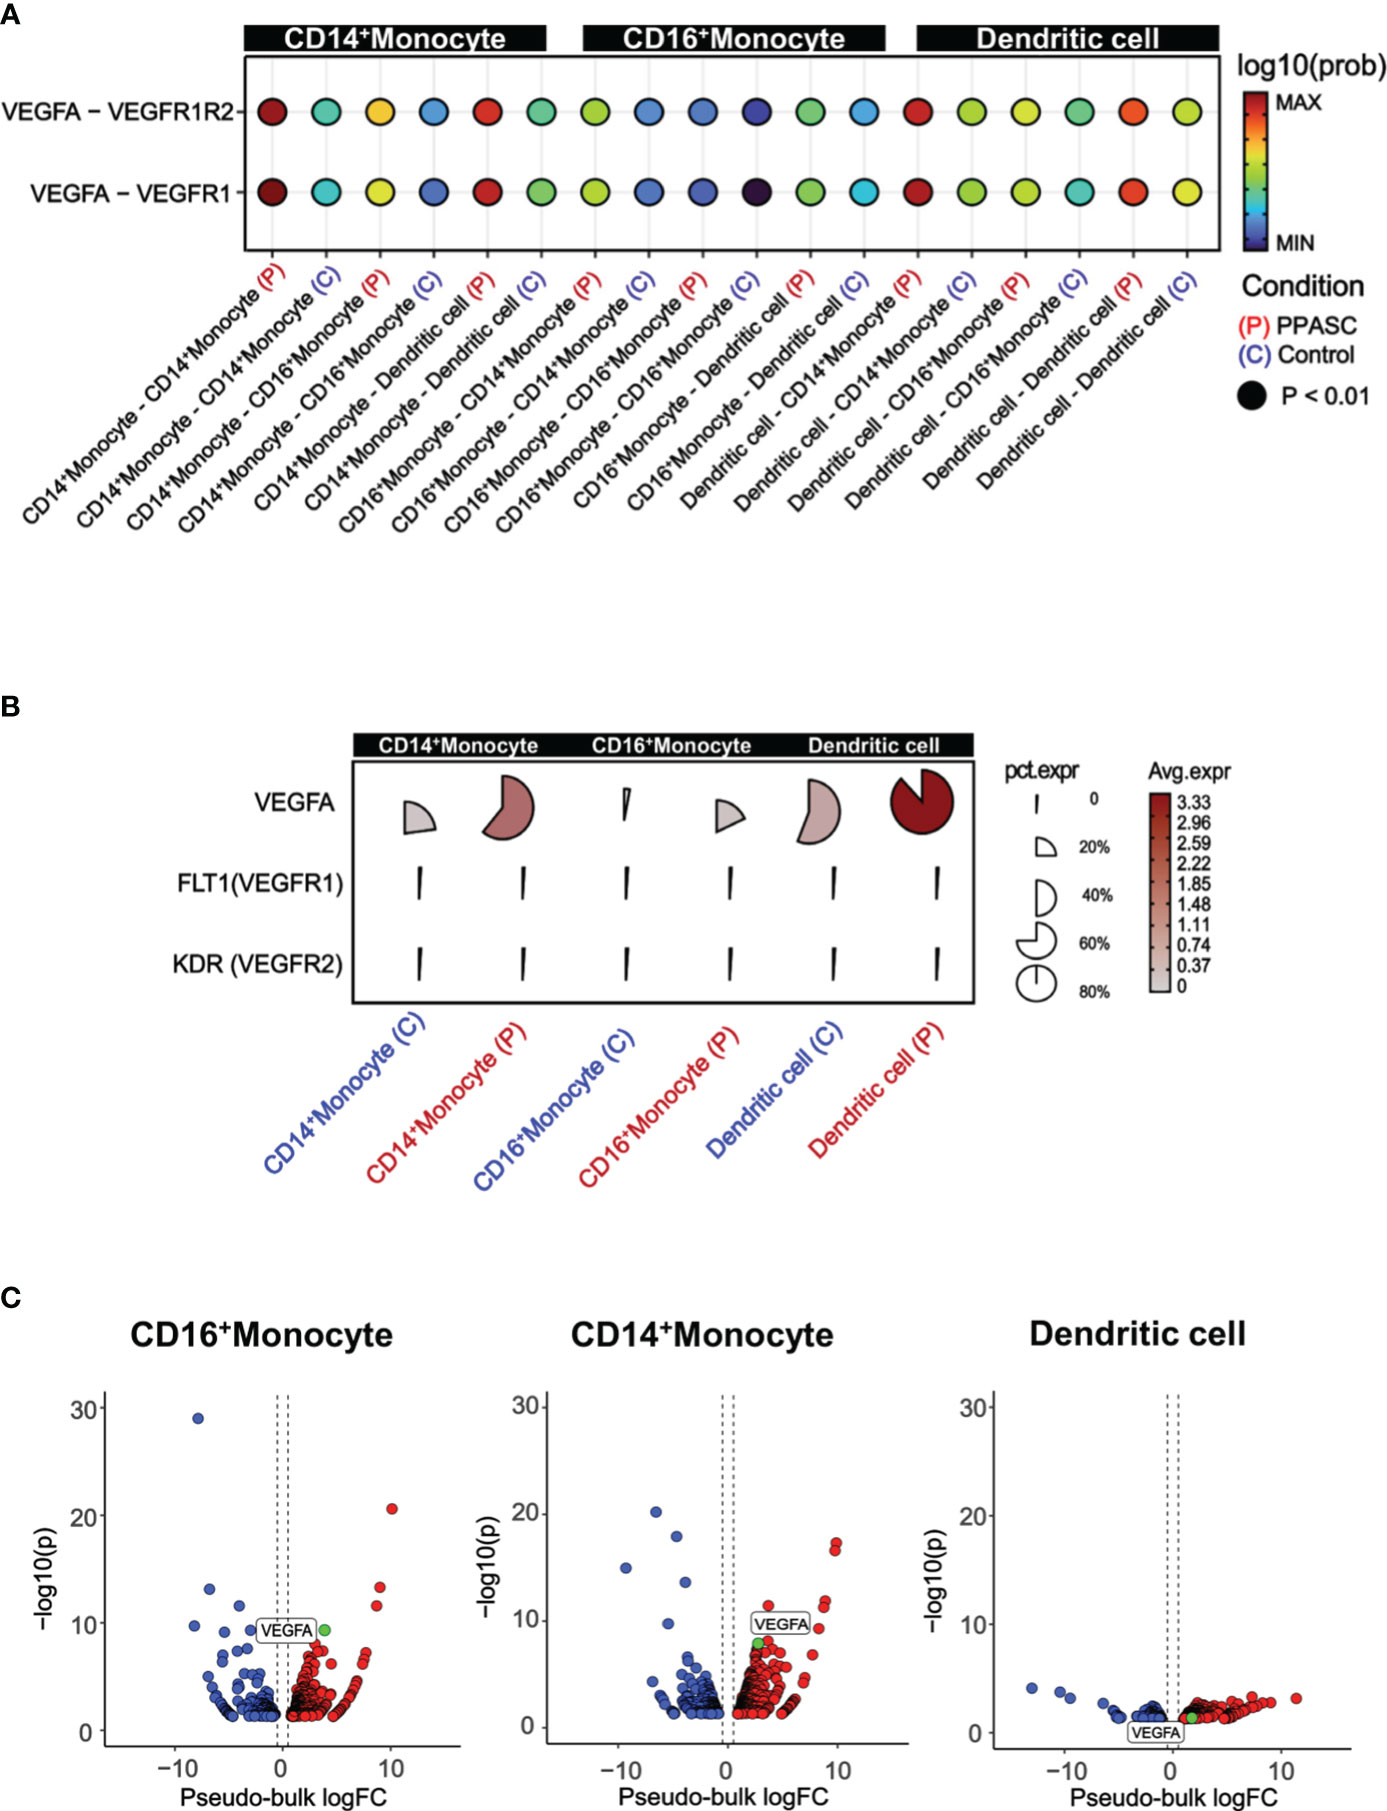
Figure 3 VEGF signaling, cell to cell interactions, and pathway enrichment analysis in PPASC compared to controls. (A) Geometric expression in cell-cell ligand-receptor interactions and VEGF signaling interactions were calculated between CD14+ and CD16+ monocytes and dendritic cells in PPASC (n=2) and control (n=2) groups. Statistically significant and comparable cell-cell interaction geometric expressions are shown on the x-axis, with ‘P’ and ‘C’ denoting the PPASC and control groups, respectively. (B) Single-cell details include average and percent expression of VEGF ligand-receptor genes in CD14+ and CD16+ monocytes and dendritic cells in PPASC and control groups. A high expression is denoted by red, and proximity to a circular form signifies a high percent expression in the cell type cluster. (C) For validation, aggregated single-cell expression data were processed as pseudo-bulk, and differentially expressed tests were conducted on VEGF ligand genes in CD14+ and CD16+ monocytes and dendritic cells in PPASC compared to control groups (Red; up-regulation, Blue; down-regulation).
Within the monocyte clusters (CD14+ and CD16+ monocytes), we further sub-grouped the signatures into gene correlation based on network modules (Figure 4A). Within CD14+ monocyte populations, network module 5 (Net-M5) was specifically found to be upregulated, while CD16+ monocyte demonstrated an upregulation of network module 4 (Net-M4) (Figure 4B). To identify the organizing hub genes in Net-M4 and M5, the top 60 genes with high eigengene-based connectivity (kME) values were selected (Supplementary Figure 12). In the Net-M4, genes involved in VEGFA-VEGFR2 signaling (NR4A1, TPM3, FAM120A, and NUMB) and WNT signaling (HHEX and APC) were identified. The Net-M5 detected genes involved in lung fibrosis (CXCL8 and IL1B), VEGFA-VEGFR2 signaling (NR4A1 and CBL), and TGF-β signaling (JUNB and ATF3) (Supplementary Figure 7). Furthermore, the pathway enrichment analysis of Net-M4 and Net-M5 revealed that the CD16+ M4 module was associated with WNT, VEGF, and TGF-β-signaling pathways (Figure 4C). The CD14+ M5 module was associated with COVID-19 adverse outcome linked pathways as well as fibroblast growth factor stimulation pathways. Interestingly, this same module in CD14+ monocytes revealed increases in pathways for fibroblast-specific apoptosis and general apoptotic pathways (Figure 4C).
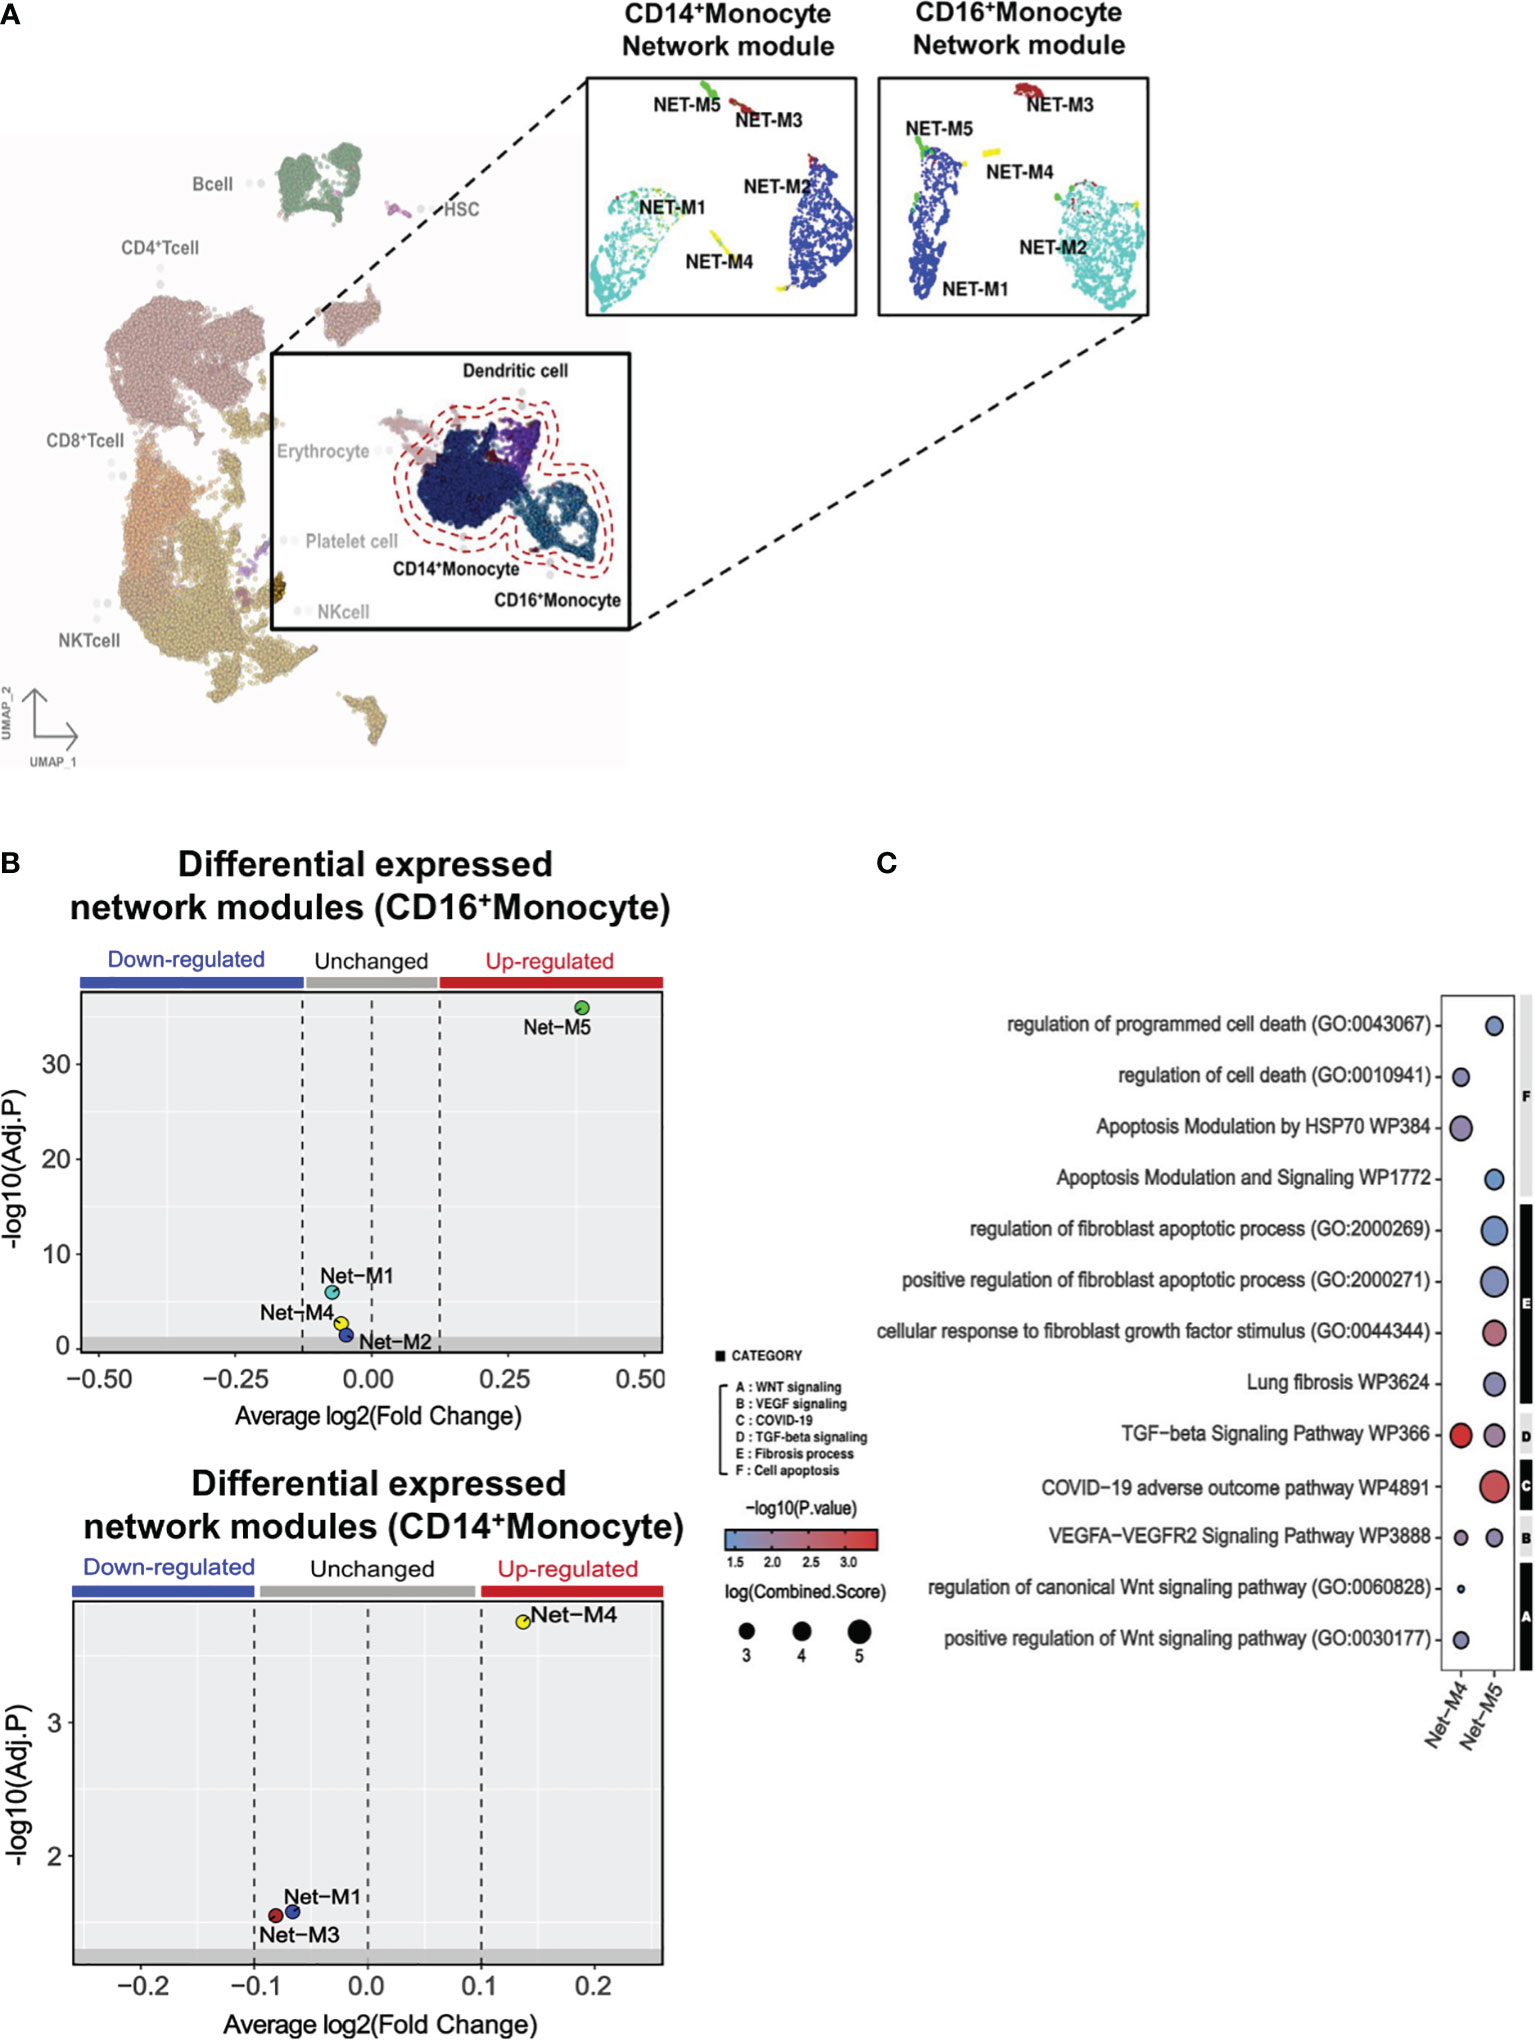
Figure 4 Monocyte gene modules in PPASC group suggest a pro-fibrotic skewing in CD14+ monocytes. (A) Gene correlation networks were constructed for CD14+ and CD16+ monocytes in PPASC (n=2) and control (n=2) groups. Cells were clustered into network modules using the UMAP clustering dimension reduction method in each correlation network. Each network module was formatted into five clusters. (B) Differential expression tests were performed using the Wilcoxon statistical framework in each network module for CD14+ and CD16+ monocytes in the PPASC and control groups. (C) Enriched pathway tests were conducted in the differentially expressed network modules 4 and 5. The results were visualized as dot plots, with selective pathway categories highlighted as functionally enriched pathways. Red dots signify up-regulation and blue dots signify down-regulation, with the size of the dot demonstrating the log fold change of the combined score.
Reports of the metabolic impacts of SARS-CoV-2 infection and association with chronic fatigue and diabetic-like events during Long-COVID are well documented (85). These observations aligned with our findings of downregulated genes associated with glycolytic metabolism (Figure 2B) and prompted us to determine the impact of PASC on immunometabolism in individuals with persistent pulmonary sequelae. Using Gene Set Variation Analysis (GSVA) based on non-parametric unsupervised learning to infer the variability of gene set enrichment related to gluconeogenesis/glycolysis, we observed that the average score of glycolysis-related pathways in MLC populations was lower in PPASC than in controls (Figure 5A). The inferred metabolic state of individual cells using a database of integrated metabolic networks and metabolic flux balance analysis demonstrated that MLCs of PPASC exhibited downregulation of gluconeogenesis/glycolysis metabolic reactions compared to the control group (Figure 5B). Furthermore, inference of intercellular metabolite communication based on estimated metabolite scores and averaged sensor gene expression values by cell group demonstrated that the metabolite, D-Glucose, was directly associated with gluconeogenesis/glycolysis metabolism. Furthermore, these inferred interaction scores revealed decreased mean abundance values in MLCs of PPASC compared to the control group (Figure 5C). The calculated communication scores for metabolite-sensor partners revealed statistically significant interaction scores in MLCs of the control group but not in PPASC (Figure 5D). This suggests a lack of gluconeogenesis/glycolysis-related metabolite interaction or a diminished interaction in PPASC. In summary, these metabolic analysis observations suggest a decreased regulation of glucose-specific metabolic pathways in MLCs of PPASC.
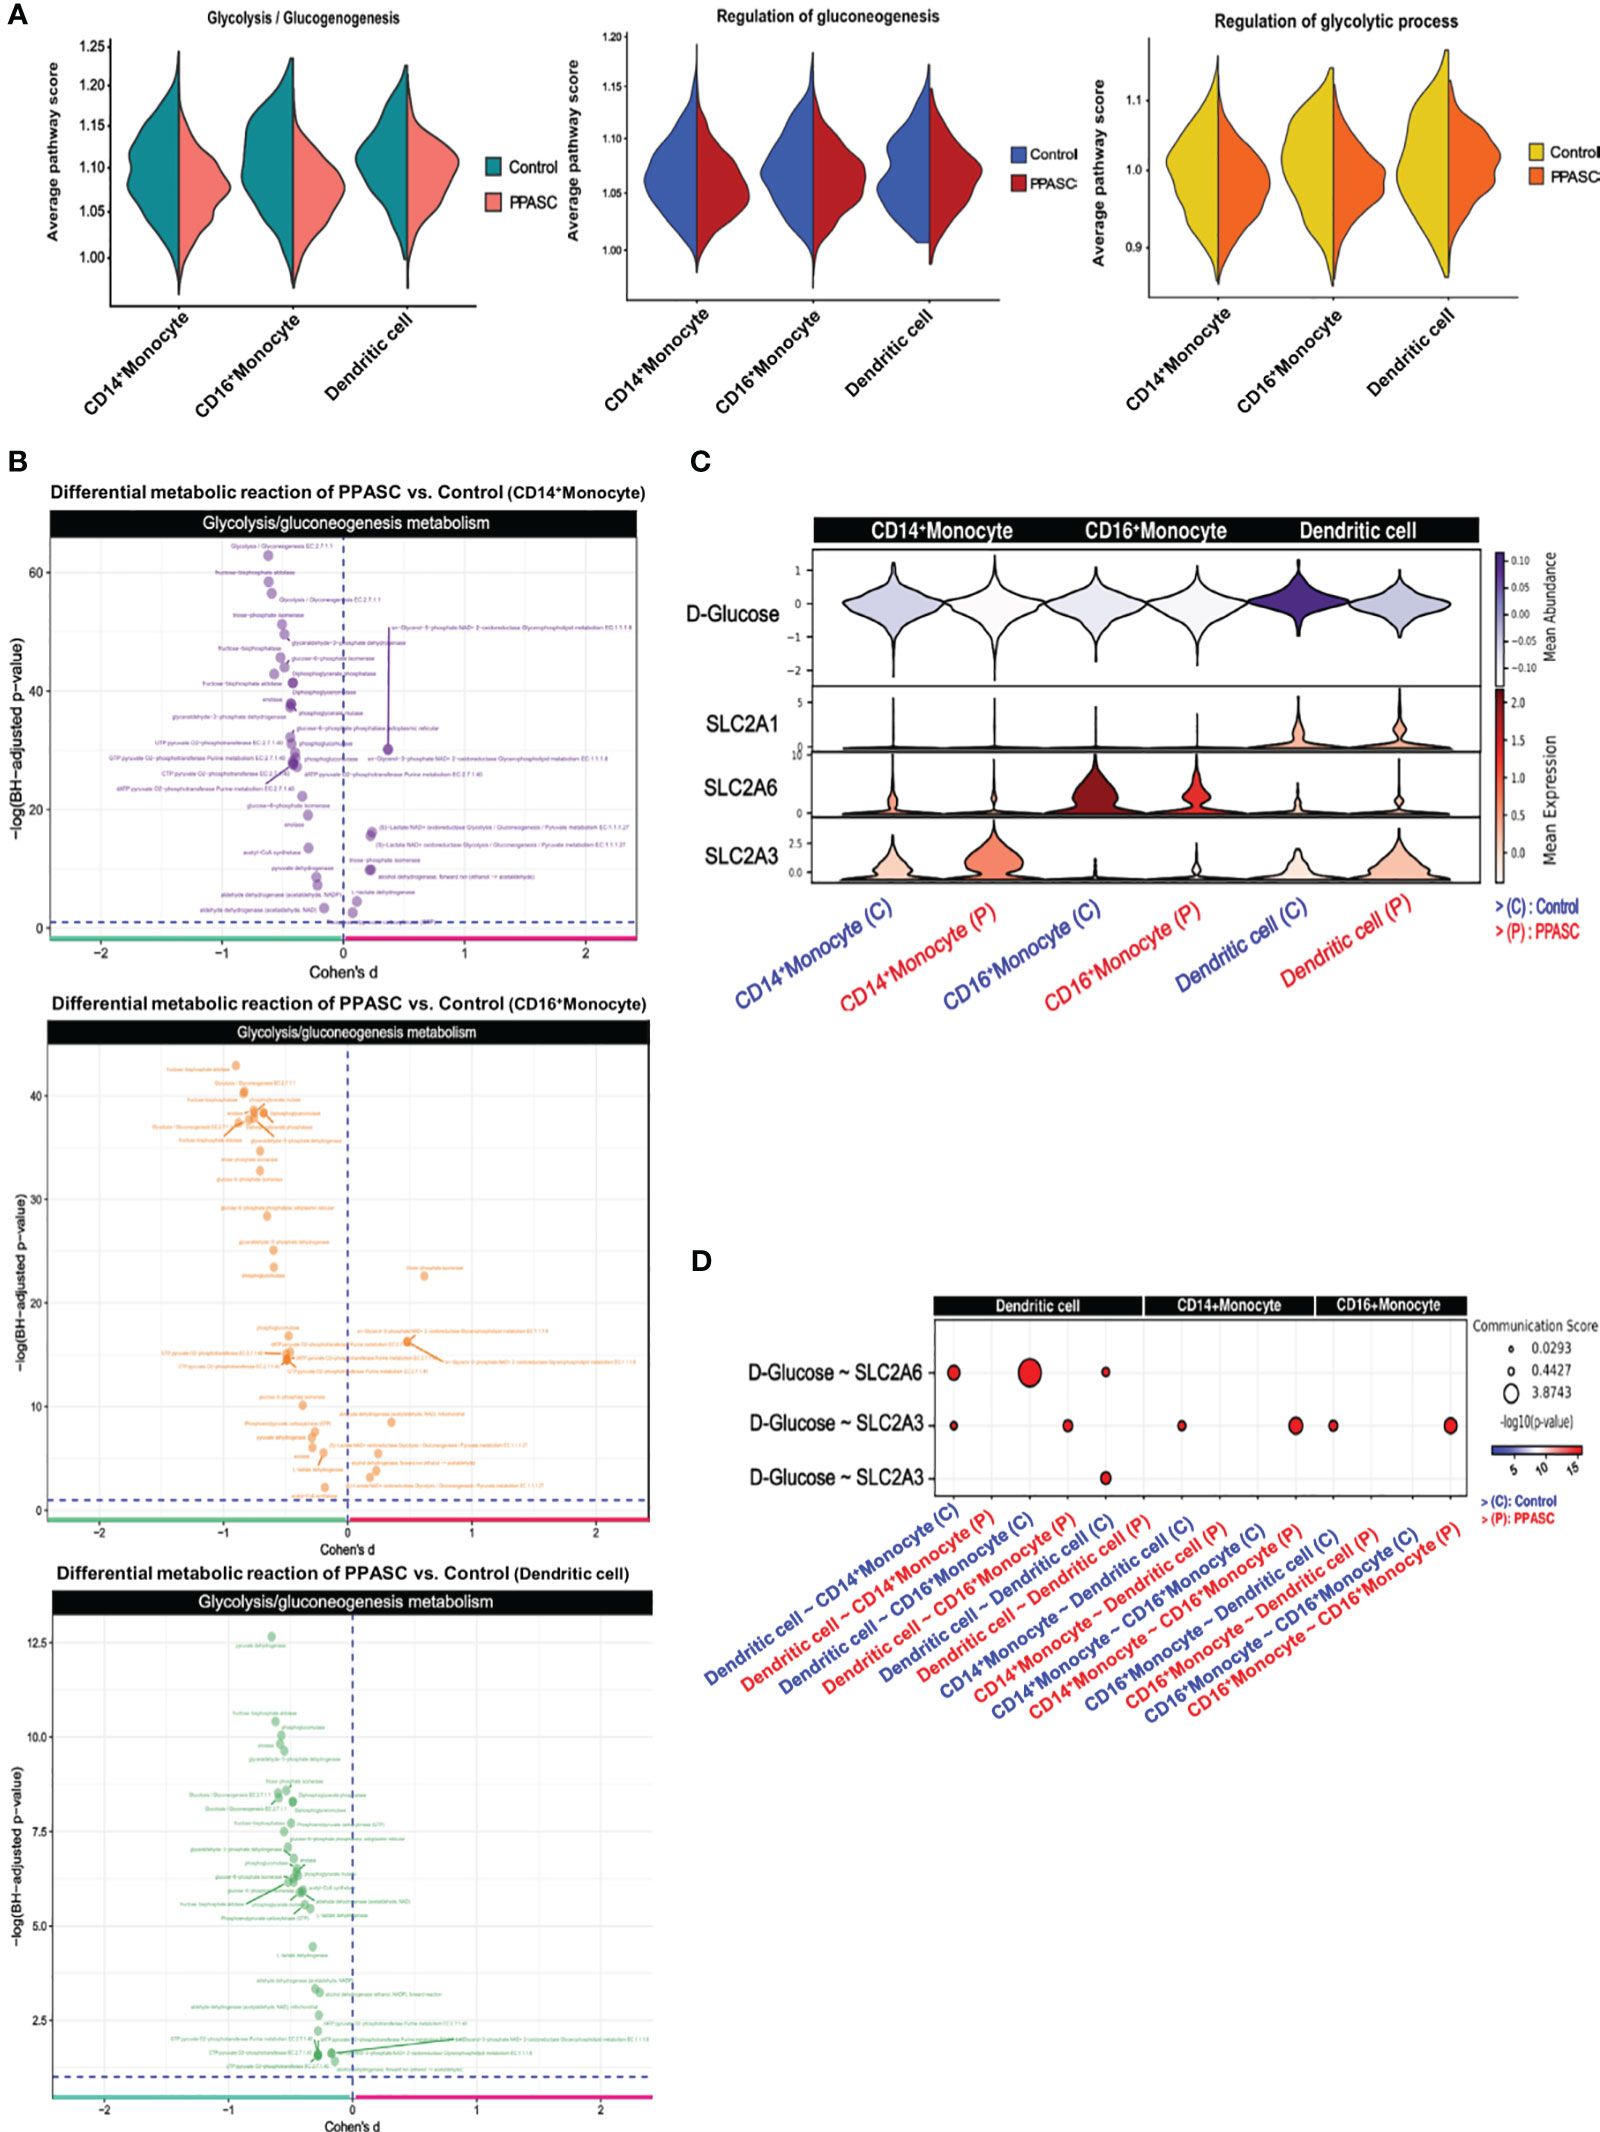
Figure 5 Metabolomic gene signatures in MLCs in Two PPASC individuals. (A) Gene set variation analysis (GSVA) was conducted using pathway signature gene sets to score average pathway scores in each cell. Glycolysis-related pathways were selectively examined in CD14+ and CD16+ monocytes and dendritic cells in PPASC (n=2) compared to control (n=2) groups. The results were split for each group and visualized as violin plots. (B) Measurement of differential metabolic reactions in glycolysis was performed using Cohen’s D statistical framework in CD14+ and CD16+ monocytes and dendritic cells. The results are visualized as a volcano plot with each dot representing a reaction in glycolysis metabolism. (C) Expression and abundance in glycolysis metabolite interaction were measured and visualized as a violin plot, depicting metabolite abundance and sensor gene expression between MLCs. (D) Inferred cell-to-cell glycolysis metabolite interactions in MLCs were scored and each communication between cells was visualized as a dot plot.
Long-term perturbation of immune regulation and altered cytokine networks have been identified in COVID-19 convalescents and individuals with PASC tended to show more dysregulation of the immune system (34, 56). This evidence supports the hypothesis that an altered immune system after recovery against SARS-CoV-2 infection contributes to the development of PASC. While the epidemiological and clinical studies of pulmonary sequelae among PASC individuals are relatively advanced, mechanistic insights into the pathophysiological underpinnings of this condition are still limited. In this study, we performed scRNA-seq of the PBMCs from two PPASC patients and a naïve control with the inclusion of an integrated analysis with a published scRNA-seq control dataset (61). We revealed that the enrichment of myeloid-specific cellular subsets, CD14+ and CD16+ monocytes, and dendritic cells had increased profibrotic signatures in PPASC. We further explored cellular metabolism by analyzing metabolic reactions, metabolic pathway scoring, and cell-cell metabolite interactions from scRNA-seq data. We also compared the scRNA-seq data from our PPASC patients to a publicly available scRNA-seq dataset from PBMC obtained from patients who experienced severe COVID-19. To the best of our knowledge, this case study provides the first evidence for metabolic alterations in MLCs with a skewing toward decreases in gene expression of glycolysis and glucose utilization in PASC individuals with persistent pulmonary symptoms.
We recently reported persisting elevation of circulating monocytes in COVID-19 convalescents and cell activation was negatively correlated with lung function in individuals with PPASC (76). Consistent with this finding, our scRNA-seq data demonstrate continued dysregulation of the peripheral immune system, particularly MLCs, months after acute infection. Ryan et al. reported alterations of the blood transcriptome at 12-, 16-, and 24 weeks post-infection with SARS-CoV-2 when compared to naïve controls (56). Indeed, transcriptional dysregulation persisted in individuals with PASC compared to those who had completely recovered, until at least 24 weeks. Immunophenotyping results of PBMC demonstrated that specific subsets of CXCR3+ monocytes were increased in COVID-19 convalescents, but total monocytes were comparable between groups (56). None of the participants who were referred to the long-COVID clinic underwent PFTs nor were they classified as pulmonary long-COVID. The heterogeneity in PASC symptoms mirrors the existence of different pathological subgroups, suggesting that increased monocytic populations observed within our study may be in relation to pulmonary-specific immunopathology. In addition, PASC individuals with persistent pulmonary sequelae may have a selective immunological response that differs from the immunological response generated for other sequelae. Thus, more studies are essential for a better understanding of the pathophysiologic mechanisms underlying diverse spectrums of PASC symptoms.
An evolving body of evidence demonstrates heightened levels of plasma monocyte/macrophage‐related markers associated with proinflammation and fibrosis in COVID-19 convalescents (86). In concordance with our observed upregulation of gene expression related to pulmonary symptoms/fibrosis, these cell types could engage in sustaining the fibrotic process that may fuel pulmonary sequelae. Findings of fibrosing phenotypes in the lungs of post-COVID-19 patients have been demonstrated via histopathologic analysis (86). Examination of the lungs after 7 days of hospitalization revealed an increase in VEGFA and fibrotic pathology akin to organizing pneumonia (87). Interestingly, we observed upregulation of VEGF specifically in MLCs in PPASC compared to controls, but the patterns of up-regulation of VEGFA were more obvious when compared with severe COVID-19. CD14+ monocytes are known to differentiate into pro-fibrotic, fibroblast-like cells known as fibrocytes (88). Fibrocytes are known to migrate via CXCR4-CXCL12-mediated activity during fibrotic remodeling (89), and we found that this receptor was significantly upregulated in CD14+ monocyte populations in PPASC but not in severe COVID-19. TGF-β-signaling pathways are canonically known to skew and activate these CD14+-differentiated cells, and upregulation of TGF-β was also observed in MLCs from PPASC. As both TGF-β and VEGF have been touted as targets to inhibit lung fibrotic development and fibrotic processes systemically (90, 91), our findings suggest that circulating CD14+ cells from PPASC preferentially acquire profibrotic features.
Interestingly, we also found that CD16+ gene module interaction networks showed interactions with antigen-presentation genes. Antigen presentation on different monocyte subsets is well documented, with CD16+ intermediate and non-classical monocytes being the most prominent antigen presentation-capable monocytes (92). In line with their findings, CD16+ monocytes were found to increase their expression of MHC molecules, further promoted by stimulation of Th1 skewing cytokines. We did not observe upregulation of any Th1 or Th2 skewing cytokines, suggesting that this process is contributing toward our observed upregulation of MHC-2 molecules.
A recent study of plasma metabolomic profiles revealed dysregulation of metabolites with the enrichment of pathways for fatty acid metabolism and TCA cycles and high levels of fatty acid metabolites (93). Advances in the field of immunometabolism have demonstrated strong associations of specific metabolic pathways with cellular phenotype. In addition, the metabolic and metabolite level of investigation within a cell is considered the most accurate thermometer for cellular function as no processing or degradation (RNA/protein) is yet to occur. Although common residual symptoms of their study cohort were fatigue and brain fog, we observed similar trends of cellular metabolic alteration, displaying the downregulation of gluconeogenesis/glycolysis pathways in MLCs. Furthermore, in the CD16+ M4 module genes, suggesting a non-glycolysis-related metabolic signature, like ACSL4, a long-chain fatty acid ligase utilized for fatty acid beta-oxidation as well as OSBPL8, an oxysterol-binding protein for intracellular lipid transport, were identified. These results suggest that the downregulation of gluconeogenesis/glycolysis pathways appeared to be associated with a compensatory upregulation of genes associated with fatty acid oxidation and amino acid-based metabolism. However, we did not observe any DEGs related to metabolism between our PPASC and the severe COVID-19 groups. Future in-depth experimental work is required to understand whether metabolic reprogramming of monocytes after SARS-CoV-2 infection favors them to use fatty acid metabolism. Interestingly, the mean abundance of ATP was relatively comparable between MLCs in both PPASC and controls, suggesting that alternative metabolic pathways are pivotally compensatory in MLCs from PPASC, given the similar ATP production across the cell types.
A comprehensive review of PASC, particularly chronic fatigue syndrome, corroborates many of the findings observed from metabolic analyses of scRNA-seq in our study (27). Rewiring of cellular metabolism is directly linked to cellular function. Within monocyte populations, upregulation of glycolysis and glucose usage correlates with activation and differentiation toward an M1, i.e., pro-inflammatory monocyte/macrophage phenotype and functionality (94). This phenotype is defined by its pro-inflammatory cytokine production, such as IFN-γ, and stimulation, while M2 relates to an anti-inflammatory and regulatory role (95). The use of fatty acid pathways and decreased glycolytic reliance suggests pro-resolution (M2)-like phenotype and functionality within these monocytes. In the future, it will be necessary to elucidate the role of monocyte immunometabolism in the context of PPASC and whether metabolic dysfunction is a predisposing risk factor for PPASC.
Our study was limited by a small sample size. One of our control participants was from a matched, publicly available single-cell sequencing dataset. The comparator scRNA-seq data were further validated with a public dataset of other SARS-CoV-2 naïve single-cell sequencing data to ensure continuity. Although we utilized Harmony’s basic pipeline to mitigate batch effects, this small sample size predisposes variations within our data to have larger impacts that an increased sample size would mitigate. The inclusion of individuals who have fully recovered from COVID-19 would be informative to compare transcriptional changes of immune cells in peripheral blood in COVID-19 convalescents with/without residual symptoms. Also, this data would further identify MLC signatures specific to PASC with pulmonary sequelae. Further studies in large-scale cohort studies, specifically targeting the pulmonary sequelae of long-COVID and recovered survivors, are needed for data validation and enhancing our understanding of PPASC immunopathology.
In conclusion, our analysis of scRNA-seq data reflecting persistent pulmonary sequelae among PASC has revealed alterations of peripheral blood cells and associated gene signatures. Collectively, our case study data demonstrate altered MLCs with specific skewing toward a pro-fibrotic and long-lived metabolic profile in PPASC. Such results will enable new insights into ongoing pulmonary sequelae among PASC individuals and also provide information into mechanisms underlying the immunopathology linked to pulmonary sequelae of PASC.
The datasets presented in this study can be found in online repositories. The names of the repository/repositories and accession number(s) can be found below: GSE235938 (GEO).
The studies involving humans were approved by Queen’s Medical Center Research and Institutional Review Committee (RA-2020-053) and University of Hawaii Institutional Review Board (2020-00406). The studies were conducted in accordance with the local legislation and institutional requirements. The participants provided their written informed consent to participate in this study.
HY: Writing – original draft, Writing – review & editing, Data curation, Formal analysis, Methodology. LD: Formal analysis, Writing – original draft, Writing – review & editing. BJ: Data curation, Methodology, Writing – review & editing, Resources. VK: Data curation, Methodology, Writing – review & editing, Formal analysis, Validation. YD: Methodology, Validation, Writing – review & editing. VN: Writing – review & editing, Resources, Funding acquisition. DC: Writing – review & editing. CS: Writing – review & editing, Funding acquisition, Resources. GD: Writing – review & editing, Data curation, Funding acquisition. YK: Writing – review & editing. JP: Conceptualization, Funding acquisition, Supervision, Writing – original draft, Writing – review & editing.
The author(s) declare financial support was received for the research, authorship, and/or publication of this article. This work was supported by Myra W. and Jean Kent Angus Foundation, Ola HAWAII (U54MD0007601), PIKO (U54GM138062), U54GM138062, P20GM103466, P20GM139753, the Molecular and Cellular Immunology Core through the funding of the Centers of Biomedical Research Excellence (COBRE) program (P30GM114737), and the NIH/NIMHD Minority Health Research Training (MHRT) Program (T37MD008636).
The authors thank the staff of the Hawaii Center for AIDS for participant recruitment, blood collection, and sample processing for the study during a particularly challenging period. We also appreciate Dr. Alexandra Gurary at the Flow Cytometry Core, John A. Burns School of Medicine, University of Hawaii at Manoa who provided technical guidance for flow cytometry experiments and Dr. Karolina Peplowska at the Genomics and Bioinformatic Shared Resource, John A. Burns School of Medicine, University of Hawaii Cancer Center who performed scRNA-seq. The authors are also grateful to the study participants.
The authors declare that the research was conducted in the absence of any commercial or financial relationships that could be construed as a potential conflict of interest.
The author(s) declared that they were an editorial board member of Frontiers, at the time of submission. This had no impact on the peer review process and the final decision.
All claims expressed in this article are solely those of the authors and do not necessarily represent those of their affiliated organizations, or those of the publisher, the editors and the reviewers. Any product that may be evaluated in this article, or claim that may be made by its manufacturer, is not guaranteed or endorsed by the publisher.
The Supplementary Material for this article can be found online at: https://www.frontiersin.org/articles/10.3389/fimmu.2023.1268510/full#supplementary-material
1. Wu Z, McGoogan JM. Characteristics of and important lessons from the Coronavirus disease 2019 (Covid-19) outbreak in China: summary of a report of 72 314 cases from the Chinese center for disease control and prevention. JAMA (2020) 323(13):1239–42. doi: 10.1001/jama.2020.2648
2. Raina SK, Kumar R. Identifying role of public health and primary care as disparate entities in current health system. J Family Med Prim Care (2021) 10(10):3531–4. doi: 10.4103/jfmpc.jfmpc_1465_21
3. Swerdlow DL, Finelli L. Preparation for possible sustained transmission of 2019 novel Coronavirus: lessons from previous epidemics. JAMA (2020) 323(12):1129–30. doi: 10.1001/jama.2020.1960
4. Pilkington V, Keestra SM, Hill A. Global Covid-19 vaccine inequity: failures in the first year of distribution and potential solutions for the future. Front Public Health (2022) 10:821117. doi: 10.3389/fpubh.2022.821117
5. Tenforde MW, Self WH, Adams K, Gaglani M, Ginde AA, McNeal T, et al. Association between Mrna vaccination and Covid-19 hospitalization and disease severity. JAMA (2021) 326(20):2043–54. doi: 10.1001/jama.2021.19499
6. Mohammed I, Nauman A, Paul P, Ganesan S, Chen KH, Jalil SMS, et al. The efficacy and effectiveness of the Covid-19 vaccines in reducing infection, severity, hospitalization, and mortality: A systematic review. Hum Vaccin Immunother (2022) 18(1):2027160. doi: 10.1080/21645515.2022.2027160
7. Perlis RH, Santillana M, Ognyanova K, Safarpour A, Lunz Trujillo K, Simonson MD, et al. Prevalence and correlates of long Covid symptoms among us adults. JAMA Netw Open (2022) 5(10):e2238804. doi: 10.1001/jamanetworkopen.2022.38804
8. Zhou F, Tao M, Shang L, Liu Y, Pan G, Jin Y, et al. Assessment of sequelae of Covid-19 nearly 1 year after diagnosis. Front Med (Lausanne) (2021) 8:717194. doi: 10.3389/fmed.2021.717194
9. Groff D, Sun A, Ssentongo AE, Ba DM, Parsons N, Poudel GR, et al. Short-term and long-term rates of postacute sequelae of Sars-Cov-2 infection: A systematic review. JAMA Netw Open (2021) 4(10):e2128568. doi: 10.1001/jamanetworkopen.2021.28568
10. Nalbandian A, Desai AD, Wan EY. Post-Covid-19 condition. Annu Rev Med (2023) 74:55–64. doi: 10.1146/annurev-med-043021-030635
11. Nalbandian A, Sehgal K, Gupta A, Madhavan MV, McGroder C, Stevens JS, et al. Post-acute Covid-19 syndrome. Nat Med (2021) 27(4):601–15. doi: 10.1038/s41591-021-01283-z
12. Xie Y, Al-Aly Z. Risks and burdens of incident diabetes in long Covid: A cohort study. Lancet Diabetes Endocrinol (2022) 10(5):311–21. doi: 10.1016/S2213-8587(22)00044-4
13. Xie Y, Xu E, Bowe B, Al-Aly Z. Long-term cardiovascular outcomes of Covid-19. Nat Med (2022) 28(3):583–90. doi: 10.1038/s41591-022-01689-3
14. Bowe B, Xie Y, Xu E, Al-Aly Z. Kidney outcomes in long Covid. J Am Soc Nephrol (2021) 32(11):2851–62. doi: 10.1681/ASN.2021060734
15. O'Mahoney LL, Routen A, Gillies C, Ekezie W, Welford A, Zhang A, et al. The prevalence and long-term health effects of long Covid among hospitalised and non-hospitalised populations: A systematic review and meta-analysis. EClinicalMedicine (2023) 55:101762. doi: 10.1016/j.eclinm.2022.101762
16. Global Burden of Disease Long CC, Wulf Hanson S, Abbafati C, Aerts JG, Al-Aly Z, Ashbaugh C, et al. Estimated global proportions of individuals with persistent fatigue, cognitive, and respiratory symptom clusters following symptomatic Covid-19 in 2020 and 2021. JAMA (2022) 328(16):1604–15. doi: 10.1001/jama.2022.18931
17. Chen C, Haupert SR, Zimmermann L, Shi X, Fritsche LG, Mukherjee B. Global prevalence of post-coronavirus disease 2019 (Covid-19) condition or long Covid: A meta-analysis and systematic review. J Infect Dis (2022) 226(9):1593–607. doi: 10.1093/infdis/jiac136
18. McFann K, Baxter BA, LaVergne SM, Stromberg S, Berry K, Tipton M, et al. Quality of life (Qol) is reduced in those with severe Covid-19 disease, post-acute sequelae of Covid-19, and hospitalization in United States adults from northern Colorado. Int J Environ Res Public Health (2021) 18(21):11048. doi: 10.3390/ijerph182111048
19. Shah R, Ali FM, Nixon SJ, Ingram JR, Salek SM, Finlay AY. Measuring the impact of Covid-19 on the quality of life of the survivors, partners and family members: A cross-sectional international online survey. BMJ Open (2021) 11(5):e047680. doi: 10.1136/bmjopen-2020-047680
20. Tak CR. The Health Impact of Long Covid: A Cross-Sectional Examination of Health-Related Quality of Life, Disability, and Health Status among Individuals with Self-Reported Post-Acute Sequelae of Sars Cov-2 Infection at Various Points of Recovery. J Patient Rep Outcomes (2023) 7(1):31. doi: 10.1186/s41687-023-00572-0
21. Bowe B, Xie Y, Al-Aly Z. Postacute sequelae of Covid-19 at 2 years. Nat Med (2023) 29(9):2347–57. doi: 10.1038/s41591-023-02521-2
22. Tsampasian V, Elghazaly H, Chattopadhyay R, Debski M, Naing TKP, Garg P, et al. Risk factors associated with post-Covid-19 condition: A systematic review and meta-analysis. JAMA Intern Med (2023) 183(6):566–580. doi: 10.1001/jamainternmed.2023.0750
23. Lukkahatai N, Rodney T, Ling C, Daniel B, Han HR. Long Covid in the context of social determinants of health. Front Public Health (2023) 11:1098443. doi: 10.3389/fpubh.2023.1098443
24. Khullar D, Zhang Y, Zang C, Xu Z, Wang F, Weiner MG, et al. Racial/ethnic disparities in post-acute sequelae of Sars-Cov-2 infection in New York: an Ehr-based cohort study from the recover program. J Gen Intern Med (2023) 38(5):1127–36. doi: 10.1007/s11606-022-07997-1
25. Xie Y, Bowe B, Al-Aly Z. Burdens of post-acute sequelae of Covid-19 by severity of acute infection, demographics and health status. Nat Commun (2021) 12(1):6571. doi: 10.1038/s41467-021-26513-3
26. Bai F, Tomasoni D, Falcinella C, Barbanotti D, Castoldi R, Mule G, et al. Female gender is associated with long Covid syndrome: A prospective cohort study. Clin Microbiol Infect (2022) 28(4):611 e9– e16. doi: 10.1016/j.cmi.2021.11.002
27. Davis HE, McCorkell L, Vogel JM, Topol EJ. Long Covid: major findings, mechanisms and recommendations. Nat Rev Microbiol (2023) 21(3):133–46. doi: 10.1038/s41579-022-00846-2
28. Bahmer T, Borzikowsky C, Lieb W, Horn A, Krist L, Fricke J, et al. Severity, predictors and clinical correlates of post-Covid syndrome (Pcs) in Germany: A prospective, multi-centre, population-based cohort study. EClinicalMedicine (2022) 51:101549. doi: 10.1016/j.eclinm.2022.101549
29. Mizrahi B, Sudry T, Flaks-Manov N, Yehezkelli Y, Kalkstein N, Akiva P, et al. Long Covid Outcomes at One Year after Mild Sars-Cov-2 Infection: Nationwide Cohort Study. BMJ (2023) 380:e072529. doi: 10.1136/bmj-2022-072529
30. Wang C, Ramasamy A, Verduzco-Gutierrez M, Brode WM, Melamed E. Acute and post-acute sequelae of Sars-Cov-2 infection: A review of risk factors and social determinants. Virol J (2023) 20(1):124. doi: 10.1186/s12985-023-02061-8
31. Abdelwahab N, Ingraham NE, Nguyen N, Siegel L, Silverman G, Sahoo HS, et al. Predictors of postacute sequelae of Covid-19 development and rehabilitation: A retrospective study. Arch Phys Med Rehabil (2022) 103(10):2001–8. doi: 10.1016/j.apmr.2022.04.009
32. Yoo SM, Liu TC, Motwani Y, Sim MS, Viswanathan N, Samras N, et al. Factors associated with post-acute sequelae of Sars-Cov-2 (Pasc) after diagnosis of symptomatic Covid-19 in the inpatient and outpatient setting in a diverse cohort. J Gen Intern Med (2022) 37(8):1988–95. doi: 10.1007/s11606-022-07523-3
33. Klein J, Wood J, Jaycox JR, et al. Distinguishing features of long COVID identified through immune profiling. Nature (2023) 623:139–48. doi: 10.1038/s41586-023-06651-y
34. Phetsouphanh C, Darley DR, Wilson DB, Howe A, Munier CML, Patel SK, et al. Immunological dysfunction persists for 8 months following initial mild-to-moderate Sars-Cov-2 infection. Nat Immunol (2022) 23(2):210–6. doi: 10.1038/s41590-021-01113-x
35. Cui L, Fang Z, De Souza CM, Lerbs T, Guan Y, Li I, et al. Innate immune cell activation causes lung fibrosis in a humanized model of long Covid. Proc Natl Acad Sci U S A (2023) 120(10):e2217199120. doi: 10.1073/pnas.2217199120
36. Cheon IS, Li C, Son YM, Goplen NP, Wu Y, Cassmann T, et al. Immune signatures underlying post-acute Covid-19 lung sequelae. Sci Immunol (2021) 6(65):eabk1741. doi: 10.1126/sciimmunol.abk1741
37. Bodansky A, Wang C-Y, Saxena A, Mitchell A, Kung AF, Takahashi S, et al. Autoantigen profiling reveals a shared post-COVID signature in fully recovered and long COVID patients. JCI Insight (2023) 8(11):e169515. doi: 10.1172/jci.insight.169515
38. Peluso MJ, Lu S, Tang AF, Durstenfeld MS, Ho HE, Goldberg SA, et al. Markers of immune activation and inflammation in individuals with postacute sequelae of severe acute respiratory syndrome Coronavirus 2 infection. J Infect Dis (2021) 224(11):1839–48. doi: 10.1093/infdis/jiab490
39. Schultheiss C, Willscher E, Paschold L, Gottschick C, Klee B, Henkes SS, et al. The Il-1beta, Il-6, and Tnf cytokine triad is associated with post-acute sequelae of Covid-19. Cell Rep Med (2022) 3(6):100663. doi: 10.1016/j.xcrm.2022.100663
40. Espin E, Yang C, Shannon CP, Assadian S, He D, Tebbutt SJ. Cellular and molecular biomarkers of long Covid: A scoping review. EBioMedicine (2023) 91:104552. doi: 10.1016/j.ebiom.2023.104552
41. Thomas T, Stefanoni D, Reisz JA, Nemkov T, Bertolone L, Francis RO, et al. Covid-19 infection alters kynurenine and fatty acid metabolism, correlating with Il-6 levels and renal status. JCI Insight (2020) 5(14):e140327. doi: 10.1172/jci.insight.140327
42. Feingold KR. The bidirectional link between Hdl and Covid-19 infections. J Lipid Res (2021) 62:100067. doi: 10.1016/j.jlr.2021.100067
43. Scherer PE, Kirwan JP, Rosen CJ. Post-acute sequelae of Covid-19: A metabolic perspective. Elife (2022) 11. doi: 10.7554/eLife.78200
44. Dias SSG, Soares VC, Ferreira AC, Sacramento CQ, Fintelman-Rodrigues N, Temerozo JR, et al. Lipid droplets fuel Sars-Cov-2 replication and production of inflammatory mediators. PloS Pathog (2020) 16(12):e1009127. doi: 10.1371/journal.ppat.1009127
45. Nardacci R, Colavita F, Castilletti C, Lapa D, Matusali G, Meschi S, et al. Evidences for lipid involvement in Sars-Cov-2 cytopathogenesis. Cell Death Dis (2021) 12(3):263. doi: 10.1038/s41419-021-03527-9
46. Grootemaat AE, van der Niet S, Scholl ER, Roos E, Schurink B, Bugiani M, et al. Lipid and nucleocapsid N-protein accumulation in Covid-19 patient lung and infected cells. Microbiol Spectr (2022) 10(1):e0127121. doi: 10.1128/spectrum.01271-21
47. Codo AC, Davanzo GG, Monteiro LB, de Souza GF, Muraro SP, Virgilio-da-Silva JV, et al. Elevated glucose levels favor Sars-Cov-2 Infection and Monocyte Response through a Hif-1alpha/glycolysis-dependent axis. Cell Metab (2020) 32(3):437–46.e5. doi: 10.1016/j.cmet.2020.07.007
48. Gurshaney S, Morales-Alvarez A, Ezhakunnel K, Manalo A, Huynh TH, Abe JI, et al. Metabolic dysregulation impairs lymphocyte function during severe Sars-Cov-2 infection. Commun Biol (2023) 6(1):374. doi: 10.1038/s42003-023-04730-4
49. Kovarik JJ, Bileck A, Hagn G, Meier-Menches SM, Frey T, Kaempf A, et al. A multi-omics based anti-inflammatory immune signature characterizes long Covid-19 syndrome. iScience (2023) 26(1):105717. doi: 10.1016/j.isci.2022.105717
50. Gaebler C, Wang Z, Lorenzi JCC, Muecksch F, Finkin S, Tokuyama M, et al. Evolution of antibody immunity to Sars-Cov-2. Nature (2021) 591(7851):639–44. doi: 10.1038/s41586-021-03207-w
51. Stein SR, Ramelli SC, Grazioli A, Chung JY, Singh M, Yinda CK, et al. Sars-Cov-2 infection and persistence in the human body and brain at autopsy. Nature (2022) 612(7941):758–63. doi: 10.1038/s41586-022-05542-y
52. Patterson BK, Francisco EB, Yogendra R, Long E, Pise A, Rodrigues H, et al. Persistence of Sars Cov-2 S1 protein in Cd16+ Monocytes in post-acute sequelae of Covid-19 (Pasc) up to 15 months post-infection. Front Immunol (2021) 12:746021. doi: 10.3389/fimmu.2021.746021
53. Cohn LB, Chomont N, Deeks SG. The biology of the Hiv-1 latent reservoir and implications for cure strategies. Cell Host Microbe (2020) 27(4):519–30. doi: 10.1016/j.chom.2020.03.014
54. Hendricks CM, Cordeiro T, Gomes AP, Stevenson M. The interplay of Hiv-1 and macrophages in viral persistence. Front Microbiol (2021) 12:646447. doi: 10.3389/fmicb.2021.646447
55. Wu VH, Nordin JML, Nguyen S, Joy J, Mampe F, Del Rio Estrada PM, et al. Profound phenotypic and epigenetic heterogeneity of the Hiv-1-infected Cd4(+) T cell reservoir. Nat Immunol (2023) 24(2):359–70. doi: 10.1038/s41590-022-01371-3
56. Ryan FJ, Hope CM, Masavuli MG, Lynn MA, Mekonnen ZA, Yeow AEL, et al. Long-term perturbation of the peripheral immune system months after Sars-Cov-2 infection. BMC Med (2022) 20(1):26. doi: 10.1186/s12916-021-02228-6
57. Su Y, Yuan D, Chen DG, Ng RH, Wang K, Choi J, et al. Multiple early factors anticipate post-acute Covid-19 sequelae. Cell (2022) 185(5):881–95.e20. doi: 10.1016/j.cell.2022.01.014
58. Graham BL, Brusasco V, Burgos F, Cooper BG, Jensen R, Kendrick A, et al. 2017 Ers/Ats standards for single-breath carbon monoxide uptake in the lung. Eur Respir J (2017) 49(1):1600016. doi: 10.1183/13993003.00016-2016
59. Zheng GX, Terry JM, Belgrader P, Ryvkin P, Bent ZW, Wilson R, et al. Massively parallel digital transcriptional profiling of single cells. Nat Commun (2017) 8:14049. doi: 10.1038/ncomms14049
60. Korsunsky I, Millard N, Fan J, Slowikowski K, Zhang F, Wei K, et al. Fast, sensitive and accurate integration of single-cell data with harmony. Nat Methods (2019) 16(12):1289–96. doi: 10.1038/s41592-019-0619-0
61. Lee JS, Park S, Jeong HW, Ahn JY, Choi SJ, Lee H, et al. Immunophenotyping of Covid-19 and influenza highlights the role of type I interferons in development of severe Covid-19. Sci Immunol (2020) 5(49). doi: 10.1126/sciimmunol.abd1554
62. Lun ATL, Riesenfeld S, Andrews T, Dao TP, Gomes T, participants in the 1st Human Cell Atlas J, et al. Emptydrops: distinguishing cells from empty droplets in droplet-based single-cell Rna sequencing data. Genome Biol (2019) 20(1):63. doi: 10.1186/s13059-019-1662-y
63. McCarthy DJ, Campbell KR, Lun AT, Wills QF. Scater: pre-processing, quality control, normalization and visualization of single-cell Rna-seq data in R. Bioinformatics (2017) 33(8):1179–86. doi: 10.1093/bioinformatics/btw777
64. Hu C, Li T, Xu Y, Zhang X, Li F, Bai J, et al. Cellmarker 2.0: an updated database of manually curated cell markers in human/mouse and web tools based on Scrna-seq data. Nucleic Acids Res (2023) 51(D1):D870–D6. doi: 10.1093/nar/gkac947
65. Finak G, McDavid A, Yajima M, Deng J, Gersuk V, Shalek AK, et al. Mast: A flexible statistical framework for assessing transcriptional changes and characterizing heterogeneity in single-cell Rna sequencing data. Genome Biol (2015) 16:278. doi: 10.1186/s13059-015-0844-5
66. Liberzon A, Subramanian A, Pinchback R, Thorvaldsdottir H, Tamayo P, Mesirov JP. Molecular signatures database (Msigdb) 3.0. Bioinformatics (2011) 27(12):1739–40. doi: 10.1093/bioinformatics/btr260
67. Zheng R, Zhang Y, Tsuji T, Zhang L, Tseng Y-H, Chen K. Mebocost: metabolic cell-cell communication modeling by single cell transcriptome. bioRxiv (2022). doi: 10.1101/2022.05.30.494067
68. Garcia-Alonso L, Holland CH, Ibrahim MM, Turei D, Saez-Rodriguez J. Benchmark and integration of resources for the estimation of human transcription factor activities. Genome Res (2019) 29(8):1363–75. doi: 10.1101/gr.240663.118
69. Alvarez MJ, Shen Y, Giorgi FM, Lachmann A, Ding BB, Ye BH, et al. Functional characterization of somatic mutations in cancer using network-based inference of protein activity. Nat Genet (2016) 48(8):838–47. doi: 10.1038/ng.3593
70. Jin S, Guerrero-Juarez CF, Zhang L, Chang I, Ramos R, Kuan CH, et al. Inference and analysis of cell-cell communication using cellchat. Nat Commun (2021) 12(1):1088. doi: 10.1038/s41467-021-21246-9
71. Robinson MD, McCarthy DJ, Smyth GK. Edger: A bioconductor package for differential expression analysis of digital gene expression data. Bioinformatics (2010) 26(1):139–40. doi: 10.1093/bioinformatics/btp616
72. Morabito S, Reese F, Rahimzadeh N, Miyoshi E, Swarup V. hdWGCNA identifies co-expression networks in high-dimensional transcriptomics data. Cell Reports Methods (2022) 3(6):100498. doi: 10.1101/2022.09.22.509094
73. Chen EY, Tan CM, Kou Y, Duan Q, Wang Z, Meirelles GV, et al. Enrichr: interactive and collaborative html5 gene list enrichment analysis tool. BMC Bioinf (2013) 14:128. doi: 10.1186/1471-2105-14-128
74. Wagner A, Wang C, Fessler J, DeTomaso D, Avila-Pacheco J, Kaminski J, et al. Metabolic modeling of single Th17 cells reveals regulators of autoimmunity. Cell (2021) 184(16):4168–85.e21. doi: 10.1016/j.cell.2021.05.045
75. Wishart DS, Guo A, Oler E, Wang F, Anjum A, Peters H, et al. Hmdb 5.0: the human metabolome database for 2022. Nucleic Acids Res (2022) 50(D1):D622–D31. doi: 10.1093/nar/gkab1062
76. Park J, Dean LS, Jiyarom B, Gangcuangco LM, Shah P, Awamura T, et al. Elevated circulating monocytes and monocyte activation in Covid-19 convalescent individuals. Front Immunol (2023) 14:1151780. doi: 10.3389/fimmu.2023.1151780
77. Thyagarajan B, Wojczynski M, Minster RL, Sanders J, Barral S, Christiansen L, et al. Genetic variants associated with lung function: the long life family study. Respir Res (2014) 15(1):134. doi: 10.1186/s12931-014-0134-x
78. Atamas SP. Vascular endothelial growth factor in idiopathic pulmonary fibrosis. An imbalancing act. Am J Respir Crit Care Med (2017) 196(4):409–11. doi: 10.1164/rccm.201703-0605ED
79. Epstein Shochet G, Bardenstein-Wald B, McElroy M, Kukuy A, Surber M, Edelstein E, et al. Hypoxia inducible factor 1a supports a pro-fibrotic phenotype loop in idiopathic pulmonary fibrosis. Int J Mol Sci (2021) 22(7):3331. doi: 10.3390/ijms22073331
80. Griffiths K, Habiel DM, Jaffar J, Binder U, Darby WG, Hosking CG, et al. Anti-fibrotic effects of cxcr4-targeting I-body ad-114 in preclinical models of pulmonary fibrosis. Sci Rep (2018) 8(1):3212. doi: 10.1038/s41598-018-20811-5
81. Joshi N, Watanabe S, Verma R, Jablonski RP, Chen CI, Cheresh P, et al. A spatially restricted fibrotic niche in pulmonary fibrosis is sustained by M-Csf/M-Csfr signalling in monocyte-derived alveolar macrophages. Eur Respir J (2020) 55(1):1900646. doi: 10.1183/13993003.00646-2019
82. Li LC, Gao J, Li J. Emerging role of hmgb1 in fibrotic diseases. J Cell Mol Med (2014) 18(12):2331–9. doi: 10.1111/jcmm.12419
83. Liu Y, Lu FA, Wang L, Wang YF, Wu CF. Long non−Coding Rna neat1 promotes pulmonary fibrosis by regulating the microrna−455−3p/Smad3 axis. Mol Med Rep (2021) 23(3):218. doi: 10.3892/mmr.2021.11857
84. Thurman AL, Li X, Villacreses R, Yu W, Gong H, Mather SE, et al. A single-cell atlas of large and small airways at birth in a porcine model of cystic fibrosis. Am J Respir Cell Mol Biol (2022) 66(6):612–22. doi: 10.1165/rcmb.2021-0499OC
85. Harding JL, Oviedo SA, Ali MK, Ofotokun I, Gander JC, Patel SA, et al. The bidirectional association between diabetes and long-Covid-19 - a systematic review. Diabetes Res Clin Pract (2023) 195:110202. doi: 10.1016/j.diabres.2022.110202
86. Kamp JC, Werlein C, Plucinski EKJ, Neubert L, Welte T, Lee PD, et al. Novel insight into pulmonary fibrosis and long Covid. Am J Respir Crit Care Med (2023) 207(8):1105–7. doi: 10.1164/rccm.202212-2314LE
87. Kamp JC, Neubert L, Ackermann M, Stark H, Werlein C, Fuge J, et al. Time-dependent molecular motifs of pulmonary fibrogenesis in Covid-19. Int J Mol Sci (2022) 23(3):1583. doi: 10.3390/ijms23031583
88. Dean LS, Chow DC, Ndhlovu LC, Boisvert WA, Chang SP, Shikuma CM, et al. Characterization of circulating fibrocytes in people living with Hiv on stable antiretroviral therapy. Immunohorizons (2022) 6(11):760–7. doi: 10.4049/immunohorizons.2200085
89. Phillips RJ, Burdick MD, Hong K, Lutz MA, Murray LA, Xue YY, et al. Circulating fibrocytes traffic to the lungs in response to Cxcl12 and mediate fibrosis. J Clin Invest (2004) 114(3):438–46. doi: 10.1172/JCI20997
90. Chaudhary NI, Roth GJ, Hilberg F, Muller-Quernheim J, Prasse A, Zissel G, et al. Inhibition of pdgf, vegf and fgf signalling attenuates fibrosis. Eur Respir J (2007) 29(5):976–85. doi: 10.1183/09031936.00152106
91. Aschner Y, Downey GP. Transforming growth factor-Beta: master regulator of the respiratory system in health and disease. Am J Respir Cell Mol Biol (2016) 54(5):647–55. doi: 10.1165/rcmb.2015-0391TR
92. Lee J, Tam H, Adler L, Ilstad-Minnihan A, Macaubas C, Mellins ED. The Mhc class ii antigen presentation pathway in human monocytes differs by subset and is regulated by cytokines. PLoS One (2017) 12(8):e0183594. doi: 10.1371/journal.pone.0183594
93. Guntur VP, Nemkov T, de Boer E, Mohning MP, Baraghoshi D, Cendali FI, et al. Signatures of mitochondrial dysfunction and impaired fatty acid metabolism in plasma of patients with post-acute sequelae of Covid-19 (Pasc). Metabolites (2022) 12(11):1026. doi: 10.3390/metabo12111026
94. Zhu X, Meyers A, Long D, Ingram B, Liu T, Yoza BK, et al. Frontline science: monocytes sequentially rewire metabolism and bioenergetics during an acute inflammatory response. J Leukoc Biol (2019) 105(2):215–28. doi: 10.1002/JLB.3HI0918-373R
Keywords: SARS-CoV-2, long-COVID, post-acute sequalae of SARS-CoV-2 infection, pulmonary sequelae, single-cell RNA sequencing, monocyte
Citation: Yoon H, Dean LS, Jiyarom B, Khadka VS, Deng Y, Nerurkar VR, Chow DC, Shikuma CM, Devendra G, Koh Y and Park J (2024) Single‐cell RNA sequencing reveals characteristics of myeloid cells in post-acute sequelae of SARS-CoV-2 patients with persistent respiratory symptoms. Front. Immunol. 14:1268510. doi: 10.3389/fimmu.2023.1268510
Received: 28 July 2023; Accepted: 14 December 2023;
Published: 08 January 2024.
Edited by:
Iole Macchia, National Institute of Health (ISS), ItalyReviewed by:
Melissa Govender, University of Oxford, United KingdomCopyright © 2024 Yoon, Dean, Jiyarom, Khadka, Deng, Nerurkar, Chow, Shikuma, Devendra, Koh and Park. This is an open-access article distributed under the terms of the Creative Commons Attribution License (CC BY). The use, distribution or reproduction in other forums is permitted, provided the original author(s) and the copyright owner(s) are credited and that the original publication in this journal is cited, in accordance with accepted academic practice. No use, distribution or reproduction is permitted which does not comply with these terms.
*Correspondence: Juwon Park, anBhcmsyNUBoYXdhaWkuZWR1; Youngil Koh, Z28wMUBzbnUuYWMua3I=
†These authors have contributed equally to this work
Disclaimer: All claims expressed in this article are solely those of the authors and do not necessarily represent those of their affiliated organizations, or those of the publisher, the editors and the reviewers. Any product that may be evaluated in this article or claim that may be made by its manufacturer is not guaranteed or endorsed by the publisher.
Research integrity at Frontiers
Learn more about the work of our research integrity team to safeguard the quality of each article we publish.