 Mahnaz Rezaei1
 Mustafa Ghanadian2
 Behrooz Ghezelbash1
 Abolfazl Shokouhi3
 Alexandr V. Bazhin4
 Andrey A. Zamyatnin Jr.5,6,7,8
 Mazdak Ganjalikhani-Hakemi1,9*
- 1Department of Immunology, Faculty of Medicine, Isfahan University of Medical Sciences, Isfahan, Iran
- 2Department of Pharmacognosy, School of Pharmacy, Isfahan University of Medical Sciences, Isfahan, Iran
- 3Endocrine and Metabolism Research Center, Isfahan University of Medical Sciences, Isfahan, Iran
- 4Department of General, Visceral and Transplant Surgery, Ludwig Maximilians University of Munich, Munich, Germany
- 5Faculty of Bioengineering and Bioinformatics, Lomonosov Moscow State University, Moscow, Russia
- 6Belozersky Institute of Physico-Chemical Biology, Lomonosov Moscow State University, Moscow, Russia
- 7Scientific Center for Translation Medicine, Sirius University of Science and Technology, Sochi, Russia
- 8Institute of Translational Medicine and Biotechnology, Sechenov First Moscow State Medical University, Moscow, Russia
- 9Regenerative and Restorative Medicine Research Center (REMER), Research Institute for Health Sciences and Technologies (SABITA), Istanbul Medipol University, Istanbul, Türkiye
Introduction: T-cell immunoglobulin and mucin domain-3 (TIM-3) is a transmembrane molecule first identified as an immunoregulator. This molecule is also expressed on leukemic cells in acute myeloid leukemia and master cell survival and proliferation. In this study, we aimed to explore the effect of TIM-3 interaction with its ligand galectin-9 (Gal-9) on glucose and lipid metabolism in AML cell lines.
Methods: HL-60 and THP-1 cell lines, representing M3 and M5 AML subtypes, respectively, were cultured under appropriate conditions. The expression of TIM-3 on the cell surface was ascertained by flow cytometric assay. We used real-time PCR to examine the mRNA expression of GLUT-1, HK-2, PFKFB-3, G6PD, ACC-1, ATGL, and CPT-1A; colorimetric assays to measure the concentration of glucose, lactate, GSH, and the enzymatic activity of G6PD; MTT assay to determine cellular proliferation; and gas chromatography–mass spectrometry (GC-MS) to designate FFAs.
Results: We observed the significant upregulated expression of GLUT-1, HK-2, PFKFB-3, ACC-1, CPT-1A, and G6PD and the enzymatic activity of G6PD in a time-dependent manner in the presence of Gal-9 compared to the PMA and control groups in both HL-60 and THP-1 cell lines (p > 0.05). Moreover, the elevation of extracellular free fatty acids, glucose consumption, lactate release, the concentration of cellular glutathione (GSH) and cell proliferation were significantly higher in the presence of Gal-9 compared to the PMA and control groups in both cell lines (p < 0.05).
Conclusion: TIM-3/Gal-9 ligation on AML cell lines results in aerobic glycolysis and altered lipid metabolism and also protects cells from oxidative stress, all in favor of leukemic cell survival and proliferation.
1 Introduction
Acute myeloid leukemia (AML) is defined by increased proliferative, undifferentiated, and non-functional hematopoietic cells in peripheral blood and/or bone marrow (1). This malignancy employs metabolic reprogramming as one of the key mechanisms to break through homeostasis. AML cells are highly reliant on aerobic glycolysis, characterized by excessive glucose consumption and lactate release. This glycolytic pattern encompasses the upregulation of glucose transporter-1 (GLUT-1) and two rate-limiting enzymes in this pathway: hexokinase-2 (HK-2) and 6-phosphofructo-2-kinase/fructose-2,6-bisphosphatase-3 (PFKFB-3). Several reports claim that the overexpression of GLUT-1 and HK-2 may be relevant to chemoresistance in AML patients (2–11). Also, the overexpression of glucose 6-phosphate dehydrogenase (G6PD), the rate-limiting enzyme in the pentose phosphate pathway (PPP), and the sensitivity of AML cells to its inhibition have been reported previously (12, 13). In line with G6PD, high levels of glutathione (GSH), to protect cells from oxidative stress, are expected in AML cells; therefore, hampering GSH production is considered for therapy (14, 15). Several studies reveal the dependence of AML cells, particularly leukemic stem cells (LSCs), on fatty acid oxidation (FAO) (16). This dependency may be due to not only providing energy but also the high capability of FAO in adjusting oxidative stress, even preventing anoikis (a kind of programmed cell death as a consequence of cell detachment from the extracellular matrix), as described in other malignancies (17–19). In this regard, the overexpression of carnitine palmitoyl transferase-1A (CPT-1A), the rate-limiting enzyme of FAO, has been reported previously in AML cells and is considered a target for therapy (20, 21). Moreover, abnormal lipogenesis in various cancers and hematologic malignancies are observed (22–24). The elevation of acetyl CoA carboxylase (ACC-1; the rate-limiting enzyme in lipogenesis) is considered a cancer hallmark in line with fatty acid synthase (FASN; another enzyme in lipid biosynthesis) in previous reports (22, 23, 25), though ACC-1 is not completely studied in AML and some data may be controversial (26). Since metabolic reprogramming in AML is a dynamic object of interest and several therapies are based on metabolic inhibitors (27), checking over the basics of these alterations, and particularly, identifying the upstream molecules that manipulate metabolic pathways in AML should be carried out to determine the role of leukemia-related markers.
More than a decade ago, T-cell immunoglobulin and mucin domain-3 (TIM-3), previously known as an immunoregulator, was identified on AML cells (28, 29). Rapidly, several studies were conducted to investigate the role of this molecule on leukemic cells. Galectin-9 (Gal-9), a β-galactoside binding lectin, was declared as its natural ligand in AML, as it binds to the IgV domain of TIM-3 and induces the phosphorylation of two tyrosine residues in the cytoplasmic tail of TIM-3 (30, 31). This leads to the activation of extracellular signal-regulated-kinase (ERK) as well as phosphoinositide 3-kinase/Protein kinase B/mammalian Target of Rapamycin (PI3K/Akt/mTOR) signaling pathway, which finally results in the activation and/or production of β-catenin, nuclear factor kappa B (NF-κB), vascular endothelial growth factor (VEGF), hypoxia-inducible factor-1 subunit alpha (HIF-1α), and tumor necrosis factor-alpha (TNF-α) (30, 32, 33). Therefore, TIM-3 is recognized as a promising target for immunotherapy and monoclonal anti-TIM-3 antibodies are currently under evaluation in several clinical trials for AML and high-risk MDS (myelodysplastic syndrome) in combination with cytotoxic therapies (NCT04266301, NCT04150029, NCT04823624, NCT03946670, NCT04878432, NCT03940352, and NCT03066648).
Currently, there are a few studies about the possible role of TIM-3 in metabolic reprogramming. A study on Jurkat T cells and another study on a macrophage cell line (RAW 264.7 cells) show that TIM-3 has a negative influence on glycolysis through downregulating GLUT-1 and HK-2 in these cells, respectively. Whether TIM-3 can affect other cells and other metabolic pathways, and in what directions, has not yet been assessed. Based on these data, we aimed to investigate the role of TIM-3 on metabolic reprogramming in AML cells by using two AML cell lines, HL-60 and THP-1, representing M3 and M5 AML subtypes, respectively1.
2 Materials and methods
2.1 Cell culture
HL-60 and THP-1 cell lines were obtained from Pasteur Institute (Tehran, Iran), cultured in Roswell Park Memorial Institute Medium 1640 (RPMI; BIO-IDEA, Iran) enriched with 10% and 15% fetal bovine serum (FBS; BIO-IDEA, Iran), respectively, in the presence of 1% antibiotic [penicillin G (10,000 U/mL) and streptomycin (10,000 U/mL); BIO-IDEA, Iran]. Cells were incubated at 37°C with 5.2% CO2 and 98% humidity. For each treatment, 5 × 10⁵ cells were transmitted to each well of a 24-well plate with 1 mL of complete medium. For the phorbol 12-myristate 13-acetate (PMA) group, cells were incubated with 50 ng/mL PMA (PeproTech, USA) for 24 h, to increase TIM-3 expression on the cell surface and lead the ligand to interact with TIM-3, aside from its other receptors like VISTA or CD44 on leukemic cells. While AML cells are known to produce Gal-9 (though in few amounts in vitro) to sharpen the effect of TIM-3, we designed Gal-9 groups in which, after exchanging the medium of cells that were exposed to 50 ng/mL PMA for 24 h, 100 ng/mL Recombinant Human Gal-9 (Escherichia coli expressed, carrier-free) (BioLegend, USA) was added to the medium. Cells or their supernatant were harvested after 24 h, 48 h, and/or 72 h after treatment with Gal-9 for each test, as required.
2.2 Flow cytometry
Cell lines were stimulated with 50 ng of PMA (PeproTech, USA) final concentration, for 24 h. FITC anti-human CD366 [(TIM-3); clone: F38-2E2, isotype: Mouse IgG1, κ] (BioLegend, USA) was used to stain stimulated cells vs. control cells. FITC mouse IgG1 κ isotype antibody (clone: MOPC-21; BioLegend, USA) was used to guarantee the specificity of the flow cytometric results. Surface TIM-3 was measured using the FACSCalibur instrument (Becton Dickinson Bioscience, USA) and data were analyzed with FlowJo software (Becton Dickinson, USA).
2.3 Real-time qPCR
Extracted total RNA (Total RNA Extraction Kit; Parstous Biotechnology, Iran) was used for cDNA synthesis (AddScript cDNA Synthesis Kit; Addbio, Sweden) in Thermal Cycler (Bio-Rad, Singapore). This product was subjected to qPCR (RealQ Plus 2x Master MixGreen, High ROX; Amplicon, Denmark) for target genes with primers (synthesis: metabion, Germany) listed in Table 1, alongside the housekeeping gene, β-actin, performed using the Applied Biosystem Real-Time PCR System (USA).
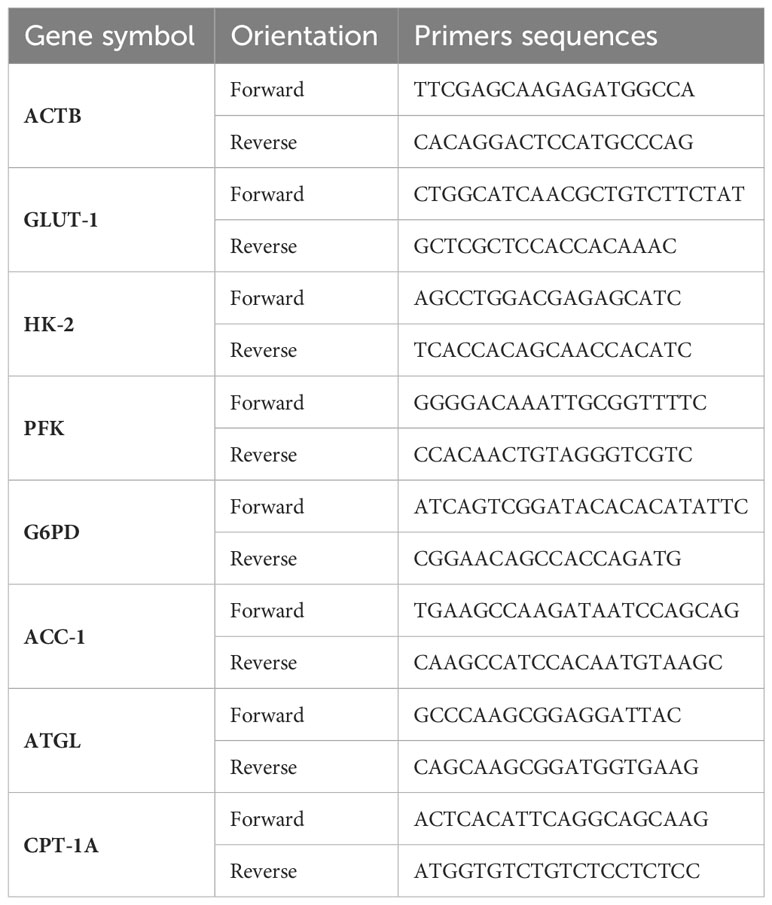
Table 1 List of studied gene expressions and their specific primer sequences.
2.4 Glucose consumption and lactate release
Glucose consumption (PARS AZMUN, Iran) and lactate release (Audit, Iran) were established by subtracting the concentration of each metabolite in fresh media (C-RPMI with 10% and 15% FBS for HL-60 and THP-1 cell lines, respectively) from the final concentration in the cell culture supernatant of the control (Ctrl), PMA, and Gal-9 groups (Hitachi 917; Boehringer Mannheim, Germany). For each treatment, the initial seeding number was 5 × 10⁵ cells per mL medium with three replicates, cultured in a 24-well plate.
2.5 GSH concentration and enzymatic activity of G6PD
A total of 6 × 10⁶ cells from each cell line for each test were grown under indicated treatments (Ctrl, PMA, and Gal-9 groups) with three replicates in six-well plates. Harvested cells were subjected to GSH concentration measurement (Navand Salamat Co., Iran) and G6PD enzymatic activity (Gesan, Italy) according to the manufacturer’s protocol.
2.6 MTT Cell viability assay
Each cell line was cultured with 105 cells per mL per well seeding number for the Ctrl, PMA, and Gal-9 groups. MTT assay was performed according to the manufacturer’s protocol (DNA Biotech, Iran). Briefly, 10 µL of MTT solution (5 mg/mL in PBS buffer) was added to 90 µL of cell suspension containing 5 × 10⁵ cell/mL, and the plate was incubated at 37°C with 5.2% CO2 and 98% humidity for 3 h. Then, the resulting formazan crystals were dissolved by adding 100 µL of detergent reagent followed by gentle mixing in a shaker. Optical density was measured at 570 nm wavelength with a background absorbance of 690 nm (MPR4+, Hiperion, Germany).
2.7 Gas chromatography–mass spectrometry
Cell culture supernatant was collected from the Ctrl, PMA, and Gal-9 groups of each cell line and lyophilized by freeze dryer (DorsaTech, Iran) for 24 h. Ultrasonication for 90 minutes after adding 3 ml of N-hexane (Pars Chemie, Iran) to each sample helped the dissolving of lipids in hexane. This procedure was performed twice, and each time, the supernatant was collected after centrifugation (3,000 rpm, 5 min) and air dried completely. After workup, 50 µL of HPLC-grade chloroform (Neutron Pharmacochemical Co, Iran) was added to each dried sample, and 1 µl was injected into the GC mass system (Agilent US94324233, USA) on a capillary column (HP-5; 30 m × 0.25 mm, 0.25 μm) in a splitless mode with the column temperature program: 100°C (H = 2) @ R 12°C to 210°C (H = 0) @ R 3°C to 250°C (H = 5) with a mass ionization voltage of 30 eV. The MSD ChemStation was used as the operating software. Identification was done using Kovats retention index, NIST and Wiley275.L libraries, and spike with standards (methyl myristate; t = 17.6, methyl palmitate; t = 19.1, methyl oleate; t = 19.4, methyl stearate). The Kovats retention index was calculated according to the retention times of normal alkanes (C9–C24) with the same oven temperature program.
2.8 Statistical analysis
Every experiment was performed in triplicate. Statistical analysis was conducted using GraphPad Prism 9.4.1 and SPSS 26.0. To evaluate the assumption of normality, the Kolmogorov–Smirnov test was performed. Therefore, one-way ANOVA, a parametric method, was used to compare the differences, and a p-value of < 0.05 was considered a statistically significant result.
3 Results
3.1 The expression of TIM-3 on AML cell lines was elevated following stimulation with PMA
As the first step, we examined the surface expression of TIM-3 on both cell lines following treatment with PMA within 72 h with flow cytometric assay and observed the maximum increase 24 h post-treatment. TIM-3 expression, 24 h after treatment, was increased from 4% to 71% and from 21% to 84% in HL-60 and THP-1 cell lines, respectively. Therefore, Gal-9 was added to the test wells 24 h after treatment with PMA (Figure 1). Also, as PMA itself can induce the activation of several transcription factors (34, 35), we used cells treated with PMA for 24 h as the second control group to compare Gal-9 groups with.
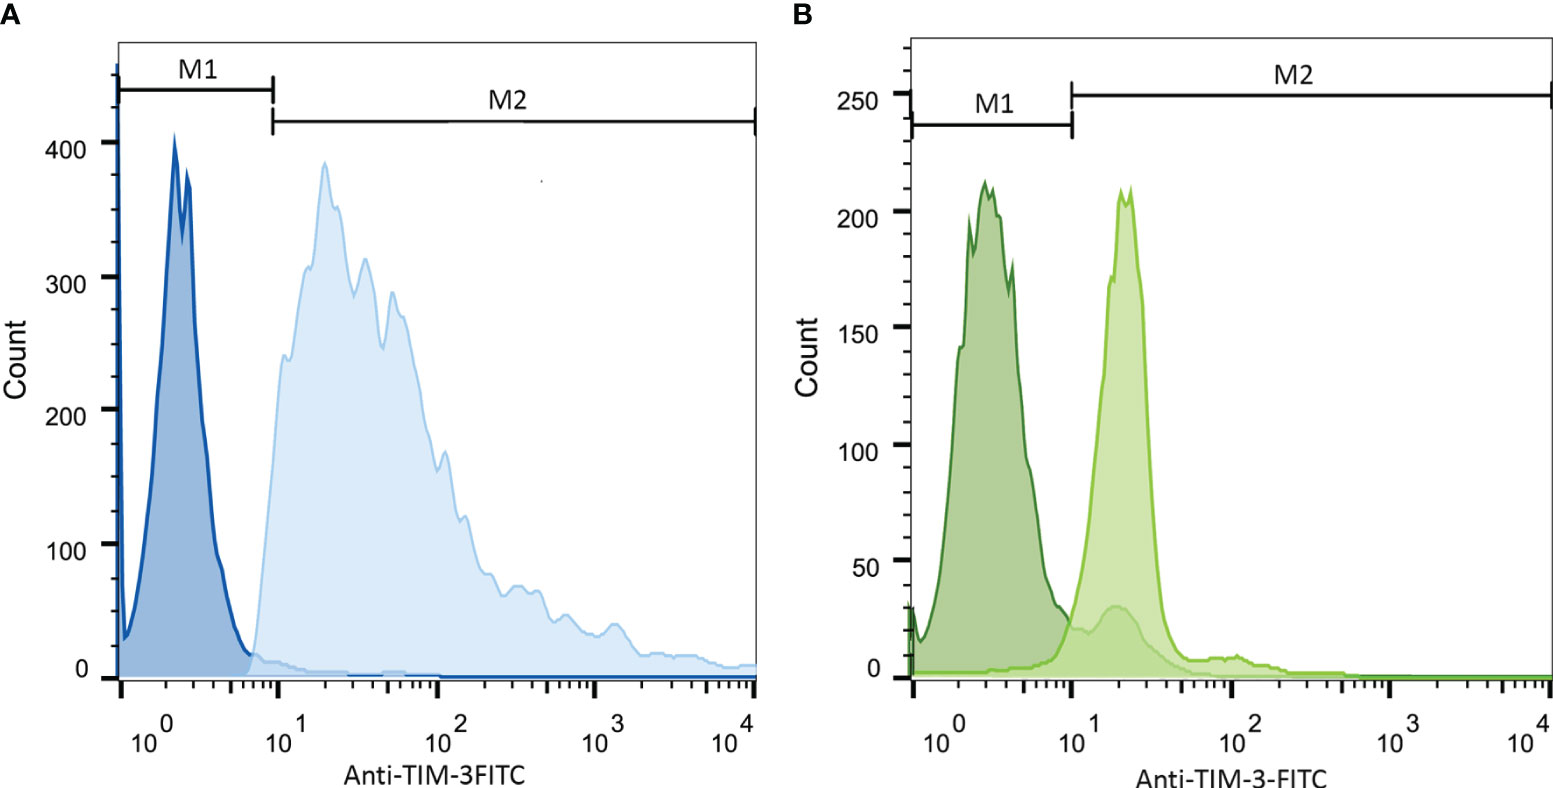
Figure 1 Increase in TIM-3 expression in HL-60 (A) and THP-1 (B) cell lines upon 24-h stimulation with PMA. Cells were incubated with 50 ng/mL/5 × 105 cells of PMA for 24 h. Then, staining with anti-TIM-3 antibody conjugated with FITC was obtained and the expression of TIM-3 in the stimulated group compared to the control group was analyzed. Both HL-60 (A) and THP-1 cell (B) lines showed increase in TIM-3 expression from 4% ( ± 1.2) to 71% ( ± 1.9)and from 21% ( ± 2.5) to 84% ( ± 3.2), respectively. The darker color represents the control group.
3.2 TIM-3/Gal-9 interaction stimulated glycolysis through upregulating the expression of GLUT-1, HK-2, and PFKFB-3 in AML cell lines in a time-dependent manner
To examine the role of TIM-3/Gal-9 interaction on glucose metabolism, we first analyzed the mRNA expression level of GLUT-1, HK-2, and PFKFB-3 in both cell lines. The same pattern of significant increase was observed for GLUT-1, HK-2, and PFKFB-3 in both studied cell lines. In the HL-60 cell line, the transcript levels of GLUT-1, HK-2, and PFKFB-3 were significantly increased after 24 h of treatment with Gal-9 and then decreased within 48 h and 72 h when compared to control and PMA groups (Table 2). In the THP-1 cell line, the expression of the same genes was significantly increased in all studied groups compared to the control and PMA groups, though the maximum increase was observed after 48 h of treatment with Gal-9. Also, the increase in mRNA expression level of PFKFB-3 is not significant after 72 h of treatment with Gal-9 compared to the PMA and control groups (Table 3, Figures 2A–F).
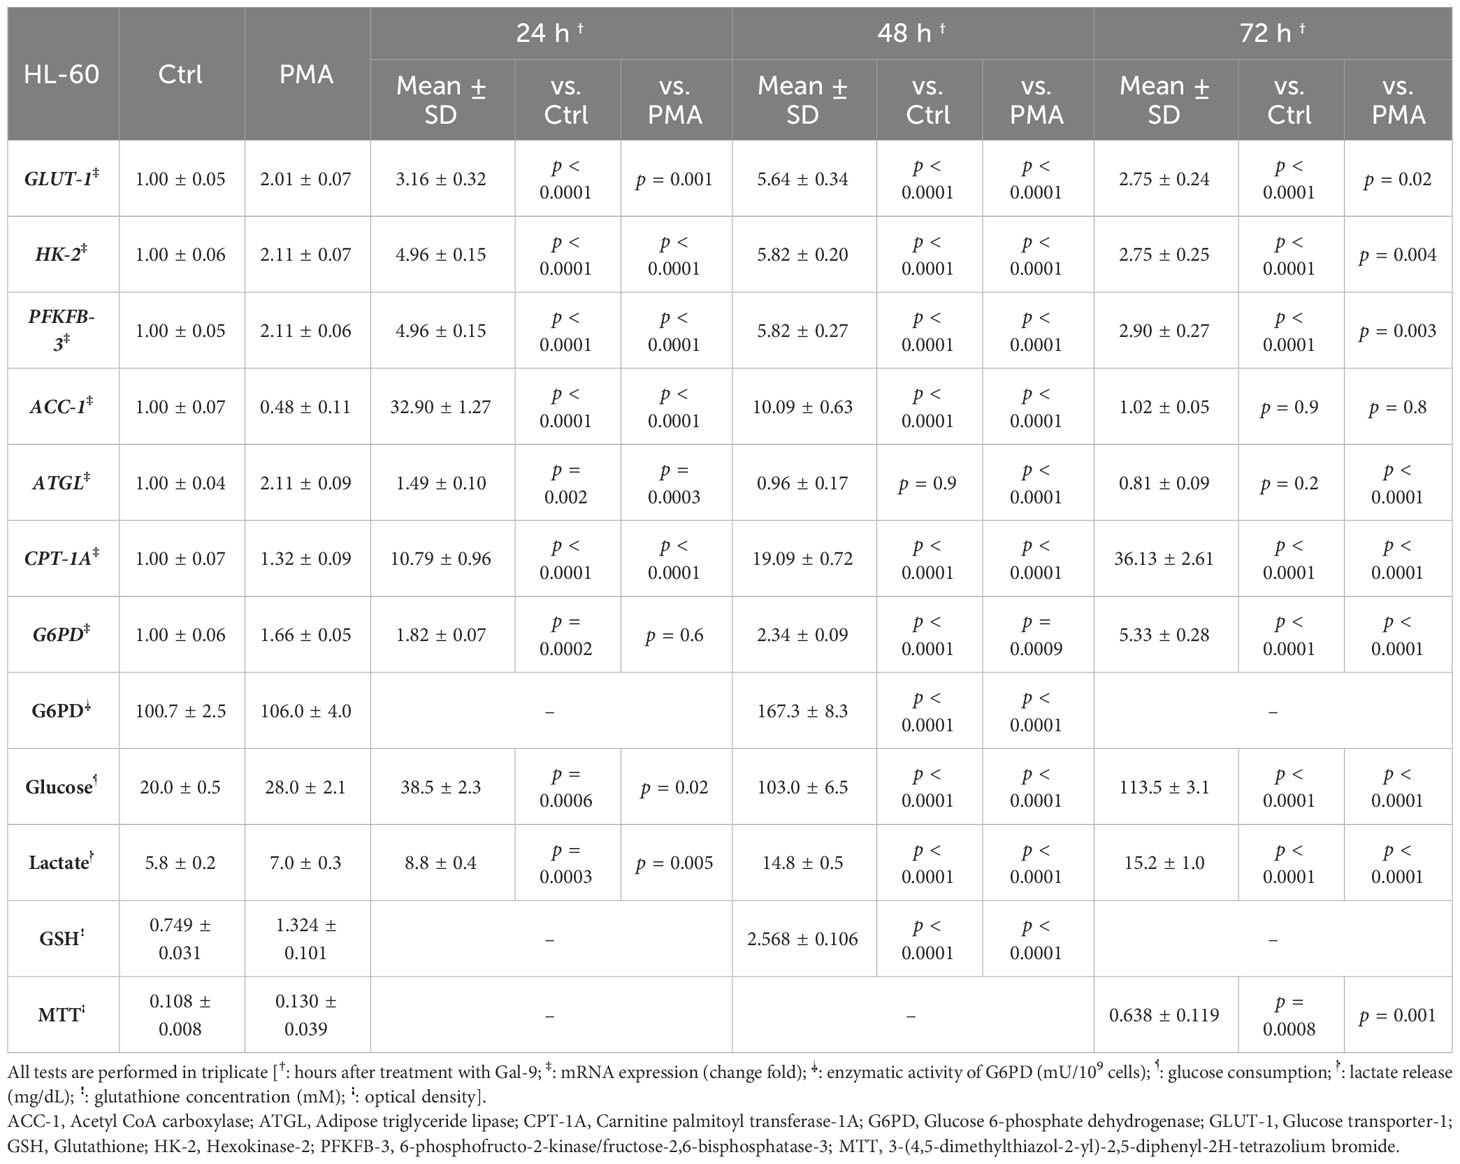
Table 2 Significance of the differences after 24 h, 48 h, and 72 h compared to the control group and PMA group in HL-60 cells.
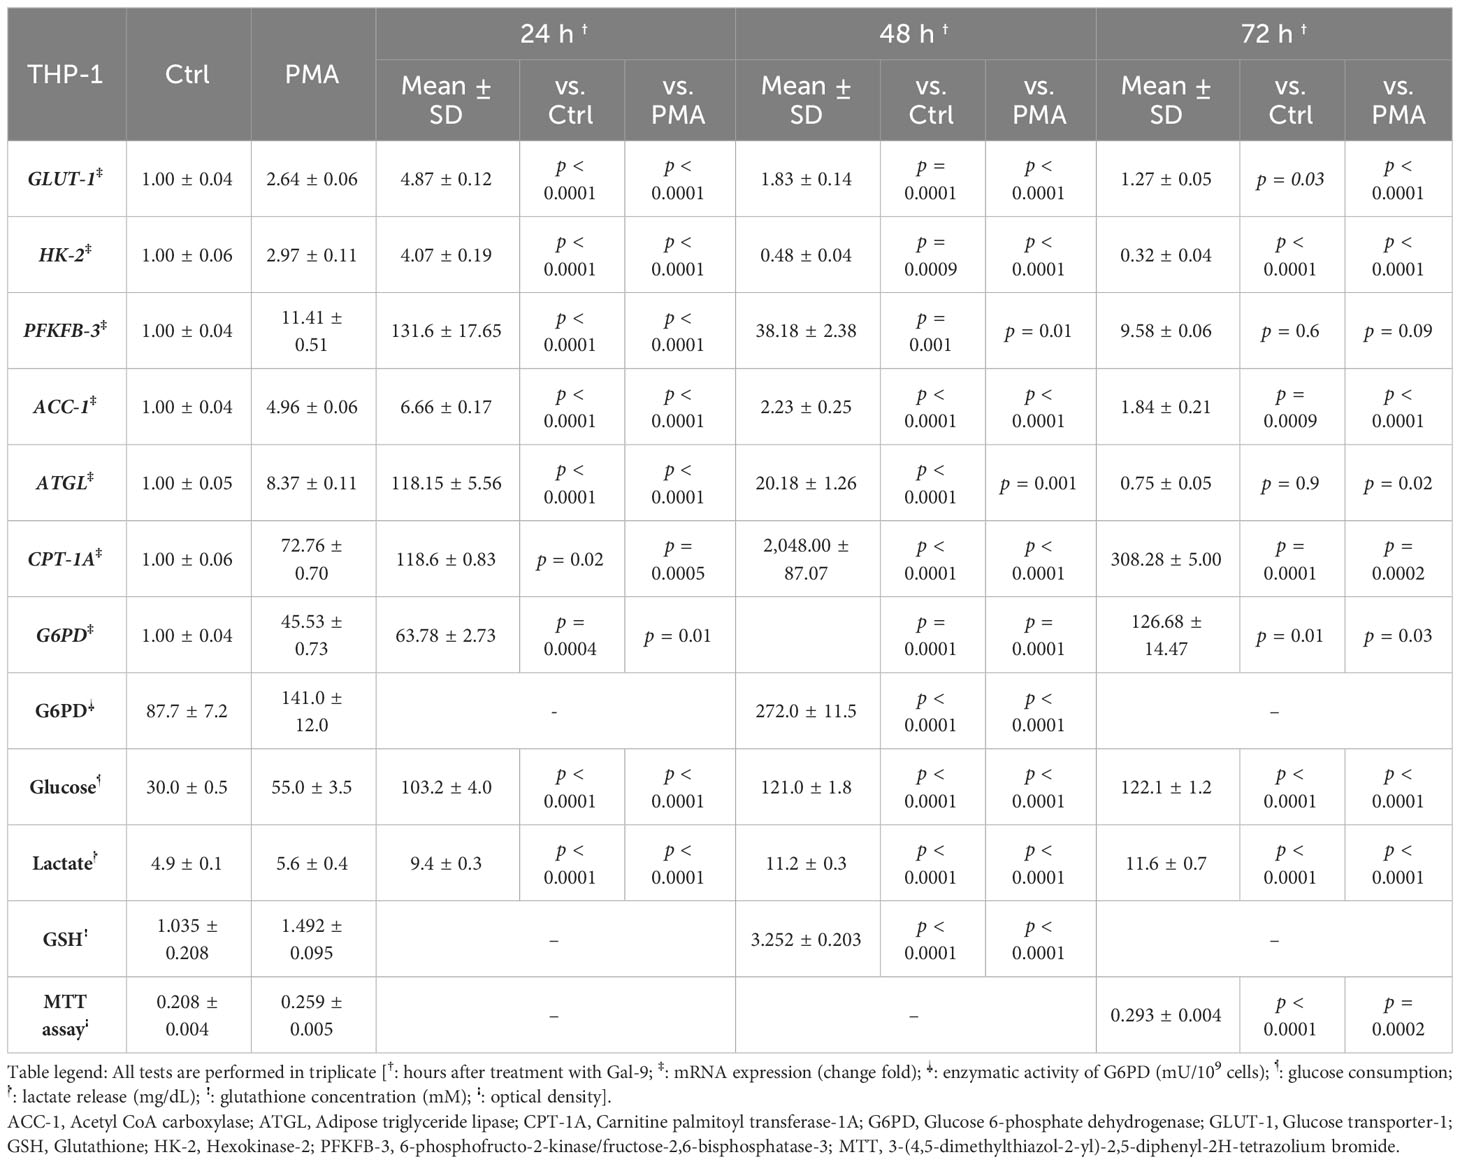
Table 3 Significance of the differences after 24 h, 48 h, and 72 h compared to the control group and PMA group in THP-1 cells.
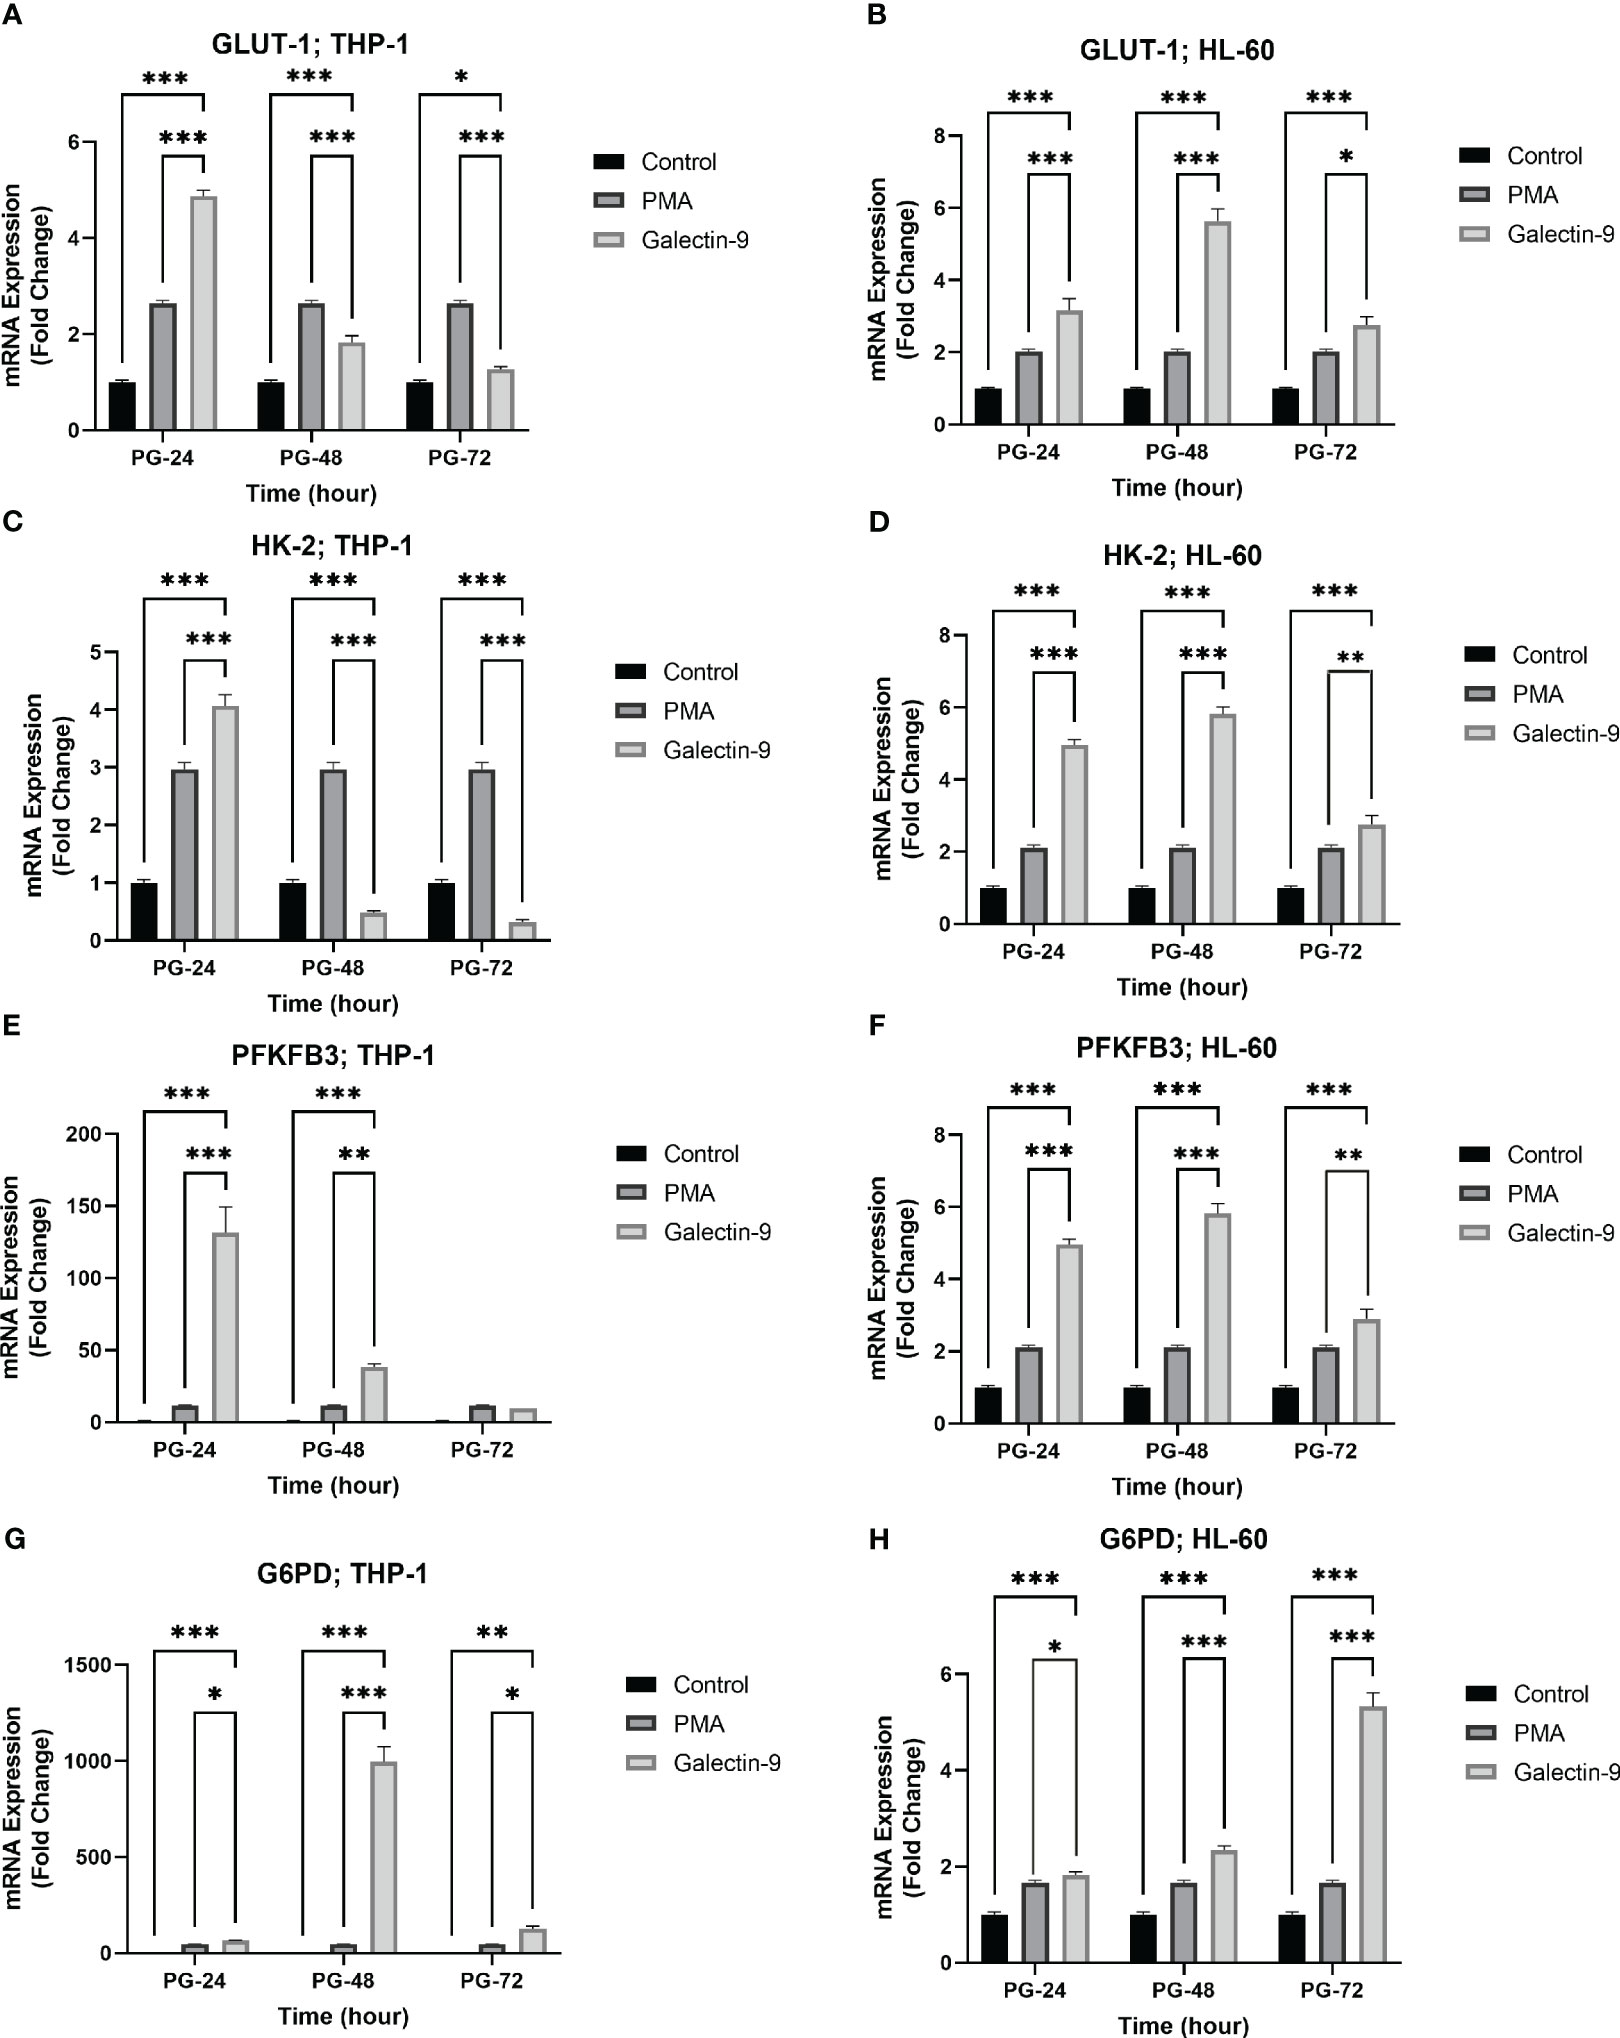
Figure 2 Increased mRNA expression of GLUT-1, HK-2, PFKFB-3, and G6PD in a time-dependent manner. The mRNA expression of GLUT-1, HK-2, and PFKFB-3 in the THP-1 cell line (A, C, E) was increased in the same time-dependent manner in the Gal-9 groups compared to the control and P-24 groups. A similar result was observed in the HL-60 cell line (B, D, F). Also, G6PD showed increased expression at the transcriptional level in both cell lines compared to the control and PMA group (G, H) (*p < 0.05, **p < 0.01, ***p < 0.001).
3.3 TIM-3/Gal-9 interaction results in an increase in glucose consumption and lactate release in AML cell lines
Next, we explored whether the upregulation of mRNA levels of GLUT-1, HK-2, and PFKFB-3 could lead to a significant increase in glucose consumption (the substrate of glycolysis) and lactate release (as the final product of glycolysis). Interestingly, a significant rising trend was observed in glucose consumption and lactate release within 72 h of the experiment compared to the control and PMA groups in both cell lines (Tables 2, 3, Figure 3).
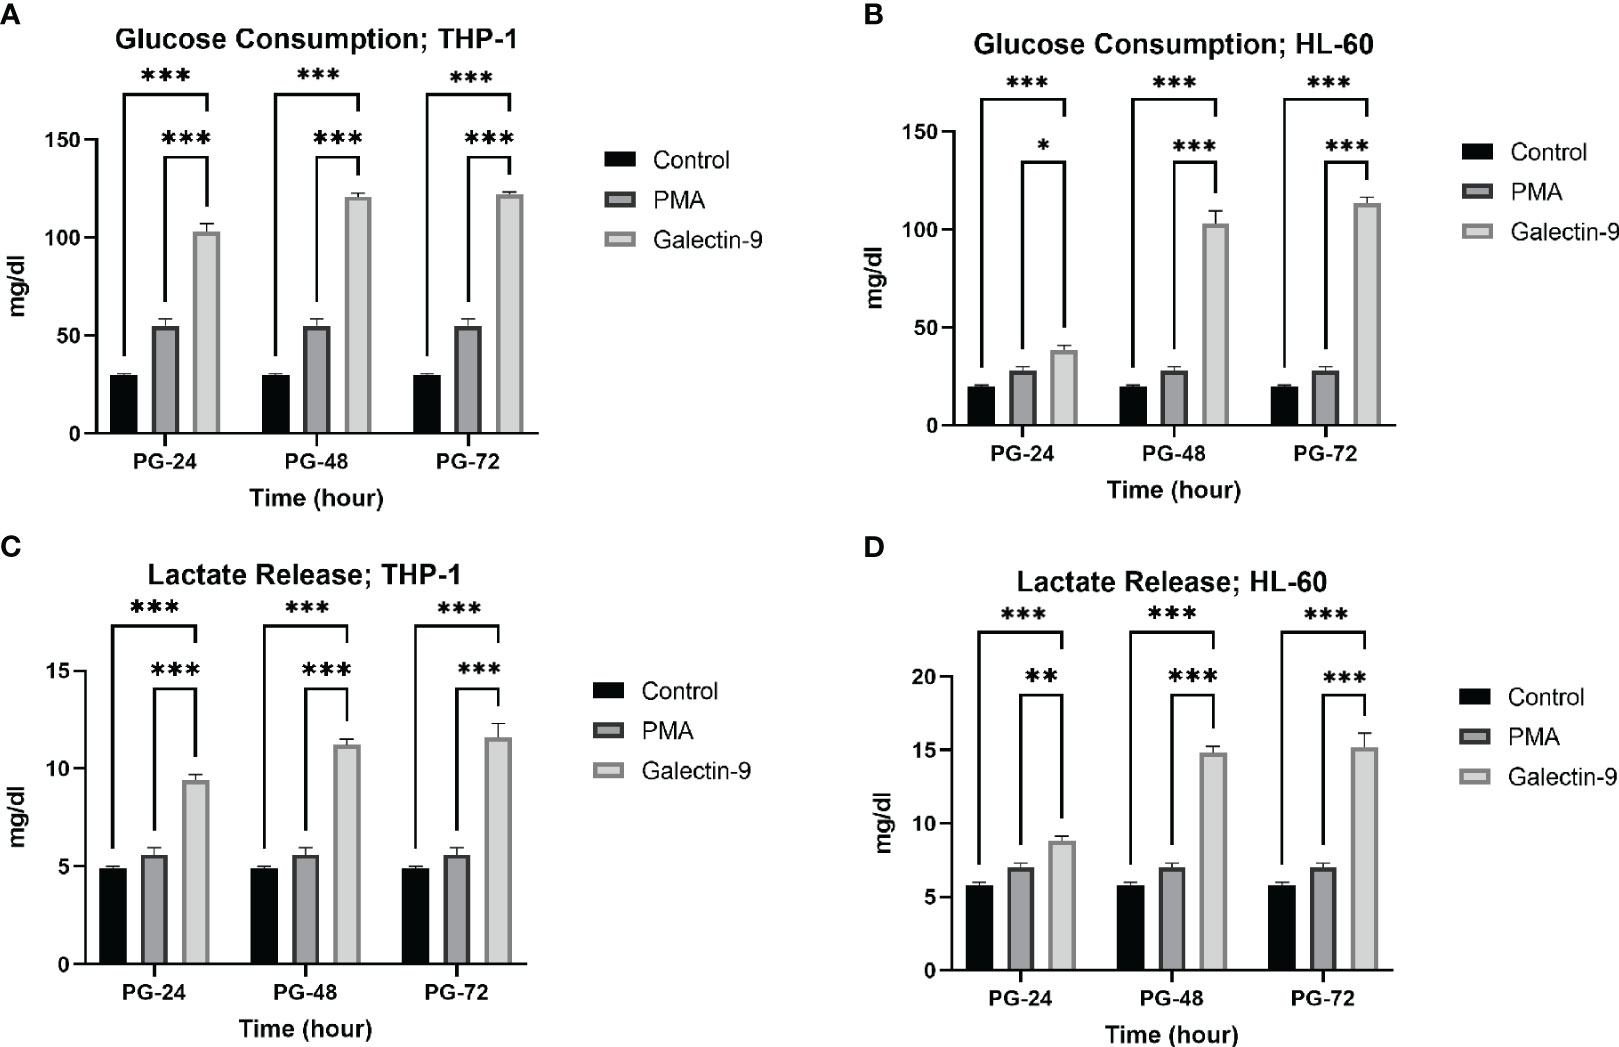
Figure 3 Increase in glucose consumption and lactate release. Glucose consumption (A, B) and lactate release (C, D) were increased in post-Gal-9 groups compared to the control and PMA group, and this increase is more significant over time in the HL-60 and THP-1 cell line (*p < 0.05, **p < 0.01, ***p < 0.001).
3.4 TIM-3/Gal-9 interaction can alter lipid metabolism in AML cell lines in a time-dependent manner
To investigate the influence of TIM-3/Gal-9 interaction on lipid metabolism, the mRNA levels of ACC-1, ATGL, and CPT-1A in test groups compared to the control and PMA groups in both HL-60 and THP-1 cell lines were measured. The transcript level of ACC-1 in the THP-1 cell line was significantly increased 24 h post-treatment with Gal-9 in comparison to the PMA and control groups (Table 3). Significant upregulation was also observed in the HL-60 cell line after 24 and 48 h of treatment with Gal-9 compared to the control group and PMA group, with the maximum elevation at 24 h post-treatment with Gal-9 (Table 3, Figures 4A, B).
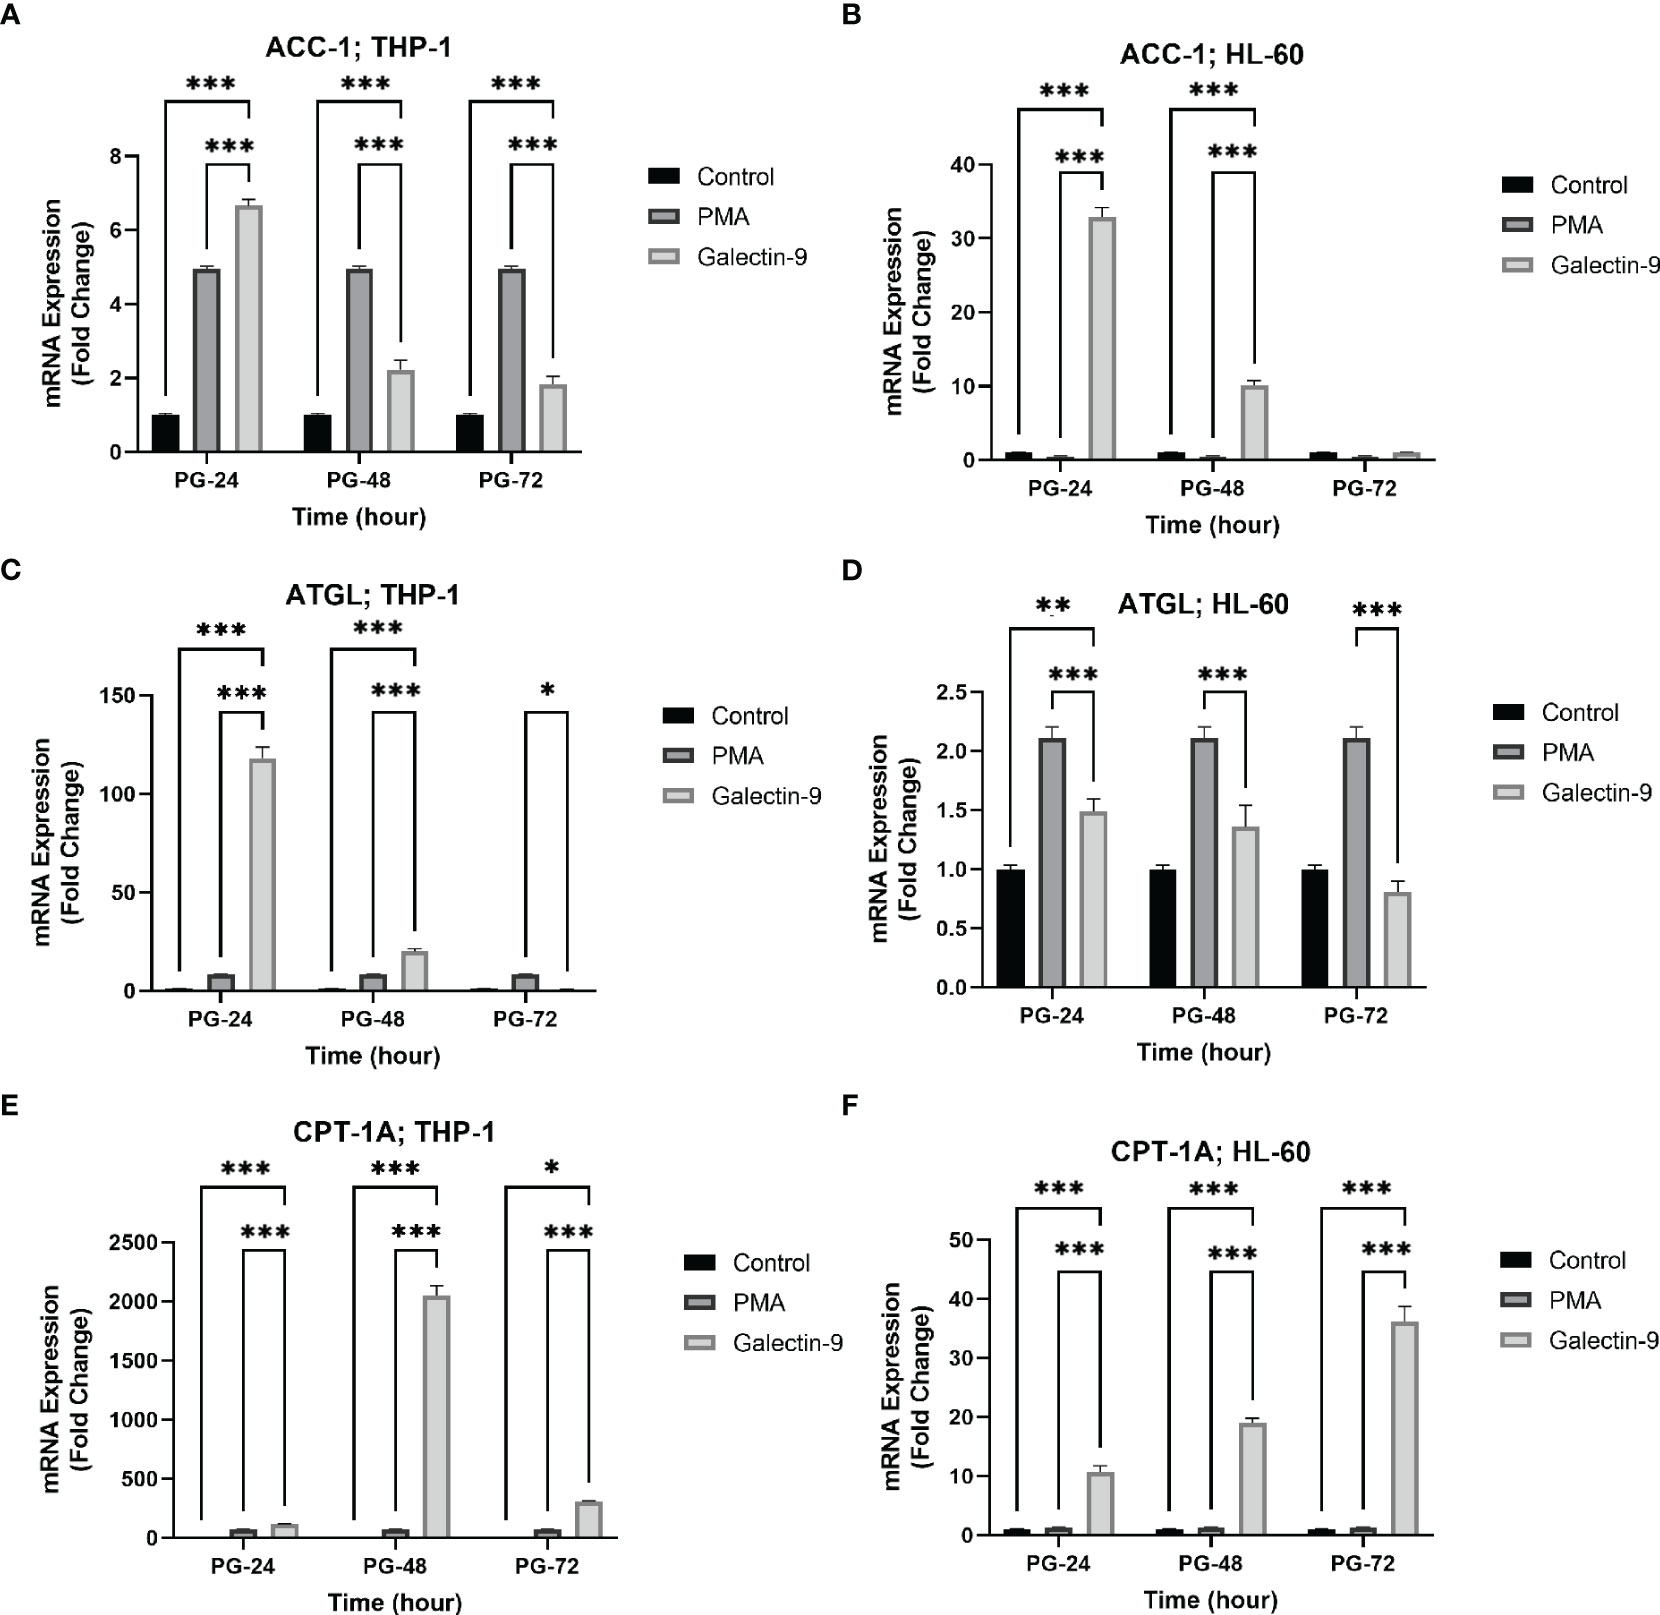
Figure 4 Increased mRNA expression of ACC-1, ATGL, and CPT-1A in a time-dependent manner. The mRNA expression of ACC-1 was increased in a time-dependent manner in the presence of Gal-9 compared to PMA and the control group in both cell lines (A, B). The mRNA expression of ATGL was increased in Gal-9 groups compared to the PMA and control group in THP-1 (C); however, the decrease and increase pattern of this enzyme in Gal-9 groups compared to the PMA and control groups in the HL-60 cell line seems to be impressed by PMA stimulation, as it decreased at 72 h (D). The mRNA expression of CPT-1A (E, F) was increased in a time-dependent manner in Gal-9 groups compared to the PMA and control groups in both cell lines (*p < 0.05, **p < 0.01, ***p < 0.001).
The transcript level of ATGL in the THP-1 cell line was increased for 48 h, with the maximum increase in the first 24 h (Table 3). For the HL-60 cell line, 24 h after treatment, the mRNA level of ATGL was significantly increased in comparison to the control group but showed a significant decrease compared to the PMA group. Meanwhile, a significant decrease was also observed at 48 and 72 h post-treatment with Gal-9 compared to the PMA group (Table 2). Thus, TIM-3/Gal-9 interaction in the HL-60 cell line led to downregulation of ATGL expression (Figures 4C, D).
The mRNA level of CPT-1A was significantly increased in all test groups compared with the control and PMA group. The maximum elevation in the THP-1 cell line was observed at 48 h post-treatment with Gal-9, while the upregulated expression still followed a rising trend in HL-60 for 72 h (Tables 2, 3, Figures 4E, F).
Furthermore, we analyzed the relative abundance of free fatty acids in the supernatant of cell cultures 48 h after treatment with Gal-9, which showed the most significant alteration in comparison to the control and PMA group in both cell lines. The percentage of long-chain FFAs in the supernatant was significantly increased in the test group compared to the control and PMA group in the HL-60 cell line. However, in the THP-1 cell line, the percentage of long-chain fatty acids was significantly decreased compared to the control group but significantly increased compared to the PMA group as PMA led to a more significant decrease in FFAs than Gal9 (Figure 5, Tables 4, 5).
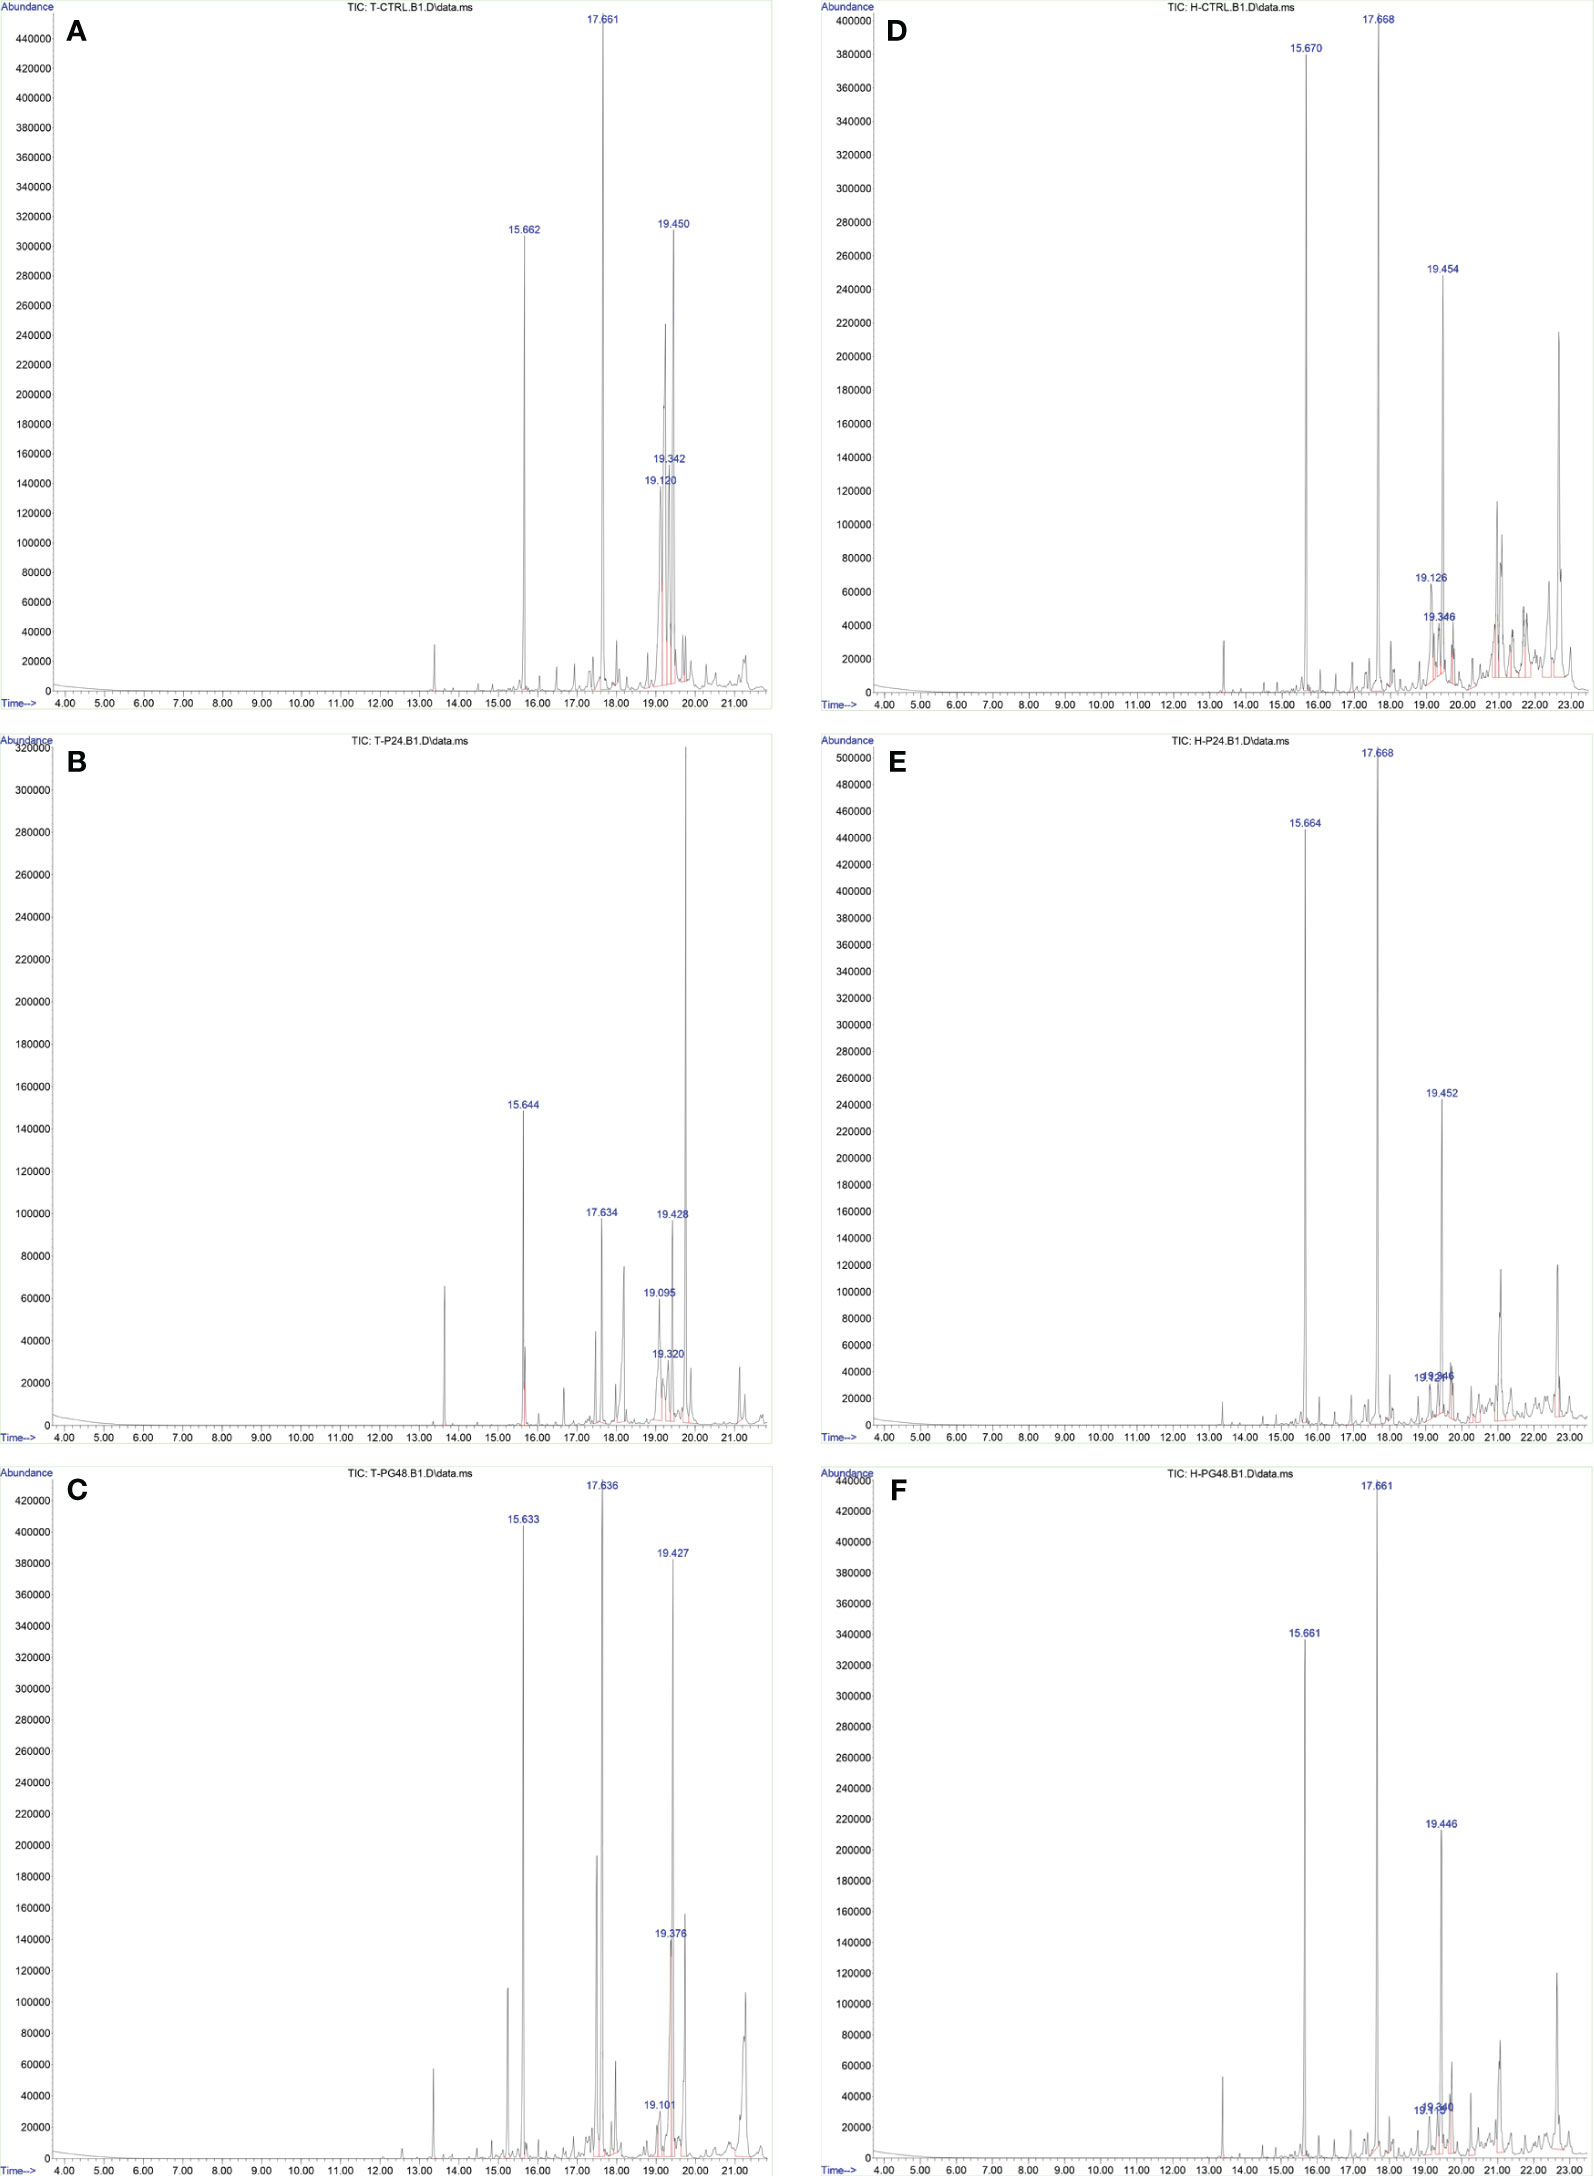
Figure 5 Increase of the percentage of FFAs 48 h after Gal-9 treatment. The relative abundance of FFAs (t = 15.6, methyl myristate; t = 17.6, methyl palmitate; t = 19.1, methyl oleate; t = 19.3, stearate; t = 19.4, methyl stearate) was increased 48 h after treatment with Gal-9 [THP-1: (C), HL-60: (F)] compared to the PMA [THP-1: (B), HL-60: (E)] and control [THP-1: (A), HL-60: (D)].
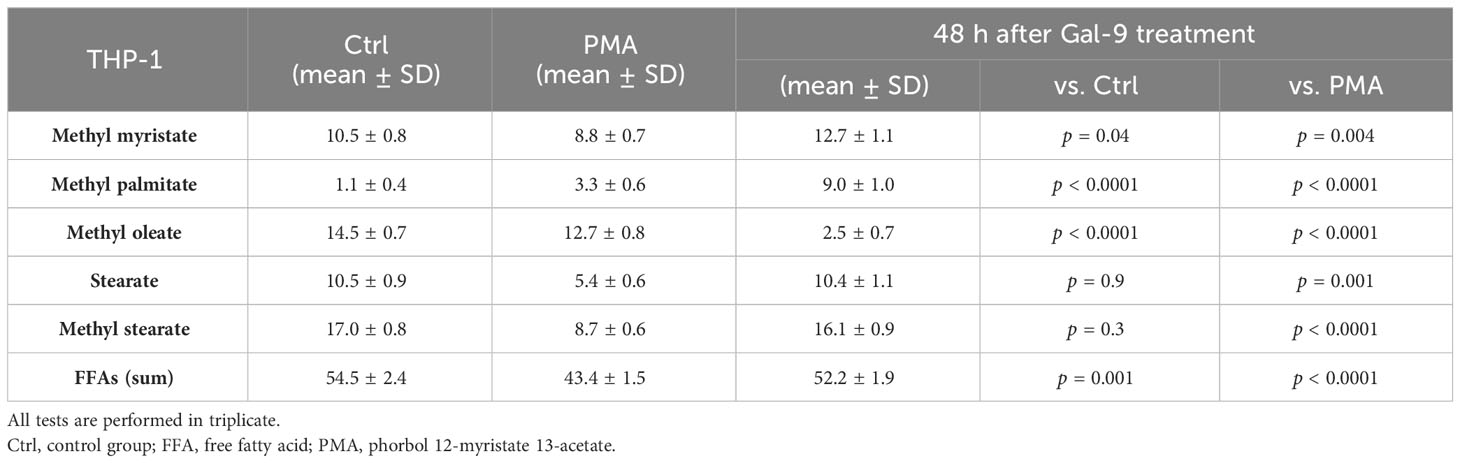
Table 4 The results of gas chromatography–mass spectrometry (GC-MS) analysis of the supernatant of THP-1 cells in percentage.
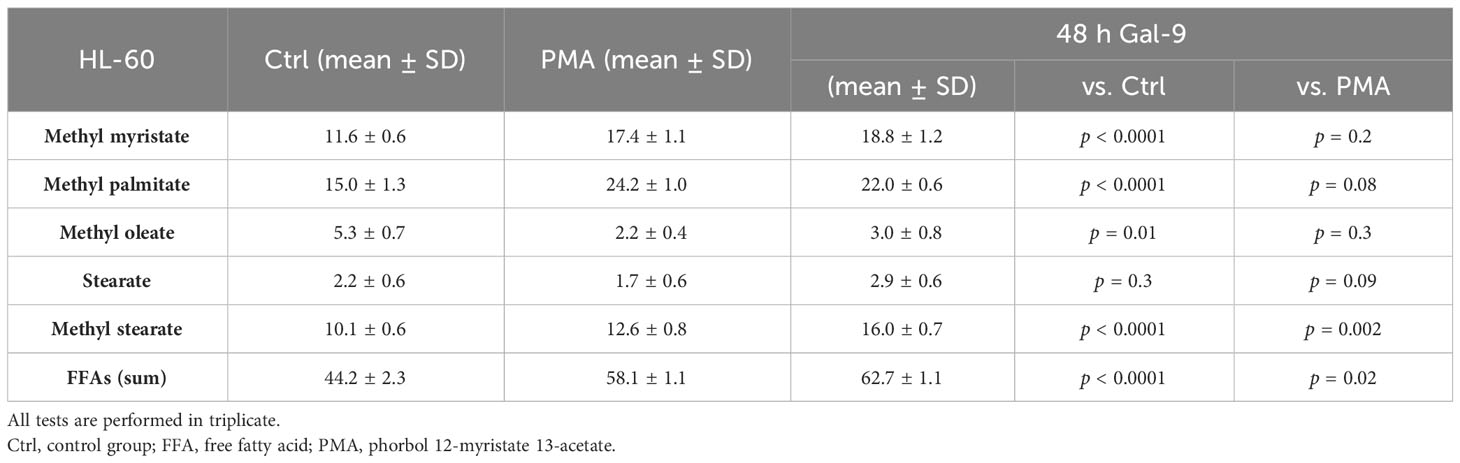
Table 5 The results of GC-MS analysis of the supernatant of HL-60 cells in percentage.
3.5 TIM-3/Gal-9 interaction can protect AML cell lines from oxidative stress by upregulation of G6PD expression and glutathione concentration
In order to explore the potential role of TIM-3 in protecting AML cells from oxidative stress, we analyzed the mRNA level and enzymatic activity of G6PD and the concentration of GSH in test groups in comparison to the control and PMA groups. We observed significant elevation in G6PD expression after 24 h of treatment with Gal-9 compared to the control group and after 48 and 72 h of treatment with Gal-9 compared to the control and PMA group in both cell lines. The maximum increase was observed at 48 h after treatment with Gal-9 in THP-1, while the rising trend of G6PD mRNA level continued for 72 h (Figures 2G, H). Analysis of the enzymatic activity of G6PD and the GSH concentration showed a significant increase at 48 h post-treatment with Gal-9 in comparison to the control and PMA group in both HL-60 and THP-1 cell lines (Tables 2, 3, Figures 6, 7).
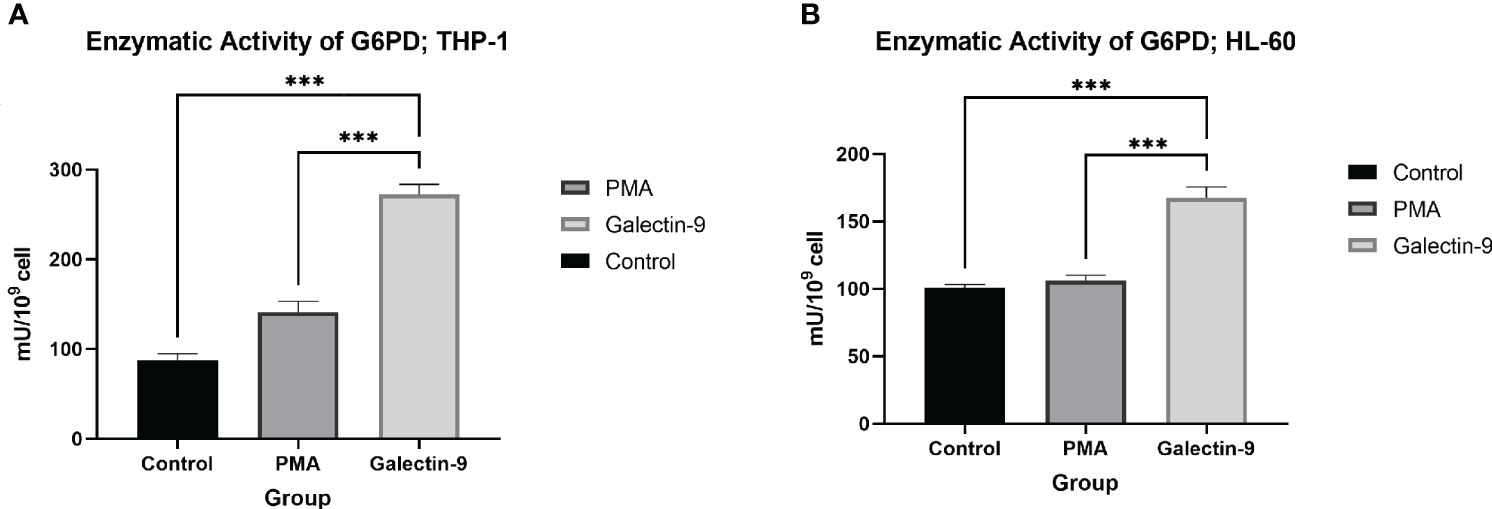
Figure 6 Increase in enzymatic activity of G6PD 48 h after Gal-9 treatment. The enzymatic activity of G6PD was elevated at 48 h after treatment with Gal-9 compared to the PMA and control group in both the THP-1 (A) and HL-60 (B) cell lines (***p < 0.001).
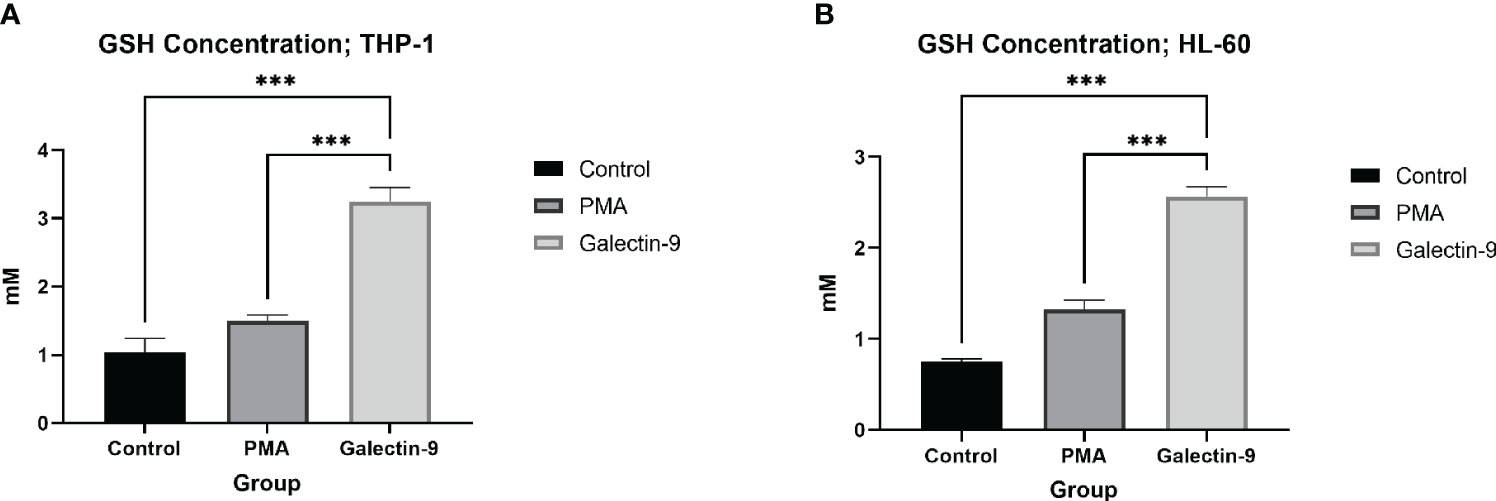
Figure 7 Elevation of GSH concentration 48 h after Gal-9 treatment. The concentration of GSH was increased at 48 h after treatment with Gal-9 compared to the PMA and control group in both the THP-1 (A) and HL-60 (B) cell lines (***p < 0.001).
3.6 TIM-3/Gal-9 interaction promotes cell proliferation in AML cell lines
In order to conclude the effects of TIM-3/Gal-9 interaction on AML cell lines, we performed an MTT test on cells 72 h after treatment with Gal-9 in comparison to the PMA and control group. Cell proliferation in the Gal-9 group was significantly higher than that of the PMA and control group in both HL-60 and THP-1 cell lines (Tables 2, 3, Figure 8).
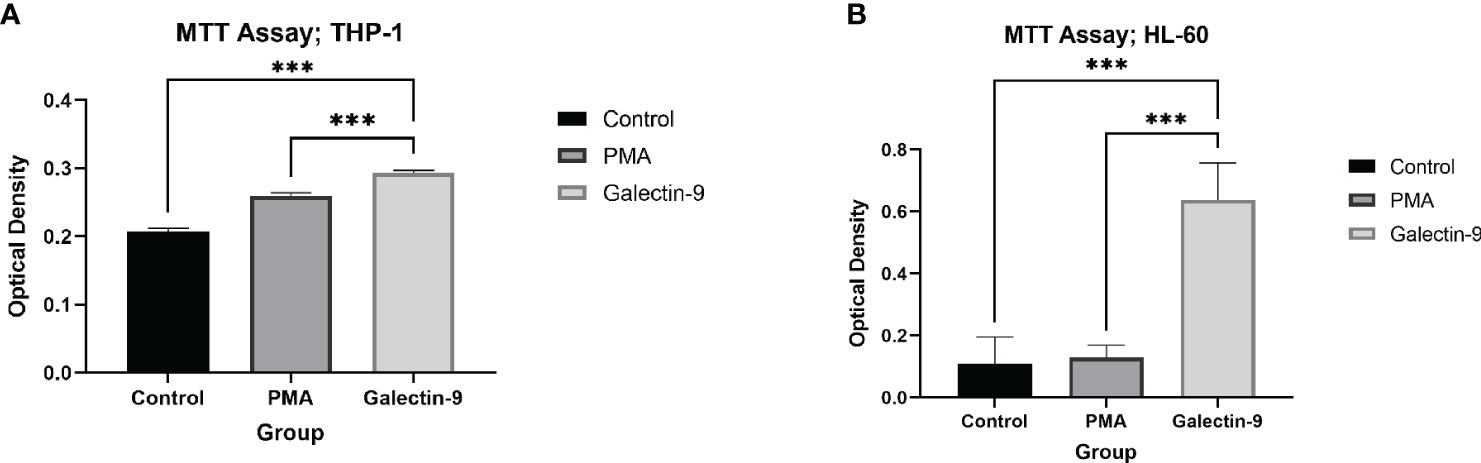
Figure 8 Increase in proliferation. The measured optical density in the MTT test, as a marker of proliferation and/or survival was elevated at 72 h after treatment with Gal-9 compared to the PMA and control group in both the THP-1 (A) and HL-60 (B) cell lines (***p < 0.001).
4 Discussion
Several therapeutic approaches in AML are focused on metabolic pathways, as the proliferation and survival of leukemic cells are extremely dependent on metabolic reprogramming, especially the alterations in glucose and lipid metabolism (27). The abnormal expression of TIM-3 on leukemic cells and LSCs in AML is associated with cellular proliferation and survival, and might also be correlated with chemoresistance (36). Furthermore, there are two more recent studies on T cells and macrophages revealing that TIM-3 has a direct role in controlling glucose metabolism. As metabolic inhibitors are among the promising therapies for AML, and several clinical trials are exploring the effect of TIM-3 blockade in AML patients, we investigated the role of TIM-3 on glucose and lipid metabolism in two AML cell lines.
In the present study, we observed that TIM-3/Gal-9 interaction could consistently promote the elevation of glucose consumption and lactate release in both HL-60 and THP-1 cell lines. Analyzing the expression of GLUT-1, HK-2, and PFKFB-3 showed that TIM-3 controls aerobic glycolysis by affecting the expression of these proteins. This is in line with the metabolic profile of glucose in AML, and the reduced proliferation in the presence of glycolysis inhibitors in leukemic cells (37–40). Apparently, the glycolytic pattern is associated with chemoresistance and high levels of mTORC1, and its activation following TIM-3/Gal-9 ligation has been reported previously (2, 3, 12, 40–42). Furthermore, HL-60 is known to be less glycolytic compared to other AML cell lines, including THP-1 (38); the lower expression of TIM-3 on the M-3 subtype of AML may be the cause. More interestingly, the metabolic profile was shown to be restricted in a time-dependent manner, as the increase in GLUT-1, HK-2, and PFKFB-3 followed an uprising trend for 48 h in HL-60 and 24 h in THP-1 (the different pattern is probably related to the heterogeneous nature of AML). This is in line with the glycolytic pattern of several immune cells upon activation, in which the Warburg effect is considered a hallmark (activated Th1 cells, CD8+ cytotoxic T cells, natural killer cells, and myeloid cells like dendritic cells and M1 macrophages) (43–59). Lee et al. studied the relationship between TIM-3 expression and glucose metabolism in Jurkat T cells and reported that glucose consumption, lactate release, and GLUT-1 expression were decreased by TIM-3 overexpression and increased by TIM-3 knockout (60). Zhang et al. revealed that TIM-3 can prevent glycolysis in the RAW 264.7 macrophage cell line through downregulation of HK-2 expression (61). These are contrary to our results. However, considering the diverse roles of TIM-3 in different cells (62), this issue is not surprising anymore, though obviously the binary behavior of TIM-3 is still a mystery requiring more investigation to be figured out. Regarding lipid metabolism, a significant elevation in the expression of ACC-1 in both cell lines, particularly in HL-60, within 24 h of treatment with Gal-9 was observed in our study. Though the expression declined at 48 and 72 h after Gal-9 treatment, it was no longer significant in the HL-60 cell line after 72 h of treatment. De novo FAS is not limited to liver and adipocytes, as this pathway is restored in malignancies and elevation of ACC-1 is considered as a cancer hallmark (22–25, 63–68). Also, switching to FAS and upregulated ACC-1 upon DC activation and M1 macrophage polarization has been reported previously (44–49, 51–53, 55, 59). The upregulation of FASN has been previously reported in the HL-60 cell line compared to healthy groups by Pizer et al. (68), though Southam et al. did not observe a significant increase in ACC-1 expression in the K562 (another AML cell line) or HL-60 cell line (26). We observed the significant upregulation of ACC-1 as a result of increased TIM-3 and in the presence of its ligand, Gal-9. On the other hand, the expression of ACC-1 in AML is not well studied yet. Considering the heterogeneous nature of this hematologic malignancy, examining the expression of FASN and analyzing intracellular fatty acids can help understand FAS in AML in the future.
The expression of ATGL in THP-1 was significantly increased within 48 h after treatment with Gal-9, with the most elevation within the first 24 h. In HL-60, the upregulation of ATGL within 24 and 48 h after Gal-9 treatment compared to the control group appears to be relevant to PMA, since the expression of ATGL is significantly decreased in comparison with the PMA group. Considering the heterogeneous nature of AML (69–71), which resulted in different expression patterns in THP-1 and HL-60 cell lines, and the sharp effect of PMA on the expression of ATGL, studying the role of TIM-3 on lipolysis requires a different study design, such as examining overexpressed or knocked-out cells.
The expression of CPT-1A was significantly elevated in both cell lines after treatment with Gal-9 in comparison to control groups; this increase was remarkably higher in THP-1. The dependence of AML cells, particularly LSCs, on high levels of FAO has been declared previously (16). This reliance is probably due to the high proficiency of FAO in balancing oxidative stress (17–19), which is the same as the physiological prolonged survival rate in immune memory cells (72, 73). Previous studies introduced CPT-1A as a target for therapy as its upregulation was associated with the worst clinical outcome in AML (20, 21). Also, Samudio et al. demonstrated that inhibition of CPT-1A results in enhanced sensitivity to cytotoxic agents in AML cells, probably based on the role of FAO in controlling mitochondrial permeability dependent on B-cell lymphoma 2 antagonist/killer (BAK) (74). After all, it can be concluded that in the HL-60 cell line, the fatty acid synthesis (FAS) pathway is activated at first, since the upregulation of ACC-1 was more significant in the first 24 h after the intervention and the FFA analysis showed a significant increase at 48 h after treatment with Gal-9. Later, as ACC-1 declined, CPT-1A was upregulated in an increasing trend for 72 h post-treatment with Gal-9, showing that FAS is replaced with FAO. Meanwhile, the THP-1 cell line showed a sharp increase in CPT-1A within 24 and 48 h after treatment with Gal-9. Although this increased expression did not ascend in the last 24 h of our study, CPT-1A does not allow the slight upregulation of ACC-1 in the first 2 days to elevate FFAs to the base level, as FFAs after 48 h treatment with Gal-9 significantly decreased compared to the control group. Overall, we observed that FAO was dominant as a result of TIM-3/Gal-9 interaction in THP-1 cells, even though it did not affect intracellular FFAs within 48 h after the intervention. Moreover, since we confirmed the upregulation of CPT-1A as a result of TIM-3/Gal-9 interaction in AML cell lines in this study, it might be interesting to examine whether TIM-3 is relevant to CD36 (an FA transporter)-positive LSCs, as these cells seem to represent an extraordinary metabolic profile with elevated FAO (75, 76).
Another interesting finding in our study was the elevation of FFAs (methyleC14-methylC18) in the supernatant from the cell culture after 48 h of treatment with Gal-9 compared to control groups. Moreover, the relative abundance of palmitate and oleate was increased after 48 h of treatment, but not significantly. To date, there are no reports on the FFAs that AML cells produce and release to the cell niche and we cannot be sure whether this incident occurs in vivo or whether it was observed due to in vitro conditions. A rational question concerning the significant elevation of the relative abundance of FFAs in the supernatant of cell culture is “For what purpose do leukemic cells produce them?”. Reviewing current knowledge on fatty acids, palmitate is one of the agonists of toll-like receptors; therefore, it can actively promote immune response (77). While the production of oleate can save cells from harmful saturated fatty acids (26), oleate might be able to show anti-inflammatory roles in some contexts (78). However, we could not measure the concentration of each free fatty acid or fatty acid methyl ester, and considering their probable role in preventing immune response, more study in this area is required. Furthermore, since in vivo LSCs directly interact with bone marrow niche and cells and not only affect them but also are affected by them, co-culturing AML cells with bone-marrow-derived adipocytes and assessing the effect of TIM-3/Gal-9 interaction on leukemic cells and adipocytes can be a subject of interest.
TIM-3/Gal-9 interaction can considerably help HL-60 and THP-1 cells to confront oxidative stress. The expression of G6PD was significantly elevated in both cell lines in the presence of Gal-9. The uprising trend was consistent within 72 h in HL-60, while the maximum increase in THP-1 was 48 h after treatment with Gal-9. Also, the upregulation observed in THP-1 cells was more considerable compared to HL-60 cells, referring to their different sources. Furthermore, we observed a significant increase in enzymatic activity of G6PD after 48 h of treatment with Gal-9 compared to control groups in both cell lines, attributed to the upregulation of this enzyme in the protein level as well. This is in line with previous studies on malignancies as the upregulation of G6PD in cancers has been discussed frequently (79). Also, this enzyme can be considered as a target for therapy, since inhibition of G6PD in AML results in cell cycle arrest or cell death and increased sensitivity in chemotherapeutic agents (80, 81). In the same context, we observed a significant elevation in the concentration of intracellular GSH. Previous studies showed that AML cells are dependent on extracellular cysteine to produce enough GSH to meet their excessive demand (14). In the same line, Pei et al. demonstrated that primary AML cells are intensively reliable on GSH as any disruption in GSH metabolism is not tolerable (15). Further investigations to reveal the role of GSH in AML relapse are the subject of interest of an ongoing project as well.
In conclusion, the present study revealed that TIM-3/Gal-9 interaction induces metabolic reprogramming in AML in a time-dependent manner, which is probably activated following the PI3K/Akt/mTOR and ERK signaling pathway. Stimulating the glucose and lipid metabolism in AML is probably one of the underlying mechanisms that adjust the role of TIM-3 in AML malignant cell’s survival and higher levels of proliferation, which made TIM-3 a promising target for therapy. This study is a step forward in defining the explicit role of TIM-3 in the pathogenesis of malignancies as well as the behavior of immune cells. Further investigation is required, not only for all the questions that remained unanswered in our limited study (such as the probable role of TIM-3 in lipolysis in the HL-60 cell line, the role of TIM-3 in other aspects of glucose and lipid metabolism, or the effect of TIM-3 on other metabolic pathways), but also to clarify the effect of TIM-3 on the metabolism of other immune cells, other AML subtypes, and primary AML cells, as well as in a co-culture system with other cells (to recreate the bone marrow microenvironment and cellular interactions) and in vivo models and clinical studies.
Data availability statement
The original contributions presented in the study are included in the article/supplementary material. Further inquiries can be directed to the corresponding author.
Ethics statement
Ethical approval was not required for the studies on humans in accordance with the local legislation and institutional requirements because only commercially available established cell lines were used. Ethical approval was not required for the studies on animals in accordance with the local legislation and institutional requirements because only commercially available established cell lines were used.
Author contributions
MR: Conceptualization, Formal Analysis, Investigation, Writing – original draft, Writing – review & editing. MG: Investigation, Methodology, Writing – review & editing. BG: Investigation, Methodology, Writing – review & editing. AS: Conceptualization, Writing – review & editing. AB: Conceptualization, Writing – review & editing. AZ: Conceptualization, Writing – review & editing. MG-H: Conceptualization, Formal Analysis, Funding acquisition, Supervision, Writing – review & editing.
Funding
The author(s) declare financial support was received for the research, authorship, and/or publication of this article. This study was supported by Isfahan University of Medical Sciences (Grant number: 3991067).
Conflict of interest
The authors declare that the research was conducted in the absence of any commercial or financial relationships that could be construed as a potential conflict of interest.
The author(s) declared that they were an editorial board member of Frontiers, at the time of submission. This had no impact on the peer review process and the final decision.
Publisher’s note
All claims expressed in this article are solely those of the authors and do not necessarily represent those of their affiliated organizations, or those of the publisher, the editors and the reviewers. Any product that may be evaluated in this article, or claim that may be made by its manufacturer, is not guaranteed or endorsed by the publisher.
Footnotes
- ^ American Type Culture Collection-THP-1 [Internet]. Available from: https://www.atcc.org/products/tib-202, American Type Culture Collection-HL-60 [Internet]. Available from: https://www.atcc.org/products/ccl-240
References
1. Kantarjian H, Kadia T, DiNardo C, Daver N, Borthakur G, Jabbour E, et al. Acute myeloid leukemia: current progress and future directions. Blood Cancer J (2021) 11(2):41. doi: 10.1038/s41408-021-00425-3
2. Song K, Li M, Xu X, Xuan L, Huang G, Liu Q. Resistance to chemotherapy is associated with altered glucose metabolism in acute myeloid leukemia. Oncol Lett (2016) 12(1):334–42. doi: 10.3892/ol.2016.4600
3. Song K, Li M, Xu XJ, Xuan L, Huang GN, Song XL, et al. HIF-1α and GLUT1 gene expression is associated with chemoresistance of acute myeloid leukemia. Asian Pacific J Cancer Prev (2014) 15(4):1823–9. doi: 10.7314/APJCP.2014.15.4.1823
4. Sun L-Y, Li X-J, Sun Y-M, Huang W, Fang K, Han C, et al. LncRNA ANRIL regulates AML development through modulating the glucose metabolism pathway of AdipoR1/AMPK/SIRT1. Mol Cancer. (2018) 17(1):1–6. doi: 10.1186/s12943-018-0879-9
5. Ju HQ, Zhan G, Huang A, Sun Y, Wen S, Yang J, et al. ITD mutation in FLT3 tyrosine kinase promotes Warburg effect and renders therapeutic sensitivity to glycolytic inhibition. Leukemia. (2017) 31(10):2143–50. doi: 10.1038/leu.2017.45
6. Hughes JM, Legnini I, Salvatori B, Masciarelli S, Marchioni M, Fazi F, et al. C/EBPα-p30 protein induces expression of the oncogenic long non-coding RNA UCA1 in acute myeloid leukemia. Oncotarget. (2015) 6(21):18534. doi: 10.18632/oncotarget.4069
7. Zhang Y, Liu Y, Xu X. Knockdown of LncRNA-UCA1 suppresses chemoresistance of pediatric AML by inhibiting glycolysis through the microRNA-125a/hexokinase 2 pathway. J Cell Biochem (2018) 119(7):6296–308. doi: 10.1002/jcb.26899
8. Jin F, Wang Y, Zhu Y, Li S, Liu Y, Chen C, et al. The miR-125a/HK2 axis regulates cancer cell energy metabolism reprogramming in hepatocellular carcinoma. Sci Rep (2017) 7(1):1–12. doi: 10.1038/s41598-017-03407-3
9. Kaushik S, Cuervo AM. Chaperone-mediated autophagy: a unique way to enter the lysosome world. Trends Cell Biol (2012) 22(8):407–17. doi: 10.1016/j.tcb.2012.05.006
10. Xia H, Najafov A, Geng J, Galan-Acosta L, Han X, Guo Y, et al. Degradation of HK2 by chaperone-mediated autophagy promotes metabolic catastrophe and cell death. J Cell Biol (2015) 210(5):705–16. doi: 10.1083/jcb.201503044
11. Robinson AJ, Hopkins GL, Rastogi N, Hodges M, Doyle M, Davies S, et al. Reactive Oxygen Species Drive Proliferation in Acute Myeloid Leukemia via the Glycolytic Regulator PFKFB3ROS Drives Proliferation in AML via PFKFB3. Cancer Res (2020) 80(5):937–49. doi: 10.1158/0008-5472.CAN-19-1920
12. Poulain L, Sujobert P, Zylbersztejn F, Barreau S, Stuani L, Lambert M, et al. High mTORC1 activity drives glycolysis addiction and sensitivity to G6PD inhibition in acute myeloid leukemia cells. Leukemia. (2017) 31(11):2326–35. doi: 10.1038/leu.2017.81
13. Su Q, Huang C-S, Wu L-S, Luo X, Tian R-M, Chen Y. [Change of G6PD activity in children with acute leukemia and its clinical significance]. Zhongguo shi yan xue ye xue za zhi. (2018) 26(6):1649–56. doi: 10.7534/j.issn.1009-2137.2018.06.012
14. Stuani L, Sarry J-E. Help from outside: cysteine to survive in AML. Blood. (2019) 134(4):336–8. doi: 10.1182/blood.2019001580
15. Pei S, Minhajuddin M, Callahan KP, Balys M, Ashton JM, Neering SJ, et al. Targeting aberrant glutathione metabolism to eradicate human acute myelogenous leukemia cells. J Biol Chem (2013) 288(47):33542–58. doi: 10.1074/jbc.M113.511170
16. German NJ, Yoon H, Yusuf RZ, Murphy JP, Finley LWS, Laurent G, et al. PHD3 loss in cancer enables metabolic reliance on fatty acid oxidation via deactivation of ACC2. Mol Cell (2016) 63(6):1006–20. doi: 10.1016/j.molcel.2016.08.014
17. Li S, Zhou T, Li C, Dai Z, Che D, Yao Y, et al. High metastaticgastric and breast cancer cells consume oleic acid in an AMPK dependent manner. PloS One (2014) 9(5):e97330. doi: 10.1371/journal.pone.0097330
18. Pike LS, Smift AL, Croteau NJ, Ferrick DA, Wu M. Inhibition of fatty acid oxidation by etomoxir impairs NADPH production and increases reactive oxygen species resulting in ATP depletion and cell death in human glioblastoma cells. Biochim Biophys Acta (BBA)-Bioenergetics. (2011) 1807(6):726–34. doi: 10.1016/j.bbabio.2010.10.022
19. Carracedo A, Weiss D, Leliaert AK, Bhasin M, De Boer VCJ, Laurent G, et al. A metabolic prosurvival role for PML in breast cancer. J Clin Invest. (2012) 122(9):3088–100. doi: 10.1172/JCI62129
20. Shi J, Fu H, Jia Z, He K, Fu L, Wang W. High expression of CPT1A predicts adverse outcomes: A potential therapeutic target for acute myeloid leukemia. EBioMedicine. (2016) 14:55–64. doi: 10.1016/j.ebiom.2016.11.025
21. Chapuis N, Poulain L, Birsen R, Tamburini J, Bouscary D. Rationale for targeting deregulated metabolic pathways as a therapeutic strategy in acute myeloid leukemia. Front Oncol (2019) 9(MAY). doi: 10.3389/fonc.2019.00405
22. Menendez JA, Lupu R. Fatty acid synthase and the lipogenic phenotype in cancer pathogenesis. Nat Rev Cancer. (2007) 7(10):763–77. doi: 10.1038/nrc2222
23. Swinnen JV, Brusselmans K, Verhoeven G. Increased lipogenesis in cancer cells: new players, novel targets. Curr Opin Clin Nutr Metab Care (2006) 9(4):358–65. doi: 10.1097/01.mco.0000232894.28674.30
24. Bhatt AP, Jacobs SR, Freemerman AJ, Makowski L, Rathmell JC, Dittmer DP, et al. Dysregulation of fatty acid synthesis and glycolysis in non-Hodgkin lymphoma. Proc Natl Acad Sci (2012) 109(29):11818–23. doi: 10.1073/pnas.1205995109
25. Igal RA. Stearoyl-CoA desaturase-1: a novel key player in the mechanisms of cell proliferation, programmed cell death and transformation to cancer. Carcinogenesis. (2010) 31(9):1509–15. doi: 10.1093/carcin/bgq131
26. Southam AD, Khanim FL, Hayden RE, Constantinou JK, Koczula KM, Michell RH, et al. Drug redeployment to kill leukemia and lymphoma cells by disrupting SCD1-mediated synthesis of monounsaturated fatty acids. Cancer Res (2015) 75(12):2530–40. doi: 10.1158/0008-5472.CAN-15-0202
27. Castro I, Sampaio-Marques B, Ludovico P. Targeting metabolic reprogramming in acute myeloid leukemia. Cells (2019) 8. doi: 10.3390/cells8090967
28. Jan M, Chao M, Cha A, Alizadeh A, Gentles A, Weissman I, et al. Prospective separation of normal and leukemie stem cells based on differential expression of TIM3, a human acute myeloid leukemia stem cell marker. Proc Natl Acad Sci U S A. (2011) 108:5009–14. doi: 10.1073/pnas.1100551108
29. Kikushige Y, Shima T, Takayanagi SI, Urata S, Miyamoto T, Iwasaki H, et al. TIM-3 is a promising target to selectively kill acute myeloid leukemia stem cells. Cell Stem Cell (2010) 7(6):708–17. doi: 10.1016/j.stem.2010.11.014
30. Kikushige Y, Miyamoto T, Yuda J, Jabbarzadeh-Tabrizi S, Shima T, Takayanagi SI, et al. A TIM-3/gal-9 autocrine stimulatory loop drives self-renewal of human myeloid leukemia stem cells and leukemic progression. Cell Stem Cell (2015) 17(3):341–52. doi: 10.1016/j.stem.2015.07.011
31. Zhu C, Anderson A, Schubart A, Xiong H, Imitola J, Khoury S, et al. The Tim-3 ligand galectin-9 negatively regulates T helper type 1 immunity. Nat Immunol (2006) 6:1245–52. doi: 10.1038/ni1271
32. Prokhorov A, Gibbs BF, Bardelli M, Rüegg L, Fasler-Kan E, Varani L, et al. The immune receptor Tim-3 mediates activation of PI3 kinase/mTOR and HIF-1 pathways in human myeloid leukaemia cells. Int J Biochem Cell Biol (2015) 59:11–20. doi: 10.1016/j.biocel.2014.11.017
33. Silva IG, Gibbs BF, Bardelli M, Varani L, Sumbayev VV. Differential expression and biochemical activity of the immune receptor Tim-3 in healthy and Malignant human myeloid cells. Oncotarget. (2015) 6(32):33823–33. doi: 10.18632/oncotarget.5257
34. Takashiba S, Van Dyke TE, Amar S, Murayama Y, Soskolne AW, Shapira L. Differentiation of monocytes to macrophages primes cells for lipopolysaccharide stimulation via accumulation of cytoplasmic nuclear factor kappaB. Infect Immun (1999) 67(11):5573–8. doi: 10.1128/IAI.67.11.5573-5578.1999
35. Park S-J, Kang S-Y, Kim N-S, Kim H-M. Phosphatidylinositol 3-kinase regulates PMA-induced differentiation and superoxide production in HL-60 cells. Immunopharmacol Immunotoxicol. (2002) 24(2):211–26. doi: 10.1081/iph-120003751
36. Rezaei M, Tan J, Zeng C, Li Y, Ganjalikhani-hakemi M. TIM-3 in leukemia ; immune response and beyond. Front Oncol (2021) 11(September):1–11. doi: 10.3389/fonc.2021.753677
37. Cunningham I, Kohno B. 18FDG-PET/CT: 21st century approach to leukemic tumors in 124 cases. Am J Hematol (2016) 91(4):379–84. doi: 10.1002/ajh.24287
38. Chen W-L, Wang J-H, Zhao A-H, Xu X, Wang Y-H, Chen T-L, et al. A distinct glucose metabolism signature of acute myeloid leukemia with prognostic value. Blood J Am Soc Hematol (2014) 124(10):1645–54. doi: 10.1182/blood-2014-02-554204
39. Wang Y, Zhang L, Chen W-L, Wang J-H, Li N, Li J-M, et al. Rapid diagnosis and prognosis of de novo acute myeloid leukemia by serum metabonomic analysis. J Proteome Res (2013) 12(10):4393–401. doi: 10.1021/pr400403p
40. Herst PM, Howman RA, Neeson PJ, Berridge MV, Ritchie DS. The level of glycolytic metabolism in acute myeloid leukemia blasts at diagnosis is prognostic for clinical outcome. J Leukoc Biol (2011) 89(1):51–5. doi: 10.1189/jlb.0710417
41. Pereira O, Teixeira A, Sampaio-Marques B, Castro I, Girão H, Ludovico P. Signalling mechanisms that regulate metabolic profile and autophagy of acute myeloid leukaemia cells. J Cell Mol Med (2018) 22(10):4807–17. doi: 10.1111/jcmm.13737
42. Herst PM, Hesketh EL, Ritchie DS, Berridge MV. Glycolytic metabolism confers resistance to combined all-trans retinoic acid and arsenic trioxide-induced apoptosis in HL60ρ0 cells. Leuk Res (2008) 32(2):327–33. doi: 10.1016/j.leukres.2007.04.014
43. Patsoukis N, Weaver JD, Strauss L, Herbel C, Seth P, Boussiotis VA. Immunometabolic regulations mediated by coinhibitory receptors and their impact on T cell immune responses. Front Immunol (2017) 8:330. doi: 10.3389/fimmu.2017.00330
44. Ricciardi S, Manfrini N, Alfieri R, Calamita P, Crosti MC, Gallo S, et al. The translational machinery of human CD4+ T cells is poised for activation and controls the switch from quiescence to metabolic remodeling. Cell Metab (2018) 28(6):895–906. doi: 10.1016/j.cmet.2018.08.009
45. Cao Y, Rathmell JC, Macintyre AN. Metabolic reprogramming towards aerobic glycolysis correlates with greater proliferative ability and resistance to metabolic inhibition in CD8 versus CD4 T cells. PloS One (2014) 9(8):e104104. doi: 10.1371/journal.pone.0104104
46. O’Neill LAJ, Pearce EJ. Immunometabolism governs dendritic cell and macrophage function. J Exp Med (2016) 213(1):15–23. doi: 10.1084/jem.20151570
47. Kelly B, O’neill LA. Metabolic reprogramming in macrophages and dendritic cells in innate immunity. Cell Res (2015) 25(7):771–84. doi: 10.1038/cr.2015.68
48. Sim WJ, Ahl PJ, Connolly JE. Metabolism is central to tolerogenic dendritic cell function. Mediators Inflamm (2016) 2016. doi: 10.1155/2016/2636701
49. Xu W, Powell JD. Peeking under the Hood of naive T cells. Cell Metab (2018) 28(6):801–2. doi: 10.1016/j.cmet.2018.11.008
50. Clem B, Telang S, Clem A, Yalcin A, Meier J, Simmons A, et al. Small-molecule inhibition of 6-phosphofructo-2-kinase activity suppresses glycolytic flux and tumor growth. Mol Cancer Ther (2008) 7(1):110–20. doi: 10.1158/1535-7163.MCT-07-0482
51. Vats D, Mukundan L, Odegaard JI, Zhang L, Smith KL, Morel CR, et al. Oxidative metabolism and PGC-1β attenuate macrophage-mediated inflammation. Cell Metab (2006) 4(1):13–24. doi: 10.1016/j.cmet.2006.05.011
52. Shevchenko I, Bazhin AV. Metabolic checkpoints: novel avenues for immunotherapy of cancer. Front Immunol (2018) 9:1816. doi: 10.3389/fimmu.2018.01816
53. Al-Khami AA, Rodriguez PC, Ochoa AC. Energy metabolic pathways control the fate and function of myeloid immune cells. J Leukoc Biol (2017) 102(2):369–80. doi: 10.1189/jlb.1VMR1216-535R
54. Jantsch J, Chakravortty D, Turza N, Prechtel AT, Buchholz B, Gerlach RG, et al. Hypoxia and hypoxia-inducible factor-1α modulate lipopolysaccharide-induced dendritic cell activation and function. J Immunol (2008) 180(7):4697–705. doi: 10.4049/jimmunol.180.7.4697
55. Fernández-Ramos AA, Poindessous V, Marchetti-Laurent C, Pallet N, Loriot M-A. The effect of immunosuppressive molecules on T-cell metabolic reprogramming. Biochimie. (2016) 127:23–36. doi: 10.1016/j.biochi.2016.04.016
56. Mason EF, Zhao Y, Goraksha-Hicks P, Coloff JL, Gannon H, Jones SN, et al. Aerobic Glycolysis Suppresses p53 Activity to Provide Selective Protection from Apoptosis upon Loss of Growth Signals or Inhibition of BCR-AblGlucose Metabolism Selectively Inhibits p53 Activity. Cancer Res (2010) 70(20):8066–76. doi: 10.1158/0008-5472.CAN-10-0608
57. Porporato PE, Dhup S, Dadhich RK, Copetti T, Sonveaux P. Anticancer targets in the glycolytic metabolism of tumors: a comprehensive review. Front Pharmacol (2011) 2:49. doi: 10.3389/fphar.2011.00049
58. Klein Geltink RI, Kyle RL, Pearce EL. Unraveling the complex interplay between T cell metabolism and function. Annu Rev Immunol (2018) 36:461–88. doi: 10.1146/annurev-immunol-042617-053019
59. Cammann C, Rath A, Reichl U, Lingel H, Brunner-Weinzierl M, Simeoni L, et al. Early changes in the metabolic profile of activated CD8+ T cells. BMC Cell Biol (2016) 17(1):1–11. doi: 10.1186/s12860-016-0104-x
60. Lee MJ, Yun SJ, Lee B, Jeong E, Yoon G, Kim K, et al. Association of TIM-3 expression with glucose metabolism in Jurkat T cells. BMC Immunol (2020) 21(1):1–13. doi: 10.1186/s12865-020-00377-6
61. Zhang J, Hou C, Dou S, Li G, Wang Z, Liu Y, et al. T cell immunoglobulin and mucin domain protein 3 inhibits glycolysis in RAW 264.7 macrophages through Hexokinase 2. Scand J Immunol (2021) 93(2):e12981. doi: 10.1111/sji.12981
62. Kikushige Y. TIM-3 in normal and Malignant hematopoiesis: Structure, function, and signaling pathways. Cancer Sci (2021) 112(9):3419–26. doi: 10.1111/cas.15042
63. Mashima T, Sato S, Okabe S, Miyata S, Matsuura M, Sugimoto Y, et al. Acyl-CoA synthetase as a cancer survival factor: Its inhibition enhances the efficacy of etoposide. Cancer Sci (2009) 100(8):1556–62. doi: 10.1111/j.1349-7006.2009.01203.x
64. Pizer ES, Jackisch C, Wood FD, Pasternack GR, Davidson NE, Kuhajda FP. Inhibition of fatty acid synthesis induces programmed cell death in human breast cancer cells. Cancer Res (1996) 56(12):2745–7.
65. Roongta UV, Pabalan JG, Wang X, Ryseck R-P, Fargnoli J, Henley BJ, et al. Cancer cell dependence on unsaturated fatty acids implicates stearoyl-coA desaturase as a target for cancer therapyAntitumor effects of SCD inhibition. Mol Cancer Res (2011) 9(11):1551–61. doi: 10.1158/1541-7786.MCR-11-0126
66. Santos CR, Schulze A. Lipid metabolism in cancer. FEBS J (2012) 279(15):2610–23. doi: 10.1111/j.1742-4658.2012.08644.x
67. de Cedrón MG, de Molina AR. Precision nutrition to target lipid metabolism alterations in cancer. In: Precision medicine for investigators, practitioners and providers. Eds. Faintuch J, Faintuch S. Academic Press (2020). p. 291–9. doi: 10.1016/B978-0-12-819178-1.00028-9
68. Pizer ES, Wood FD, Pasternack GR, Kuhajda FP. Fatty acid synthase (FAS): a target for cytotoxic antimetabolites in HL60 promyelocytic leukemia cells. Cancer Res (1996) 56(4):745–51.
69. Tsuchiya S, Yamabe M, Yamaguchi Y, Kobayashi Y, Konno T, Tada K. Establishment and characterization of a human acute monocytic leukemia cell line (THP-1). Int J cancer. (1980) 26(2):171–6. doi: 10.1002/ijc.2910260208
70. Dalton WTJ, Ahearn MJ, McCredie KB, Freireich EJ, Stass SA, Trujillo JM. HL-60 cell line was derived from a patient with FAB-M2 and not FAB-M3. Blood. (1988) 71(1):242–7. doi: 10.1182/blood.V71.1.242.242
71. Li S, Mason CE, Melnick A. Genetic and epigenetic heterogeneity in acute myeloid leukemia. Curr Opin Genet Dev (2016) 36:100–6. doi: 10.1016/j.gde.2016.03.011
72. Pearce EL, Walsh MC, Cejas PJ, Harms GM, Shen H, Wang L-S, et al. Enhancing CD8 T-cell memory by modulating fatty acid metabolism. Nature. (2009) 460(7251):103–7. doi: 10.1038/nature08097
73. Araki K, Turner AP, Shaffer VO, Gangappa S, Keller SA, Bachmann MF, et al. mTOR regulates memory CD8 T-cell differentiation. Nature. (2009) 460(7251):108–12. doi: 10.1038/nature08155
74. Samudio I, Harmancey R, Fiegl M, Kantarjian H, Konopleva M, Korchin B, et al. Pharmacologic inhibition of fatty acid oxidation sensitizes human leukemia cells to apoptosis induction. J Clin Invest. (2010) 120(1):142–56. doi: 10.1172/JCI38942
75. Ye H, Adane B, Khan N, Sullivan T, Minhajuddin M, Gasparetto M, et al. Leukemic stem cells evade chemotherapy by metabolic adaptation to an adipose tissue niche. Cell Stem Cell (2016) 19(1):23–37. doi: 10.1016/j.stem.2016.06.001
76. Farge T, Saland E, De Toni F, Aroua N, Hosseini M, Perry R, et al. Chemotherapy-resistant human acute myeloid leukemia cells are not enriched for leukemic stem cells but require oxidative metabolismenergetic control of in vivo chemoresistance in AML. Cancer Discovery (2017) 7(7):716–35. doi: 10.1158/2159-8290.CD-16-0441
77. Nagy C, Haschemi A. Time and demand are two critical dimensions of immunometabolism: the process of macrophage activation and the pentose phosphate pathway. Front Immunol (2015) 6:164. doi: 10.3389/fimmu.2015.00164
78. Coll T, Eyre E, Rodríguez-Calvo R, Palomer X, Sánchez RM, Merlos M, et al. Oleate reverses palmitate-induced insulin resistance and inflammation in skeletal muscle cells. J Biol Chem (2008) 283(17):11107–16. doi: 10.1074/jbc.M708700200
79. Li R, Wang W, Yang Y, Gu C. Exploring the role of glucose−6−phosphate dehydrogenase in cancer (Review). Oncol Rep (2020) 44(6):2325–36. doi: 10.3892/or.2020.7803
80. Gregory MA, D’Alessandro A, Alvarez-Calderon F, Kim J, Nemkov T, Adane B, et al. ATM/G6PD-driven redox metabolism promotes FLT3 inhibitor resistance in acute myeloid leukemia. Proc Natl Acad Sci U S A. (2016) 113(43):E6669–78. doi: 10.1073/pnas.1603876113
Keywords: acute myeloid leukemia, TIM-3, immunometabolism, glucose metabolism, lipid metabolism, galectin-9
Citation: Rezaei M, Ghanadian M, Ghezelbash B, Shokouhi A, Bazhin AV, Zamyatnin AA Jr. and Ganjalikhani-Hakemi M (2023) TIM-3/Gal-9 interaction affects glucose and lipid metabolism in acute myeloid leukemia cell lines. Front. Immunol. 14:1267578. doi: 10.3389/fimmu.2023.1267578
Received: 26 July 2023; Accepted: 23 October 2023;
Published: 10 November 2023.
Edited by:
Claudio Cerchione, Scientific Institute of Romagna for the Study and Treatment of Tumors (IRCCS), ItalyReviewed by:
Todd Triplett, Texas Tech University Health Sciences Center, United StatesVadim V. Sumbayev, University of Kent, United Kingdom
Ritu Gupta, All India Institute of Medical Sciences, India
Copyright © 2023 Rezaei, Ghanadian, Ghezelbash, Shokouhi, Bazhin, Zamyatnin and Ganjalikhani-Hakemi. This is an open-access article distributed under the terms of the Creative Commons Attribution License (CC BY). The use, distribution or reproduction in other forums is permitted, provided the original author(s) and the copyright owner(s) are credited and that the original publication in this journal is cited, in accordance with accepted academic practice. No use, distribution or reproduction is permitted which does not comply with these terms.
*Correspondence: Mazdak Ganjalikhani-Hakemi, bWdoYWtlbWlAbWVkLm11aS5hYy5pcg==