 Patrice Cunningham1Christian A. Unger1Emma A. Patton1Akyla Aiken1,2Alea Browne1Ella James1
 Ahmed K. Aladhami1Marion C. Hope 3rd1
 Brandon N. VanderVeen1Thomas D. Cardaci1
 E. Angela Murphy1
 Reilly T. Enos1
 Kandy T. Velázquez1,2*
- 1Department of Pathology, Microbiology, and Immunology, School of Medicine, University of South Carolina, Columbia, SC, United States
- 2Columbia Department of Veterans Affairs Health Care System, Columbia, SC, United States
Cachexia, a complex wasting syndrome, significantly affects the quality of life and treatment options for cancer patients. Studies have reported a strong correlation between high platelet count and decreased survival in cachectic individuals. Therefore, this study aimed to investigate the immunopathogenesis of cancer cachexia using the ApcMin/+ mouse model of spontaneous colorectal cancer. The research focused on identifying cellular elements in the blood at different stages of cancer cachexia, assessing inflammatory markers and fibrogenic factors in the skeletal muscle, and studying the behavioral and metabolic phenotype of ApcMin/+ mice at the pre-cachectic and severely cachectic stages. Platelet measurements were also obtained from other animal models of cancer cachexia - Lewis Lung Carcinoma and Colon 26 adenocarcinoma. Our study revealed that platelet number is elevated prior to cachexia development in ApcMin/+ mice and can become activated during its progression. We also observed increased expression of TGFβ2, TGFβ3, and SMAD3 in the skeletal muscle of pre-cachectic ApcMin/+ mice. In severely cachectic mice, we observed an increase in Ly6g, CD206, and IL-10 mRNA. Meanwhile, IL-1β gene expression was elevated in the pre-cachectic stage. Our behavioral and metabolic phenotyping results indicate that pre-cachectic ApcMin/+ mice exhibit decreased physical activity. Additionally, we found an increase in anemia at pre-cachectic and severely cachectic stages. These findings highlight the altered platelet status during early and late stages of cachexia and provide a basis for further investigation of platelets in the field of cancer cachexia.
1 Introduction
Cachexia is defined as an unintentional body weight loss, which can include loss of muscle with or without loss of fat mass (1, 2). The progression of cancer cachexia is often classified into stages – pre-cachexia, cachexia, and severe/refractory cachexia – based on weight loss, muscle functional capacity, and inflammatory status (1). Despite interventions, reversing or halting the progression of cachexia is extremely challenging. Therefore, cachexia contributes to an increased mortality rate (3, 4). Moreover, a study conducted in cancer patients found weight loss was a predictor of mortality (5). In addition, a multi-institutional observational study in cancer patients found that factors such as body weight loss, decreased handgrip strength, anorexia, and fatigue are associated with the deterioration of quality of life resulting from the progression of cancer cachexia (6). Currently, there are no approved therapies for cancer cachexia, and drugs targeting its inflammatory component have not respond as expected (7). Exploring new processes, such as the immunopathogenesis of cachexia, may provide insights into its initiation and facilitate the development of drugs to counter muscle wasting.
There is evidence to suggest that platelets, small anucleate cells which participate in hemostasis as well as inflammatory and immunological processes, may be involved in the development of cachexia in humans (8–16). Notably, a strong association has been observed between high platelet counts and decreased survival in cachectic patients (12, 17, 18). Research has shown that platelets release a variety of molecules that can contribute to the inflammation and tissue wasting seen in cachexia (19). These molecules include cytokines, chemokines, and growth factors that can activate pathways involved in muscle breakdown and inhibit pathways involved in muscle growth (20–22). In addition, platelets can interact with immune cells such as macrophages and neutrophils, which are also involved in the development of cachexia (23–25). Platelets can stimulate the release of pro-inflammatory molecules from these cells, exacerbating the inflammatory response seen in cachexia. Furthermore, platelets can also promote the release of various growth factors linked to fibrosis (26). These facts, together with epidemiological data, provide evidence of a strong association between cancer mortality and an increased platelet count (17, 18, 27).
Elevated platelet levels are consistently observed in individuals with a poor prognosis in cancer (28–31). A large case-control study reported a significant association between a very high platelet count and an increased risk of developing colon, lung, and stomach cancers within three years (32). These cancers are the malignancies with the highest cachexia incidence (4, 33). Experimental models of colorectal cancer have shown that platelet sequestration in the spleen occurs prior to the elevation of the inflammatory cytokine interleukin-6 (IL-6) (34). It has also been demonstrated that IL-6 can stimulate thrombopoietin production, which leads to platelet formation (35, 36). Other studies suggest the clinical relevance of modifying platelet responses in inflammatory conditions, as antiplatelet medications have been shown to reduce mortality from infections and sepsis (37, 38). Therefore, it is possible that platelets might be involved in the initiation as well the severity of cancer cachexia.
The purpose of this study was to investigate the immunopathogenesis of cancer cachexia using the preclinical model of spontaneous colorectal cancer, ApcMin/+ mice. First, we sought to identify cellular elements of the blood at different stages of cancer cachexia. A complete blood count (CBC) is a commonly conducted test in humans due to its usefulness in assessing various health conditions (39). It is particularly valuable in evaluating cell components of the blood, including white blood cells, red blood cells, and platelets. Subsequently, we assessed inflammatory markers and fibrogenic factors in the skeletal muscle. Furthermore, we investigated the behavioral and metabolic phenotype of ApcMin/+ mice at the pre-cachectic stage. Lastly, platelet measurements were obtained from two other mouse models of cancer cachexia, Lewis Lung Carcinoma and Colon 26 adenocarcinoma, to determine if platelet number increases and/or activation occurs in other animal models of cancer cachexia.
2 Materials and methods
2.1 Animals
C57BL/6J (strain #000664) and C57BL/6J-ApcMin/J (ApcMin/+, strain #002020) were originally purchased from The Jackson Laboratory (Bar Harbor, ME, USA). C57BL/6J female mice were bred with C57BL/6J-ApcMin/J male mice to obtain age- (17-44 weeks of age) and sex-matched littermate controls. C57BL/6J (male and female) and ApcMin/+ (male and female) mice were weaned and housed together in ventilated cages to minimize environmental and microbiome-related differences. Lewis Lung Carcinoma or LLC (ATCC, Manassas, VA, USA; CRL-1642) cells were implanted (1X 10⁶, 3rd passage) in the right flank area of C57BL/6J male mice (16-20 weeks of age) age purchased from Jackson Laboratory. Colon 26 adenocarcinoma or C26 cells (donated from Dr. Andrea Bonetto) were implanted (1X 10⁶, 3rd passage) at 15 weeks of age in the subscapular region of CD2F1 male mice (Charles River Laboratory, Raleigh NC, USA). CD2F1 mice were euthanized two weeks after C26 cell implantation. The breeding protocol and experiments conducted in this study were approved by the Institutional Animal Care and Use Committee (IACUC) of the University of South Carolina. Mice were fed purified AIN-76A diet ad libitum (Bio-Serv, Frenchtown, NJ, USA) and room lighting followed a 12-hour light and 12-hour dark cycle with a temperature average of 22°C and humidity of 50%. Weekly body weight measurements were recorded to assess body weight loss from their peak body weight. ApcMin/+ mice with less than 5% body weight loss was assigned to the pre-cachectic group, while those with body weight loss exceeding 10% were allocated to the severely cachectic group. Both groups, along with C57BL6/J littermate control mice, were euthanized with an overdose of isoflurane once the desired body weight loss was reached in ApcMin/+ mice. Blood and tissue samples were collected for further analysis. LLC-tumor bearing mice were euthanized twenty-five days post-implantation and stratified based on body weight loss after tumor excision. Meanwhile, C26-tumor bearing mice were euthanized two weeks after tumor implantation and exhibited >10% body weight loss after tumor removal.
2.2 Behavioral and metabolic phenotyping
Behavioral and metabolic phenotyping of C57BL/6J (n=9) and ApcMin/+ pre-cachectic (n=7) mice were performed between twelve and fifteen weeks of age for one week using the Promethion System (Sable System International, Las Vegas, NV, USA) as previously described (40). Severely cachectic ApcMin/+ mice were not included in this assessment as survival was not an end point in this experiment. Food and water consumption, body mass, locomotor activity, energy expenditure, and sleeping patterns during the light and dark cycle were collected and analyzed. Metabolic parameters were analyzed using the lean body mass (Dual-Energy X-ray Absorptiometry) as a covariate.
2.3 Functional test
Forelimb strength and neuromuscular function of C57BL/6J (n=9) and ApcMin/+ pre-cachectic (n=7) mice were determined using grip strength (Bioseb, Pinellas Park, FL, USA) and rotarod (Panlab, Harvard Apparatus, Holliston, MA) assessments. For grip strength, mice were placed in a grid and their tail was gently pulled backward until they lost their grip. The average peak force from five trials was recorded and graphed. In the neuromuscular function test, mice were habituated to the rotarod, which is an elevated rotating rod. On the test day, mice were placed on the rod and subjected to a ramping protocol (0-25 rpm, 0.02 x g) over a period of 120 sec or until they fell from the rod. This protocol was repeated three times with a 2-minute waiting interval. The best performance time was recorded and graphed.
2.4 Complete blood count
Blood collected during euthanasia was analyzed using the VetScan Hm5 (Abaxis, Union City, CA, USA) for hematology assessment. The complete blood count and 3-part differential were utilized to measure various parameters, including white blood cells (WBC), lymphocytes (LYM), monocytes (MON), neutrophils (NEU), red blood cells (RBC), Hemoglobin (HGB), hematocrit (HCT), mean corpuscular volume (MCV), mean corpuscular hemoglobin (MCH), red cell distribution width (RDW), platelets (PLT), mean platelet volume (MPV), and platelet distribution width (PDWs).
2.5 Gastrointestinal polyp quantification
Small and large intestines were dissected and rinsed in PBS. Polyp numbers were counted under a dissection microscope after euthanasia.
2.6 Quantitative real time PCR
The gastrocnemius muscle of ApcMin/+mice and C57BL6/J littermate controls was homogenized in Trizol for RNA extraction. The isolated RNA was quantified using a nanodrop, and the iScript cDNA synthesis kit was used to transcribe and analyze the expression of specific genes, including: Ly6g, F4/80, CD206/mrc1, IL-10, IL-1β, IL-4, IL-6, TNFα, TGFβ1, TGFβ2, TGFβ3, SMAD2, SMAD3, and fibrinogen. Reference genes (Nono, Gusb, Hmbs, RplpO, 18S, H2afv) were also run, and stable genes (Nono, Hmbs, RplpO, H2afv) were selected as the normalization factors for each analysis using Qbase + software (Biogazelle, Ghent, Belgium).
2.7 Statistical analysis
The data were analyzed using Prism 8 (GraphPad Software, La Jolla, CA). One-way ANOVA or mixed-effects model tests were performed, followed by Tukey’s multiple comparison test or Sidak’s multiple comparisons test, respectively. Unpaired two-tailed t-tests were used to compare the number of polyps between pre-cachectic and severely cachectic ApcMin/+ mice, as well as functional tests (grip strength and rotarod test) between C57BL/6J and ApcMin/+ pre-cachectic mice, and platelet count between non-cancer and tumor-bearing mice. If Bartlett’s test for equal variance failed, the data were log-transformed and reanalyzed. Metabolic parameters were analyzed using an ANCOVA (MMPC National Mouse Metabolic Phenotyping Center) (41) with lean body mass as a covariate. The data are presented as means ± standard error, and a significance level of p<0.05 was used.
3 Results
3.1 Skeletal muscle and fat mass changes with cancer cachexia progression in ApcMin/+ male and female mice
To confirm the progression of cancer cachexia, we measured body weight, polyp number, as well as mass of hindlimb muscles, spleen, liver, and fat. As expected, severely cachectic ApcMin/+ mice (with an average body weight loss of twenty-four percent) weighed significantly less than ApcMin/+ pre-cachectic (with an average body weight loss of four percent) and C57BL/6J mice at euthanasia (Figure 1A, p=0.0425 and p<0.0001). The mass of the soleus, plantaris, gastrocnemius, extensor digitorum longus (EDL), tibialis anterior, and quadriceps muscles was also reduced in severely cachectic ApcMin/+ mice compared to C57BL/6J mice (Figures 1B–G, p=0.0022, p<0.0001, p<0.0001, p=0.0004, p=0.0028, and p<0.0001 respectively). Moreover, significant differences in the mass of the plantaris, gastrocnemius, EDL, and quadriceps were observed between pre-cachectic ApcMin/+ and severely cachectic ApcMin/+ mice (p=0.0228, p<0.0001, p=0.0079, and p=0.0002 respectively). Splenomegaly was observed in both pre-cachectic ApcMin/+ and severely cachectic ApcMin/+ mice when compared to C57BL/6J mice (Table 1, p=0.0029 and p<0.0001). No significant difference in liver weight was observed between the groups. There was no difference in fat pad mass between C57BL/6J mice and pre-cachectic ApcMin/+ mice. However, a significant reduction in gonadal and retroperitoneal fat masses were observed between severely cachectic ApcMin/+ mice and C57BL/6J mice (p=0.0010 and p=0.0032). No significant differences were observed in fat pad mass and polyp number between pre-cachectic ApcMin/+ and severely cachectic ApcMin/+ mice. Similarly, previous studies have shown no changes in polyp size relative to cachectic stage (42–46).
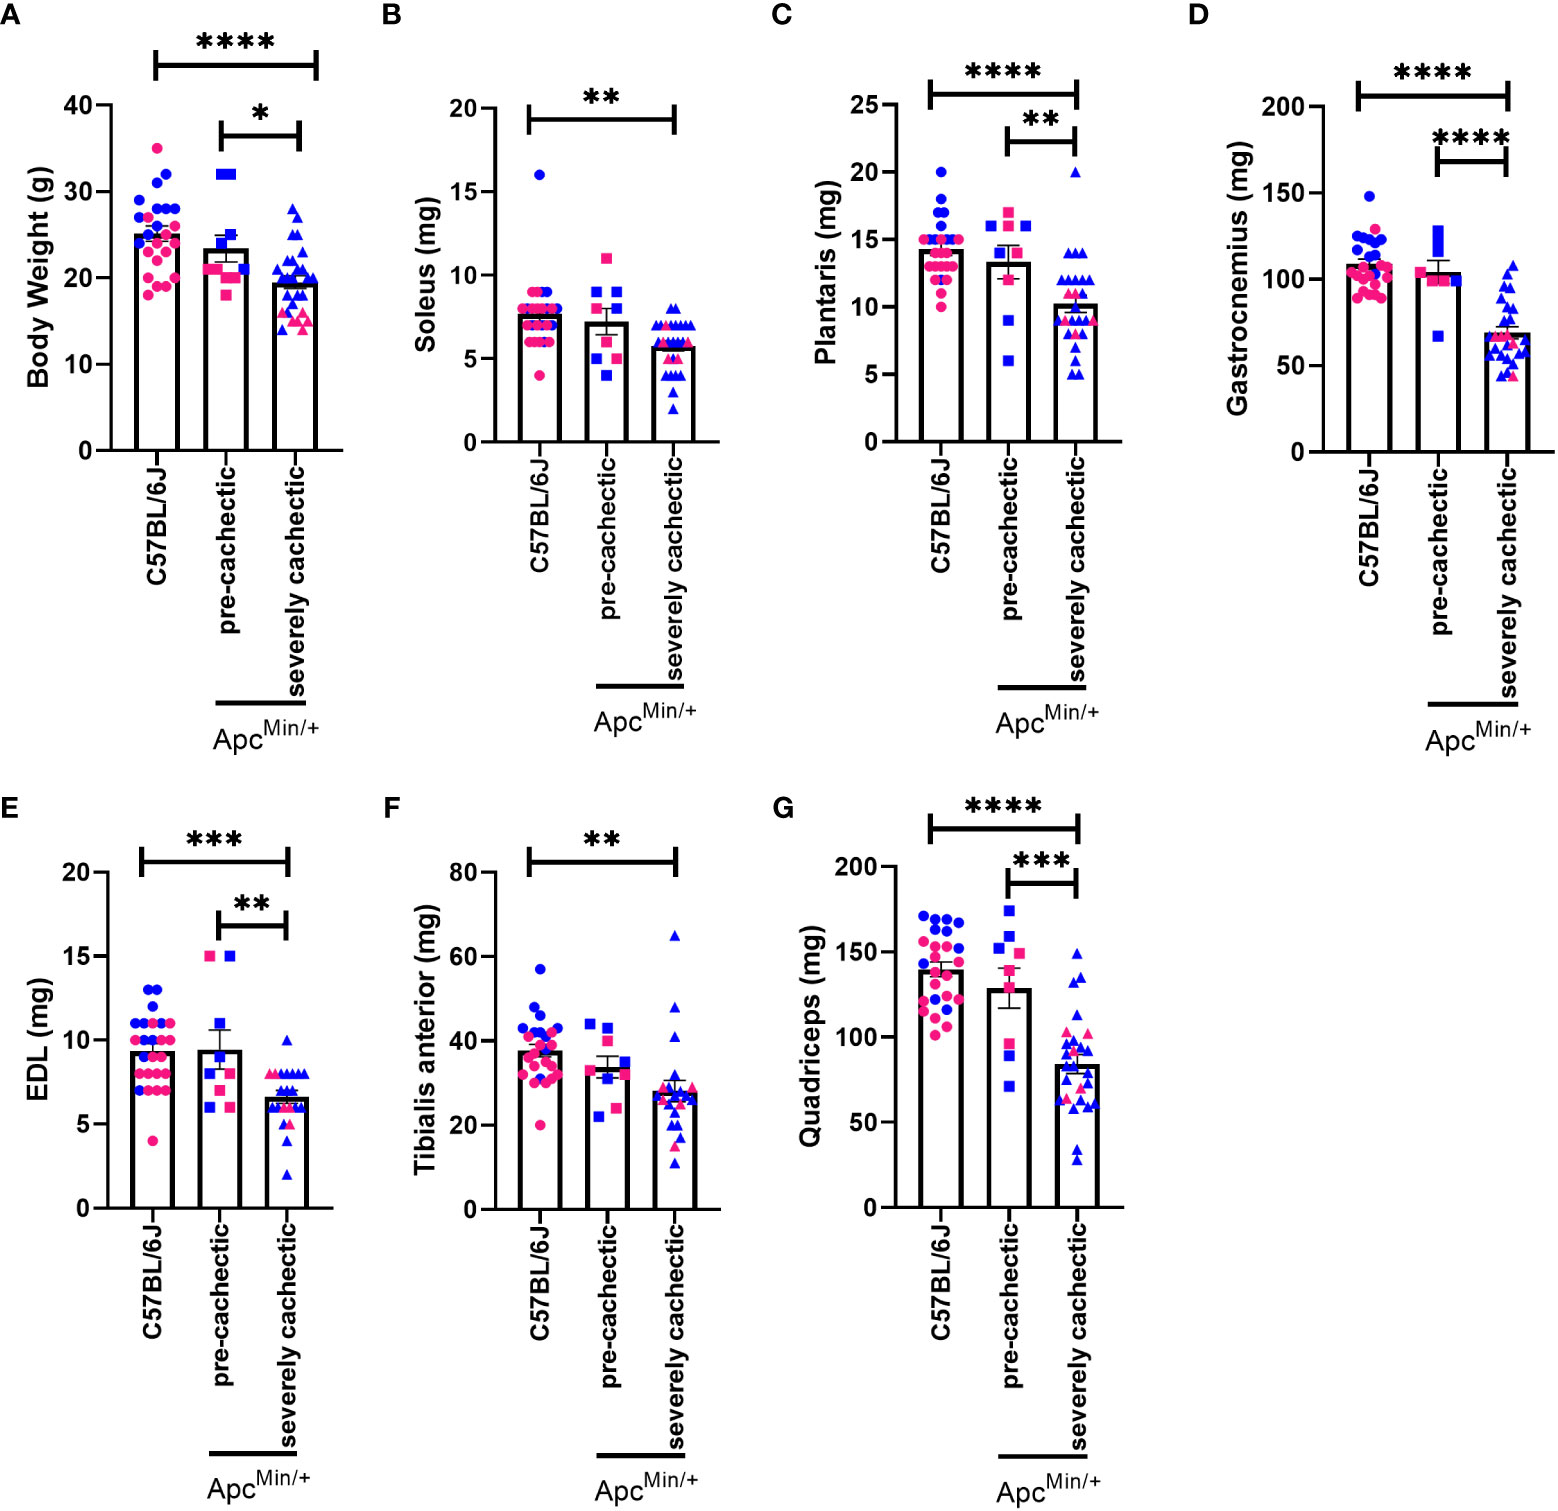
Figure 1 Body weight and hindlimb muscle mass in male and female ApcMin/+ mice during cancer cachexia progression. (A) Body weight (B) soleus, (C) plantaris, (D) gastrocnemius, (E) EDL, (F) TA, and (G) quadricep muscle mass of at the end point of the experiment in non-cancer control C57BL/6J (n=24), pre-cachectic ApcMin/+ (n=10, body weight loss <5%), and severely cachectic (n=27, body weight loss >10%) mice. Pink represents females, and blue represents male mice. One-way ANOVA followed by a Tukey’s multiple comparisons test. *p<0.05, **p<0.01, ***p<0.001, and ****p<0.0001.
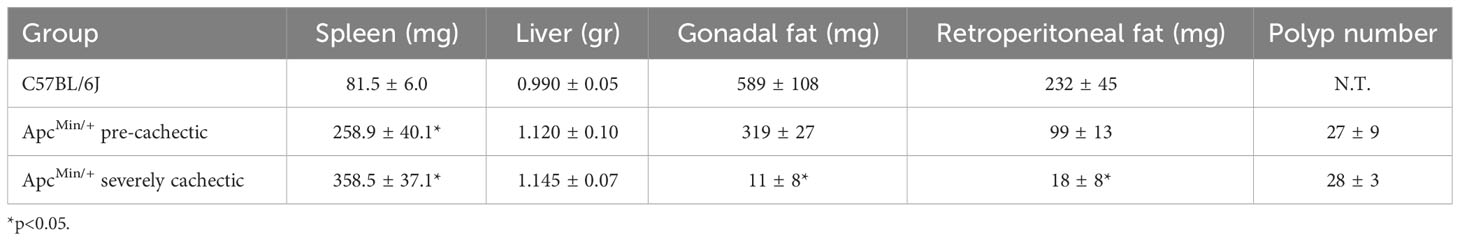
Table 1 Organ weight, fat pad mass, and polyp number in pre-cachectic and cachectic mice.
3.2 Hematological profile in cancer cachexia progression in ApcMin/+ male and female mice
To characterize the hematological profile during cancer cachexia progression, we measured the number of white blood cells, red blood cells, and platelets in the blood of pre-cachectic ApcMin/+, severely cachectic ApcMin/+, and C57BL/6J mice. The total number of white blood cells did not differ between groups (Figure 2A). However, severely cachectic ApcMin/+ mice showed a significant reduction in lymphocyte number compared to C57BL/6J mice (p=0.0071), but not compared to pre-cachectic ApcMin/+ mice (Figure 2B). There was no difference in monocytes between groups (Figure 2C). A significant increase was observed in the number of neutrophils in severely cachectic ApcMin/+ mice compared to C57BL/6J mice (p=0.0082), but not compared to pre-cachectic ApcMin/+ mice (Figure 2D). When the neutrophil:lymphocyte was calculated, a significant increase was observed in severely cachectic ApcMin/+ mice compared to C57BL/6J mice (Figure 2E, p=0.0003). There was a trend towards an increase neutrophil:lymphocyte in pre-cachectic ApcMin/+ compared to C57BL/6J mice (p=0.0550).
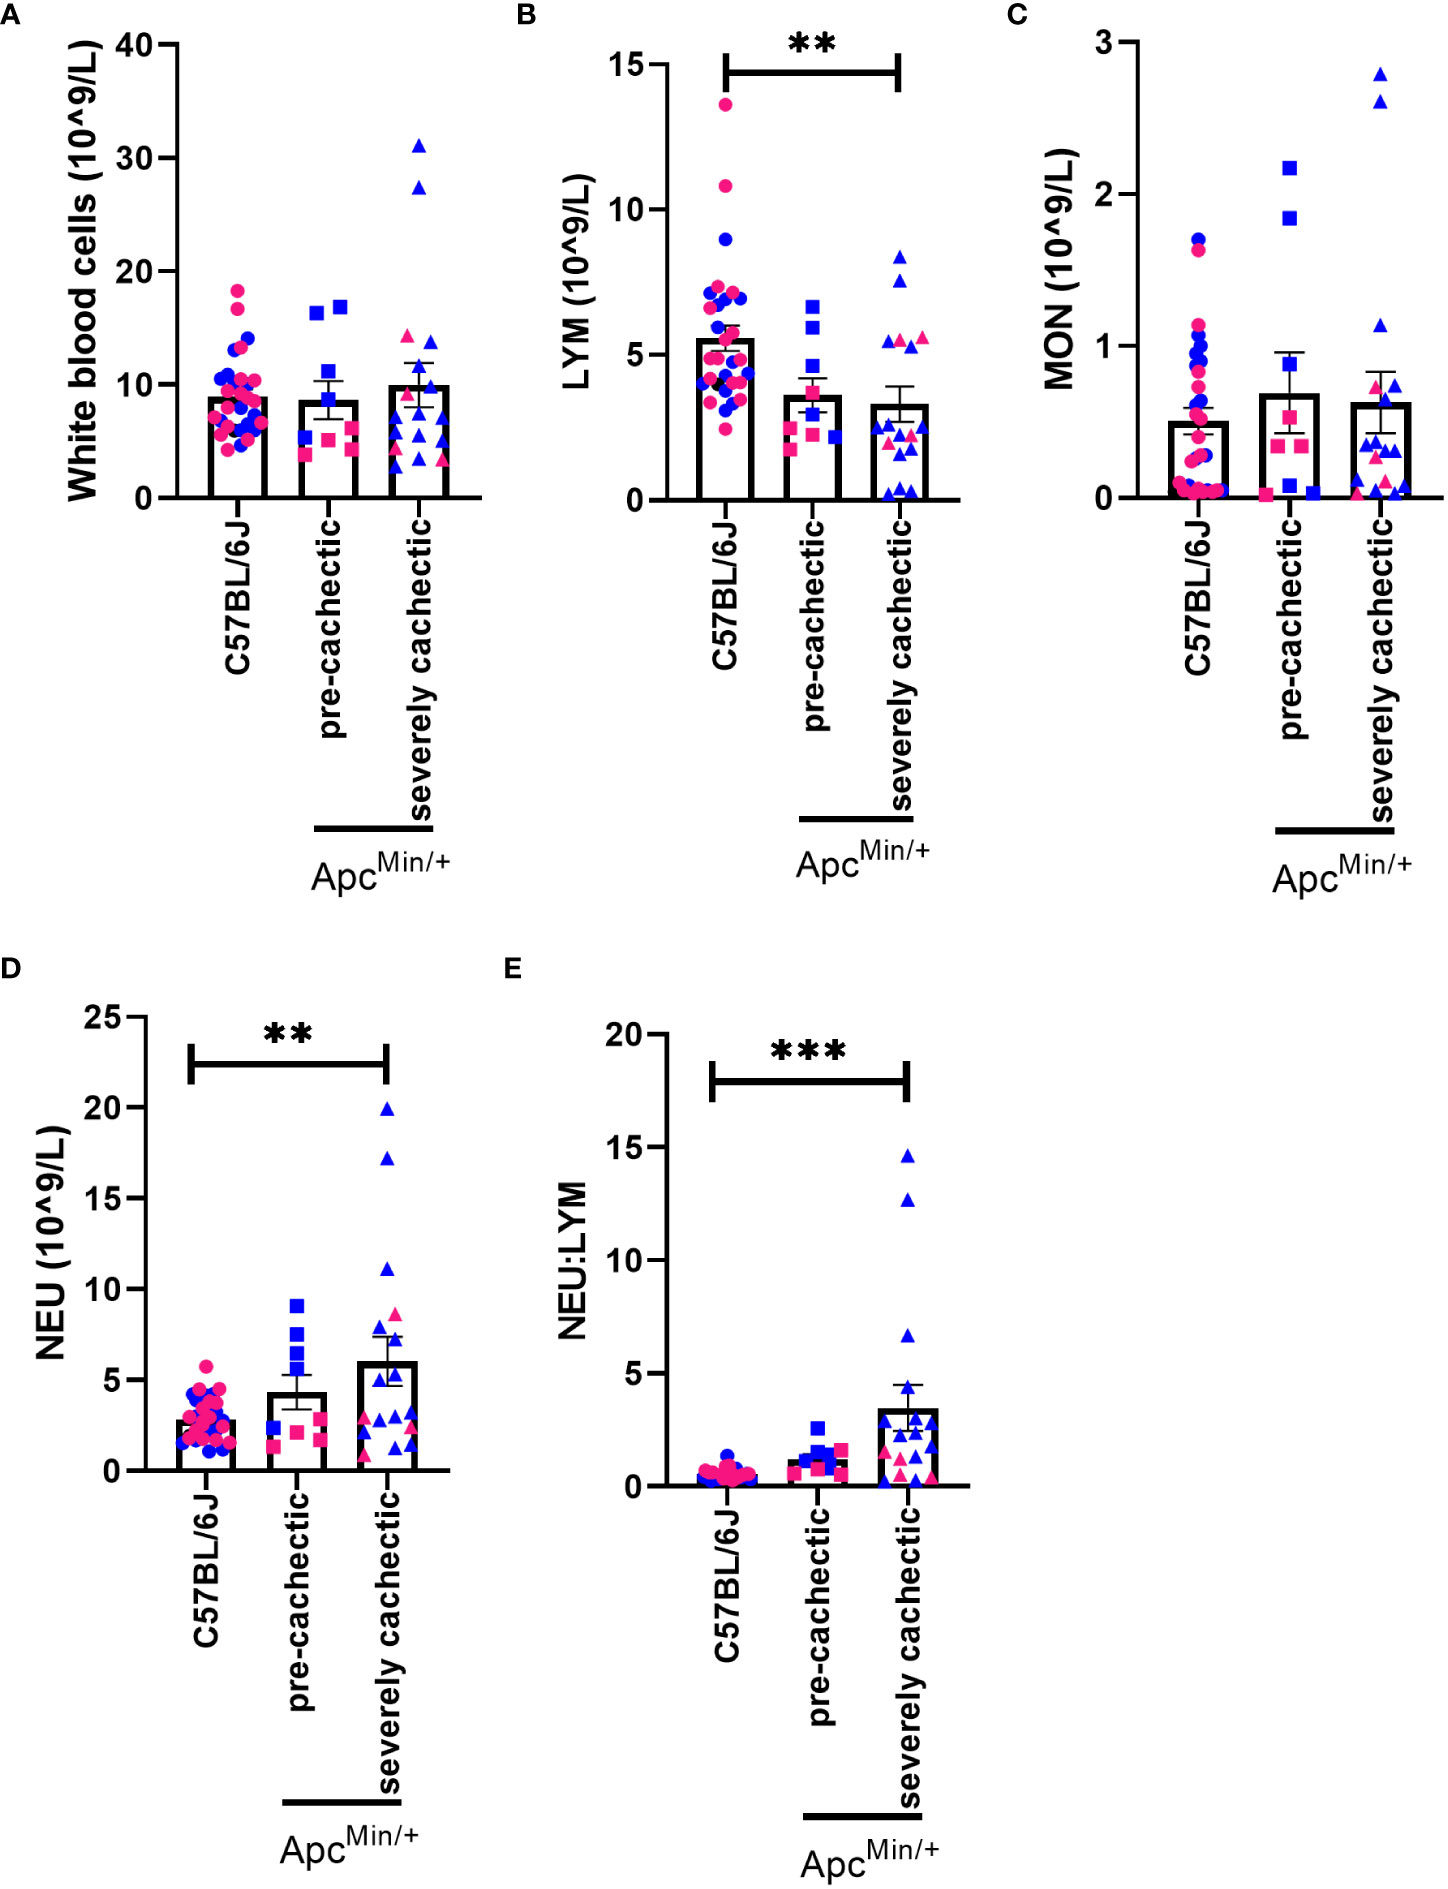
Figure 2 White blood cells profile in male and female ApcMin/+ mice during cancer cachexia progression. (A) White blood cell, (B) lymphocyte, (C) monocyte, (D) neutrophil, and (E) neutrophil:lymphocyte in the blood of non-cancer control C57BL/6J (n=24), pre-cachectic ApcMin/+(n=9), and severely cachectic ApcMin/+ mice (n=17). Pink represents females, and blue represents male mice. One-way AVONA followed by a Tukey’s multiple comparisons test. **p<0.01 and ***p<0.001.
Anemia is one of the hallmarks of cancer cachexia (47). Therefore, we proceeded to identify if anemia precedes muscle mass loss. A reduction in the number of red blood cells, hemoglobin, and hematocrit was observed in both pre-cachectic ApcMin/+ and severely cachectic ApcMin/+ mice compared to C57BL/6J mice (Figures 3A–C, p<0.0001, p<0.0001, and p<0.0001). Additionally, an increase in red blood cell indices was observed between ApcMin/+ and C57BL/6J mice (Figures 3D–G). Mean corpuscular volume, or the size of the red blood cell, was significantly increased in pre-cachectic ApcMin/+ and severely cachectic ApcMin/+ mice compared to C57BL/6J mice (Figure 3D, p=0.0473 and p<0.0001). Mean corpuscular hemoglobin, or the amount of hemoglobin per red blood cell, was significantly elevated in pre-cachectic ApcMin/+ and severely cachectic ApcMin/+ mice compared to C57BL/6J mice (Figure 3E, p=0.0085 and P<0.0001). Additionally, a difference in mean corpuscular hemoglobin was observed between pre-cachectic and severely cachectic ApcMin/+ mice (p=0.0127). An increase in the average concentration of hemoglobin per red blood cell, or mean corpuscular hemoglobin concentration, was observed in severely cachectic ApcMin/+ mice when compared to C57BL/6J mice (p=0.0013) (Figure 3F). Additionally, increased variation in the size of red blood cells, or red cell distribution width, was observed in pre-cachectic ApcMin/+ and severely cachectic ApcMin/+ mice when compared to C57BL/6J mice (p<0.0001 and p<0.0001) (Figure 3G).
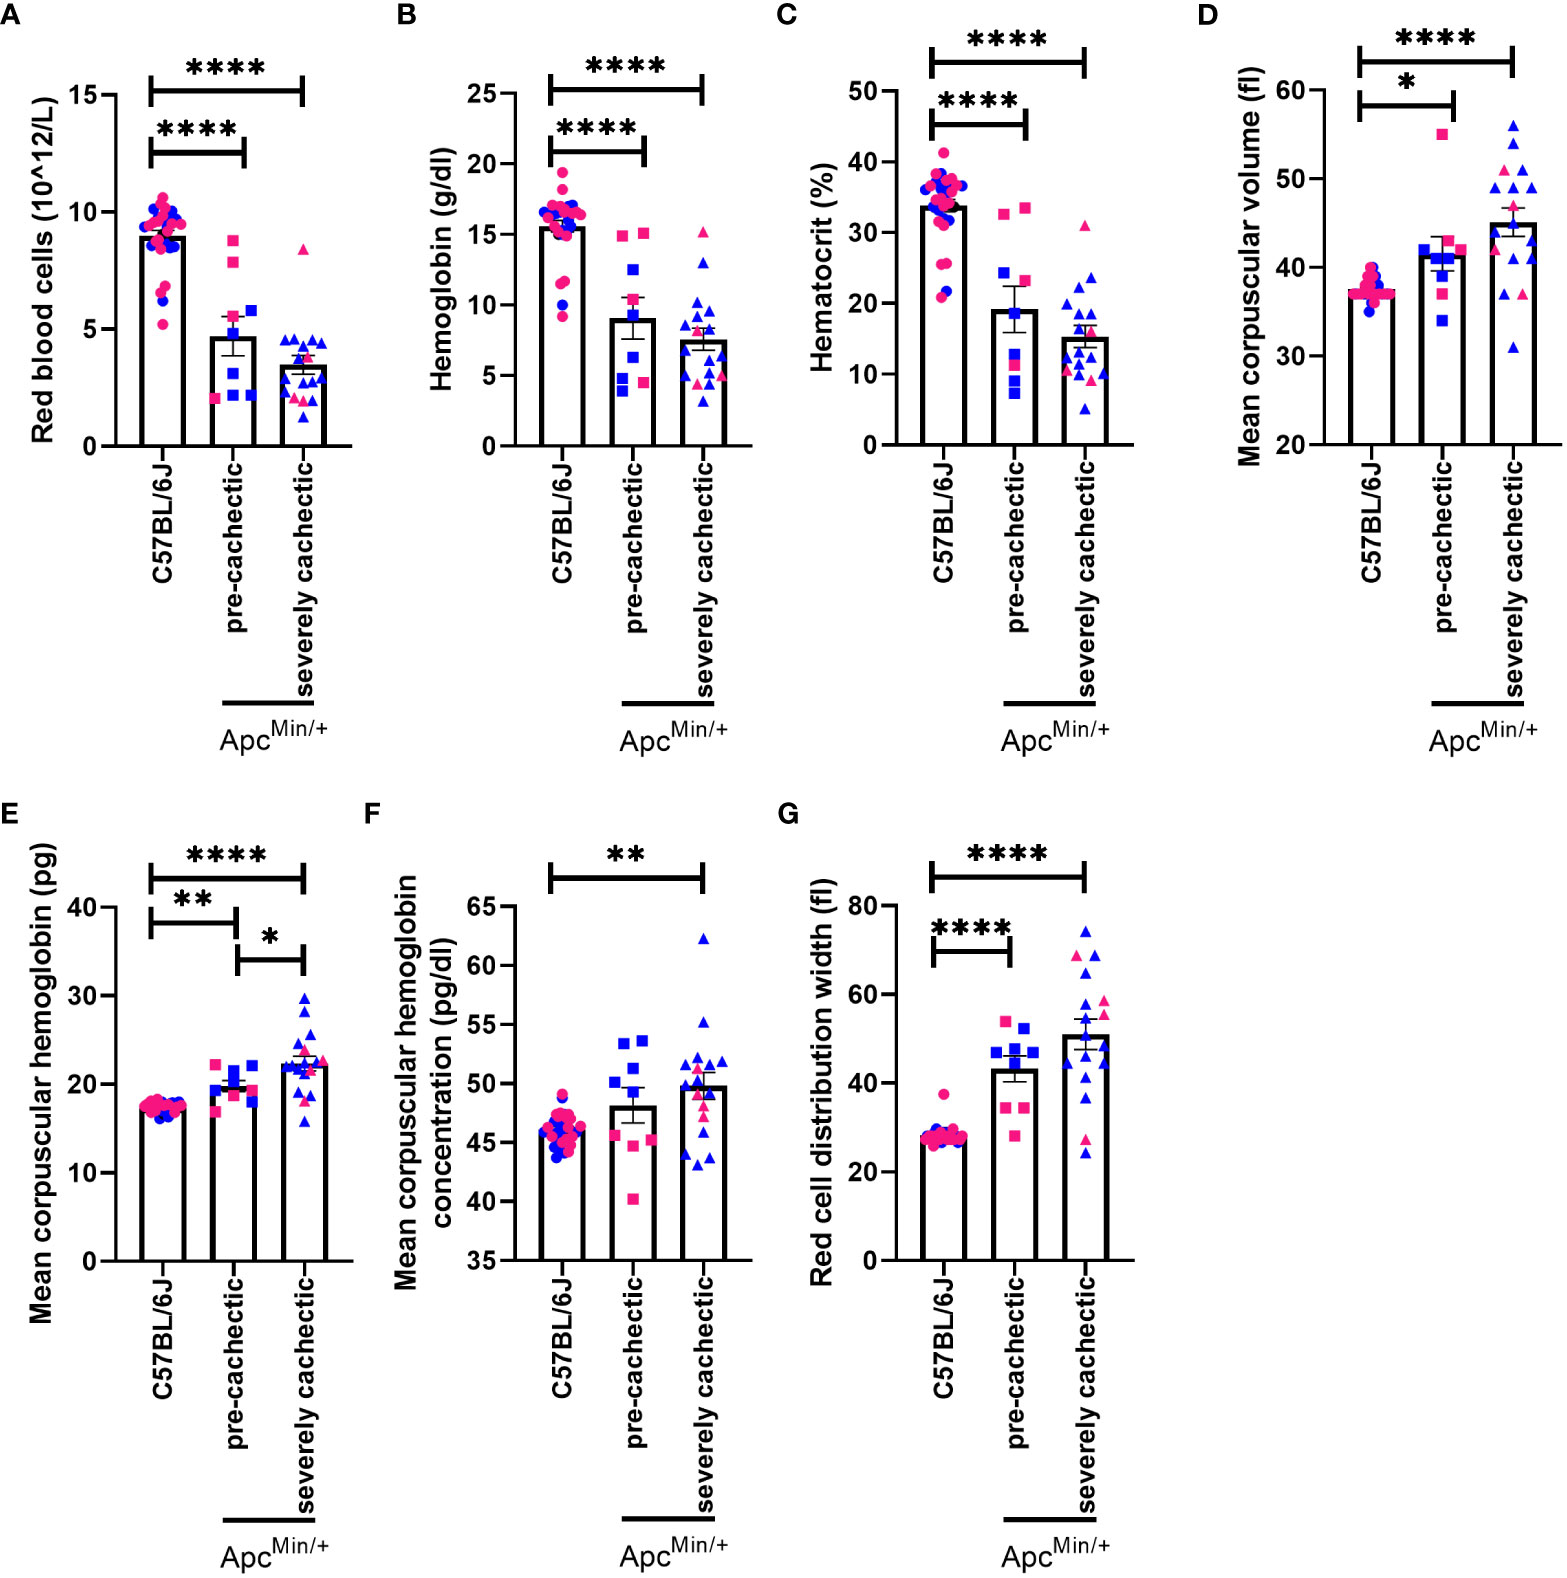
Figure 3 Hematological profile in male and female ApcMin/+ mice during cancer cachexia progression. (A) Red blood cell (B) hemoglobin (C) hematocrit, (D) mean corpuscular volume, (E) mean corpuscular hemoglobin, (F) mean corpuscular hemoglobin concentration (G) red blood cell distribution width in the blood of non-cancer control C57BL/6J (n=24), pre-cachectic ApcMin/+ (n=9), and severely cachectic ApcMin/+ mice (n=17). Pink represents females, and blue represents male mice. One-way AVONA followed by a Tukey’s multiple comparisons test. *p<0.05, **p<0.01, and ****p<0.0001.
Since a very high platelet count has been associated with increased risk of developing cachexia-related cancers (32) and correlated with one-year overall survival in patients with cancer cachexia (17, 18), we sought to measure platelets at different stages of cancer cachexia. We observed that platelet count in pre-cachectic ApcMin/+ mice was significantly elevated compared to C57BL/6J mice (Figure 4A, p=0.0234). There was a trend towards an increased platelet count in severely cachectic ApcMin/+ mice (p=0.0551). In terms of the size of platelets, severely cachectic ApcMin/+ mice showed an increase in mean platelet volume compared to C57BL/6J mice (Figure 4B, p=0.0142). Elevated mean platelet volume is indicative of platelet activation (48). There was no variation in platelet distribution observed between groups (Figure 4C).
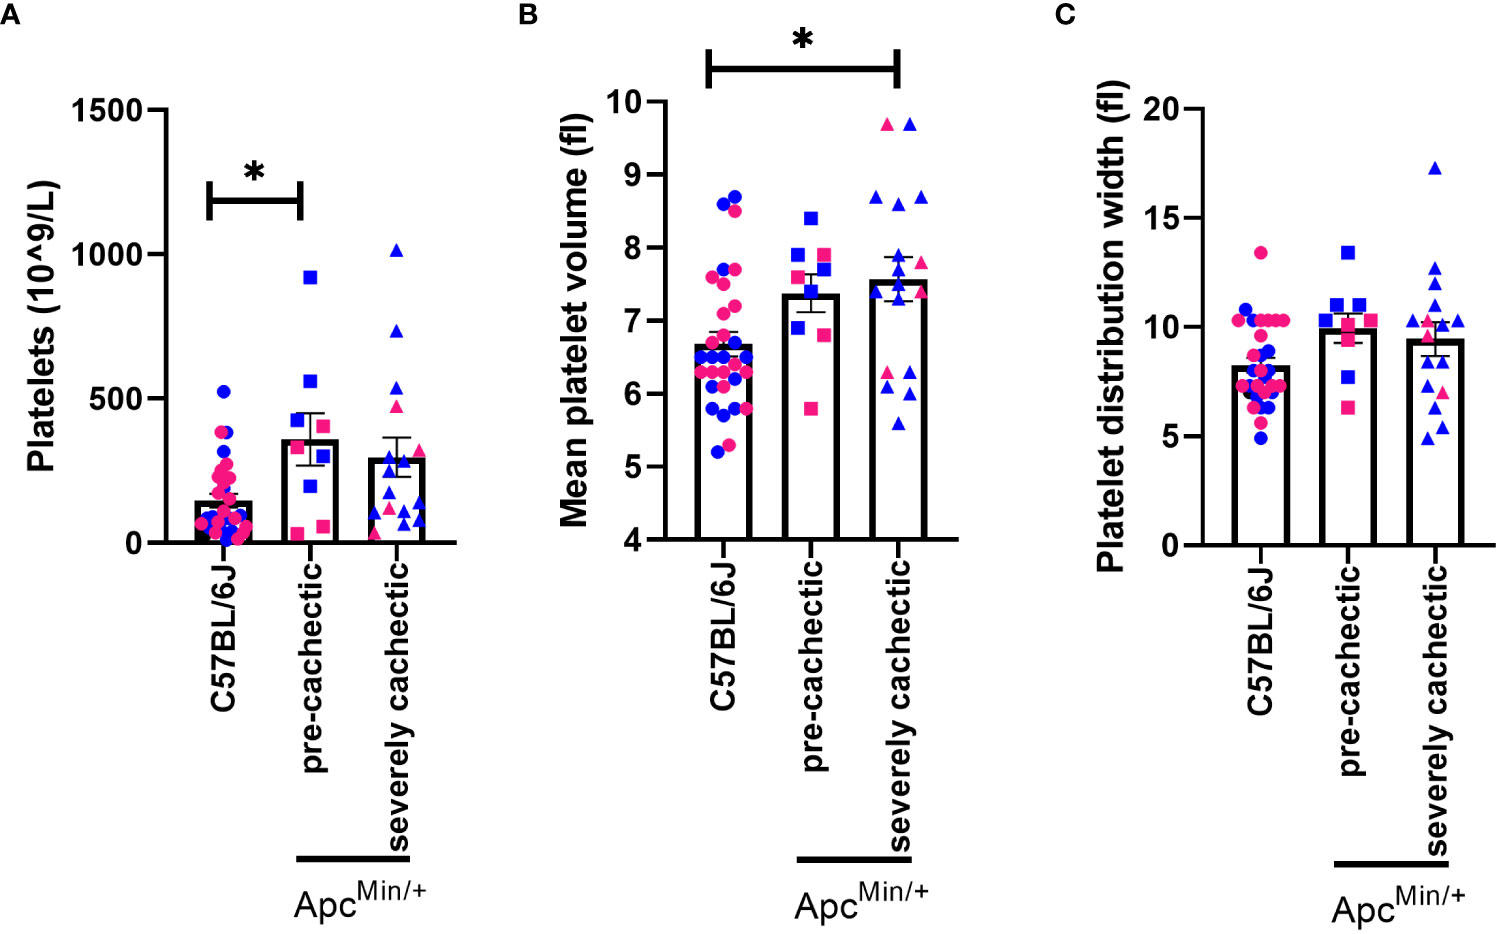
Figure 4 Platelet profile in male and female ApcMin/+ mice during cancer cachexia progression. (A) Platelet, (B) mean platelet volume and, (C) platelet distribution width in the blood of non-cancer control C57BL/6J (n=24), pre-cachectic ApcMin/+(n=9), and severely cachectic ApcMin/+ mice (n=17). Pink represents females, and blue represents male mice. One-way AVONA followed by a Tukey’s multiple comparisons test. *p<0.05.
3.3 Behavioral and physiological profiles of ApcMin/+ pre-cachectic male and female mice
To better understand the behavioral and physiological profile of pre-cachectic ApcMin/+ mice we assessed ambulatory activity, sleep patterns, forelimb strength, and neuromuscular function. Pre-cachectic ApcMin/+ mice showed a significant decrease in directed locomotor activity during the night cycle (active cycle) compared to C57BL/6J mice (Figure 5A). However, no change in stereotypical behavior (grooming, rearing, etc.) was observed between pre-cachectic ApcMin/+ and C57BL/6J mice (Figure 5B). There was a significant main effect of time for increased sleep behavior during the night cycle in pre-cachectic ApcMin/+ mice (Figure 5C). No changes were observed in grip strength and neuromuscular function between pre-cachectic ApcMin/+ and C57BL/6J mice (Figures 5D, E, p=0.1764 and p=0.8019).
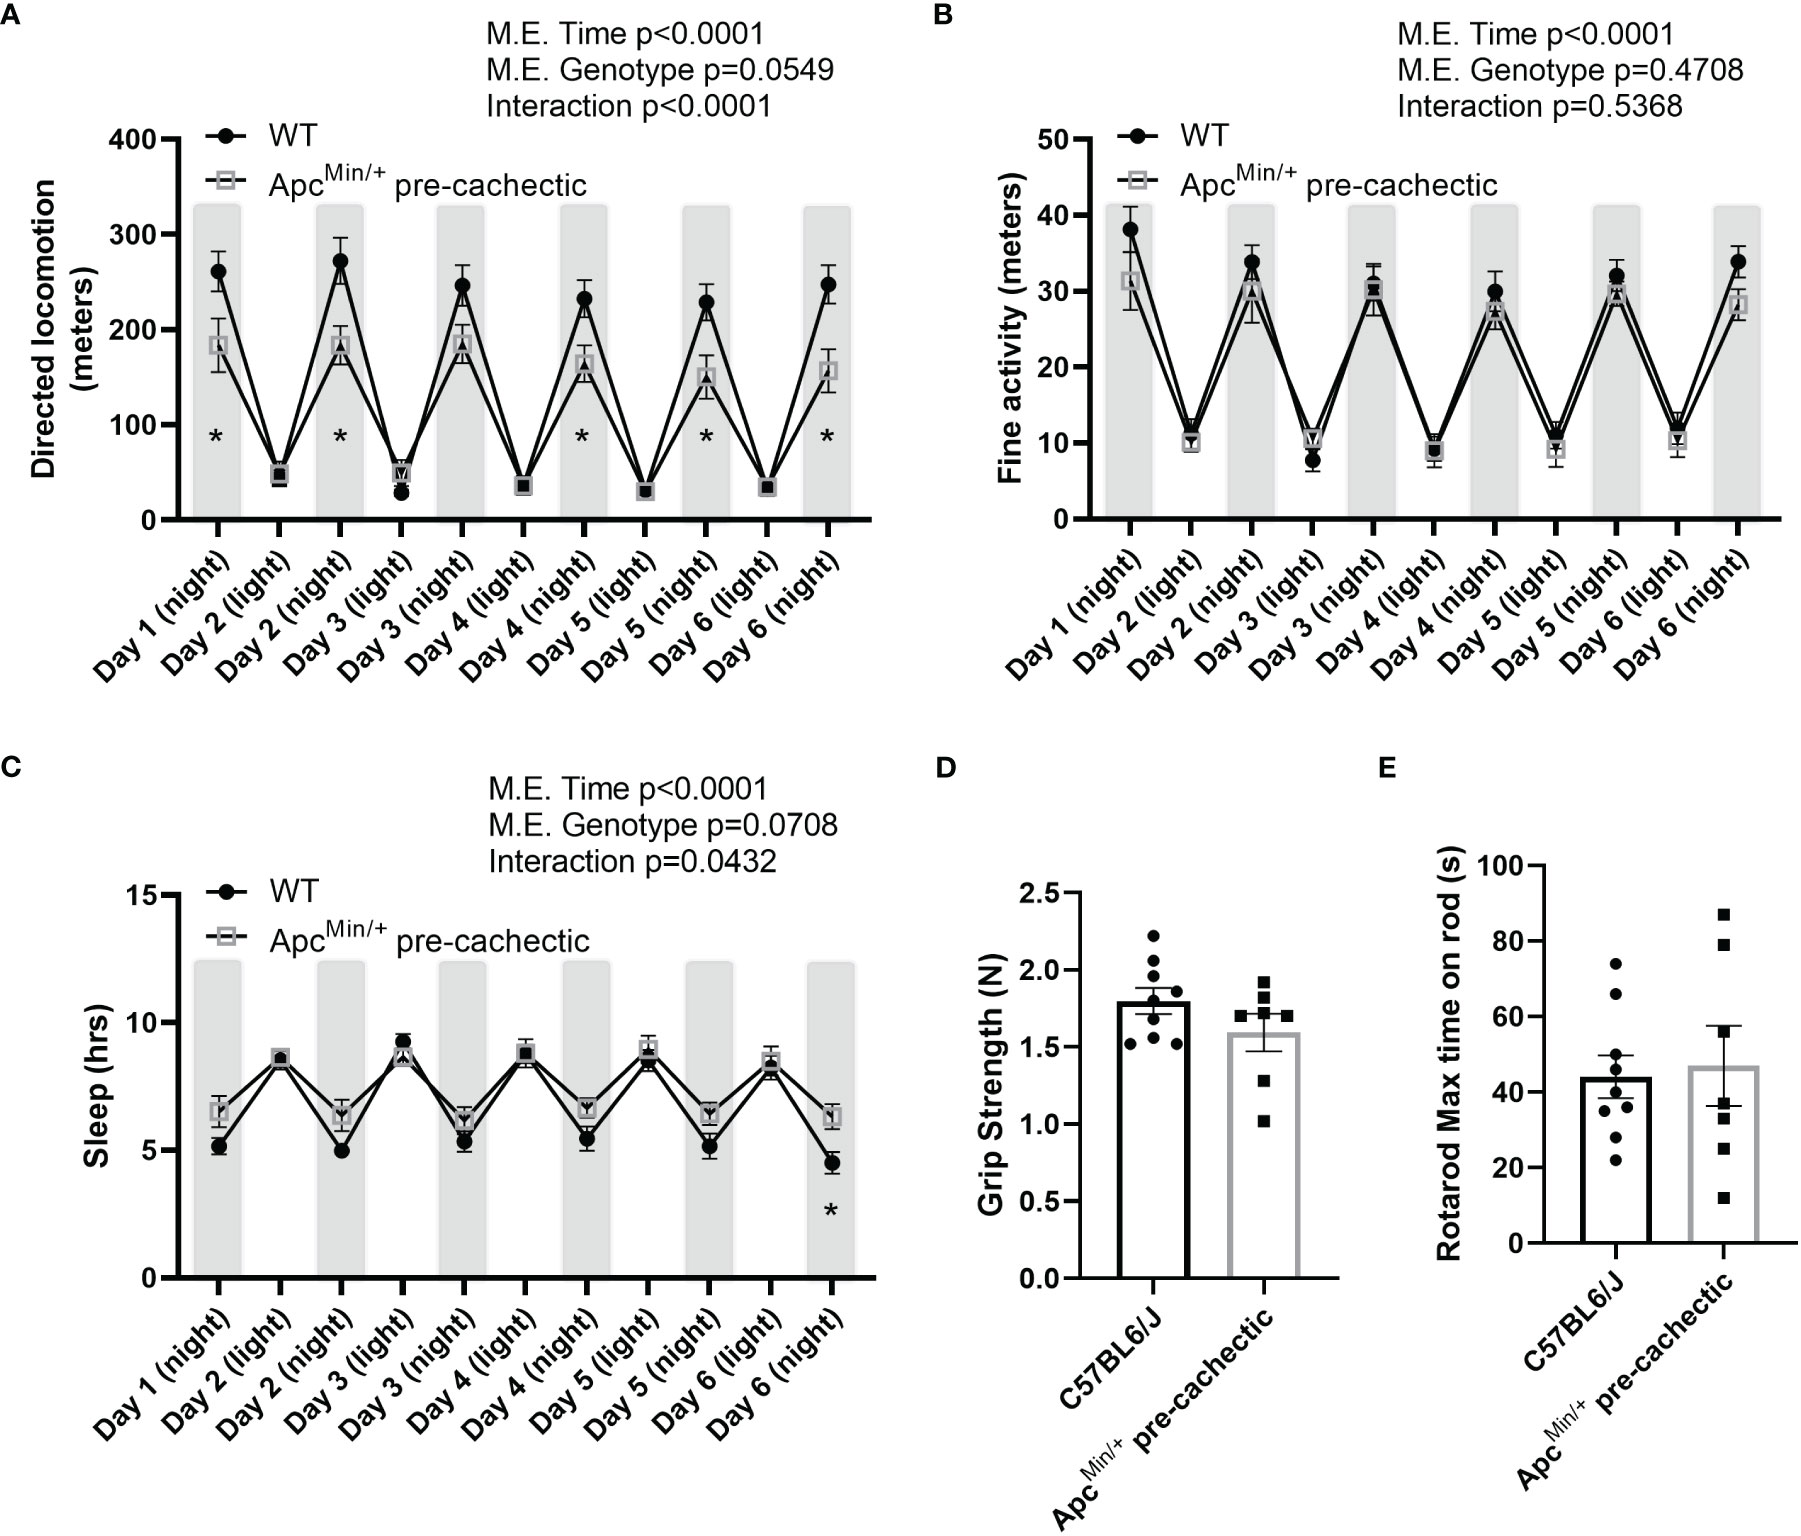
Figure 5 Behavioral and metabolic phenotype profile in pre-cachectic male and female ApcMin/+ mice over six days. (A) Directed locomotor activity, (B) stereotypic behavior (grooming, rearing, etc.), and (C) sleeping hours during the light and dark cycle in non-cancer control C57BL/6J (n=9) and pre-cachectic ApcMin/+ (n=7) mice. Mixed-effects model followed by Sidak’s multiple comparison (D) Grip strength and (E) rotarod test. Two-tailed unpaired t-test. *p<0.05.
Since previous studies in mice have indicated that physical inactivity and systemic metabolic dysfunction are associated with accelerated cachexia (49), we sought to investigate the impact of pre-cachexia on indirect calorimetry outcomes. We observed that pre-cachectic ApcMin/+ mice significantly decreased total and resting energy expenditure, oxygen consumption, and carbon dioxide production compared to C57BL/6J mice (Table 2). No changes were observed in mean respiratory exchange ratio, energy intake, and mean sleep. However, a significant decrease was observed in mean distance traveled in pre-cachectic ApcMin/+ mice compared to C57BL/6J mice.
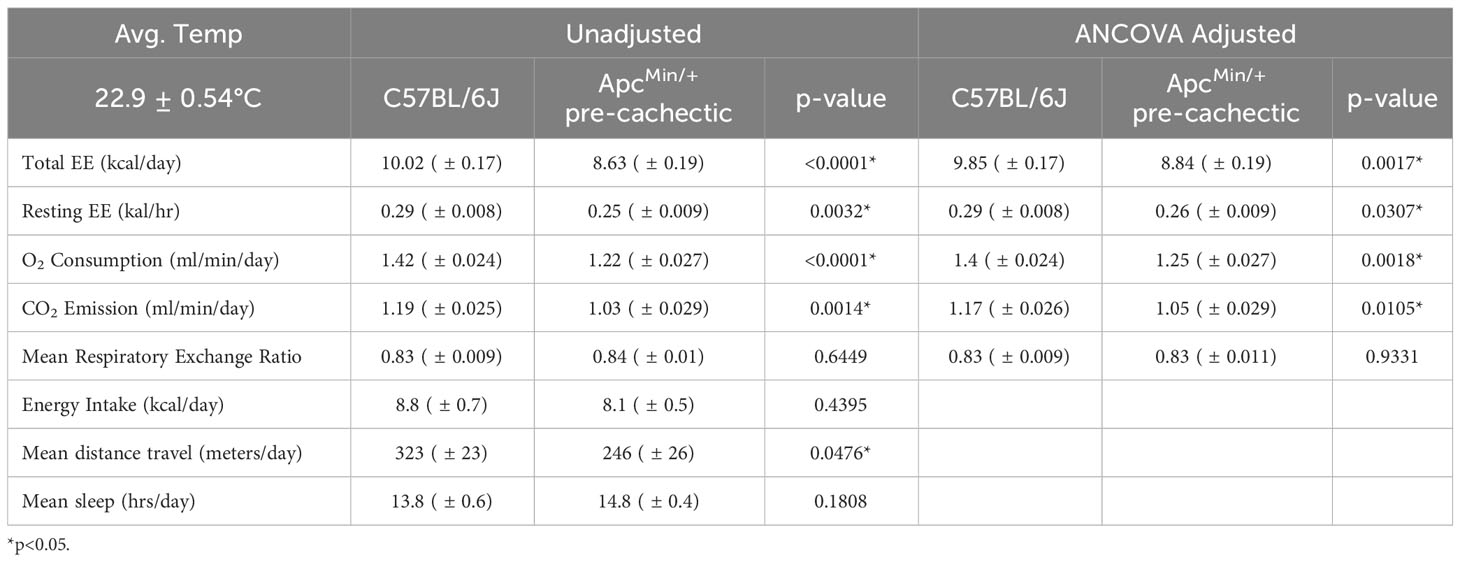
Table 2 Metabolic phenotyping of pre-cachectic ApcMin/+ mice.
3.4 Skeletal muscle gene expression of immune cell markers during cancer cachexia progression in ApcMin/+ male and female mice
To determine the possible involvement of immune cells in the progression of cancer cachexia, we measured the gene expression of nonexclusive conventional immune cell markers in the skeletal muscle of non-cancer C57BL/6J mice, as well as pre-cachectic and severely cachectic ApcMin/+ mice. We observed a significant increase in the expression of Ly6g (neutrophil marker) in severely cachectic ApcMin/+ mice compared to pre-cachectic ApcMin/+ mice (Figure 6A, p=0.0178), but not C57BL/6J mice. Interestingly, severely cachectic ApcMin/+ mice showed an increase in CD206 (Figure 6C) (mannose receptor c-type 1, M2 macrophage marker, p=0.0464) and IL-10 (Figure 6D) (anti-inflammatory cytokine related to M2 macrophages, p=0.0216), but no change in F4/80 (a general marker of macrophages) gene expression compared to C57BL/6J mice (Figure 6B, p=0.1450). No difference in the gene expression of IL-4 was observed between the groups (Figure 6E, p=0.8874). We observed an increase in the gene expression of the pro-inflammatory cytokine IL-1β in pre-cachectic ApcMin/+ mice compared to C57BL/6J mice (p=0.0021) and severely cachectic ApcMin/+ mice (Figure 6F, p=0.0387). However, no changes in IL-6 and TNFα were observed between the groups (Figures 6G, H, p=0.6966, and p=0.6415).
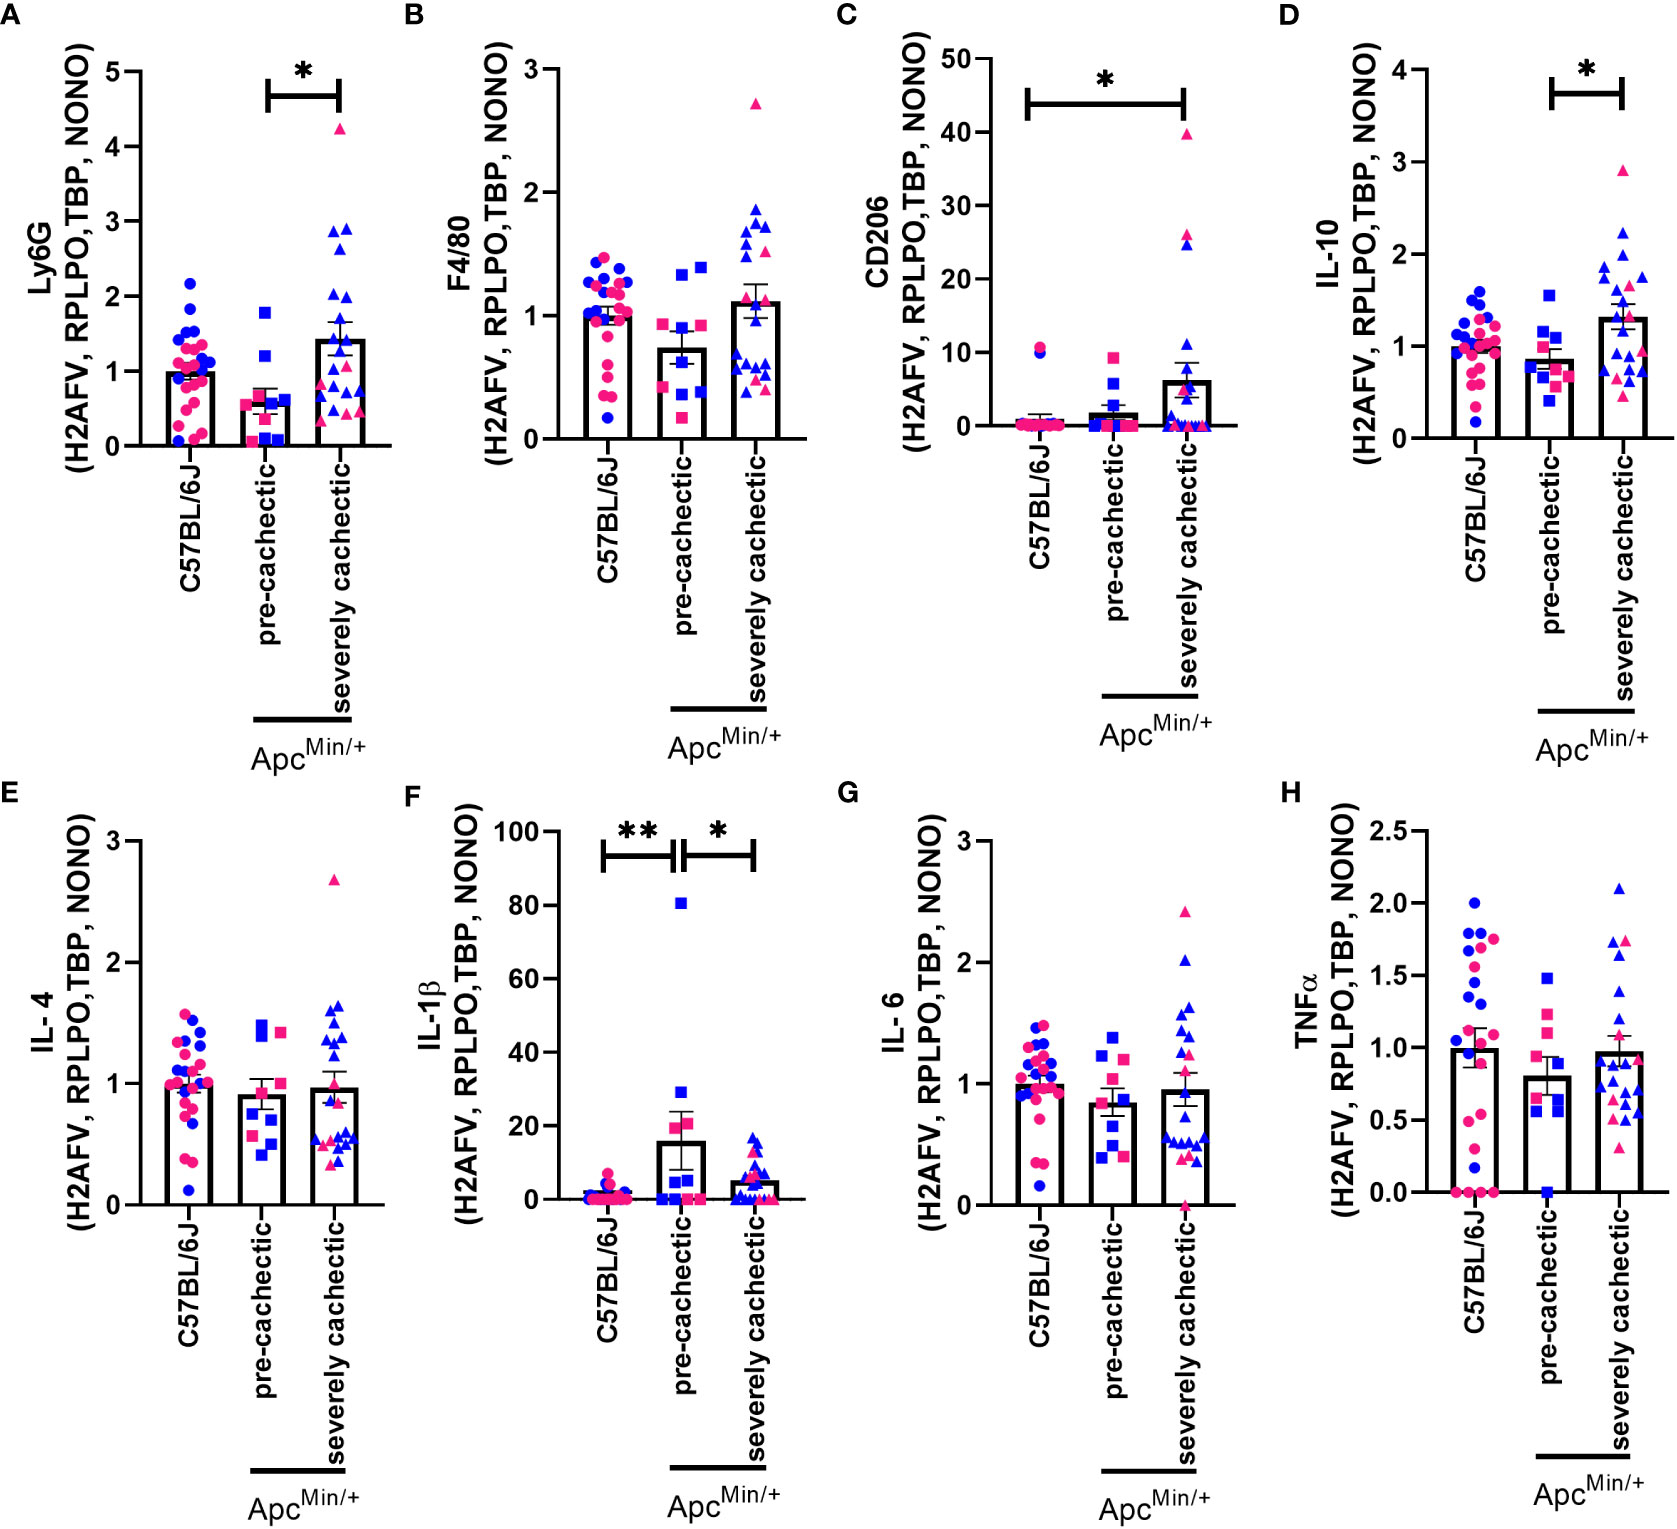
Figure 6 Gene expression of immune cell markers in the gastrocnemius muscle of male and female ApcMin/+ mice during cancer cachexia progression. (A) Ly6G, (B) F4/80, (C) CD206, (D) IL-10, (E) IL-4, (F) IL-1β, (G) IL-6, and (H) TNFα mRNA expression in non-cancer control C57BL/6J (n=24), pre-cachectic (n=10), and severely cachectic ApcMin/+ mice (n=21). Pink represents females, and blue represents male mice. All genes were normalized to the following reference genes H2AFV, RPLPO, TBP, and NONO. One-way AVONA followed by a Tukey’s multiple comparisons test. *p<0.05, and **p<0.01.
3.5 Skeletal muscle gene expression of the TGFβ signalling pathway during cancer cachexia progression in ApcMin/+ male and female mice
Since platelets can promote the release of various growth factors linked to fibrosis (26), and collagen deposition has been observed in cancer cachexia (27, 50), we evaluated whether the TGFβ signalling pathway was modulated in the pre-cachectic and severely cachectic stages. No difference in the gene expression of TGFβ-1 was observed between the groups (Figure 7A, p=0.1816). However, a significant increase in the gene expression of TGFβ-2 and TGFβ-3 was observed in the skeletal muscle of pre-cachectic ApcMin/+ mice compared to C57BL/6J mice (Figures 7B, C, p=0.0454 and p=0.0021). Additionally, severely cachectic ApcMin/+ mice exhibited a significant decrease in TGFβ-3 compared to pre-cachectic ApcMin/+ mice (p=0.0056). We then sought to examine the downstream canonical pathways of TGFβ. No change was observed in SMAD2 between the groups (Figure 7D, p=0.1541). However, an increase in SMAD3 expression was observed in pre- cachectic ApcMin/+ mice compared to severely cachectic ApcMin/+ mice (Figure 7E, p=0.0475). Finally, we investigated the expression of fibrinogen gamma chain, a molecule essential for platelet aggregation (51), whose synthesis has been elevated in patients with cancer and cachexia (52, 53). A significant increase in the expression of fibrinogen gamma chain was observed in pre-cachectic ApcMin/+ mice (p=0.0312) compared to severely cachectic ApcMin/+ mice (Figure 7F).
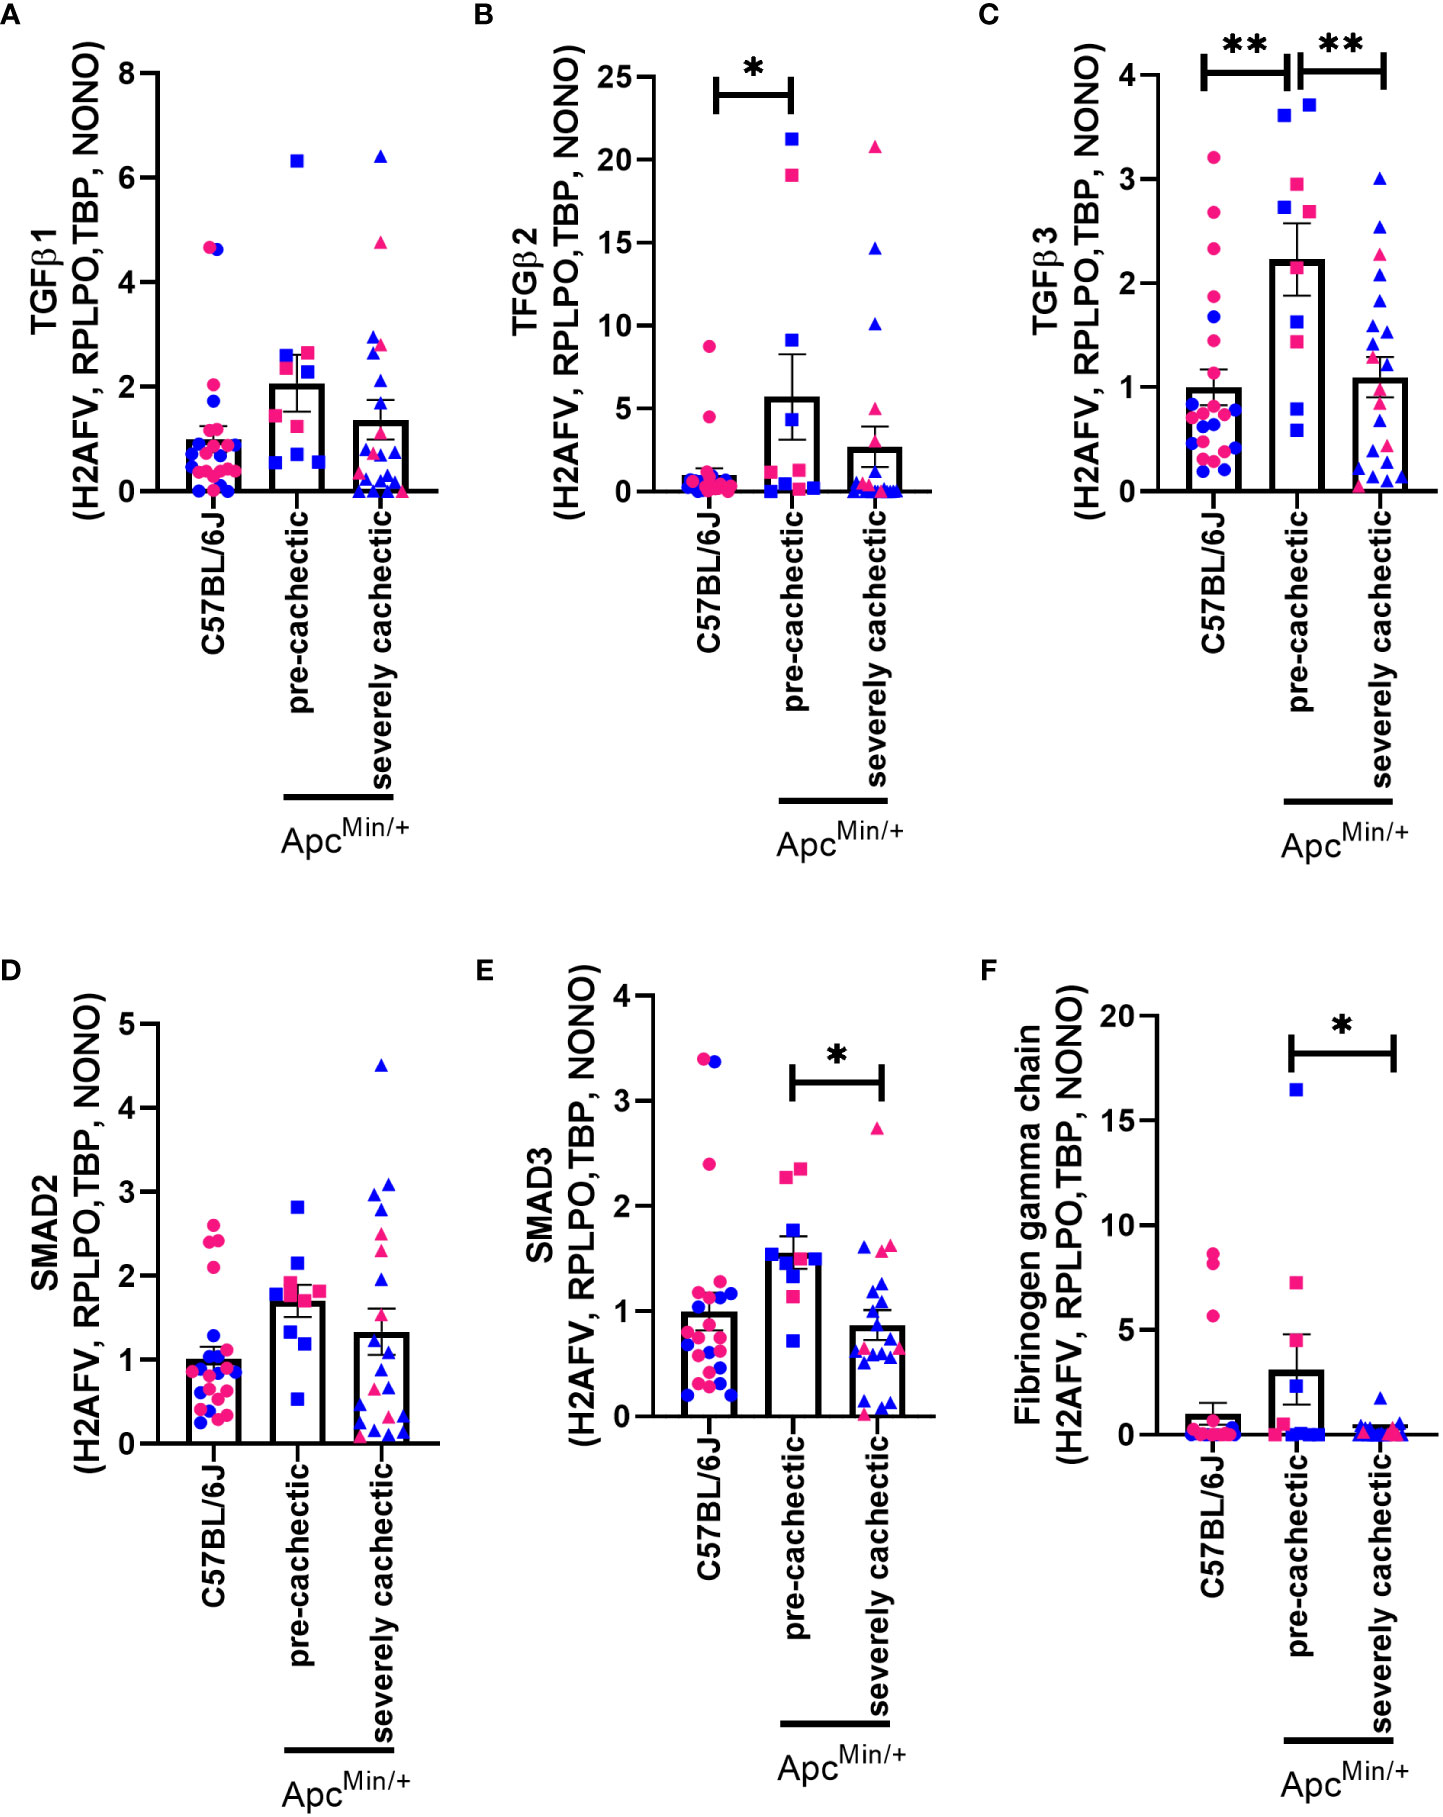
Figure 7 Gene expression of fibrogenic markers in the gastrocnemius muscle of male and female ApcMin/+ mice during cancer cachexia progression. (A) TGFβ1, (B) TFGβ2, (C) TGFβ3, (D) SMAD2, (E) SMAD3, and (F) fibrinogen gamma chain mRNA expression of non-cancer control C57BL/6J (n=24), pre-cachectic (n=10), and severely cachectic ApcMin/+ mice (n=21). Pink represents females, and blue represents male mice. All genes were normalized to the following reference genes H2AFV, RPLPO, TBP, and NONO. One-way AVONA followed by a Tukey’s multiple comparisons test. *p<0.05, and **p<0.01.
3.6 Platelet profile in two models of cancer cachexia, LLC-tumor bearing mice and C26-tumor bearing mice
To confirm whether the increase in platelet number or platelet activation occurs in other models of muscle wasting, we examined the platelet profile in the Lewis lung carcinoma (LLC) and colon 26 adenocarcinoma (C26) models of cancer cachexia. Tumor weight in LLC-tumor bearing mice with less than five percent body weight loss (2.353 ± 0.6105 grams) and more than ten percent body weight loss (1.771 ± 0.5006 grams) were not significantly different (p=0.5129, data not shown). No difference was observed in the platelet count of LLC-tumor bearing mice (Figure 8A, p=0.0756). However, a significant increase in mean platelet volume was observed in severely cachectic LLC-tumor bearing mice compared to non-cancer C67BL/6J mice and LLC-tumor bearing mice with less than five percent body weight loss (Figure 8B, p=0.0079, p=0.0270). No significant difference was observed in platelet distribution width between the groups (Figure 8C, p=0.0983). In the case of C26-tumor bearing mice, an increase in platelet count was observed compared to non-cancer CD2F1 mice (Figure 9A, p<0.0001). There were no changes observed in mean platelet volume and platelet distribution width between C26-tumor bearing mice and non-cancer CD2F1 mice (Figures 9B, C, p=0.4020 and p=0.3373).
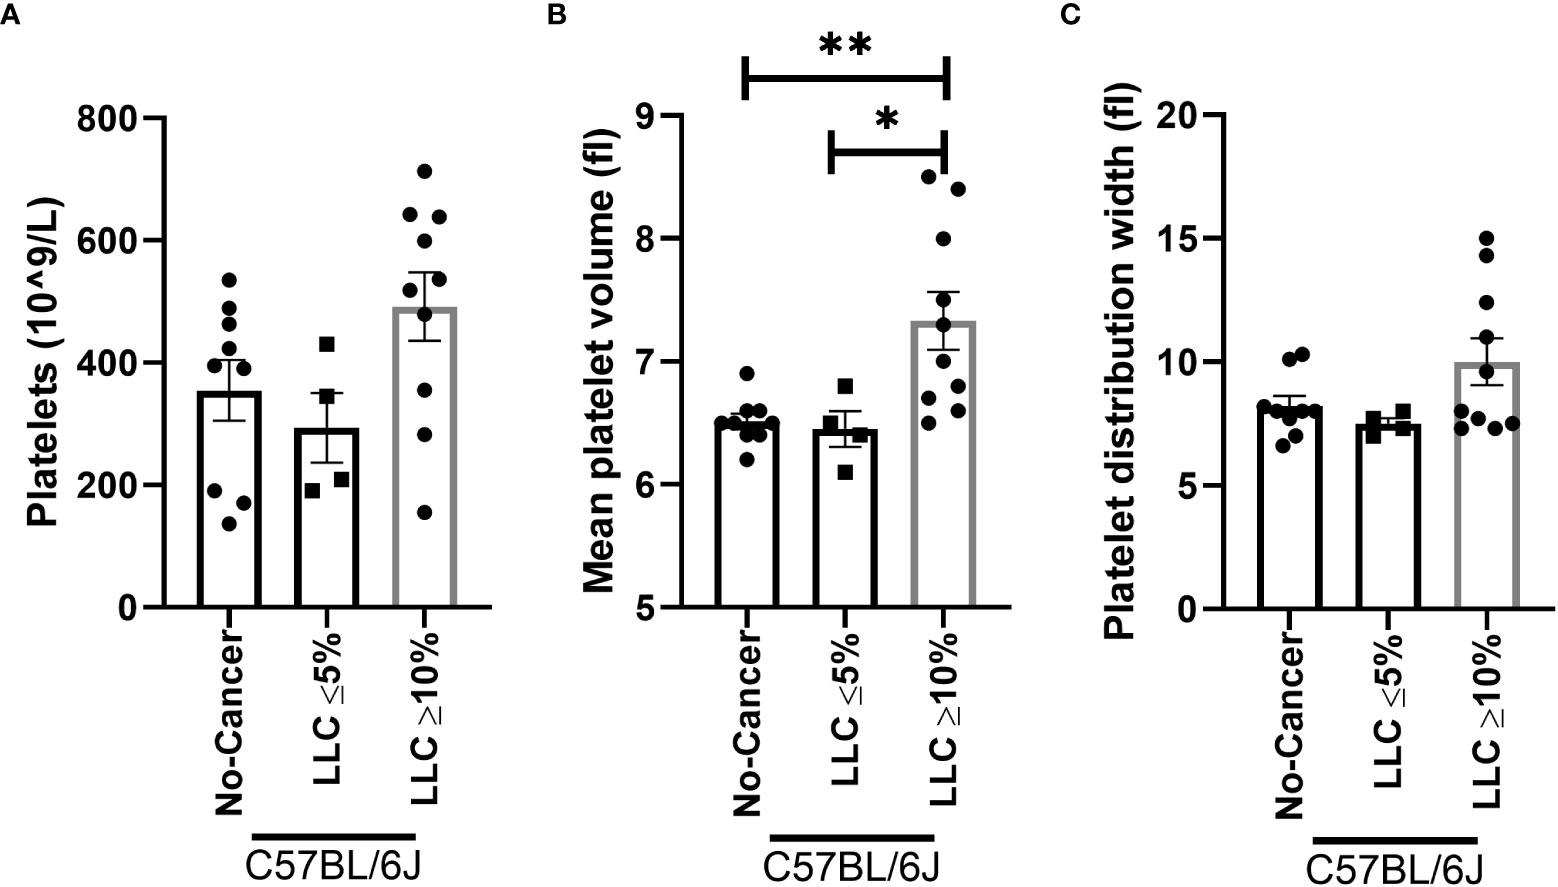
Figure 8 Platelet profile in male LLC-tumor bearing mice. (A) Platelets, (B) mean platelet volume, and (C) platelet distribution width in non-cancer control C57BL/6J mice (n=9), LLC-tumor bearing mice with less than 5% body weight loss (n=4), and LLC-tumor bearing mice with more than 10% body weight loss (n=10). One-way AVONA followed by a Tukey’s multiple comparisons test. *p<0.05, and **p<0.01.
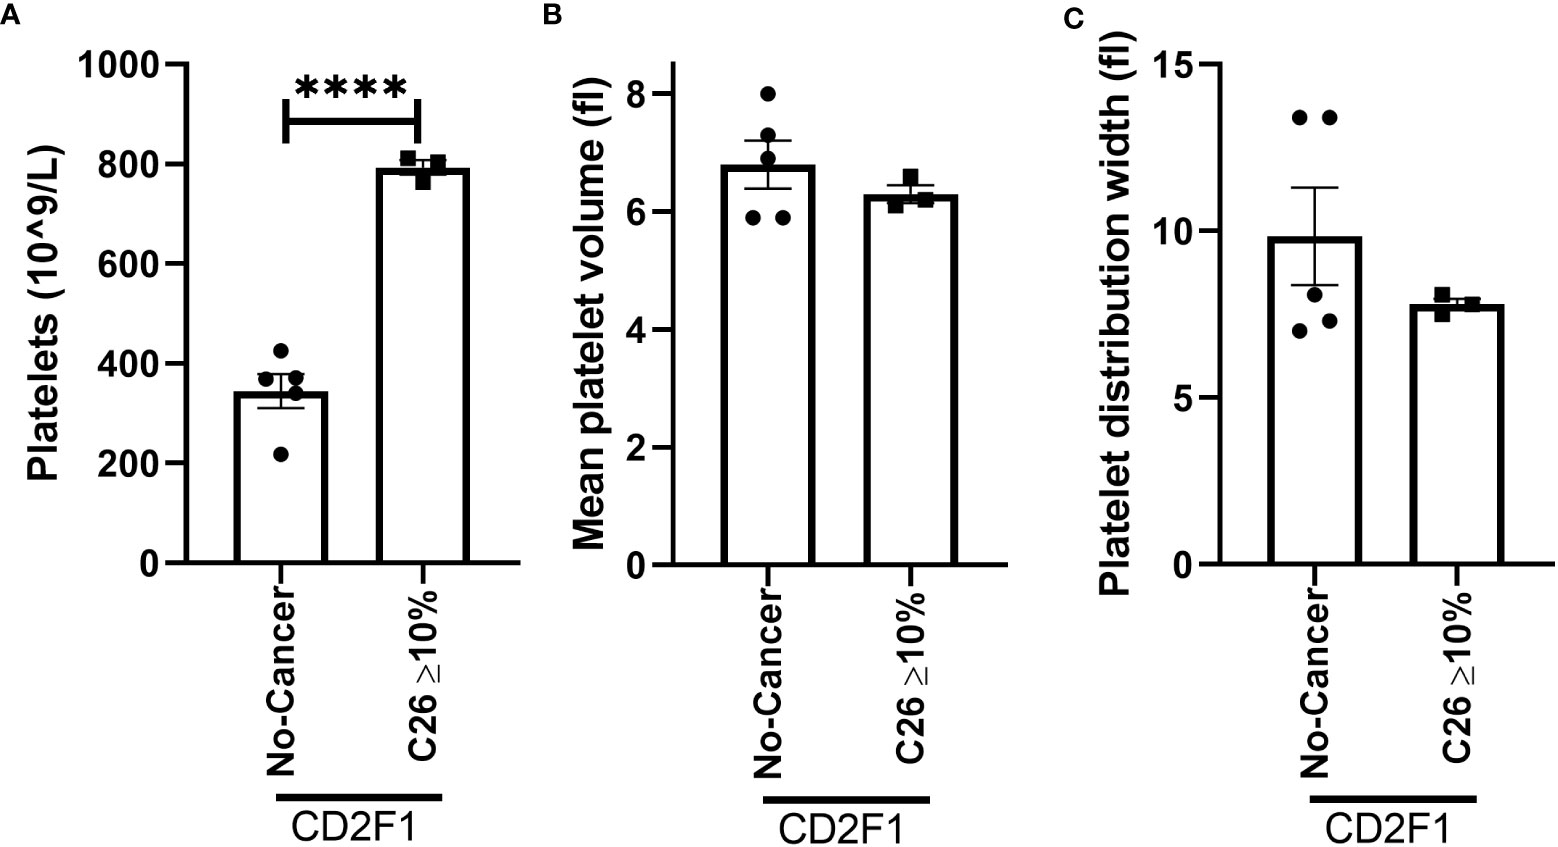
Figure 9 Platelet profile in male C26-tumor bearing mice. (A) Platelets, (B) mean platelet volume, and (C) platelet distribution width in non-cancer control CD2F1 mice (n=5) and C26-tumor bearing mice with more than 10% body weight loss (n=3). Two-tailed unpaired t-test. ****p<0.0001.
4 Discussion
Cachexia, a complex wasting syndrome (1, 2), significantly affects the quality of life and treatment options of cancer patients (6). It is most commonly observed in pancreatic, lung, colon, and stomach cancers (4, 33). While muscle wasting has been linked with pro-inflammatory cytokines the immunopathological aspects of the syndrome remain unexplored. Prior to cancer diagnosis, studies have noted an increase in platelet number in humans (32). Platelets can also interact with cancer cells and the tumor microenvironment, contributing to tumor progression (54–56). Additionally, cancer treatments in humans has been associated with platelet activation, indicated by high mean platelet volume (57). Elevated platelet levels are consistently correlated with a poor prognosis in cancer (28–31). Moreover, a strong association has been observed between high platelet count and decreased survival in cachectic individuals (12, 17, 18). In this study, we sought to investigate the systemic platelet profile and immunomodulatory molecules in the skeletal muscle during the progression of cancer cachexia. Our findings reveal a novel discovery that platelet elevation precedes muscle wasting and platelet activation intensifies during severely cachectic stages. Additionally, we observed that anemia and physical inactivity precede muscle mass loss. Furthermore, our study highlights the involvement of the TGFβ signaling pathway in early stages and immune cells in late stages of cancer cachexia. Overall, these findings suggest that targeting platelets could open new research avenues for cancer cachexia.
To investigate the link between platelet and muscle wasting, we analyzed blood samples using automated hematology in three established cancer cachexia models that recapitulate the human condition (58–63). Few studies have explored platelet count in rodent models with cancer cachexia (64, 65). Our study revealed increased platelet count and activation across multiple stages of cancer cachexia. Reddel et. al., observed elevated platelet count in C26-tumor bearing mice at late stages of cancer cachexia but not in non-cachectic mice (64). Similarly, Thomas et. al., reported an increase in systemic platelets (CD41+ cells) in LLC-tumor bearing mice and Panc02-tumor bearing mice (65). In humans, high platelets counts have been associated with renal cachexia in patients with end-stage renal disease, where the protein catabolic rate predicted platelet count (12). These findings suggest that platelets might play a role in the initiation and progression of muscle wasting.
Besides hemostasis, platelets play a critical role in inflammation (37). They interact with immune cells such as macrophages and neutrophils (24, 25). In severely cachectic mice, we observed an increase in neutrophils and a decrease in lymphocytes, with no changes in monocytes. These changes in white blood cells have been previously reported in cancer patients (66–70). Similarly, we found an increase in the expression of Ly6G, CD206, and IL-10 in the skeletal muscle of severely cachectic mice. Macrophage recruitment has been observed in the skeletal muscle of severely cachectic patients (27). Depletion of neutrophils in rodents slows down muscle wasting in mice with pancreatic and lung cancer (25, 71). We also observed an increase in IL-1β in the skeletal muscle of pre-cachectic mice, but not at the severely cachectic stage. IL-1β can be secreted from various cells including monocytes, macrophages, neutrophils, and platelets (72–75). IL-1β has been implicated in cancer cachexia in humans (76). It is possible that the increase in platelets leads to an increase in IL-1β. Conducting future experiments to deplete and adoptively transfer platelets could provide valuable insights into the role of platelets in modulating neutrophils, macrophages, and lymphocytes in cancer cachexia.
Other evidence that sets platelets as an important contributor to cancer cachexia is their capacity to promote latent TGFβ activation (77). In both pre-cachexia and cachexia stages, elevated expression of the canonical signaling pathway of TGFβ1 has been observed in the plasma of cancer patients (67). Similarly, the skeletal muscle of pancreatic cachectic patients exhibit elevated transcripts involved in TGFβ activation and the develop of fibrosis, which correlates with decreased survival (27). In our study, we observed an increase in TGFβ2, TGFβ3, and SMAD3, but not TGFβ1, in the skeletal muscle of pre-cachectic mice. However, an increase in TGFβ1 has been observed in early cachexia in LLC-tumor bearing mice (50). Overexpression and administration of TGFβ2 has been shown to induce cachexia in mice, rats, and humans (78–80). While extensive research has been conducted on the role of TGFβ1 in other wasting conditions such as muscle dystrophy (50, 81–89), the contribution of TGFβ2 and TGFβ3 to cancer cachexia remains unexplored.
We found anemia in ApcMin/+ mice starting at the pre-cachectic stage and continuing into the severely cachectic stage. Baltgalvis et al., demonstrated that anemia occurs before reductions in wheel running performance in ApcMin/+ mice (90). Anemia has also been observed in patients with cancer cachexia and has been shown to predict physical activity (91). In our study, we observed a decrease in direct locomotor activity in ApcMin/+ mice, even without changes in grip strength and rotarod performance. Anemia and physical inactivity have been observed in other cancer cachexia models, such as LLC- and C26-tumor bearing mice (49, 92, 93). Therefore, we speculate that physical inactivity may be caused by anemia. However, others have attributed the decline in activity performance to cancer-related fatigue (92, 94). Whether anemia in cancer cachexia reduces oxygen levels in skeletal muscle or the brain, leading to physical inactivity and fatigue, remains unknown.
A limitation of this study is the lack of power to test for sex differences. In this study, no assessments were performed to determine the estrus cycle in female mice nor were hormonal concentrations measured in either sex. Previous observations have indicated a decline in ovarian function in ApcMin/+ female mice (95), while pre-clinical and clinical studies have suggested potential sex differences during the initiation and progression of cancer cachexia (42, 50, 96–99). Some studies have separated males and females to test the data, but this approach does not determine whether the sexes responded differently. Others have tested sex as a factor in a factorial design without including if the interaction was significant. Additionally, studies have not accounted for the differences in hormonal status between females and also males. Remarkably, approximately seventy percent of biological science manuscripts have reported sex differences (sexual dimorphism, sex-dependent, and sex-specific) without statistically comparing the sexes (100). Consequently, further studies are necessary to investigate whether sex differences exist in cancer cachexia and whether hormonal status contributes to these differences.
While our understanding of the pro-inflammatory cytokines, IL-6 and TNF-α leading to cancer cachexia has been established, the immunopathogenesis of muscle wasting has been overlooked. In general, we sought to investigate the blood cellular elements and immune adaptations throughout the progression of cancer cachexia, shedding new light on the role of early platelet presence and immune cell infiltration in this syndrome. Our findings reveal that platelet count is elevated prior to cachexia development in ApcMin/+ mice and can become activated during its progression. Furthermore, we observed an increased expression of TGFβ2, TGFβ3, and SMAD3 in the skeletal muscle of pre-cachectic ApcMin/+ mice. In severely cachectic mice we noted elevated gene expression related to neutrophils and anti-inflammatory macrophages. Additionally, we found an increase in anemia associated with physical inactivity. Our behavioral and metabolic phenotyping findings suggest that pre-cachectic ApcMin/+ mice decrease physical activity to conserve energy. Overall, our findings demonstrate altered platelet status during early and late stages of cachexia, paving the way for further investigation of platelets in the field of cancer cachexia.
Data availability statement
The original contributions presented in the study are included in the article/supplementary materials, further inquiries can be directed to the corresponding author/s.
Ethics statement
The animal study was approved by Institutional Animal Care and Use Committee (IACUC) of the University of South Carolina. The study was conducted in accordance with the local legislation and institutional requirements.
Author contributions
KV: Conceptualization, Data curation, Formal Analysis, Funding acquisition, Project administration, Resources, Supervision, Writing – review & editing. PC: Conceptualization, Data curation, Formal Analysis, Writing – original draft, Writing – review & editing. CU: Conceptualization, Data curation, Formal Analysis, Writing – review & editing. EP: Data curation, Formal Analysis, Writing – review & editing. AA: Writing – original draft, Writing – review & editing. AB: Writing – original draft, Writing – review & editing. EJ: Data curation, Formal Analysis, Writing – review & editing. AA: Data curation, Formal Analysis, Writing – review & editing. MH: Data curation, Formal Analysis, Writing – review & editing. BV: Data curation, Formal Analysis, Writing – review & editing. TC: Data curation, Formal Analysis, Writing – review & editing. EM: Data curation, Formal Analysis, Funding acquisition, Resources, Supervision, Writing – review & editing. RE: Conceptualization, Data curation, Funding acquisition, Resources, Supervision, Writing – review & editing.
Funding
This research received support from the Department of Pathology, Microbiology, & Immunology Startup Funds at the University of South Carolina [KTV, RTE, EAM], the Department of Veterans Affairs, Veterans Health Administration VISN7 [KTV-Research Development Award], VA Office of Research and Development Summer Research Program-Columbia VA Health Care System [AA], and the National Institute of Health [RTE-AT010348; PC and AB-GM066526]. The contents of this manuscript do not represent the views of the U.S. Department of Veterans Affairs or the United States government.
Acknowledgments
The authors would like to express their gratitude to RDA mentors Dr. Frank Spinale and Dr. Michael Ryan for their continuous encouragement and support during grant submission process and data collection.
Conflict of interest
The authors declare that the research was conducted in the absence of any commercial or financial relationships that could be construed as a potential conflict of interest.
Publisher’s note
All claims expressed in this article are solely those of the authors and do not necessarily represent those of their affiliated organizations, or those of the publisher, the editors and the reviewers. Any product that may be evaluated in this article, or claim that may be made by its manufacturer, is not guaranteed or endorsed by the publisher.
References
1. Fearon K, Strasser F, Anker SD, Bosaeus I, Bruera E, Fainsinger RL, et al. Definition and classification of cancer cachexia: an international consensus. Lancet Oncol (2011) 12(5):489–95. doi: 10.1016/S1470-2045(10)70218-7
2. Nemer L, Krishna SG, Shah ZK, Conwell DL, Cruz-Monserrate Z, Dillhoff M, et al. Predictors of pancreatic cancer-associated weight loss and nutritional interventions. Pancreas (2017) 46(9):1152–7. doi: 10.1097/MPA.0000000000000898
3. Arthur ST, Van Doren BA, Roy D, Noone JM, Zacherle E, Blanchette CM. Cachexia among US cancer patients. J Med Econ (2016) 19(9):874–80. doi: 10.1080/13696998.2016.1181640
4. Arthur ST, Noone JM, Van Doren BA, Roy D, Blanchette CM. One-year prevalence, comorbidities and cost of cachexia-related inpatient admissions in the USA. Drugs Context (2014) 3:212265. doi: 10.7573/dic.212265
5. Utech AE, Tadros EM, Hayes TG, Garcia JM. Predicting survival in cancer patients: the role of cachexia and hormonal, nutritional and inflammatory markers. J Cachexia Sarcopenia Muscle (2012) 3(4):245–51. doi: 10.1007/s13539-012-0075-5
6. Takayama K, Atagi S, Imamura F, Tanaka H, Minato K, Harada T, et al. Quality of life and survival survey of cancer cachexia in advanced non-small cell lung cancer patients-Japan nutrition and QOL survey in patients with advanced non-small cell lung cancer study. Support Care Cancer (2016) 24(8):3473–80. doi: 10.1007/s00520-016-3156-8
7. Prado BL, Qian Y. Anti-cytokines in the treatment of cancer cachexia. Ann Palliat Med (2019) 8(1):67–79. doi: 10.21037/apm.2018.07.06
8. Muqaku B, Eisinger M, Meier SM, Tahir A, Pukrop T, Haferkamp S, et al. Multi-omics analysis of serum samples demonstrates reprogramming of organ functions via systemic calcium mobilization and platelet activation in metastatic melanoma. Mol Cell Proteomics (2017) 16(1):86–99. doi: 10.1074/mcp.M116.063313
9. Yoshizawa K, Okamoto T, Moriya K, Izawa A, Satoh Y, Naruto M, et al. Effects of natural human interleukin-6 on thrombopoiesis and tumor progression in tumor-bearing mice. Cancer Lett (1994) 79(1):83–9. doi: 10.1016/0304-3835(94)90067-1
10. Black K, Garrett IR, Mundy GR. Chinese hamster ovarian cells transfected with the murine interleukin-6 gene cause hypercalcemia as well as cachexia, leukocytosis and thrombocytosis in tumor-bearing nude mice. Endocrinology (1991) 128(5):2657–9. doi: 10.1210/endo-128-5-2657
11. Kanzaki M, Soda K, Gin PT, Kai T, Konishi F, Kawakami M. Erythropoietin attenuates cachectic events and decreases production of interleukin-6, a cachexia-inducing cytokine. Cytokine (2005) 32(5):234–9. doi: 10.1016/j.cyto.2005.10.002
12. Molnar MZ, Streja E, Kovesdy CP, Budoff MJ, Nissenson AR, Krishnan M, et al. High platelet count as a link between renal cachexia and cardiovascular mortality in end-stage renal disease patients. Am J Clin Nutr (2011) 94(3):945–54. doi: 10.3945/ajcn.111.014639
13. Liz-Pimenta J, Tavares V, Neto BV, Santos JMO, Guedes CB, Araujo A, et al. Thrombosis and cachexia in cancer: Two partners in crime? Crit Rev Oncol Hematol (2023) 186:103989. doi: 10.1016/j.critrevonc.2023.103989
14. Brass LF, Diamond SL, Stalker TJ. Platelets and hemostasis: a new perspective on an old subject. Blood Adv (2016) 1(1):5–9. doi: 10.1182/bloodadvances.2016000059
15. Kapur R, Zufferey A, Boilard E, Semple JW. Nouvelle cuisine: platelets served with inflammation. J Immunol (2015) 194(12):5579–87. doi: 10.4049/jimmunol.1500259
16. Semple JW, Italiano JE Jr., Freedman J. Platelets and the immune continuum. Nat Rev Immunol (2011) 11(4):264–74. doi: 10.1038/nri2956
17. Liu Y, Ge Y, Li Q, Ruan G, Zhang Q, Zhang X, et al. Association between platelet count with 1-year survival in patients with cancer cachexia. J Cancer (2021) 12(24):7436–44. doi: 10.7150/jca.62788
18. Permuth JB, Clark Daly A, Jeong D, Choi JW, Cameron ME, Chen DT, et al. Racial and ethnic disparities in a state-wide registry of patients with pancreatic cancer and an exploratory investigation of cancer cachexia as a contributor to observed inequities. Cancer Med (2019) 8(6):3314–24. doi: 10.1002/cam4.2180
19. Argiles JM, Busquets S, Garcia-Martinez C, Lopez-Soriano FJ. Mediators involved in the cancer anorexia-cachexia syndrome: past, present, and future. Nutrition (2005) 21(9):977–85. doi: 10.1016/j.nut.2005.02.003
20. Boehlen F, Clemetson KJ. Platelet chemokines and their receptors: what is their relevance to platelet storage and transfusion practice? Transfus Med (2001) 11(6):403–17. doi: 10.1046/j.1365-3148.2001.00340.x
21. Klinger MH. Platelets and inflammation. Anat Embryol (Berl) (1997) 196(1):1–11. doi: 10.1007/s004290050075
22. Weyrich AS, Lindemann S, Zimmerman GA. The evolving role of platelets in inflammation. J Thromb Haemost (2003) 1(9):1897–905. doi: 10.1046/j.1538-7836.2003.00304.x
23. Maouia A, Rebetz J, Kapur R, Semple JW. The immune nature of platelets revisited. Transfus Med Rev (2020) 34(4):209–20. doi: 10.1016/j.tmrv.2020.09.005
24. Deng M, Aberle MR, van Bijnen A, van der Kroft G, Lenaerts K, Neumann UP, et al. Lipocalin-2 and neutrophil activation in pancreatic cancer cachexia. Front Immunol (2023) 14:1159411. doi: 10.3389/fimmu.2023.1159411
25. Deyhle MR, Callaway CS, Neyroud D, D’Lugos AC, Judge SM, Judge AR. Depleting ly6G positive myeloid cells reduces pancreatic cancer-induced skeletal muscle atrophy. Cells (2022) 11(12). doi: 10.3390/cells11121893
26. O’Sullivan BP, Michelson AD. The inflammatory role of platelets in cystic fibrosis. Am J Respir Crit Care Med (2006) 173(5):483–90. doi: 10.1164/rccm.200508-1243PP
27. Judge SM, Nosacka RL, Delitto D, Gerber MH, Cameron ME, Trevino JG, et al. Skeletal muscle fibrosis in pancreatic cancer patients with respect to survival. JNCI Cancer Spectr (2018) 2(3):pky043. doi: 10.1093/jncics/pky043
28. Taucher S, Salat A, Gnant M, Kwasny W, Mlineritsch B, Menzel RC, et al. Impact of pretreatment thrombocytosis on survival in primary breast cancer. Thromb Haemost (2003) 89(6):1098–106. doi: 10.1016/j.ejso.2012.04.009
29. Bensalah K, Leray E, Fergelot P, Rioux-Leclercq N, Tostain J, Guille F, et al. Prognostic value of thrombocytosis in renal cell carcinoma. J Urol (2006) 175(3 Pt 1):859–63. doi: 10.1016/S0022-5347(05)00526-4
30. Pedersen LM, Milman N. Prognostic significance of thrombocytosis in patients with primary lung cancer. Eur Respir J (1996) 9(9):1826–30. doi: 10.1183/09031936.96.09091826
31. Ishizuka M, Nagata H, Takagi K, Iwasaki Y, Kubota K. Preoperative thrombocytosis is associated with survival after surgery for colorectal cancer. J Surg Oncol (2012) 106(7):887–91. doi: 10.1002/jso.23163
32. Giannakeas V, Kotsopoulos J, Cheung MC, Rosella L, Brooks JD, Lipscombe L, et al. Analysis of platelet count and new cancer diagnosis over a 10-year period. JAMA Netw Open (2022) 5(1):e2141633. doi: 10.1001/jamanetworkopen.2021.41633
33. Laviano A, Meguid MM. Nutritional issues in cancer management. Nutrition (1996) 12(5):358–71. doi: 10.1016/S0899-9007(96)80061-X
34. Baltgalvis KA, Berger FG, Pena MM, Davis JM, White JP, Carson JA. Muscle wasting and interleukin-6-induced atrogin-I expression in the cachectic Apc (Min/+) mouse. Pflugers Arch (2009) 457(5):989–1001. doi: 10.1007/s00424-008-0574-6
35. Stone RL, Nick AM, McNeish IA, Balkwill F, Han HD, Bottsford-Miller J, et al. Paraneoplastic thrombocytosis in ovarian cancer. N Engl J Med (2012) 366(7):610–8. doi: 10.1056/NEJMoa1110352
36. Kaser A, Brandacher G, Steurer W, Kaser S, Offner FA, Zoller H, et al. Interleukin-6 stimulates thrombopoiesis through thrombopoietin: role in inflammatory thrombocytosis. Blood (2001) 98(9):2720–5. doi: 10.1182/blood.V98.9.2720
37. Thomas MR, Storey RF. The role of platelets in inflammation. Thromb Haemost (2015) 114(3):449–58. doi: 10.1160/TH14-12-1067
38. Wang Y, Ouyang Y, Liu B, Ma X, Ding R. Platelet activation and antiplatelet therapy in sepsis: A narrative review. Thromb Res (2018) 166:28–36. doi: 10.1016/j.thromres.2018.04.007
39. Tefferi A, Hanson CA, Inwards DJ. How to interpret and pursue an abnormal complete blood cell count in adults. Mayo Clin Proc (2005) 80(7):923–36. doi: 10.4065/80.7.923
40. Cunningham P, Sumal A, Patton E, Helms H, Noneman MT, Martinez-Muniz G, et al. Ojeok-san ameliorates visceral and somatic nociception in a mouse model of colitis induced colorectal cancer. PloS One (2022) 17(6):e0270338. doi: 10.1371/journal.pone.0270338
41. Page, M. E. E. A. EE ANCOVA analysis . Available at: https://www.mmpc.org/shared/regression.aspx.
42. Counts BR, Fix DK, Hetzler KL, Carson JA. The effect of estradiol administration on muscle mass loss and cachexia progression in female apc (Min/+) mice. Front Endocrinol (Lausanne) (2019) 10:720. doi: 10.3389/fendo.2019.00720
43. Fix DK, Counts BR, Smuder AJ, Sarzynski MA, Koh HJ, Carson JA. Wheel running improves fasting-induced AMPK signaling in skeletal muscle from tumor-bearing mice. Physiol Rep (2021) 9(14):e14924. doi: 10.14814/phy2.14924
44. Puppa MJ, White JP, Sato S, Cairns M, Baynes JW, Carson JA. Gut barrier dysfunction in the Apc(Min/+) mouse model of colon cancer cachexia. Biochim Biophys Acta (2011) 1812(12):1601–6. doi: 10.1016/j.bbadis.2011.08.010
45. Puppa MJ, White JP, Velazquez KT, Baltgalvis KA, Sato S, Baynes JW, et al. The effect of exercise on IL-6-induced cachexia in the Apc (Min/+) mouse. J Cachexia Sarcopenia Muscle (2012) 3(2):117–37. doi: 10.1007/s13539-011-0047-1
46. Vanderveen BN, Fix DK, Counts BR, Carson JA. The effect of wheel exercise on functional indices of cachexia in tumor-bearing mice. Med Sci Sports Exerc (2020) 52(11):2320–30. doi: 10.1249/MSS.0000000000002393
47. Theologides A. Cancer cachexia. Cancer (1979) 43(5 Suppl):2004–12. doi: 10.1002/1097-0142(197905)43:5+<2004::AID-CNCR2820430708>3.0.CO;2-#
48. Thompson CB, Eaton KA, Princiotta SM, Rushin CA, Valeri CR. Size dependent platelet subpopulations: relationship of platelet volume to ultrastructure, enzymatic activity, and function. Br J Haematol (1982) 50(3):509–19. doi: 10.1111/j.1365-2141.1982.tb01947.x
49. Counts BR, Halle JL, Carson JA. Early-onset physical inactivity and metabolic dysfunction in tumor-bearing mice is associated with accelerated cachexia. Med Sci Sports Exerc (2022) 54(1):77–88. doi: 10.1249/MSS.0000000000002772
50. Washington TA, Schrems ER, Haynie WS, Rosa-Caldwell ME, Brown JL, Saling L, et al. Development of skeletal muscle fibrosis in a rodent model of cancer cachexia. Cell Biochem Funct (2023) 41(4):478–89. doi: 10.1002/cbf.3797
51. Farrell DH, Thiagarajan P, Chung DW, Davie EW. Role of fibrinogen alpha and gamma chain sites in platelet aggregation. Proc Natl Acad Sci U.S.A. (1992) 89(22):10729–32. doi: 10.1073/pnas.89.22.10729
52. Preston T, Slater C, McMillan DC, Falconer JS, Shenkin A, Fearon KC. Fibrinogen synthesis is elevated in fasting cancer patients with an acute phase response. J Nutr (1998) 128(8):1355–60. doi: 10.1093/jn/128.8.1355
53. Witte KK, Ford SJ, Preston T, Parker JD, Clark AL. Fibrinogen synthesis is increased in cachectic patients with chronic heart failure. Int J Cardiol (2008) 129(3):363–7. doi: 10.1016/j.ijcard.2007.07.119
54. Hinterleitner C, Zhou Y, Tandler C, Heitmann JS, Kropp KN, Hinterleitner M, et al. Platelet-expressed TNFRSF13B (TACI) predicts breast cancer progression. Front Oncol (2021) 11:642170. doi: 10.3389/fonc.2021.642170
55. Braun A, Anders HJ, Gudermann T, Mammadova-Bach E. Platelet-cancer interplay: molecular mechanisms and new therapeutic avenues. Front Oncol (2021) 11:665534. doi: 10.3389/fonc.2021.665534
56. Fabricius HA, Starzonek S, Lange T. The role of platelet cell surface P-selectin for the direct platelet-tumor cell contact during metastasis formation in human tumors. Front Oncol (2021) 11:642761. doi: 10.3389/fonc.2021.642761
57. Tuncel T, Ozgun A, Emirzeoglu L, Celik S, Bilgi O, Karagoz B. Mean platelet volume as a prognostic marker in metastatic colorectal cancer patients treated with bevacizumab-combined chemotherapy. Asian Pac J Cancer Prev (2014) 15(15):6421–3. doi: 10.7314/APJCP.2014.15.15.6421
58. Argiles JM, Anker SD, Evans WJ, Morley JE, Fearon KC, Strasser F, et al. Consensus on cachexia definitions. J Am Med Dir Assoc (2010) 11(4):229–30. doi: 10.1016/j.jamda.2010.02.004
59. Ohe Y, Podack ER, Olsen KJ, Miyahara Y, Miura K, Saito H, et al. Interleukin-6 cDNA transfected Lewis lung carcinoma cells show unaltered net tumour growth rate but cause weight loss and shortened survival in syngeneic mice. Br J Cancer (1993) 67(5):939–44. doi: 10.1038/bjc.1993.174
60. Argiles JM, Figueras M, Ametller E, Fuster G, Olivan M, de Oliveira CC, et al. Effects of CRF2R agonist on tumor growth and cachexia in mice implanted with Lewis lung carcinoma cells. Muscle Nerve (2008) 37(2):190–5. doi: 10.1002/mus.20899
61. Su LK, Kinzler KW, Vogelstein B, Preisinger AC, Moser AR, Luongo C, et al. Multiple intestinal neoplasia caused by a mutation in the murine homolog of the APC gene. Science (1992) 256(5057):668–70. doi: 10.1126/science.1350108
62. Corpet DE, Pierre F. Point: From animal models to prevention of colon cancer. Systematic review of chemoprevention in min mice and choice of the model system. Cancer Epidemiol Biomarkers Prev (2003) 12(5):391–400.
63. Bennani-Baiti N, Walsh D. Animal models of the cancer anorexia-cachexia syndrome. Support Care Cancer (2011) 19(9):1451–63. doi: 10.1007/s00520-010-0972-0
64. Reddel CJ, Allen JD, Ehteda A, Taylor R, Chen VM, Curnow JL, et al. Increased thrombin generation in a mouse model of cancer cachexia is partially interleukin-6 dependent. J Thromb Haemost (2017) 15(3):477–86. doi: 10.1111/jth.13612
65. Thomas GM, Panicot-Dubois L, Lacroix R, Dignat-George F, Lombardo D, Dubois C. Cancer cell-derived microparticles bearing P-selectin glycoprotein ligand 1 accelerate thrombus formation in vivo. J Exp Med (2009) 206(9):1913–27. doi: 10.1084/jem.20082297
66. Barker T, Fulde G, Moulton B, Nadauld LD, Rhodes T. An elevated neutrophil-to-lymphocyte ratio associates with weight loss and cachexia in cancer. Sci Rep (2020) 10(1):7535. doi: 10.1038/s41598-020-64282-z
67. Penafuerte CA, Gagnon B, Sirois J, Murphy J, MacDonald N, Tremblay ML. Identification of neutrophil-derived proteases and angiotensin II as biomarkers of cancer cachexia. Br J Cancer (2016) 114(6):680–7. doi: 10.1038/bjc.2016.3
68. Xu C, Yuan J, Du W, Wu J, Fang Q, Zhang X, et al. Significance of the neutrophil-to-lymphocyte ratio in p16-negative squamous cell carcinoma of unknown primary in head and neck. Front Oncol (2020) 10:39. doi: 10.3389/fonc.2020.00039
69. Derman BA, Macklis JN, Azeem MS, Sayidine S, Basu S, Batus M, et al. Relationships between longitudinal neutrophil to lymphocyte ratios, body weight changes, and overall survival in patients with non-small cell lung cancer. BMC Cancer (2017) 17(1):141. doi: 10.1186/s12885-017-3122-y
70. Yun NK, Rouhani SJ, Bestvina CM, Ritz EM, Gilmore BA, Tarhoni I, et al. Neutrophil-to-lymphocyte ratio is a predictive biomarker in patients with epidermal growth factor receptor (EGFR) mutated advanced non-small cell lung cancer (NSCLC) treated with tyrosine kinase inhibitor (TKI) therapy. Cancers (Basel) (2021) 13(6). doi: 10.3390/cancers13061426
71. Wang D, Li X, Jiao D, Cai Y, Qian L, Shen Y, et al. LCN2 secreted by tissue-infiltrating neutrophils induces the ferroptosis and wasting of adipose and muscle tissues in lung cancer cachexia. J Hematol Oncol (2023) 16(1):30. doi: 10.1186/s13045-023-01429-1
72. Lindemann S, Tolley ND, Dixon DA, McIntyre TM, Prescott SM, Zimmerman GA, et al. Activated platelets mediate inflammatory signaling by regulated interleukin 1beta synthesis. J Cell Biol (2001) 154(3):485–90. doi: 10.1083/jcb.200105058
73. Kominato Y, Galson D, Waterman WR, Webb AC, Auron PE. Monocyte expression of the human prointerleukin 1 beta gene (IL1B) is dependent on promoter sequences which bind the hematopoietic transcription factor Spi-1/PU.1. Mol Cell Biol (1995) 15(1):58–68.
74. Karmakar M, Minns M, Greenberg EN, Diaz-Aponte J, Pestonjamasp K, Johnson JL, et al. N-GSDMD trafficking to neutrophil organelles facilitates IL-1beta release independently of plasma membrane pores and pyroptosis. Nat Commun (2020) 11(1):2212. doi: 10.1038/s41467-020-16043-9
75. Lopez-Castejon G, Brough D. Understanding the mechanism of IL-1beta secretion. Cytokine Growth Factor Rev (2011) 22(4):189–95. doi: 10.1016/j.cytogfr.2011.10.001
76. Zhang D, Zheng H, Zhou Y, Tang X, Yu B, Li J. Association of IL-1beta gene polymorphism with cachexia from locally advanced gastric cancer. BMC Cancer (2007) 7:45. doi: 10.1186/1471-2407-7-45
77. Blakytny R, Ludlow A, Martin GE, Ireland G, Lund LR, Ferguson MW, et al. Latent TGF-beta1 activation by platelets. J Cell Physiol (2004) 199(1):67–76. doi: 10.1002/jcp.10454
78. Kelly FJ, Anderson S, Thompson MM, Oyama TT, Kennefick TM, Corless CL, et al. Acute and chronic renal effects of recombinant human TGF-beta2 in the rat. J Am Soc Nephrol (1999) 10(6):1264–73. doi: 10.1681/ASN.V1061264
79. Khemissa F, Mineur L, Amsellem C, Assenat E, Ramdani M, Bachmann P, et al. A phase III study evaluating oral glutamine and transforming growth factor-beta 2 on chemotherapy-induced toxicity in patients with digestive neoplasm. Dig Liver Dis (2016) 48(3):327–32. doi: 10.1016/j.dld.2015.11.025
80. Erlebacher A, Derynck R. Increased expression of TGF-beta 2 in osteoblasts results in an osteoporosis-like phenotype. J Cell Biol (1996) 132(1-2):195–210. doi: 10.1083/jcb.132.1.195
81. Jude B, Tissier F, Dubourg A, Droguet M, Castel T, Leon K, et al. TGF-beta pathway inhibition protects the diaphragm from sepsis-induced wasting and weakness in rat. Shock (2020) 53(6):772–8. doi: 10.1097/SHK.0000000000001393
82. Preusse C, von Moers A, Kolbel H, Pehl D, Goebel HH, Schara U, et al. Inflammation-induced fibrosis in skeletal muscle of female carriers of Duchenne muscular dystrophy. Neuromuscul Disord (2019) 29(7):487–96. doi: 10.1016/j.nmd.2019.05.003
83. Piva L, Gavassini BF, Bello L, Fanin M, Soraru G, Barp A, et al. TGFBR2 but not SPP1 genotype modulates osteopontin expression in Duchenne muscular dystrophy muscle. J Pathol (2012) 228(2):251–9. doi: 10.1002/path.4026
84. Waning DL, Mohammad KS, Reiken S, Xie W, Andersson DC, John S, et al. Excess TGF-beta mediates muscle weakness associated with bone metastases in mice. Nat Med (2015) 21(11):1262–71. doi: 10.1038/nm.3961
85. Accorsi A, Cramer ML, Girgenrath M. Fibrogenesis in LAMA2-related muscular dystrophy is a central tenet of disease etiology. Front Mol Neurosci (2020) 13:3. doi: 10.3389/fnmol.2020.00003
86. Ohsawa Y, Okada T, Nishimatsu S, Ishizaki M, Suga T, Fujino M, et al. An inhibitor of transforming growth factor beta type I receptor ameliorates muscle atrophy in a mouse model of caveolin 3-deficient muscular dystrophy. Lab Invest (2012) 92(8):1100–14. doi: 10.1038/labinvest.2012.78
87. Lundberg I, Brengman JM, Engel AG. Analysis of cytokine expression in muscle in inflammatory myopathies, Duchenne dystrophy, and non-weak controls. J Neuroimmunol (1995) 63(1):9–16. doi: 10.1016/0165-5728(95)00122-0
88. Murakami N, McLennan IS, Nonaka I, Koishi K, Baker C, Hammond-Tooke G. Transforming growth factor-beta2 is elevated in skeletal muscle disorders. Muscle Nerve (1999) 22(7):889–98. doi: 10.1002/(SICI)1097-4598(199907)22:7<889::AID-MUS12>3.0.CO;2-B
89. Biressi S, Miyabara EH, Gopinath SD, Carlig PM, Rando TA. A Wnt-TGFbeta2 axis induces a fibrogenic program in muscle stem cells from dystrophic mice. Sci Transl Med (2014) 6(267):267ra176. doi: 10.1126/scitranslmed.3008411
90. Baltgalvis KA, Berger FG, Pena MM, Mark Davis J, White JP, Carson JA. Activity level, apoptosis, and development of cachexia in Apc(Min/+) mice. J Appl Physiol (1985) 109(4):1155–61. doi: 10.1152/japplphysiol.00442.2010
91. Fouladiun M, Korner U, Gunnebo L, Sixt-Ammilon P, Bosaeus I, Lundholm K. Daily physical-rest activities in relation to nutritional state, metabolism, and quality of life in cancer patients with progressive cachexia. Clin Cancer Res (2007) 13(21):6379–85. doi: 10.1158/1078-0432.CCR-07-1147
92. Furrer R, Jauch AJ, Nageswara Rao T, Dilbaz S, Rhein P, Steurer SA, et al. Remodeling of metabolism and inflammation by exercise ameliorates tumor-associated anemia. Sci Adv (2021) 7(37):eabi4852. doi: 10.1126/sciadv.abi4852
93. van der Ende M, Plas RLC, van Dijk M, Dwarkasing JT, van Gemerden F, Sarokhani A, et al. Effects of whole-body vibration training in a cachectic C26 mouse model. Sci Rep (2021) 11(1):21563. doi: 10.1038/s41598-021-98665-7
94. Andre N, Gastinger S, Rebillard A. Chronic fatigue in cancer, brain connectivity and reluctance to engage in physical activity: A mini-review. Front Oncol (2021) 11:774347. doi: 10.3389/fonc.2021.774347
95. Hetzler KL, Hardee JP, LaVoie HA, Murphy EA, Carson JA. Ovarian function’s role during cancer cachexia progression in the female mouse. Am J Physiol Endocrinol Metab (2017) 312(5):E447–59. doi: 10.1152/ajpendo.00294.2016
96. Zhong X, Zimmers TA. Sex differences in cancer cachexia. Curr Osteoporos Rep (2020) 18(6):646–54. doi: 10.1007/s11914-020-00628-w
97. Hetzler KL, Hardee JP, Puppa MJ, Narsale AA, Sato S, Davis JM, et al. Sex differences in the relationship of IL-6 signaling to cancer cachexia progression. Biochim Biophys Acta (2015) 1852(5):816–25. doi: 10.1016/j.bbadis.2014.12.015
98. Wallengren O, Iresjo BM, Lundholm K, Bosaeus I. Loss of muscle mass in the end of life in patients with advanced cancer. Support Care Cancer (2015) 23(1):79–86. doi: 10.1007/s00520-014-2332-y
99. Cosper PF, Leinwand LA. Cancer causes cardiac atrophy and autophagy in a sexually dimorphic manner. Cancer Res (2011) 71(5):1710–20. doi: 10.1158/0008-5472.CAN-10-3145
Keywords: muscle wasting, platelets, physical activity, red blood cells, TGFβ
Citation: Cunningham P, Unger CA, Patton EA, Aiken A, Browne A, James E, Aladhami AK, Hope 3rd MC, VanderVeen BN, Cardaci TD, Murphy EA, Enos RT and Velázquez KT (2023) Platelet status in cancer cachexia progression in ApcMin/+ mice. Front. Immunol. 14:1253587. doi: 10.3389/fimmu.2023.1253587
Received: 05 July 2023; Accepted: 10 August 2023;
Published: 28 August 2023.
Edited by:
Vijay Kumar, Louisiana State University, United StatesReviewed by:
Xiaoling Zhong, Indiana University School of Medicine, United StatesTyrone Anthony Washington, University of Arkansas, United States
Copyright © 2023 Cunningham, Unger, Patton, Aiken, Browne, James, Aladhami, Hope 3rd, VanderVeen, Cardaci, Murphy, Enos and Velázquez. This is an open-access article distributed under the terms of the Creative Commons Attribution License (CC BY). The use, distribution or reproduction in other forums is permitted, provided the original author(s) and the copyright owner(s) are credited and that the original publication in this journal is cited, in accordance with accepted academic practice. No use, distribution or reproduction is permitted which does not comply with these terms.
*Correspondence: Kandy T. Velázquez, a2FuZHkudmVsYXpxdWV6QHVzY21lZC5zYy5lZHU=