 Pingna Zhang
 Yunling Geng2†
 Kezhen Yang
 Hongbo Chen
94% of researchers rate our articles as excellent or good
Learn more about the work of our research integrity team to safeguard the quality of each article we publish.
Find out more
ORIGINAL RESEARCH article
Front. Immunol. , 09 October 2023
Sec. Inflammation
Volume 14 - 2023 | https://doi.org/10.3389/fimmu.2023.1252347
This article is part of the Research Topic Immunity and Inflammatory Responses in Kidney Disease: from Mechanisms to Novel Therapeutic Strategies View all 17 articles
Background: Membranous nephropathy (MN) is an autoimmune glomerular disease that is predominantly mediated by immune complex deposition and complement activation. The aim of this study was to identify key biomarkers of MN and investigate their association with immune-related mechanisms, inflammatory cytokines, chemokines and chemokine receptors (CCRs).
Methods: MN cohort microarray expression data were downloaded from the GEO database. Differentially expressed genes (DEGs) in MN were identified, and hub genes were determined using a protein-protein interaction (PPI) network. The relationships between immune-related hub genes, immune cells, CCRs, and inflammatory cytokines were examined using immune infiltration analysis, gene set enrichment analysis (GSEA), and weighted gene co-expression network analysis (WGCNA). Finally, the immune-related hub genes in MN were validated using ELISA.
Results: In total, 501 DEGs were identified. Enrichment analysis revealed the involvement of immune- and cytokine-related pathways in MN progression. Using WGCNA and immune infiltration analysis, 2 immune-related hub genes (CYBB and CSF1R) were identified. These genes exhibited significant correlations with a wide range of immune cells and were found to participate in B cell/T cell receptor and chemokine signaling pathways. In addition, the expressions of 2 immune-related hub genes were positively correlated with the expression of CCR1, CX3CR1, IL1B, CCL4, TNF, and CCR2.
Conclusion: Our study identified CSF1 and CYBB as immune-related hub genes that potentially influence the expression of CCRs and pro-inflammatory cytokines (CCR1, CX3CR1, IL1B, CCL4, TNF, and CCR2). CSF1 and CYBB may be potential biomarkers for MN progression, providing a perspective for diagnostic and immunotherapeutic targets of MN.
Membranous nephropathy (MN) is an autoimmune glomerular disease and is the most frequent cause of nephrotic syndrome (NS) in adults, accounting for approximately 30% of the cases, with individuals aged 30–50 years reaching the peak incidence rate (1, 2). Specific lesions of MN are the results of thickening of the glomerular capillary walls that results from the formation of immune deposits on the capillary wall (3). This immunological conflict is predominantly mediated by immune complex deposition and complement activation, which contribute to the impairment of glomerular filtration barrier, leading to nonselective proteinuria (4). Approximately 80% of MN cases occur without a specific cause (primary MN [pMN]), whereas 20% are associated with other diseases such as lupus erythematosus, infections (hepatitis B), malignancies, or drug intoxication (5).
The organ-specific autoimmune nature of pMN was determined in 2009 with the identification of phospholipase A2 receptor (PLA2R) in podocytes (6). Glomerular deposition of IgG on PLA2R is specific for pMN and is found in approximately 70% of cases reported in adults. This discovery has improved our understanding of the pathophysiology of pMN, in which circulating autoantibodies directly target podocyte antigens (7). This has opened a paradigm shift in the pathophysiological pattern, diagnosis, and targeted intervention for MN. Meanwhile, the mechanisms of autoimmunity initiation, exposure to antigens, and antibody pathogenicity have attracted much attention, revealing the significance of the immune system in the progression of MN (8). The initiation of MN may involve the cooperation of multiple factors, including genetic and environmental factors, as well as epigenetic and immune predispositions that result in the loss of immune system tolerance to develop MN (9). B and T cells, autoantibodies, cytokines, and complement system activation contribute to MN pathogenesis. A disordered proportion of regulatory T cells has been suggested to be the main characteristic of patients with MN without treatment (10). Some patients with MN display an increase in the CD4+/CD8+ subset ratio (11), which might be associated with the clinical response to immunosuppressive therapy; however, this was not confirmed in patients with MN treated with rituximab (12). In addition, the number of plasma cells and regulatory B cells in patients with MN was significantly higher than those in healthy individuals, and the number of PLA2R-specific memory B cells amplified in vitro may be related to circulating PLA2R antibody titers (13). Chemokines and chemokine receptors (CCRs) could recruit immune cells into tissues and are involved in inflammatory response (14). However, many aspects of the molecular mechanisms of immunity and chemokines involved in MN pathogenesis remain unclear.
Bioinformatics analysis has been widely utilized to reveal molecular pathogenesis of diseases and identify disease biomarkers (15). Microarray technology has been used in a range of bioinformatics analyses in the biomedical field to provide novel insights and help discover critical factors in the etiopathogenesis of diseases (16). In this study, gene expression profiles of MN were obtained using the Gene Expression Omnibus (GEO) database and differentially expressed genes (DEGs) were identified from them. Notably, weighted co-expression network analysis (WGCNA) and Gene Set Enrichment Analysis (GSEA) analyses were performed to explore immune cell infiltration in MN and further reveal immune-related pathways and identify potential biomarkers for MN. In addition, correlations between immune-related central genes and pro-inflammatory cytokines were analyzed. A flowchart of this study is shown in Figure 1.
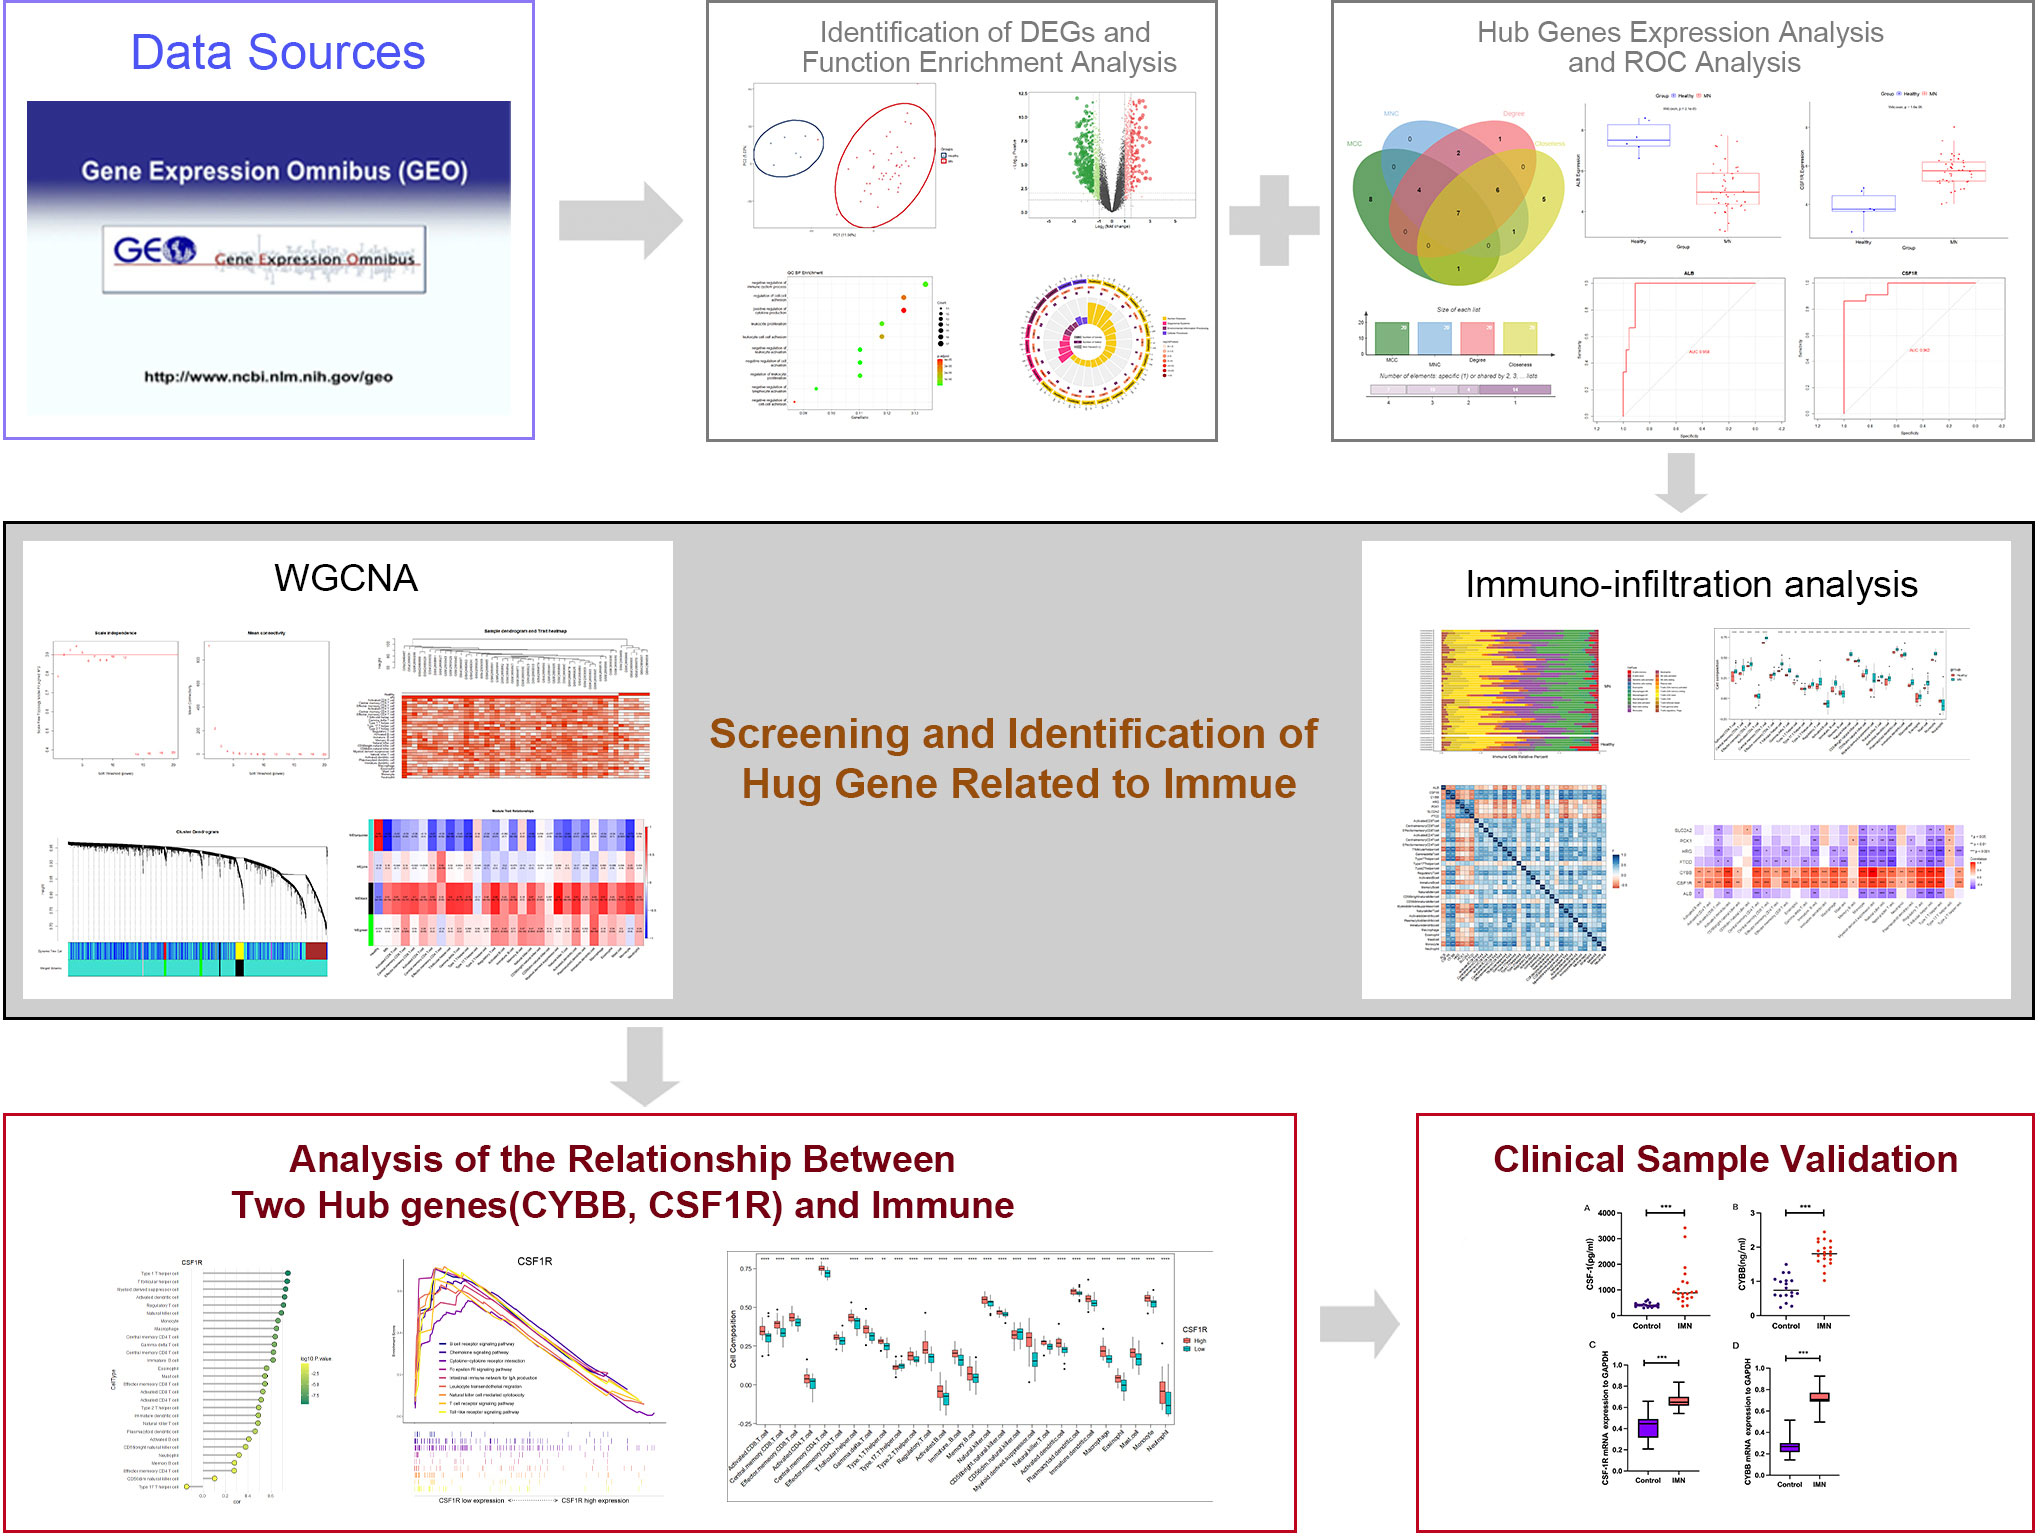
Figure 1 Technology roadmap for this study.
Microarray expression data for the MN cohorts were obtained from the GEO database (http://www.ncbi.nlm.nih.gov/geo/). The GSE108113 dataset containing data of 44 cases of MN and six healthy controls was used as a training set. For validation, microarray expression data from an additional 51 patients with MN and 6 healthy controls were obtained from another dataset, GSE200828. The “ggord” and “yyplot” packages in R were used to perform principal component analysis (PCA) between samples. In this analysis, the sample separation among different groups were checked. Meanwhile, the “GEOquery” package was used to perform probe annotation and normalization of gene expression using the obtained datasets. When a gene corresponded to multiple probe IDs, only the ID with the highest average expression level was retained. The standardized matrix file was used for all subsequent downstream analyses.
Differential expression analysis was conducted using the ‘limma’ package in R software, employing a screening criterion of P-value < 0.05 and |log fold change (FC)| > 1.5 (17, 18). The resulting DEGs were visualized using various approaches including PCA, Venn diagrams, and volcano plots. To identify hub genes, a protein-protein interaction (PPI) network of DEGs was constructed using the STRING database (https://cn.string-db.org/). The PPI information was extracted with an interaction score of 0.4, specifically focusing on “Homo sapiens” as the species. Subsequently, the PPI network analysis results were exported to Cytoscape 3.9.1, for further investigation. The CytoHubba plug-in was employed to sort and filter the nodes within the network based on the network characteristics, aiding in the identification of core elements within this complex network. Core genes were identified using the degree, MNC, closeness, and MCC methods available in the CytoHubba plug-in. Common genes among the top 20 genes identified by each method were identified to determine the hub genes.
GO and KEGG analyses of the DEGs were conducted using the Metascape database (https://metascape.org/). The analysis was limited to the species “Homo sapiens,” and the KEGG screening conditions included a minimum overlap of 3, a P-value threshold of 0.01, and a minimum enrichment of 1.5. The DEG list was used for GO and KEGG enrichment analysis (19), and the results were visualized using the ‘clusterprofiler’ packages of R software and the OmicShare tools (https://www.omicshare.com/tools).
The levels of different hub genes in patients with MN and healthy individuals were assessed by box plots, which were processed by the “ggplot2” package of R software. To further evaluate the predictive accuracy of the hub genes, receiver operating characteristic (ROC) curve analysis was performed to distinguish patients with MN from healthy individuals. Based on the obtained expression profile of hub genes and its high-throughput sequencing data, the ROC curves of hub genes were plotted using the “pROC “ software package. The area under the curve (AUC) was used to compare the diagnostic value of the hub genes. Meanwhile, the independent external GSE200828 dataset was used to validate the expression levels and diagnostic value of the hub genes in distinguishing patients with MN and healthy individuals.
The ssGSEA algorithm (20) was utilized to quantify the infiltration levels of 28 immune cells in the selected samples from the GSE108113 dataset. The abundance of these 28 types of infiltrating immune cells in the GSE108113 samples was estimated using the “GSVA” package. The proportion of 22 immune cell types in the GSE108113 samples was estimated using CIBERSORTx. The relationship between hub genes and immune cell infiltration was estimated by the “GSVA” package, which was visualized using the “ggplot2” package. KEGG pathway datasets from different expression groups performed functional enrichment analyses by using “GSVA” package.
To construct a gene co-expression network of the GSE108113 dataset, WGCNA was performed using the WGCNA package in R software. Genes with the highest absolute deviation of 25% from the median were selected for analysis (21). The quality of the analyzed data was evaluated by “goodSampleGenes” function, followed by clustering of samples and elimination of outlier samples. An ideal soft threshold was selected, and the “pickSoftThreshold” function was used to transform the matrix data into an adjacency matrix. This was followed by cluster analysis and modules were identified according to topological overlap. The results of immune infiltration obtained as phenotypic data were combined with WGCNA results to perform module analysis, which aimed to explore the relationship between the modules and immune cells. The genes in the module most closely related to immunity that overlapped with the hub genes were selected for further analysis.
To further analyze the correlation between immune-related hub genes, CCRs, and pro-inflammatory cytokines, lists of CCRs and pro-inflammatory cytokines were collected (Supplementary Table S1). Spearman correlation coefficients between immune-related hub genes, CCRs, and pro-inflammatory cytokines were analyzed. Thereafter, scatter plots depicting their relations were generated using the “ggstatsplot” package, presenting the linear relationship between them generated using the statistical method “lm.”.
To measure the protein levels of CSF-1 and CYBB/NOX2, we used specific ELISA kits for human CSF-1 (KE00184; Proteintech, USA) and CYBB/NOX2 (EK13559; Signalway Antibody, USA). Serum samples were collected from 20 patients with MN and 18 healthy controls (the clinical characteristics of the patients with MN and healthy controls are provided in Supplementary Table S2). ELISA was performed according to the manufacturer’s instructions. Briefly, the standard samples and samples from both experimental groups were transferred to a 96-well plate. An equal volume of the kit reagent was added to each well, and the plate was incubated for 30 min. The stop solution was added, and the absorbance signal was measured at 450 nm using a plate reader.
To test the gene expression level of CSF1R and CYBB in patients with MN and healthy controls, quantitative real-time polymerase chain reaction (RT–PCR) analysis of the mRNA levels of the genes from serum of patients was performed (Applied Biosystems, USA). The mRNA was reverse transcribed to cDNA using an Omniscript RT kit (Vazyme, China). RT-qPCR analysis was performed using the AceQ Universal SYBR qPCR Master Mix. After GAPDH normalization, the relative expression levels of the target gene were carried out with the 2-△△CT approach. The primer sequences are listed in Table 1.
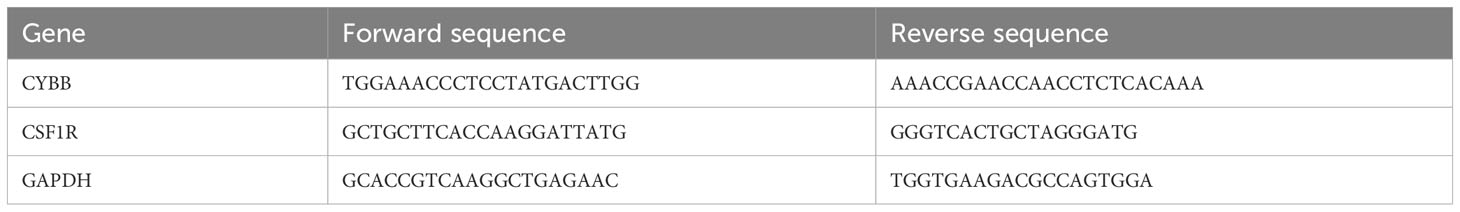
Table 1 Sequences of the primers designed for RT-qPCR.
All patients came from Dongzhimen Hospital. Studies involving human participants were reviewed and approved by the Ethics Committee of Beijing Dongzhimen Hospital, First Clinical Medical College of Beijing University of Chinese Medicine. All the patients/participants provided written informed consent to participate in the study.
PCA distinctly indicated the separation of patients with MN from healthy controls (Figure 2A). A total of 501 DEGs were identified during differential expression analysis based on adjusted P-value < 0.05 and |logFC| > 1.5. Among these DEGs, 133 were upregulated and 368 were downregulated (Figure 1) (Supplementary Table S3). Using the STRING database, a PPI network of DEGs was constructed, comprising 273 nodes and 840 edges. The scores for degree, MNC, closeness, and MCC were calculated using the CytoHubba plug-in, and the top 20 genes from each method were intersected to identify seven hub genes: SLC2A2, HRG, CYBB, PCK1, CSF1R, FTCD, and ALB. The Venn diagram in Figure 2B shows the overlap between DEGs.
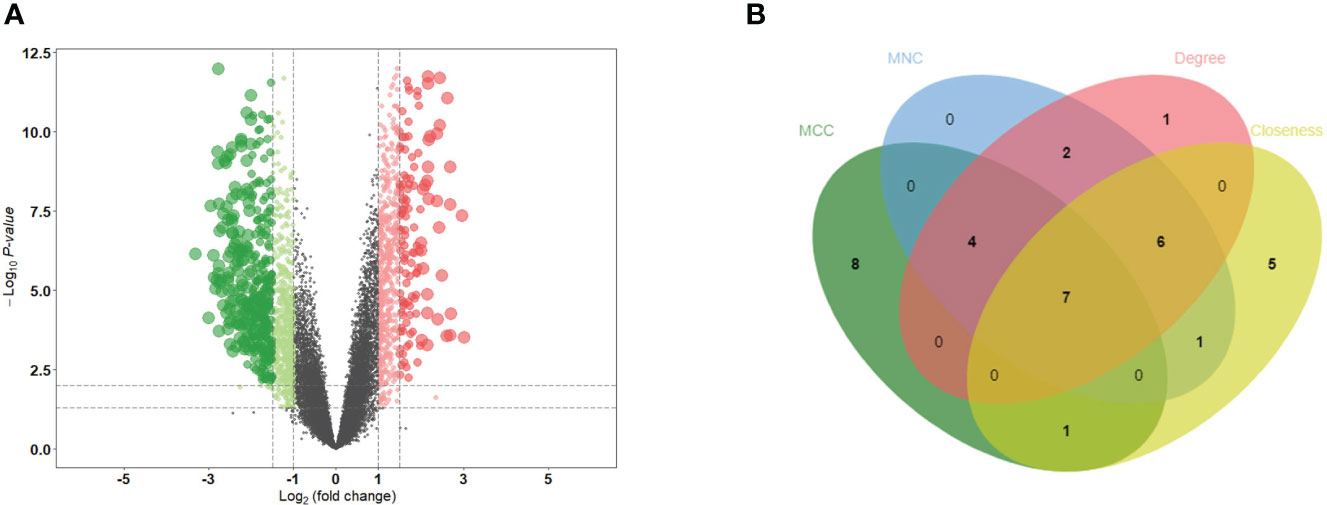
Figure 2 Identification of DEGs and hub genes. (A) Volcano diagram of DEGs. Red indicates upregulated genes and green indicates downregulated genes. (B) Venn diagram for screening hub genes. DEGs, differentially expressed genes.
During KEGG enrichment analysis, the upregulated KEGG pathways were related to the MAPK signaling pathway, cytokine-cytokine receptor interactions, and NK cell-mediated cytotoxicity (Figures 3A-C). During GO analysis, the upregulated genes were mainly involved in the negative regulation of the immune system process, endocytic vesicles, and heme binding (Figure 3D). Among the downregulated genes, the most relevant downregulated KEGG pathways were those related to metabolism of xenobiotics by cytochrome P450, drug metabolism, and chemical carcinogenesis-receptor activation (Figures 3E-G). The genes downregulated in MN were mostly related to amino acid metabolic process, apical part of cell, and transmembrane transporter activity (Figure 3H). Detailed information is provided in Supplementary Table S4.
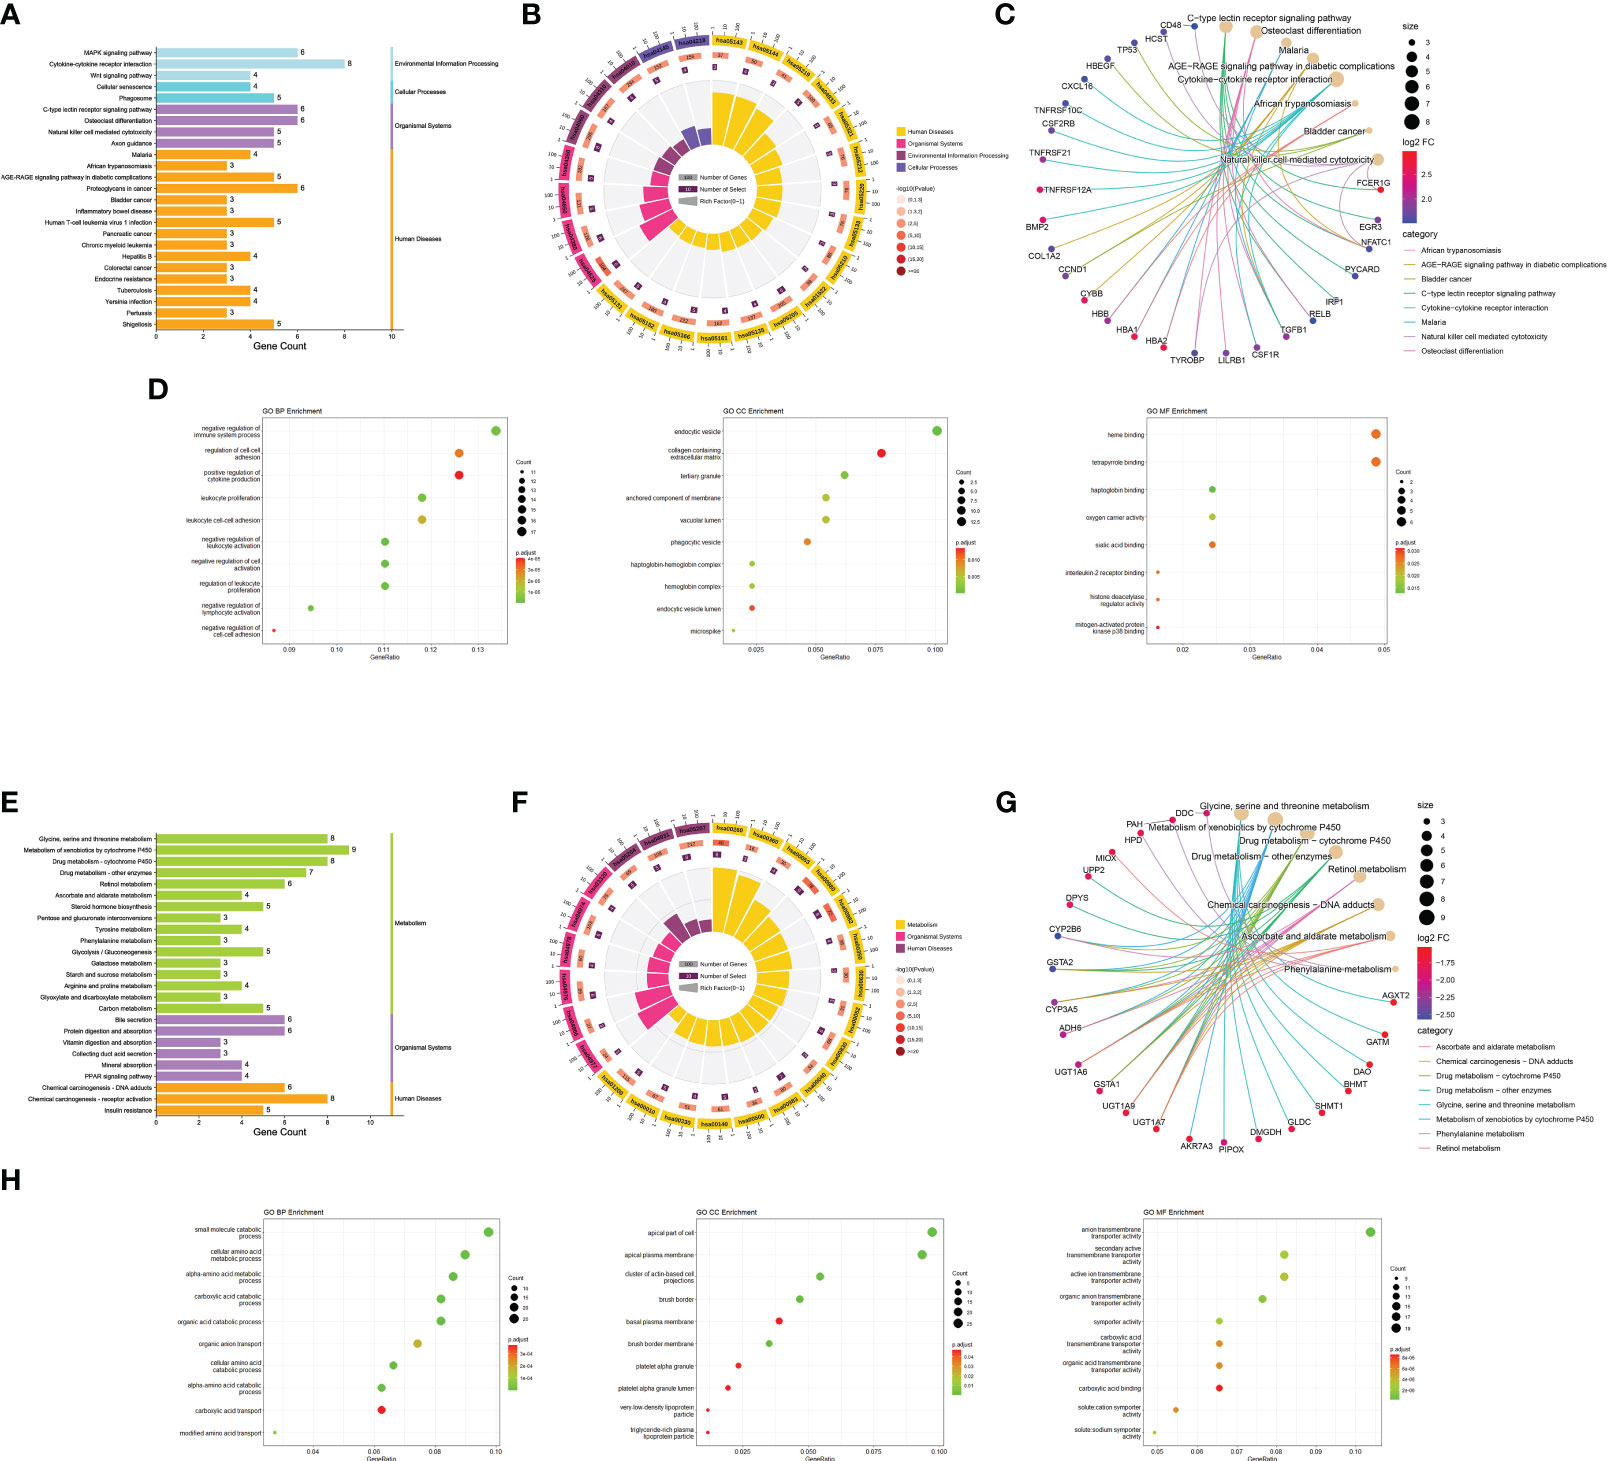
Figure 3 Functional enrichment analysis. (A) Bar graph of KEGG pathway enrichment analysis of upregulated genes. The horizontal coordinate indicates the number of genes annotated to the pathway, and different colors represent different pathway classifications. (B) Circle diagram of KEGG pathway enrichment analysis of upregulated genes. The first circle indicates the number of the pathway; the second circle indicates the number of genes and P-value of the pathway; the third circle indicates the number of genes annotated to the pathway; and the fourth circle indicates the enrichment coefficient for each pathway. (C) Network diagram of KEGG pathway enrichment analysis of upregulated genes indicate the specific target distribution on the pathway. (D) Bubble plot of GO enrichment analysis of upregulated genes, including BP, CC, and MF. The size of the dots indicates the number of genes, and the color corresponds to the P-value. (E-H) GO and KEGG pathway enrichment analysis of downregulated genes. BP: biological process, CC: cell component, MF: molecular function.
Box plots were constructed to assess the expression levels of the seven hub genes between patients with MN and healthy controls (Figure 4A). The expression levels of ALB (P=2.1e-05), FTCD (P=6.3e-05), HRG (P=1.6e-05), PCK1 (P=8.1e-06), and SLC2A2 (P=0.0019) in MN were significantly lower than those in healthy controls. However, the expression levels of CSF1R (P=1.6e-05) and CYBB (P=2.1e-05) in patients with MN were significantly higher than those in healthy controls (Figure 4B). Furthermore, to validate the expression levels of these seven hub genes in patients with MN and healthy controls, an independent external dataset, GSE200828, was used, and the results were consistent with those from the GSE108113 dataset (Figure 5A). The diagnostic ability of these seven hub genes was validated using GSE200828 dataset. The values of AUC of the seven hub genes showed that all seven hub genes indicated favorable diagnostic value for MN, with an AUC of 0.958 (95%CI 90.52%-100%) for ALB, AUC of 0.962 (95%CI 90.53%-100%) for CSF1R, AUC of 0.958 (95%CI 90.23%-100%) for CYBB, AUC of 0.943 (95%CI 87.22%-100%) for FTCD, AUC of 0.962 (95%CI 91.1%-100%) for HRG, AUC of 0.970 (95%CI 92.44%-100%) for PCK1, and AUC of 0.871 (95%CI 73.74%-100%) for SLC2A2 (Figure 5B). Thus, all seven hub genes exhibited high diagnostic values, with AUC values > 0.85.
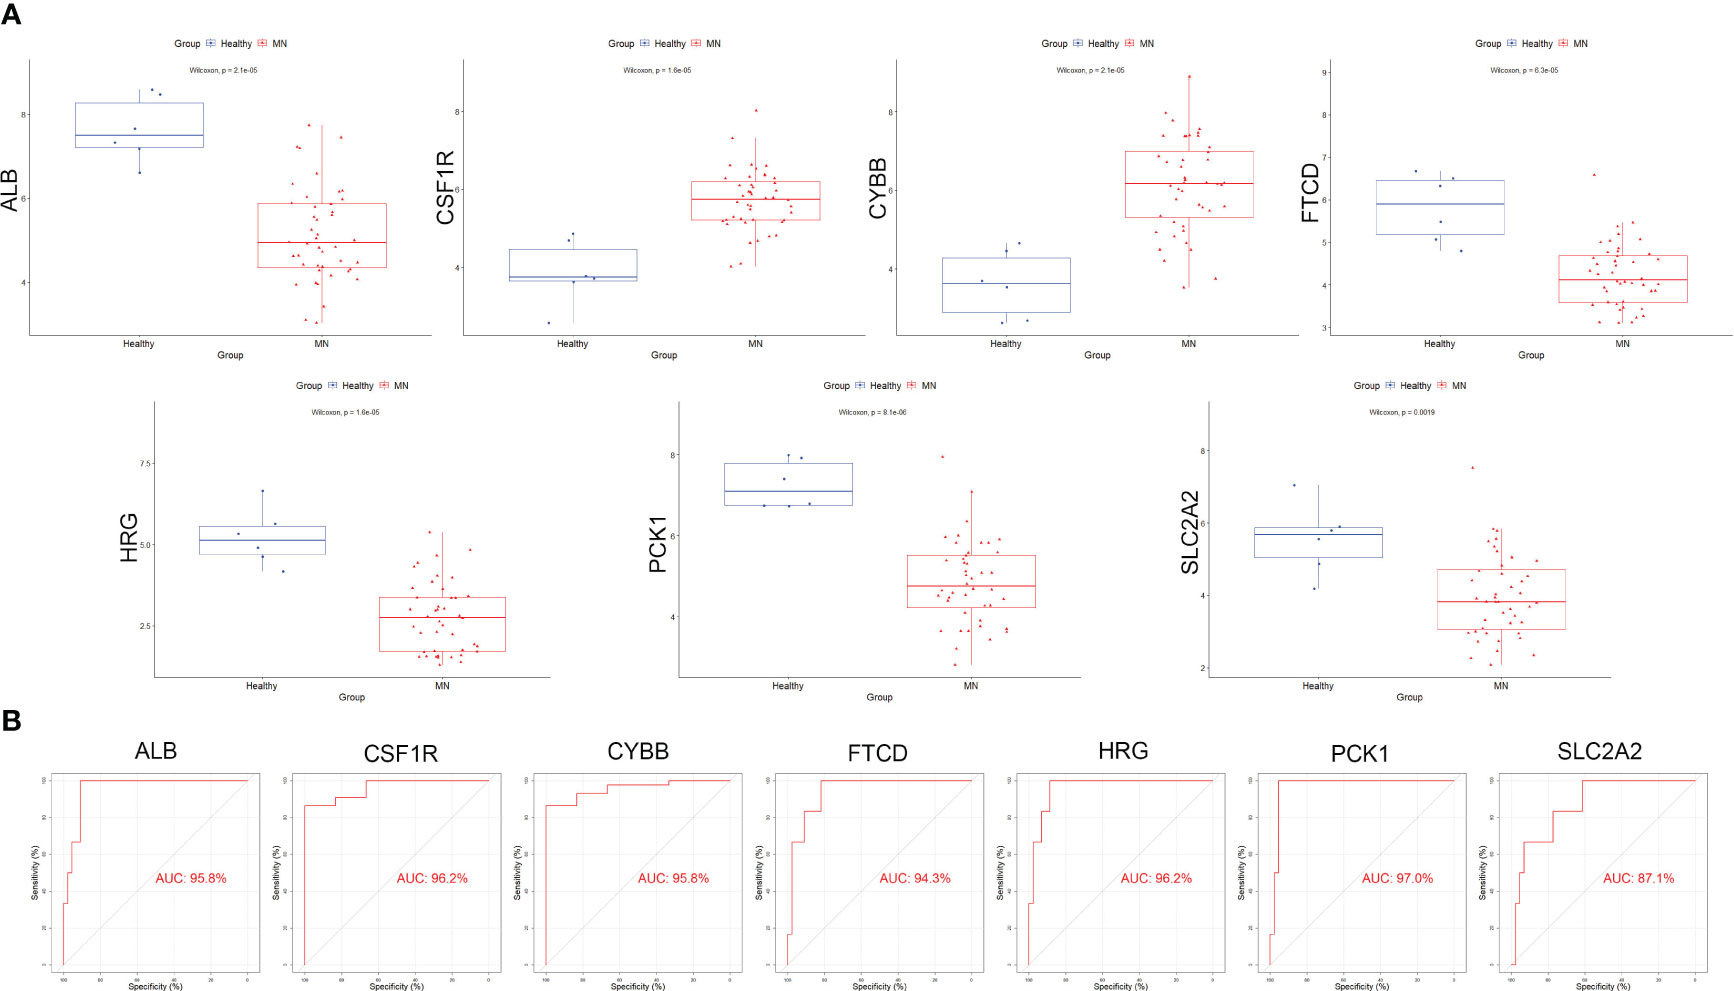
Figure 4 Validation of hub genes in the exploration cohort. (A) The expression of each hub gene in different subgroups. (B) AUC values for each hub gene in the ROC curve. AUC: area under the curve. ROC: receiver operating characteristic.
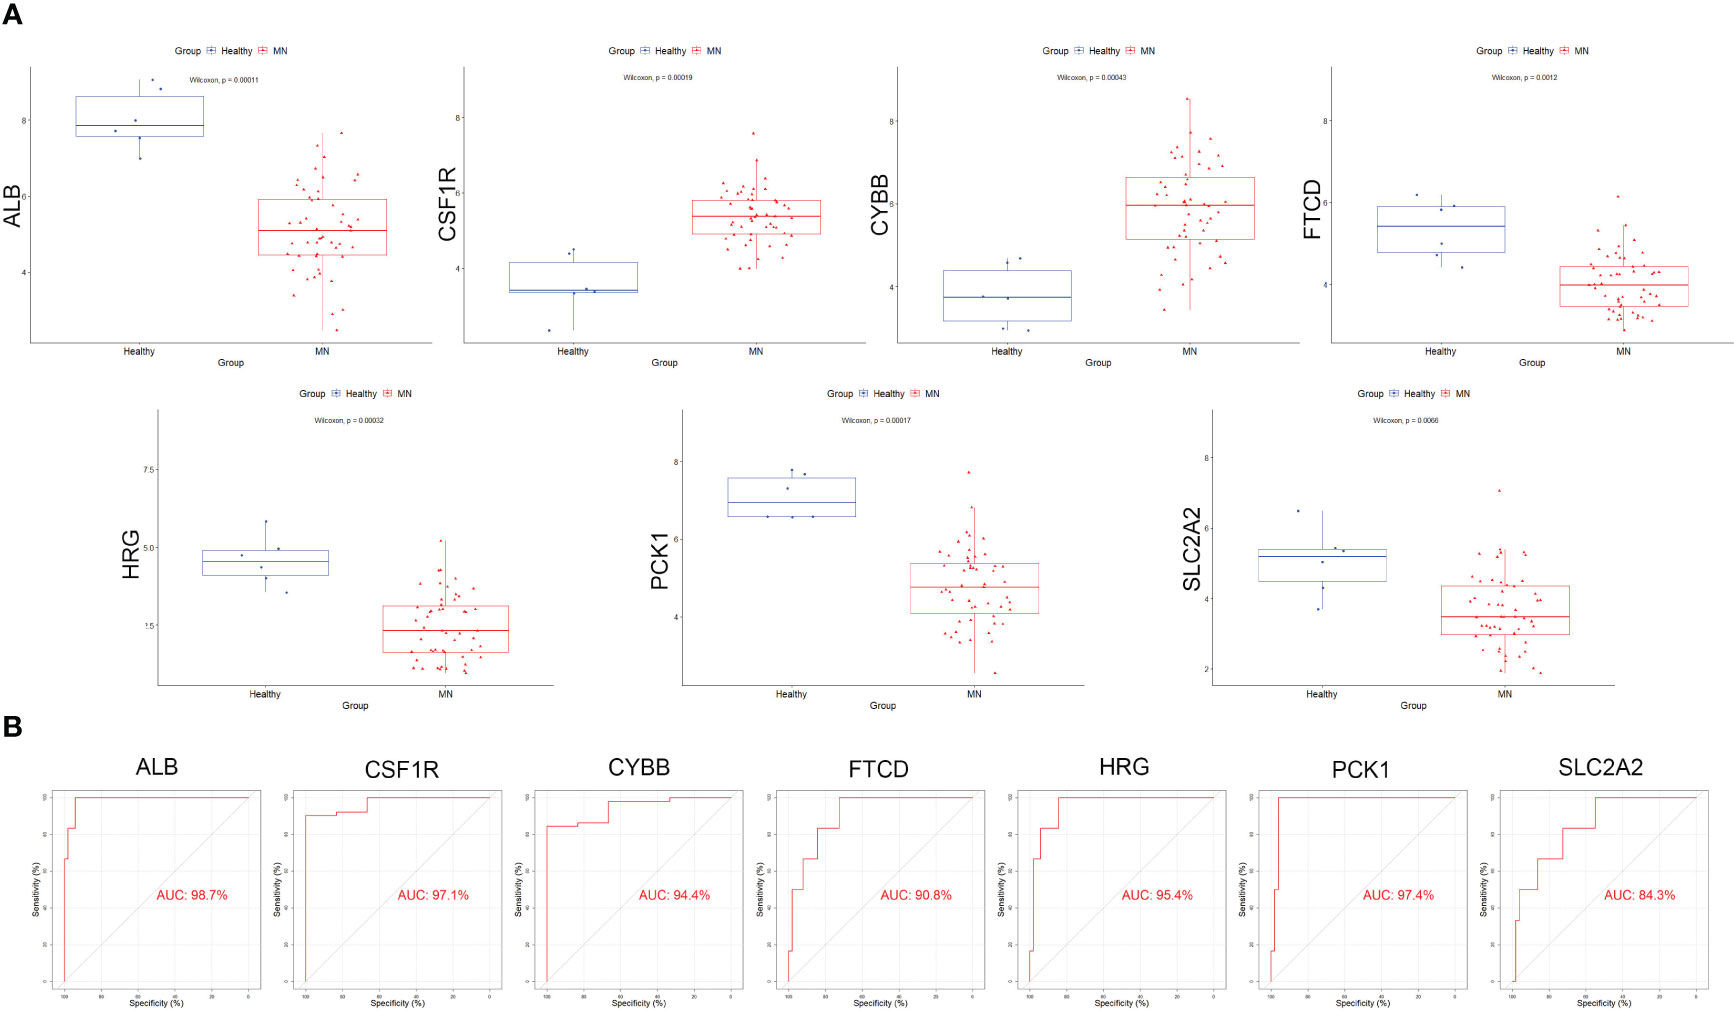
Figure 5 Validation of the hub genes in the validation cohort. (A) The expression of each hub gene in different subgroups. (B) AUC values for each hub gene in the ROC curve.
To investigate the relative level of immune cell infiltration between patients with MN and healthy controls, the CIBERSORT algorithm was used. The distribution of the 22 immune cell infiltrations in GSE108113 is presented as a bar plot (Figure 6A). Immune cell infiltration analysis revealed that the numbers of CD4+ T cells, CD8+ T cells, natural killer (NK) cells, monocytes, and macrophages were significantly higher in MN tissues than in healthy tissues (P < 0.001) (Figure 6B). Furthermore, the correlation between the seven hub genes and 28 immune cells was assessed. CYBB and CSF1R exhibited positive correlations with several immune cells, particularly central memory CD4+ T cells (cor = 0.70, P < 0.001; cor = 0.640, P < 0.001), monocyte (cor = 0.776, P < 0.001; cor = −0.640, P < 0.001), activated dendritic cell (cor = 0.750, P < 0.001; cor = 0.724, P < 0.001), T follicular helper cell (cor = 0.782, P < 0.001; cor = 0.744, P < 0.001) and regulatory T cell (cor = 0.737, P < 0.001; cor = 0.715, P < 0.001). In addition, SLC2A2, PCK1, HRG, FTCD, and ALB levels were negatively correlated with most immune cells, including central memory CD4+ T cells, monocytes, NK cells, and follicular helper T cells (P < 0.05) (Figures 6C, D).
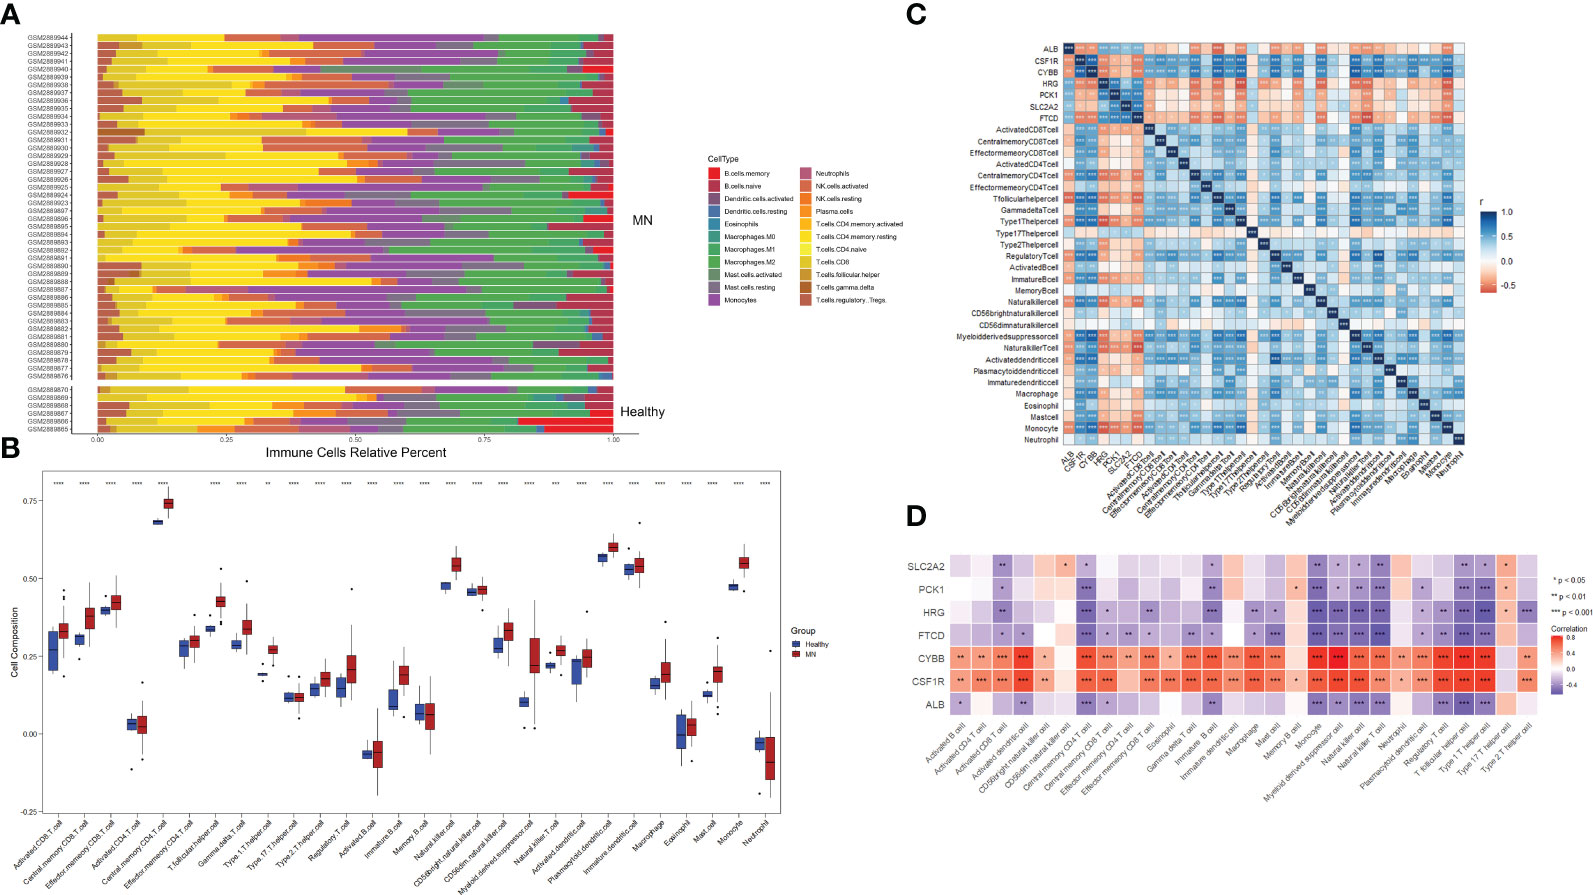
Figure 6 Immune cell infiltration analysis. (A) Plot of the percentage of 22 immune cells in each sample. Different colors represent different immune cells. (B) The distribution of 28 immune cells in different groups. (C, D) Correlation between 28 immune cells and hub genes. The color indicates the correlation size. *P <0.05, **P <0.01, ***P <0.001, ****P <0.0001.
For WGCNA, 6,221 genes were selected. The appropriate soft threshold was determined to be β = 2, indicating a scale-free network (Figure 7A). Combining the results of immune infiltration with WGCNA, the correlation between each sample and the 28 immune cells is shown in Figure 7B. Four gene modules were obtained by merging similar modules (Figure 7C). As revealed by heat maps, the correlations between multiple modules of 28 immune cells associated with patients with MN and healthy controls are presented in Figure 7D, which shows that immune cells are closely associated with genes in the black module. Within the black module, two immune-related hub genes, CSF1R and CYBB, were selected by intersecting the genes in the module with previously identified hub genes.
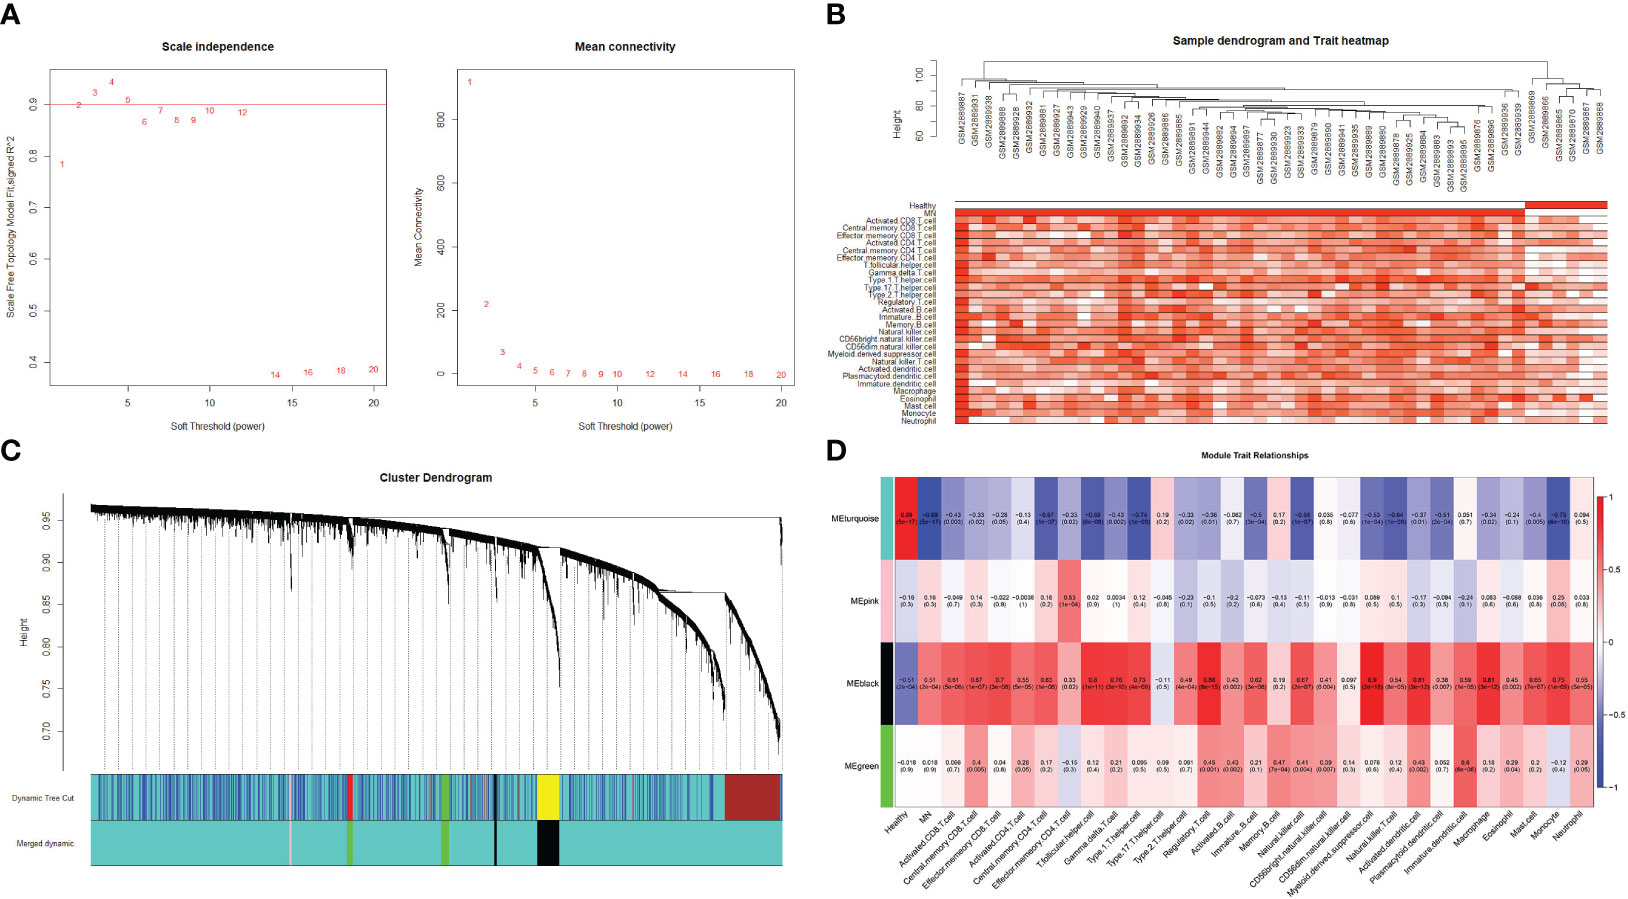
Figure 7 Weighted gene co-expression network analysis (A) Determination of the soft threshold value. The red line indicates the soft threshold value corresponding to a correlation coefficient of 0.9. (B) The samples were analyzed for clustering, observed for the presence of outliers, and combined with the results of immune cell infiltration. (C) Clustered dendrogram of the top 25% absolute deviations of the median, with each branch representing one gene. Each color at the bottom indicates one module, and the modules after merging are shown below. (D) Heat map of the relationship between modules and traits. The black modules in the graph clearly correlate more strongly with multiple immune cells than other modules.
To further explore the correlation between two hub genes and immune cells infiltration, the “GSVA” and “ggplot” packages were used for analysis and visualization. As shown in Figures 8A, D, both CSF1 and CYBB displayed a significant positive correlation with 28 immune cells, except type 17 helper cells (P <0.005). In Figures 8C, F, the boxplot shows the abundance of 28 immune cells corresponding to hub genes at different expression levels. Due to the similarity in the grouping of these two genes at different expression levels, the results of immune cell infiltration analysis are also similar, but they are actually different. CD4+ T cells, CD8+ T cells, NK cells, monocytes, and macrophages evidently exhibited high immune scores for high CYBB and CSF1R expression (P < 0.001), which further verified that the two hub genes were responsible for the pathogenesis of immune-mediated MN.
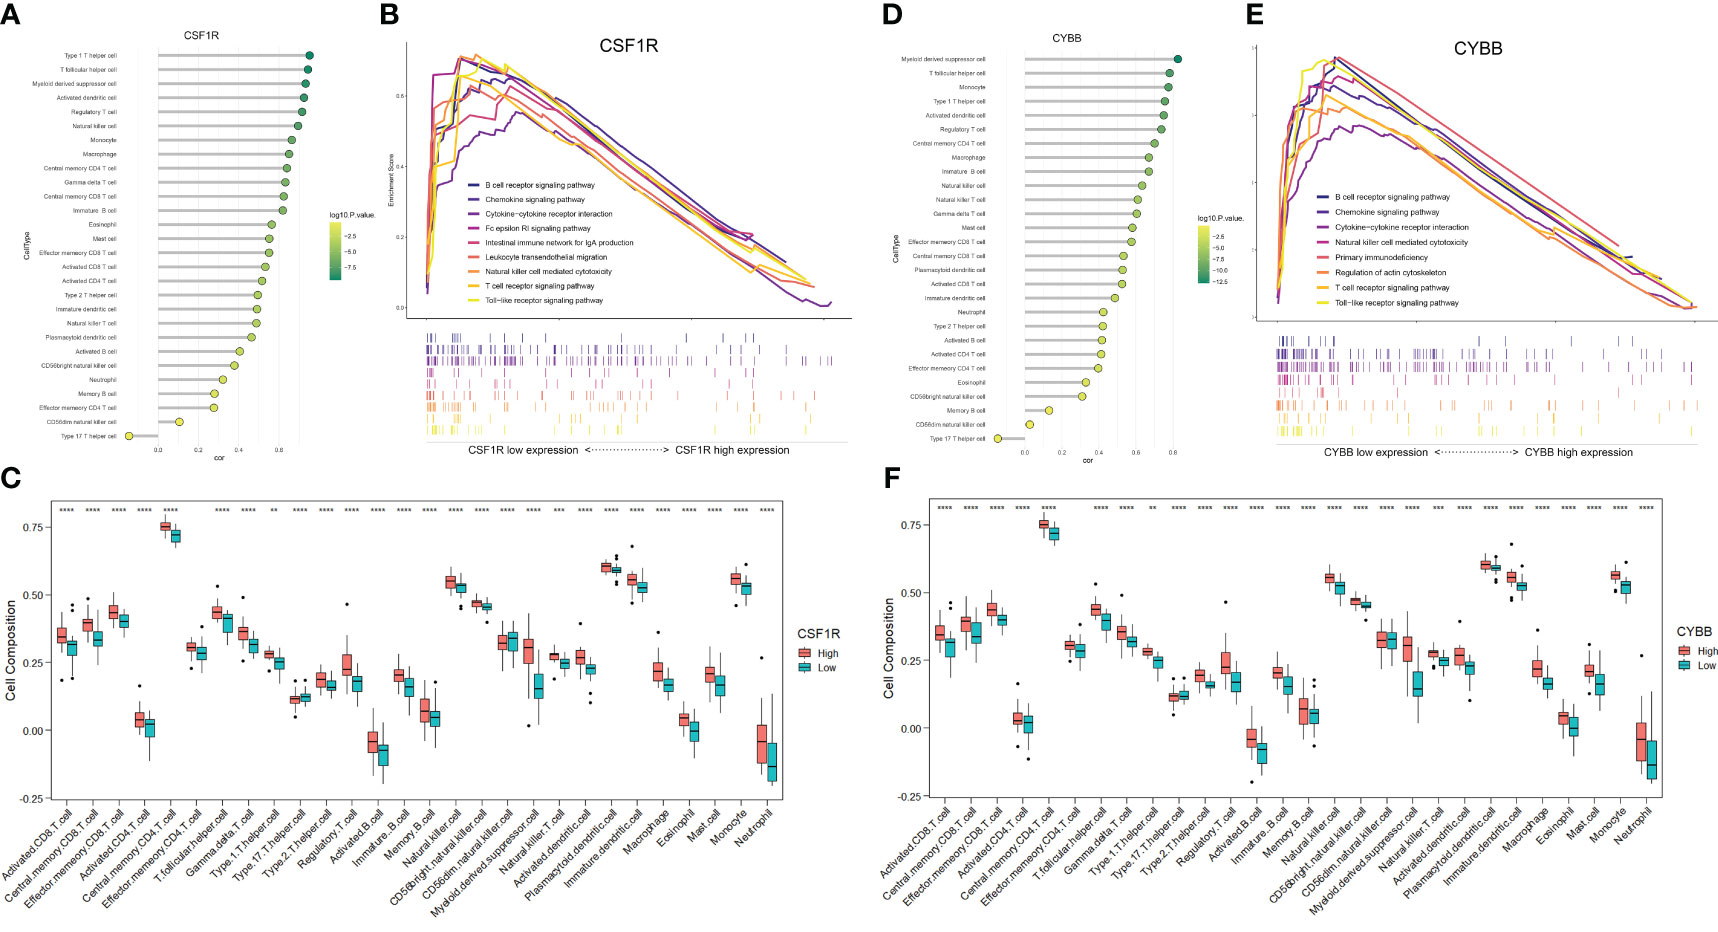
Figure 8 Analysis of immune-associated hub genes. (A) Lollipop plot of CSF1R correlation with 28 immune cells. The horizontal coordinate indicates the correlation size, and the color indicates the P-value. (B) Immune-related GSEA analysis of CSF1R with different expression levels. (C) Distribution of 28 immune cells in CSF1R with different expression levels. (D-F) Analysis of CYBB. **P <0.01, ***P <0.001, ****P <0.0001.
The GSEA of DEGs that take the canonical pathways gene sets (c2.cp.kegg.v7.5.1.symbols) in the MsigDB database as a reference was performed with the criteria of | normalized enriched score (NES)| > 1 and FDR < 0.25 (Supplementary Table S5). The samples were divided into high- and low-expression groups based on the expression levels of CYBB and CSF1R (Figures 8B, E). Overexpression of CSF1R was enriched in pathways involved in B cell/T cell receptor signaling pathways, chemokine signaling pathway, NK cell-mediated cytotoxicity, and cytokine-cytokine receptor interactions (P < 0.05). In addition, the pathways altered by CYBB were related to B cell/T cell receptor signaling pathways, chemokine signaling pathway, and primary immunodeficiency (P < 0.05). These results confirmed that CYBB and CSF1R play crucial roles in immune-related signaling pathways during MN development.
To further analyze the effect of immune-related hub genes on CCRs and pro-inflammatory cytokines, six CCRs and pro-inflammatory cytokines were obtained from the black modules: CCR1, CX3CR1, IL1B, CCL4, TNF, and CCR2. The correlation between CYBB and CSF1R and the six CCRs and pro-inflammatory cytokines is shown in Figure 9A. There was a significant positive correlation with a significant difference (P < 0.01). The correlation between CSF1R and CYBB was further demonstrated using scatter plots (Figures 9B, C). As the expression of CYBB and CSF1R increased, the expression of the six CCRs and proinflammatory cytokines also increased. This showed that CYBB and CSF1R influenced the expression of CCRs and pro-inflammatory cytokines to promote inflammation.
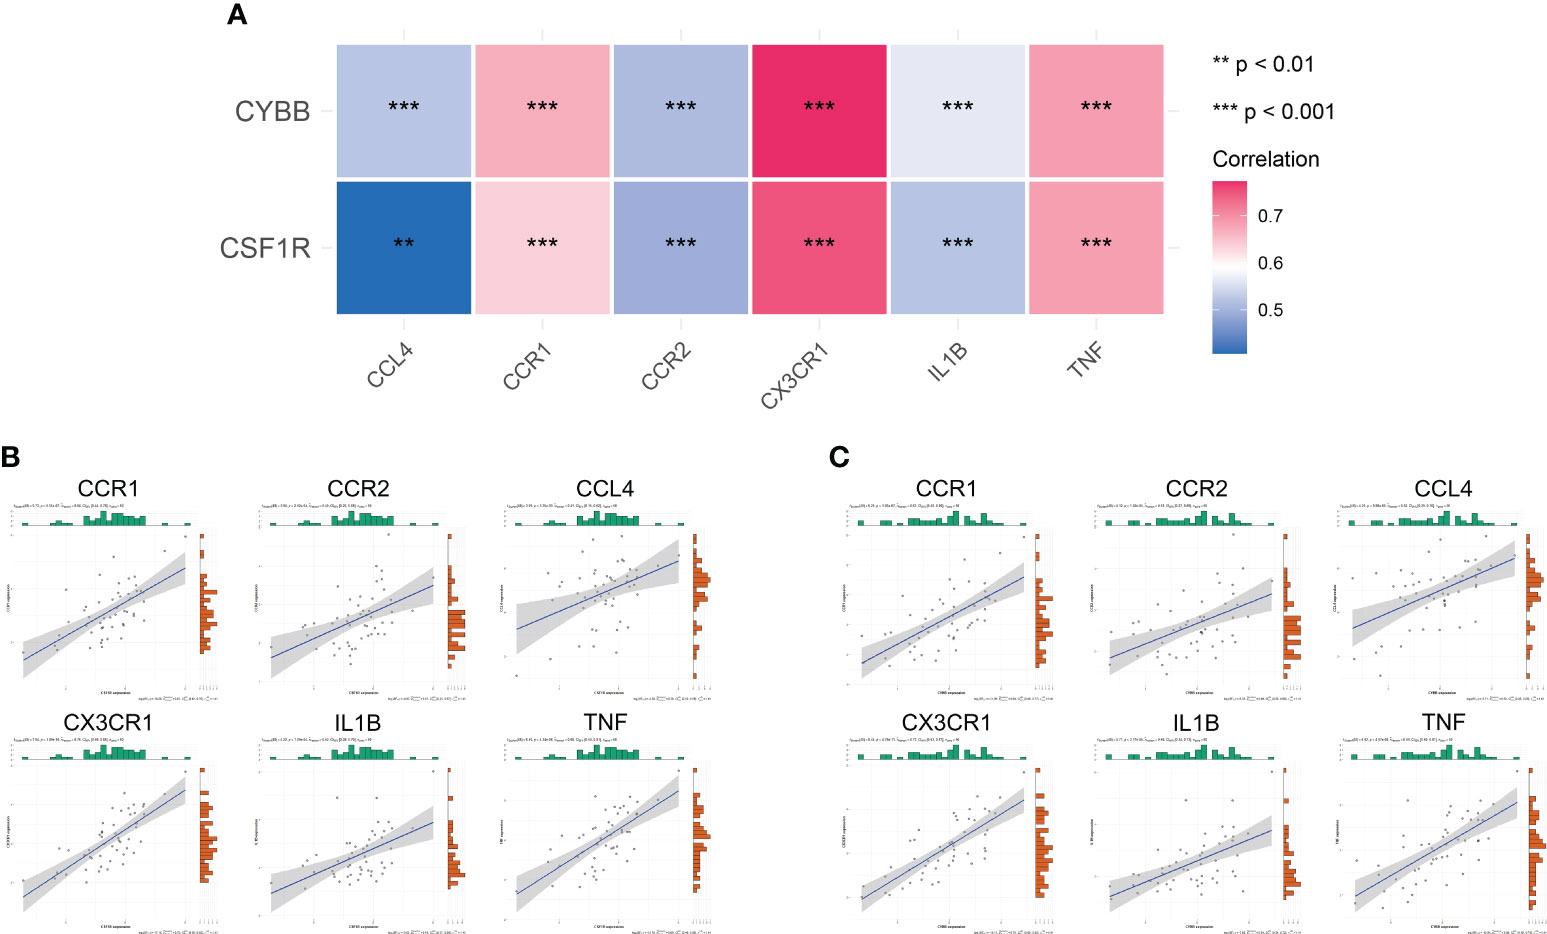
Figure 9 Correlation between immune-related hub genes and inflammatory factors and CCRs. (A) Correlation heat map. The different colors represent the magnitude of the correlation. (B, C) Correlation scatter plot. **P < 0.01, ***P < 0.001.
The experimental results of serum levels of CSF-1 in patients with MN were significantly higher than those in healthy controls (Figure 10A), which is consistent with the results of our bioinformatic prediction. Similarly, increased CYBB expression was observed in patients with MN compared to that in healthy controls (Figure 10B). qPCR analysis showed that mRNA expression of CSF1R and CYBB was increased in patients with MN compared to healthy controls (Figures 10C, D). These experimental findings validate and reinforce the predictive value of bioinformatic analysis, further supporting the involvement of CSF1R and CYBB in MN pathogenesis.
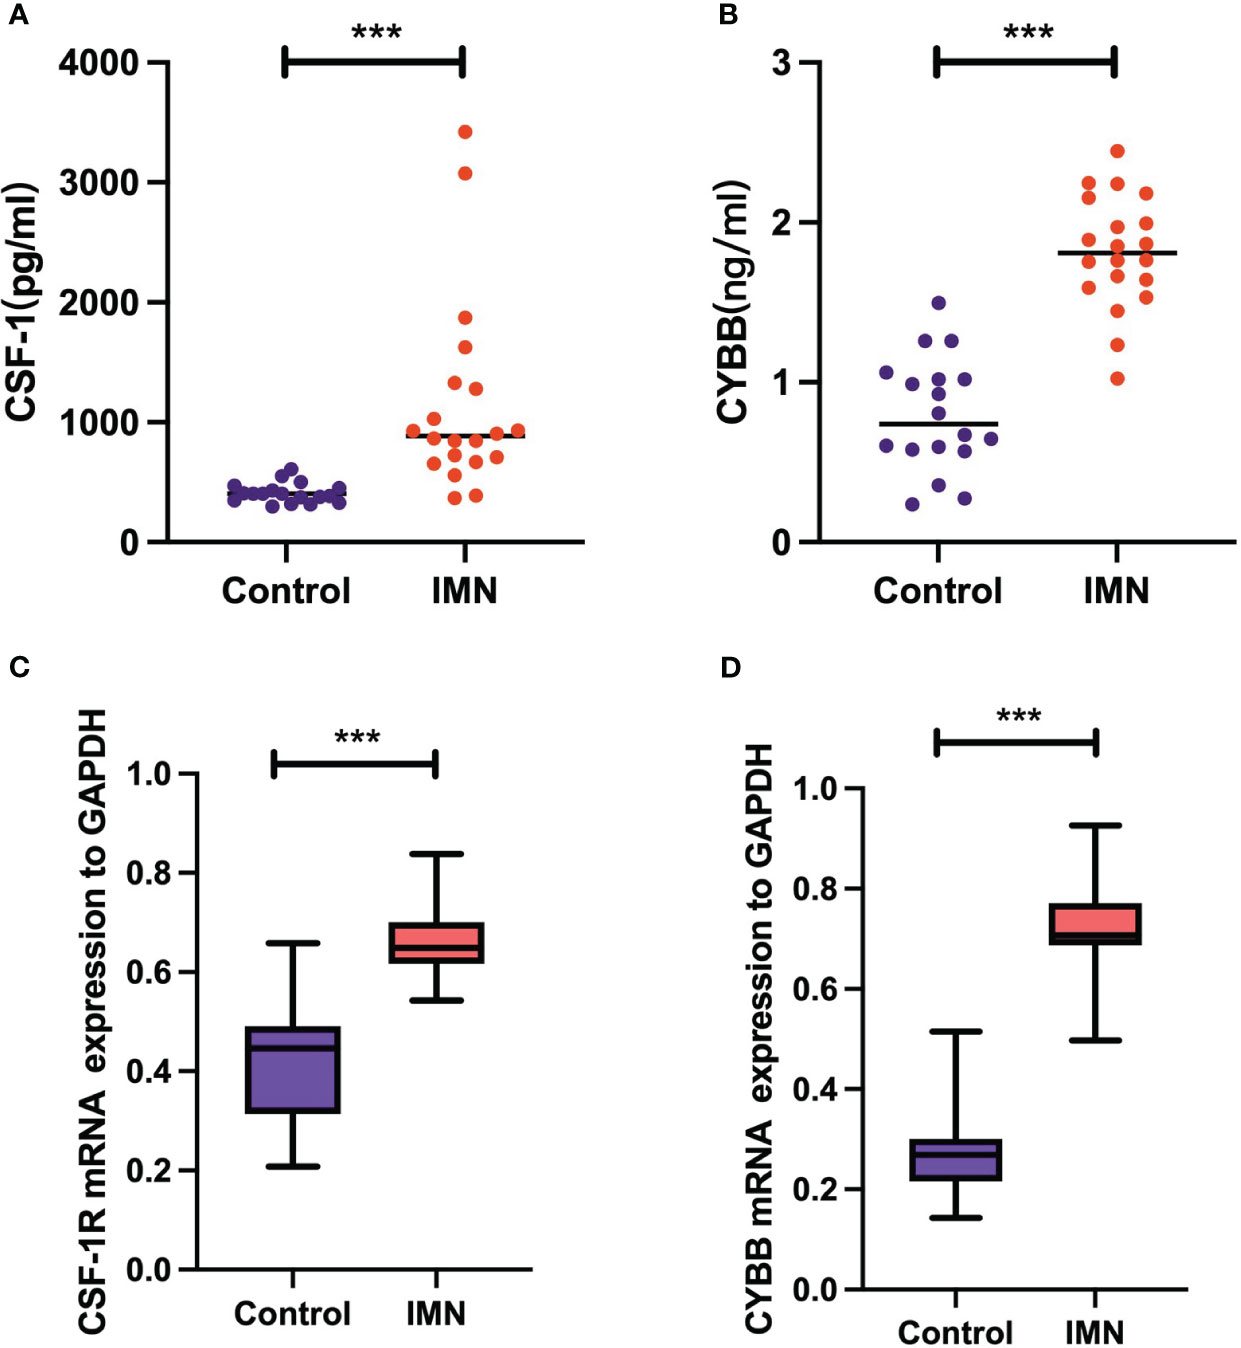
Figure 10 Validation of CSF-1 and CYBB. Each point represents a sample. (A, B) ELISA measurement of CSF-1 and CYBB. (C, D) mRNA expression of CSF1R and CYBB was analyzed by RT-qPCR. ***P < 0.001, vs Control.
In this study, GO analysis revealed that the upregulated genes were primarily enriched in immune system processes, endocytic vesicles, and heme-binding. The pathogenesis of MN involves the formation of circulating immune network complexes and activation of autoreactive immune cells targeting glomerular cells, encompassing both innate and adaptive immune responses. The upregulated genes mainly participated in multiple immune-related diseases and immune pathways according to KEGG, such as the C-type lectin (CTL) receptor (CLR) signaling pathway, cytokine-cytokine receptor interaction, and NK cell-mediated cytotoxicity. The accumulation of subepithelial immunocomplexes induces complement activation and disruption events that lead to the release of pathogen-associated molecular patterns (PAMP) and damage-associated molecular patterns (DAMP). CTLs are pattern recognition receptors that recognize these molecules and play vital roles in the immune system. CLRs on the surface of dendritic cells can promote the expression of costimulatory molecules and enhance their ability to present antigens to CD4+ and CD8+ T cells after binding to ligands, thus regulating the adaptive immune response. After recognizing ligands, CLRs on the surface of lymphocytes can induce the expression of pro-inflammatory factors and facilitate the binding of lymphocytes to major histocompatibility complex I (MHC I) or MHC class I molecules on target cells to induce inflammation and cytotoxicity. The concordance between these findings and the enrichment of upregulated genes suggests the presence of key genes involved in the immune response networks associated with MN.
Growing evidence regarding the pathogenic role of the impaired immune system and the molecular mechanism of MN progression has been widely revealed. Autoantibodies, immune complexes, and cytokines induced by T cells, B cells, monocytes, and other immune cells are involved in the progression of MN. Immune complex deposition within the GBM leads to the release of DAMP, which activate innate immune cells and trigger antigen-presenting cell (APC) activation. Antigen presentation by APCs to T cells leads to their activation and differentiation into subsets, such as Th1 and Th2, which involve key signaling pathways in patients with idiopathic MN (8). T cell-derived cytotoxicity contributes to the inflammatory response and tissue infiltration by immune cells (22). Autoreactive T-cells recruit, activate, and proliferate B-cells, resulting in the production of autoantibodies that cause barrier disruption and irreversible kidney damage. Indeed, basic and clinical research has indicated that the deposition of IgG along the glomerular basement membrane secreted by B cells is a hallmark of MN, which results in a sequence of events that impair the glomerular filtering barrier and induce proteinuria (23). In addition, B cells are present in renal biopsy specimens of MN, which shows that B lymphocytes are related to the pathogenesis of the disease (24). Rituximab treatment reduces glomerular IgG4 and C3 deposition by suppressing autoantibody generation, improving proteinuria in MN (25). Monocytes and macrophages are critical drivers of the innate immune system and are responsible for tissue regeneration and regulation immune (26). A recent study showed that CD14+CD163+CD206+M2 monocytes positively correlated with 24 h urine albumin and PLA2R levels in MN (27). Tubulointerstitial injury is mediated by macrophage migration, which is a common finding during the early phase of MN progression. M2-like monocytes are considered potential indicators of MN severity (28). We employed computational approaches such as CIBERSORTx or the ssGSEA algorithm to analyze immune infiltration. The results of the present study are consistent with previous findings, confirming an altered distribution of immune cells in MN.
Based on the genes closely associated with MN, as identified by PPI network analysis, seven hub genes were identified, namely, ALB, FTCD, HRG, PCK1, and SLC2A2 (upregulated genes) and CSF1R and CYBB (downregulated genes). To identify genes closely related to MN progression, WGCNA was used to identify core molecules. Furthermore, combined with immune cell infiltration analysis, the results of WGCNA revealed that the black module was closely related to immune response in MN, which was further intersected with seven hub genes to obtain the overlapping genes CSF1R and CYBB. These results strongly suggest that the regulation of CSF1R and CYBB may influence MN pathogenesis through the immune system. Based on the immune infiltration analysis, both CSF1R and CYBB were significantly and positively associated with most immune cells, which further confirmed that these two genes play a central role in the autoimmune pathology of MN.
The identification of the roles of CSF1R and CYBB in MN advances our strategies for disease diagnosis and treatment. As a central receptor on the macrophage surface, CSF1R binds to CSF-1 or IL-34 to regulate the development, activation, and function of macrophages (29). Furthermore, the CSF-1R signaling pathway is responsible for migration and multiply of macrophage (30). Several studies have identified CSF-1R as a pharmacological target for alleviating disease progression, including those of rheumatoid arthritis, Alzheimer’s disease, and cancer. Particularly, CSF-1 acted as a “master switch” and contributed to monocyte and macrophage phenotypes that was positively related with lupus activity in kidney diseases (31). Further, the treatment with CSF-1R inhibitor was confirmed to significantly ameliorate renal injury in murine lupus (32). Pharmacological inhibition of CSF-1R with GW2580 alleviated ischemia-induced renal injury by reducing M2 macrophage infiltration (33). Recently, MALDI–MSI analysis was performed to detect proteomic alterations in renal biopsies, and macrophage migration inhibitory factor was identified as a valuable biomarker for response to therapy in MN (34). In addition, renal biopsies from patients with MN showed that monocytes/macrophages predominate the interstitial infiltrate, suggesting that macrophages may be key regulators of the pathogenesis of MN (35). Based on these studies, CSF1R was predicted to contribute to the disturbance of the immune balance associated with MN. CYBB (also called NOX2) is considered the central component of NADPH oxidase, which is responsible for the bactericidal activity within macrophages and neutrophils involved in respiratory bursts (36). When CYBB/NOX2, the terminal component of the respiratory chain, is activated, it enters the plasma membrane to form phagosomes, which are necessary for triggering superoxide production activity of the complex (37). A recent study showed that CYBB/NOX2 in cDCs promotes antigen presentation to activate CD4+ T cells and leads to TH cell-induced tissue damage (38). In a model of hyperhomocysteinemia-induced renal injury, NADPH oxidase-mediated redox signaling was responsible for switching on NLRP3 inflammasome activation, which recruited immune cell infiltration, ultimately leading to glomerular injury and sclerosis (39). These results are further supported by our study. To explore the possible mechanism by which CSF1 and CYBB act on immune cells in MN, GSEA was used to determine the immune function of DEGs. The results revealed that CSF1R and CYBB were significantly correlated with B cell/T cell receptor signaling pathways, which are involved in MN immunopathogenesis. Furthermore, using ELISA, CSF1 and CYBB/NOX2 were found to be overexpressed in patients with MN, and the dependability of their diagnostic values was confirmed by ROC curve analysis, which further verified our bioinformatics analysis results.
Chemokines could promote differentiation of immune cells and induce tissue extravasation (40). Notably, studies have found that podocytes can be stimulated by the inflammatory setting of glomerulonephritis, which is mediated by CCRs (41). The expression of IL-10 and CCR1 mRNA were observed in polarized Mφ, and M-CSF restored the synthesis of IL-10 through M1 Mφ (42). CCL2/MCP-1 coordinates inflammatory monocyte transport between bone marrow, circulation and atherosclerotic plaque by binding to CCR2 (43).The distribution pattern of CX3CR1 was consistent with the expression of T cells and monocytes/macrophages, and it was distributed in both renal interstitial and glomerular infiltrated leukocytes (44). In our study, CCR1, CX3CR1, IL1B, CCL4, TNF, and CCR2 were activated by CSF1 and CYBB/NOX2, which are closely related to the inflammatory response. These results reveal that CSF1 and CYBB/NOX2 could be potential diagnostic biomarkers and immunotherapy targets for MN.
Our study has some limitations. First, the sample size of healthy controls was small, which may have influenced the study results. Second, through validation using sera from patients with MN, gene expression levels in renal tissues need to be further explored, and experimental studies are warranted to utilize our results in clinical settings. Third, there was little clinical information in the included dataset, which resulted in further correlation analyses that could not be conducted.
Through comprehensive bioinformatics analysis, we identified two hub genes (CSF1R and CYBB) that are closely involved in the progression of MN. The results of this preliminary study highlight the significance of immune infiltration and the relationship between the two hub genes and most immune cells with potential immune mechanisms in MN. CSF1R and CYBB influenced the expression of CCRs and proinflammatory cytokines (CCR1, CX3CR1, IL1B, CCL4, TNF, and CCR2). CSF1R and CYBB may be potential biomarkers for MN progression, providing a perspective for diagnostic and immunotherapeutic targets of MN.
The original contributions presented in the study are included in the article/Supplementary Material. Further inquiries can be directed to the corresponding authors.
The studies involving humans were approved by the Ethics Committee of Beijing Dongzhimen Hospital, First Clinical Medical College of Beijing University of Chinese Medicine. All the patients/participants provided written informed consent to participate in the study. The studies were conducted in accordance with the local legislation and institutional requirements. The participants provided their written informed consent to participate in this study.
PZ: Writing – original draft. YG: Data curation. JT: Formal analysis. ZC: Software. XX: Validation. KY: Methodology. HC: Project administration. All authors contributed to the article and approved the submitted version.
This study was supported by the Major project jointly constructed by the State Administration of Traditional Chinese Medicine and Zhejiang Provincial Administration of Traditional Chinese Medicine (GZY-ZJ-KJ-23013) and the Zhejiang natural science foundation of China (Y23H270009).
The authors declare that the research was conducted in the absence of any commercial or financial relationships that could be construed as a potential conflict of interest.
All claims expressed in this article are solely those of the authors and do not necessarily represent those of their affiliated organizations, or those of the publisher, the editors and the reviewers. Any product that may be evaluated in this article, or claim that may be made by its manufacturer, is not guaranteed or endorsed by the publisher.
The Supplementary Material for this article can be found online at: https://www.frontiersin.org/articles/10.3389/fimmu.2023.1252347/full#supplementary-material
1. Ronco P, Debiec H. Molecular pathogenesis of membranous nephropathy. Annu Rev Pathol (2020) 15:287–313. doi: 10.1146/annurev-pathol-020117-043811
2. Francis JM, Beck LH Jr., Salant DJ. Membranous nephropathy: A journey from bench to bedside. Am J Kidney Dis (2016) 68(1):138–47. doi: 10.1053/j.ajkd.2016.01.030
4. Beck LH Jr., Salant DJ. Membranous nephropathy: from models to man. J Clin Invest (2014) 124(6):2307–14. doi: 10.1172/JCI72270
5. Couser WG. Primary membranous nephropathy. Clin J Am Soc Nephrol (2017) 12(6):983–97. doi: 10.2215/CJN.11761116
6. Beck LH Jr., Bonegio RG, Lambeau G, Beck DM, Powell DW, Cummins TD, et al. M-type phospholipase A2 receptor as target antigen in idiopathic membranous nephropathy. N Engl J Med (2009) 361(1):11–21. doi: 10.1056/NEJMoa0810457
7. Ronco P, Beck L, Debiec H, Fervenza FC, Hou FF, Jha V, et al. Membranous nephropathy. Nat Rev Dis Primers (2021) 7(1):69. doi: 10.1007/978-3-642-27843-3_94-1
8. Motavalli R, Etemadi J, Kahroba H, Mehdizadeh A, Yousefi M. Immune system-mediated cellular and molecular mechanisms in idiopathic membranous nephropathy pathogenesis and possible therapeutic targets. Life Sci (2019) 238:116923. doi: 10.1016/j.lfs.2019.116923
9. van de Logt AE, Fresquet M, Wetzels JF, Brenchley P. The anti-PLA2R antibody in membranous nephropathy: what we know and what remains a decade after its discovery. Kidney Int (2019) 96(6):1292–302. doi: 10.1016/j.kint.2019.07.014
10. Motavalli R, Etemadi J, Soltani-Zangbar MS, Ardalan MR, Kahroba H, Roshangar L, et al. Altered Th17/Treg ratio as a possible mechanism in pathogenesis of idiopathic membranous nephropathy. Cytokine (2021) 141:155452. doi: 10.1016/j.cyto.2021.155452
11. Kuroki A, Iyoda M, Shibata T, Sugisaki T. Th2 cytokines increase and stimulate b cells to produce IgG4 in idiopathic membranous nephropathy. Kidney Int (2005) 68(1):302–10. doi: 10.1111/j.1523-1755.2005.00415.x
12. Fervenza FC, Abraham RS, Erickson SB, Irazabal MV, Eirin A, Specks U, et al. Rituximab therapy in idiopathic membranous nephropathy: a 2-year study. Clin J Am Soc Nephrol (2010) 5(12):2188–98. doi: 10.2215/CJN.05080610
13. Cantarelli C, Jarque M, Angeletti A, Manrique J, Hartzell S, O'Donnell T, et al. A comprehensive phenotypic and functional immune analysis unravels circulating anti-phospholipase A2 receptor antibody secreting cells in membranous nephropathy patients. Kidney Int Rep (2020) 5(10):1764–76. doi: 10.1016/j.ekir.2020.07.028
14. Jiang BC, Liu T, Gao YJ. Chemokines in chronic pain: cellular and molecular mechanisms and therapeutic potential. Pharmacol Ther (2020) 212:107581. doi: 10.1016/j.pharmthera.2020.107581
15. Cortes-Ciriano I, Gulhan DC, Lee JJ, Melloni GEM, Park PJ. Computational analysis of cancer genome sequencing data. Nat Rev Genet (2022) 23(5):298–314. doi: 10.1038/s41576-021-00431-y
16. Abbott TR, Dhamdhere G, Liu Y, Lin X, Goudy L, Zeng L, et al. Development of CRISPR as an antiviral strategy to combat SARS-CoV-2 and influenza. Cell (2020) 181(4):865–76 e12. doi: 10.1016/j.cell.2020.04.020
17. Ritchie ME, Phipson B, Wu D, Hu Y, Law CW, Shi W, et al. Limma powers differential expression analyses for RNA-sequencing and microarray studies. Nucleic Acids Res (2015) 43(7):e47. doi: 10.1093/nar/gkv007
18. Davis S, Meltzer PS. GEOquery: a bridge between the gene expression omnibus (GEO) and BioConductor. Bioinformatics (2007) 23(14):1846–7. doi: 10.1093/bioinformatics/btm254
19. Huang da W, Sherman BT, Lempicki RA. Systematic and integrative analysis of large gene lists using DAVID bioinformatics resources. Nat Protoc (2009) 4(1):44–57. doi: 10.1038/nprot.2008.211
20. Bindea G, Mlecnik B, Tosolini M, Kirilovsky A, Waldner M, Obenauf AC, et al. Spatiotemporal dynamics of intratumoral immune cells reveal the immune landscape in human cancer. Immunity (2013) 39(4):782–95. doi: 10.1016/j.immuni.2013.10.003
21. Langfelder P, Horvath S. WGCNA: an r package for weighted correlation network analysis. BMC Bioinf (2008) 9:559. doi: 10.1186/1471-2105-9-559
22. Suarez-Fueyo A, Bradley SJ, Klatzmann D, Tsokos GC. T cells and autoimmune kidney disease. Nat Rev Nephrol (2017) 13(6):329–43. doi: 10.1038/nrneph.2017.34
23. Glassock RJ. Human idiopathic membranous nephropathy–a mystery solved? N Engl J Med (2009) 361(1):81–3. doi: 10.1056/NEJMe0903343
24. Cohen CD, Calvaresi N, Armelloni S, Schmid H, Henger A, Ott U, et al. CD20-positive infiltrates in human membranous glomerulonephritis. J Nephrol (2005) 18(3):328–33.
25. Ruggenenti P, Fervenza FC, Remuzzi G. Treatment of membranous nephropathy: time for a paradigm shift. Nat Rev Nephrol (2017) 13(9):563–79. doi: 10.1038/nrneph.2017.92
26. Laria A, Lurati A, Marrazza M, Mazzocchi D, Re KA, Scarpellini M. The macrophages in rheumatic diseases. J Inflammation Res (2016) 9:1–11. doi: 10.2147/JIR.S82320
27. Hou J, Zhang M, Ding Y, Wang X, Li T, Gao P, et al. Circulating CD14(+)CD163(+)CD206(+) M2 monocytes are increased in patients with early stage of idiopathic membranous nephropathy. Mediators Inflamm (2018) 2018:5270657. doi: 10.1155/2018/5270657
28. Mezzano SA, Droguett MA, Burgos ME, Ardiles LG, Aros CA, Caorsi I, et al. Overexpression of chemokines, fibrogenic cytokines, and myofibroblasts in human membranous nephropathy. Kidney Int (2000) 57(1):147–58. doi: 10.1046/j.1523-1755.2000.00830.x
29. Buechler MB, Fu W, Turley SJ. Fibroblast-macrophage reciprocal interactions in health, fibrosis, and cancer. Immunity (2021) 54(5):903–15. doi: 10.1016/j.immuni.2021.04.021
30. Sehgal A, Irvine KM, Hume DA. Functions of macrophage colony-stimulating factor (CSF1) in development, homeostasis, and tissue repair. Semin Immunol (2021) 54:101509. doi: 10.1016/j.smim.2021.101509
31. Ruacho G, Lira-Junior R, Gunnarsson I, Svenungsson E, Bostrom EA. Inflammatory markers in saliva and urine reflect disease activity in patients with systemic lupus erythematosus. Lupus Sci Med (2022) 9(1):e000607. doi: 10.1136/lupus-2021-000607
32. Chalmers SA, Wen J, Shum J, Doerner J, Herlitz L, Putterman C. CSF-1R inhibition attenuates renal and neuropsychiatric disease in murine lupus. Clin Immunol (2017) 185:100–8. doi: 10.1016/j.clim.2016.08.019
33. Deng X, Yang Q, Wang Y, Zhou C, Guo Y, Hu Z, et al. CSF-1R inhibition attenuates ischemia-induced renal injury and fibrosis by reducing Ly6C(+) M2-like macrophage infiltration. Int Immunopharmacol (2020) 88:106854. doi: 10.1016/j.intimp.2020.106854
34. L'Imperio V, Smith A, Ajello E, Piga I, Stella M, Denti V, et al. MALDI-MSI pilot study highlights glomerular deposits of macrophage migration inhibitory factor as a possible indicator of response to therapy in membranous nephropathy. Proteomics Clin Appl (2019) 13(3):e1800019. doi: 10.1002/prca.201800019
35. Alexopoulos E, Seron D, Hartley RB, Nolasco F, Cameron JS. Immune mechanisms in idiopathic membranous nephropathy: The role of the interstitial infiltrates. Am J Kidney Diseases (1989) 13(5):404–12. doi: 10.1016/S0272-6386(89)80024-1
36. Weaver CJ, Leung YF, Suter DM. Expression dynamics of NADPH oxidases during early zebrafish development. J Comp Neurol (2016) 524(10):2130–41. doi: 10.1002/cne.23938
37. Rastogi R, Geng X, Li F, Ding Y. NOX activation by subunit interaction and underlying mechanisms in disease. Front Cell Neurosci (2016) 10:301. doi: 10.3389/fncel.2016.00301
38. Keller CW, Kotur MB, Mundt S, Dokalis N, Ligeon LA, Shah AM, et al. CYBB/NOX2 in conventional DCs controls t cell encephalitogenicity during neuroinflammation. Autophagy (2021) 17(5):1244–58. doi: 10.1080/15548627.2020.1756678
39. Abais JM, Zhang C, Xia M, Liu Q, Gehr TW, Boini KM, et al. NADPH oxidase-mediated triggering of inflammasome activation in mouse podocytes and glomeruli during hyperhomocysteinemia. Antioxid Redox Signal (2013) 18(13):1537–48. doi: 10.1089/ars.2012.4666
40. Markl F, Huynh D, Endres S, Kobold S. Utilizing chemokines in cancer immunotherapy. Trends Cancer (2022) 8(8):670–82. doi: 10.1016/j.trecan.2022.04.001
41. Popovic ZV, Bestvater F, Krunic D, Kramer BK, Bergner R, Loffler C, et al. CD73 overexpression in podocytes: A novel marker of podocyte injury in human kidney disease. Int J Mol Sci (2021) 22(14):7642. doi: 10.3390/ijms22147642
42. Nakano H, Kirino Y, Takeno M, Higashitani K, Nagai H, Yoshimi R, et al. GWAS-identified CCR1 and IL10 loci contribute to M1 macrophage-predominant inflammation in behcet's disease. Arthritis Res Ther (2018) 20(1):124. doi: 10.1186/s13075-018-1613-0
43. Georgakis MK, Bernhagen J, Heitman LH, Weber C, Dichgans M. Targeting the CCL2-CCR2 axis for atheroprotection. Eur Heart J (2022) 43(19):1799–808. doi: 10.1093/eurheartj/ehac094
Keywords: membranous nephropathy, immune, inflammatory cytokines, biomarkers, bioinformatics
Citation: Zhang P, Geng Y, Tang J, Cao Z, Xiang X, Yang K and Chen H (2023) Identification of biomarkers related to immune and inflammation in membranous nephropathy: comprehensive bioinformatic analysis and validation. Front. Immunol. 14:1252347. doi: 10.3389/fimmu.2023.1252347
Received: 03 July 2023; Accepted: 21 September 2023;
Published: 09 October 2023.
Edited by:
Henry Liu, Penn State Milton S. Hershey Medical Center, United StatesReviewed by:
Zhongda Jin, Guangdong Provincial Hospital of Chinese Medicine, ChinaCopyright © 2023 Zhang, Geng, Tang, Cao, Xiang, Yang and Chen. This is an open-access article distributed under the terms of the Creative Commons Attribution License (CC BY). The use, distribution or reproduction in other forums is permitted, provided the original author(s) and the copyright owner(s) are credited and that the original publication in this journal is cited, in accordance with accepted academic practice. No use, distribution or reproduction is permitted which does not comply with these terms.
*Correspondence: Xiaojun Xiang, eHhqNzU2M0BzaW5hLmNvbQ==; Kezhen Yang, NzY3Mjk5NjMyQHFxLmNvbQ==; Hongbo Chen, Y2hlbmhiNTIxQDEyNi5jb20=
†These authors have contributed equally to this work
Disclaimer: All claims expressed in this article are solely those of the authors and do not necessarily represent those of their affiliated organizations, or those of the publisher, the editors and the reviewers. Any product that may be evaluated in this article or claim that may be made by its manufacturer is not guaranteed or endorsed by the publisher.
Research integrity at Frontiers
Learn more about the work of our research integrity team to safeguard the quality of each article we publish.