
95% of researchers rate our articles as excellent or good
Learn more about the work of our research integrity team to safeguard the quality of each article we publish.
Find out more
ORIGINAL RESEARCH article
Front. Immunol. , 01 August 2023
Sec. Comparative Immunology
Volume 14 - 2023 | https://doi.org/10.3389/fimmu.2023.1236812
 Zi-Rui Wang1,2†
 Shu-Yao Li1,2†
 Ya-Zhou Zhang1,2Yong-An Li1,2Huan-Huan Huo1,2Chuan-Qi Yu1,2
 Qiu-Bai Zhou1,2*
The subject of this study was to explore the optimum requirements of loach (Paramisgurnus dabryanus) regarding dietary proteins and lipids and discuss the underlying mechanism. We designed nine diets to determine the effects of different levels of dietary crude protein (CP: 30%, 35%, and 40%) and ether extract (EE: 6%, 10%, and 14%) on the growth performance and metabolism of P. dabryanus. In total, 2160 healthy P. dabryanus (5.19 ± 0.01 g) were divided into nine groups with four replications at 60 fish per barrel stocking density. The trial lasted for eight weeks. Serum and liver samples were gathered for metabolomic and transcriptomic analyses. The results showed that the specific growth rate of P. dabryanus in the CP40EE10 group was the fastest and notably higher than that in other groups (P< 0.05). Analysis of the metabolome results found that the mTOR signaling pathway, glycerophospholipid metabolism, D-arginine and D-ornithine metabolism were significantly enriched pathways in the CP40EE10 group compared with the other groups (P< 0.05). Moreover, the transcriptomic analysis of differentially expressed genes (DEGs) showed that the expression of ARG (arginase) involved in protein synthesis was significantly upregulated in the CP40EE10 group compared to the slowest growing group (P< 0.05). Additionally, the expression of SPLA2 (secretory phospholipase A2) involved in lipid metabolism and FBP (fructose-1,6-bisphosphatase) involved in glucose metabolism were all significantly downregulated in the CP30EE6 group compared with the CP40EE10 group (P< 0.05). Furthermore, the analysis of differentially expressed metabolites (DEMs) and DEGs co-enriched in the KEGG pathway revealed that the significantly enriched pathways were arginine and proline metabolism, glycerophospholipid metabolism, and glycolysis/gluconeogenesis in CP40EE10 compared with other groups (P< 0.05). We conclude that including 40% CP and 10% EE in the P. dabryanus diet could result in a better growth rate. We hypothesized from metabolomic and transcriptomic analyses that the CP40EE10 diet might promote the growth of P. dabryanus by promoting protein synthesis, lipid metabolism, and energy production.
Paramisgurnus dabryanus (P. dabryanus), a member of Cypriniformes, Cobitidae, Paramisgurnus, it is famous for its high survival rate, strong disease resistance and fast-growing (1). Moreover, the fillet of P. dabryanus richly contains high-quality protein, fatty acid, various mineral elements, and B vitamins, which are popular among consumers (2, 3). The nutritional value of wild loach is higher than that of farmed loach, but the yield of wild loach cannot meet the needs of consumers. Thus, an artificial culture of loach is necessary. At present, studies of loach have focused on investigating breeding and reproduction (4), hybridization (5), and immune responses (6, 7). However, research progress on the nutritional requirements of artificial feed for loach is slower than that of other fish (2, 8).
The suitable nutrient composition of feed ensures a nutritional balance to promote growth and minimizes production costs and nitrogen emissions. Furthermore, it has been reported that dietary lipids have a protein-retaining effect, and the addition of more lipids in the diet improves the efficient utilization of protein, thereby maximizing nitrogen retention and improving growth performance (9–11). As a result, evaluate and determine the optimal levels of dietary protein and lipid for the artificial diet of P. dabryanus is of great significance
Previous studies on the nutrient composition of the feed of aquatic animals tend to focus on apparent indicators, such as weight gain rate, survival rate, and biochemical blood indicators (11–13). However, more and more researchers have paid attention to understanding the growth of fish on the metabolic and molecular levels after technological developments (14–16). In recent years, the rapid development of integrated multi-omics analysis reported has provided new understanding for revealing the hidden biological regularities of various phenotypes (17–20). Transcriptomic data can be used to explore functional genes associated with phenotypes, but do not reflect actual metabolite level in an organism at the level of gene expression, which makes it hard to determine the critical path of specific character (21–23).
Metabolomics can be used to understand the physiological and biochemical states of biological systems about phenotypes at the metabolite level (24, 25). Therefore, an integrated analysis of metabolomics and transcriptomics can further link genes and metabolites to systematically characterize metabolic pathways associated with phenotypes (19, 26).
In previous studies, dietary protein requirements of Paramisgurnus dabryanus (3 to 6 g) were from 33% to 36% and lipid levels were from 5% to 7% to achieve optimal growth performance (1, 27–29). Thus, 3 protein levels of 30%, 35%, 40% and 3 lipid levels of 6%, 10%, 14% were designed to evaluate the interaction effects of different dietary protein and lipid levels on growth performance and investigated the optimal balance of protein and lipid in P. dabryanus diets and the mechanisms behind it using LC-MS/MS metabolomics approach and the RNA-seq transcriptomics approach. These findings will strengthen our comprehension of the mechanisms behind growth differences and help to explore optimal nutritional requirements and feeding regimens of P. dabryanus.
Soybean meal and fish meal were the main sources of protein, soy lecithin, soybean oil and fish oil were the main sources of lipid. A complete crossover experiment with three levels of crude protein (CP) and three levels of ether extract (EE) was used to formulate a total of 9 diets with four replicates (Table 1). The ingredients were ground to an ideal particle size (80 mesh), weighed, mixed and added water to stir evenly according to the formula, then used a granulator to form feed pellets with a diameter of 2 mm, which were dried for later use.
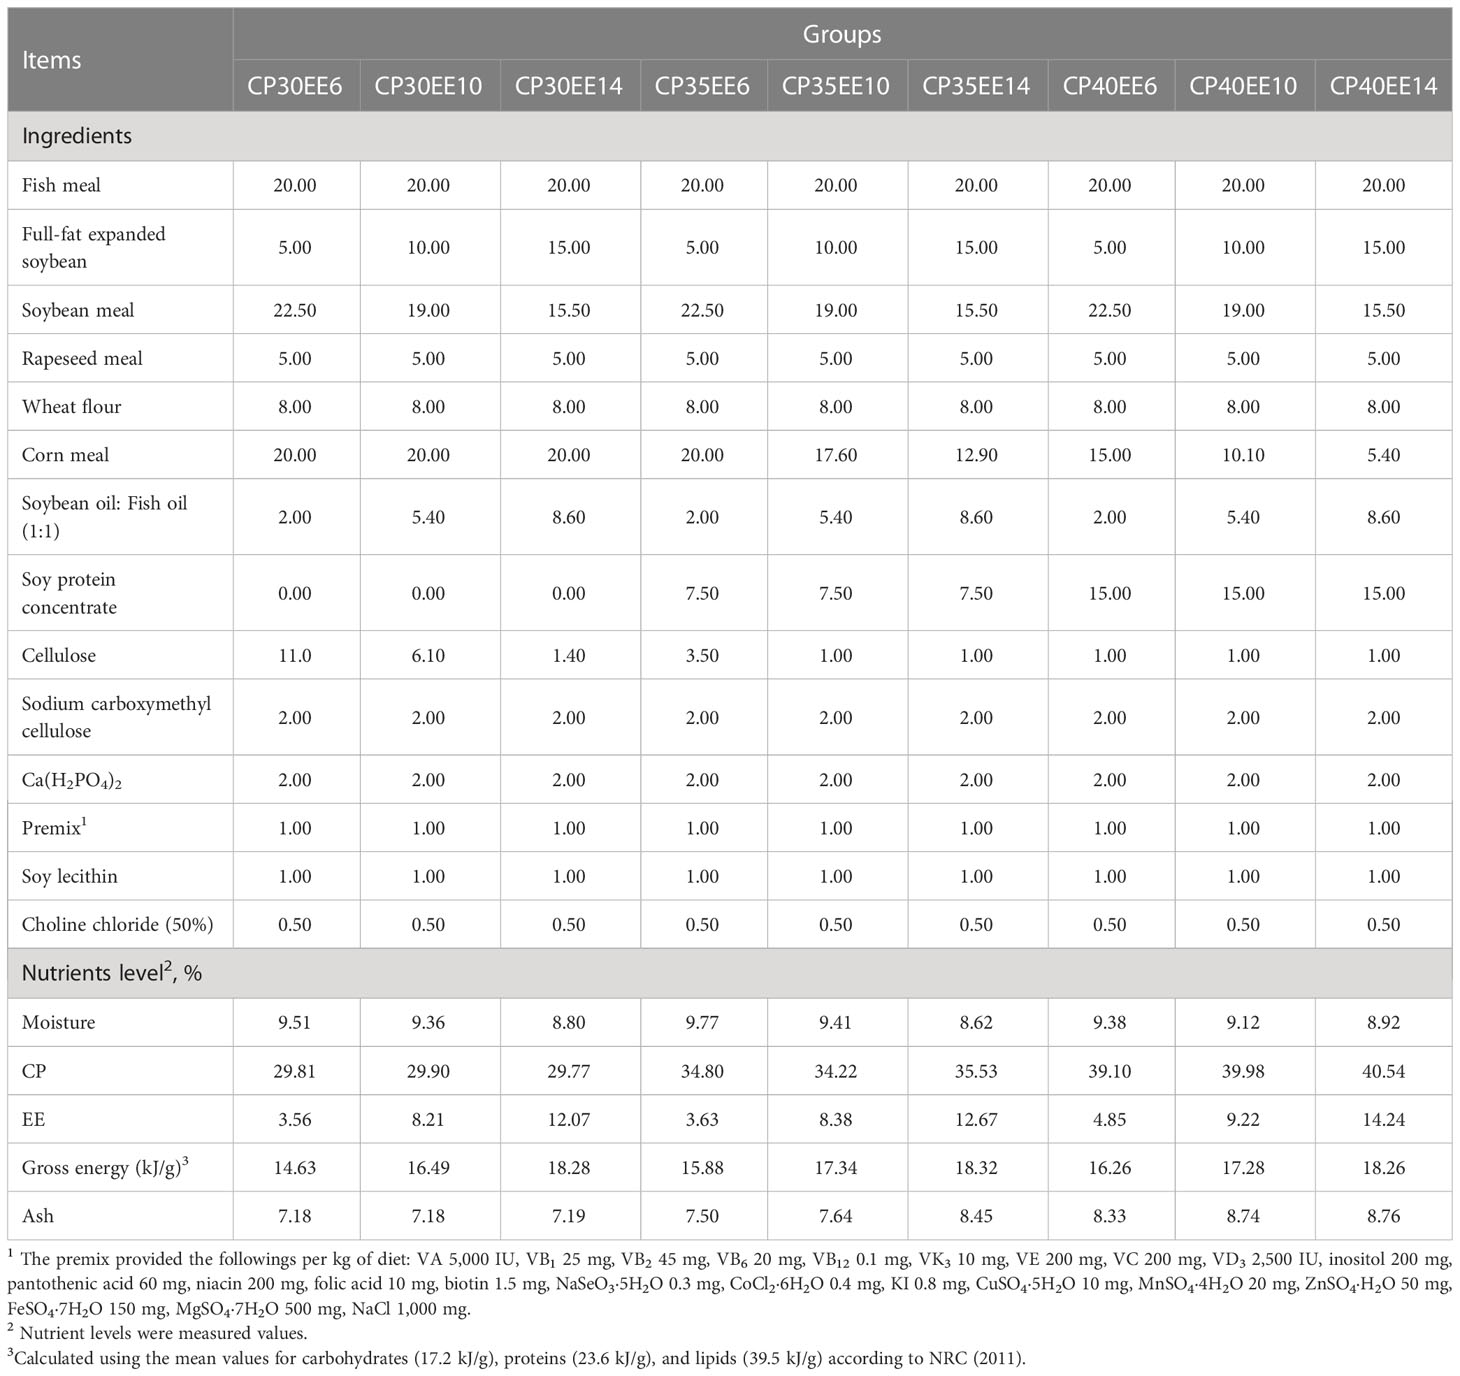
Table 1 The composition and nutrient level of experimental feed (air-dry basis) %.
Paramisgurnus dabryanus conducted in the sunshine shed of the breeding base of Jiangxi Agricultural University were from the Fengcheng Loach Breeding Professional Cooperative of Jiangxi province, China. In this study, a total of 2160 healthy P. dabryanus (5.19 ± 0.01 g) were divided into nine groups with four replications at a stocking density of 60 fish per tank (80 cm × 66 cm × 64 cm), and fed with nine diets (Table 1) twice-daily (08:00 and 17:00) for an eight-week period according to 3% of the fish body weight. During the trial, 1/2 water was exchanged once a week with continuous aeration throughout the experimental period. The water temperature was 25~28°C and the dissolved oxygen was above 5 mg/L, and the photoperiod was determined by the natural lighting. All experimental procedures were performed according to the regulations in the China Law for Animal Health Protection and Instructions (Ethics approval No. SCXK (YU2005-0001)).
At the end of the feeding experiment, the number and weight of loaches were obtained after 24 hours of starvation to evaluate growth performance. Four loaches per barrel were anesthetized with MS-222 (100 mg/mL). Then wipe the surface of the loaches with 75% ethanol. Blood samples of 8 loaches from each group were collected, centrifuged at 3000 r/min for 10 min, and serum samples were collected for metabolomics analysis. Liver samples of 8 loaches form each group were immediately stored in liquid nitrogen for liver transcriptome analysis. All samples were transferred to an ultra-low-temperature refrigerator at −80 °C.
All chemical composition analyses of diets were conducted according to the methods specified by the AOAC (1995). Moisture was analyzed by 105 °C normal temperature drying method (GB/T 6435-2014), crude protein (N × 6.25) by Kjeldahl method (GB/T 6432-1994), crude lipid by Soxhlet extraction method (GB/T 6433-2006) and ash analysis by combustion at 550°C using a muffle furnace (GB/T6438-2007).
IBW is the initial body weight (g), FBW is the final body weight (g), d denotes days of feeding.
Metabolomic was performed in OE Biotech Co. Ltd., Shanghai, China. The sample was added into 1.5 mL EP tube with 10 μL of 2-chloro-l-phenylalanine (0.3 mg/mL) dissolved in methanol as the internal standard. After 10 seconds of vorticity, 300 μL of ice-cold mixture of methanol and acetonitrile (2:1) was added, and vortexed for 1 minute, then it is ultra sounded on ice for 10 minutes and incubation at −20°C for 30 minutes to precipitated proteins. The extract was centrifuged at 13000 rpm for 10 min at 4 °C, and the supernatant was taken from a 300 µL glass vial and dried by freezing and concentrating in a centrifugal dryer. A mixture of 400 µL methanol and water (1:4) were added to each sample, the sample was swirled for 30 seconds, ultra sounded for 3 minutes, and then placed at -20 °C for 2 hours. The sample was centrifuged at 13000 rpm for 10 min at 4 °C. Each tube of supernatants (150 µL) was collected with a crystal syringe, filtered through a 0.22 µm microfilter, and transferred into LC vials. The samples were stored at −80°C for LC-MS analysis. Quality control (QC) samples were prepared by mixing equal portions of all samples as a single combined sample (30).
ACQUITY UPLC I-Class system (Waters Corporation, Milford, USA) was used in conjunction with VION IMS QTOF mass spectrometry to analyze ESI positive ion and ESI negative ion mode metabolic profiles. ACQUITY UPLC BEH C18 column (100×2.1 mm, 1.7 µm) was used for both modes. The column temperature was 45°C. Water containing 0.1% formic acid and acetonitrile/methanol 2/3 were used as mobile phases A and B, respectively. The gradient program was 0/99, 1/70, 2.5/40, 6.5/10, 8.5/0, 10.7/0, 10.8/99, 13/99 (min/% mobile phase A), and the flow rate of mobile phase was 0.4 mL/min. All samples were kept at 4 °C during analysis. A mass spectrometry (MS) system equipped with ESI source was used to scan samples with a mass range of 50 to 1000 in both positive and negative ion modes. The parameters of MS were as follows: electrospray capillary voltage 2500 V, injection voltage 40 V, collision voltage 4 eV, ion source temperature 115°C, desolving temperature 450 m, desolving gas flow 900 L/h (30).
The data was preprocessed prior to pattern recognition, and the raw data was subjected to baseline filtering, peak recognition, integration, retention time correction, peak alignment, and normalization by metabolomics software Progenesis QI V2.3 (Nonlinear Dynamics, Newcastle, UK). Human Metabolome Database (HMDB), Lipidmaps (V2.3), METLIN database and self-built database were used to identify compounds based on accurate mass numbers, secondary fragments and isotope distribution. Differential metabolites were screened by partial least squares discriminant analysis (PLS-DA) model with projected variable importance (VIP≥1), and T-test results were obtained by univariate analysis (P< 0.05).
Transcriptomics was performed in OE Biotech Co. Ltd., Shanghai, China. Total RNA was isolated using the Mir-VANA miRNA kit (Cat. AM1561, Invitrogen, Thermo Fisher Scientific Inc., USA), following manufacturer’s protocol. RNA purity and quantification were assessed using a NanoDrop 2000 spectrophotometer (Thermo Fisher Scientific, Waltham, MA, USA). RNA integrity was assessed using the Agilent 2100 bioanalyzer (Agilent Technologies, Santa Clara, CA, USA). The library was then constructed using the TruSeq stranded mRNA LT sample preparation kit (Illumina, San Diego, CA, USA) according to the manufacturer’s instructions.
High-quality reads were screened by removing all reads containing adapters, containing > 10% unknown nucleotides and > 50% low-quality bases. Then, De novo splicing was conducted. Trinity software was used to obtain the transcription sequences by pairing end splicing (31). According to sequence similarity and length, the longest one was selected, and the CD-HIT software was used for clustering to eliminate redundancy, and a set of final Unigene was obtained as a reference sequence for subsequent analysis (32). BUSCO has constructed single-copy gene sets for several extensive evolutionary clays from the OrthoDB database (33). Unigene was compared with NR, KOG, GO, Swiss-Prot, eggNOG and KEGG databases by diamond software (34) and Pfam database by HMMER software (35). Using the spliced Unigene as a database, the expression abundance of Unigene in each sample was identified by sequence similarity comparison. Bowtie2 was used to calculate the number of reads compared with Unigene in each sample (36), and the expression level of Unigene (FPKM value) was calculated. These values were then compared to explore differences in gene expression between the samples. DESeq2 was used for inter-group and inter-sample comparisons to identify DEGs. KEGG pathway enrichment analysis was performed on these DEGs relative to the genome-wide background using the same method as the differential abundance metabolite analyses described above.
The results of growth performance data were determined using one-way analysis of variance, followed by Duncan’s multiple comparisons test. Optimal nutrient combination levels were obtained by two-factor analysis of variance. The data were presented as mean ± SE; significant differences (P< 0.05) between variables. Statistical analysis was performed using SPSS 25.0.
The combination of different lipid and protein levels in the diet significantly affected the WGR and SGR of P. dabryanus (P< 0.05; Figure 1). The WGR and SGR of P. dabryanus in CP40EE10 were higher than those in the other groups. On the other hand, CP30EE6 as a low-protein/low-lipid diet group and CP30EE14 as a low-protein/high-lipid diet group were inferior to the CP40EE10 group. Next, a pairwise comparison of CP30EE6 vs. CP40EE10 and CP30EE14 vs. CP40EE10 were conducted to analyze the molecular mechanisms affecting the growth of P. dabryanus.
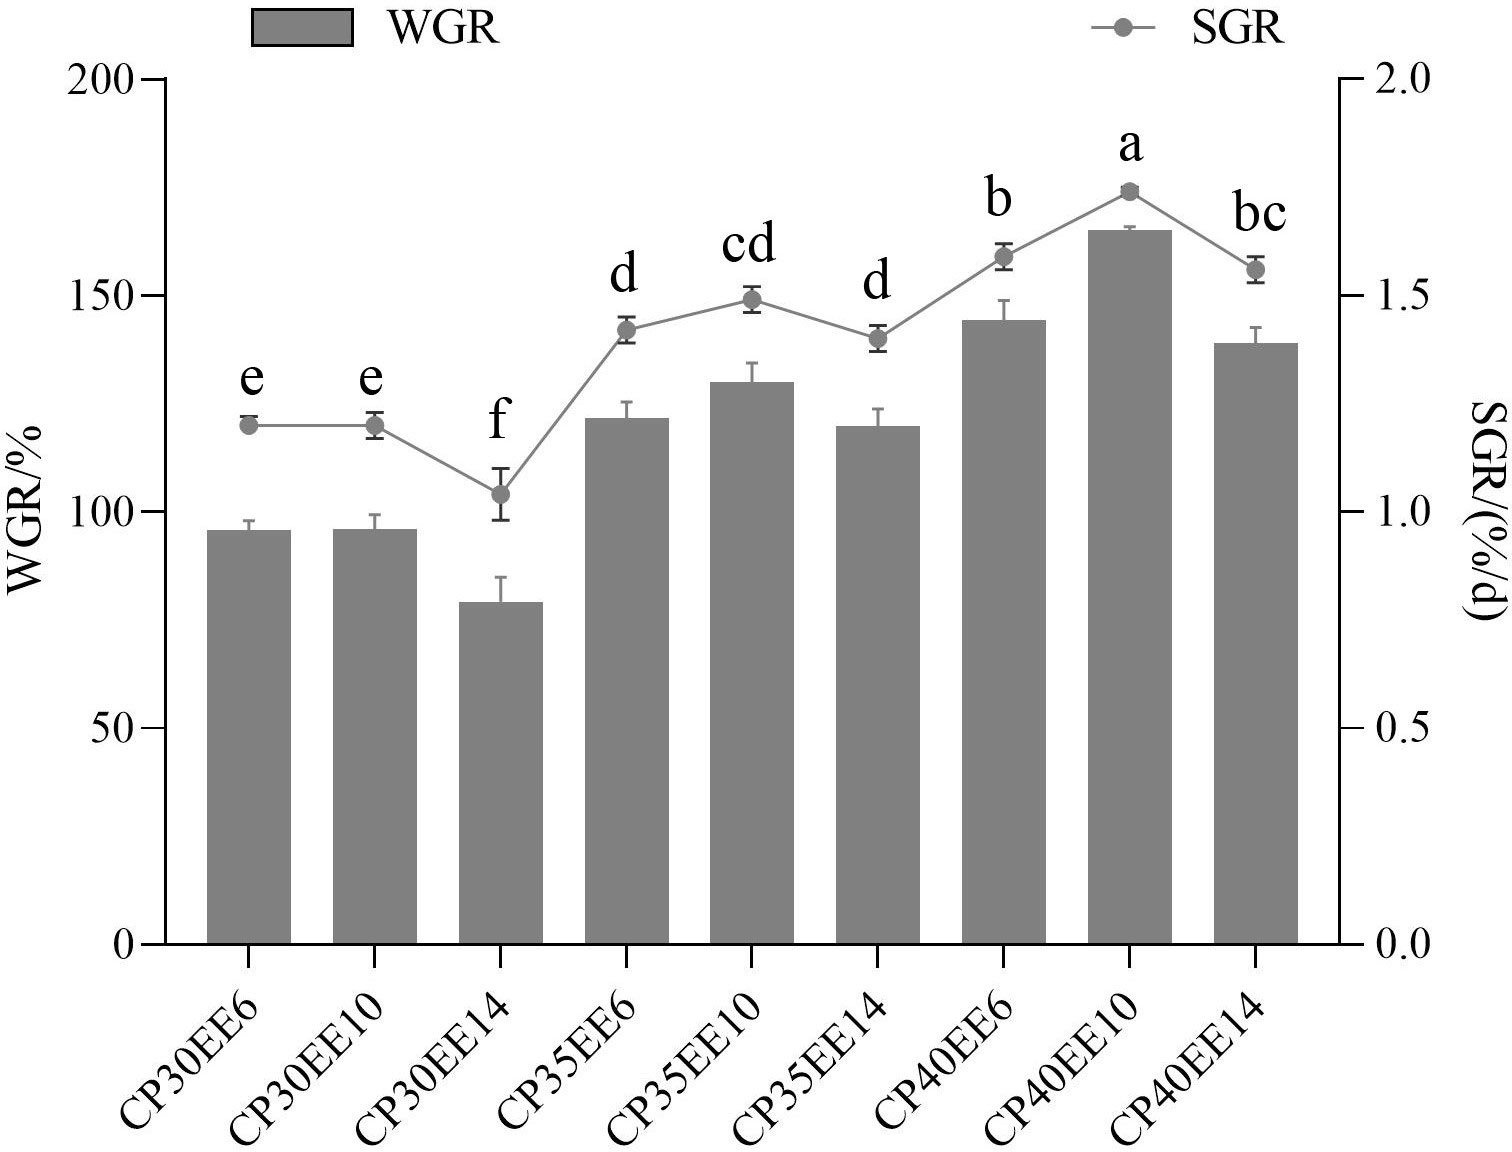
Figure 1 Effect of different combinations of lipid and protein levels in diets on growth performance of Paramisgurnus dabryanus WGR, weight gain rate; SGR, specific growth rate; Diets: CP30EE6: 30% crude protein, 6% ether extract; CP30EE10: 30% crude protein, 10% ether extract; CP30EE14: 30% crude protein, 14% ether extract; etc.; Treatment means represent the average values for 4 tanks per treatment; treatment means followed by different superscript letter in the same column are significantly different (P < 0.05).
Principal component analysis (PCA) was used to reduce the dimensionality of the detected metabolite data to analyze the grouping trends and outliers of the observed variables in the dataset. There was a clear separation between the CP40EE10 vs. CP30EEE6 and CP40EE10 vs. CP30EE14 groups (Figure 2). Besides, PLS-DA score plots showed an apparent division between groups (Figure 2). Combining the above two results, the CP40EE10 group was significantly different from both the CP30EE6 and CP30EE14 groups regarding their metabolite levels (P< 0.05).
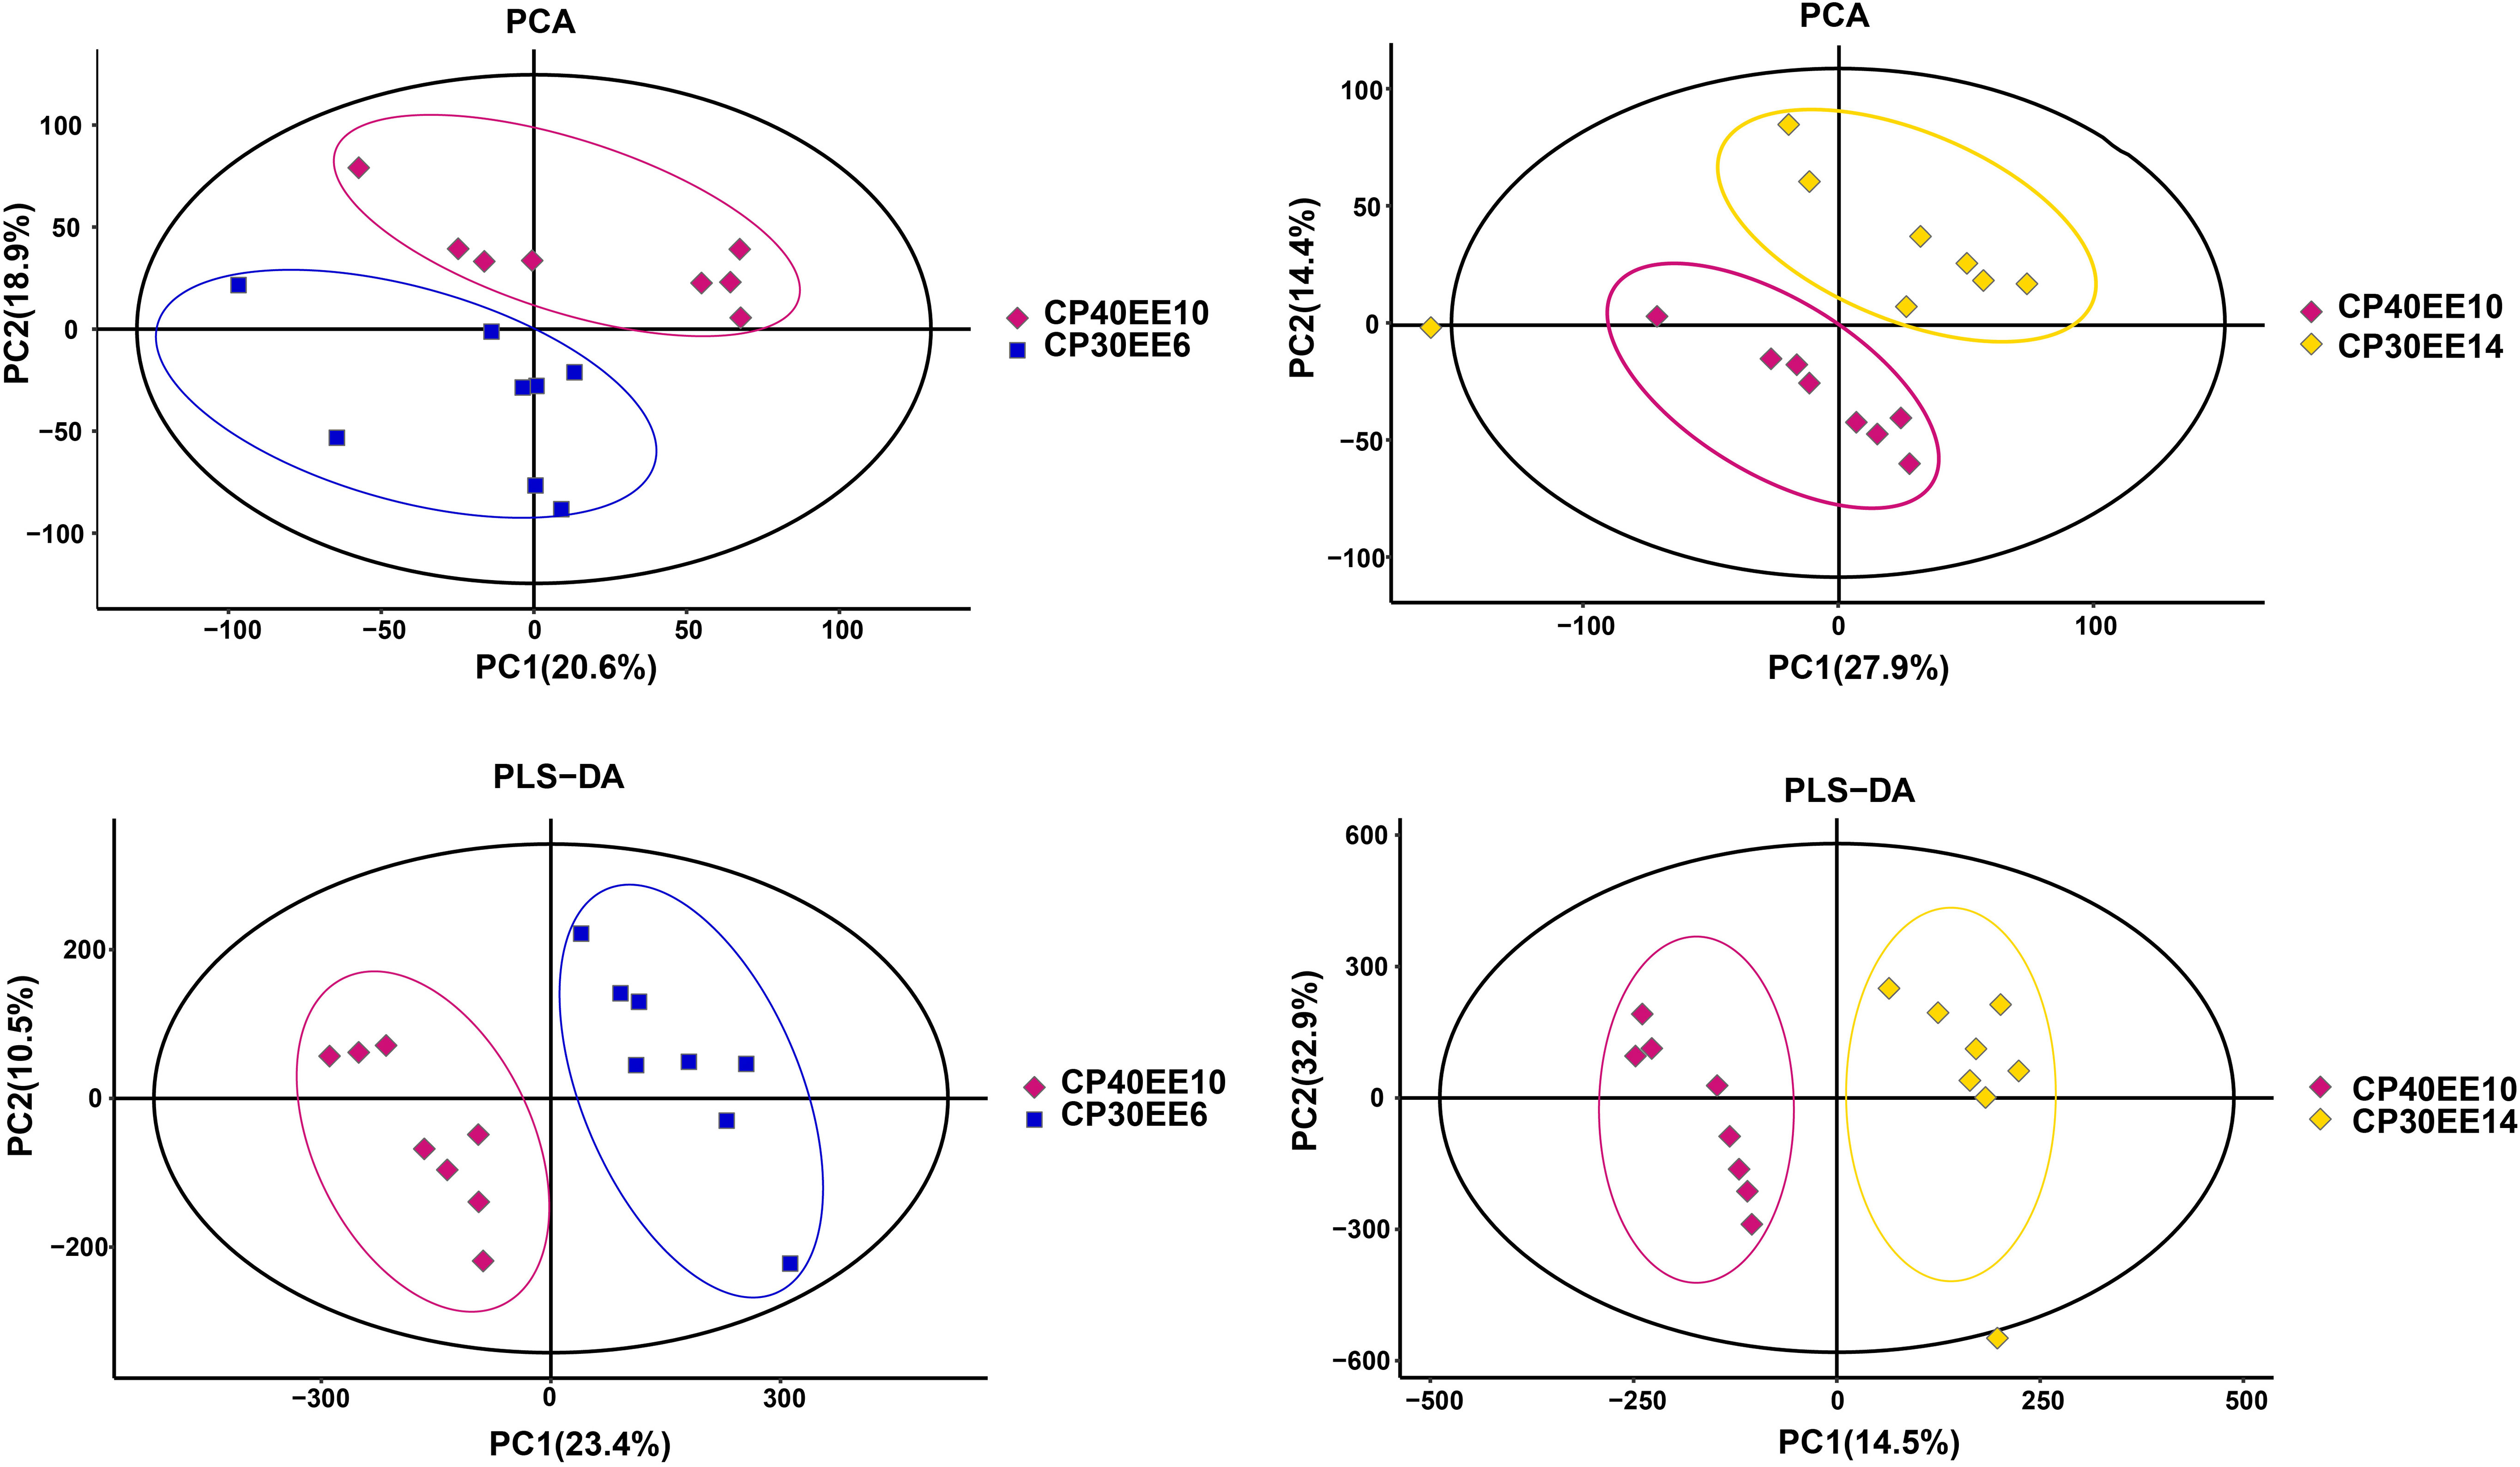
Figure 2 PCA and PLS-DA score plots of serum metabolites in samples. CP30EE6, 30% crude protein, 6% ether extract; CP30EE14, 30% crude protein, 14% ether extract; CP40EE10, 30% crude protein, 10% ether extract.
LC-MS/MS was used to analyze the serum of eight replicate samples from CP30EE6, CP30EE14, and CP40EE10. A total of 1492 metabolites were detected. There were 100 differentially expressed metabolites (DEMs) in the CP40EE10 group compared with the CP30EE6 group, including 73 metabolites markedly upregulated and 27 metabolites significantly down-regulated (P< 0.05). Meanwhile, there were a total of 107 DEMs in the CP40EE10 group, with 56 metabolites obviously upregulated and 51 metabolites obviously downregulated (P< 0.05) (Figures 3, 4), compared with the CP30EE14 group.
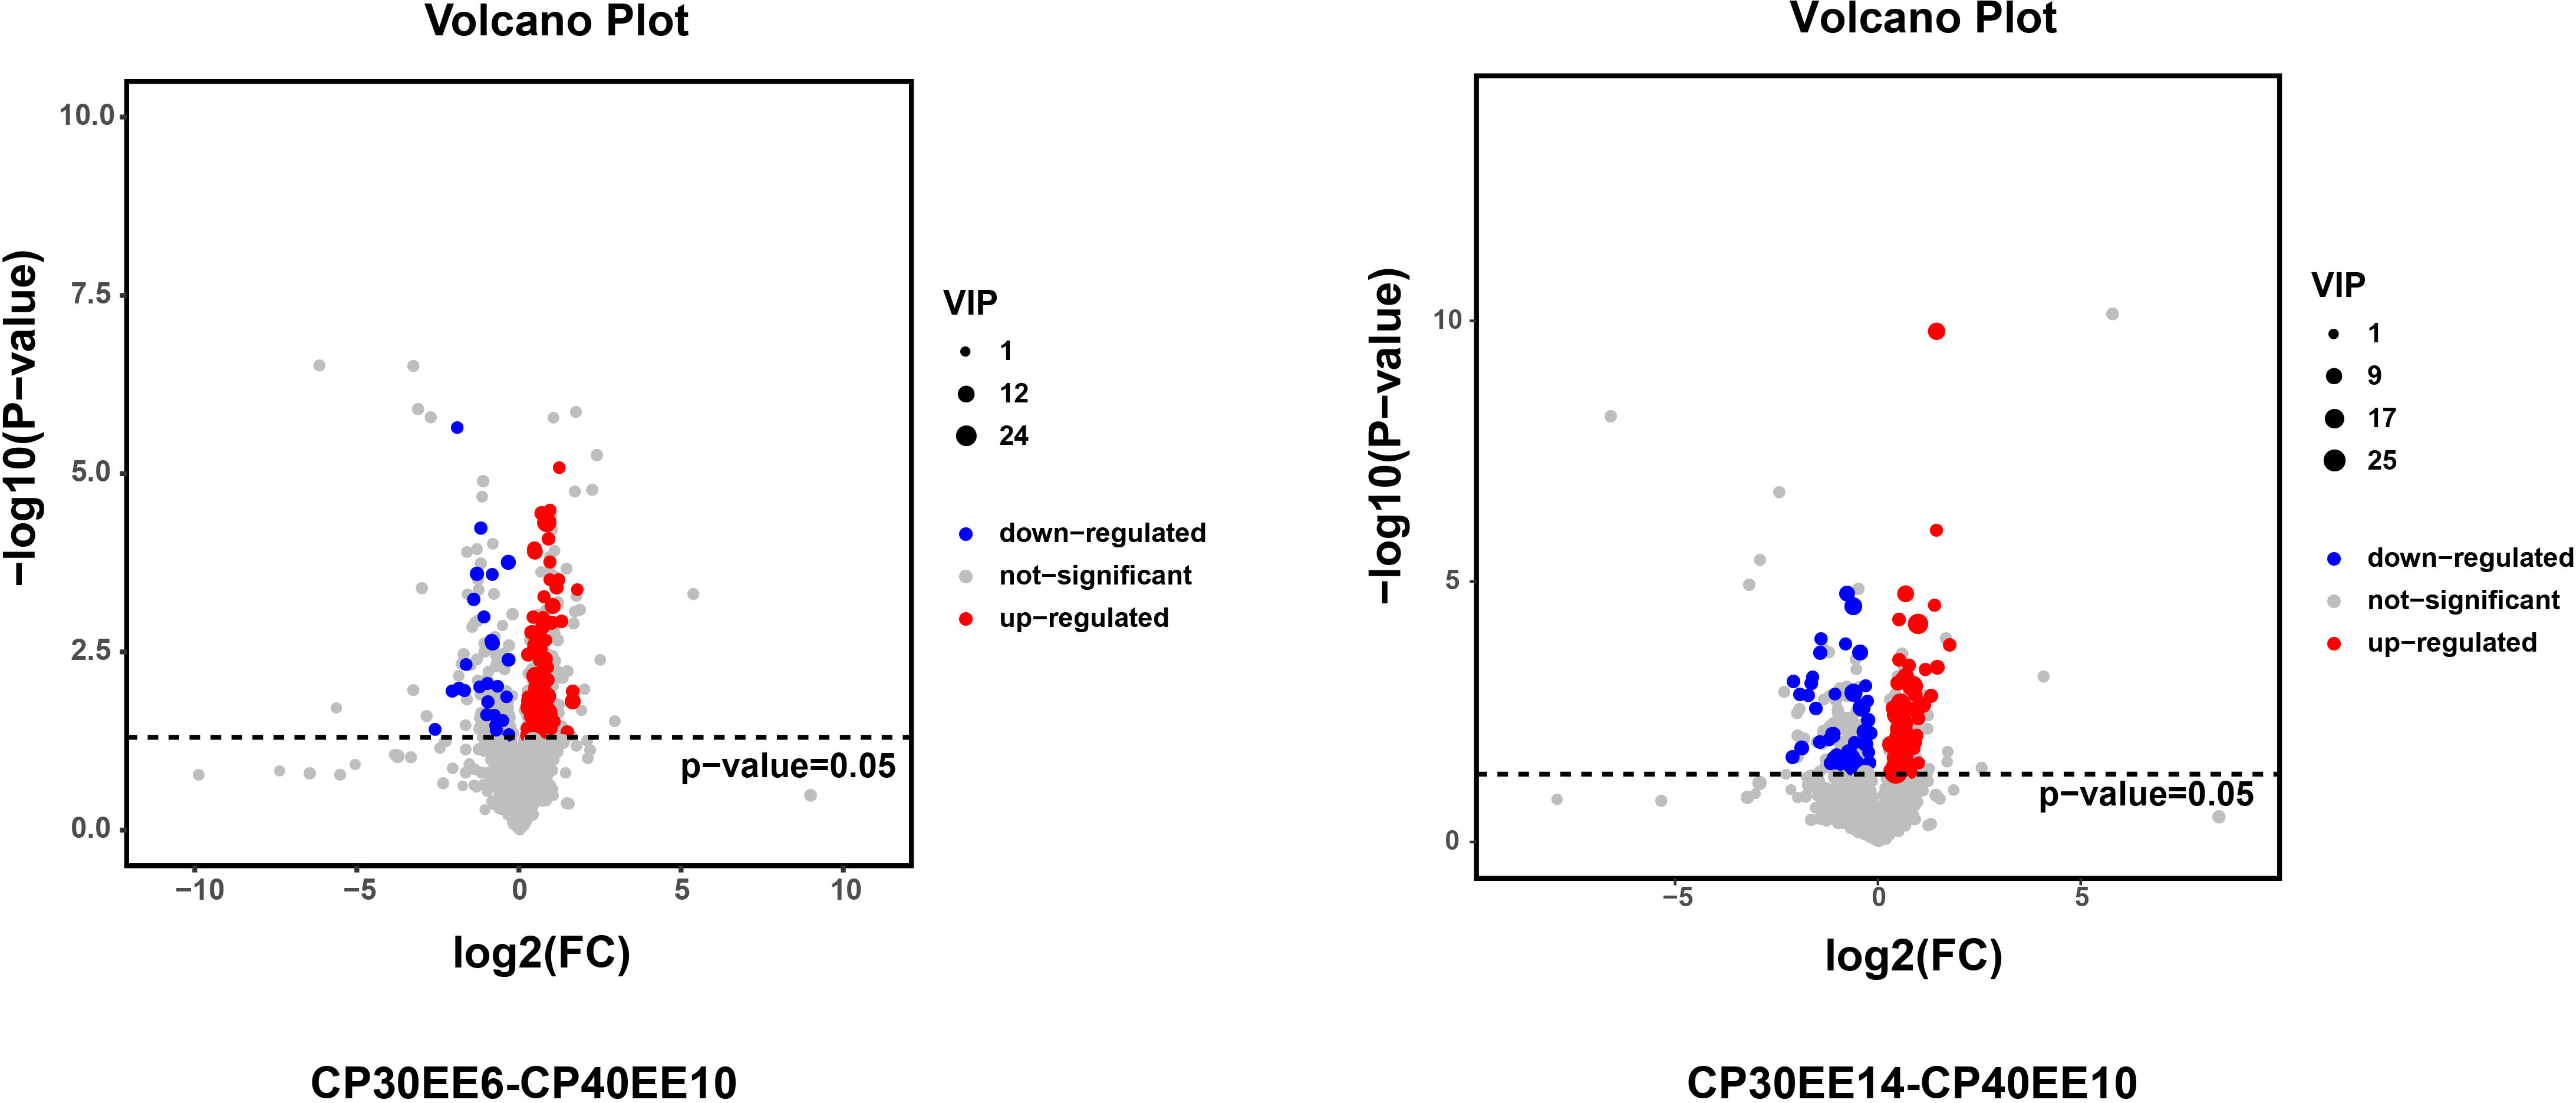
Figure 3 Volcanic plot of DEMs. DEMs, differentially expressed metabolites; CP30EE6, 30% crude protein, 6% ether extract; CP30EE14, 30% crude protein, 14% ether extract; CP40EE10, 30% crude protein, 10% ether extract.
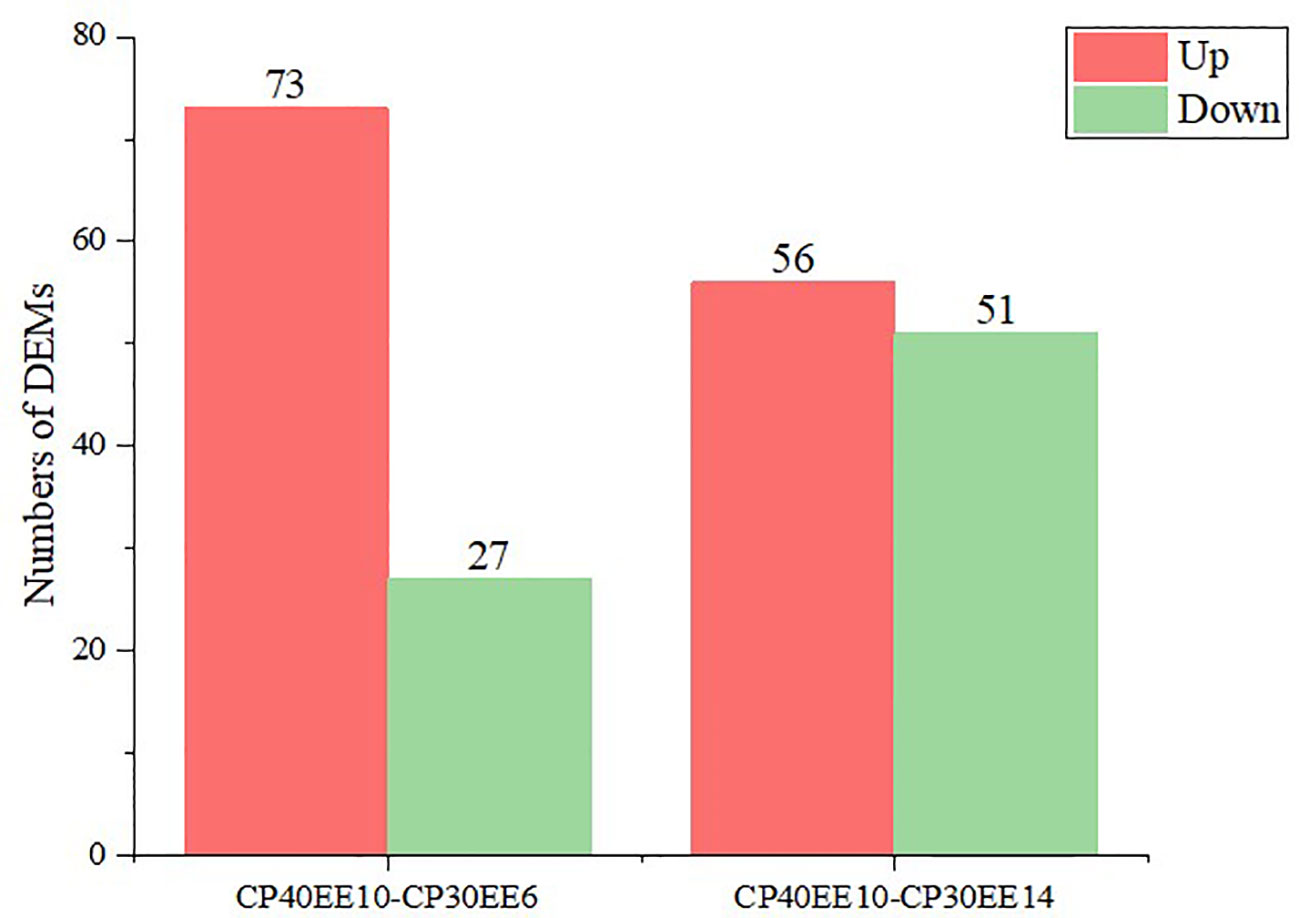
Figure 4 Statistics of DEMs in CP40EE10 vs CP30EE6 and CP40EE10 vs CP30EE14. Red represents significant up-regulation, and green represents significant down-regulation (Same as below). DEMs, differentially expressed metabolites; CP30EE6, 30% crude protein, 6% ether extract; CP30EE14, 30% crude protein, 14% ether extract; CP40EE10, 30% crude protein, 10% ether extract.
A total of 20 and 21 metabolic pathways were detected in CP40EE10 vs. CP30EE6 and CP40EE10 vs. CP30EE14, respectively (Figure 5), in the enrichment analysis of the above DEMs in the KEGG pathway. Primary bile acid biosynthesis, mTOR signaling pathway, glycerophospholipid metabolism, D-arginine and D-ornithine metabolisms were the first four significant differential pathways between the CP40EE10 and CP30EE6 groups (Figure 5A). The glycerophospholipid metabolism, arachidonic acid metabolism, autophagy–other, mTOR signaling pathway, autophagy–animal, and D-arginine and D-ornithine metabolisms were the first six significant differential pathways between the CP40EE10 and CP30EE14 groups (Figure 5B). The three metabolic pathways, glycerophospholipid metabolism, mTOR signaling pathway, and D-arginine and D-ornithine metabolisms in the CP40EE10 group were significantly enriched compared with the other two groups (P< 0.05), as shown in Figure 6. In these pathways, L-arginine was available in the mTOR signaling pathway and D-arginine and D-ornithine metabolism. Phosphatidylcholine (PC), 1-Acyl-sn-glycero-3-phosphocholine (LysoPC), glycerophosphocholine, phosphocholine, and phosphatidylethanolamine (PE) were involved in glycerophospholipid metabolism. The expression of these DEMs in the CP40EE10 group was significantly higher than in the other two groups.
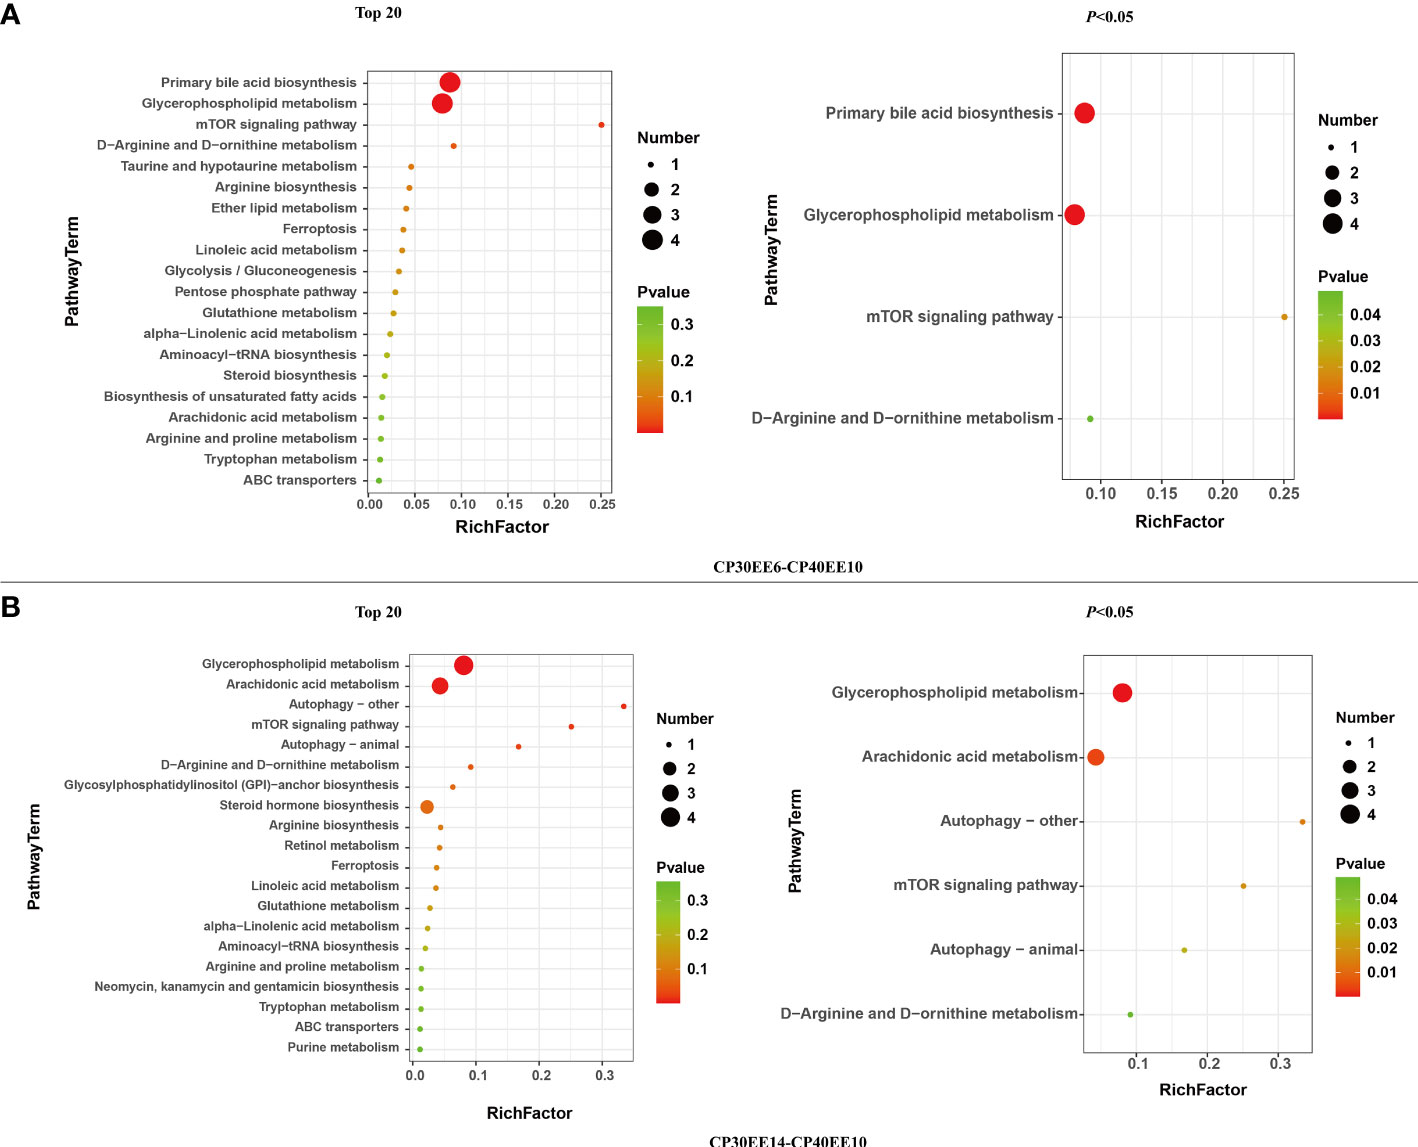
Figure 5 Metabolome view map of significant metabolic pathways. DEMs, differentially expressed metabolites; CP30EE6, 30% crude protein, 6% ether extract; CP30EE14, 30% crude protein, 14% ether extract; CP40EE10, 30% crude protein, 10% ether extract. The X-axis means rich factor. The Y-axis represents the KEGG pathway terms. The roundness color represents the p value. The roundness area represents the DEM number in this pathway. (A, B) represent differential metabolic pathway comparison between CP30EE6-CP40EE10 and CP30EE14-CP40EE10, respectively
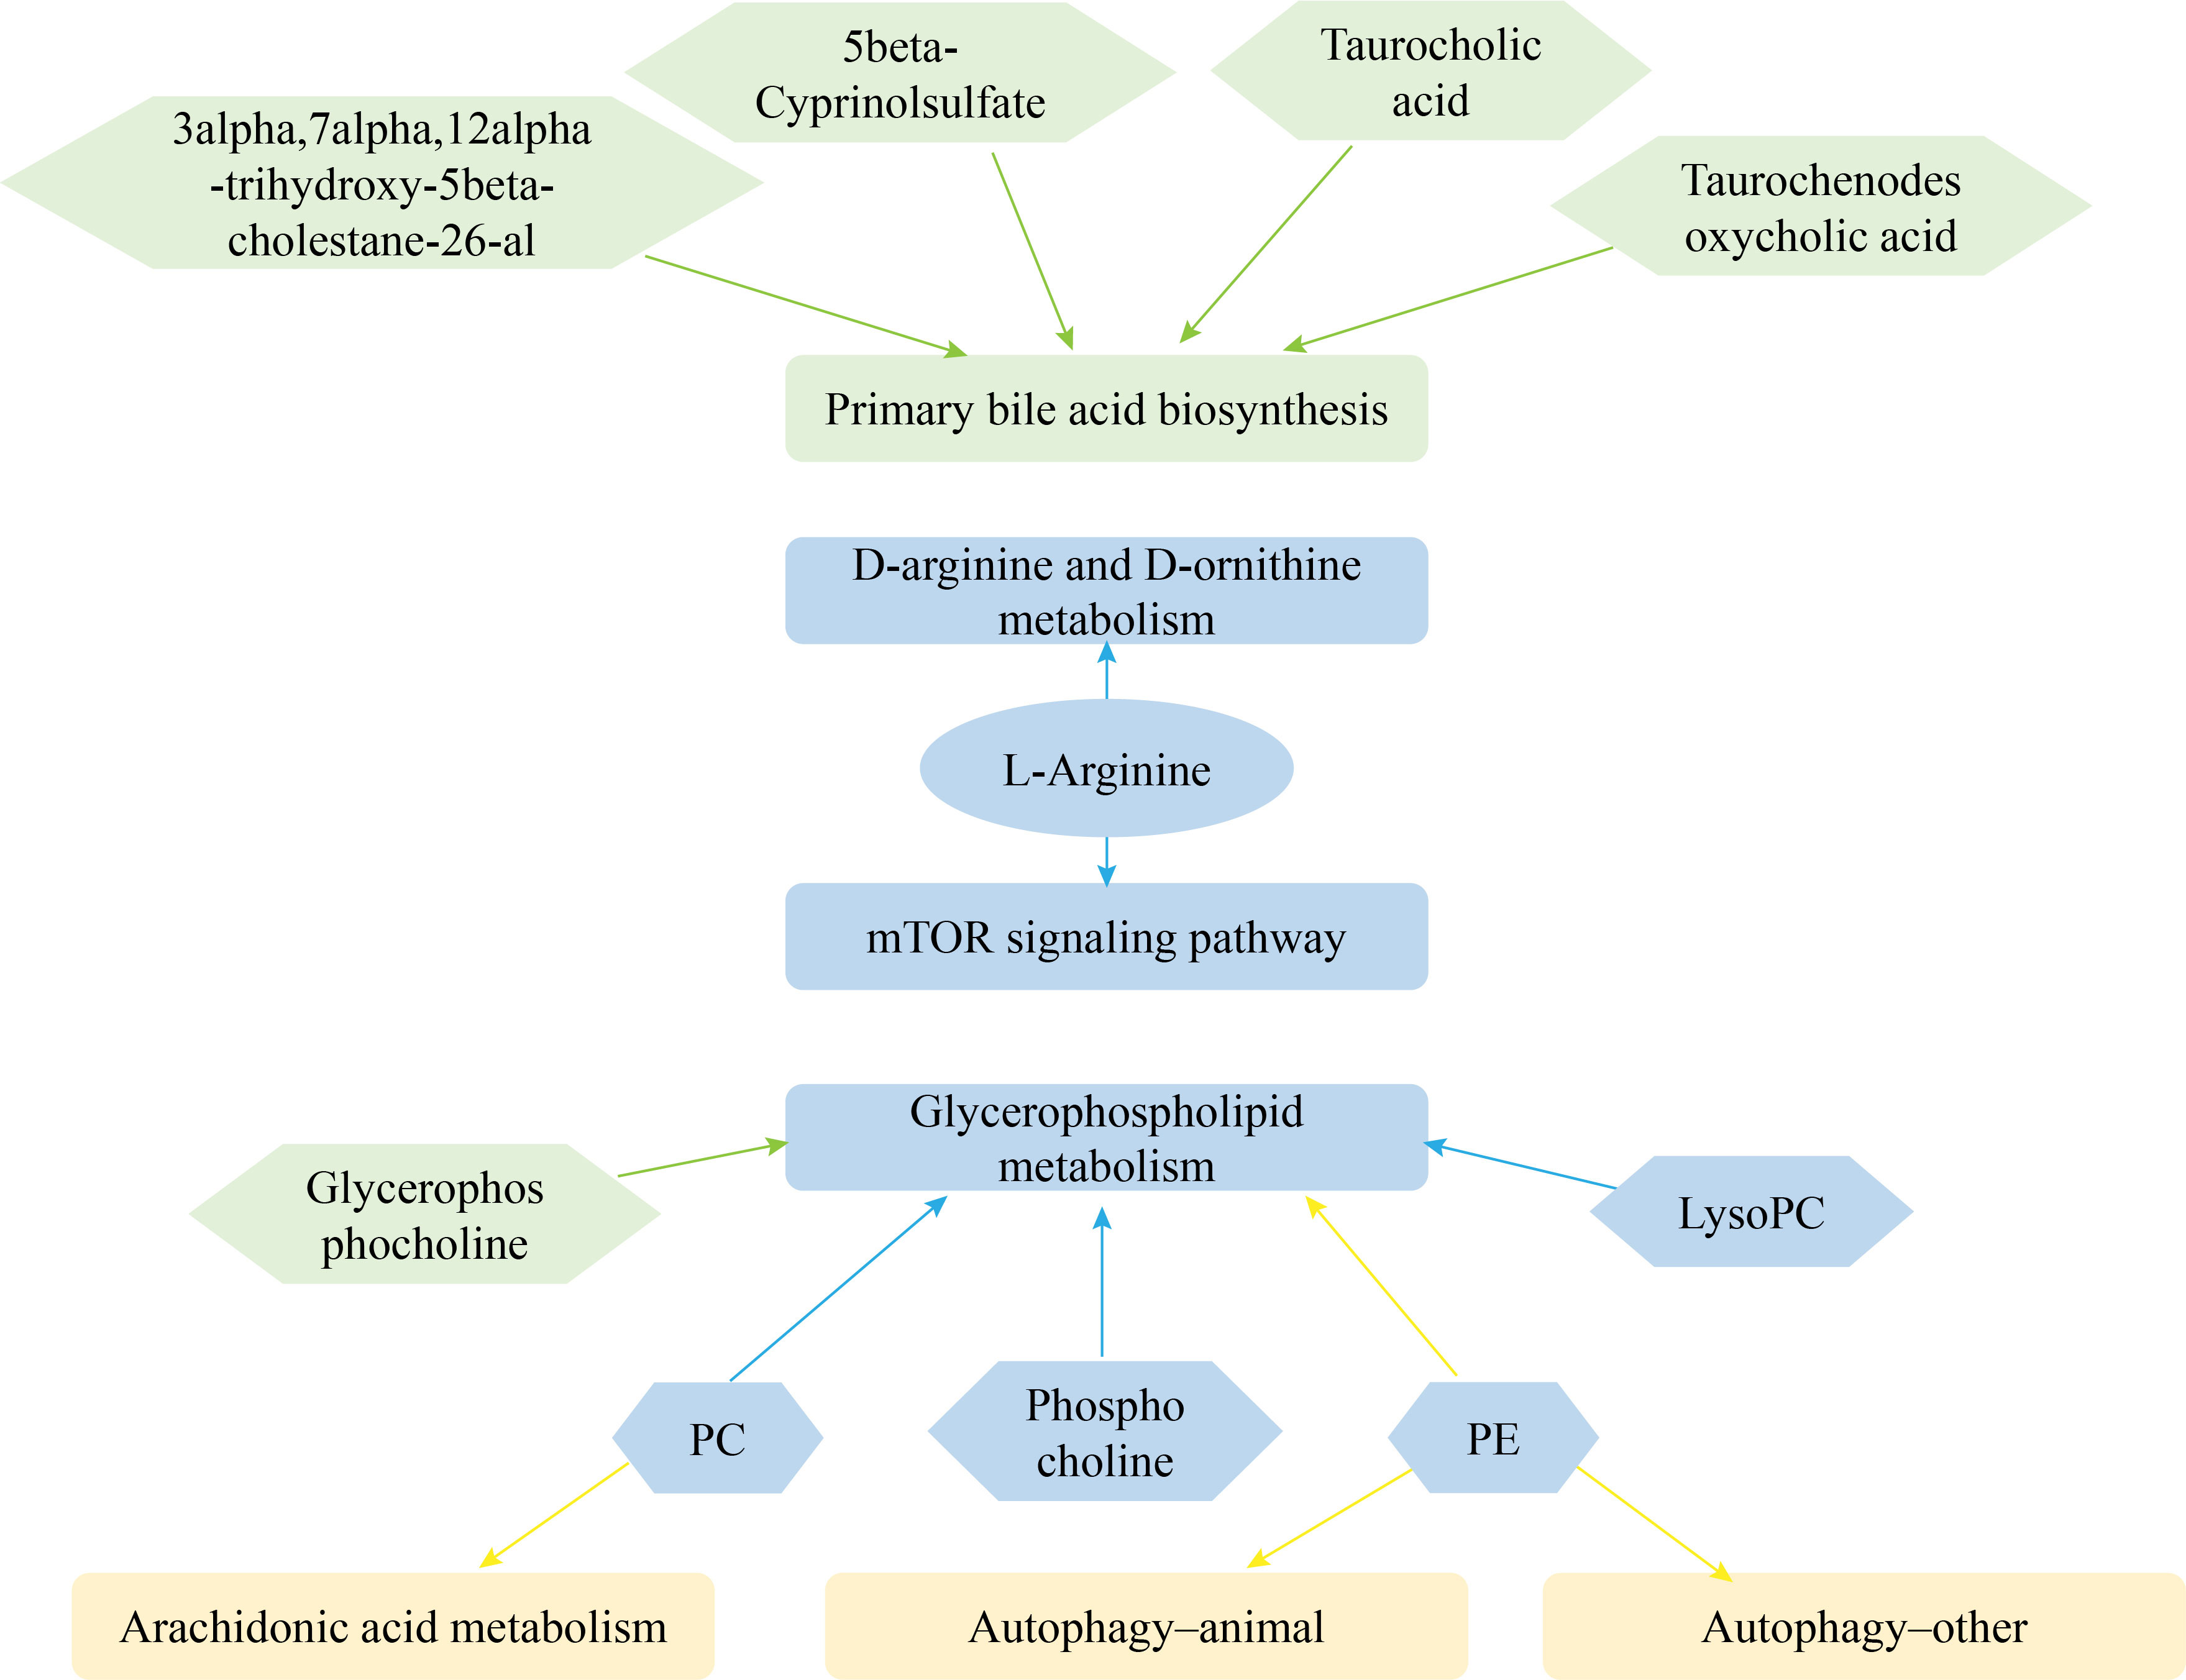
Figure 6 Network of metabolic pathways and key DEMs. Green represents DEMs and significantly enriched pathways in CP40EE10 vs CP30EE6 groups, yellow represents DEMs and significantly enriched pathways in CP40EE10 vs CP30EE14, and blue represents DEMs and significantly enriched pathways in common.
Performing RNA sequencing on RNA samples extracted from liver tissues of the CP30EE6, CP30EE14, and CP40EE10 groups, transcriptomic sequencing of 24 samples was completed in this analysis, and 83.82 G clean bases were obtained. The valid base amount of each sample ranged from 94.26% to 95.40%, the Q30 base ranged from 95.41% to 95.85%, and the average GC content was 46.44%. After filtering, 57,001 unigenes were assembled, with a total length of 62,346,987 bp and an average length of 1,093.79 bp (Supplementary Table S1). Sequences ranging from 301 to 400 bp in length were the most abundant, constituting 24.93% of the total sequences (Figure S1A).
Transcriptional integrity can be estimated from conserved genes in related species. The total number of genes in the selected BUSCO groups was 4584, and 63.1% of the genes were encoded as complete proteins. Among these genes, 58.3% were complete. Among single-copy BUSCOs, 4.8% of the genes were complete and duplicated BUSCOs, 9.3% were fragmented BUSCOs, and 27.6% were missing BUSCOs (Figure S1B). The data were stored in the NCBI Sequence Read Archive (SRA, http://www.ncbi.nlm.nih.gov/Traces/sra) with accession number SRP384751.
The assembled single genes were used as the database, and the expression abundance of single genes in each sample was determined by sequence similarity comparison. Bowtie2 was used to obtain the number of reads in each sample compared to single genes (Supplementary Table S2) and could represent the entire sequencing results, meeting the transcriptome data analysis requirements.
This study used P ≤ 0.05 and FC ≥ 2 as the thresholds for significant differences in gene expression. Differentially expressed genes (DEGs) in the livers of P. dabryanus from the CP30EE6, CP30EE14, and CP40EE10 groups were identified. This approach identified 2027 and 2055 DEGs in CP40EE10 vs. CP30EE6 and CP40EE10 vs. CP30EE14, respectively. We found that 850 DEGs were significantly downregulated, while 1177 DEGs were significantly upregulated in the CP40EE10 group compared to CP30EE6. Simultaneously, compared with the CP30EE14 group, the CP40EE10 group had 1400 significantly upregulated DEGs, and 655 downregulated DEGs (Figures 7, 8). Pathway analyses were conducted using the KEGG database to characterize the DEGs functionally. The CP30EE6 group had 180 downregulated DEGs distributed in 240 pathways compared with the CP40EE10 group. Among these pathways, 59 significantly enriched pathways were identified via KEGG pathway analysis (P< 0.05).
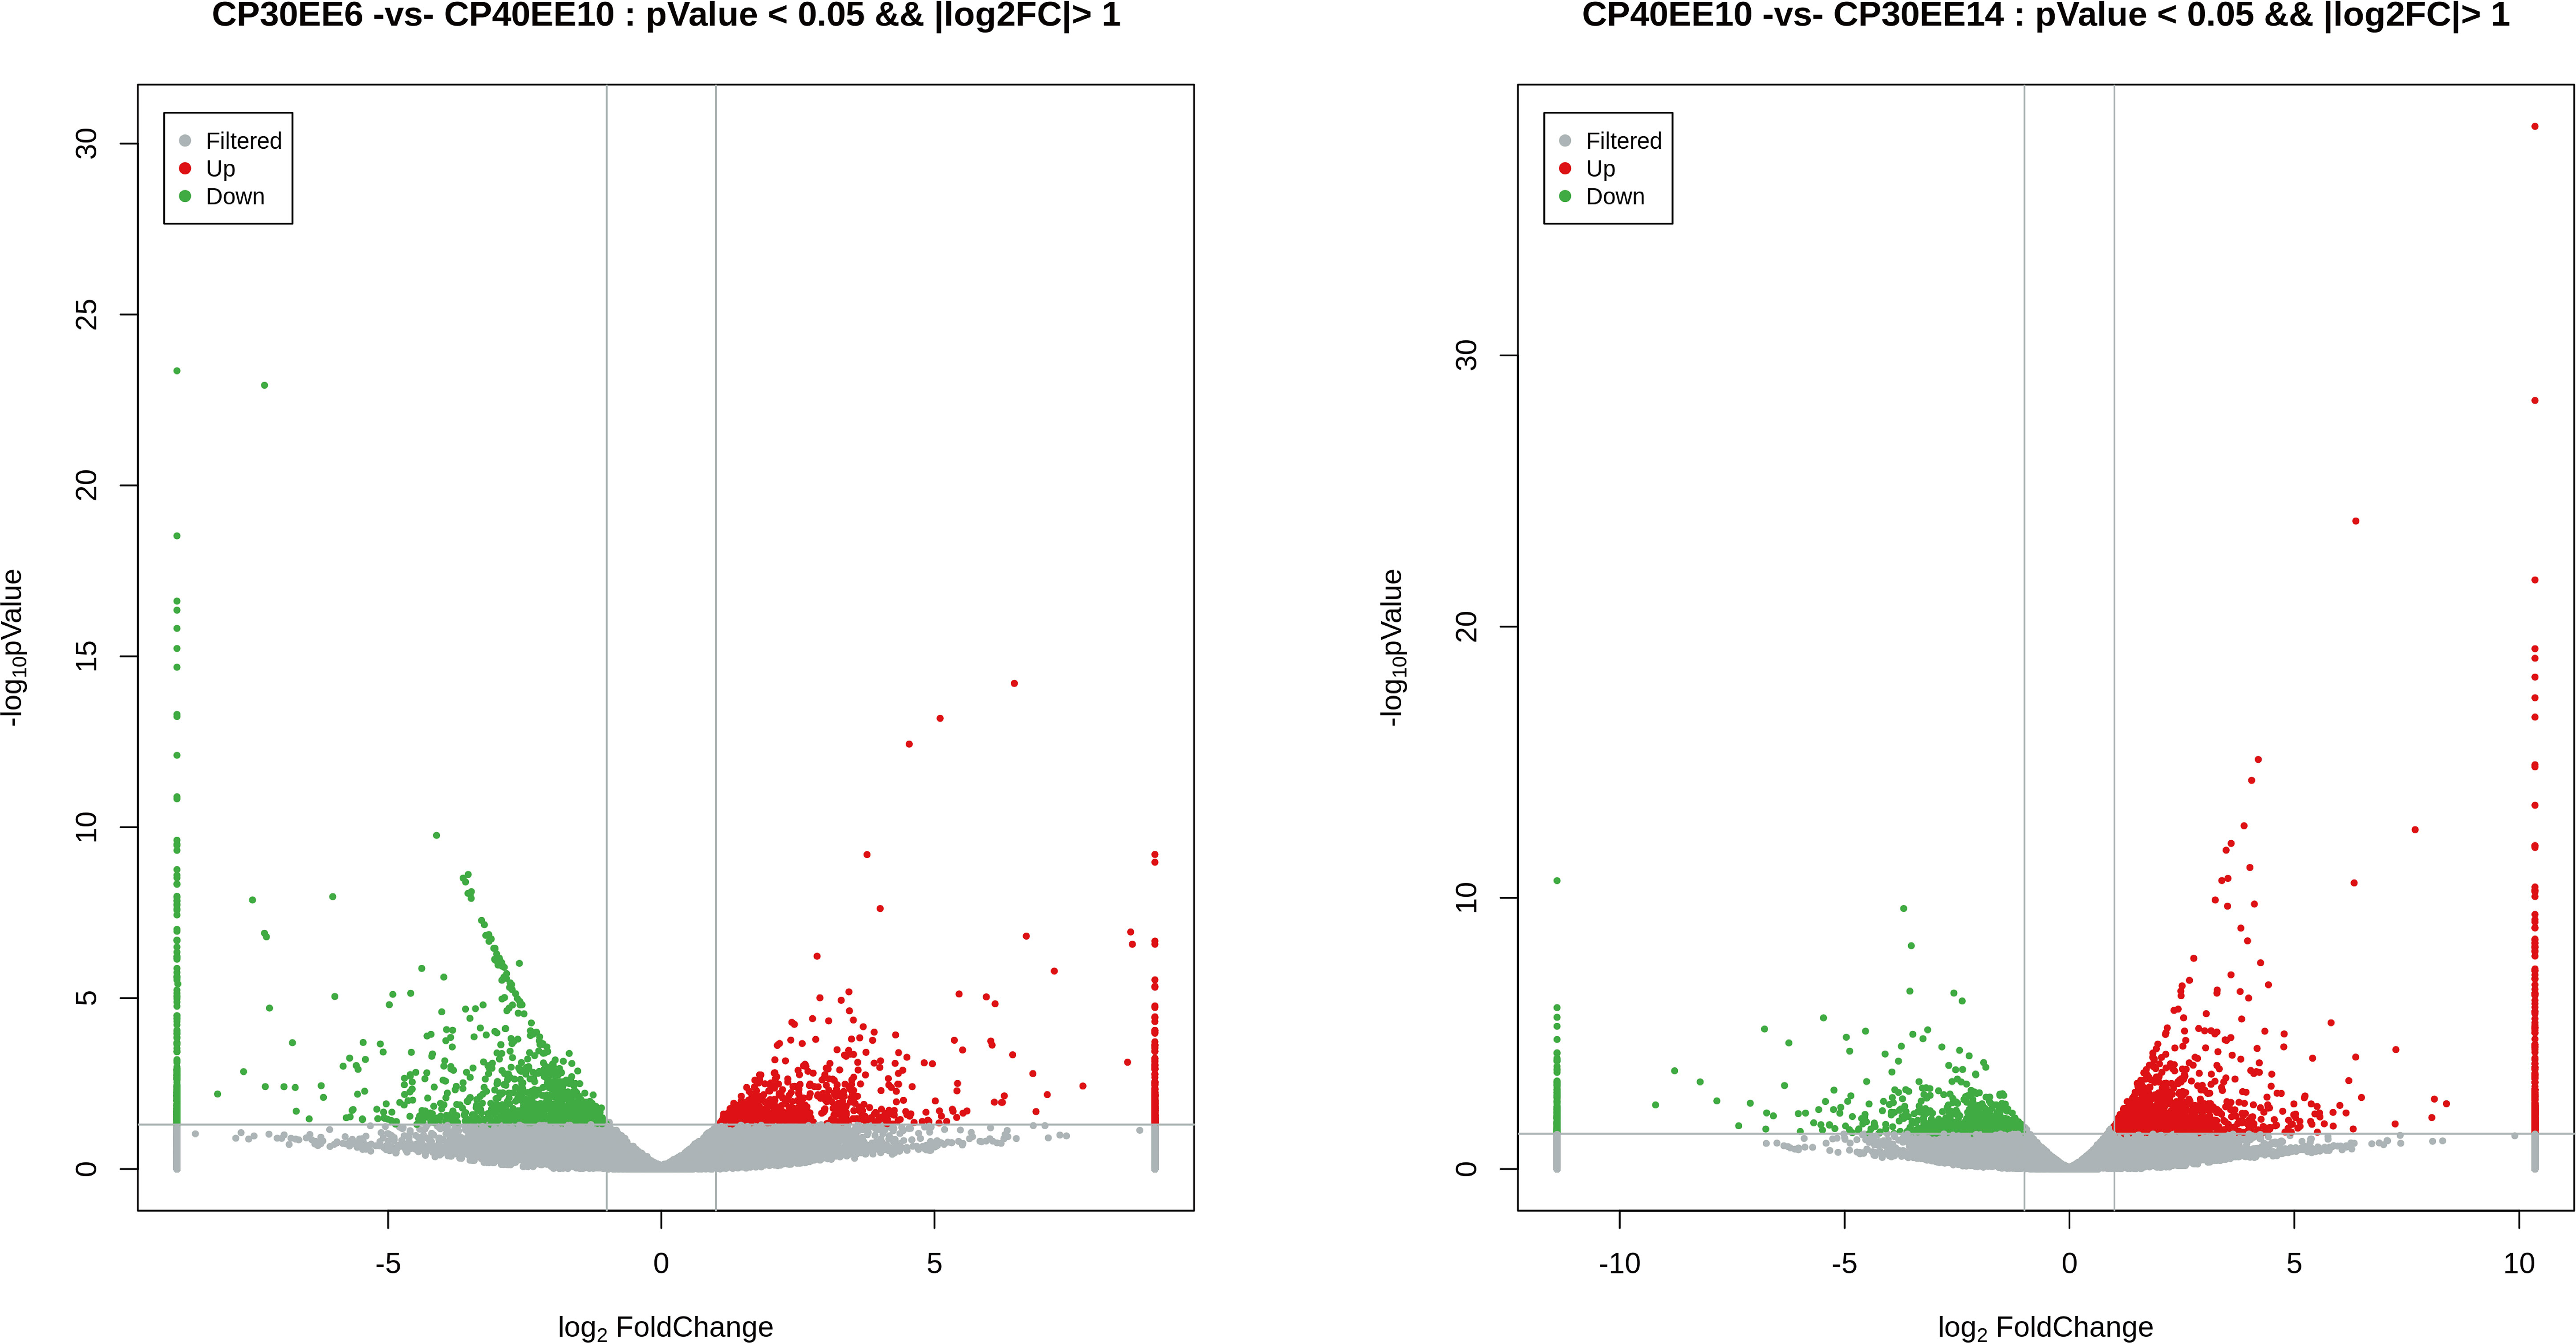
Figure 7 Volcanic plot of DEGs. DEGs, differentially expressed metabolites; CP30EE6, 30% crude protein, 6% ether extract; CP30EE14, 30% crude protein, 14% ether extract; CP40EE10, 30% crude protein, 10% ether extract.
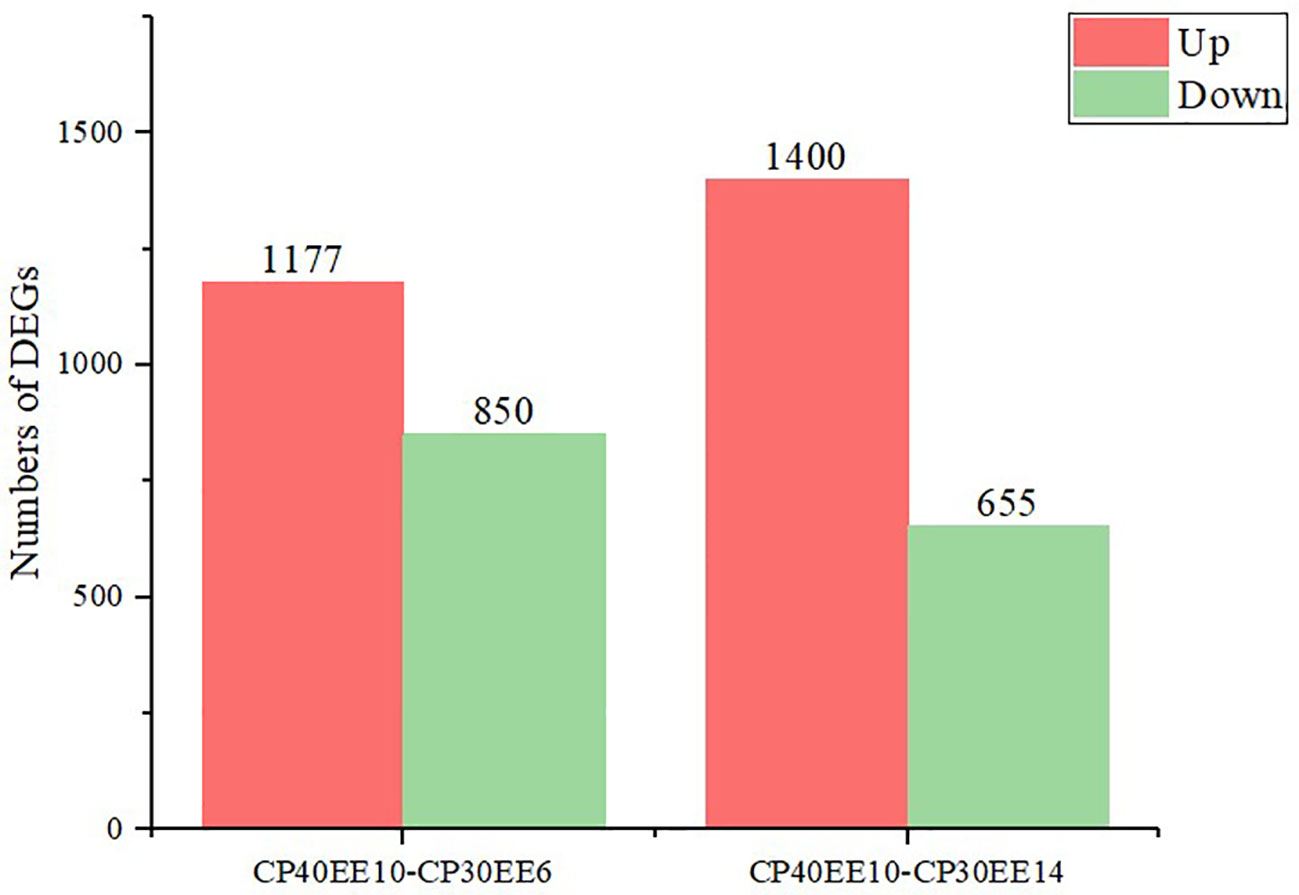
Figure 8 Statistics of DEGs in CP40EE10 vs CP30EE6 and CP40EE10 vs CP30EE14. DEGs, differentially expressed metabolites; CP30EE6, 30% crude protein, 6% ether extract; CP30EE14, 30% crude protein, 14% ether extract; CP40EE10, 30% crude protein, 10% ether extract.
The CP30EE14 group had 242 downregulated DEGs distributed in 253 pathways. Among these pathways, there were 69 significantly enriched pathways (P< 0.05). In the CP40EE10 vs. CP30EE6 comparison, the 20 high-ranking significant pathways included seven metabolism-related pathways, such as arginine and proline metabolism, linoleic acid metabolism, alpha-linolenic acid metabolism, arachidonic acid metabolism, pentose phosphate pathway, ether lipid metabolism, and glycolysis/gluconeogenesis. The remaining 13 pathways were linked to digestion, disease, and immunity. Among them, three apparent pathways were pancreatic secretion, protein or fat digestion, and absorption (P< 0.05). In the CP40EE10 vs. CP30EE14 comparison, the 20 high-ranking significant pathways included 16 metabolism pathways, such as phenylalanine metabolism, glycolysis/gluconeogenesis, phenylalanine, tyrosine, and tryptophan biosynthesis.
The PPAR signaling pathway and proximal tubule bicarbonate reclamation were enriched in the remaining four pathways (P< 0.05; Figure 9). PPAR contained all upregulated genes in seven metabolism-related pathways of the CP40EE10 vs. CP30EE6 comparison and 16 metabolism-related pathways of CP40EE10 vs. CP30EE14, as shown in Supplementary Table S3. Additionally, the main DEGs involved in glycolysis/gluconeogenesis and arginine and proline metabolism, such as proA/B (glutamate-5-semialdehyde dehydrogenase/glutamate 5-kinase), FBP (fructose-1,6-bisphosphatase), GAPDH (glyceraldehyde 3-phosphate dehydrogenase), ALDO (fructose-bisphosphate aldolase), and AMD1 (S-adenosylmethionine decarboxylase) in the CP40EE10 group, were higher than those in the CP30EE6 and CP30EE14 groups. The main metabolic pathways and key upregulated DEGs are shown in Figure 10.
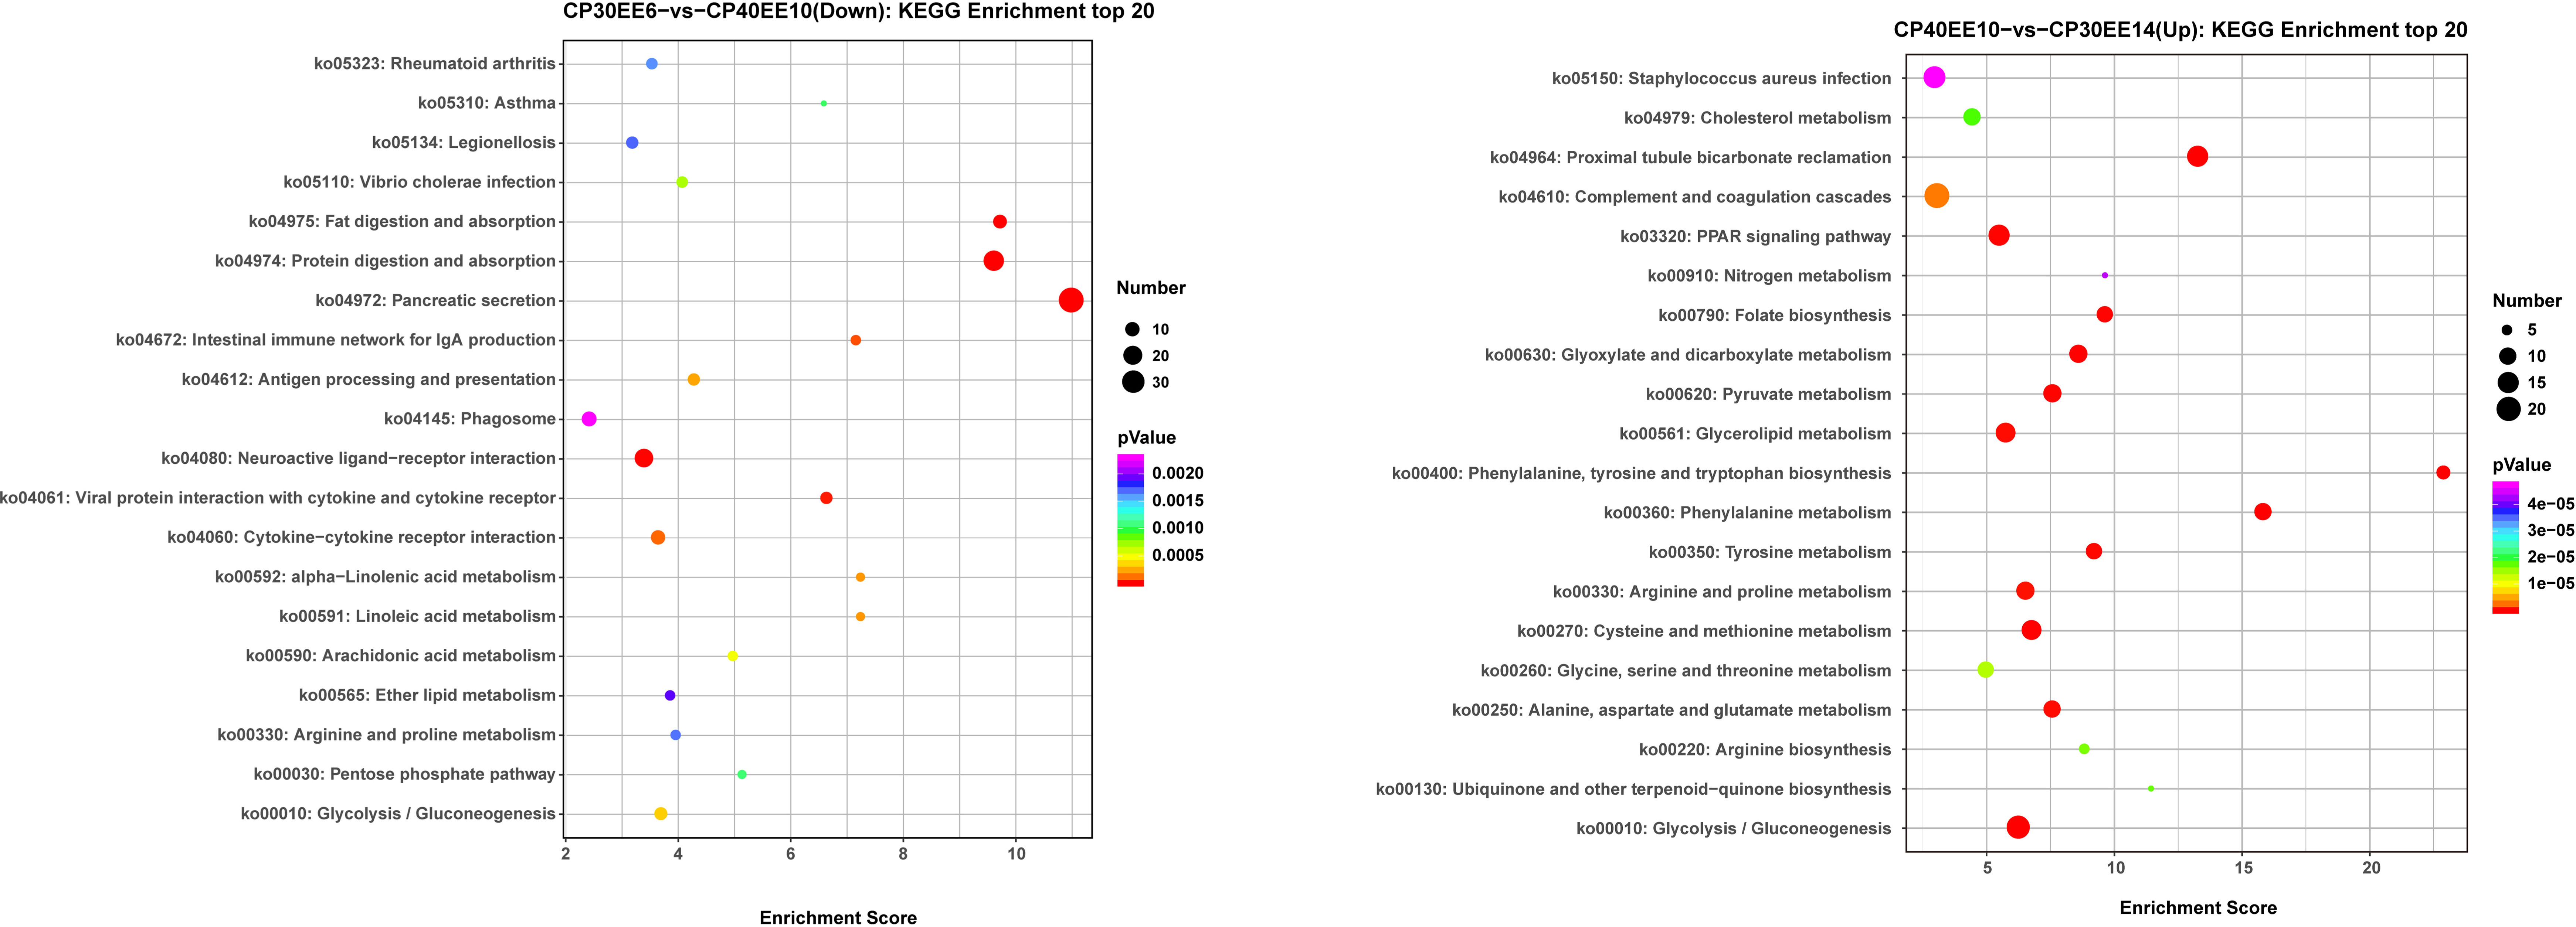
Figure 9 KEGG enrichment top 20 between CP30EE6, CP30EE14 and CP40EE10 groups. CP30EE6, 30% crude protein, 6% ether extract; CP30EE14, 30% crude protein, 14% ether extract; CP40EE10, 30% crude protein, 10% ether extract. The X-axis means rich factor. The Y-axis represents the KEGG pathway terms. The roundness color represents the p value. The roundness area represents the DEG number in this pathway.
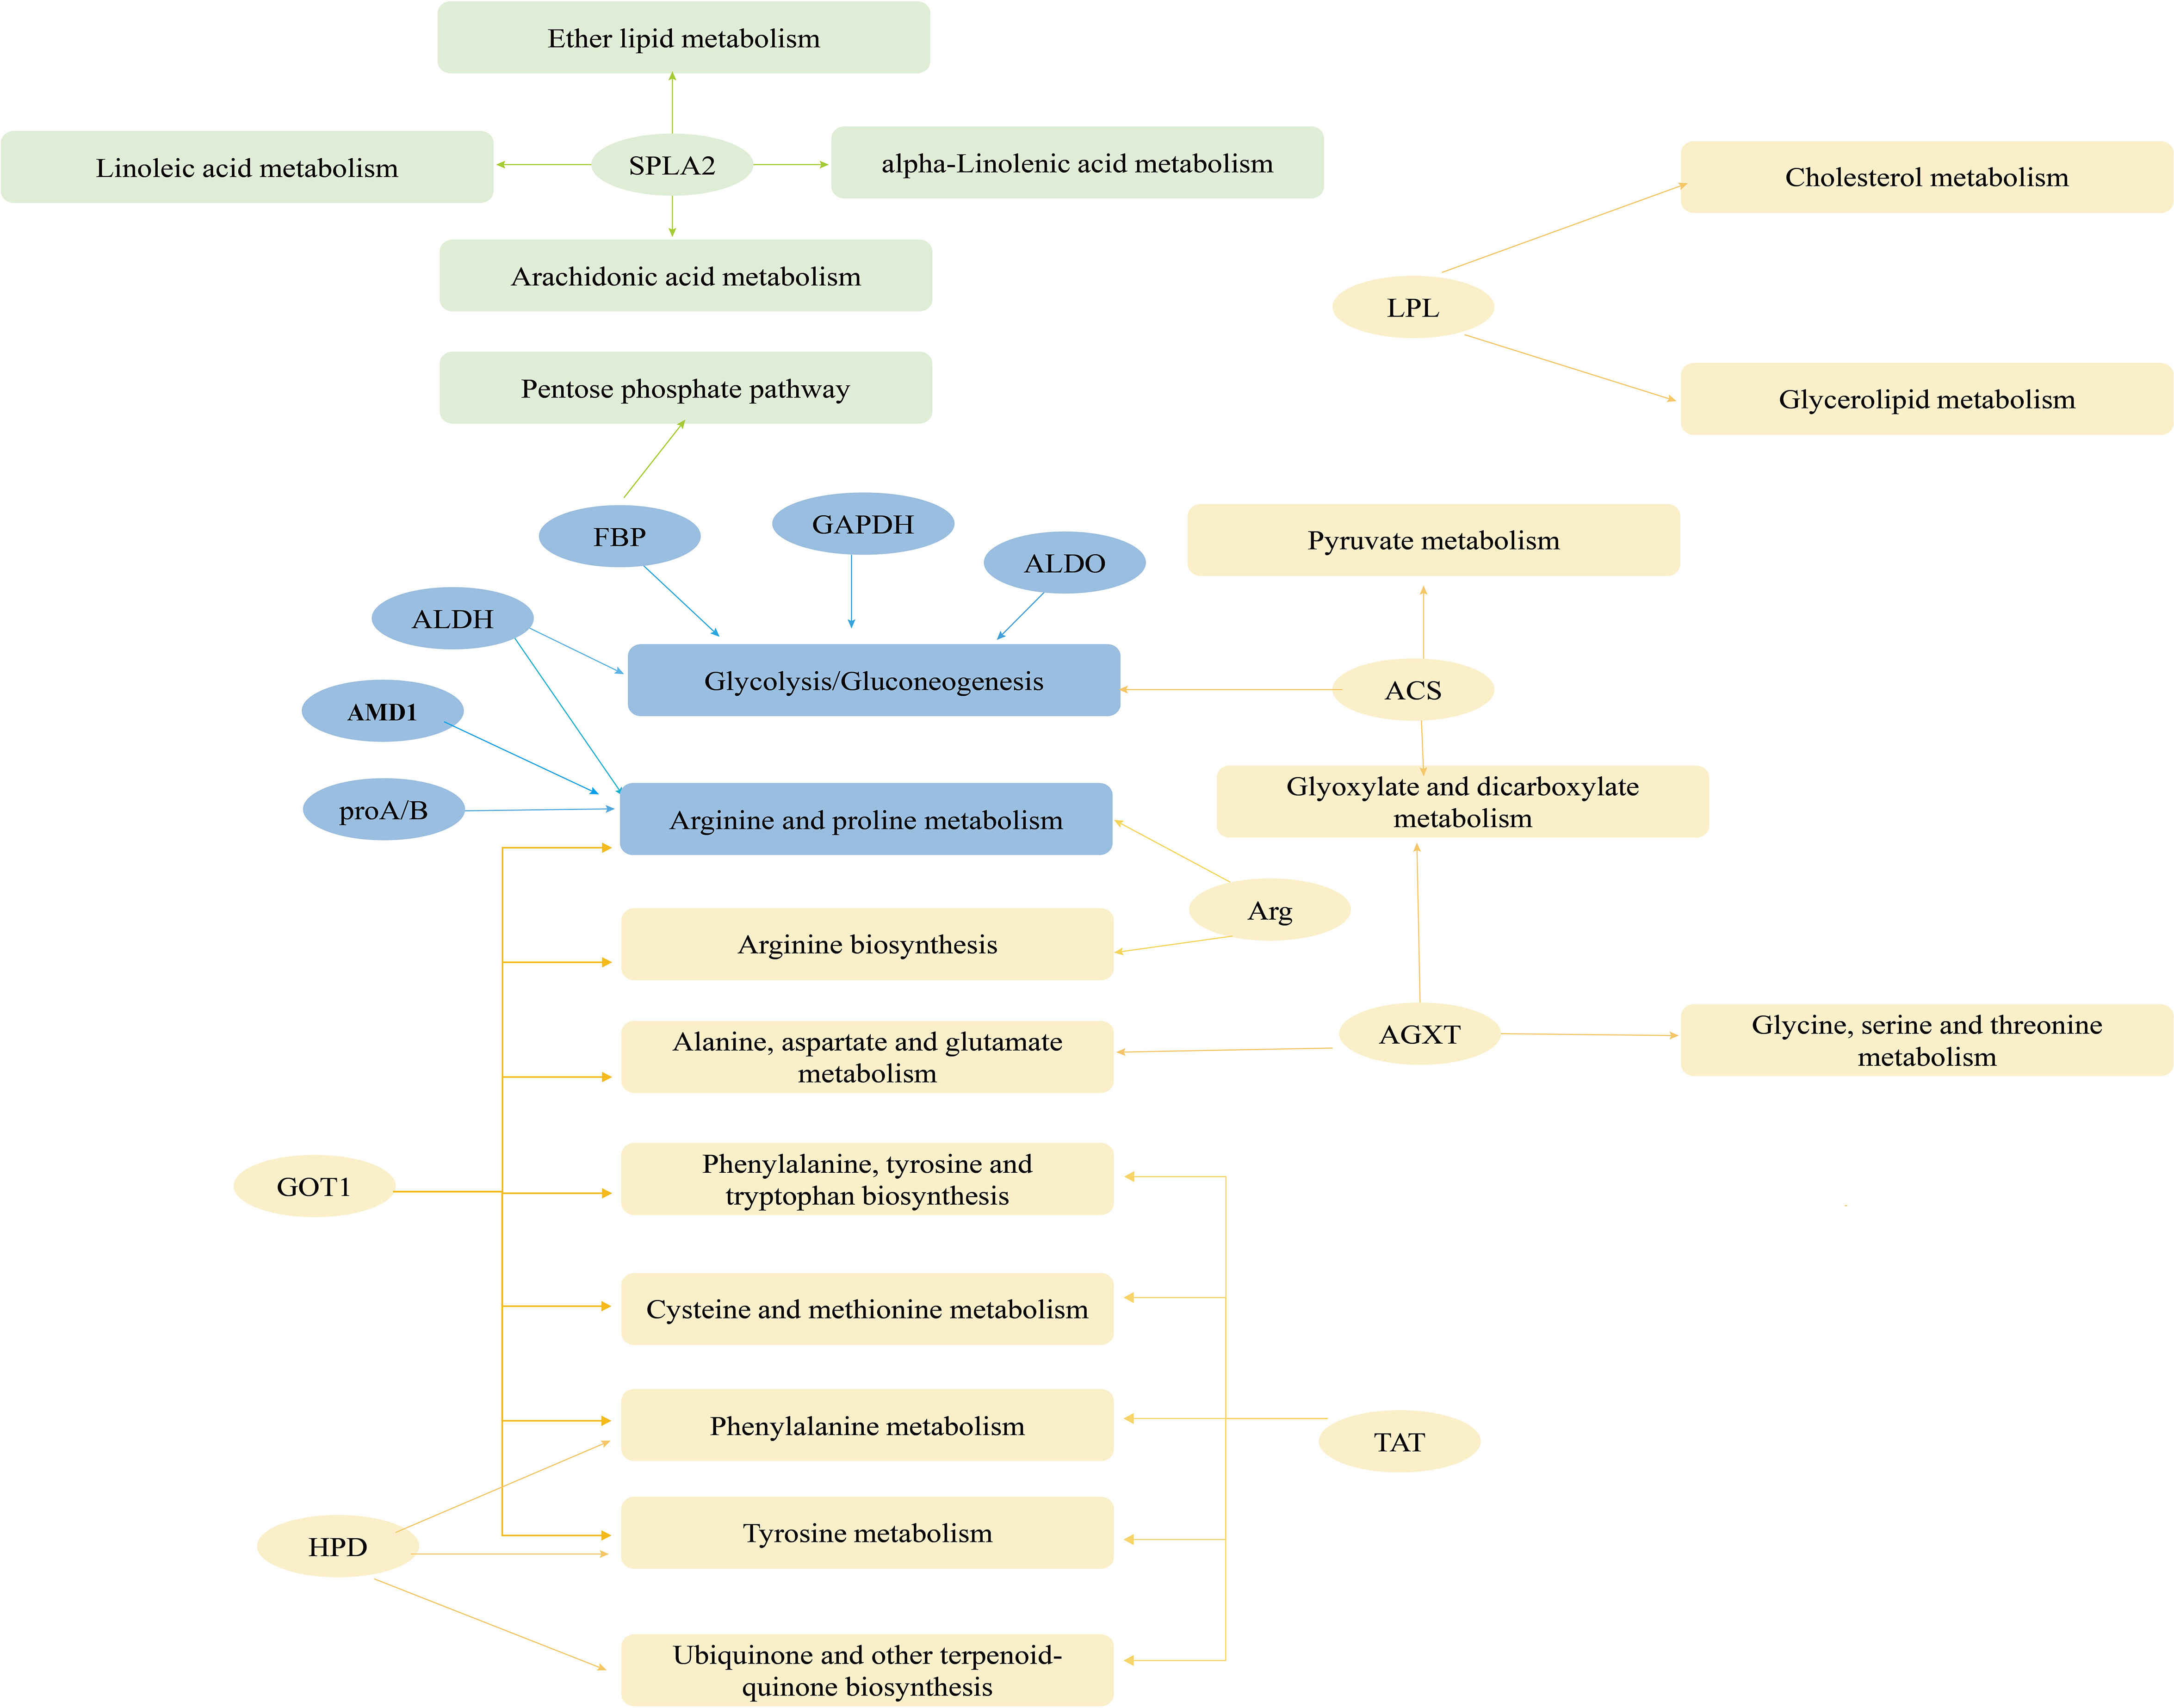
Figure 10 Network of metabolic pathways and key genes. Green represents DEGs and significantly enriched pathways in CP40EE10 vs CP30EE6 groups, yellow represents DEGs and significantly enriched pathways in CP40EE10 vs CP30EE14, and blue represents DEMs and significantly enriched pathways in common.
Additionally, the DEGs significantly decreased in pancreatic secretion, protein or fat digestion, and absorption pathways in the CP30EE6 group were amyA (alpha-amylase), PRSS1-2-3 (trypsin), LIPF (gastric triacylglycerol lipase), SPLA2 (secretory phospholipase A2), and NPC1L1 (Niemann-Pick C1-like protein 1). Additionally, the DEGs significantly decreased in the proximal tubule bicarbonate reclamation. The PPAR signaling pathway in the CP30EE14 group were PPARα (peroxisome proliferator-activated receptor alpha), gdhA (glutamate dehydrogenase (NAD(P)+), PCK (phosphoenolpyruvate carboxykinase (GTP), LPL (lipoprotein lipase), and ACS (acyl-CoA synthetase) (Supplementary Table S4).
The only significantly enriched metabolic pathway in the CP40EE10 vs. CP30EE6 comparison, in which DEMs and DEGs coexist, was glycerophospholipid metabolism (indicated by rounded green rectangles, P< 0.05). Only arachidonic acid metabolism and autophagy were significantly enriched pathways for DEM and DEG coexistence in the CP40EE10 vs. CP30EE14 comparison (indicated by rounded yellow rectangles, P< 0.05). Arachidonic acid, arginine and proline, and tryptophan metabolisms coexisted in the two comparison groups (indicated by rounded blue rectangles). Several critical metabolic pathways are shown in Figure 11. The metabolites and genes related to the amino acid, lipid, and carbohydrate metabolism in the serum and liver of P. dabryanus in the CP40EE10 group were significantly higher than those in the other two groups (P< 0.05).
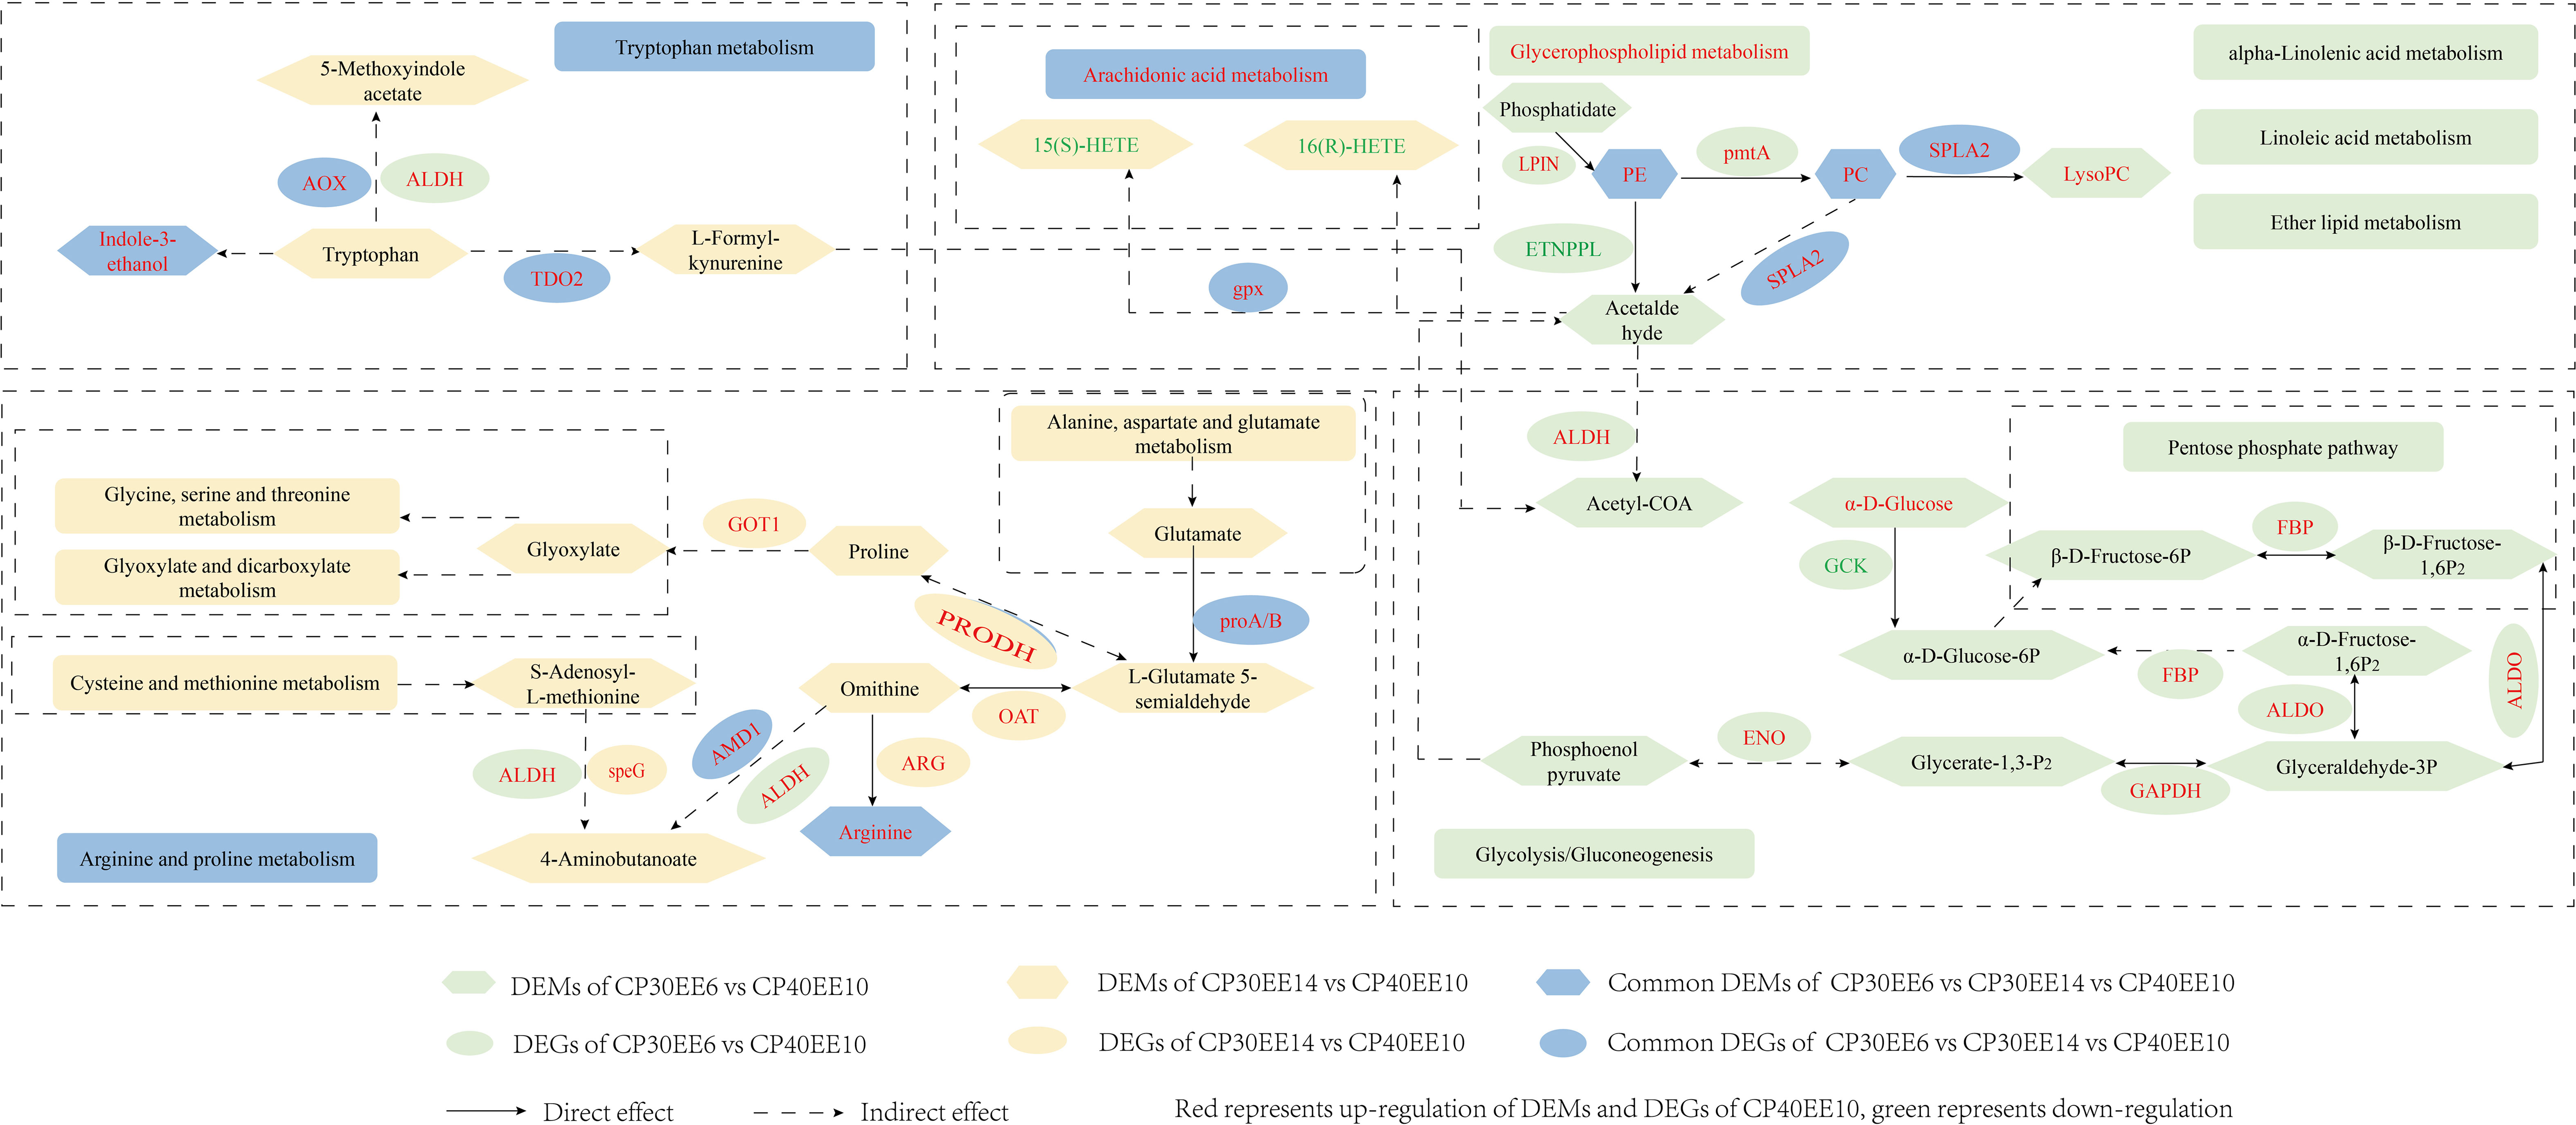
Figure 11 A metabolic network of DEMs and DEGs in KEGG pathways identified by multi-omics analysis between CP30EE6, CP30EE14 and CP40EE10 groups. DEMs, differentially expressed metabolites; DEGs, differentially expressed genes; CP30EE6, 30% crude protein, 6% ether extract; CP30EE14, 30% crude protein, 14% ether extract; CP40EE10, 30% crude protein, 10% ether extract.
Research on suitable feed formulations is essential for the aquaculture industry. Inappropriate protein and lipid levels lead to poor fish growth (13, 37–40). Therefore, by feeding diets with different dietary protein and lipid levels, exploring the mechanisms behind the differences in growth of P. dabryanus is critical to setting optimal nutrient requirements and achieving optimal aquaculture growth rates. In this study, P. dabryanus was fed a CP40EE10 diet (40% protein and 10% lipid) and reached the highest WGR and SGR. Hence, compared with other combinations, the CP40EE10 diet was the optimal dietary protein and lipid balance for P. dabryanus based on growth performance. LC-MS/MS-based metabolomic and RNA-seq-based transcriptomic analyses were performed to analyze the effects of dietary protein and lipids and explore the underlying mechanisms of the P. dabryanus fed with CP40EE10 (optimal diet), CP30EE6 (low-protein/low-lipid diet), and CP30EE14 (low-protein/high-lipid diet).
During the in-depth analysis of the DEGs, an essential functional gene, the arginase gene (ARG), was identified. ARG regulates L-arginine to produce ornithine and urea. Ornithine is a precursor of polyamines, a vital substance for regulating cell growth and promoting cell proliferation (41). As an intermediate of the urea cycle, L-arginine can alleviate ammonia poisoning with the urea cycle and avoid metabolic disorders caused by excess ammonia (42). Additionally, L-arginine can be used for ribosomal synthetic proteins (41, 43). On the other hand, studies have found that dietary protein content significantly affects amino acid metabolism (44). In this study, the expression level of ARG was significantly higher in the CP40EE10 group than in the other groups. Consistent with this, the level of L-arginine in the CP40EE10 group was significantly higher than that in the CP30EE6 and CP30EE14 groups. Therefore, high protein intake in the CP40EE10 group might promote amino acid metabolism, primarily through the arginine metabolism pathway, to promote P. dabryanus growth. This result could further support the optimal growth data.
Two other genes related to glucose metabolism have been paid attention to, namely fructose 1,6-bisphosphatase (FBP) and glyceraldehyde-3-phosphate dehydrogenase (GAPDH). Glucose, the primary energy substance of most cells, can provide energy for the body to maintain normal physiological activities through glycolysis/gluconeogenesis (16). FBP and GAPDH are essential regulators of glycolysis/gluconeogenesis, and their reduction affects energy production (45). Therefore, different gluconeogenic enzyme activities in animal tissues will lead to different growth rates, which should be the expected result. Likewise, animals fed optimal dietary proteins and lipids exhibit the high activity of enzymes related to glucose metabolism and considerable growth potential (46). In this study, the expression of genes related to glucose metabolism in the high-protein group (CP40EE10 group) was higher than in the low-protein groups (CP30EE6 and CP30EE14). This result was similar to results showing that liver gluconeogenic enzyme activity increased when rainbow trout were fed a high-protein diet (47). This can also support the result that the growth of P. dabryanus fed an optimal diet was better than that of a low-protein/low-lipid or low-protein/high-lipid diet. This result resembles that of the tilapia (Oreochromis niloticus) trial (16).
Lipids are essential macronutrients for regulating animal growth, reproduction, health, and body functions. It has been reported that glycerophosphocholine is reduced along with a decrease in compensatory liver ability (48). PC accounts for 40–50% of total cell phospholipids, and it can control lipid metabolism, mainly regulating lipid, lipoprotein, and whole-body energy metabolism (49, 50). LysoPC is an essential metabolite produced by many cells, widely distributed in various tissues. It can increase the penetration of ions in the membrane and change the mucosal barrier function (51, 52). The study found that LysoPC can promote growth and lower lipid accumulation in juvenile turbots (53). In mammals, the mTOR signaling pathway was found to play an essential role in regulating lipid metabolism gene expression. mTORC1 promotes lipid biosynthesis by being a sterol regulatory element binding protein (SREBP) (54), which is an essential class of transcription factors involved in lipid synthesis (55). mTORC1 also promotes PPARγ activity and adipogenesis (56) and regulates PPARα activity and hepatic ketogenesis (54).
In this study, the PC, LysoPC, glycerophosphocholine, phosphocholine, and PE expressions were significantly upregulated in the CP40EE10 group. Notably, the expression of these metabolite-regulating genes, such as SPLA2, ETNPPL, pmtA, and mTORC1, also increased in the CP40EE10 group. These results showed that the CP40EE10 group had better lipid metabolism ability. Similar results were observed in seabass, large yellow croakers, and grass carps (57–59). This indicates that appropriate dietary lipid levels facilitate lipid metabolism, thus promoting fish growth.
In addition to the above metabolic pathways with significant differences, there were other KEGG-enriched pathways with significant differences among the three groups. Compared with the CP30EE6 group, the protein or fat digestion and absorption, and pancreatic secretion in the CP40EE10 group were also significantly enriched, which was mainly due to the downregulated expression of amyA, SPLA2, CPA/B, LIPF, and other genes involved in the above pathways in the liver of the CP30EE6 group, indicating that low-protein/low-lipid diet could not provide enough protein and lipid to meet individual nutritional needs, resulting in slow growth. Compared with the CP30EE14 group, the PPAR signaling pathway was significantly enriched in the CP40EE10 group. PPARα, ME1, and LPL were all regulatory genes in this pathway. PPARα plays a vital role in fatty acid beta-oxidation, and the activation of the PPARα signaling pathway has a noticeable hypolipidemic effect (60). The ME1 protein is a part of the tricarboxylic acid shuttle and can be used in Fatty acid biosynthesis and many other metabolic processes (61). LPL is a rate-limiting enzyme that decomposes chylomicrons in circulating lipoprotein and significantly low-density lipoprotein triglycerides and releases FAs and glycerol (45, 57).
A high-fat diet provides more triglycerides, causing an increase in LPL enzyme activity and promoting lipolysis. From a nutritional point of view, it provides energy for the body and releases fatty acids to meet the fatty acid requirements of fish (37). In this study, the expression of LPL in the CP40EE10 group was higher than in the high-fat diet CP30EE14 group, which may be because its matched protein-to-lipid ratio can promote lipid metabolism and utilization. However, in the present study, the gene expression of PPARα, ME1, and LPL in the CP30EE14 group was significantly lower than that in the CP40EE10 group, indicating that P. dabryanus in the CP30EE14 group could not fully utilize dietary lipids, which may lead to impaired fat metabolism inhibiting fish growth.
In conclusion, the CP40EE10 (CP: 40%, EE: 10%) diet achieved the best growth performance of P. dabryanus in this study. Integrated metabolomic and transcriptomic analyses were applied to investigate the changes in metabolites and genes between the CP40EE10, CP30EE6, and CP30EE14 groups. Specific metabolic pathways were identified, and the loach individuals with fast growth presented active protein and lipid metabolisms, robust signal transduction systems. These characteristics may be essential for WGR in P. dabryanus. The results of this study enhance our understanding of the effects of dietary protein and lipid levels on the growth of P. dabryanus.
The data presented in the study are deposited in the NCBI Sequence Read Archive (SRA, http://www.ncbi.nlm.nih.gov/Traces/sra) repository, accession number SRP384751, Bioproject ID: PRJNA855358.
The animal study was reviewed and approved by China Law for Animal Health Protection and Instructions (Ethics approval No. SCXK (YU2005-0001)).
WZR: Visualization Preparation, Conceptualization, Methodology; LSY: Formal analysis, Data curation, Writing-Original draft preparation; ZQB: Conceptualization, Methodology, Review & Editing, Supervision; LYA: Formal analysis, Investigation, Resources; ZYZ, HHB and YCQ: Writing - Review & Editing Preparation. All authors contributed to the article and approved the submitted version.
This work was supported by National Natural Science Foundation of China, No.31860732, China Agriculture Research System of MOF and MARA (CARS-46).
The authors declare that the research was conducted in the absence of any commercial or financial relationships that could be construed as a potential conflict of interest.
All claims expressed in this article are solely those of the authors and do not necessarily represent those of their affiliated organizations, or those of the publisher, the editors and the reviewers. Any product that may be evaluated in this article, or claim that may be made by its manufacturer, is not guaranteed or endorsed by the publisher.
The Supplementary Material for this article can be found online at: https://www.frontiersin.org/articles/10.3389/fimmu.2023.1236812/full#supplementary-material
P. dabryanus, Paramisgurnus dabryanus; CP, Crude protein; EE, ether extract; WGR, Weight gain rate; SGR, Specific growth rate; PCA, Principal coordinates analysis; PLS-DA, Partial least squares discriminant analysis; VIP, Variable importance in the projection; FC, Fold change; DEM, Differentially expressed metabolite; DEG, Differentially expressed gene; KEGG, Kyoto Encyclopedia of Genes and Genomes.
1. Gao Y, He J, He ZL, Li ZW, Zhao B, Mu Y, et al. Effects of fulvic acid on growth performance and intestinal health of juvenile loach Paramisgurnus dabryanus (Sauvage). Fish Shellfish Immunol (2017) 62:47–56. doi: 10.1016/j.fsi.2017.01.008
2. Yan J, Li Y, Liang X, Zhang Y, Dawood MAO, Matuli'C D, et al. Effects of dietary protein and lipid levels on growth performance, fatty acid composition and antioxidant-related gene expressions in juvenile loach Misgurnus anguillicaudatus. Aquaculture Res (2017) 48(10):5385–93. doi: 10.1111/are.13352
3. Yang G, Cui XL, Liu S, Lu J, Hou XY, Meng WR, et al. Effects of dietary Lactobacillus helveticus on the growth rate, disease resistance and intestinal health of pond loach (Misgurnus anguillicaudatus). Aquaculture (2021) 544:737038. doi: 10.1016/j.aquaculture.2021.737038
4. Huang SQ, Cao XJ, Tian XC, Luo WW, Wang WM. Production of tetraploid gynogenetic loach using diploid eggs of natural tetraploid loach, Misgurnus anguillicaudatus, Fertilized with UV-Irradiated Sperm of Megalobrama amblycephala without treatments for chromosome doubling. Cytogenetic Genome Res (2016) 147(4):260–7. doi: 10.1159/000444384
5. Huang SQ, Zhang L, Cao XJ, Wang WM. Fertility and gamete ploidy of allopentaploid offspring of tetraploid dojo loach Misgurnus anguillicaudatus females and large-scale loach Paramisgurnus dabryanus males. Fisheries Sci (2020) 86(5):741–8. doi: 10.1007/s12562-020-01432-2
6. Chen J, Chen L. Effects of chitosan-supplemented diets on the growth performance, nonspecific immunity and health of loach fish (Misgurnus anguillicadatus). Carbohydr Polymers (2019) 225:115227. doi: 10.1016/j.carbpol.2019.115227
7. Zhao Y, Wang LK, Gao J. Effects of dietary highly unsaturated fatty acid levels on growth, fatty acid profiles, antioxidant activities, mucus immune responses and hepatic lipid metabolism related gene expressions in loach (Misgurnus anguillicaudatus) juveniles. Aquaculture Res (2019) 50(9):2486–95. doi: 10.1111/are.14202
8. Gao J, Koshio S, Wang WM, Li Y, Huang SQ, Cao XJ. Effects of dietary phospholipid levels on growth performance, fatty acid composition and antioxidant responses of Dojo loach Misgurnus anguillicaudatus larvae. Aquaculture (2014) 426-427:304–9. doi: 10.1016/j.aquaculture.2014.02.022
9. Welengane E, Sado RY, Bicudo Á.J.D.A. Protein-sparing effect by dietary lipid increase in juveniles of the hybrid fish tambatinga (♀Colossoma macropomum× ♂Piaractus brachypomus). Aquaculture Nutr (2019) 25(6):1272–80. doi: 10.1111/anu.12941
10. Liu H, Dong XH, Tan BP, Du T, Zhang S, Yang YZ, et al. Effects of dietary protein and lipid levels on growth, body composition, enzymes activity, expression of IGF-1 and TOR of juvenile northern whiting, Sillago sihama. Aquaculture (2021) 533:736166. doi: 10.1016/j.aquaculture.2020.736166
11. Rahimnejad S, Dabrowski K, Izquierdo M, Malinovskyi O, Kolářová J, Policar T. Effects of dietary protein and lipid levels on growth, body composition, blood biochemistry, antioxidant capacity and ammonia excretion of European grayling (Thymallus thymallus). Front Mar Sci (2021) 8:715636. doi: 10.3389/fmars.2021.715636
12. Sørensen M, Gong YY, Bjarnason F, Vasanth GK, Dahle D, Huntley M, et al. Nannochloropsis oceania-derived defatted meal as an alternative to fishmeal in Atlantic salmon feeds. PLoS One (2017) 12(7):e179907. doi: 10.1371/journal.pone.0179907
13. Yue HM, Huang XQ, Ruan R, Ye H, Li Z, Li CJ. Effects of dietary protein levels on the growth, body composition, serum biochemistry and digestive enzyme activity in Chinese rice field eel (Monopterus albus) fingerlings. Aquaculture Res (2019) 51(1):400–9. doi: 10.1111/are.14387
14. Ma BH, Wang LG, Lou B, Tan P, Xu DD, Chen RY. Dietary protein and lipid levels affect the growth performance, intestinal digestive enzyme activities and related genes expression of juvenile small yellow croaker (Larimichthys polyactis). Aquaculture Rep (2020) 17:100403. doi: 10.1016/j.aqrep.2020.100403
15. Mir IN, Srivastava PP, Bhat IA, Jaffar YD, Sushila N, Sardar P, et al. Optimal dietary lipid and protein level for growth and survival of catfish Clarias magur larvae. Aquaculture (2020) 520:734678. doi: 10.1016/j.aquaculture.2019.734678
16. Yang CG, Jiang M, Lu X, Wen H. Effects of dietary protein level on the gut microbiome and nutrient metabolism in tilapia (Oreochromis niloticus). Animals (2021) 11(4):1024. doi: 10.3390/ani11041024
17. Beale DJ, Karpe AV, Ahmed W. Beyond Metabolomics: A Review of Multi-Omics-Based Approaches. Cham: Springer International Publishing (2016) p. 289–312. doi: 10.1007/978-3-319-46326-1_10.
18. Ebrahim A, Brunk E, Tan J, O'Brien EJ, Kim D, Szubin R, et al. Multi-omic data integration enables discovery of hidden biological regularities. Nat Commun (2016) 7(1):13091. doi: 10.1038/ncomms13091
19. Wang JG, Hou X, Chen XW, Zhang KJ, Wang J, Wang CH. Comprehensive analysis of metabolomics and transcriptomics provides insights into growth difference of juvenile Eriocheir sinensis during the molting cycle. Aquaculture (2021) 539:736661. doi: 10.1016/j.aquaculture.2021.736661
20. Yan JW, Risacher SL, Shen L, Saykin AJ. Network approaches to systems biology analysis of complex disease: integrative methods for multi-omics data. Briefings Bioinf (2017) 19(6):1370–1381. doi: 10.1093/bib/bbx066
21. Huang S, Wang J, Yue WC, Chen J, Gaughan S, Lu WQ, et al. Transcriptomic variation of hepatopancreas reveals the energy metabolism and biological processes associated with molting in Chinese mitten crab, Eriocheir sinensis. Sci Rep (2015) 5(1):14015. doi: 10.1038/srep14015
22. Chen XW, Wang J, Yue WC, Liu JS, Wang CH. Hepatopancreas transcriptome analysis of Chinese mitten crab (Eriocheir sinensis) with white hepatopancreas syndrome. Fish Shellfish Immunol (2017) 70:302–7. doi: 10.1016/j.fsi.2017.08.031
23. Chen JJ, Zhang DF, Tan QS, Zhou H, Yao JP. Growth performance, intestinal morphology, hepatopancreatic antioxidant capacity and growth-related gene mRNA expressions of juvenile grass carp (Ctenopharyngodon idellus) as affected by graded levels of dietary arginine. Aquaculture Nutr (2019) 25:1124–34. doi: 10.1111/anu.12928
24. Jiang WW, Tian XL, Fang ZH, Li L, Dong SL, Li HD, et al. Metabolic responses in the gills of tongue sole (Cynoglossus semilaevis) exposed to salinity stress using NMR-based metabolomics. Sci Total Environ (2019) 653:465–74. doi: 10.1016/j.scitotenv.2018.10.404
25. Yang CY, Hao RJ, Du XD, Wang QH, Deng YW, Sun RJ. Response to different dietary carbohydrate and protein levels of pearl oysters (Pinctada fucata martensii) as revealed by GC–TOF/MS-based metabolomics. Sci Total Environ (2019) 650:2614–23. doi: 10.1016/j.scitotenv.2018.10.023
26. Hao RJ, Du XD, Yang CY, Deng YW, Zheng Z, Wang QH. Integrated application of transcriptomics and metabolomics provides insights into unsynchronized growth in pearl oyster Pinctada fucata martensii. Sci Total Environ (2019) 666:46–56. doi: 10.1016/j.scitotenv.2019.02.221
27. Victor H, Zhao B, Mu Y, Dai XX, Wen ZS, Gao Y, et al. Effects of Se-chitosan on the growth performance and intestinal health of the loach Paramisgurnus dabryanus (Sauvage). Aquaculture (2019) 498:263–70. doi: 10.1016/j.aquaculture.2018.08.067
28. Chen XM, Gao CS, Du XY, Yao JM, He FF, Niu XT, et al. Effects of dietary astaxanthin on the growth, innate immunity and antioxidant defense system of Paramisgurnus dabryanus. Aquaculture Nutr (2020) 26(5):1453–62. doi: 10.1111/anu.13093
29. Du ZJ, Luo W, Liu Y, Xu HM, Wu JY, Wang TZ, et al. The dietary zinc requirement of a benthic fish Paramisgurnus dabryanus. Aquaculture Res (2020) 51(4):1346–52. doi: 10.1111/are.14462
30. Leng XQ, Zhou H, Tan QS, Du H, Wu JP, Liang XF, et al. Integrated metabolomic and transcriptomic analyses suggest that high dietary lipid levels facilitate ovary development through the enhanced arachidonic acid metabolism, cholesterol biosynthesis and steroid hormone synthesis in Chinese sturgeon (Acipenser sinensis). Br J Nutr (2019) 122(11):1230–41. doi: 10.1017/S0007114519002010
31. Grabherr MG, Haas BJ, Yassour M, Levin JZ, Thompson DA, Amit I, et al. Full-length transcriptome assembly from RNA-Seq data without a reference genome. Nat Biotechnol (2011) 29(7):644–52. doi: 10.1038/nbt.1883
32. Li WZ, Jaroszewski L, Godzik A. Clustering of highly homologous sequences to reduce the size of large protein databases. Bioinformatics (2001) 17(3):282–3. doi: 10.1093/bioinformatics/17.3.282
33. Simão FA, Waterhouse RM, Ioannidis P, Kriventseva EV, Zdobnov EM. BUSCO: Assessing genome assembly and annotation completeness with single-copy orthologs. Bioinf (Oxford England) (2015) 31(19):3210–2. doi: 10.1093/bioinformatics/btv351
34. Buchfink BJ, Xie C, Huson DH. Fast and sensitive protein alignment using DIAMOND. Nat Methods (2015) 12:59–60. doi: 10.1038/nmeth.3176
35. Mistry J, Finn RD, Eddy SR, Bateman A, Punta M. Challenges in homology search: HMMER3 and convergent evolution of coiled-coil regions. Nucleic Acids Res (2013) 41(12):e121. doi: 10.1093/nar/gkt263
36. Langmead B, Salzberg SL. Fast gapped-read alignment with Bowtie 2. Nat Methods (2012) 9(4):357–9. doi: 10.1038/nmeth.1923
37. Zhang J, Zhao NN, Sharawy Z, Li Y, Ma J, Lou YN. Effects of dietary lipid and protein levels on growth and physiological metabolism of Pelteobagrus fulvidraco larvae under recirculating aquaculture system (RAS). Aquaculture (2018) 495:458–64. doi: 10.1016/j.aquaculture.2018.06.004
38. Su H, Han T, Li XY, Zheng PQ, Wang YB, Wang JT. Dietary protein requirement of juvenile kelp grouper (Epinephelus moara). Aquaculture Res (2019) 50(12):3783–92. doi: 10.1111/are.14341
39. Lu X, Peng D, Chen XR, Wu F, Jiang M, Tian J, et al. Effects of dietary protein levels on growth, muscle composition, digestive enzymes activities, hemolymph biochemical indices and ovary development of pre-adult red swamp crayfish (Procambarus clarkii). Aquaculture Rep (2020) 18:100542. doi: 10.1016/j.aqrep.2020.100542
40. Xun PW, Lin HZ, Wang RX, Yu W, Zhou CP, Tan X, et al. Effects of dietary lipid levels on growth performance, plasma biochemistry, lipid metabolism and intestinal microbiota of juvenile golden pompano (Trachinotus ovatus). Aquaculture Nutr (2021) 27(5):1683–98. doi: 10.1111/anu.13307
41. Huang JQ, Zhong RZ, Yang CY, Wang QH, Liao YS, Deng YW. Dietary carbohydrate and protein levels affect the growth performance of juvenile peanut worm (Sipunculus nudus): an LC–MS-based metabolomics study. Front Mar Sci (2021) 8:702101. doi: 10.3389/fmars.2021.702101
42. Clark TC, Tinsley J, Sigholt T, Macqueen DJ, Martin SAM. Supplementation of arginine, ornithine and citrulline in rainbow trout (Oncorhynchus mykiss): Effects on growth, amino acid levels in plasma and gene expression responses in liver tissue. Comparative biochemistry and physiology. Part A Mol Integr Physiol (2020) 241:110632. doi: 10.1016/j.cbpa.2019.110632
43. Smith TF, Hartman H. The evolution of Class II Aminoacyl-tRNA synthetases and the first code. FEBS Lett (2015) 589(23):3499–507. doi: 10.1016/j.febslet.2015.10.006
44. Cai LS, Wang L, Song K, Lu KL, Zhang CX, Rahimnejad S. Evaluation of protein requirement of spotted seabass (Lateolabrax maculatus) under two temperatures, and the liver transcriptome response to thermal stress. Aquaculture (2020) 516:734615. doi: 10.1016/j.aquaculture.2019.734615
45. Li SB, Yang ZG, Tian HY, Ren SJ, Zhang WX, Wang AM. Effects of dietary carbohydrate-to-lipid ratios on growth performance, intestinal digestion, lipid and carbohydrate metabolism of red swamp crayfish (Procambarus clarkii). Aquaculture Rep (2022) 24:101117. doi: 10.1016/j.aqrep.2022.101117
46. Sagar V, Sahu NP, Pal AK, Hassaan M, Jain KK, Salim HS, et al. Effect of different stock types and dietary protein levels on key enzyme activities of glycolysis-gluconeogenesis, the pentose phosphate pathway and amino acid metabolism in Macrobrachium rosenbergii. J Appl Ichthyology (2019) 35(4):1016–1024. doi: 10.1111/jai.13931
47. Lupianez JA, Sanchez-Lozano MJ, Garcia-Rejon L, de la Higuera M. Long-term effect of a high-protein/non-carbohydrate- diet on the primary liver and kidney metabolism in rainbow trout (Salmogairdneri). Aquaculture (1989) 79:91–101. doi: 10.1016/0044-8486(89)90449-3
48. Ye Q, Yin W, Zhang L, Xiao H, Qi Y, Liu S, et al. The value of grip test, lysophosphatidlycholines, glycerophosphocholine, ornithine, glucuronic acid decrement in assessment of nutritional and metabolic characteristics in hepatitis B cirrhosis. PLoS One (2017) 12(4):e175165. doi: 10.1371/journal.pone.0175165
49. Xu J, Tang LY, Zhang Q, Wei JY, Xian MH, Zhao Y, et al. Relative quantification of neuronal polar lipids by UPLC-MS reveals the brain protection mechanism of Danhong injection. RSC Adv (2017) 7(72):45746–56. doi: 10.1039/C7RA09245H
50. Lin ZD, Wang XD, Bu XY, Jia YY, Shi QC, Du ZY, et al. Dietary phosphatidylcholine affects growth performance, antioxidant capacity and lipid metabolism of Chinese mitten crab (Eriocheir sinensis). Aquaculture (2021) 541:736814. doi: 10.1016/j.aquaculture.2021.736814
51. Knuplez E, Marsche G. An updated review of pro- and anti-inflammatory properties of plasma lysophosphatidylcholines in the vascular system. Int J Mol Sci (2020) 21(12):4501. doi: 10.3390/ijms21124501
52. Nutautaite M, Raceviciute-Stupeliene A, Andalibizadeh L, Sasyte V, Bliznikas S, Pockevicius A, et al. Improving broiler chickens' health by using lecithin and lysophosphatidylcholine emulsifiers: a comparative analysis of physiological indicators. Iranian J Veterinary Res (2021) 22(1):33–9. doi: 10.22099/ijvr.2021.37028.5411
53. Xu HG, Luo X, Bi QZ, Wang ZD, Meng XX, Liu JS, et al. Effects of dietary lysophosphatidylcholine on growth performance and lipid metabolism of juvenile turbot. Aquaculture Nutr (2022) 2022:1–12. doi: 10.1155/2022/3515101
54. Laplante M, Sabatini DM. Regulation of mTORC1 and its impact on gene expression at a glance. J Cell Sci (2013) 126(8):1713–9. doi: 10.1242/jcs.125773
55. Horton JD, Goldstein JL, Brown MS. SREBPs: activators of the complete program of cholesterol and fatty acid synthesis in the liver. J Clin Invest (2002) 109(9):1125–31. doi: 10.1172/JCI15593
56. Rosen ED, MacDougald OA. Adipocyte differentiation from the inside out. Nature reviews. Mol Cell Biol (2006) 7(12):885–96. doi: 10.1038/nrm2066
57. Yan J, Liao K, Wang T, Mai K, Xu W, Ai Q. Dietary lipid levels influence lipid deposition in the liver of large yellow croaker (Larimichthys crocea) by regulating lipoprotein receptors, fatty acid uptake and triacylglycerol synthesis and catabolism at the transcriptional level. PLoS One (2015) 10:e129937. doi: 10.1371/journal.pone.0129937
58. Li AX, Yuan XC, Liang XF, Liu LW, Li J, Li B, et al. Adaptations of lipid metabolism and food intake in response to low and high fat diets in juvenile grass carp (Ctenopharyngodon idellus). Aquaculture (2016) 457:43–9. doi: 10.1016/j.aquaculture.2016.01.014
59. Xie SW, Lin YY, Wu T, Tian LX, Liang JJ, Tan BP. Dietary lipid levels affected growth performance, lipid accumulation, inflammatory response and apoptosis of japanese seabass (Lateolabraxjaponicus). Aquaculture Nutr (2021) 27(3):807–16. doi: 10.1111/anu.13225
60. Chen ZZ, Xing Y, Fan X, Liu TJ, Zhao MM, Liu L, et al. Fasting and refeeding affect the goose liver transcriptome mainly through the PPAR signaling pathway. J Poultry Sci (2021) 58:245–57. doi: 10.2141/jpsa.0200095
Keywords: Paramisgurnus dabryanus, growth performance, protein, lipid, omics
Citation: Wang Z-R, Li S-Y, Zhang Y-Z, Li Y-A, Huo H-H, Yu C-Q and Zhou Q-B (2023) Metabolomic and transcriptomic profiling reveals the effect of dietary protein and lipid levels on growth performance in loach (Paramisgurnus dabryanus). Front. Immunol. 14:1236812. doi: 10.3389/fimmu.2023.1236812
Received: 08 June 2023; Accepted: 17 July 2023;
Published: 01 August 2023.
Edited by:
Saima Kausar, Southwest University, ChinaReviewed by:
Kai Zhang, Chinese Academy of Fishery Sciences, ChinaCopyright © 2023 Wang, Li, Zhang, Li, Huo, Yu and Zhou. This is an open-access article distributed under the terms of the Creative Commons Attribution License (CC BY). The use, distribution or reproduction in other forums is permitted, provided the original author(s) and the copyright owner(s) are credited and that the original publication in this journal is cited, in accordance with accepted academic practice. No use, distribution or reproduction is permitted which does not comply with these terms.
*Correspondence: Qiu-Bai Zhou, emhvdXFpdWJhaUAxNjMuY29t
†These authors have contributed equally to this work and share first authorship
Disclaimer: All claims expressed in this article are solely those of the authors and do not necessarily represent those of their affiliated organizations, or those of the publisher, the editors and the reviewers. Any product that may be evaluated in this article or claim that may be made by its manufacturer is not guaranteed or endorsed by the publisher.
Research integrity at Frontiers
Learn more about the work of our research integrity team to safeguard the quality of each article we publish.