
94% of researchers rate our articles as excellent or good
Learn more about the work of our research integrity team to safeguard the quality of each article we publish.
Find out more
ORIGINAL RESEARCH article
Front. Immunol., 12 October 2023
Sec. Cancer Immunity and Immunotherapy
Volume 14 - 2023 | https://doi.org/10.3389/fimmu.2023.1236806
This article is part of the Research TopicNovel Biomarkers in Tumor Immunity and ImmunotherapyView all 49 articles
 Jinfeng Zhu1,2
 Qitong Chen1,2Liyun Zeng1,2Hongyu Gao1,2Tong Wu1,2Yeqing He1,2Jiachi Xu1,2Jian Pang1,2Jing Peng1,2Yueqiong Deng1,2
 Yi Han1,2
 Wenjun Yi1,2*
Background: Origin recognition complex 6 (ORC6) is one of the six highly conserved subunit proteins required for DNA replication and is essential for maintaining genome stability during cell division. Recent research shows that ORC6 regulates the advancement of multiple cancers; however, it remains unclear what regulatory impact it has on the tumor immune microenvironment.
Methods: Unpaired Wilcoxon rank sum and signed rank tests were used to analyze the differences in the expression of ORC6 in normal tissues and corresponding tumor tissues. Multiple online databases have evaluated the genetic alterations, protein expression and localization, and clinical relevance of ORC6. To evaluate the potential prognostic impact and diagnostic significance of ORC6 expression, we carried out log-rank, univariate Cox regression, and receiver operating characteristic curve analysis. The ICGC-LIRI-JP cohort, CGGA-301 cohort, CGGA-325 cohort, CGGA-693 cohort, and GSE13041 cohort were used for external validation of the study findings. The associations between ORC6 expression and immune cell infiltration, immune checkpoint expression, and immunotherapy cohorts was further analyzed. To explore the functional and signaling pathways related to ORC6 expression, gene set enrichment analysis was performed. To clarify the expression and function of ORC6 in hepatocellular carcinoma (LIHC) and glioma, we conducted in vitro experiments.
Results: Expression of ORC6 is upregulated in the majority of cancer types and is associated with poor patient prognosis, notably in cases of LIHC and gliomas. In addition, ORC6 may be involved in multiple signaling pathways related to cancer progression and immune regulation. High expression of ORC6 correlates with an immunosuppressive state in the tumor microenvironment. The results of further immunotherapy cohort analysis suggested that patients in the ORC6 high-expression group benefited from immunotherapy. Inhibiting ORC6 expression suppressed the proliferative and migratory abilities of LIHC and glioma cells.
Conclusion: High expression of ORC6 may be used as a biomarker to predict the poor prognosis of most tumor patients. The high expression of ORC6 may be involved in the regulation of the tumor immunosuppressive environment, and it is expected to become a molecular target for inhibiting tumor progression.
Worldwide, cancer presents a life-threatening situation and is one of the most economically burdensome diseases (1). Currently, no treatment for cancer is absolutely effective. As research advances, scientists are increasingly concentrating on the shared characteristics of different malignant tumors to uncover their underlying causes and create targeted inhibitors for cancer therapy (2). For instance, PD-L1 levels are often increased in different cancer types, and recent studies indicate that many oncogenic signaling pathways lead to this overexpression. Antagonistic antibodies against the inhibitory immune checkpoint receptor PD-1 or its ligand PD-L1 have shown promise in the treatment of various cancers, leading to significant improvement in patient survival rates (3). Protein tyrosine kinases from the human epidermal growth factor receptor family, such as EGFR and HER2, are important therapeutic targets for many malignancies, including non-small cell lung cancer, breast cancer, and gastroesophageal cancer, particularly colorectal cancer (4). Aldehyde dehydrogenase (ALDH) serves as a cancer stem cell biomarker across various cancers. Clinically, ALDHs are also regarded as indicators of poor prognosis in solid cancers. Targeting ALDHs may impede cancer stem cells in solid tumors, thereby achieving therapeutic effects (5). Therefore, analyzing the differential expression of genes across cancers, screening valuable genes, and exploring their correlation with clinical prognosis and the tumor immune microenvironment will promote the further development of tumor-targeted therapy and immunotherapy.
The origin recognition complex (ORC) is a vital six-subunit protein that is highly conserved across species and plays a crucial role in DNA replication. It is essential for maintaining genome stability during cell division (6). ORC6, the smallest subunit of human ORC, is primarily involved in chromosome segregation, DNA replication, and cell division. It localizes to replication forks to carry out these functions (7). ORC6 is a cofactor in the mismatch repair (MMR) complex that promotes efficient mismatch repair (8). In recent years, research has identified a correlation between elevated ORC6 expression and adverse prognostic outcomes in patients with colorectal cancer (9), renal clear cell carcinoma (10), gastric adenocarcinoma (11), and breast cancer (12). Current research on ORC6 in tumors is restricted to specific types of human cancers. There has been no systematic multi-omics analysis across different types of cancer, notably in liver hepatocellular carcinoma (LIHC) and glioma (GBMLGG).
The research found that ORC6 was frequently overexpressed in various cancer types and was associated with adverse survival outcomes. Additionally, the biological function of ORC6 may be linked to RNA modifications, DNA methylation, and the tumor immune microenvironment. By examining ORC6 across cancers, we observed that it significantly contributes to the development of LIHC and GBMLGG. Our study reveals that ORC6 acts as an independent risk factor for the overall prognosis of LIHC and GBMLGG. Subsequently, we conducted in vitro experiments to elucidate whether ORC6 promotes the progression of LIHC and GBMLGG. Together, our investigation provides a comprehensive understanding of the tumorigenic role of ORC6 in different cancers and indicates that ORC6 could be a dependable biomarker for predicting the clinical prognoses and immune landscapes in patients with LIHC and GBMLGG.
We obtained a unified and standardized pan-cancer dataset (TCGA TARGET GTEx, https://xenabrowser.net/) from the UCSC database. Furthermore, we extracted the ORC6 gene values from each sample and applied log2 (x+1) transformation for each value. The Sangerbox (13) online tool was used for visualization. In addition, we acquired validation cohorts from external sources, including the International Cancer Genome Consortium (ICGC), Chinese Glioma Genome Atlas Project (CGGA), and Gene Expression Omnibus (GEO) databases. These cohorts included the ICGC-LIRI-JP cohort, CGGA-301 cohort, CGGA-325 cohort, CGGA-693 cohort, and GSE13041 cohort. Cancer-type abbreviations are listed in Table 1.
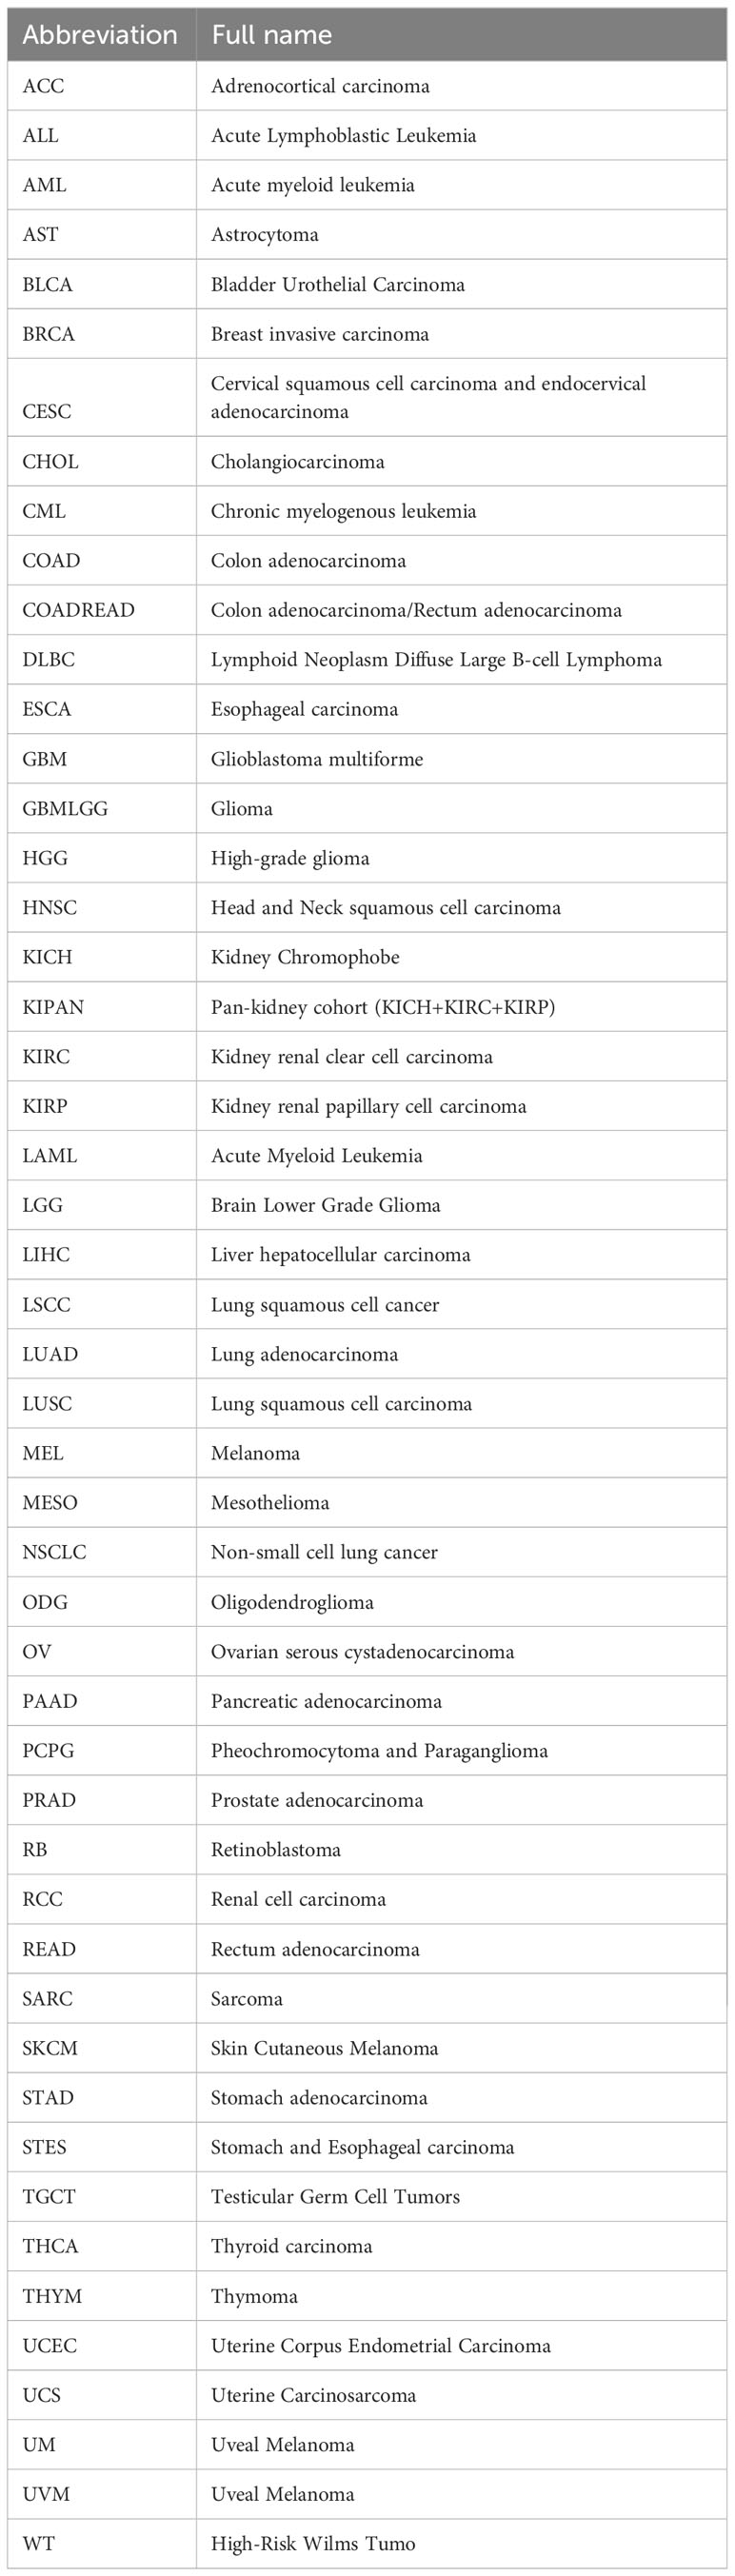
Table 1 Tumor types and abbreviations.
The gene mutation type and frequency of ORC6 in the TCGA pan-cancer dataset were explored by accessing cBioPortal (https://www.cbioportal.org/). We obtained the copy number variation (CNV) dataset at gene level 4 from all TCGA samples processed by GISTIC software (14) through GDC (https://portal.gdc.cancer.gov/). We used the unpaired Wilcoxon rank sum test or the Wilcoxon signed rank test to compare the values between the two groups and the Kruskal–Wallis test for differences among multiple groups.
The Human Protein Atlas (HPA, https://www.proteinatlas.org/) was utilized to obtain images of the subcellular localization of ORC6 protein in cancer cells (HEK293 and PC-3) by immunofluorescence staining of cells. Furthermore, the subcellular localization of the ORC6 gene was obtained through the Genecards database.
The comPPI website (http://comppi.linkgroup.hu/) was utilized to analyze the protein-protein interaction network of ORC6. The minimum interaction score was 1, and the edge width was scaled based on the interaction score.
The correlation of ORC6 expression with clinical features was assessed by Spearman correlation analysis. We performed univariate Cox regression analysis to investigate the prognostic significance of ORC6 expression in predicting the disease-free interval (DFI), progression-free interval (PFI), overall survival (OS), and disease-specific survival (DSS) in pan-cancer cohorts. We then utilized forest plots for a graphical representation of these results.
TCGA data were curated to extract ORC6 expression levels in transcripts per million (TPM) format, followed by data normalization using log2(TPM+1). Survival data of matched samples were integrated and subsequently subjected to optimal grouping truncation using the ‘surv_cutpoint’ function from the ‘survminer’ package. The aim was to distinguish between the high and low ORC6 expression groups. Prognostic differences between the high- and low-expression groups were evaluated using the log-rank test. RNA-seq data in TPM format from TCGA and GTEx were uniformly processed through the Toil pipeline, as sourced from UCSC XENA (https://xenabrowser.net/datapages/). ORC6 expression levels corresponding to TCGA cancer samples and GTEx normal tissue samples for each cancer type were extracted. The data were normalized using Log2(TPM+1). To assess the diagnostic accuracy for tumor detection, we employed the ‘pROC’ package to calculate sensitivity and specificity. Diagnostic value was quantified by the area under the curve (AUC), with a value of 1.0 indicating perfect diagnostics and 0.5 representing no diagnostic value. An AUC greater than 0.85 was considered to possess a high diagnostic value.
The correlation of ORC6 expression with DNA promoter methylation levels in cancer was explored by UALCAN(https://ualcan.path.uab.edu/) (15). The correlation of ORC6 expression with marker gene expression associated with three classes of RNA modifications (N1-methyladenosine (m1A), 5-methylcytosine (m5C) and N6-methyladenosine (m6A)) (16) across cancers was assessed using Spearman correlation analysis.
To clarify the expression of ORC6 and immune-related characteristics, we employed Spearman correlation analysis to calculate the correlation between ORC6 and 5 types of immune-related genes (chemokines, chemokine receptors, immunosimulators, immunoinhibitors, and MHC). TISIDB(http://cis.hku.hk/TISIDB/) (17) to assess the immune cell infiltration status of ORC6.
To assess the impact of immunotherapy on ORC6 expression, we analyzed the immunotherapy advanced urothelial carcinoma cohort (IMvigor210 cohort) (18). The R package ‘limma’ was utilized for differential expression analysis of the target gene in the different groups. Additionally, we accessed the CAMOIP database (https://www.camoip.net/) (19) to obtain the prognostic information of the Auslander-Melanoma (20) immunotherapy cohort and assessed the effect of ORC6 expression on the survival time of patients after immunotherapy.
The possibility of ORC6 expression as a predictive marker for immunotherapy response was analyzed using the TISMO (http://tismo.cistrome.org/) (21) and TIDE (http://tide.dfci.harvard.edu/) (22) databases. To examine the correlation between ORC6 expression and the half-inhibitory concentration (IC50) of the drug, we employed the R package ‘pRRophetic’ (23) for the analysis.
Tumor Immune Single-cell Hub (TISCH, http://tisch.comp-genomics.org/) is a scRNA-seq database that has been specifically developed to investigate the single-cell landscape of the tumor microenvironment (TME) (24). We screened single-cell datasets, including ALL_GSE132509, BRCA_GSE161529, CESC_GSE168652, CHOL_GSE138709, CRC_GSE166555, ESCA_GSE160269, HNSC_GSE103322, LIHC_GSE166635, LSCC_GSE150321, OV_GSE154600, PAAD_ CRA001160, PRAD_GSE141445, STAD_GSE134520, THCA_GSE148673 and UVM_GSE139829. UMAP plots were used for the visualization of cell types and ORC6 expression levels.
We utilized single-cell sequence data obtained from CancerSEA(http://biocc.hrbmu.edu.cn/CancerSEA/) (25) to examine the relationship between ORC6 and 14 distinct cancer functional states.
To investigate the mechanisms underlying the impact of ORC6 expression on the prognosis of tumor patients, we performed gene set enrichment analysis (GSEA) to explore the ORC6-related signaling pathways, as previously described in the literature (26, 27). We performed differentially expressed gene (DEG) analysis on the ORC6-low and ORC6-high subgroups of each cancer using the “limma” R package. The threshold was set at 30%, and genes with adjusted P values <0.05 were considered DEGs. We selected the h.all.v7.2.symbols.gmt gene set as our reference and employed it to determine the normalized enrichment score (NES) and false discovery rate (FDR). By examining the correlation between the ORC6 gene expression matrix and the known functional genome, we evaluated the impact of coordinated changes in genes within the genome on phenotypic alterations. The presented findings were visualized as bubble plots with the aid of the R package “ggplot2”. The CAMOIP (19) network server was employed to perform Kyoto Encyclopedia of Genes and Genomes (KEGG) and Gene Ontology (GO) analyses based on ORC6 expression in TCGA-LIHC transcriptome data using the R package “clusterProfiler”.
The LIHC cell lines HCCLM3 and MHCC97-H and the hepatic epithelial cell line THLE-2 were acquired from BeNa Culture Collection. The HepG2, U-251 MG, and LN229 cell lines were obtained from Procell and cultured according to the manufacturer’s instructions. Transfection was carried out in 6-well plates (NEST Biotechnology) using Lipofectamine 2000 (Invitrogen) according to the manufacturer’s protocol in HepG2, HCCLM3, U-251 MG, and LN229 cells. The siRNA used in this study was synthesized by GenePharma. Supplementary Table S1 lists the sequences of the siRNAs used in this study. The Western blot experimental steps were described in a previous study (28). The antibodies used in this study were anti-ORC6 (Proteintech, 17784-1-AP, 1:1000) and anti-alpha tubulin (Proteintech, 11224-1-AP, 1:5000).
Control and experimental cells were placed in 96-well plates at cell densities of 5,000 (HepG2 and HCCLM3) or 3,000 (U251 MG and LN229) cells per well, respectively. After incubation for 0, 24, 48, and 78 hours, cell viability was assessed by using the CCK-8 assay (GlpBio), and the optical density (OD) was measured at 450 nm with a microplate reader.
Cell proliferation was assessed using EdU (5-ethynyl-2’-deoxyuridine) staining. Briefly, control and experimental cells were seeded in 96-well plates and incubated overnight. After incubation with 10 μM EdU (RiboBio) for 2 hours, cells were fixed with 4% paraformaldehyde for 20 minutes, permeabilized with 0.5% Triton X-100 for 15 minutes, incubated with EdU reaction solution for 30 minutes, and finally incubated with Hoechst 33342 for 10 minutes. Images were taken using an inverted fluorescence microscope (Olympus).
Control and experimental cells were seeded onto a 6-well plate and cultured until reaching a confluence of 70% before undergoing transfection and continuing to be cultured normally. Scratch assays were performed when cell confluence reached approximately 90%, with images taken at 0 and 36 hours thereafter. For Transwell migration assays, 50,000 (HepG2 and HCCLM3) or 15,000 (U251 MG and LN229) cells were seeded into the chamber and cultured with serum-free medium within the insert and with 10% complete medium outside of the insert. After 24 hours, cells were fixed and stained, and then the cells within the insert were removed by gently swabbing with a cotton tip before imaging.
We used Student’s t-test to determine the statistical significance of differences between the two groups. Paired t-tests were conducted to compare the expression levels of ORC6 in tumor tissues with those in their paired normal tissues. We evaluated the prognostic significance of ORC6 by conducting log-rank and univariate Cox regression analyses. Spearman correlation analysis was employed to assess the correlations between ORC6 and its corresponding features. A p value < 0.05 was considered to indicate statistical significance.
We conducted a comparative analysis of ORC6 expression in tumor vs. normal tissues by merging the TCGA and GTEx databases. ORC6 was found to be significantly upregulated in 33 tumors (all p<0.05), as illustrated in Figure 1A. However, no significant changes were observed in TCGT. Then, our analysis of tumor and matched normal tissue samples from the TCGA database revealed that ORC6 expression was significantly elevated in tumor samples from BLCA, BRCA, CHOL, COAD, ESCA, HNSC, KICH, KIRC, KIRP, LIHC, LUSC, LUAD, PRAD, READ, STAD, THCA, and UCEC (Figure 1B, all p<0.05). Further protein score hints were provided by the HPA online database. ORC6 showed high protein scores in the stomach, duodenum, colon, pancreas, lymph nodes, testis, and bone marrow but low protein scores in the liver (Figure 1C). Regarding its protein expression in tumors, we observed that ORC6 was moderately/highly expressed in 100% of head and neck cancer (3/3) and testicular cancer (11/11) tissues and was moderately/highly expressed in 54.5% (6/11) of liver cancer tissues (Figure 1D). To clarify the localization of ORC6 protein expression, we obtained immunofluorescence staining images of ORC6 protein expression in HEK 293 and PC-3 cells through the HPA database (Supplementary Figure S1A). Further access to the Genecards database was performed for validation (Supplementary Figure S1B). We found that ORC6 was mainly concentrated in the nucleus and cytoplasm. Finally, we constructed a PPI network using interaction data sourced from the ComPPI website. The results of our analysis showed that proteins found to be in close interaction with ORC6 were primarily localized within the nucleus, as depicted in Supplementary Figure S1C. In summary, we identified that ORC6 was generally highly expressed in tumors.
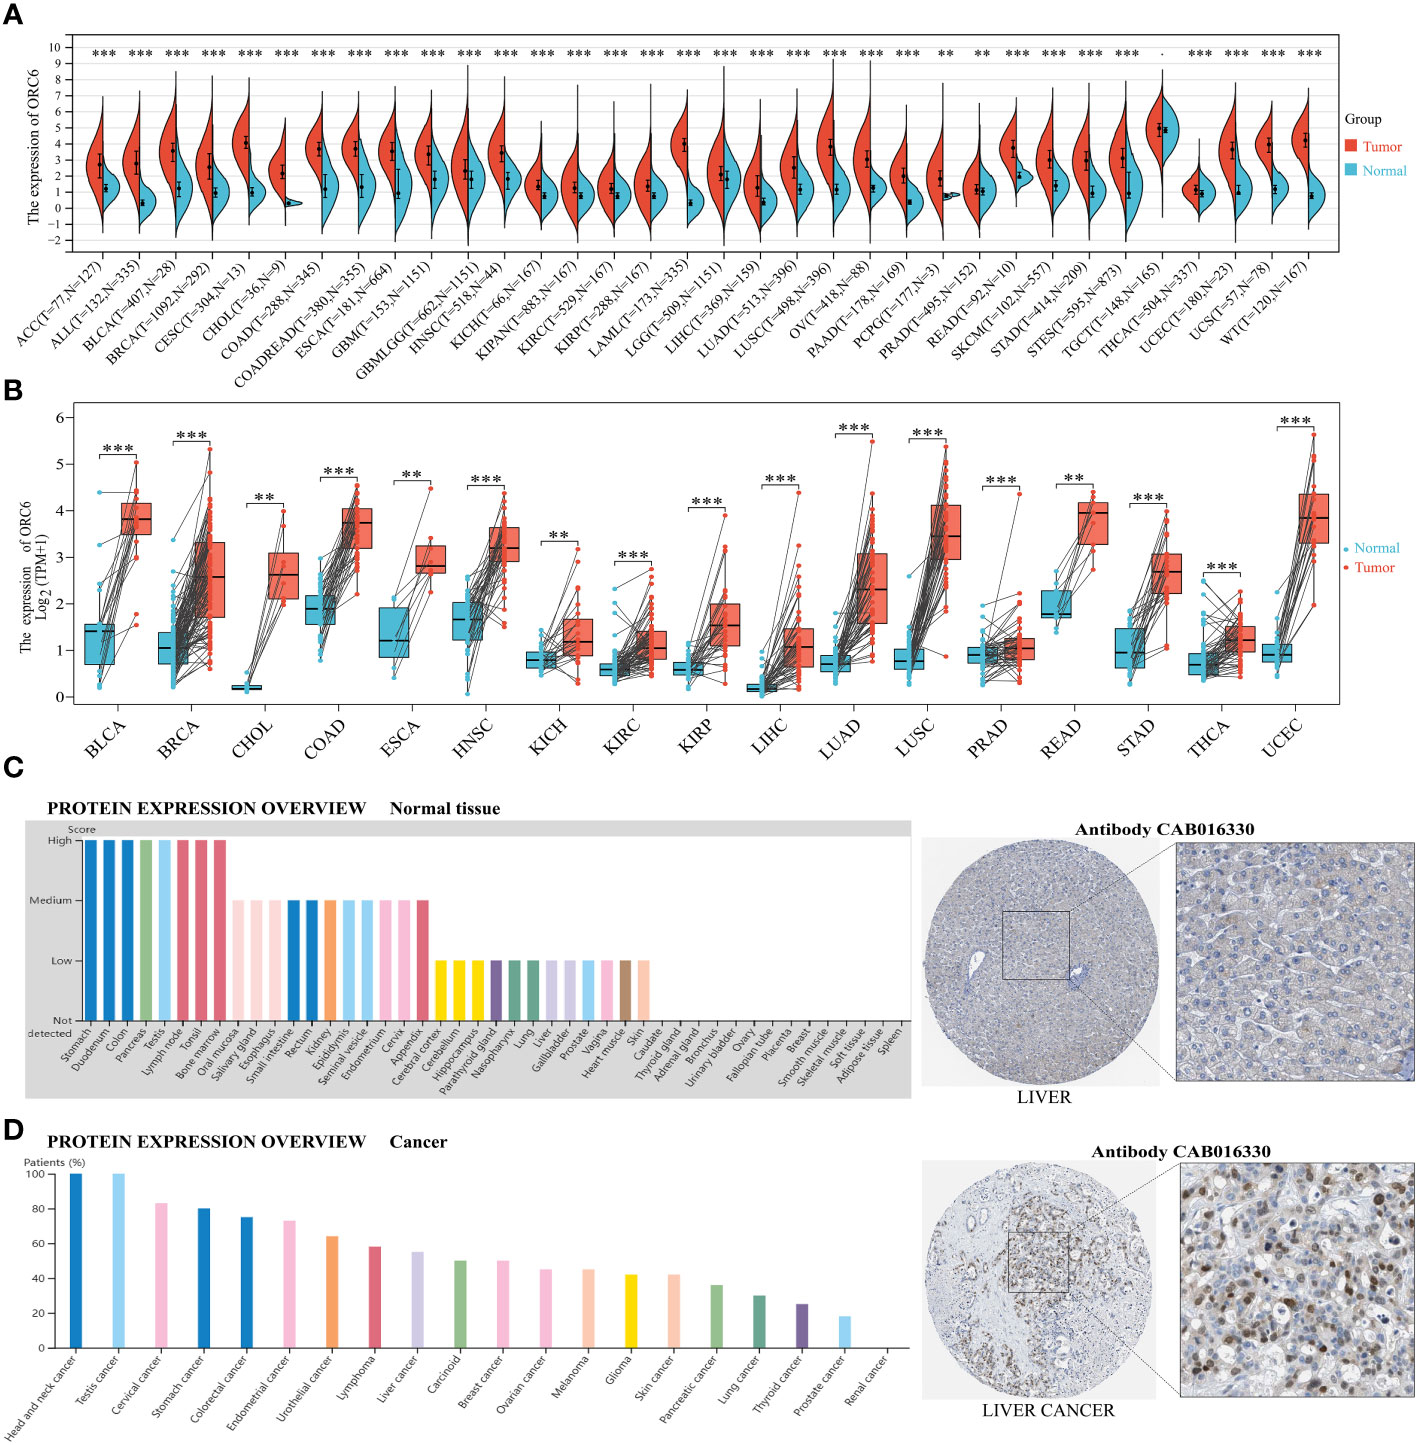
Figure 1 ORC6 expression profiles. (A) ORC6 mRNA expression levels in pan-cancer tissues and corresponding normal tissues derived from TCGA and GTEx databases. (B) Differential expression of ORC6 in tumor and paired adjacent tissues. (C, D) Protein expression analysis of ORC6 in normal tissues and cancer tissues using the Human Protein Atlas database. The left panel shows the expression scores or positive percentages in each tissue, while representative immunohistochemistry images of normal liver tissue and liver cancer tissue are shown in the right panel. (**p < 0.01, ***p < 0.001).
The frequency and type of ORC6 gene genetic alterations across cancers were analyzed by the cBioPortal platform. As illustrated in Supplementary Figure S1D, the most frequent type of genetic alteration in ORC6 was “amplification”, followed by “deep deletion”, “mutation” and “structural variation”. SARC exhibited the greatest frequency of ORC6 genetic mutations. These alterations included “deep deletions” in 2.35% of genes and “structural variants” in 0.39% of genes. In PRAD, the gene alteration frequency of ORC6 was 2.63%, of which the frequency of “amplification” reached 2.43%. In both DLBC and UCS, ORC6 genetic alterations were “deeply deleted”. In UCEC and SKCM, the frequency of ORC6 gene “mutation” reached 1.13%. In five different cancer types (ACC, ESCA, LIHC, KIRP, and PAAD), the ORC6 gene only exhibited “amplified” genetic variants. The mutation frequency of the ORC6 gene is generally low, at less than 3%. This could be due to the high conservation of genes within the ORC family (29). Subsequently, to explore the relationship between ORC6 expression and genomic variations across different cancer types, we employed either the Wilcoxon rank-sum test or the Kruskal–Wallis rank-sum test. We observed differential expression of ORC6 across three distinct variant groups (gain-variant, loss-variant, and no-variant) in 14 different cancers: BLCA, BRCA, CESC, COAD, HNSC, KIPAN, LIHC, LUAD, LUSC, OV, PRAD, STAD, STES, and UCS (Supplementary Figure S1E, all p<0.05). Specifically, ORC6 expression was generally higher in the gain-variant group than in the loss/neutral-variant group.
Numerous reports suggest that abnormal DNA methylation in the promoter region of genes can induce changes in chromatin structure and DNA stability, ultimately leading to the dysregulation of gene expression within the body (30). Therefore, we analyzed differences in the DNA promoter methylation levels of ORC6 between tumor and normal tissues using UALCAN. As depicted in Supplementary Figure S2A, methylation levels were lower in BLCA, BRCA, HNSC, THYM, UCEC, and PRAD than in normal tissues (all p<0.05). In contrast, methylation levels were higher in PAAD, KIRC, LUSC, and SARC than in normal tissues (Supplementary Figure S2A, all p<0.05). Moreover, RNA modifications are critical in selectively regulating the expression of genes (31). Our analysis, as illustrated in Supplementary Figure S2B, reveals a strong positive correlation between ORC6 expression and m1A-, m5C-, and m6A-related genes across almost all tumor types. These findings suggest that the ubiquitous overexpression of ORC6 in tumors may be closely associated with its epigenetic modifications and genetic variations. This correlation further supports the potential of ORC6 as a cancer regulatory factor and provides valuable clues for further exploring its role in cancer.
We also investigated the correlations between ORC6 expression and various clinicopathological features. According to the results presented in Figure 2A, there was a positive correlation between ORC6 expression and lymph node metastasis in several tumor types, and the correlations in HNSC (p=2.2e-4), KIPAN (p=6.8e-8), KIRC (p=5.6e-3), PRAD (p=4.0e-8), THCA (p=0.02) and other tumor types were the most robust. Figure 2B shows that the increase in ORC6 expression was positively correlated with tumor metastasis in ACC (p=8.2e-3), KIPAN (p=1.9e-3), KIRC (p=4.3e-4), LUAD (p=9.5e-3), PRAD (p=0.01), and SKCM (p=0.03). Furthermore, increased ORC6 expression was positively correlated with the T stage of ACC (p=4.8e-8), KIPAN (p=1.1e-9), KIRC (p=1.4e-5), KIRP (p=2.4e-8) and PRAD (p =7.0e-12) (Figure 2C). Figure 2D shows that the increased expression of ORC6 was positively correlated with the histological grade of GBMLGG (p=9.2e-25), HNSC (p=5.6e-9), LGG (p=9.2e-25), LIHC (p=3.0e-15) and PAAD (p=2.9e-9) but negatively correlated with the histological grade of STES (p=6.3e-5). Similarly, increased ORC6 expression was positively correlated with clinical staging (Figure 2E), and typical tumor types were ACC (p=6.3e-5), HNSC (p=1.5e-3), KIPAN (p=3.3e-9), KIRC (p=2.4e-4), and LUAD (p=0.01). From the above findings, it can be inferred that ORC6 might play a role in tumor progression and metastasis.
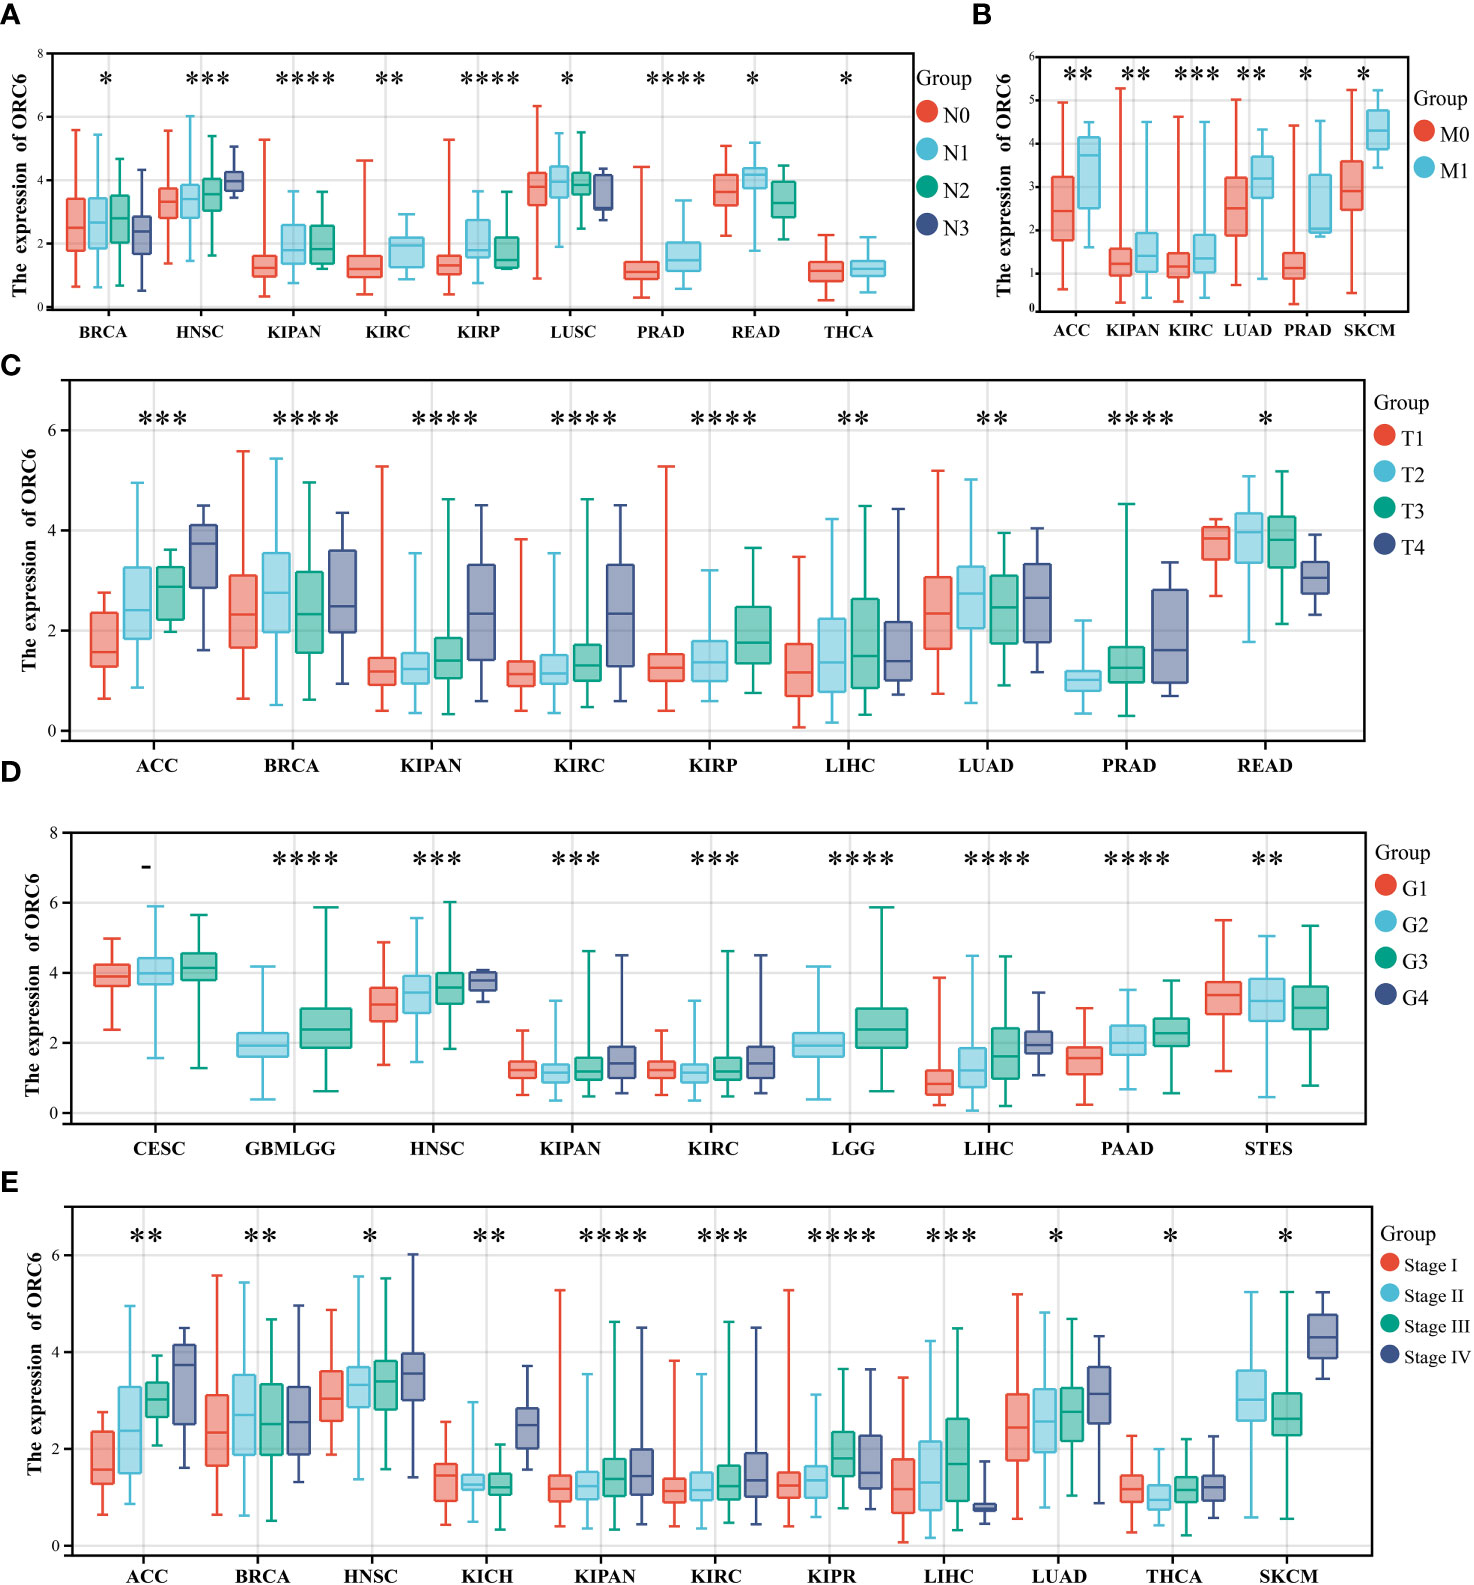
Figure 2 Correlations between clinical features and ORC6. (A–E) Correlation of ORC6 expression with pan-cancer clinical N stage (A), M stage (B), T stage (C), histological grade (D), and clinical stage (E). (*p<0.05, **p<0.01, ***p<0.001, ****p<0.0001).
To investigate the effect of ORC6 on tumor prognosis, we plotted survival curves and assessed OS using the Kaplan–Meier method. As shown in Figure 3, in ACC, BRCA, GBMLGG, HNSC, KICH, KIRC, KIRP, LGG, LIHC, LUAD, LUADLUSC, MESO, OSCC, PAAD, PCPG, SARC and UCEC patients, high ORC6 levels were highly correlated with poorer OS (Figure 3A; all p<0.05). Moreover, it is worth noting that high ORC6 expression was exclusively correlated with improved OS in OV (Figure 3B; p<0.05).
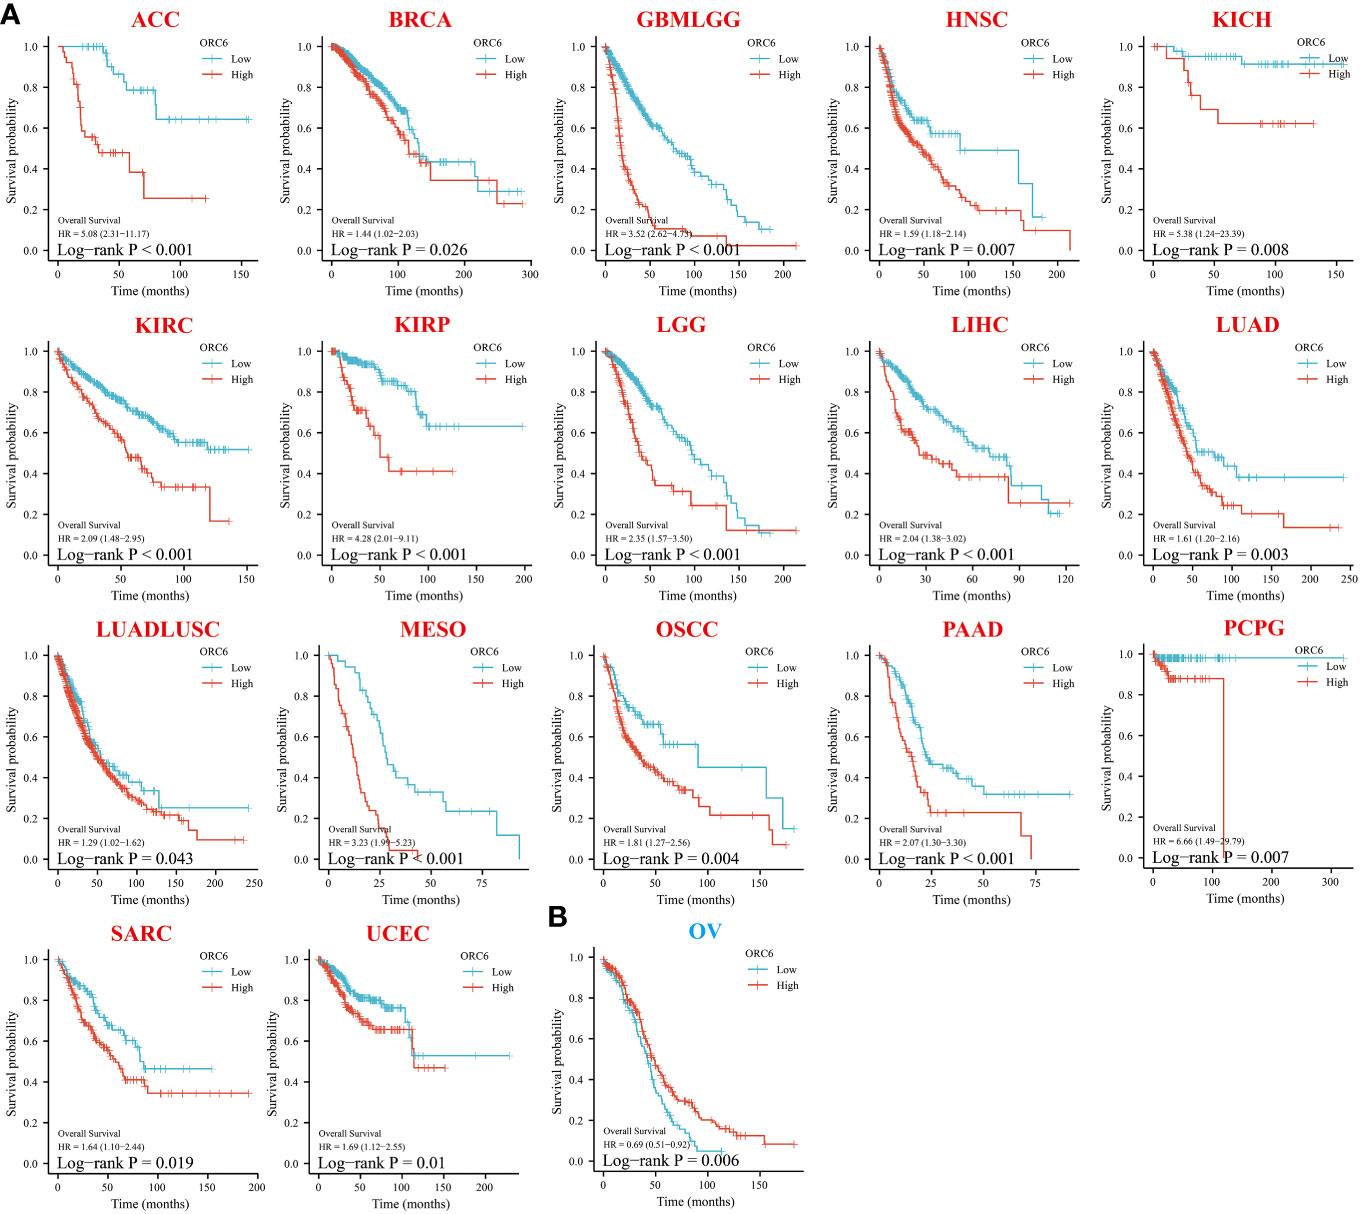
Figure 3 Relationship between ORC6 expression and overall survival (OS) of patients. (A, B) Relationship between ORC6 expression levels and prognosis in the indicated tumor types. In the abbreviation of tumor type, red represents poor prognosis, and blue represents good prognosis. The results are grouped by the best cutoff value, and the log-rank method was used for survival difference analysis.
Following this, we conducted Cox regression analysis to assess the correlation between ORC6 expression and several survival outcomes, including OS, DSS, DFI, and PFI, for each tumor type. The results were then presented in the form of a forest plot. As shown in Figure 4A, our findings indicate that high ORC6 expression was significantly associated with shorter OS in GBMLGG, KIPAN, KIRP, LGG, ACC, KIRC, MESO, LIHC, PCPG, PRAD, PAAD, KICH, LUAD, UVM, BRCA and HNSC patients (all p<0.05). High ORC6 expression in GBMLGG, KIPAN, KIRP, KIRC, ACC, LGG, MESO, LIHC, PRAD, KICH, PCPG, BRCA, PAAD, UVM, and LUAD patients was associated with poorer DSS (Figure 4B, all p<0.05). Regarding DFI, there was a significant association between high ORC6 expression and lower DFI in KIRP, KIPAN, LIHC, BRCA, PRAD, PAAD, SARC, THCA, MESO, and LUAD patients, whereas high ORC6 expression in OV patients was associated with improved prognosis for DFI (Figure 4C, all p<0.05). Furthermore, as illustrated in Figure 4D, high ORC6 levels were strongly correlated with poorer PFI in GBMLGG, KIPAN, PRAD, KIRP, ACC, LIHC, LGG, UVM, KIRC, KICH, PAAD, BRCA, MESO, BLCA and HNSC (all p<0.05).
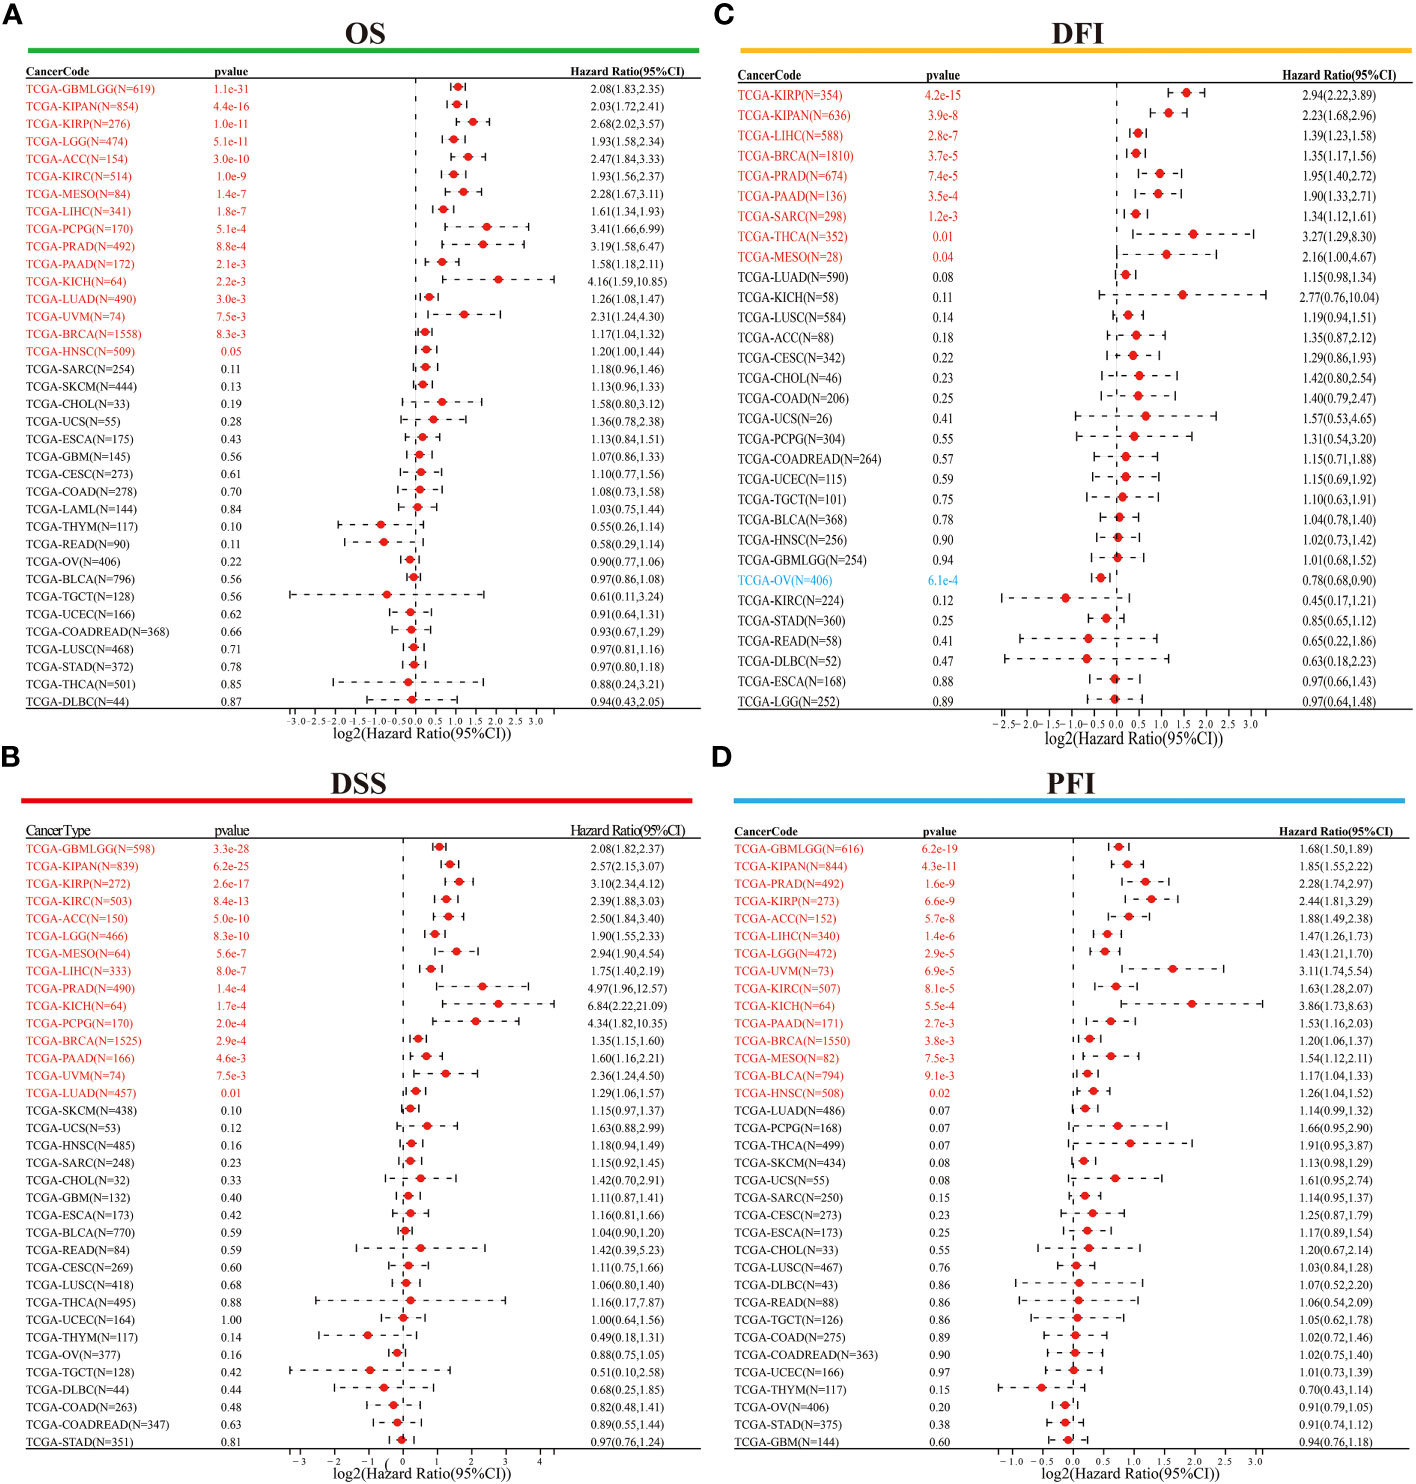
Figure 4 Univariate Cox regression analysis was performed to determine the prognostic role of ORC6. (A–D) Correlation of ORC6 expression with OS (A), DSS (B), DFI (C), and PFI (D). (OS, overall survival; DSS, disease-specific survival; DFI, disease-free interval; PFI, progression-free interval).
Moreover, we assessed the diagnostic accuracy of ORC6 in different types of cancer using ROC curves. As shown in Figure 5, in ACC, BLCA, BRCA, CESC, CHOL, COAD, COADREAD, ESAD, ESCA, GBM, HNSC, LAML, LIHC, LUAD, LUADLUSC, LUSC, OSCC, OV, PAAD, READ, STAD, UCEC and UCS, ORC6 could be used as a highly accurate diagnostic marker (Figures 5A–W, all AUC>0.85). In DLBC, GBMLGG, KICH, KIRC, KIRP, SKCM, and THYM, ORC6 had moderate diagnostic performance (Supplementary Figures S3A–E, H, K; all AUC=0.7~0.85). In LGG, PRAD, TGCT, and THCA, ORC6 had poor diagnostic values (Supplementary Figures S3F, G, I, J; all AUC=0.5~0.7). In conclusion, our study revealed that high expression of ORC6 is generally linked to unfavorable prognosis in the majority of cancer types, and it has good diagnostic value.
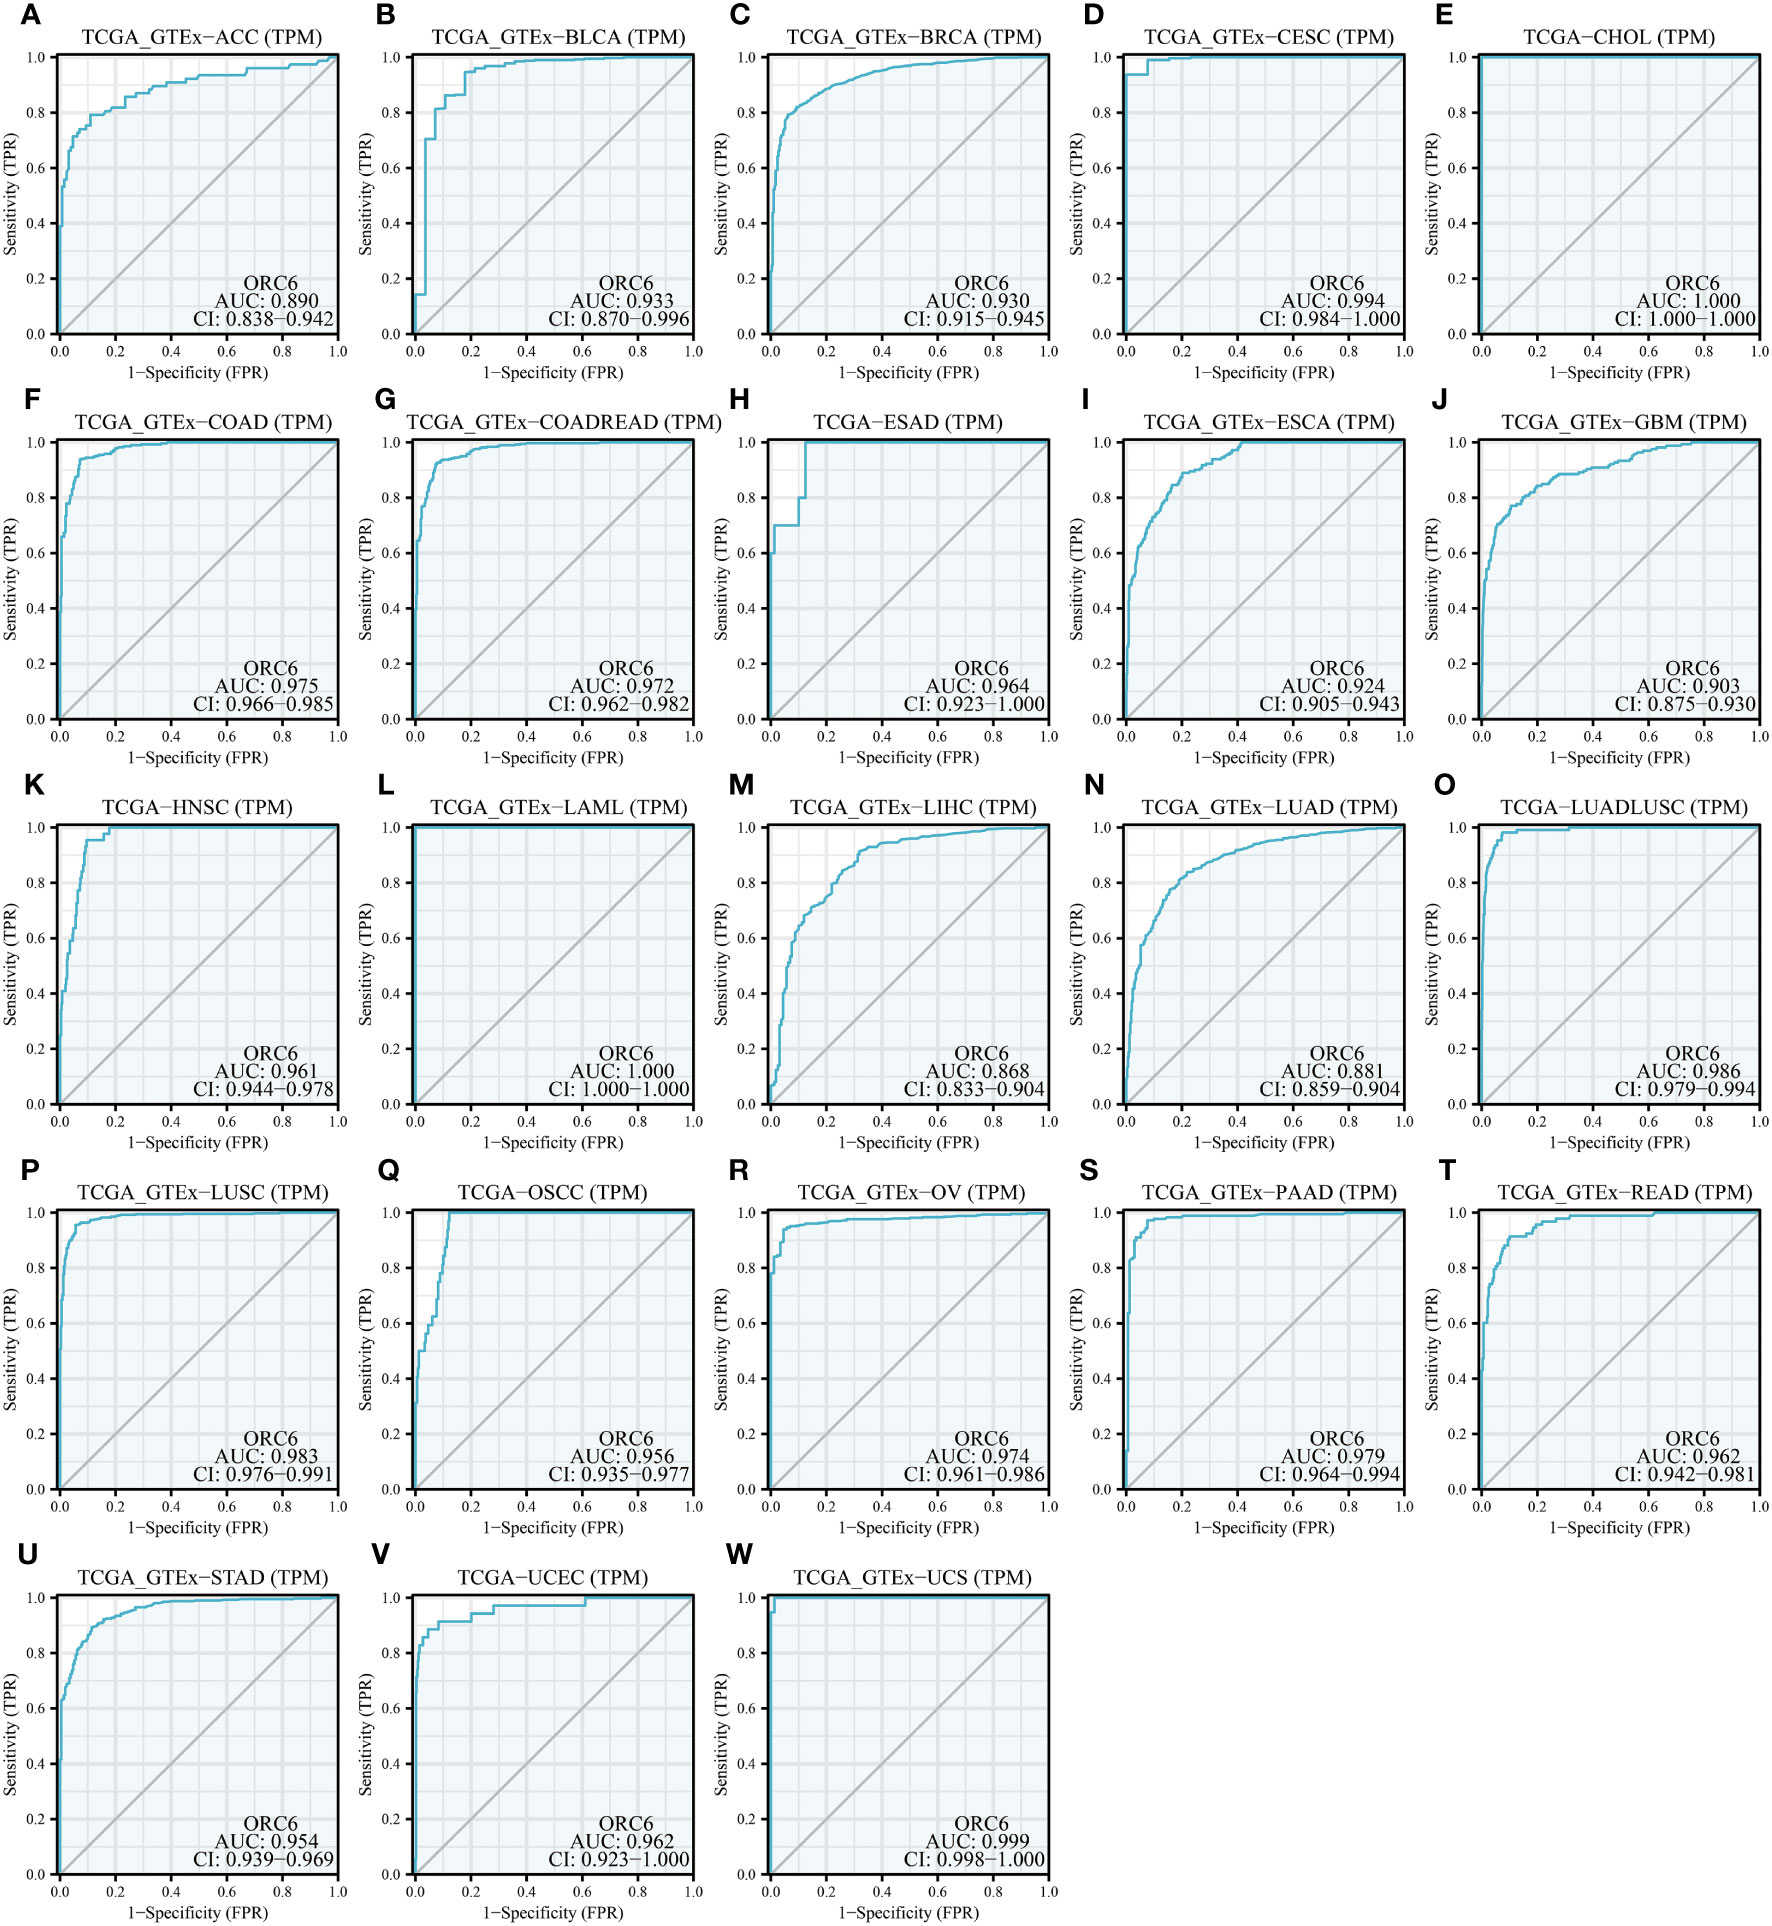
Figure 5 Diagnostic value of ORC6. (A–W) ROC curve of ORC6 in ACC, BLCA, BRCA, CESC, CHOL, COAD, COADREAD, ESAD, ESCA, GBM, HNSC, LAML, LIHC, LUAD, LUADLUSC, LUSC, OSCC, OV, PAAD, READ, STAD, UCEC and UCS.
To explore the possible biological pathways influenced by ORC6 that may contribute to tumorigenesis and progression, we conducted GSEA on data obtained from 33 tumors from TCGA. As illustrated in Figure 6A, we observed that immune-related pathways, including TNFα signaling via NFκB, IFN-α response, IFN-γ response, inflammatory response, IL-6/JAK/STAT3, IL-2/STAT5, complement and coagulation cascades, and allograft rejection pathways, were significantly enriched across a diverse range of tumors. Moreover, we observed a positive correlation between ORC6 expression and MYC target V2, MYC target V1, MTORC1, mitotic spindle, G2 checkpoint, E2F target, DNA repair, and other pathways across cancers. Furthermore, KEGG analysis revealed that ORC6 was mainly involved in the synthesis and degradation of various substances, drug metabolism, the cell cycle, ferroptosis, and neuroactive ligand-receptor interactions in LIHC (Figure 6B). GO analysis, including the BP, CC, and MF categories, indicated that ORC6 was mainly related to immune response regulation and biological enzyme activity in LIHC (Figures 6C–E).
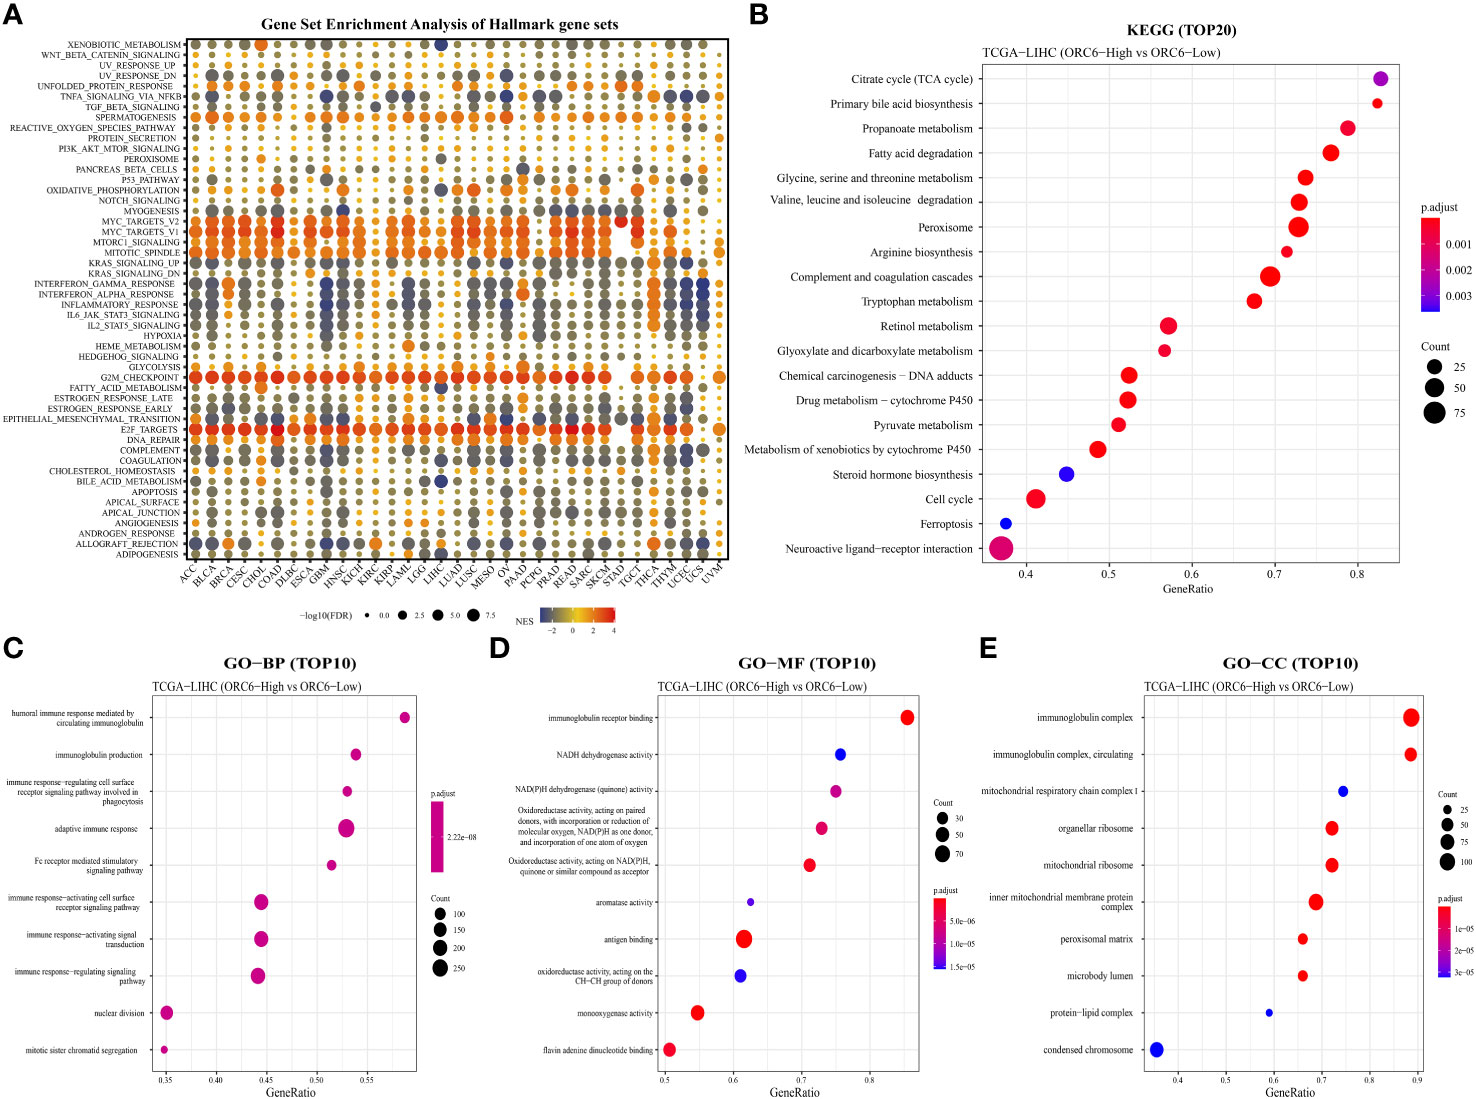
Figure 6 Gene set differential enrichment analysis of ORC6 across cancers and in liver cancer. (A) This graph visualizes the potential signaling pathways that are associated with ORC6 expression in different tumor types. The circles depict cancer enrichment projects. Their sizes vary based on their false discovery rate (FDR), while the colors represent the corresponding normalized enrichment score (NES) for each enrichment item. (B) The top 20 enriched KEGG results in HCC are shown. (C–E) The top 10 enriched gene ontology biological processes (BPs) (C), molecular functions (MFs) (D), and cellular components (CCs) (E) are also displayed.
To explore ORC6 expression in diverse TMEs, including ALL, BRCA, CESC, CHOL, CRC, ESCA, HNSC, LIHC, LSCC, OV, PAAD, PRAD, STAD, THCA, and UVM, we investigated their expression distribution (Figures 7A–O). The results were interesting, as they showed that ORC6 was primarily expressed at high levels in the malignant cells of these cancers. In STAD, it was predominantly expressed in pit mucus cells (Figure 7M). It is worth noting that in LIHC, ORC6 was also found to be expressed in T-cell proliferation, which demonstrates its potential role in this immune response (Figures 7H, P). To further investigate the relationship between ORC6 and the functional status of different cancers, we analyzed single-cell sequencing data obtained from CancerSEA for 14 types of cancer. In most tumors, ORC6 showed a positive correlation with the cell cycle, proliferation, DNA damage, and DNA repair (Supplementary Figure S4). In contrast, ORC6 was negatively associated with apoptosis, hypoxia, metastasis, and quiescence in most tumors (Supplementary Figure S4). These findings suggest a correlation between abnormal expression of ORC6 and the advancement of cancer as well as the immune response of cancer.
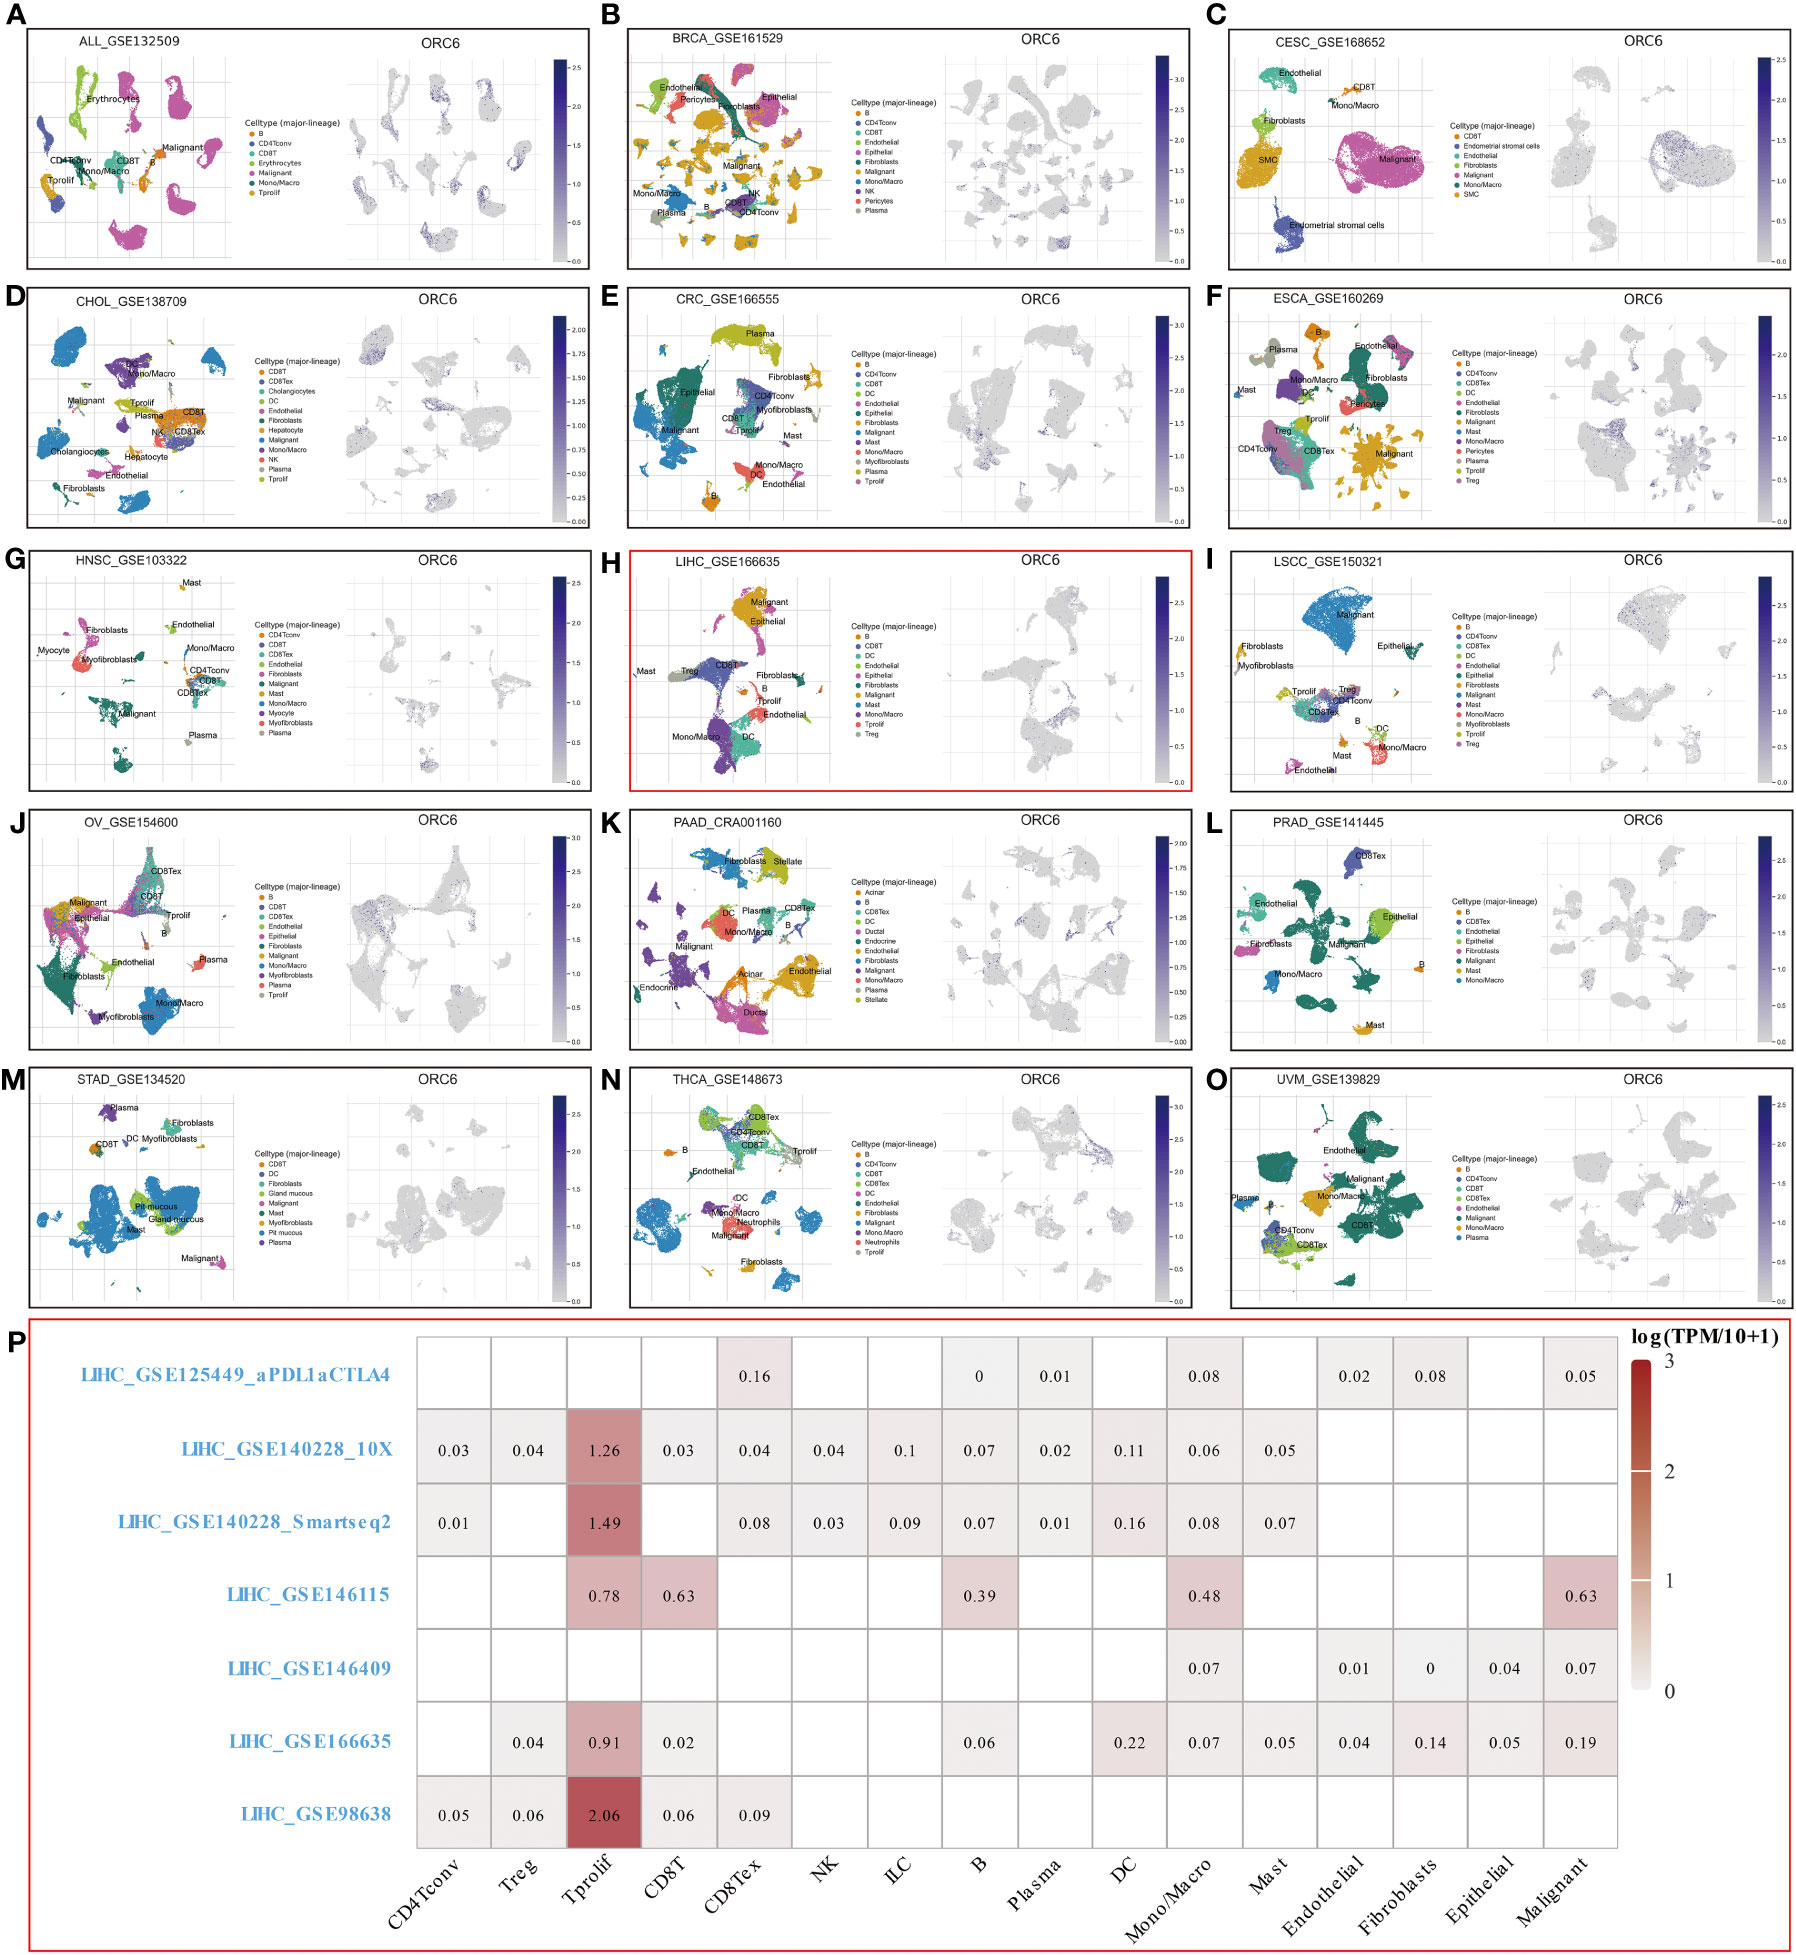
Figure 7 Single-cell sequencing analysis of ORC6 expression in malignant cells. (A–0) ORC6 in ALL (A), BRCA (B), CESC (C), CHOL (D), CRC (E), ESCA (F), HNSC (G), LIHC (H), LSCC (I), OV (J), PAAD (K), PRAD (L), THCA (N) and UVM (O) were mainly expressed in malignant cells; ORC6 was mainly expressed in pit mucous in STAD (M). (P) Expression distribution of ORC6 in several LIHCs.
Investigating the possible gene expression within tumors and its connection to immune cells can greatly aid in predicting the clinical outcome for patients with tumors and selecting appropriate diagnostic targets and intervention strategies (32). To gain further insights into the correlation between ORC6 and immune cells in the TME, we used the TISIDB tool for analysis. The pan-cancer analysis indicated that the expression level of ORC6 displayed an inverse correlation with the infiltration abundance of various immune cells, including Tem CD8 cells, Th1 cells, NK cells, pDCs, iDCs, eosinophils, monocytes, and neutrophils, while showing a positive correlation with the infiltration abundance of Act CD8 cells and Th2 cells (Figure 8A). This phenomenon was especially evident in LIHC (Figures 8B–K). Furthermore, in gliomas, which include GBM and LGG, ORC6 expression was negatively correlated with the abundance of infiltrating immune cells, including Tem CD8, Tcm CD4, Tfh, Th1, Th17, Act B, lmm B, NK, MDSC, NKT, Act DC, pDC, iDC, macrophage, eosinophil, mast, monocyte, and neutrophil cells. In contrast, ORC6 expression levels in THCA and KIRC were positively correlated with the majority of immune cell infiltration (Figure 8A).
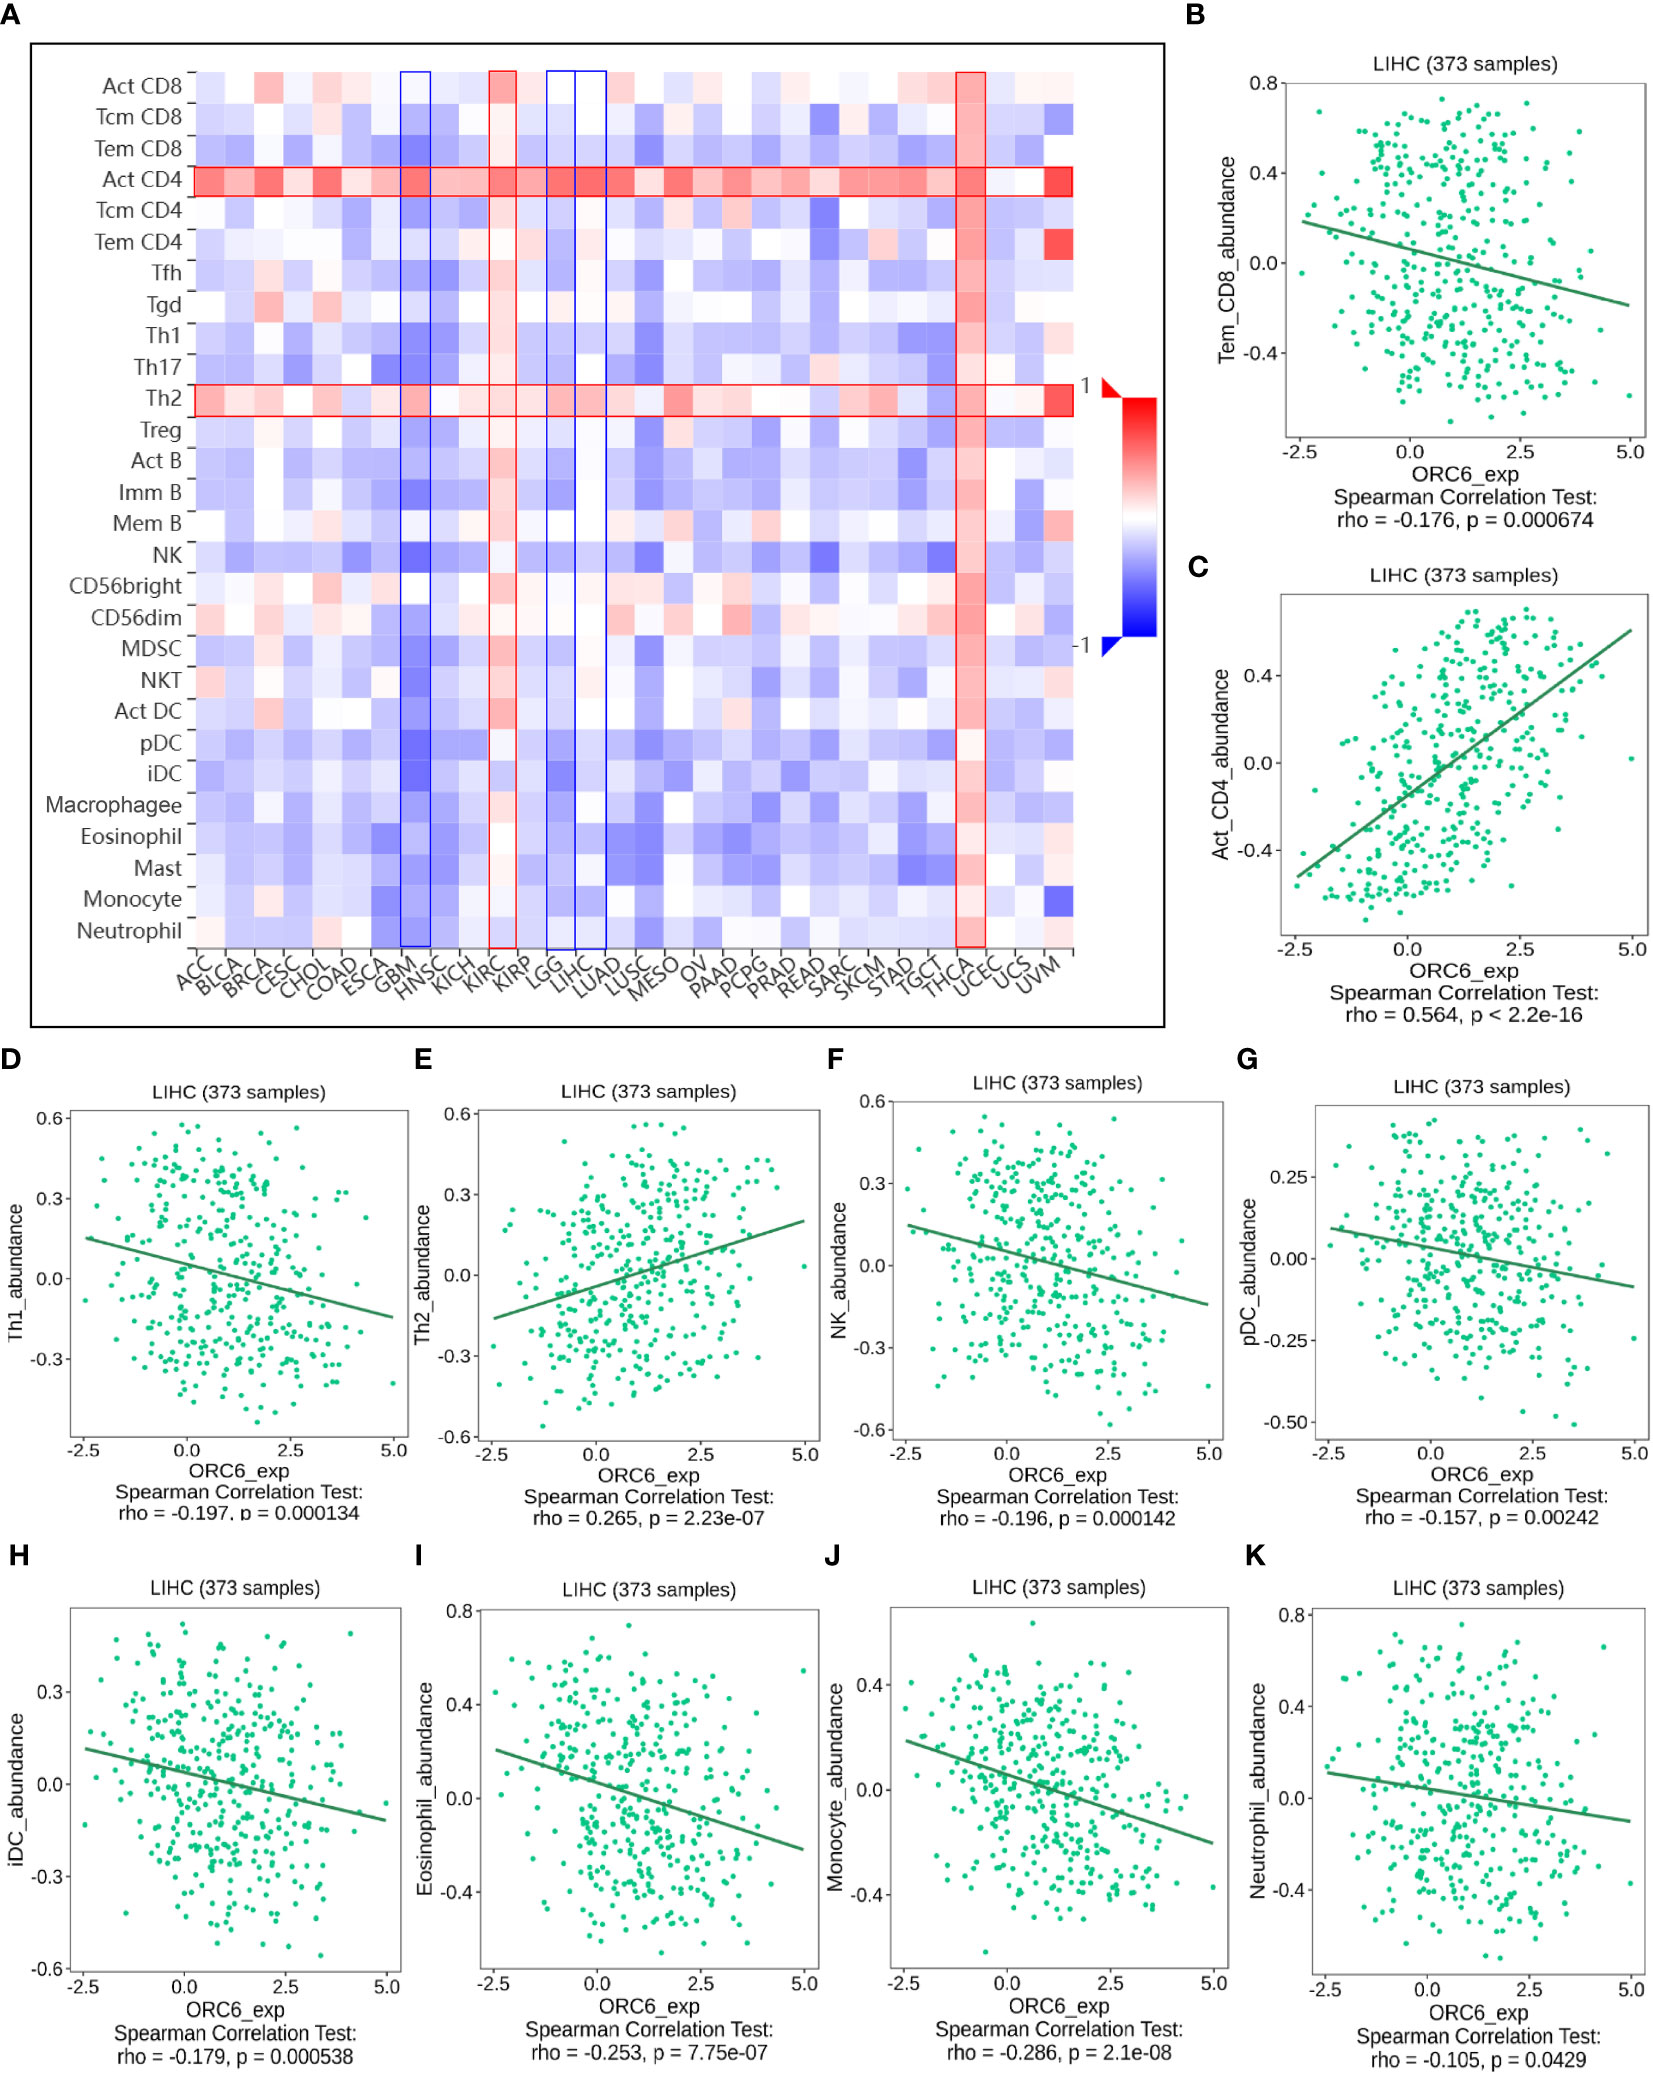
Figure 8 The relationship between ORC6 levels and immune infiltration was analyzed by Timer 2.0. (A) ORC6 expression correlates with immune cell infiltration across cancers. (B–K) Correlation of ORC6 expression with the abundance of Tem CD8, Act CD4, Th1, Th2, NK, pDC, iDC, eosinophil, monocyte and neutrophil cell infiltration in LIHC.
Furthermore, we examined the association between ORC6 expression and the expression of genes related to immune regulation (Figures 9A–E). The heatmap indicated that ORC6 was coexpressed with most immune-related genes across cancers. Especially in DLBC, UVM, LIHC, KIRC, and THCA, ORC6 was roughly positively correlated with 5 immune-related genes. In TGCT, GBM, and LUSC, ORC6 was roughly negatively correlated with immune-related genes. Furthermore, the chemokine CCL14 was negatively correlated with ORC6 expression across cancers (Figure 9A). Among the immune activation-related genes, MICB, PVR, ULBP1, CD276, and TNFRSF25 were positively correlated with ORC6 expression in most tumors (Figure 9C). There was a positive correlation between the expression of ORC6 and genes related to immunosuppression in several cancer types, such as DLBC, UVM, LIHC, KIRC, THCA, GBMLGG, LGG, and PRAD, as indicated in Figure 9D. Notably, in the advanced urothelial carcinoma cohort with immunotherapy, the response group had significantly higher ORC6 expression (Figure 9F, p=0.00099). Furthermore, we observed that in the melanoma immunotherapy cohort, the high ORC6 expression group had prolonged survival after immunotherapy (Figure 9G, p=0.027). Taken together, these results suggest that ORC6 may be involved in immune cell infiltration and the expression of immunomodulatory genes and that high ORC6 expression may indicate a better response to immunotherapy.
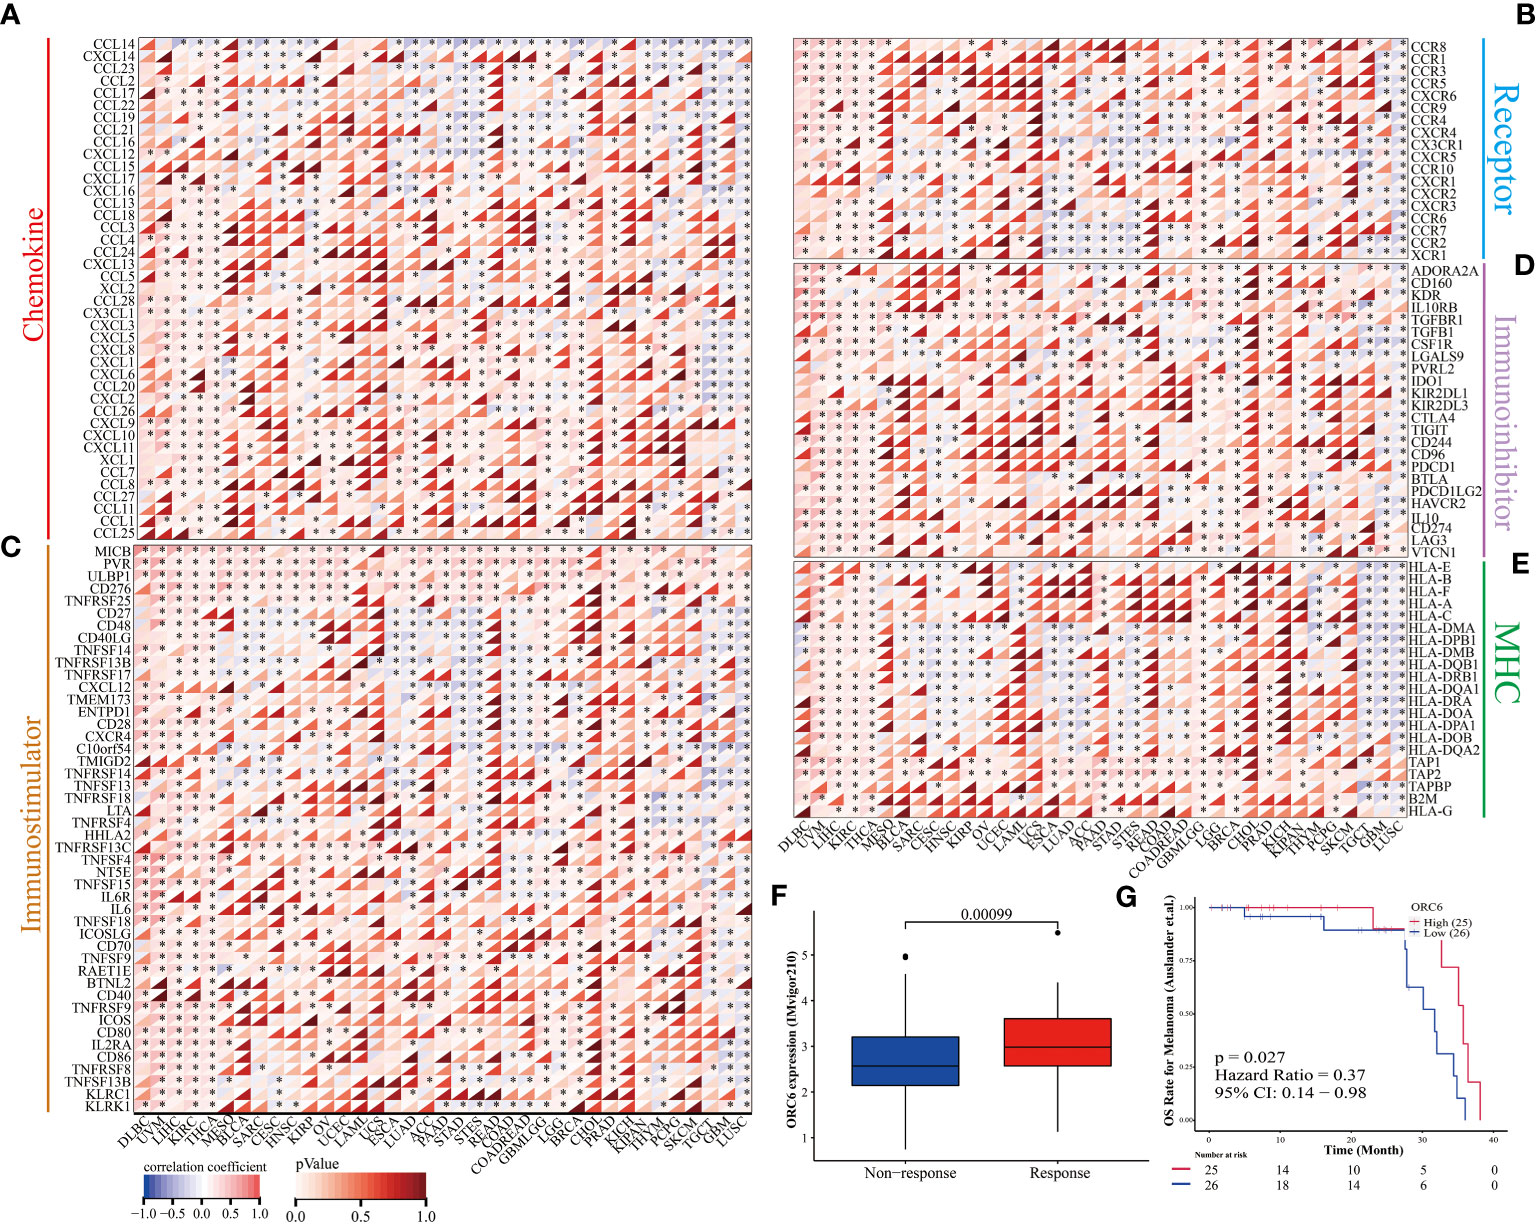
Figure 9 ORC6 expression and immunotherapy response. (A–E) Correlation analysis of ORC6 expression with five types of immune regulation-related genes, including chemokine (A), chemokine receptor (B), immune stimulator (C), immune inhibitors (D), and MHC (E). (F) Association of ORC6 expression with immunotherapy response in the IMvigor210 cohort. (G) In the melanoma immunotherapy cohort, the log-rank method was used to analyze the difference in survival after immunotherapy between the high- and low-expression groups of ORC6. *p<0.05.
To elucidate the predictive function of ORC6 expression in immunotherapy response, we evaluated it using the TISMO database. As depicted in Figure 10A, ORC6 expression was markedly different in 5 subjects before and after ICB treatment and between responder and nonresponder cohorts. Moreover, ORC6 expression was significantly different in the six cell lines before and after cytokine treatment (Figure 10B). Furthermore, we performed a biomarker assessment of ORC6 by TIDE. The findings indicated that ORC6 had a better predictive effect in 7 immunotherapy cohorts (Figure 10C). In addition, we performed a sensitivity analysis of chemotherapy drugs commonly used to treat LIHC. As shown in Figure 10D, the ORC6 high-expression group was closely correlated with the reduction of IC50 of 5-fluorouracil, doxorubicin, gemcitabine, and imatinib (all p<0.001).
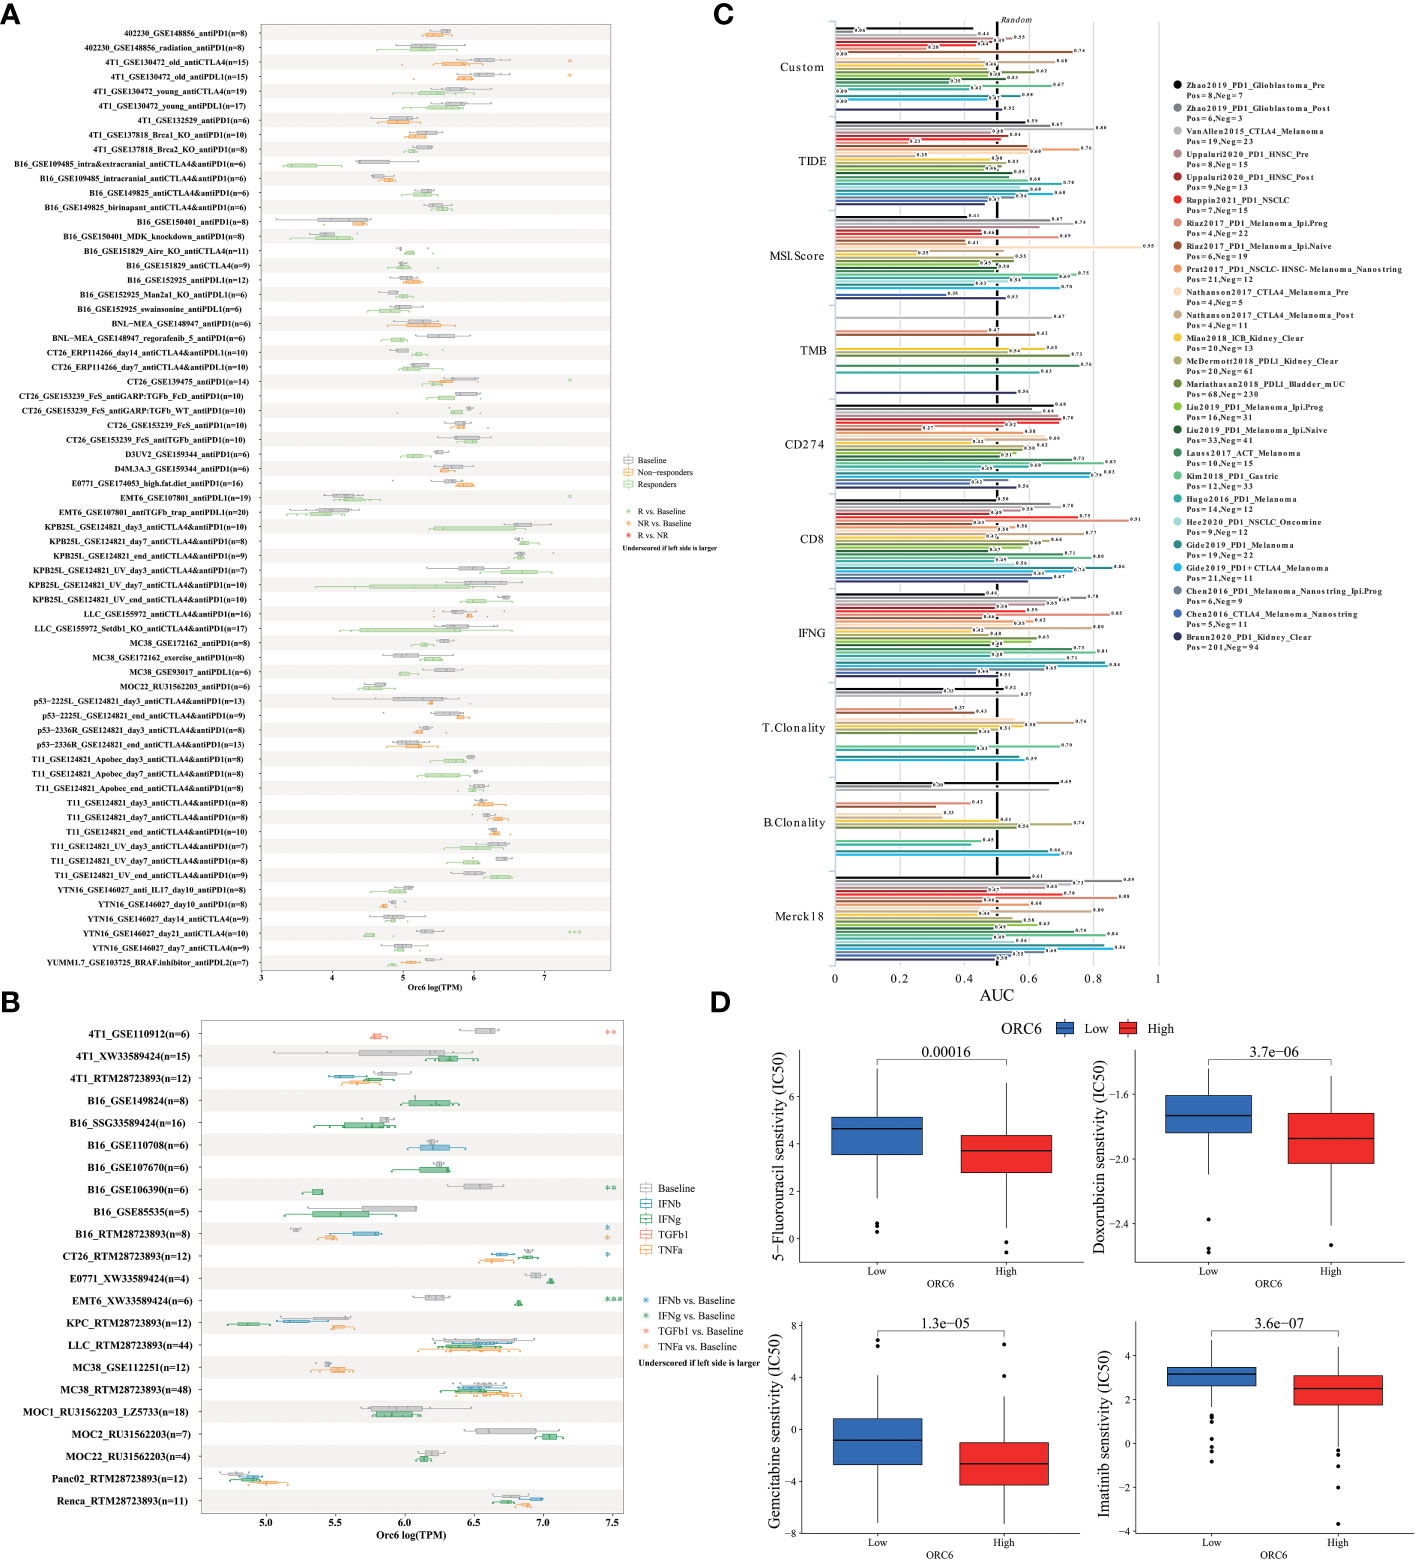
Figure 10 Correlation of ORC6 expression with immunotherapy response, biomarkers, and drug sensitivity. (A) Differences in ORC6 expression between the immunosuppressive treatment group and the control group. (B) Differences in ORC6 expression between cytokine-treated and control groups. (C) The predictive role of ORC6 as a biomarker versus other markers in different immunotherapy cohorts. (D) Relationship between ORC6 expression and half-inhibitory concentration (IC50) of 5-fluorouracil, doxorubicin, gemcitabine and imatinib. *p < 0.05, **p < 0.01, ***p < 0.001.
After collating and analyzing the pan-cancer data mentioned above, it was observed that the elevated expression of ORC6 was significantly associated with the unfavorable prognosis and malignancy of LIHC and GBMLGG patients (Figures 1–4). Consequently, our study will concentrate on LIHC and GBMLGG.
We collected clinical information and ORC6 expression profiles of patients belonging to the TCGA-LIHC cohort. After performing a chi-square test analysis, we discovered a significant correlation between ORC6 expression and tumor histological grade, alpha-fetoprotein (AFP) content, and vascular invasion in LIHC (Supplementary Table S2). Furthermore, via univariate and multivariate Cox regression analysis, we identified ORC6 and pathological stage as independent prognostic risk factors for LIHC (Supplementary Table S3). Subsequently, a nomogram was developed to estimate the survival likelihood of patients at intervals of 1, 3, and 5 years, and its prediction efficiency was confirmed by the calibration curve, as illustrated in Figures 11A, B. This indicates that the model had a high accuracy in its predictive ability. Given that our analysis of ORC6 was solely based on the TCGA database, we conducted external verification by collating clinical information and ORC6 expression profiles of patients belonging to the ICGC-LIRI-JP cohort. The results showed that ORC6 expression in LIHC was significantly higher than that in normal tissues (Figure 11C). It was positively correlated with the clinical stage and associated with poor overall survival (Figures 11D, E). Furthermore, univariate and multivariate Cox regression analyses revealed ORC6, sex, and clinical stage as independent risk factors for poor prognosis in LIHC (Figures 11F, G). To investigate the function of ORC6 in LIHC cells, we carried out in vitro experiments. Initially, we assessed the basal expression of ORC6 in LIHC cell lines and normal hepatocytes. Our findings indicate that LIHC cell lines have noticeably increased ORC6 expression compared to normal hepatocytes, as illustrated in Figure 12A. To assess the impact of ORC6 downregulation in LIHC cells, we chose two LIHC cell lines with high expression (HepG2 and HCCLM3) and conducted an ORC6 knockout assay (Figures 12B, C). Using the EdU cell proliferation test, a significant decrease in the proliferation of LIHC cells was observed after the knockout of ORC6 expression (Figure 12D). In addition, similar results were obtained through CCK-8 analysis (Figures 12E, F). Subsequently, we conducted wound healing and Transwell tests to examine the impact of ORC6 downregulation on the migratory capacity of LIHC cells. The results indicate that compared to the control cells, the downregulation of ORC6 significantly inhibited the migration ability of LIHC cells (Figures 12G–L).
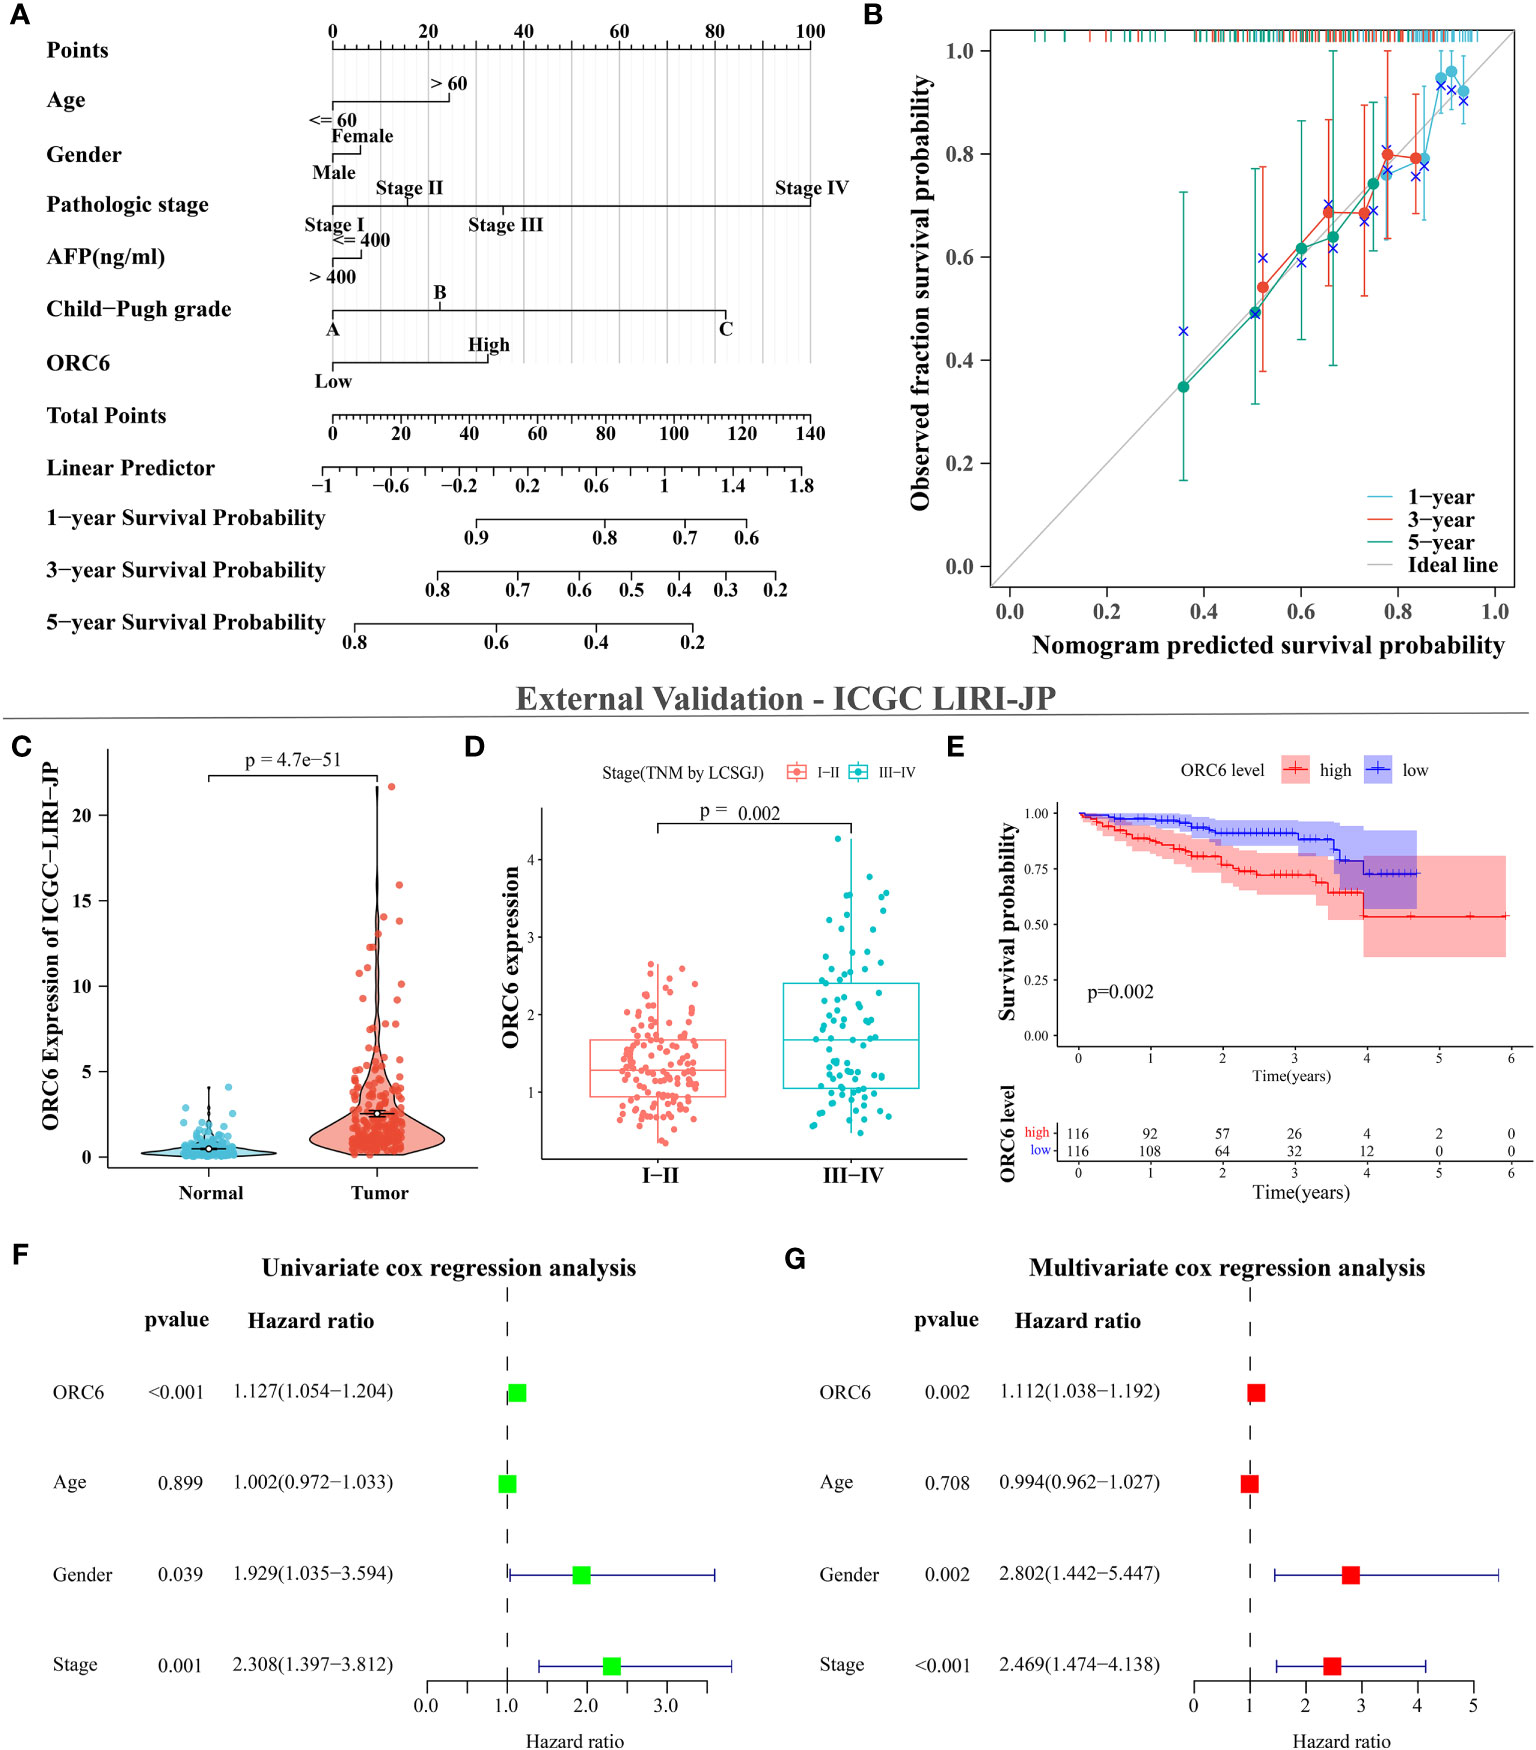
Figure 11 ORC6 is an independent risk factor for poor prognosis in LIHC. (A) Construction of line charts for 1-, 3-, and 5-year time points. (B) Calibration curves for 1-, 3-, and 5-year timepoints. (C–G) External data validation using the ICGC LIRI-JP cohort. (C) Differential expression analysis of ORC6 between tumor and normal tissues. (D) Differential expression analysis of ORC6 across different clinical stages. (E) Survival analysis of the high and low ORC6 expression groups, with both univariate (F) and multivariate (G) Cox regression analyses used to establish the role of ORC6 in LIHC.
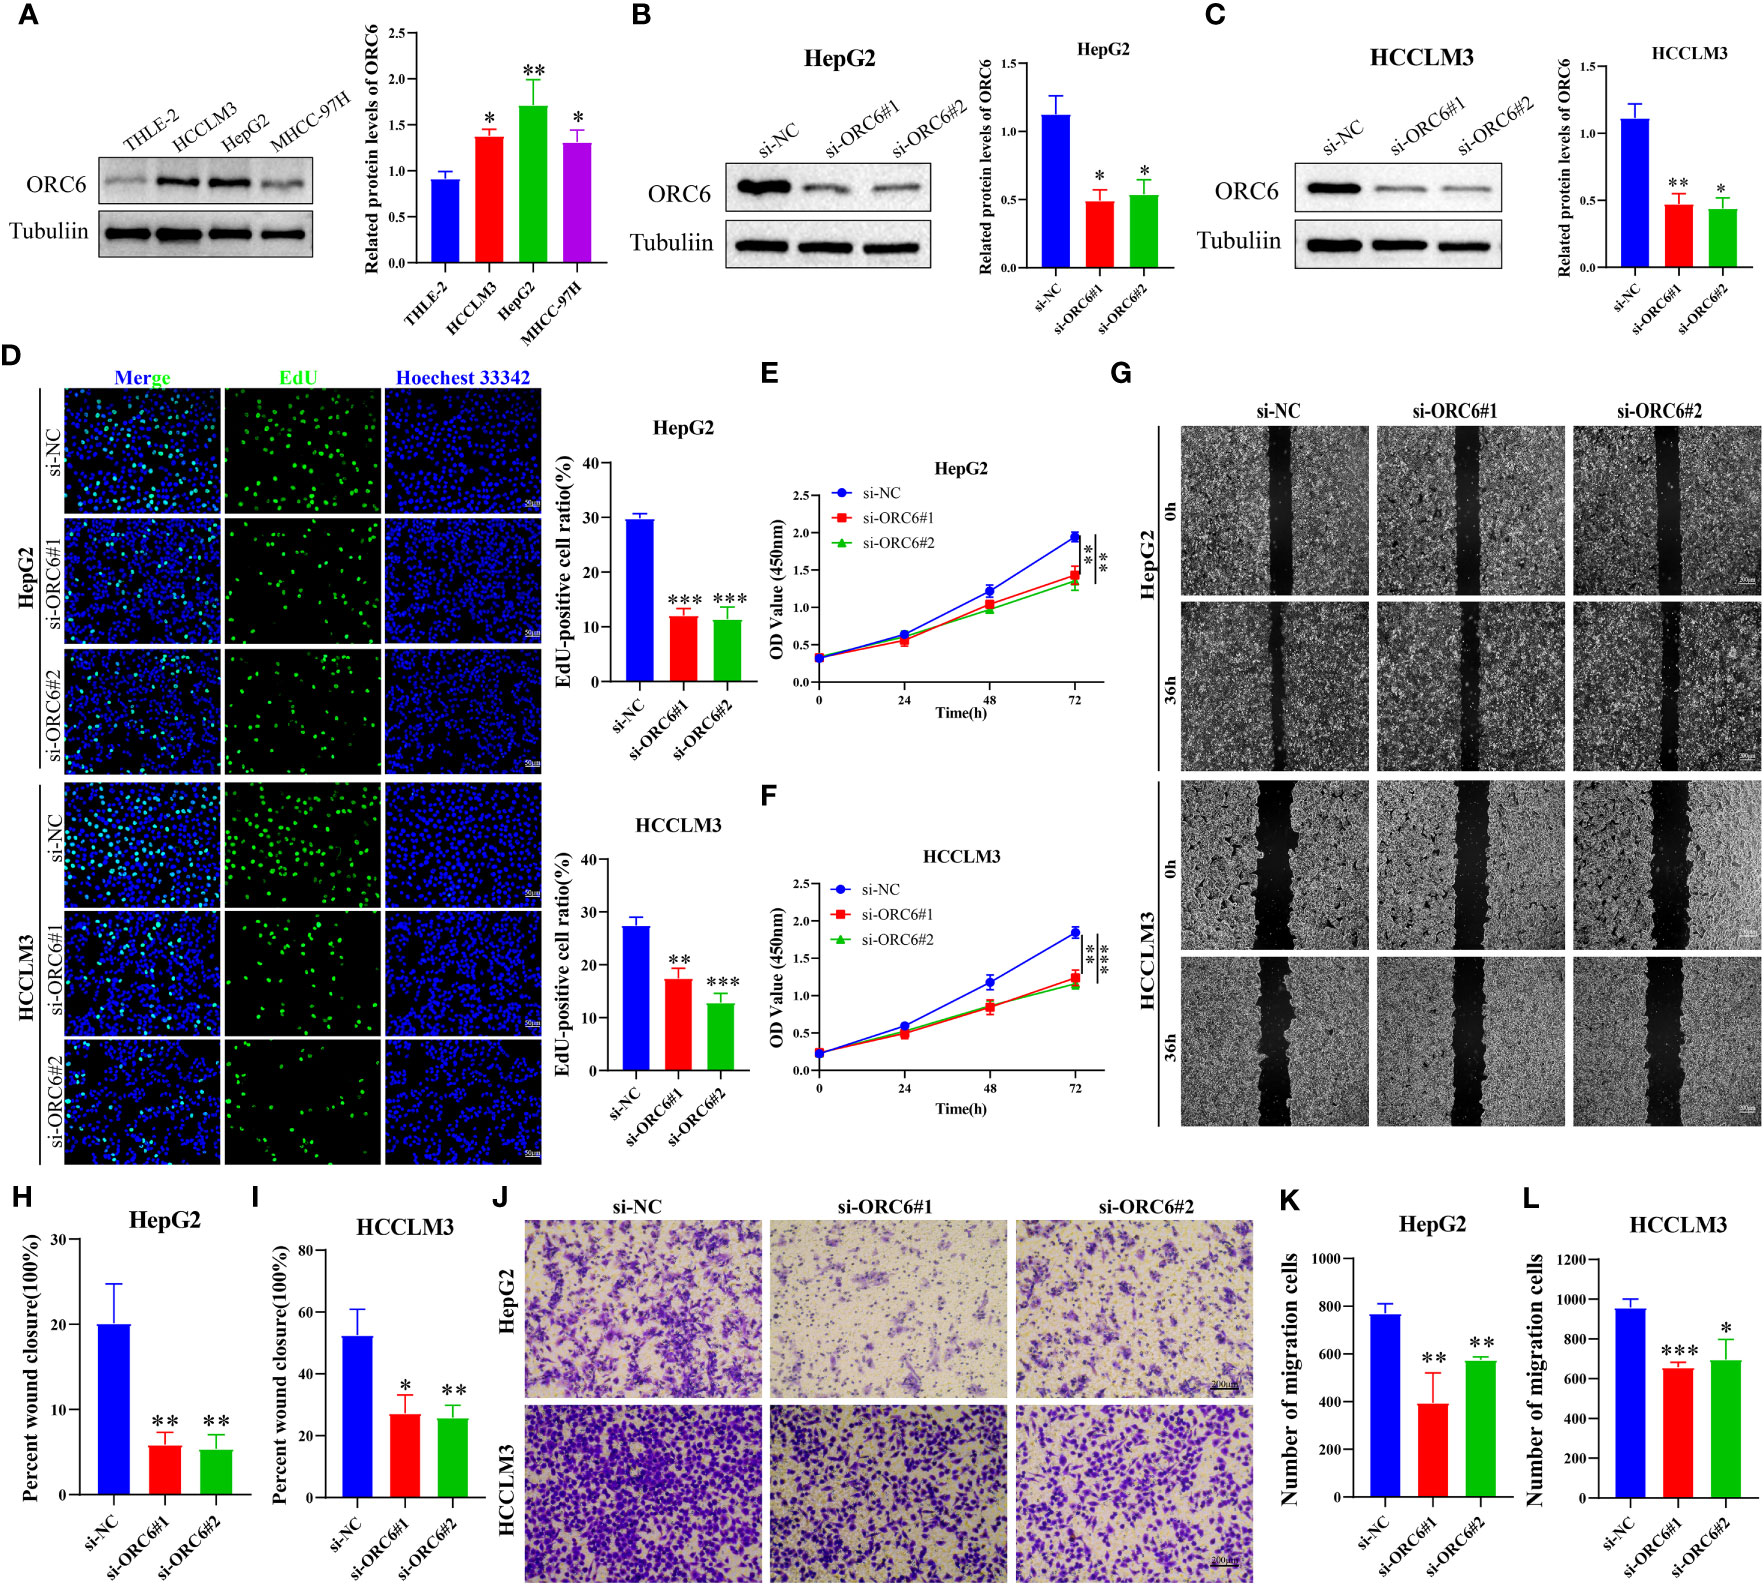
Figure 12 Silencing ORC6 expression suppresses the proliferation and migration of LIHC cells. (A) Western blot analysis and quantitative measurements of ORC6 protein levels in liver cells (THLE-2) and LIHC cells (HCCLM3, HepG2, and MHCC-97H). Western blot analysis and quantitative measurements of ORC6 knockdown efficiency in HepG2 (B) and HCCLM3 (C) cells. (D) EdU staining and quantitative analysis were performed to evaluate changes in cell proliferation following ORC6 knockdown. A CCK-8 assay was utilized to evaluate the effect of ORC6 knockdown on cell viability in HepG2 (E) and HCCLM3 (F) cells. (G–I) A wound-healing assay was used to evaluate the changes in the cell migration rate among the si-NC, si-ORC6#1, and si-ORC6#2 groups of HepG2 and HCCLM3 cells. (J–L) Transwell assays were utilized to evaluate the changes in cell migration ability among the si-NC, si-ORC6#1, and si-ORC6#2 groups in HepG2 and HCCLM3 cells. *p < 0.05, **p < 0.01, ***p < 0.001.
Subsequently, we compiled the ORC6 expression and clinical information of patients in the TCGA-GBMLGG cohort. The chi-square test revealed a significant association between ORC6 expression and age, histological type, WHO grade, IDH status, and 1p/19q codeletion in GBMLGG patients (Supplementary Table S4). Furthermore, our investigation revealed that ORC6, age, WHO grade, and 1p/19q codeletion were independent prognostic risk factors for GBMLGG patients, as confirmed by univariate and multivariate Cox regression analyses (Supplementary Table S5). Time-dependent ROC curve analysis further identified age, WHO grade, and ORC6 as the top three effective predictors for 1-, 3-, and 5-year patient survival (Figure 13A, all AUC>0.7). Our results were validated in an external cohort. As demonstrated in Figures 13B–D, ORC6 expression increased concomitantly with WHO grade in the CGGA-301, CGGA-325, and CGGA-693 cohorts. Moreover, high levels of ORC6 expression were significantly associated with an unfavorable prognosis among GBMLGG patients in the CGGA-301, CGGA-325, CGGA-693, and GSE13041 cohorts (Figures 13E–H, all p < 0.05). In addition, the expression profile of ORC6 in the GBMLGG cell line was analyzed using the CCLE database (Figure 13I). Further, the expression of ORC6 protein was effectively inhibited in U251 MG and LN229 cells (Figures 14A, B). Consistent with findings in LIHC, the inhibition of ORC6 expression led to decreased proliferation and migration of U251 MG and LN229 cells (Figures 14C–J). In conclusion, our in vitro results strengthen the evidence supporting the carcinogenic effects of ORC6 in LIHC and GBMLGG.

Figure 13 ORC6 effectively predicts the prognosis of the patients with GBMLGG. (A) Receiver operating characteristic (ROC) curves for predicting 1-, 3-, and 5-year overall survival (OS) of patients with GBMLGG. (B–D) Analysis of differential expression of ORC6 in different WHO grades explored in the CGGA-301, CGGA-325, and CGGA-693 cohorts, respectively. (E–H) Survival differences between high and low ORC6 expression groups were examined in the CGGA-301, CGGA-325, CGGA-693 and GSE13041 cohorts. (I) The Cancer Cell Line Encyclopedia (CCLE) database was used to analyze the expression of ORC6 in GBMLGG cell lines.
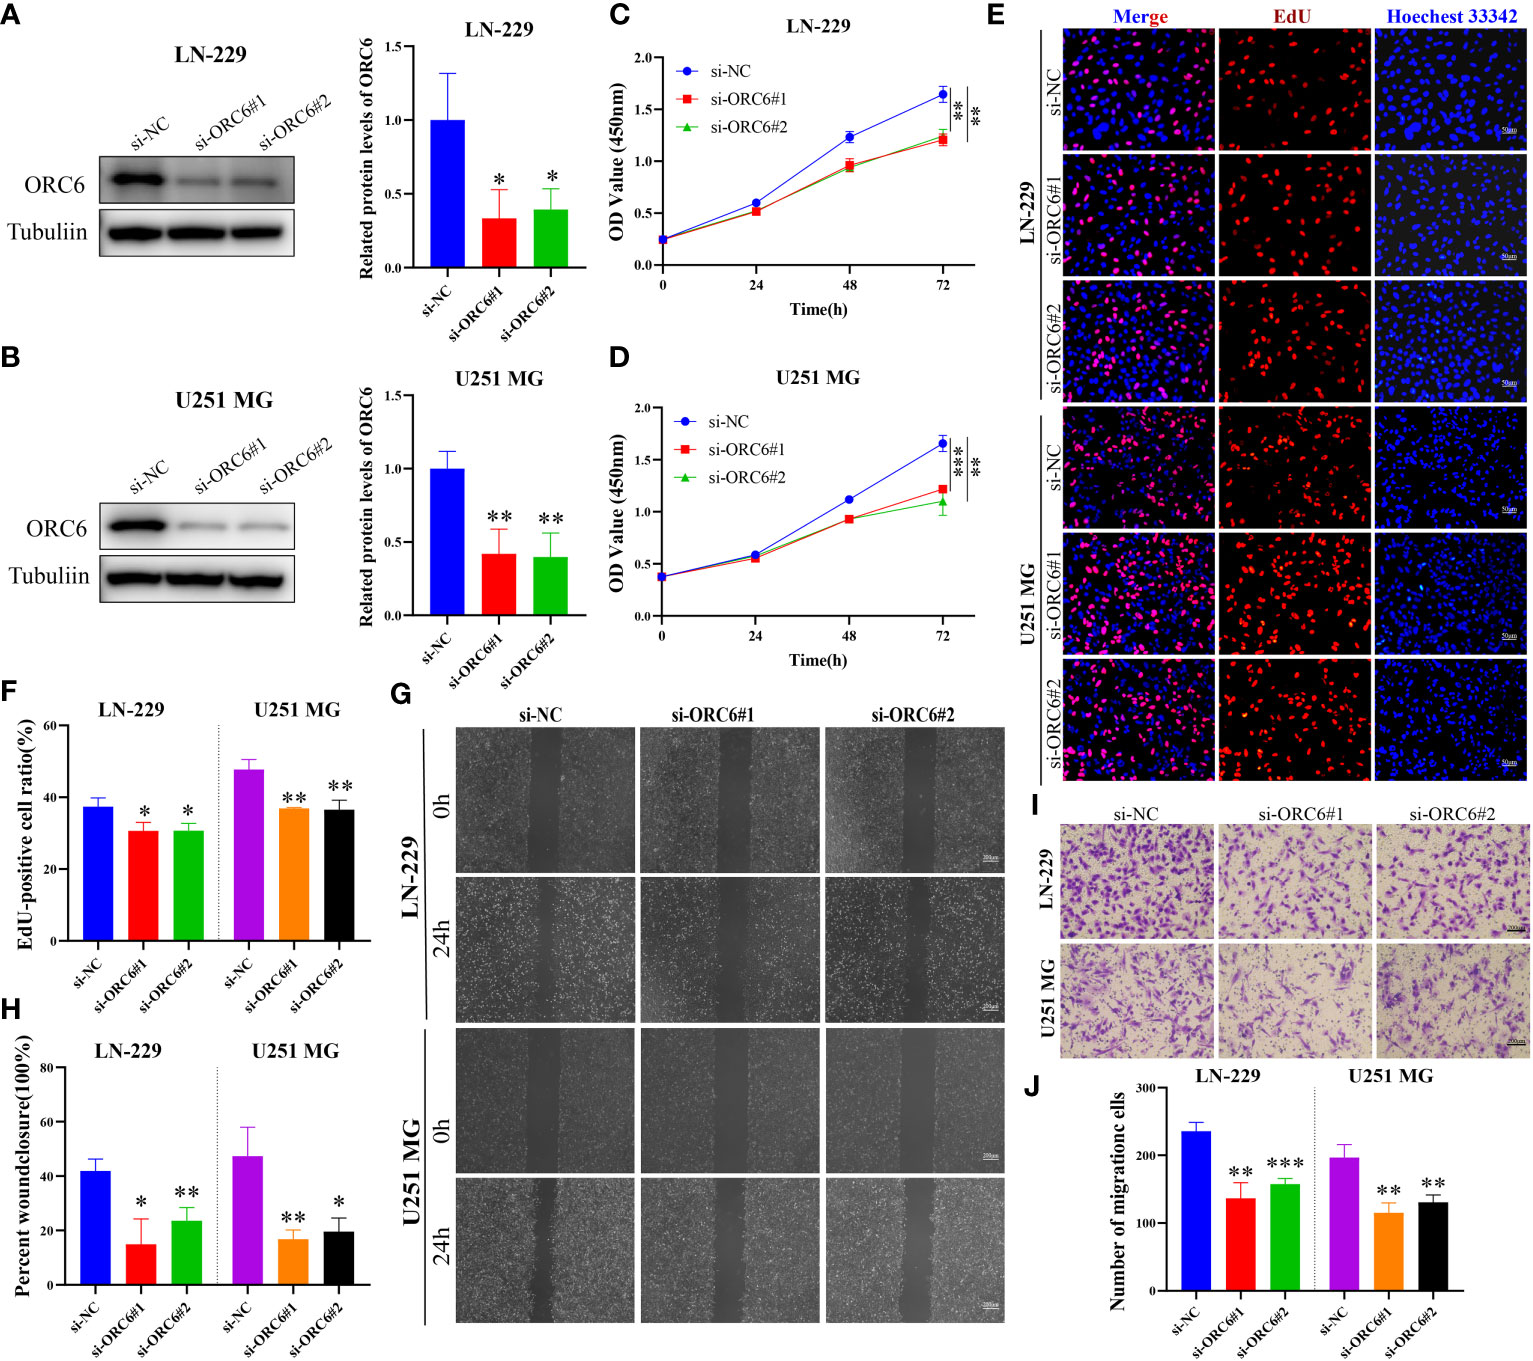
Figure 14 Knockdown of ORC6 expression suppresses proliferation and migration of GBMLGG cells. (A, B) Western blot analysis and quantitative measurements of ORC6 knockdown efficiency in LN-229 and U251 MG cells. (C, D) CCK-8 assay was used to evaluate the effect of ORC6 knockdown on cell viability in LN-229 and U251 MG cells. (E, F) EdU staining and quantitative analysis were performed to evaluate the changes in cell proliferation after ORC6 knockdown. (G, H) A wound healing assay was used to evaluate the changes in cell migration rate among the si-NC, si-ORC6#1, and si-ORC6#2 groups of LN-229 and U251 MG cells. (I, J) Transwell assays were used to evaluate the changes in cell migration ability among the si-NC, si-ORC6#1, and si-ORC6#2 groups in LN-229 and U251 MG cells. *p < 0.05, **p < 0.01, ***p < 0.001.
Multi-omics data mining analysis is crucial for exploring tumor heterogeneity and complexity and identifying prognostic biomarkers. Prior studies have linked high ORC6 expression to poor tumor prognosis, progression, and drug resistance in some cancers (33, 34), but its prognostic and biological significance in most cancer types remains unclear. We performed a comprehensive pan-cancer study of ORC6 and revealed its important role in LIHC and GBMLGG. In addition, we verified that ORC6 was highly expressed in LIHC and GBMLGG and could serve as an independent marker of poor prognosis. Further external cohort analysis and in vitro experiments supported our findings.
In this study, we observed that the expression of ORC6 was higher in most tumors than in normal tissues, as well as in paired cancer and paracancerous tissues. Next, we analyzed the correlations between ORC6 expression and clinicopathological features and discovered that ORC6 expression was positively correlated with tumor size, metastasis, histological grade, lymph node metastasis, and clinical analysis, which further implied that ORC6 expression was associated with tumor progression and metastasis. By utilizing log-rank and Cox regression analysis, it was determined that increased expression of ORC6 was significantly linked to unfavorable prognosis in various types of tumors, in concurrence with previous research (10, 34, 35). Through ROC curves, we also found that ORC6 was a highly accurate diagnostic marker for most tumor types. Single-cell functional analysis also indicated that ORC6 expression was positively correlated with the cell cycle and proliferation of tumor cells. We found that ORC6 and pathologic stage were independent prognostic risk factors for patients with LIHC. ORC6, age, WHO grade, and 1p/19q codeletion are independent risk factors for poor prognosis of GBMLGG, and this result is consistent with previous studies (36). Furthermore, the time-dependent ROC curves showed that ORC6 was more accurate than sex, histological type, IDH, and 1p/19q colocation in predicting the 1-, 3-, and 5-year survival of GBMLGG patients. After silencing ORC6 expression, we found that the proliferation and migration abilities of LIHC and GBMLGG cells were attenuated. The results of this study suggest that elevated ORC6 levels may serve as a valuable prognostic marker for adverse outcomes in most tumor types. However, the validation of this study was limited to in vitro experiments, and further in vivo studies are needed to fully explore this possibility.
Genetic alterations and altered epigenetic regulation are considered major factors in cancer development and progression (37, 38). In recent years, there has been growing recognition that RNA not only serves as an intermediary or effector molecule in protein synthesis but also plays a crucial and direct functional role in regulating gene expression. Consequently, the significance of RNA modifications has gained increasing prominence in scientific research and healthcare settings. Extensive evidence has suggested that the perturbation of RNA epigenetic pathways is associated with the development and progression of various human diseases, including cancer (39). In our study, we found that genetic alterations, DNA promoter methylation, and RNA modifications of ORC6 have important effects on its expression. The main mutation forms of ORC6 in tumors were “amplification” and “deep deletion”, and the amplification was mainly concentrated in PAAD, BRCA, OV, BLCA, ACC, ESCA, LIHC, LUAD, etc. We also noticed that ORC6 expression was markedly linked to CNV, mainly in BRCA, CESC, HNSC, LUAD, LUSC, OV, and STES. In BLCA, BRCA, HNSC, THYM, UCEC, and PRAD, as the levels of ORC6 promoter methylation were reduced compared to those in normal tissues. However, in PAAD, KIRC, LUSC, and SARC, there was a significant increase in ORC6 promoter methylation levels. Furthermore, we identified a positive correlation between ORC6 expression and m1A-, m5C-, and m6A-related genes in almost all of the analyzed tumor types. Our single-cell functional analysis also indicated a close association between ORC6 expression and DNA damage and repair mechanisms, which highlights the underlying mechanisms of aberrant ORC6 expression in cancer from both genetic alteration and epigenetic modification perspectives.
Cancer progression, metastasis, invasion, and resistance to therapy are modulated by bidirectional interactions between cancer cells and the TME (40). Characteristics of TME include hypoxia, immunosuppression, chronic inflammation, acidosis, high interstitial fluid pressure, increased ECM stiffness, and depletion of essential nutrients. Immunotherapy mainly targets hypoxia and immunosuppression, which are presently active research topics (41). Precision medicine aims to develop targeted and immunotherapies to enhance the survival rate. Cancer immunotherapy presents an effective and groundbreaking method to fight cancer by manipulating or modulating the immune system to elicit a robust response against tumors (42). Successful cancer immunotherapy depends on overcoming the immunosuppressive environment in the TME of cancer patients (43). Increasing evidence suggests that immune dysregulation plays a critical role in allowing tumors to evade the host immune system (44), involving both innate and adaptive immunity. Research has revealed that tumor-infiltrating lymphocytes tend to exhibit dysfunctional behavior and may remain in a quiescent state near cancerous cells. Despite this, a few patients’ T cells have been found to preserve their ability to proliferate and persist, leading to the complete eradication of sizable tumor deposits (45). This finding is consistent with our finding in single-cell sequencing that ORC6 is predominantly expressed on Tprolif and malignant cells. Therefore, targeting ORC6 could potentially offer a precise method for identifying Tprolif and malignant cells, leading to novel avenues for tumor immunotherapy (46). Here, we found an inverse correlation between the expression level of ORC6 and the abundance of immune cells widely believed to contribute to the suppression of tumor infiltration, including Tem CD8 cells, Th1 cells, NK cells, pDCs, iDCs, eosinophils, and monocytes (47–52). Interestingly, we noticed that ORC6 expression levels were positively correlated with the abundance of Act CD4 and Th2 cells in the TME. Act CD4 refers to activated CD4 T cells, a key component of the adaptive immune system. Recent studies have found that CD4+ T-cell infiltration defines an immune escape environment and predicts poor patient outcomes (53). Th2 refers to helper T-cell type 2, which is a specific type of T-cell in the immune system. Th2 cells play a critical role in the adaptive immune response by supporting B-cell function. Interestingly, the accumulation of Th2 cells within tumors, in addition to Hodgkin’s lymphoma, has been associated with a poor prognosis in several types of cancers (54). At present, researchers are exploring ways to regulate Th2 cells to improve the effect of tumor treatment. Regulatory T cells (Tregs) are a subset of T cells crucial for maintaining immune homeostasis and tolerance. Research suggests that several subtypes of Tregs, including TNFR2+, LAG3+, TIM3+, and CTLA-4+ Tregs, demonstrate potent anticancer capabilities. However, in recent years, researchers have also discovered links between particular highly infiltrated Treg subtypes within tumors and favorable patient outcomes, such as CD30+OX40+ and BLIMP‐1+FOXP3+ Tregs (55). This might elucidate the favorable correlation between ORC6 and Treg infiltration abundance in BRCA, KIRC, MESO, and THCA, whereas an inverse correlation exists in the majority of other tumor types.
Cancer cells can secrete important cytokines and chemokines for the TME during growth and progression (56), these cytokines and chemokines can in turn regulate the TME and cell signaling pathways to affect cancer progression (57, 58). Our study revealed a positive correlation between ORC6 expression and cytokines as well as receptors in different types of tumors. Notably, GSEA revealed a strong association between ORC6 expression and the cytokine-cytokine receptor interaction pathway, and our GSEA further highlights the close association between ORC6 and immune-related pathways in multiple tumor types. Moreover, we discovered a positive association between ORC6 expression and well-known targets for classical immune suppression and activation, such as PVR, MICB, ULBP1, CD276, CTLA4, TNFRSF25, PD-1 (PDCD1), TIGIT, PD-L2 (PDCD1LG2), HAVCR2, PD-L1 (CD274), and LAG3. Strikingly, our findings reveal that ORC6 expression has a certain predictive effect on immunotherapy, cytokine therapy, and chemotherapy response. The current use of multifunctional carriers to deliver therapeutic drugs to lesion sites helps to significantly improve the effect of noninvasive treatment. Multifunctional carriers allow for multiple treatment options, including photodynamic therapy, photothermal therapy, chemotherapy, immunotherapy, or their synergistic treatments (59). Therefore, molecular probes targeting ORC6 combined with multifunctional carriers are promising cancer treatment strategies (60). Collectively, these observations provide new insights into the complex regulation of immune cell-mediated tumor suppression and suggest that ORC6 may serve as a promising predictive marker of immunotherapy efficacy in cancer treatment. Nevertheless, the mechanisms by which ORC6 regulates the tumor immune microenvironment and tumor progression need to be further elucidated in the future.
ORC6 emerges as a promising prognostic biomarker across various cancer types, particularly in LIHC and GBMLGG. This study underscores the correlation between high ORC6 expression and the tumor immunosuppressive environment. These findings suggest a potential role for ORC6 in tumor immune regulation, thereby offering further support for advancing the development of cancer immunotherapies.
The datasets presented in this study can be found in online repositories. The names of the repository/repositories and accession number(s) can be found in the article/Supplementary Material.
Ethical approval was not required for the study involving humans in accordance with the local legislation and institutional requirements. Written informed consent to participate in this study was not required from the participants or the participants’ legal guardians/next of kin in accordance with the national legislation and the institutional requirements.
JZ conducted the formal analysis and wrote the original draft. WY performed the project administration. QC, LZ, HG, TW, YHe, and YD conducted the experiments. JX, JPang, JPeng, HG, TW, and YHan participated in software analysis. JZ, QC, LZ, and JPeng conducted data curation. JZ and WY contributed to writing, reviewing, and editing the article. WY provided funding acquisition. All authors read and approved the final submitted manuscript.
This study was funded by the Science and Technology Innovation Program of Hunan Province (Grant No.2021SK2026), the Clinical Medical Boot Technology Innovation Project of Hunan Province (Grant No. 2021SK53504), the Health and Family Planning Commission of Hunan Province (Grant No. . 2022JJ70143), the Clinical Research Special Fund of Wu Jieping Medical Foundation (Grant No. 320.6750.2022-19-29), the Tumor Clinical Research of Public Welfare of Xiaoxiang the Clinical Research (Grant No. HTSF202207275503), the Innovation Platform and Talent Plan of Hunan Province (2023SK4019) and the National Natural Science Foundation of China (Grant No. 82270834, 82000756).
The authors declare that the research was conducted in the absence of any commercial or financial relationships that could be construed as a potential conflict of interest.
All claims expressed in this article are solely those of the authors and do not necessarily represent those of their affiliated organizations, or those of the publisher, the editors and the reviewers. Any product that may be evaluated in this article, or claim that may be made by its manufacturer, is not guaranteed or endorsed by the publisher.
The Supplementary Material for this article can be found online at: https://www.frontiersin.org/articles/10.3389/fimmu.2023.1236806/full#supplementary-material
Supplementary Figure S1 | ORC6 genetic alterations, localization, and interactions. (A) Immunofluorescence images and merged images of ORC6 protein, nucleus, endoplasmic reticulum (ER), and microtubules in HEK 293 and PC-3 cell lines. (B) ORC6 expression mapping was obtained through the Genecard website. (C) Protein-protein interaction (PPI) network presenting proteins that interact with ORC6. (D) Mutation types and frequencies of ORC6 in pan-cancer were obtained from the cBioPortal website. (E) The expression levels of ORC6 in various CNV status in pan-cancer. *p < 0.05, **p < 0.01, ***p < 0.001.
Supplementary Figure S2 | ORC6 DNA methylation levels and the relationship between ORC6 and RNA-modifying gene expression. (A, B) Promoter methylation levels of ORC6 in different cancer types compared to normal adjacent tissues. Beta values represent DNA methylation levels ranging from 0 (unmethylated) to 1 (fully methylated). (C) The relationship between ORC6 expression and gene expression related to three types of RNA modifications was analyzed by Spearman correlation. *p<0.05.
Supplementary Figure S3 | Diagnostic value of ORC6 across cancers. (A-W) ROC curve of ORC6 in DLBC, GBMLGG, KICH, KIRC, KIRP, LGG, PRAD, SKCM, TGCT, THCA, and THYM.
Supplementary Figure S4 | Correlation between ORC6 expression and the functional status of 14 cancers. (A) The correlation between ORC6 expression and the functional status of 14 cancers was analyzed using single-cell sequence data from the CancerSEA database.
1. Sung H, Ferlay J, Siegel RL, Laversanne M, Soerjomataram I, Jemal A, et al. Global cancer statistics 2020: globocan estimates of incidence and mortality worldwide for 36 cancers in 185 countries. CA Cancer J Clin (2021) 71(3):209–49. doi: 10.3322/caac.21660
2. Chen F, Zhang Y, Gibbons DL, Deneen B, Kwiatkowski DJ, Ittmann M, et al. Pan-Cancer Molecular Classes Transcending Tumor Lineage across 32 Cancer Types, Multiple Data Platforms, and over 10,000 Cases. Clin Cancer Res (2018) 24(9):2182–93. doi: 10.1158/1078-0432.CCR-17-3378
3. Yamaguchi H, Hsu JM, Yang WH, Hung MC. Mechanisms regulating pd-L1 expression in cancers and associated opportunities for novel small-molecule therapeutics. Nat Rev Clin Oncol (2022) 19(5):287–305. doi: 10.1038/s41571-022-00601-9
4. Friedlaender A, Subbiah V, Russo A, Banna GL, Malapelle U, Rolfo C, et al. Egfr and her2 exon 20 insertions in solid tumours: from biology to treatment. Nat Rev Clin Oncol (2022) 19(1):51–69. doi: 10.1038/s41571-021-00558-1
5. Xia J, Li S, Liu S, Zhang L. Aldehyde dehydrogenase in solid tumors and other diseases: potential biomarkers and therapeutic targets. MedComm (2023) 4(1):e195. doi: 10.1002/mco2.195
6. Liu S, Balasov M, Wang H, Wu L, Chesnokov IN, Liu Y. Structural analysis of human orc6 protein reveals a homology with transcription factor tfiib. Proc Natl Acad Sci USA (2011) 108(18):7373–8. doi: 10.1073/pnas.1013676108
7. Prasanth SG, Prasanth KV, Stillman B. Orc6 involved in DNA replication, chromosome segregation, and cytokinesis. Science (2002) 297(5583):1026–31. doi: 10.1126/science.1072802
8. Lin YC, Liu D, Chakraborty A, Kadyrova LY, Song YJ, Hao Q, et al. Orc6 is a component of the replication fork and enables efficient mismatch repair. Proc Natl Acad Sci USA (2022) 119(22):e2121406119. doi: 10.1073/pnas.2121406119
9. Hu Y, Wang L, Li Z, Wan Z, Shao M, Wu S, et al. Potential prognostic and diagnostic values of cdc6, cdc45, orc6 and snhg7 in colorectal cancer. Onco Targets Ther (2019) 12:11609–21. doi: 10.2147/OTT.S231941
10. Pan Q, Li F, Ding Y, Huang H, Guo J. Orc6 acts as a biomarker and reflects poor outcome in clear cell renal cell carcinoma. J Cancer (2022) 13(8):2504–14. doi: 10.7150/jca.71313
11. Mao R, Wang Z, Zhang Y, Chen Y, Liu Q, Zhang T, et al. Development and validation of a novel prognostic signature in gastric adenocarcinoma. Aging (Albany NY) (2020) 12(21):22233–52. doi: 10.18632/aging.104161
12. Chen S, Jin Z, Xin L, Lv L, Zhang X, Gong Y, et al. Expression and clinical significance of origin recognition complex subunit 6 in breast cancer - a comprehensive bioinformatics analysis. Int J Gen Med (2021) 14:9733–45. doi: 10.2147/IJGM.S342597
13. Shen W, Song Z, Zhong X, Huang M, Shen D, Gao P, et al. Sangerbox: A comprehensive, interaction-friendly clinical bioinformatics analysis platform. iMeta (2022) 1(3):e36. doi: 10.1002/imt2.36
14. Mermel CH, Schumacher SE, Hill B, Meyerson ML, Beroukhim R, Getz G. Gistic2.0 facilitates sensitive and confident localization of the targets of focal somatic copy-number alteration in human cancers. Genome Biol (2011) 12(4):R41. doi: 10.1186/gb-2011-12-4-r41
15. Chandrashekar DS, Karthikeyan SK, Korla PK, Patel H, Shovon AR, Athar M, et al. Ualcan: an update to the integrated cancer data analysis platform. Neoplasia (2022) 25:18–27. doi: 10.1016/j.neo.2022.01.001
16. Huang S, Sun L, Hou P, Liu K, Wu J. A comprehensively prognostic and immunological analysis of actin-related protein 2/3 complex subunit 5 in pan-cancer and identification in hepatocellular carcinoma. Front Immunol (2022) 13:944898. doi: 10.3389/fimmu.2022.944898
17. Ru B, Wong CN, Tong Y, Zhong JY, Zhong SSW, Wu WC, et al. Tisidb: an integrated repository portal for tumor-immune system interactions. Bioinformatics (2019) 35(20):4200–2. doi: 10.1093/bioinformatics/btz210
18. Balar AV, Galsky MD, Rosenberg JE, Powles T, Petrylak DP, Bellmunt J, et al. Atezolizumab as first-line treatment in cisplatin-ineligible patients with locally advanced and metastatic urothelial carcinoma: A single-arm, multicentre, phase 2 trial. Lancet (2017) 389(10064):67–76. doi: 10.1016/S0140-6736(16)32455-2
19. Lin A, Qi C, Wei T, Li M, Cheng Q, Liu Z, et al. Camoip: A web server for comprehensive analysis on multi-omics of immunotherapy in pan-cancer. Brief Bioinform (2022) 23(3):bbac129. doi: 10.1093/bib/bbac129
20. Auslander N, Zhang G, Lee JS, Frederick DT, Miao B, Moll T, et al. Robust prediction of response to immune checkpoint blockade therapy in metastatic melanoma. Nat Med (2018) 24(10):1545–9. doi: 10.1038/s41591-018-0157-9
21. Zeng Z, Wong CJ, Yang L, Ouardaoui N, Li D, Zhang W, et al. Tismo: syngeneic mouse tumor database to model tumor immunity and immunotherapy response. Nucleic Acids Res (2022) 50(D1):D1391–D7. doi: 10.1093/nar/gkab804
22. Fu J, Li K, Zhang W, Wan C, Zhang J, Jiang P, et al. Large-scale public data reuse to model immunotherapy response and resistance. Genome Med (2020) 12(1):21. doi: 10.1186/s13073-020-0721-z
23. Geeleher P, Cox N, Huang RS. Prrophetic: an R package for prediction of clinical chemotherapeutic response from tumor gene expression levels. PloS One (2014) 9(9):e107468. doi: 10.1371/journal.pone.0107468
24. Sun D, Wang J, Han Y, Dong X, Ge J, Zheng R, et al. Tisch: A comprehensive web resource enabling interactive single-cell transcriptome visualization of tumor microenvironment. Nucleic Acids Res (2021) 49(D1):D1420–D30. doi: 10.1093/nar/gkaa1020
25. Yuan H, Yan M, Zhang G, Liu W, Deng C, Liao G, et al. Cancersea: A cancer single-cell state atlas. Nucleic Acids Res (2019) 47(D1):D900–D8. doi: 10.1093/nar/gky939
26. Zhu J, Luo C, Zhao J, Zhu X, Lin K, Bu F, et al. Expression of lox suggests poor prognosis in gastric cancer. Front Med (Lausanne) (2021) 8:718986. doi: 10.3389/fmed.2021.718986
27. Tu Z, Peng J, Long X, Li J, Wu L, Huang K, et al. Sperm autoantigenic protein 17 predicts the prognosis and the immunotherapy response of cancers: A pan-cancer analysis. Front Immunol (2022) 13:844736. doi: 10.3389/fimmu.2022.844736
28. Zhu J, Huang Q, Liu S, Peng X, Xue J, Feng T, et al. Construction of a novel lncrna signature related to genomic instability to predict the prognosis and immune activity of patients with hepatocellular carcinoma. Front Immunol (2022) 13:856186. doi: 10.3389/fimmu.2022.856186
29. Chen Z, Speck C, Wendel P, Tang C, Stillman B, Li H. The architecture of the DNA replication origin recognition complex in saccharomyces cerevisiae. Proc Natl Acad Sci USA (2008) 105(30):10326–31. doi: 10.1073/pnas.0803829105
30. Saghafinia S, Mina M, Riggi N, Hanahan D, Ciriello G. Pan-cancer landscape of aberrant DNA methylation across human tumors. Cell Rep (2018) 25(4):1066–80 e8. doi: 10.1016/j.celrep.2018.09.082
31. Helm M, Motorin Y. Detecting rna modifications in the epitranscriptome: predict and validate. Nat Rev Genet (2017) 18(5):275–91. doi: 10.1038/nrg.2016.169
32. Zhang R, Guo Y, Liu Z, Kong L, Li C, He L, et al. Identification of irf8 as an immune infiltration-related biomarker in hepatocellular carcinoma by bioinformatics analysis. MedComm (2020) (2022) 3(3):e149. doi: 10.1002/mco2.149
33. Gavin EJ, Song B, Wang Y, Xi Y, Ju J. Reduction of orc6 expression sensitizes human colon cancer cells to 5-fluorouracil and cisplatin. PloS One (2008) 3(12):e4054. doi: 10.1371/journal.pone.0004054
34. Chen H, Bao L, Hu J, Wu D, Tong X. Orc6, negatively regulated by mir-1-3p, promotes proliferation, migration, and invasion of hepatocellular carcinoma cells. Front Cell Dev Biol (2021) 9:652292. doi: 10.3389/fcell.2021.652292
35. Wang XK, Wang QQ, Huang JL, Zhang LB, Zhou X, Liu JQ, et al. Novel candidate biomarkers of origin recognition complex 1, 5 and 6 for survival surveillance in patients with hepatocellular carcinoma. J Cancer (2020) 11(7):1869–82. doi: 10.7150/jca.39163
36. Qu S, Qiu O, Hu Z. The prognostic factors and nomogram for patients with high-grade gliomas. Fundam Res (2021) 1(6):824–8. doi: 10.1016/j.fmre.2021.07.005
37. Esteller M. Cancer epigenomics: DNA methylomes and histone-modification maps. Nat Rev Genet (2007) 8(4):286–98. doi: 10.1038/nrg2005
38. Lahtz C, Pfeifer GP. Epigenetic changes of DNA repair genes in cancer. J Mol Cell Biol (2011) 3(1):51–8. doi: 10.1093/jmcb/mjq053
39. Barbieri I, Kouzarides T. Role of rna modifications in cancer. Nat Rev Cancer (2020) 20(6):303–22. doi: 10.1038/s41568-020-0253-2
40. Hanahan D, Coussens LM. Accessories to the crime: functions of cells recruited to the tumor microenvironment. Cancer Cell (2012) 21(3):309–22. doi: 10.1016/j.ccr.2012.02.022
41. Zhang S-W, Wang H, Ding X-H, Xiao Y-L, Shao Z-M, You C, et al. Bidirectional crosstalk between therapeutic cancer vaccines and the tumor microenvironment: beyond tumor antigens. Fundam Res (2022). doi: 10.1016/j.fmre.2022.03.009
42. Gao Y, Shen M, Shi X. Interaction of dendrimers with the immune system: an insight into cancer nanotheranostics. View (2021) 2(3):20200120. doi: 10.1002/VIW.20200120
43. Flavell RA, Sanjabi S, Wrzesinski SH, Licona-Limon P. The polarization of immune cells in the tumour environment by tgfbeta. Nat Rev Immunol (2010) 10(8):554–67. doi: 10.1038/nri2808
44. Lario S, Ramirez-Lazaro MJ, Sanjuan-Herraez D, Brunet-Vega A, Pericay C, Gombau L, et al. Plasma sample based analysis of gastric cancer progression using targeted metabolomics. Sci Rep (2017) 7(1):17774. doi: 10.1038/s41598-017-17921-x
45. Rosenberg SA, Restifo NP. Adoptive cell transfer as personalized immunotherapy for human cancer. Science (2015) 348(6230):62–8. doi: 10.1126/science.aaa4967
46. Zhang X, Liu X, Guo Y, Wu FG. Strategies for visualizing inflammation. View (2021) 2(1):20200025. doi: 10.1002/VIW.20200025
47. Lv B, Wang Y, Ma D, Cheng W, Liu J, Yong T, et al. Immunotherapy: reshape the tumor immune microenvironment. Front Immunol (2022) 13:844142. doi: 10.3389/fimmu.2022.844142
48. van der Leun AM, Thommen DS, Schumacher TN. Cd8(+) T cell states in human cancer: insights from single-cell analysis. Nat Rev Cancer (2020) 20(4):218–32. doi: 10.1038/s41568-019-0235-4
49. Vinay DS, Ryan EP, Pawelec G, Talib WH, Stagg J, Elkord E, et al. Immune evasion in cancer: mechanistic basis and therapeutic strategies. Semin Cancer Biol (2015) 35 Suppl:S185–S98. doi: 10.1016/j.semcancer.2015.03.004
50. Verneau J, Sautes-Fridman C, Sun CM. Dendritic cells in the tumor microenvironment: prognostic and theranostic impact. Semin Immunol (2020) 48:101410. doi: 10.1016/j.smim.2020.101410
51. Chusid MJ. Eosinophils: friends or foes? J Allergy Clin Immunol Pract (2018) 6(5):1439–44. doi: 10.1016/j.jaip.2018.04.031
52. Ugel S, Cane S, De Sanctis F, Bronte V. Monocytes in the tumor microenvironment. Annu Rev Pathol (2021) 16:93–122. doi: 10.1146/annurev-pathmechdis-012418-013058
53. Gu Y, Chen Y, Jin K, Cao Y, Liu X, Lv K, et al. Intratumoral cd103(+)Cd4(+) T cell infiltration defines immunoevasive contexture and poor clinical outcomes in gastric cancer patients. Oncoimmunology (2020) 9(1):1844402. doi: 10.1080/2162402X.2020.1844402
54. Fridman WH, Pages F, Sautes-Fridman C, Galon J. The immune contexture in human tumours: impact on clinical outcome. Nat Rev Cancer (2012) 12(4):298–306. doi: 10.1038/nrc3245
55. Jiang Z, Zhu H, Wang P, Que W, Zhong L, Li XK, et al. Different subpopulations of regulatory T cells in human autoimmune disease, transplantation, and tumor immunity. MedComm (2020) (2022) 3(2):e137. doi: 10.1002/mco2.137
56. Hinshaw DC, Shevde LA. The tumor microenvironment innately modulates cancer progression. Cancer Res (2019) 79(18):4557–66. doi: 10.1158/0008-5472.CAN-18-3962
57. Mantovani A, Allavena P, Sica A, Balkwill F. Cancer-related inflammation. Nature (2008) 454(7203):436–44. doi: 10.1038/nature07205
58. Liotta LA, Kohn EC. The microenvironment of the tumour-host interface. Nature (2001) 411(6835):375–9. doi: 10.1038/35077241
59. Bian Y, Wang Y, Chen X, Zhang Y, Xiong S, Su D. Image-guided diagnosis and treatment of glioblastoma. View (2023) 4(3):20220069. doi: 10.1002/VIW.20220069
Keywords: Orc6, pan-cancer, prognosis, immunotherapy, tumor microenvironment
Citation: Zhu J, Chen Q, Zeng L, Gao H, Wu T, He Y, Xu J, Pang J, Peng J, Deng Y, Han Y and Yi W (2023) Multi-omics analysis reveals the involvement of origin recognition complex subunit 6 in tumor immune regulation and malignant progression. Front. Immunol. 14:1236806. doi: 10.3389/fimmu.2023.1236806
Received: 08 June 2023; Accepted: 29 September 2023;
Published: 12 October 2023.
Edited by:
Takaji Matsutani, Repertoire Genesis, Inc., JapanCopyright © 2023 Zhu, Chen, Zeng, Gao, Wu, He, Xu, Pang, Peng, Deng, Han and Yi. This is an open-access article distributed under the terms of the Creative Commons Attribution License (CC BY). The use, distribution or reproduction in other forums is permitted, provided the original author(s) and the copyright owner(s) are credited and that the original publication in this journal is cited, in accordance with accepted academic practice. No use, distribution or reproduction is permitted which does not comply with these terms.
*Correspondence: Wenjun Yi, eWl3ZW5qdW5AY3N1LmVkdS5jbg==
Disclaimer: All claims expressed in this article are solely those of the authors and do not necessarily represent those of their affiliated organizations, or those of the publisher, the editors and the reviewers. Any product that may be evaluated in this article or claim that may be made by its manufacturer is not guaranteed or endorsed by the publisher.
Research integrity at Frontiers
Learn more about the work of our research integrity team to safeguard the quality of each article we publish.