
95% of researchers rate our articles as excellent or good
Learn more about the work of our research integrity team to safeguard the quality of each article we publish.
Find out more
ORIGINAL RESEARCH article
Front. Immunol. , 25 August 2023
Sec. Cancer Immunity and Immunotherapy
Volume 14 - 2023 | https://doi.org/10.3389/fimmu.2023.1227593
This article is part of the Research Topic Studying Novel Immune Signatures, Targets, and Drugs in Hepatobiliary Tumors: Based On Advanced Technologies View all 7 articles
 Ensi Ma1,2†
 Jianhua Li1,2†
 Conghuan Shen1,2†
 Yange Gu1,2Xinju Zhang3
 Li Li1,2
 Jing Zhao4*
 Zhengxin Wang1,2*
Background: N6-methyladenosine (m6A) is the most abundant epitranscriptomic modification of RNA, which can affect RNA metabolism and protein translation. The m6A modification plays a critical role in cancer development, including hepatocellular carcinoma (HCC). Despite several m6A-related signatures in HCC, most of them lack the necessary validation and the reliability is still elusive.
Methods: Differentially expressed genes (DEGs) in the Cancer Genome Atlas were comprehensively analyzed to identify m6A signature associated with HCC prognosis. Gene set enrichment analysis, tumor mutation burden (TMB), immune infiltration, and therapeutic response were evaluated. Importantly, mass spectrometry proteomics and multiplex immunofluorescence assays were performed for validation.
Results: The m6A-related protein-coding gene signature was established, which can divide HCC into high-/low-risk subgroups with markedly different overall survival (OS) and clinical stages. Furthermore, we validated its reliability and robustness in our 101 independent HCC specimens using proteomic detection and confirmed that our signature readily identified high-risk HCC patients with 3-year survival rates of 44.1% vs. 71.8% in the low-risk group. Functional analysis indicated that the high-risk group might stimulate the cell cycle and activate oncogenic pathways such as MAPK, mTOR, and VEGF, whereas the low-risk group mainly regulated amino acid, fatty acid, and drug metabolism. Additionally, the high-risk group had more TMB, upregulated immune checkpoint molecule expression, including PD-1, CTLA4, TIM3, and LAG3, and preferentially formed an immunosuppressive microenvironment. Accordingly, potential therapeutic responses showed that high-risk patients were potentially sensitive to inhibitors targeting the cell cycle and MAPK signaling, with patients possibly benefiting from immunotherapy. Moreover, multiplex immunofluorescence assays indicated that high-risk HCC samples displayed distinct immunosuppressive features, with abundant M2-polarized macrophages and T-regulatory cell infiltration.
Conclusion: The m6A signature had a prominent capacity to evaluate OS and characterize the tumor immune microenvironment of HCC, which may serve as a useful approach for risk stratification management and provide a valuable clue to choosing rational therapeutic strategies.
Globally, hepatocellular carcinoma (HCC) is the sixth most common malignancy and the fourth leading cause of cancer-associated death (1). Multiple regimens, including targeted-, chemo-, and immune-therapies, have been approved for HCC treatment (2, 3); however, overall prognosis and survival rates for patients with HCC remain dismal, with approximately 781,000 HCC deaths every year (1). Therefore, effective approaches must be developed to identify patients with poor prognoses. For high-risk HCC subgroups, better clinical management and rational treatment strategies are required to improve overall prognosis rates.
Currently, because of ongoing advancements in new cancer detection technologies, N6-methyladenosine (m6A) modifications of RNA molecules (4), which exert significant effects on RNA stability, export, splicing, or translation (5), have come to prominence. The m6A modification is catalyzed by an installed complex composed of multiple methyltransferases as “writers,” m6A RNA-binding proteins as “readers,” and demethylases as “erasers.” The well-established m6A writer methyltransferases include methyltransferase-like 3 (METTL3), METTL14, Wilms’ tumor 1-associating protein (WTAP), RNA-binding motif protein 15 (RBM 15), and zinc finger CCCH-type containing 13 (ZC3H13). These methyltransferases are responsible for adding methylated units to target RNA. m6A modification is a dynamically reversible process that can be removed by RNA demethylases, the fat mass and obesity-associated protein (FTO), and alkB homolog 5 (ALKBH5). The m6A-modified RNA can be recognized by various RNA-binding protein “readers” to determine RNA fate, including YTHDC1, YTHDF1/2/3, insulinlike growth factor mRNAbinding protein family (IGFBP1/2/3), and RBMX (6).
Accumulating evidence demonstrates that m6A modification has critical roles in malignant cancer evolution and is highly topical in the cancer biology field (7–12). Many studies have delineated how m6A modification regulates HCC development. For instance, the “writer” METTL14 mediates m6A-mediated EGFR methylation, thereby suppressing EGFR/PI3K/AKT activity and inhibiting epithelial–mesenchymal transition and metastasis in HCC (13). The m6A “reader” YTHDF1 promotes HCC cell autophagy by binding with m6A-modified ATG2A and ATG14 mRNAs to increase their translation rates under hypoxia (14). The “eraser” FTO is also involved in HCC progression and modulates cancer stem cell properties by demethylating SOX2, KLF4, and NANOG mRNAs (15). Given the important regulatory function of m6A modification, m6A-related genes may have promising molecular profiles for patient stratification. Recently, several m6A-related gene signatures were identified in different cancers, including HCC (16–20). However, most signatures lacked validation data in independent cohorts; thus, their reliability and robustness remain elusive.
In this study, we identified and validated an m6A-related protein-coding gene signature that could be used to indicate prognosis, characterize the tumor immune microenvironment, and predict potential treatment efficacy for patients with HCC. Our findings may provide risk stratification management and rational therapeutic strategies for high-risk HCC patients.
Raw gene expression data from HCC and the corresponding clinical information were extracted from the Cancer Genome Atlas (TCGA) database (https://portal.gdc.cancer.gov/). Transcript data from 374 tumor specimens and 50 normal specimens were included. HTseq counts were normalized based on the transcripts per million (TPM) method.
The exclusion criteria were as follows: (i) histologic diagnosis ruled out HCC; (ii) extremely low gene expression values; and (iii) incomplete clinical data and a follow-up time<30 days. ID conversion was conducted by Perl (Perl Programming Language version 5.30.1)
To generate the m6A-related signature and quantify the m6A modification patterns of each patient, we aimed to construct a scoring system (called m6AScore) and assess all individuals with HCC.
Initially, we conducted consensus clustering analysis using the ConsensusClusterPlus package (21) in R statistical software (version 4.1.3, https://www.r-project.org/). Steps included data preparation with gene expression data from TCGA or other sources, applying preprocessing techniques, selecting the ConsensusClusterPlus algorithm, determining the optimal number of clusters using the scree plot, and interpreting cluster results through gene functional analysis, pathway enrichment, and correlation analysis with clinical features.
Then, the overlapped differentially expressed genes (DEGs) were obtained by Venn diagrams. Next, the prognostic value of protein-coding DEGs of the distinct m6A modification patterns was determined using Cox proportional hazards regression analysis. Moreover, the protein-coding DEGs with significant prognostic value were included in calculating the m6AScore. Given the prognostic protein-coding DEGs in HCC, principal component analysis (PCA) was then performed to establish the m6AScore. PCA is a dimension reduction method and has been extensively used in gene expression analysis (19, 22). Similar to a previous study, we added principal components (PC) 1 and 2 as the last gene signature scores.
Where i and j are the order and the total number of m6A-related prognostic protein coding in HCC. Finally, the Z-score of the m6AScore was used for further analysis.
For different clusters, the outstanding gene ontology (GO) terms and Kyoto Encyclopedia of Genes and Genomes (KEGG) pathways were identified and visualized by bubble diagrams.
In total, an independent cohort of 101 patients with HCC was enrolled at Huashan Hospital, Fudan University, between March 2015, and June 2020. None of the patients received radiotherapy or chemotherapy before surgery. Each patient provided informed consent. The study protocol was approved by the Human Research Ethics Committee of Huashan Hospital, Fudan University. Basic information about the samples is listed in the Supplementary Materials (Tables S4, S5).
Copy number variation (CNV) data were downloaded from the TCGA database. Gene mutation data were also downloaded from the TCGA database, and gene mutations were identified in the high-/low-m6AScore groups. Moreover, the tumor mutation burden (TMB) of each sample was calculated via a Perl script (https://www.perl.org/). TMB was defined as the total number of mutations per megabase in the tumor tissue.
GSEA is a computational method that can execute GO and KEGG analyses with a given gene list. GSEA software version 4.2.3 (https://www.gsea-msigdb.org/) was employed to predict the potential functions of the m6A-related signature. Combined with the high- and low-risk groups determined by the m6AScore, GO and KEGG pathway enrichment analyses were conducted to visualize various genes involved in different pathways, biological functions, and their expression patterns. Data were corrected for multiple testing (number of permutations = 1000).
The R package of pRRophetic was used to predict the sensibility of common chemotherapeutic agents, as previously described (23). Sensibility indicates the effectiveness of a substance in inhibiting specific biological or biochemical functions. The group difference was tested by the Wilcoxon signed-rank test.
Gene signature analysis of T-cell dysfunction and prediction of cancer immunotherapy response by patients with cancer were performed using the tumor immune dysfunction and exclusion (TIDE) algorithm as previously described (24). TIDE utilized both T-cell dysfunction and exclusion signatures to model immune escape in tumors with different cytotoxic T lymphocyte levels, and the TIDE score is consistent with signatures of tumor immune evasion. A higher tumor TIDE score is associated with a worse immune checkpoint blockade response.
By performing single-sample gene set enrichment analysis (ssGSEA) (25), the immune function scores of each patient with HCC were calculated to further quantify the composition of tumor-infiltrating immune cells. According to the immune score, the degree of immune cell infiltration was quantified in HCC tissues. Immunocyte gene signatures enrolled in this study are listed in Table S6.
Proteomic detection was performed in four steps: protein isolation from formalin-fixed paraffin-embedded tumor samples, protein digestion, peptide sequencing by MS, and data analysis to identify the proteins.
The details of the processing of the raw files generated by MS are as follows: MS raw files were searched in the NCBI Human Refseq database using the Mascot search engine (v2.3, Matrix Science Inc.; version 04-07-2013, total 32015 entries). The parent and daughter ion mass deviations were set at 20 and 50 ppm, respectively (QExactive HF) or 0.5 Da. The theoretical protein cleavage sites were arginine (R) and lysine (K), with a maximum of two missed cleavage sites allowed. Carbamidomethylation (C) for immobilization and acetyl (protein N-term) and oxidation (M) for dynamic modifications. All the identified peptides were obtained from the area under the MS1 peak calculation, and the peptide false discovery rate was controlled at 1%. At the protein characterization level, we only kept those proteins that contained at least one unique peptide and two high-quality peptides (strict peptide, i.e., Mascot Ion Score >20). For protein quantification, we used an intensity-based absolute quantification algorithm (i.e., iBAQ algorithm) and subsequently normalized each iBAQ value to FOT-iBAQ values. This was performed by dividing the iBAQ value by the sum of the iBAQ of all detected proteins in the corresponding sample. Then, to make this FOT size easier to read and write, this FOT value was multiplied by 105, resulting in the iFOT value.
The proteome sequencing of 101 HCC specimens obtained from the General Surgery Department of Huashan Hospital, Fudan University, was performed by the National Institute of Metrology (China) as described above. The sample quality control and the protein profile expression involved in this study have been shown in Figures. S1, S2 in Supplementary Material.
After the paraffin sections were dewaxed in water, the slides were immersed in citric acid antigen repair buffer and boiled in water for antigen repair. The sample was incubated with 3% H2O2 at room temperature before rinsing with phosphate-buffered saline (PBS). The solution was closed with 5% FBS at 37°C for 30 min and then incubated with the primary antibody at 4°C overnight. The sample was rinsed with PBS, incubated with Cy5/Sp Green-labeled secondary antibodies at 37°C, and then rinsed again with PBS. The solution was then incubated with Hoechst at room temperature for 15 min, and serial staining was performed repetitively by stripping off previous primary/secondary antibodies via microwave treatment.
The Kaplan–Meier analysis with the log-rank test was performed to compare the survival difference between the high-/low-risk HCC groups. Data were tested for normal distribution, and if normally distributed, the Student’s t-test was used or the nonparametric Mann–Whitney U-test was applied unless stated otherwise. Correlations were assessed according to the Pearson test for parametric data and the Spearman test for nonparametric data. All statistical analyses were conducted using Prism (version 8, https://www.graphpad-prism.cn/) and R statistical software (version 4.1.3, https://www.r-project.org/). A P-value of<0.05 denoted a statistically significant difference (*P< 0.05; **P< 0.01, and *** P< 0.001).
The TCGA database, which includes detailed clinical information on 33 cancer types, is regarded as the landmark of cancer genomics programs. To identify the m6A-related signature in HCC, we downloaded all the raw gene expression data of 374 patients with HCC from the TCGA database. After carefully checking the clinical information of each sample, 31 patients were excluded because of incomplete clinical data or a follow-up time of less than 30 days. Ultimately, 343 patients with reliable transcript data and detailed clinical information were enrolled in the study. Through literature reports, 15 well-established m6A regulatory genes (METTL3, METTL14, WTAP, ZC3H13, RBM15, YTHDC1, YTHDF1, YTHDF2, YTHDF3, IGFBP1, IGFBP2, IGFBP3, RBMX, FTO, and ALKBH5) were used for further analysis. The whole analysis process was summarized as a flowchart in Figure 1.
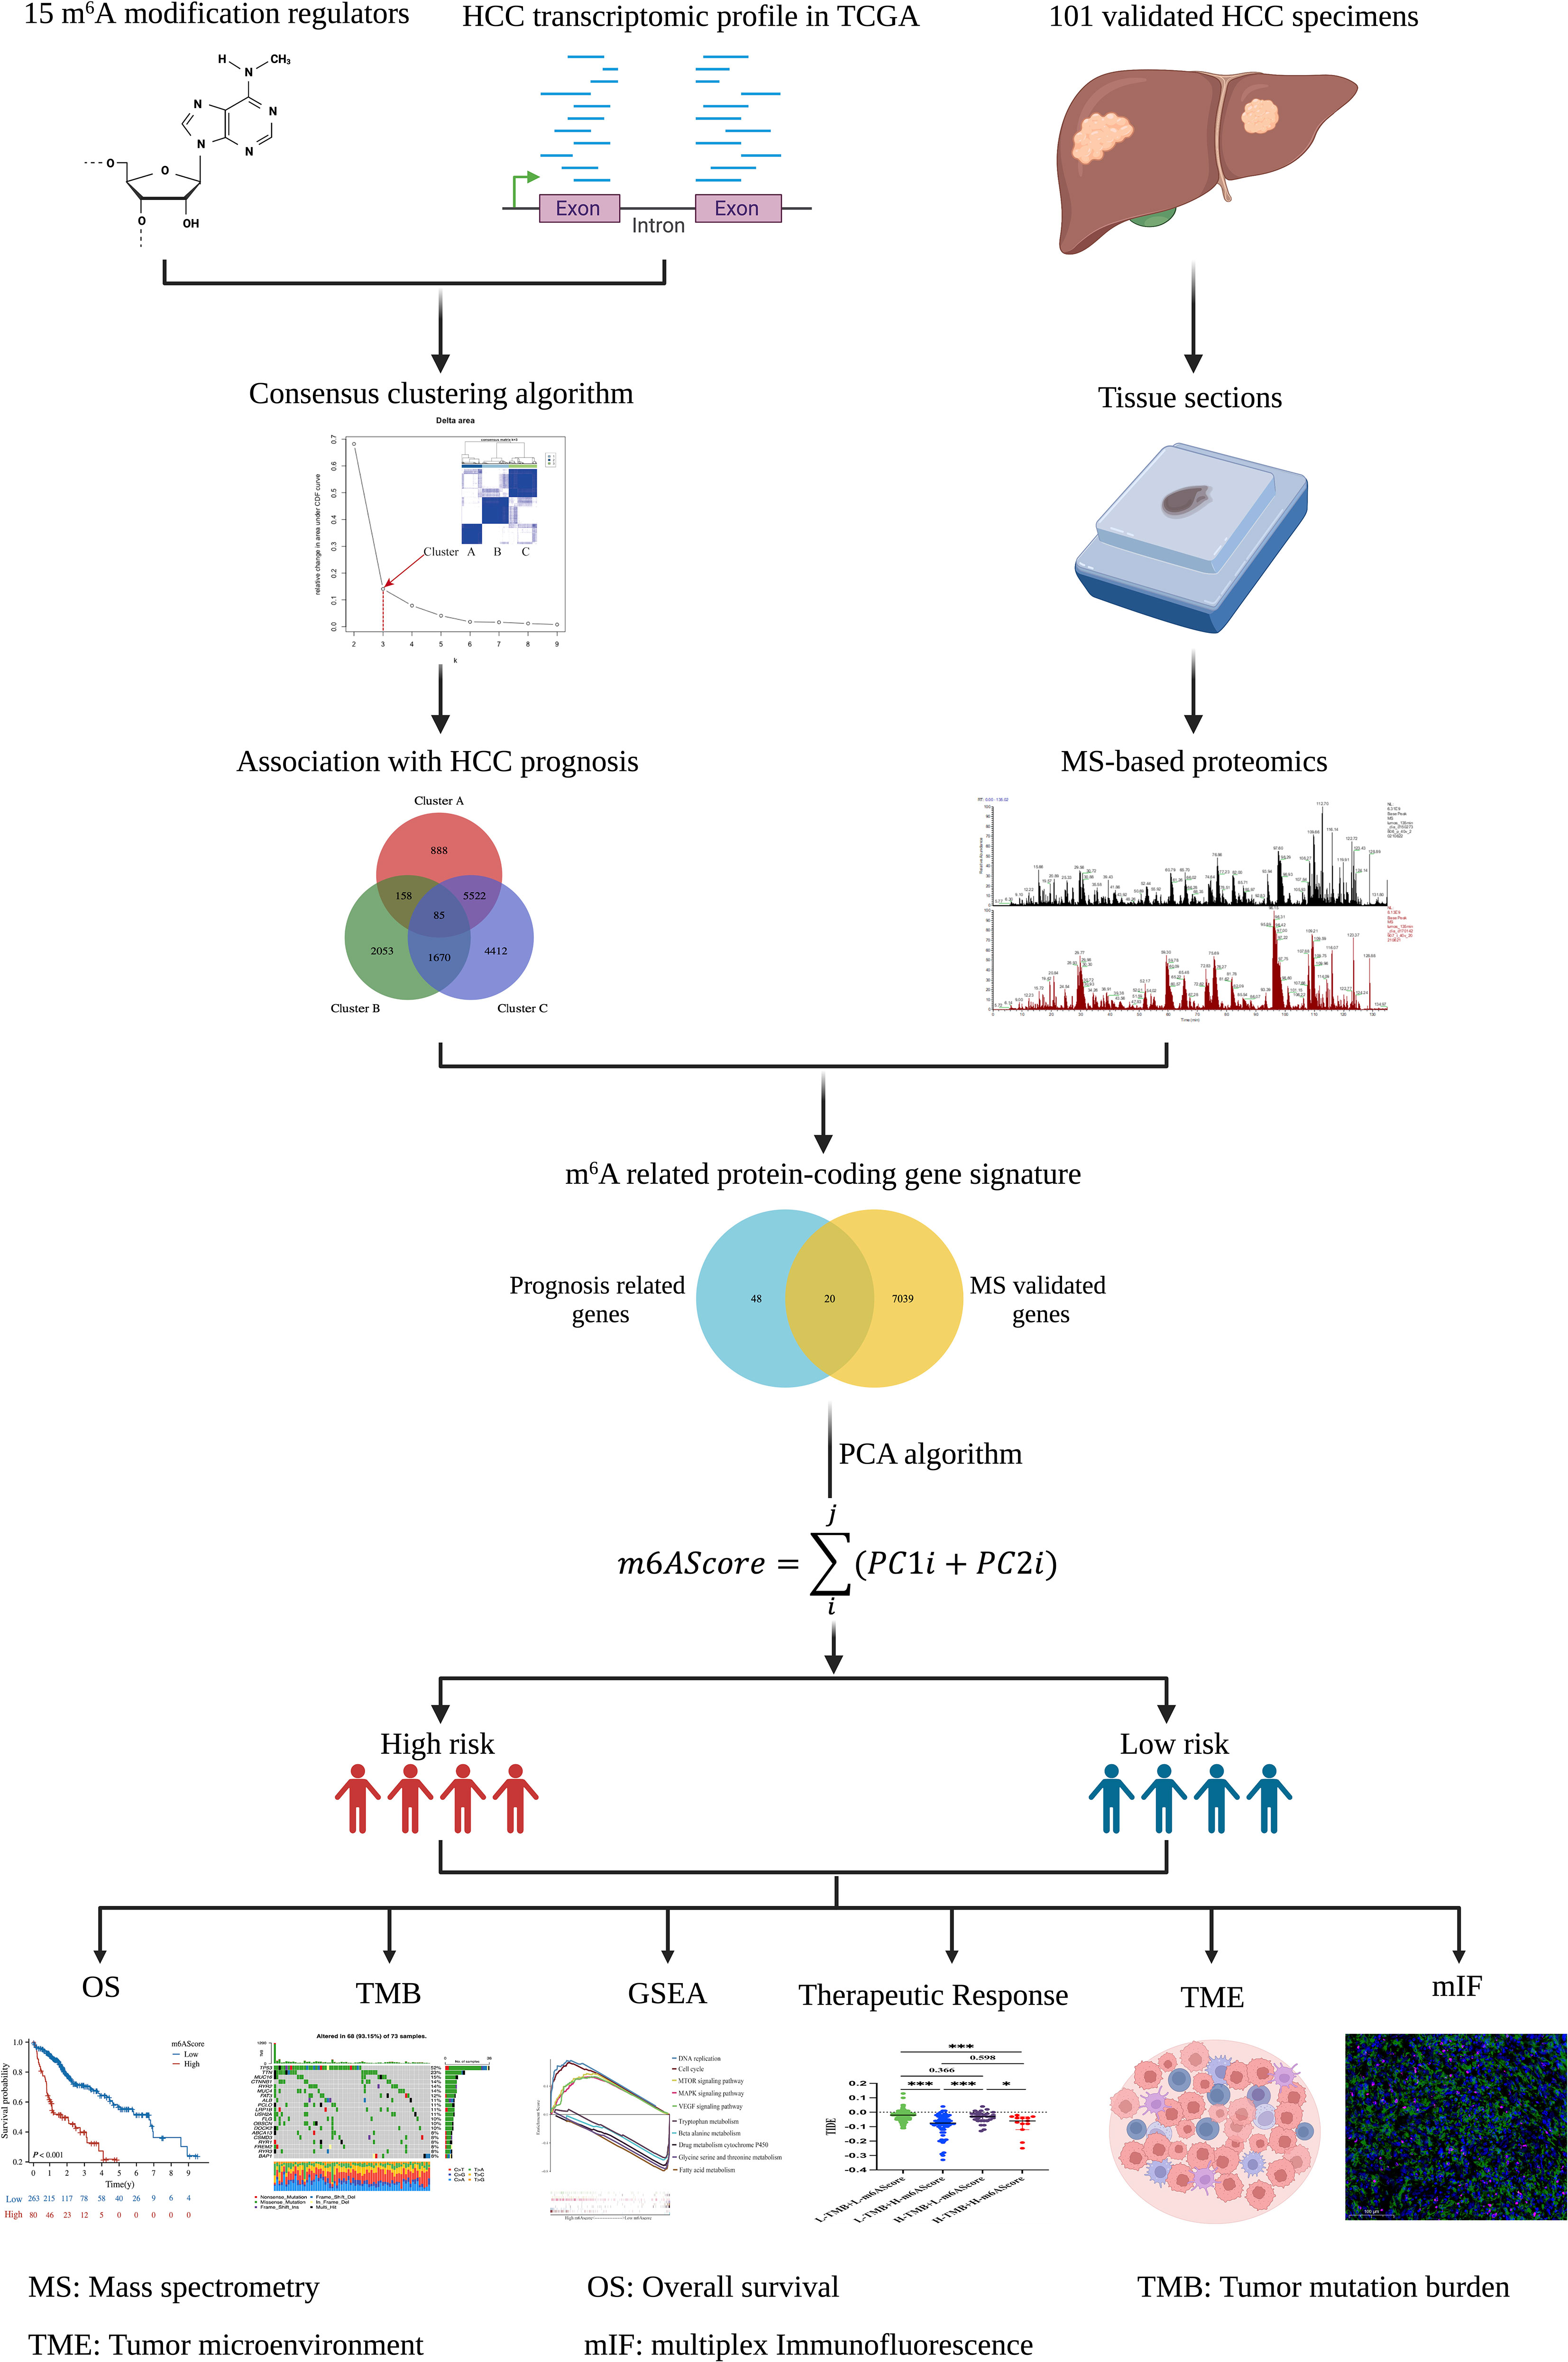
Figure 1 Flowchart of establishing the m6A-related protein-coding gene signature in HCC. The schematic diagrams were created with the help of BioRender.
Univariate Cox regression analysis of the gene expression level revealed that 11 of the 15 m6A regulators were significantly correlated with HCC prognosis, whereas METTL14, IGFBP1/2, and ALKBH5 failed to reach statistical association (Figure 2A). According to the consensus algorithm with the 11 m6A regulators, the slope of the scree plot sharply declined when the abscissa was k = 3, suggesting that the patients could be divided into three categories for better cluster presentation (Figure 2B). GO and KEGG analyses showed that each cluster displayed different features (Figure 2C). Cluster A was closely associated with RNA processing and splicing (Figure 2C, left panel). Cluster B was involved in histone modification and ribosome assembly (Figure 2C, middle panel). Cluster C was mainly enriched in extracellular structure, collagen matrix, and integrin binding (Figure 2C, right panel). There were 85 DEGs overlapped in the three clusters (Table S1), and 68 of these DEGs were significantly associated with HCC prognosis (Figure 2D, left panel). DEGs are listed in Table S2. Given that protein-coding genes are major executors of biological function, we performed proteomic detection using MS assays on 101 HCC samples at our center. In total, 7059 protein expression were successfully detected using this approach. Subsequently, 68 prognosis-related genes were intersected with MS-detected genes, and 20 protein-coding genes were eventually defined as m6A-related signatures for analysis (Figure 2D, right panel). Their coefficients are listed in Table S3.
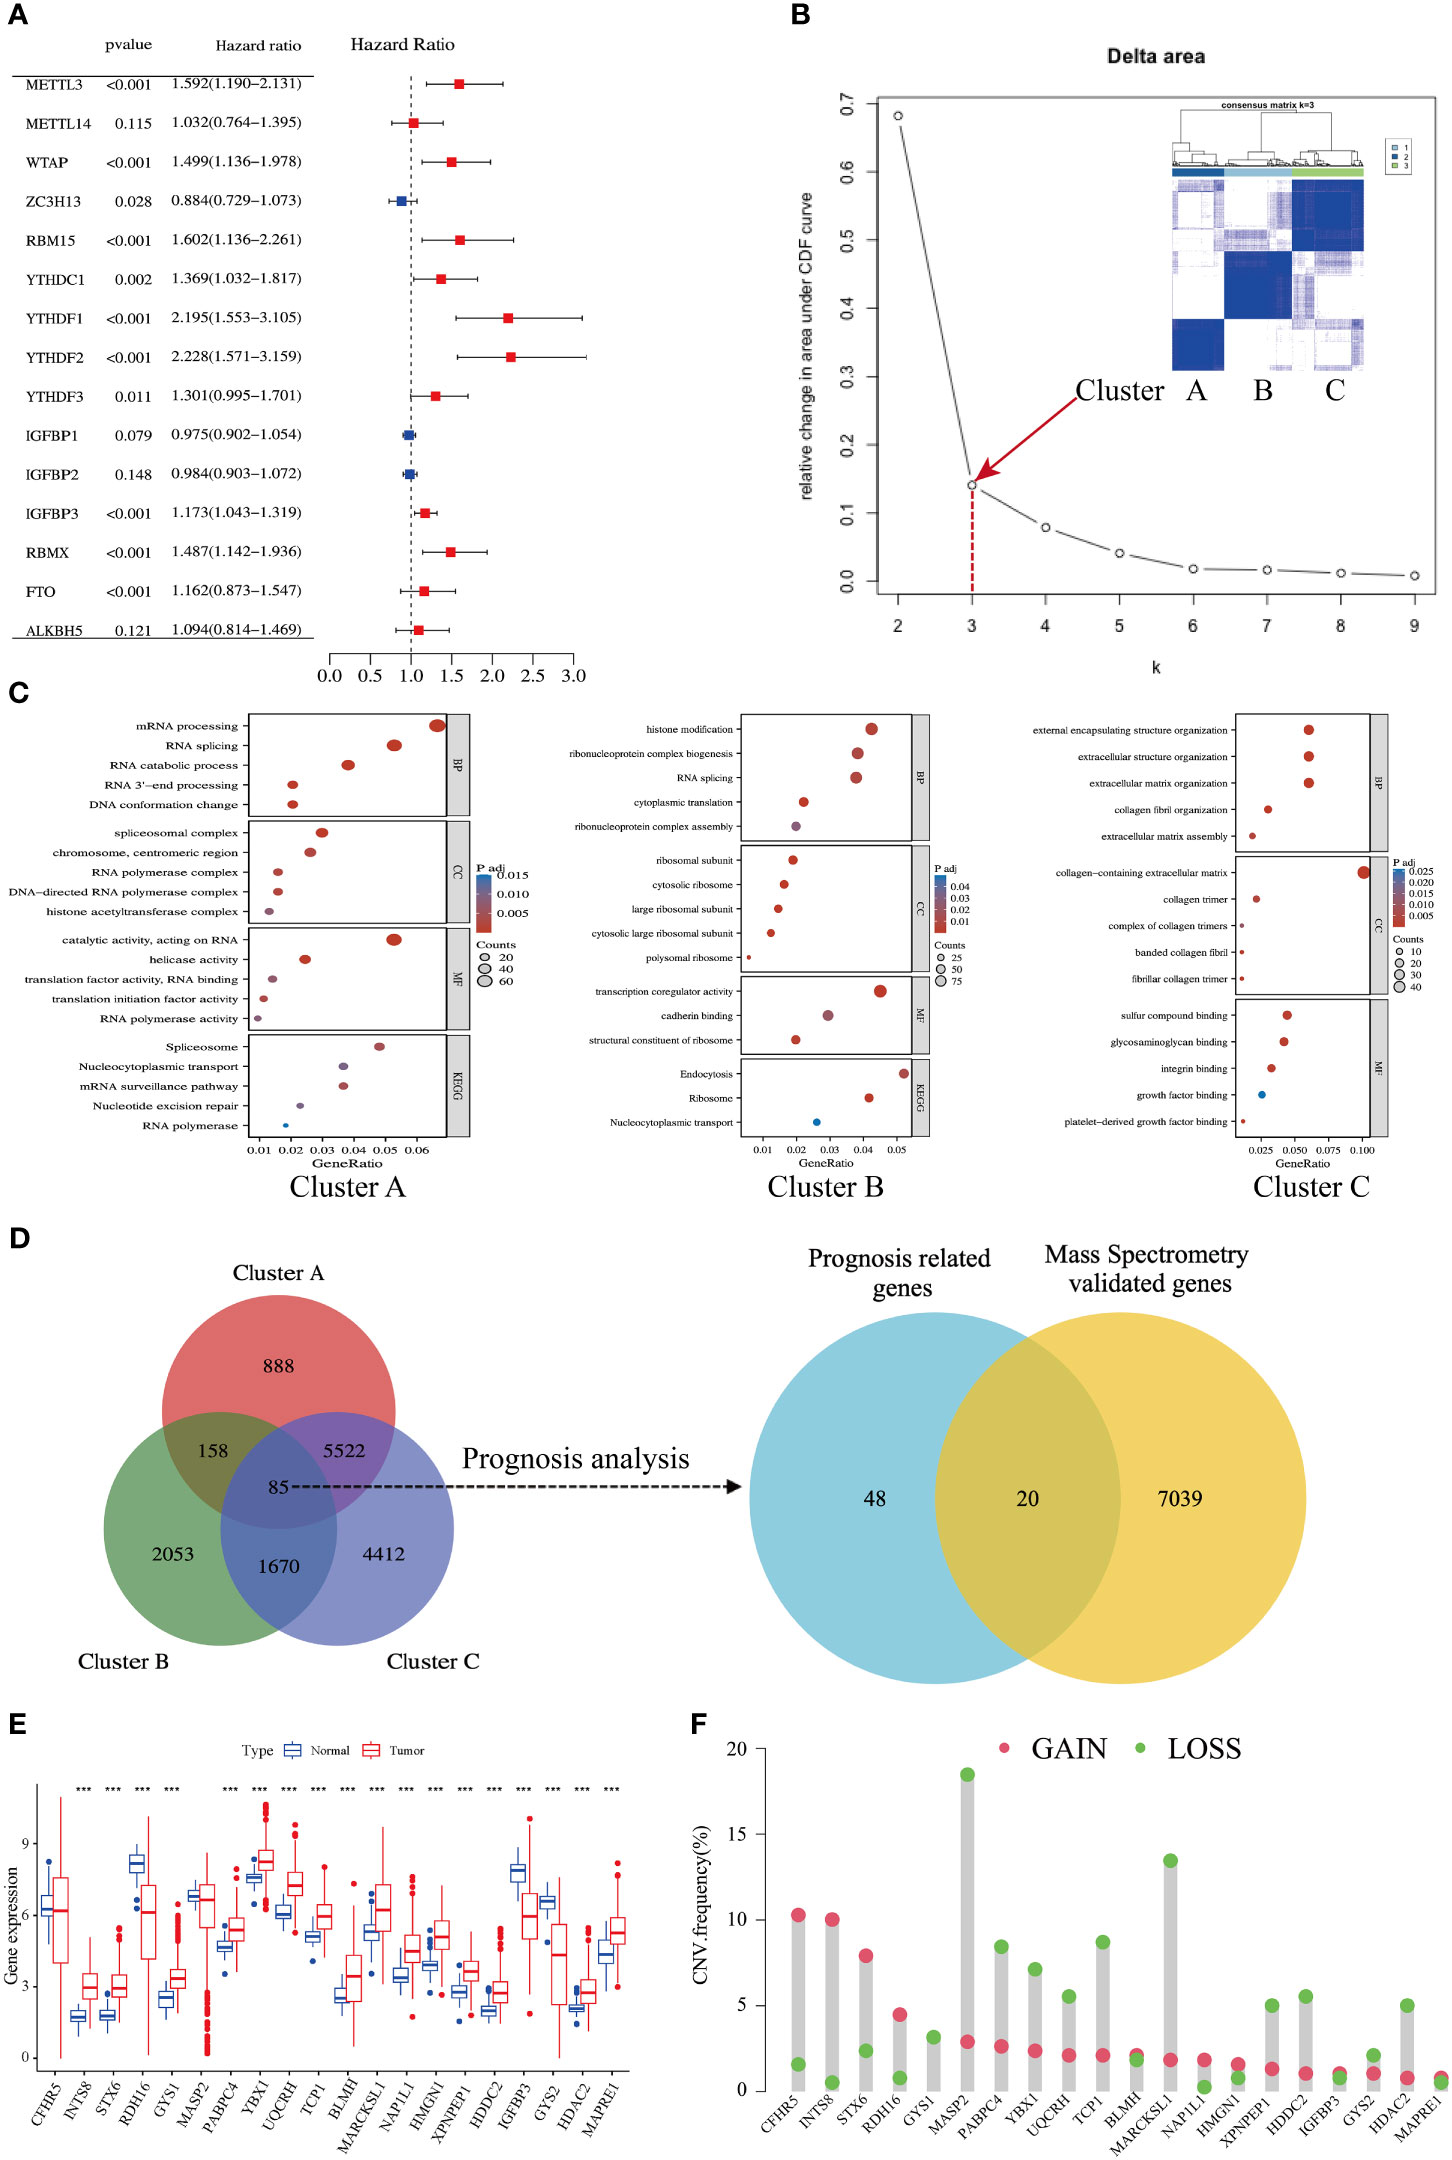
Figure 2 Identification of an m6A-related gene signature in HCC. (A) Forest plots show 15 m6A-related genes from uniCox regression analysis with respect to OS and gene expression. (B) A scree plot shows the optimal number of principal components; k = 3 was selected. (C) Bubble plots show GO and KEGG enrichment analyses of differentially expressed genes (DEGs) in three clusters. (D) Venn diagrams show DEGs in three clusters (left side); mass spectrometry-validated genes and prognosis-related genes (right side). (E) Expression levels of 20 genes in tumors and adjacent normal counterparts in HCC; red and blue boxes indicate tumor and normal tissue, respectively. (F) Copy number variation (CNV) frequency of the 20 genes in HCC; CNV gains and losses are shown in red and green, respectively.
The expression levels of the 20 m6A-related genes were compared between HCC tissues and adjacent normal counterparts. Most of them were upregulated, and five of them were downregulated (Figure 2E). The copy number variation (CNV) of loss and gain is shown in Figure 2F. Moreover, we found an abundance of high-confidential m6A clusters within these 20 genes via SRAMP online analysis (http://www.cuilab.cn/sramp) (Figure S3), suggesting that these genes are m6A modification targets.
Taken together, we established an m6A-related signature composed of 20 protein-coding genes, which has a significant correlation with HCC prognosis.
According to the m6A-related signature, the m6AScore was calculated for each patient, as described in the method. Based on the Youden index (26), 343 HCC patients in TCGA were divided into low- and high-risk groups. As shown in Figures 3A, B. the death risk gradually increased with the elevation of m6AScore. Meanwhile, a high m6AScore was markedly correlated with advanced HCC stages (Figure 3C). Thus, patients with high m6AScores were stratified into the high-risk HCC group.
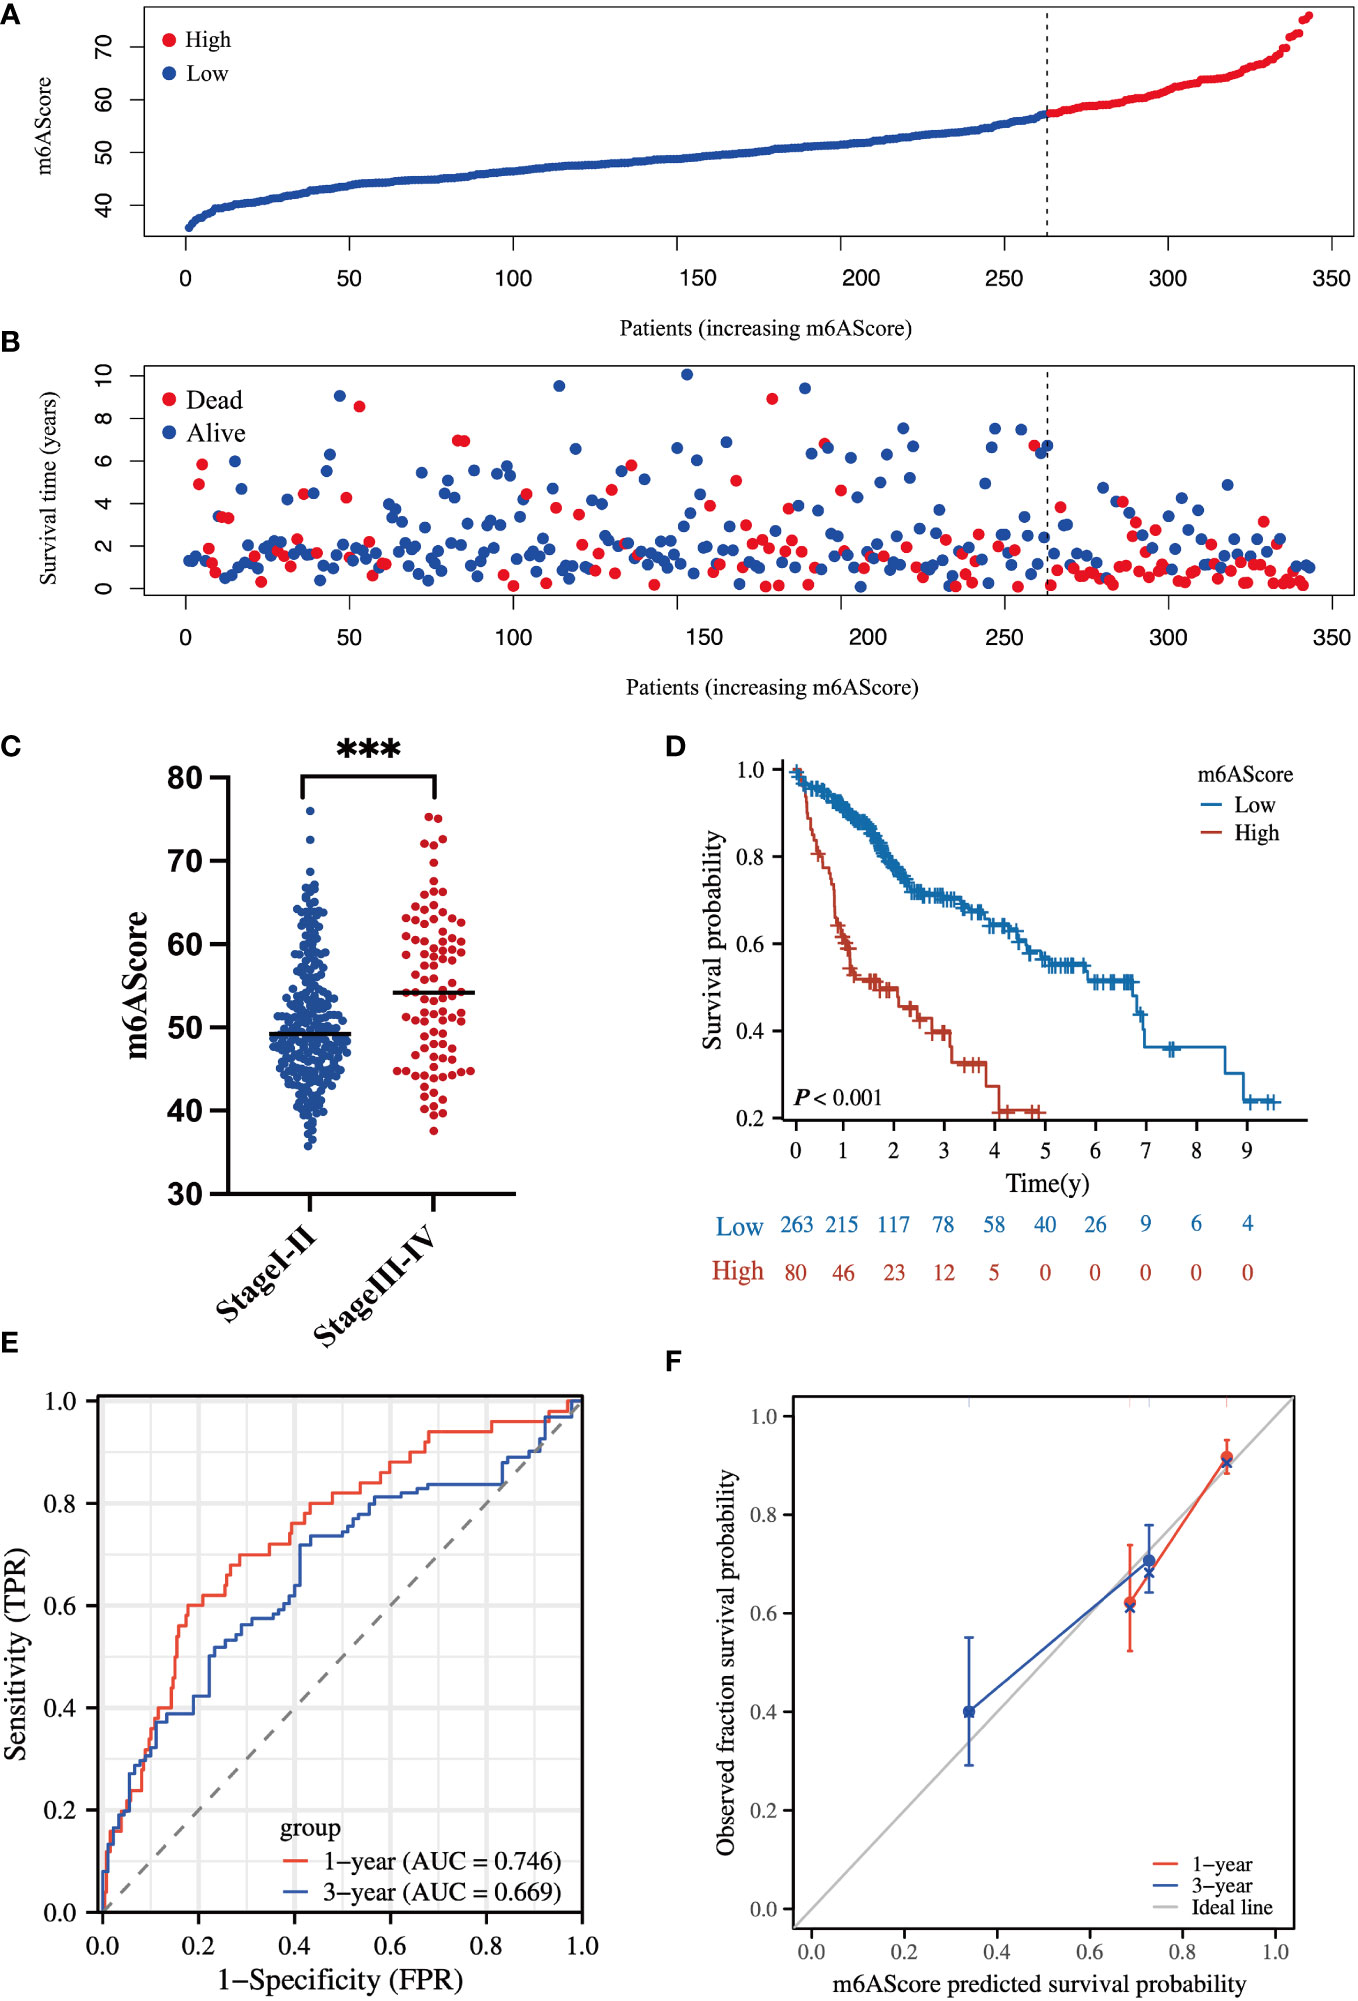
Figure 3 Clinical significance of the m6A-related signature in the TCGA-HCC cohort (A) m6AScore distribution according to the m6A-related signature in TCGA-HCC samples; red represents a high m6AScore (high risk) group and blue represents a low m6AScore (low risk) group. (B) Associations between the m6AScore and survival status; red represents deceased patients and blue represents surviving patients. (C) Box plot showing the relationship between the m6AScore and clinical pathological stage; blue represents stage I–II patients and red represents stage III–IV patients. (D) Kaplan–Meier survival curves showing the low m6AScore group (blue graph) and the high m6AScore group (red graph). (E) Receiver operating characteristics (ROC) curve and area under the ROC of m6AScores for 1 (red graph) and 3 (blue graph) years. (F) Calibration curve of m6AScores for 1 (red graph) and 3 (blue graph) years.
Then, Kaplan–Meier analysis for overall survival (OS) showed that the high-risk group frequently had a shorter survival time (Figure 3D). The 1-, 3-, and 5-year survival rates of high-risk vs. low-risk patients were 62.2% vs. 91.7%, 40.1% vs. 70.7%, and 21.9% vs. 57.0%, respectively. Receiver operating characteristic (ROC) curve analysis indicated that the m6AScore was a useful prognostic index for OS prediction of patients with HCC, as the areas under the ROC curve (AUCs) reached 0.746 and 0.669 in 1 and 3 years, respectively (Figure 3E). Moreover, the m6AScore model displayed good calibration, and the calibration curves for 1- and 3-year survival were all close to the ideal line (Figure 3F).
To further confirm the reliability of our model, we conducted validation using an external dataset of ICGC-JP. As shown in Figure S4, the 1-, 3-, and 5-year survival rates of high-risk vs. low-risk patients were 84.8% vs. 94.9%, 71.2% vs. 84.5%, and 40.7% vs. 70.0%, respectively. The 1- and 3-year AUC was 0.707 and 0.739. These results indicated that our model had a favorable predictive activity.
Collectively, these findings suggest that the m6A-related coding-gene signature has a great capacity to predict the OS of patients with HCC.
To evaluate the reliability of the m6A-related protein-coding gene signature in prognostic evaluation, an independent cohort of 101 HCC specimens was used for further validation. The basic information about the validated HCC cohort in our center is listed in Table S4. The protein levels of m6A-related signature were determined by MS assay, and the m6AScore was calculated to divide patients into high- and low-risk HCC groups as above mentioned.
In line with the above results in Figure 3, the high m6AScore group had a higher death risk (Figures 4A, B) and advanced clinical stages (Figure 4C). In addition, the high-risk group had a remarkably shorter survival time (Figure 4D). The 1-, 3-, and 5-year survival rates of high-risk vs. low-risk patients were 87.5% vs. 92.2%, 44.1% vs. 71.8%, and 44.1% vs. 68.3%, respectively. ROC curve analysis further confirmed the accuracy and sensitivity of the m6A-related signature, as the AUC reached 0.722 and 0.604 in 1 and 3 years, respectively (Figure 4E). The calibration curves for 1 and 3 years were close to the ideal line and showed a satisfactory calibration effect (Figure 4F).
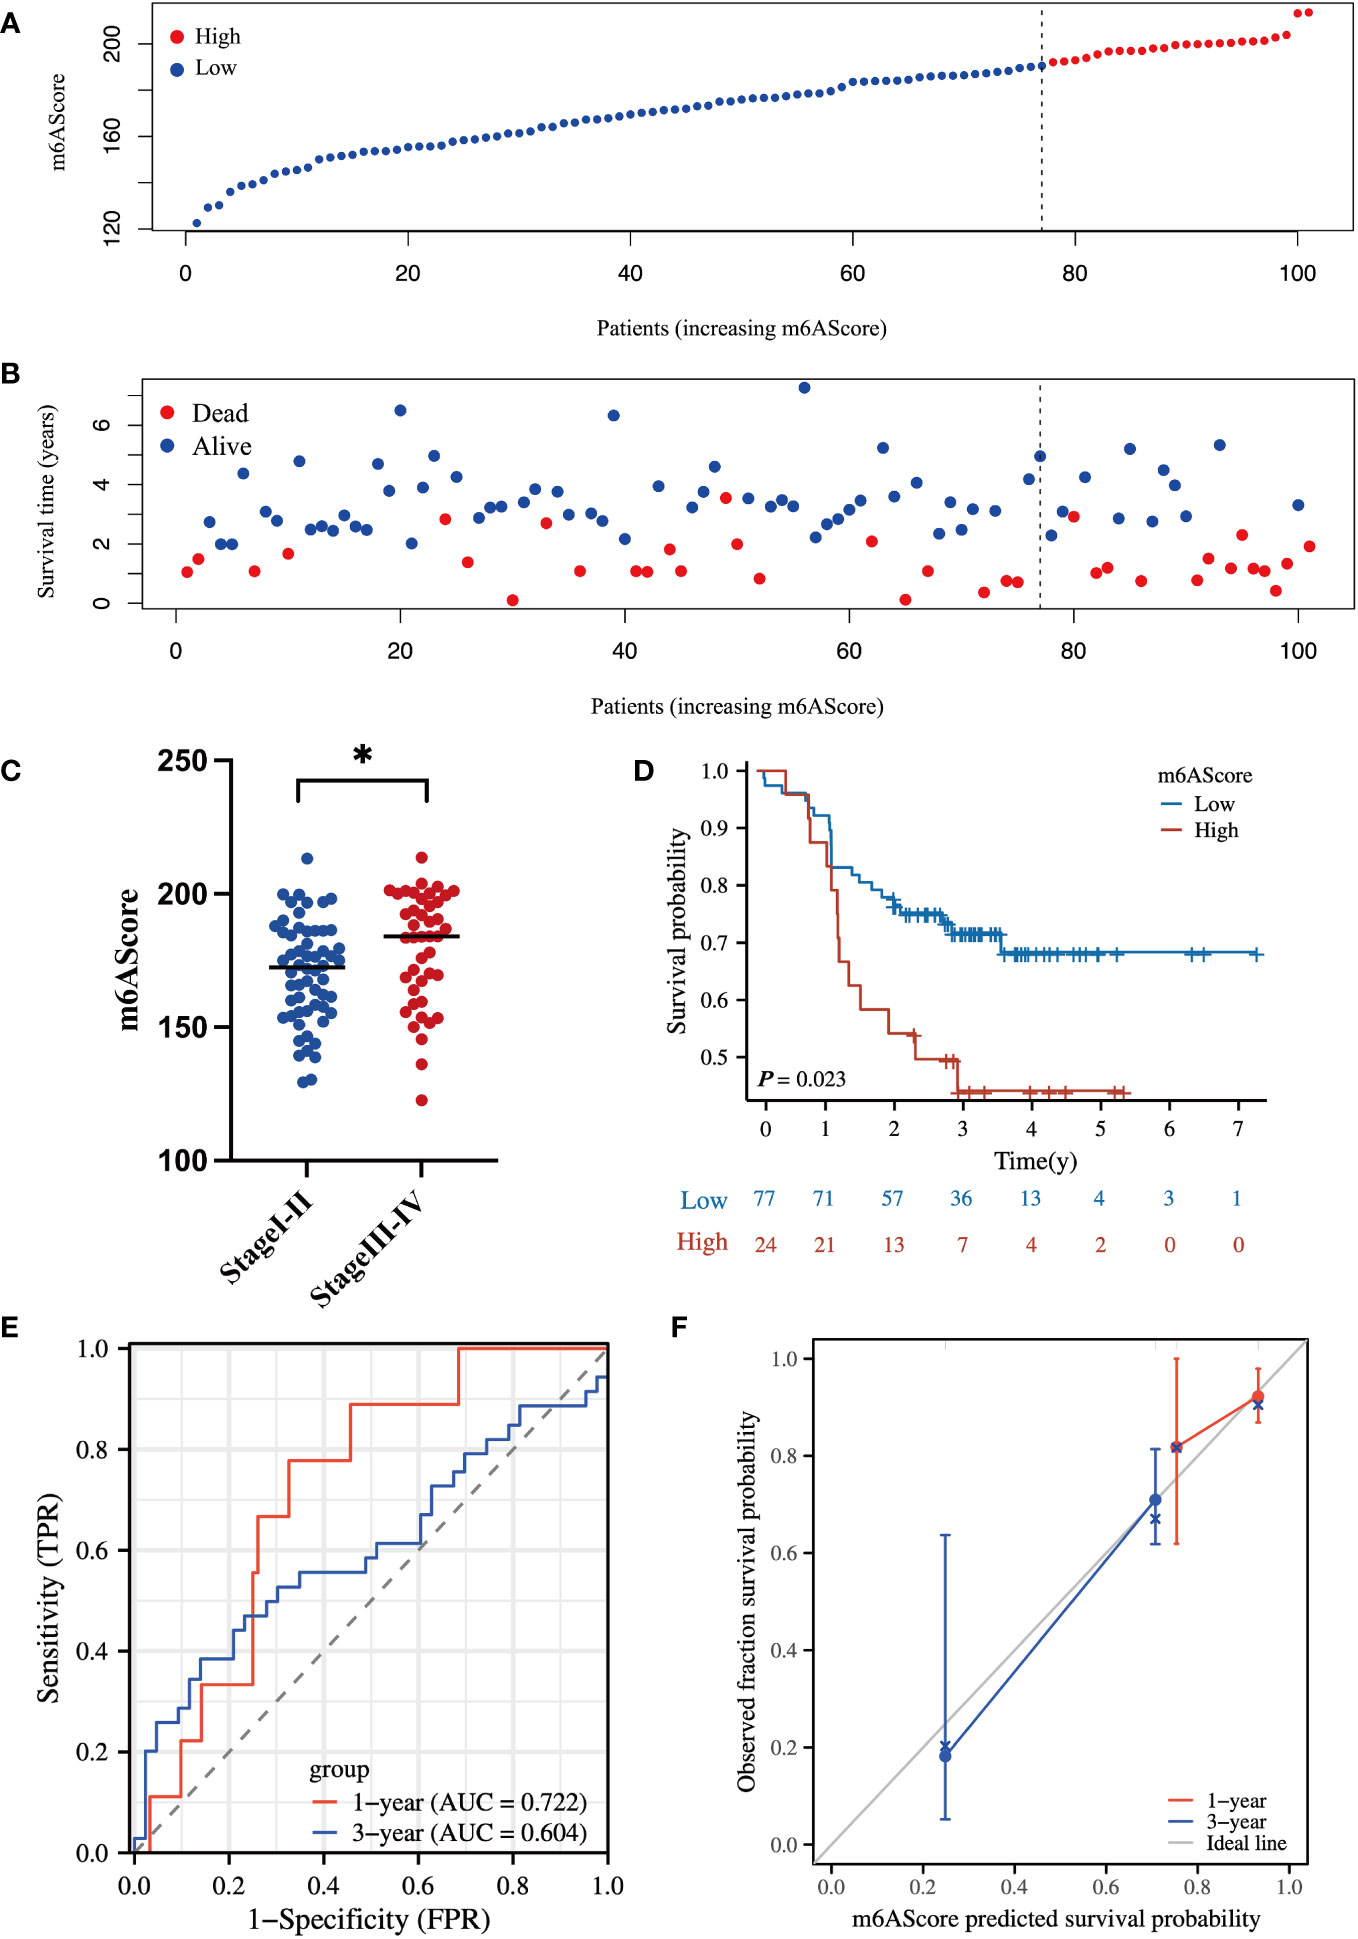
Figure 4 Proteomic validation of the m6A-related gene signature in an independent HCC cohort (A) m6AScore distribution according to the m6A-related signature in independent HCC samples; red represents a high m6AScore (high risk) group and blue represents a low m6AScore (low risk) group. (B) Associations between the m6AScore and survival status; red represents deceased patients and blue represents surviving patients. (C) Box plot showing the relationship between the m6AScore and clinical pathological stage; blue represents stage I–II patients and red represents stage III–IV patients. (D) Kaplan–Meier survival curves showing the low m6AScore group (blue graph) and the high m6AScore group (red graph). (E) Receiver operating characteristics (ROC) curve and area under the ROC of m6AScores for 1 (red graph) and 3 (blue graph) years. (F) Calibration curve of m6AScores for 1 (red graph) and 3 (blue graph) years.
Therefore, these validated results confirm the reliability and robustness of our m6A-related signature that can readily stratify high-risk HCC patients and evaluate OS. The m6A-related signature may facilitate better clinical management of high-risk HCC at an early stage.
To exploit the underlying mechanisms of the m6A-related signature, GSEA was performed for GO and KEGG analyses to explore possible biological functions. As shown in Figures 5A, B, in the high-risk HCC group, aberrant DNA replication and recombination, epigenetic dysregulation, cell cycle chaos, and activation of oncogenic signaling pathways such as MAPK, mTOR, and VEGF were obviously enriched. In contrast, disordered amino acid and fatty acid metabolism as well as abnormalities of the cytochrome p450 pathway were markedly enriched in the low-risk HCC group.
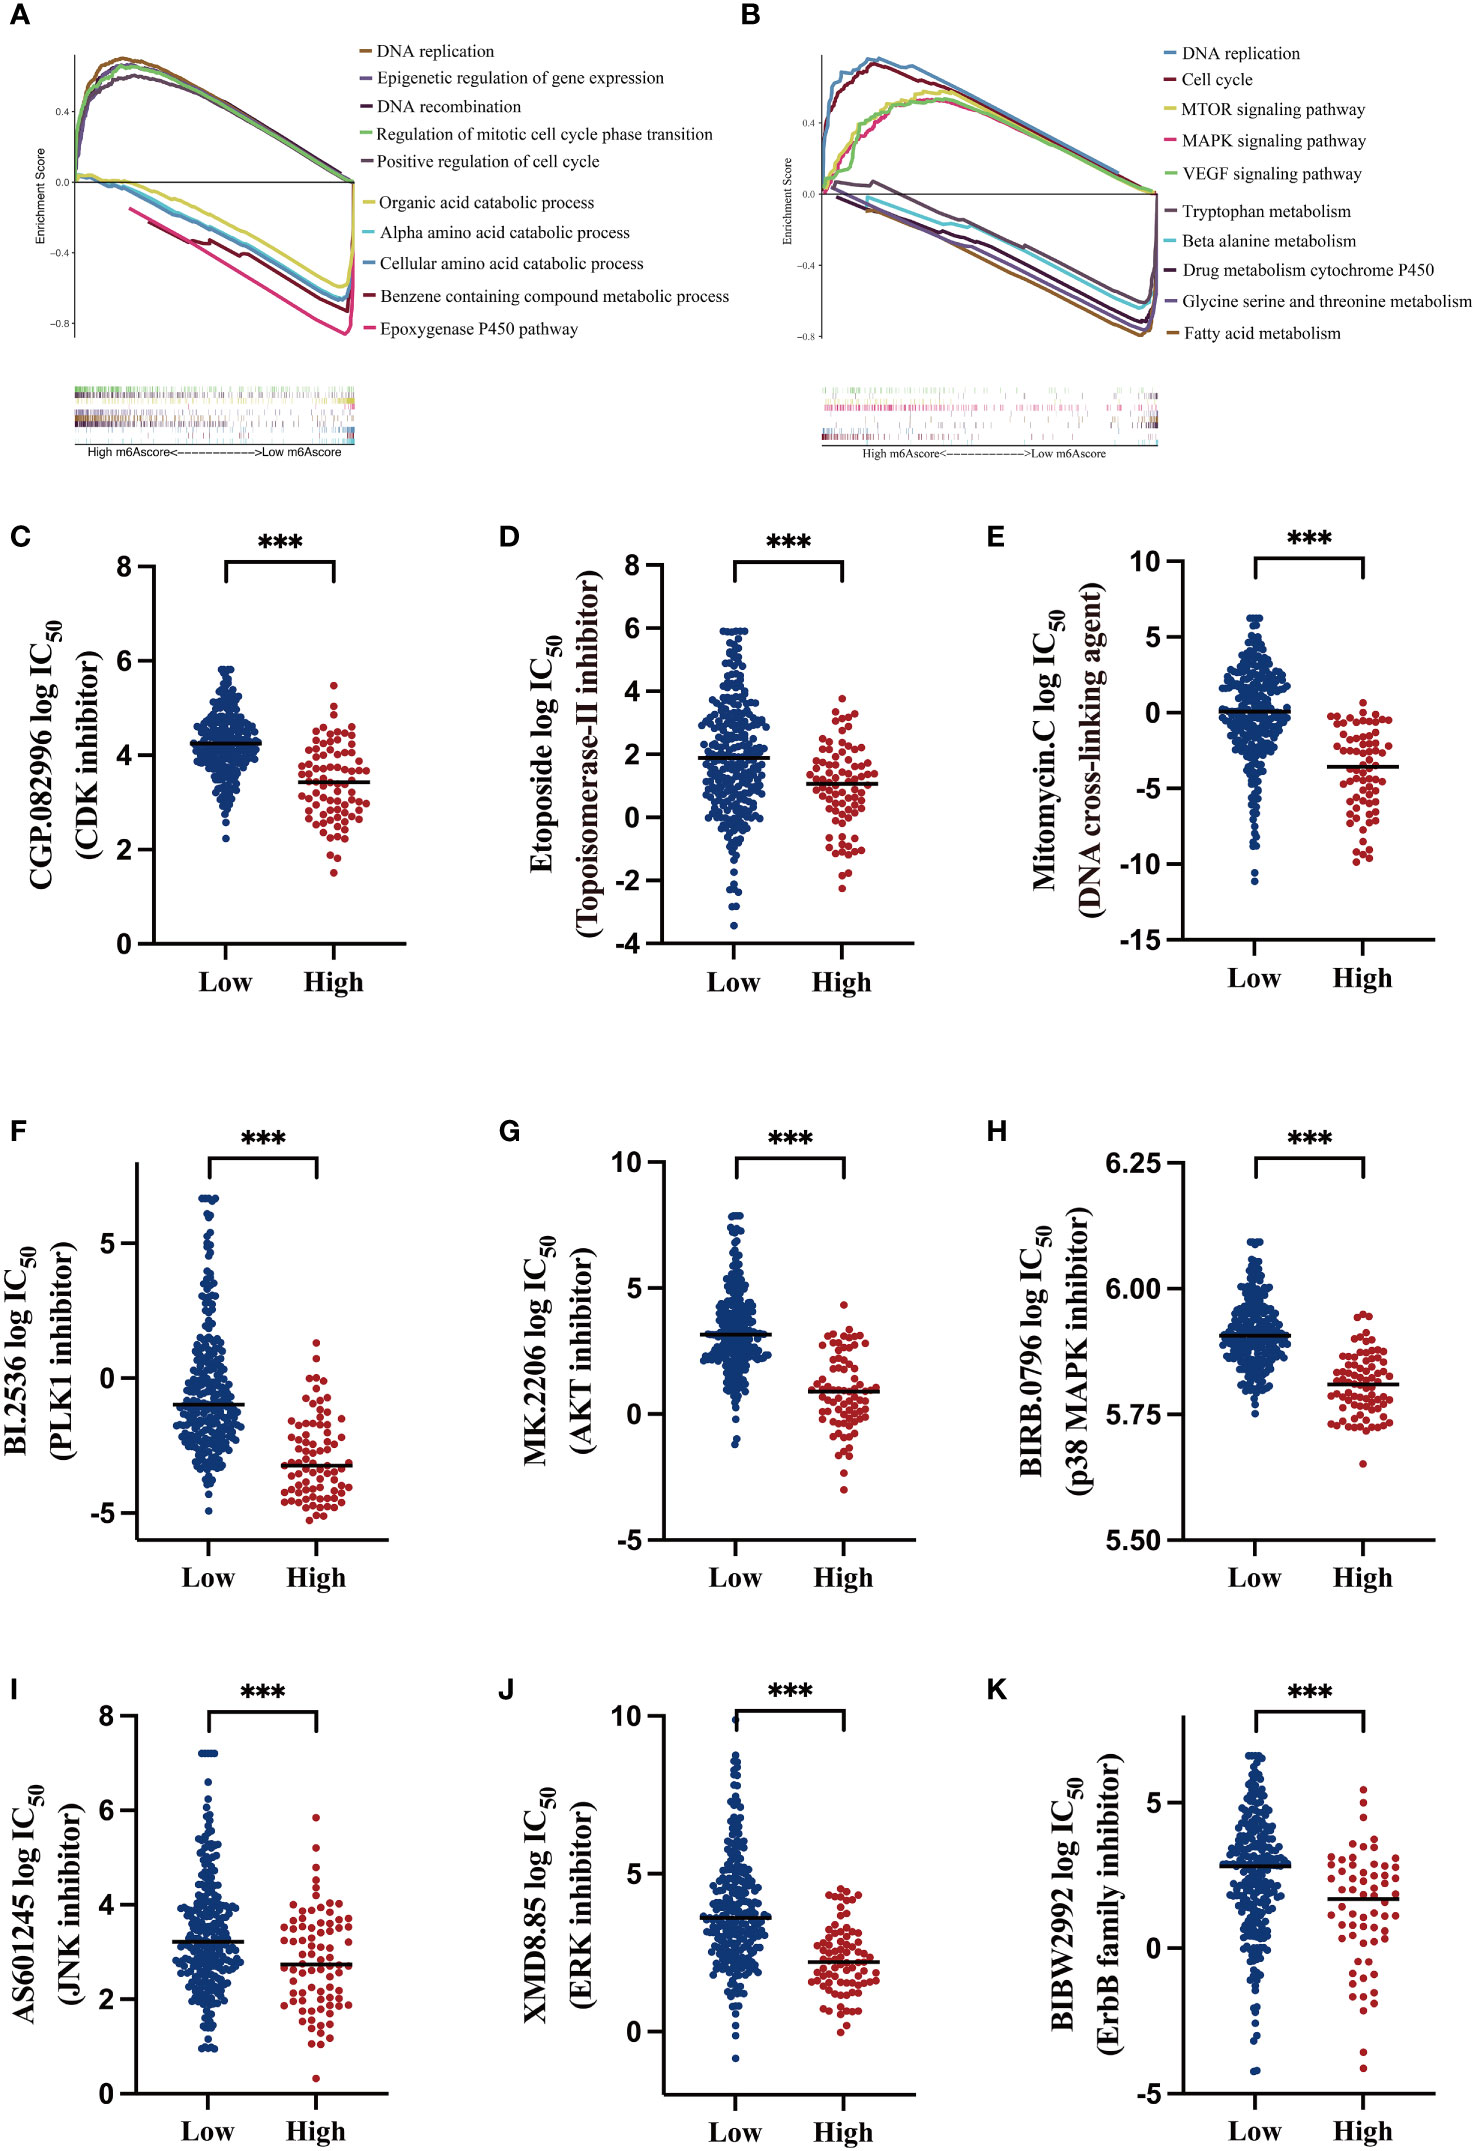
Figure 5 Functional analysis of the m6A-related signature and predicting susceptibility to targeted/chemotherapy agents (A) Gene Set Enrichment Analysis (GSEA) of gene ontology (GO) terms; the lower section shows gene set enrichment in the low m6AScore group and the upper section shows gene set enrichment in the high m6AScore group. (B) GSEA for KEGG pathways; the lower section shows gene set enrichment in the low m6AScore group and the upper section shows gene set enrichment in the high m6AScore group. (C–K) Box plots showing estimated logIC50 values for several chemotherapeutic agents in high- or low-m6AScore groups. *** represents p < 0.001.
Based on GSEA results, we probed potentially effective strategies for high-risk HCC treatments. Some Food and Drug Administration-approved inhibitors and chemotherapeutics that target the cell cycle (CGP.082996), repress DNA replication and synthesis (etoposide and mitomycin C), and inactivate MAPK signaling (PLK1, AKT, and p38 inhibitors) were selected for analysis. Then, half maximal inhibitory concentrations (IC50) for these inhibitors were evaluated in low- and high-risk subgroups in the pRRophetic platform, which is an independent and authorized public resource for predicting inhibitor sensitivity and is based on gene expression microarray data (23). As shown in Figures 5C–K, high-risk HCC patients were more sensitive to these inhibitors, as low drug concentrations effectively inhibited cell proliferation.
These findings suggest that low- and high-risk groups may have different oncogenic mechanisms promoting HCC development. High-risk HCC patients may have elicited better responses to CDK and MAPK inhibitors and the chemotherapeutics etoposide and mitomycin C. Thus, our m6A-related signature was beneficial in selecting rational therapeutic strategies.
TMB is an important index to evaluate cancer progression and the efficacy of immunotherapy. We found that the gene mutation landscapes were markedly different between the low- and high-risk groups, as shown in the waterfall chart in Figures 6A, B. Among the low-risk patients, the CTNNB1 mutation was the most common event (Figure 6A), whereas in high-risk group, the frequency of the TP53 mutation appeared in more than half of the total mutant events (Figure 6B). Then, according to the combination of high/low TMB and m6AScore, HCC patients were divided into four subgroups as indicated in Figure 6C, L-TMB+L-m6AScore, L-TMB+H-m6AScore, H-TMB+L-m6AScore, and H-TMB+H-m6AScore. We found that the H-TMB+H-m6AScore group had the worst prognosis, whereas the L-TMB+L-m6AScore group had the best prognosis.
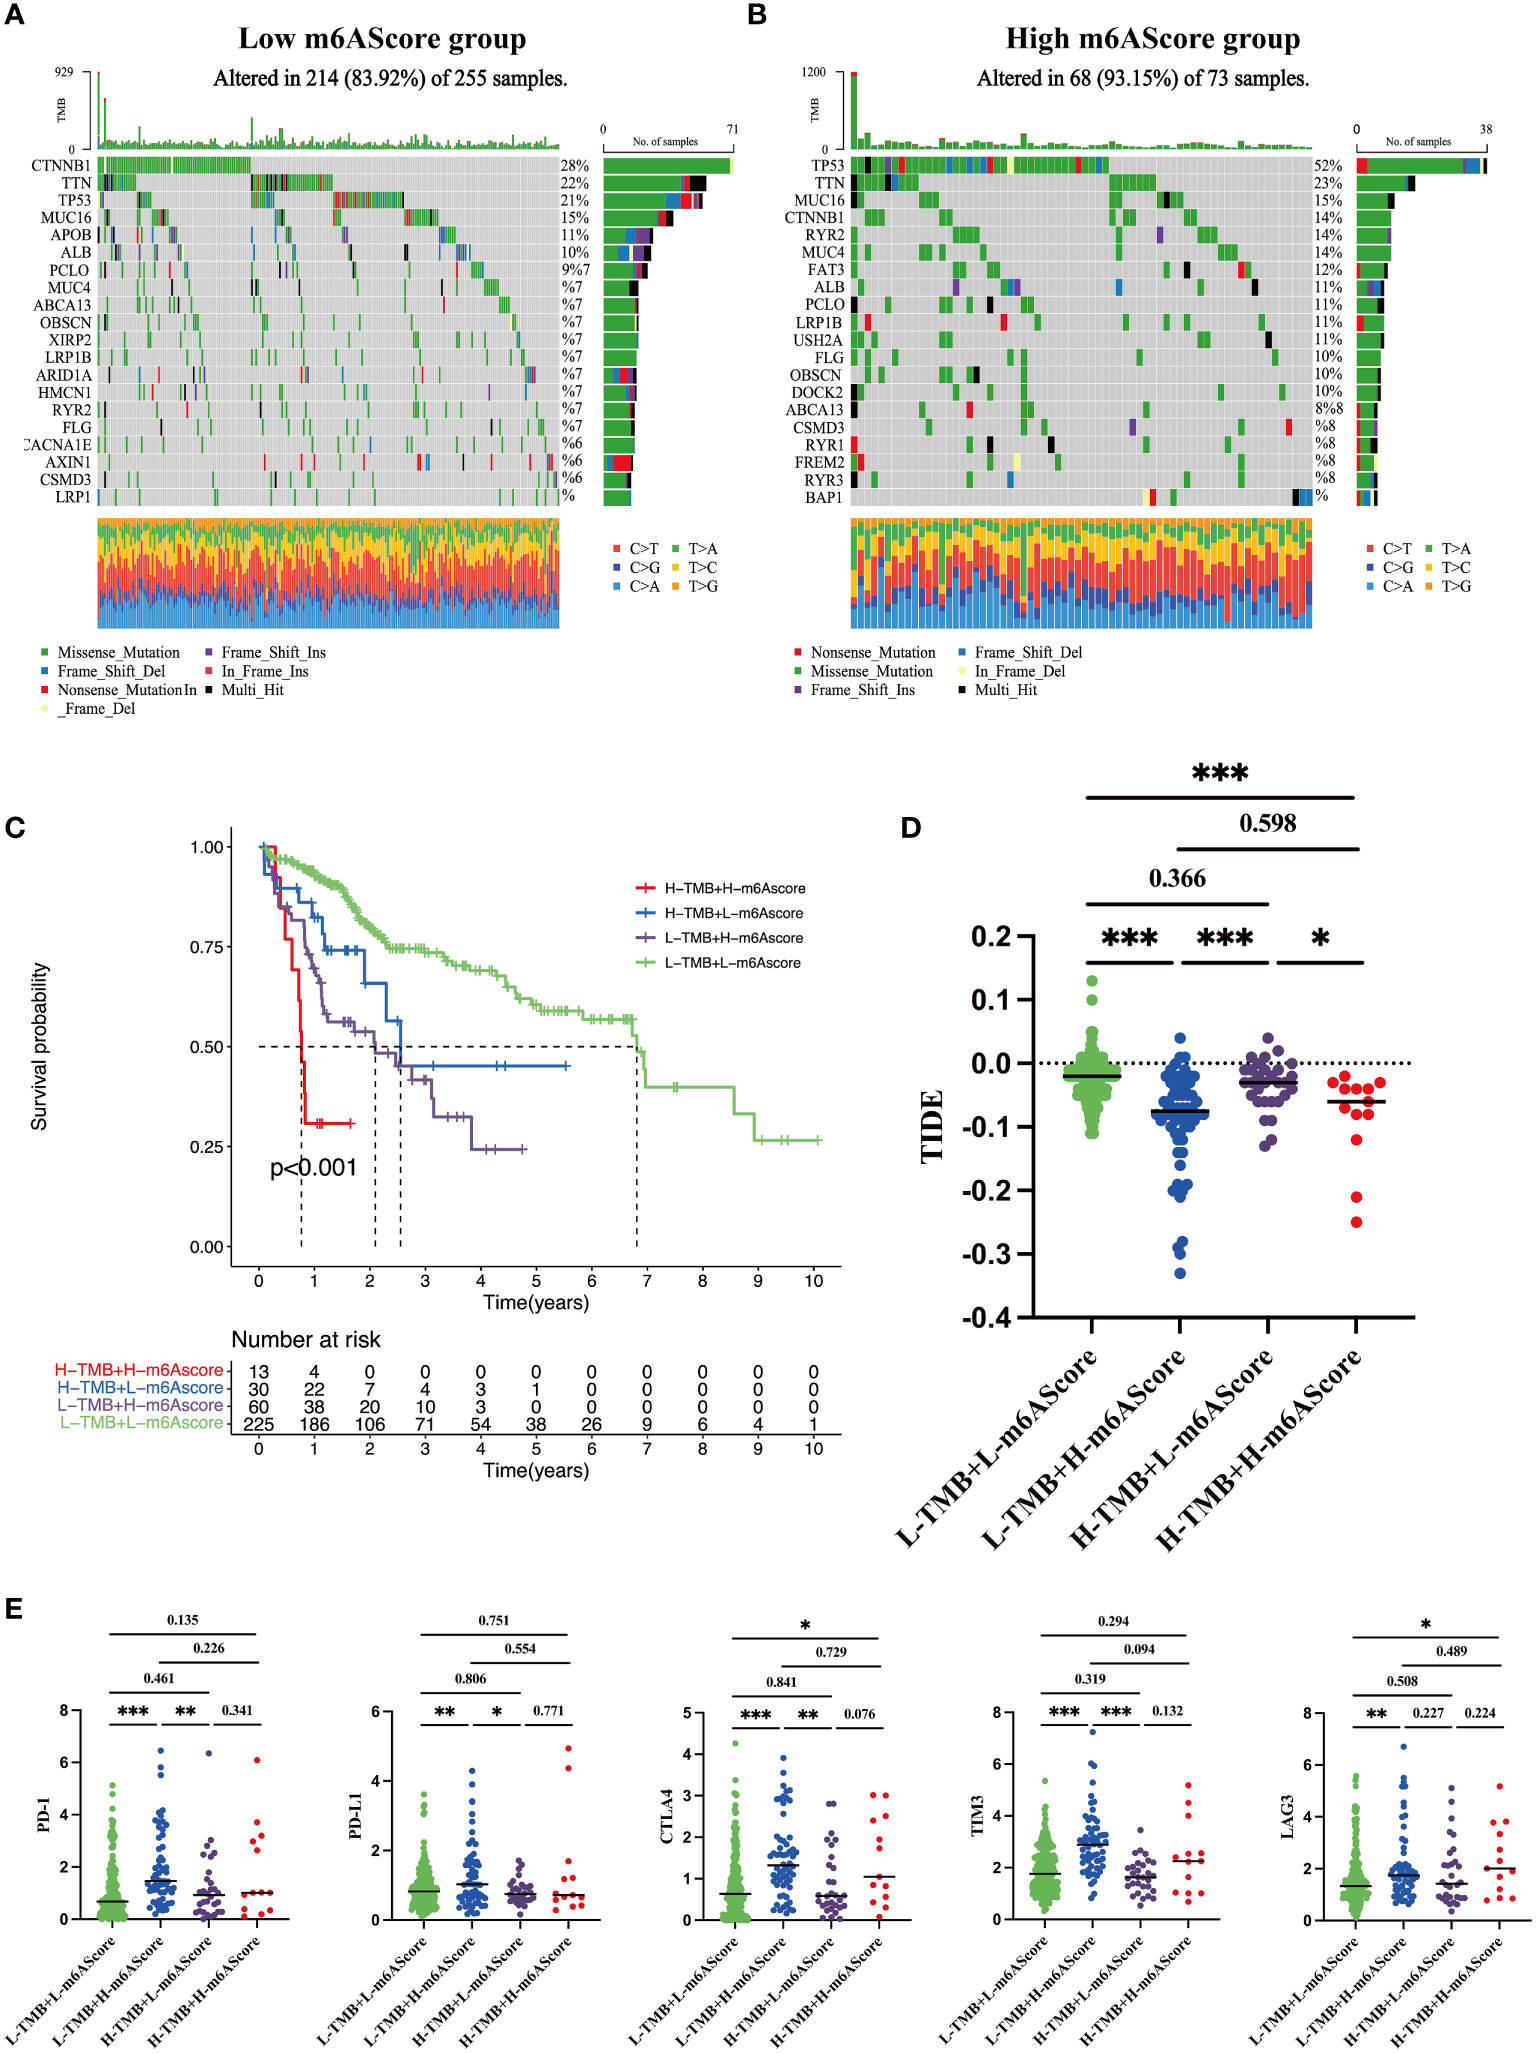
Figure 6 Tumor somatic mutations in the m6A-related signature and immunotherapy sensitivity predictions (A) Gene mutation frequency in the low m6AScore group. (B) Gene mutation frequency in the high m6AScore group. (C) Kaplan–Meier survival curves among four groups divided by tumor mutation burden (TMB) and m6AScores. L-TMB was the short for low TMB and H-TMB referred to high TMB; L-m6AScore was the short for low m6AScore and H-m6AScore referred to high-m6AScore. (D) TIDE analyses predict responses to immunotherapy as indicated by TIDE scores in the four groups; lower TIDE scores suggest increased responsiveness to immunotherapy. (E) Box plots show differential immune checkpoint gene expression (PD-1, PD-L1, CTLA4, TIM3, and LAG3) between high- and low-m6AScore groups. *, **, *** represent p < 0.05, p < 0.01, p < 0.001.
Recently, immunotherapy combined with immune checkpoint inhibitor approaches has generated encouraging clinical outcomes in different cancers, including HCC (27). TIDE is an algorithm that predicts immunotherapy responses; a high TIDE score frequently indicates poor responses (24). HCC patients with high m6AScores were inclined to have lower TIDE scores regardless of the TMB (Figure 6D), suggesting that high-risk groups benefit from immunotherapy. Furthermore, we analyzed the expression levels of several well-documented immune checkpoint molecules, including CTLA4, PD-1, PD-L1, LAG3, and TIM3, in TMB + m6AScore subgroups. Most immune checkpoint molecules had higher expression levels in the high m6AScore subgroup, indicating that high-risk HCC patients may suppress T-cell activation and evade antitumor immunity (Figure 6E). However, it also indicated that high-risk HCC patients may be sensitive to immune checkpoint therapy, such as antibodies directed against PD-1, CTLA4, TIM3, and LAG3.
Taken together, m6AScores combined with TMB could be used to stratify the poorest prognostic HCC subgroup. High-risk HCC patients are prone to immune evasion by upregulating immune checkpoint protein expression and may benefit from immune checkpoint therapy.
To systematically delineate the status of the tumor immune microenvironment, we compared the infiltration percentage of various immune cells via ssGSEA analysis. Notably, immunosuppressive cells such as M2 polarized macrophages and T-regulatory cell were obviously accumulated in the high-risk group (Figure 7A). Each of the 20 genes in the m6A signature individually contributed to immune cell infiltration (Figure 7B). It is well known that Foxp3 is an essential transcriptional factor of Treg; CD163, IRF4, and VSIG4 are the markers of M2-macrophages. Thus, the expression levels of these genes were analyzed in the TCGA dataset. The high-risk HCC group exhibited significant upregulation of Foxp3, CD163, IRF4, and VSIG4 (Figures 7C–F).
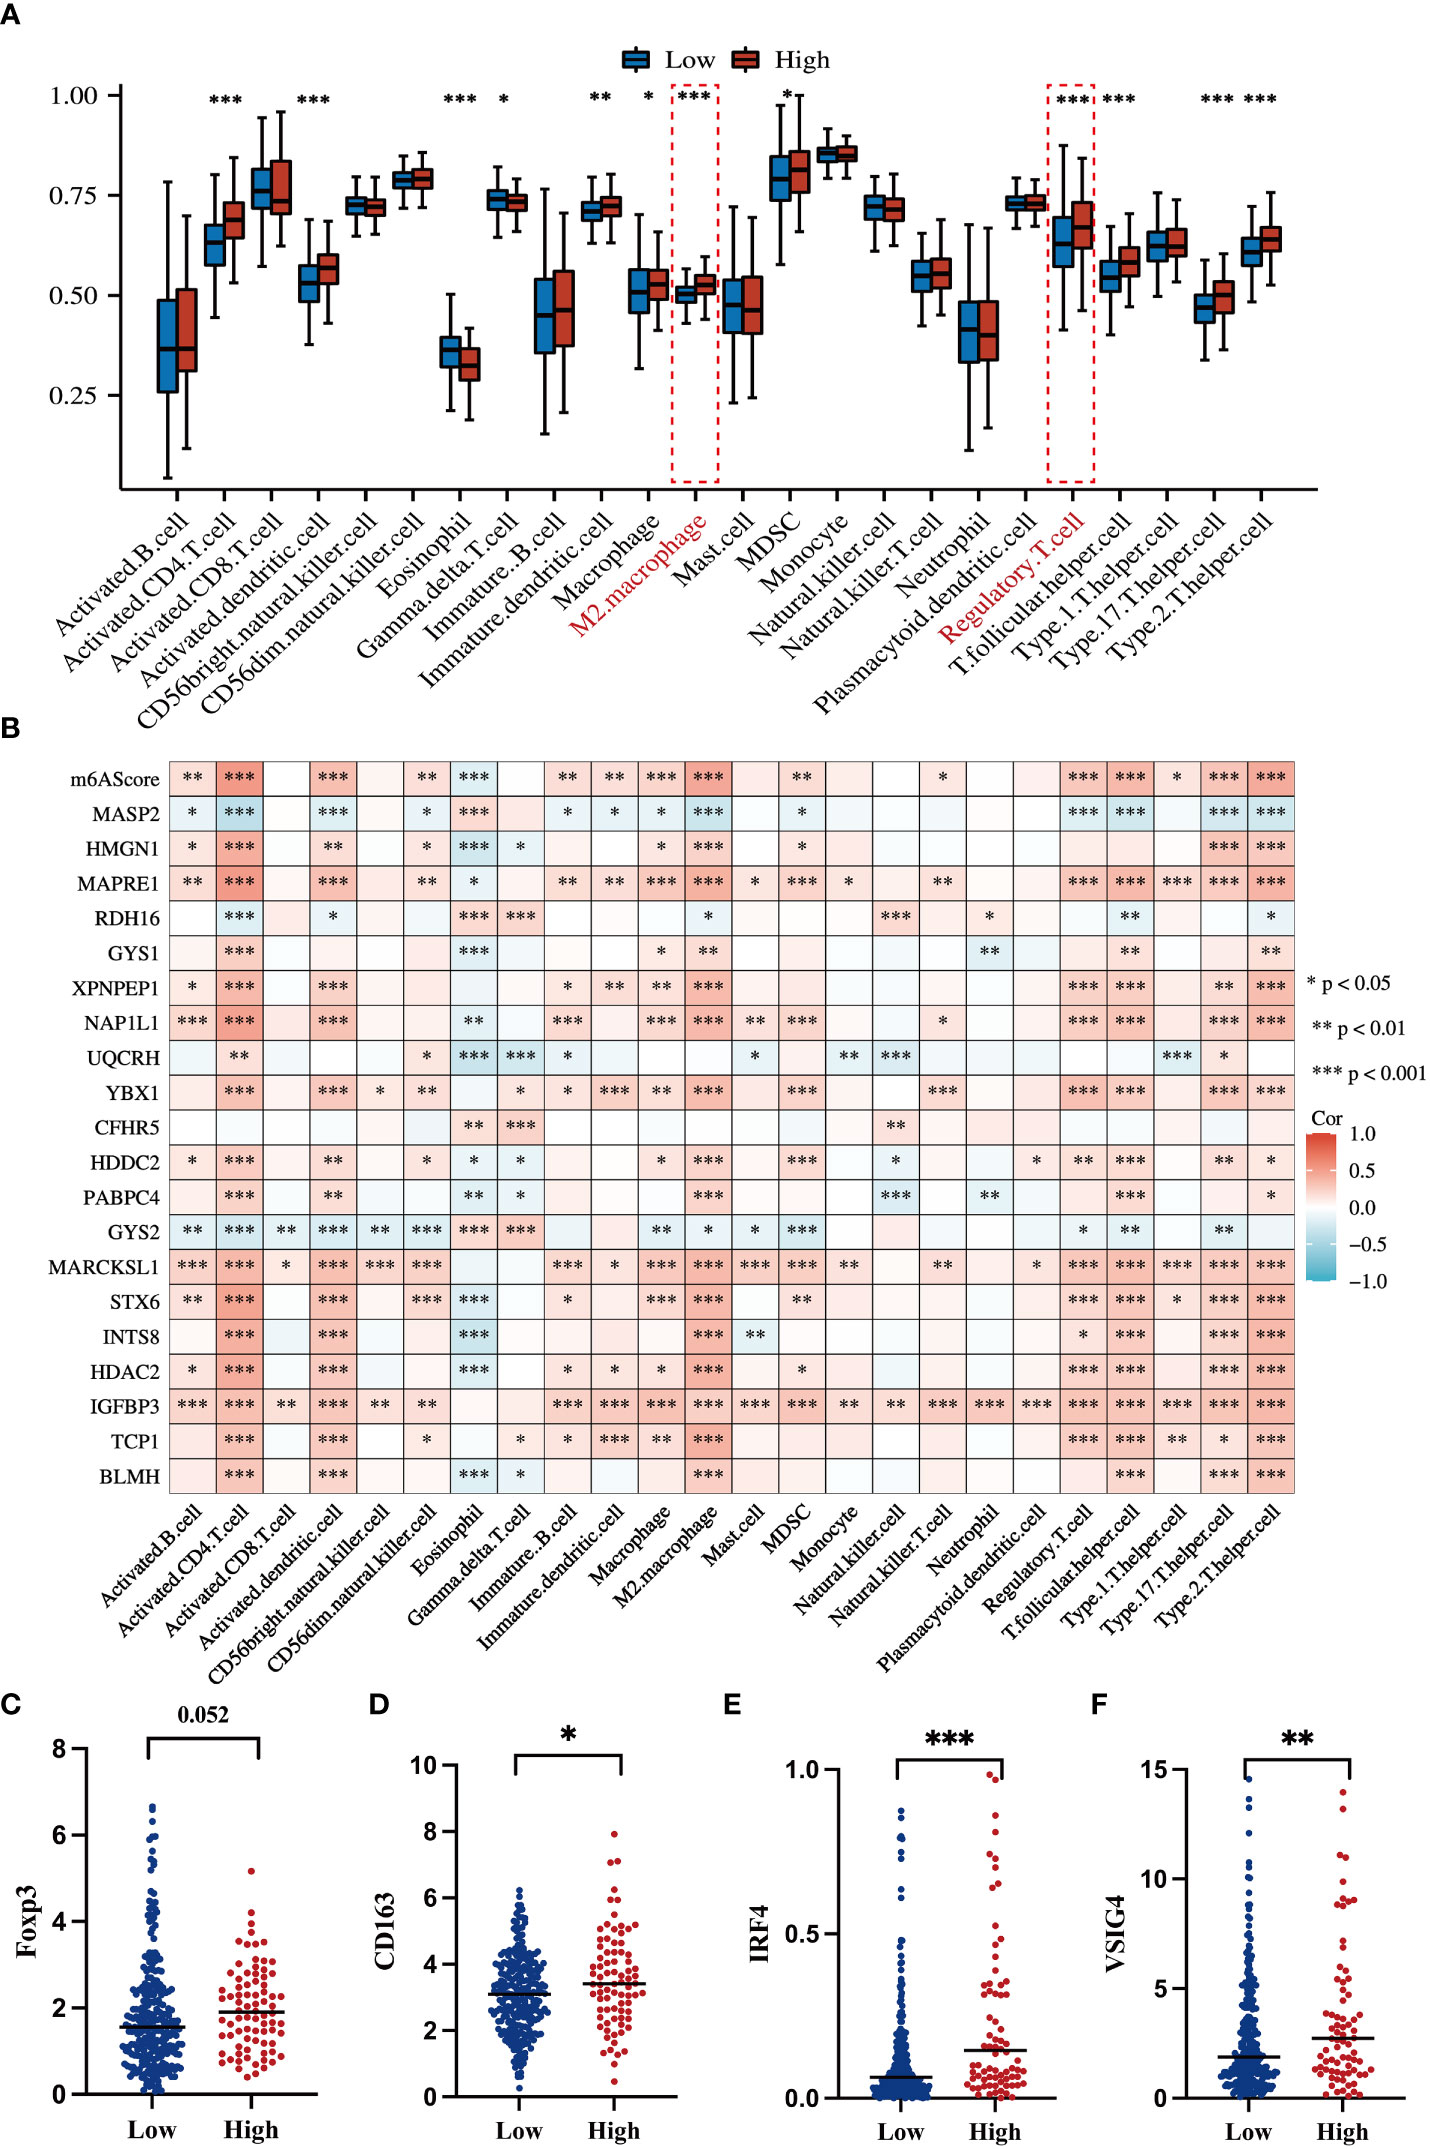
Figure 7 Correlations of the m6A-related signature with immune cell infiltration and related genes (A) Box plot shows an ssGSEA analysis of m6AScores and immune infiltration levels in HCC; red represents the high m6AScore group and blue represents the low m6AScore group. (B) Correlation heatmap showing the relationship between the m6AScore, gene expression (20 genes), and immune cell infiltration. (C–F) Box plots showing T-regulatory cell and M2-type macrophage-related gene expression between high- and low-m6AScore groups. *, **, *** represent p < 0.05, p < 0.01, p < 0.001.
To confirm and validate these findings, multiplex immunofluorescence staining was performed to display tumor microenvironment features in part of our HCC cohort. In low-risk HCC samples, there were a few M2-macrophages (green) and Tregs (purple) observed (Figure 8A). Consistently, in high-risk HCC samples, there was obvious infiltration of M2-macrophages and Tregs within the tumor microenvironment (Figure 8B).
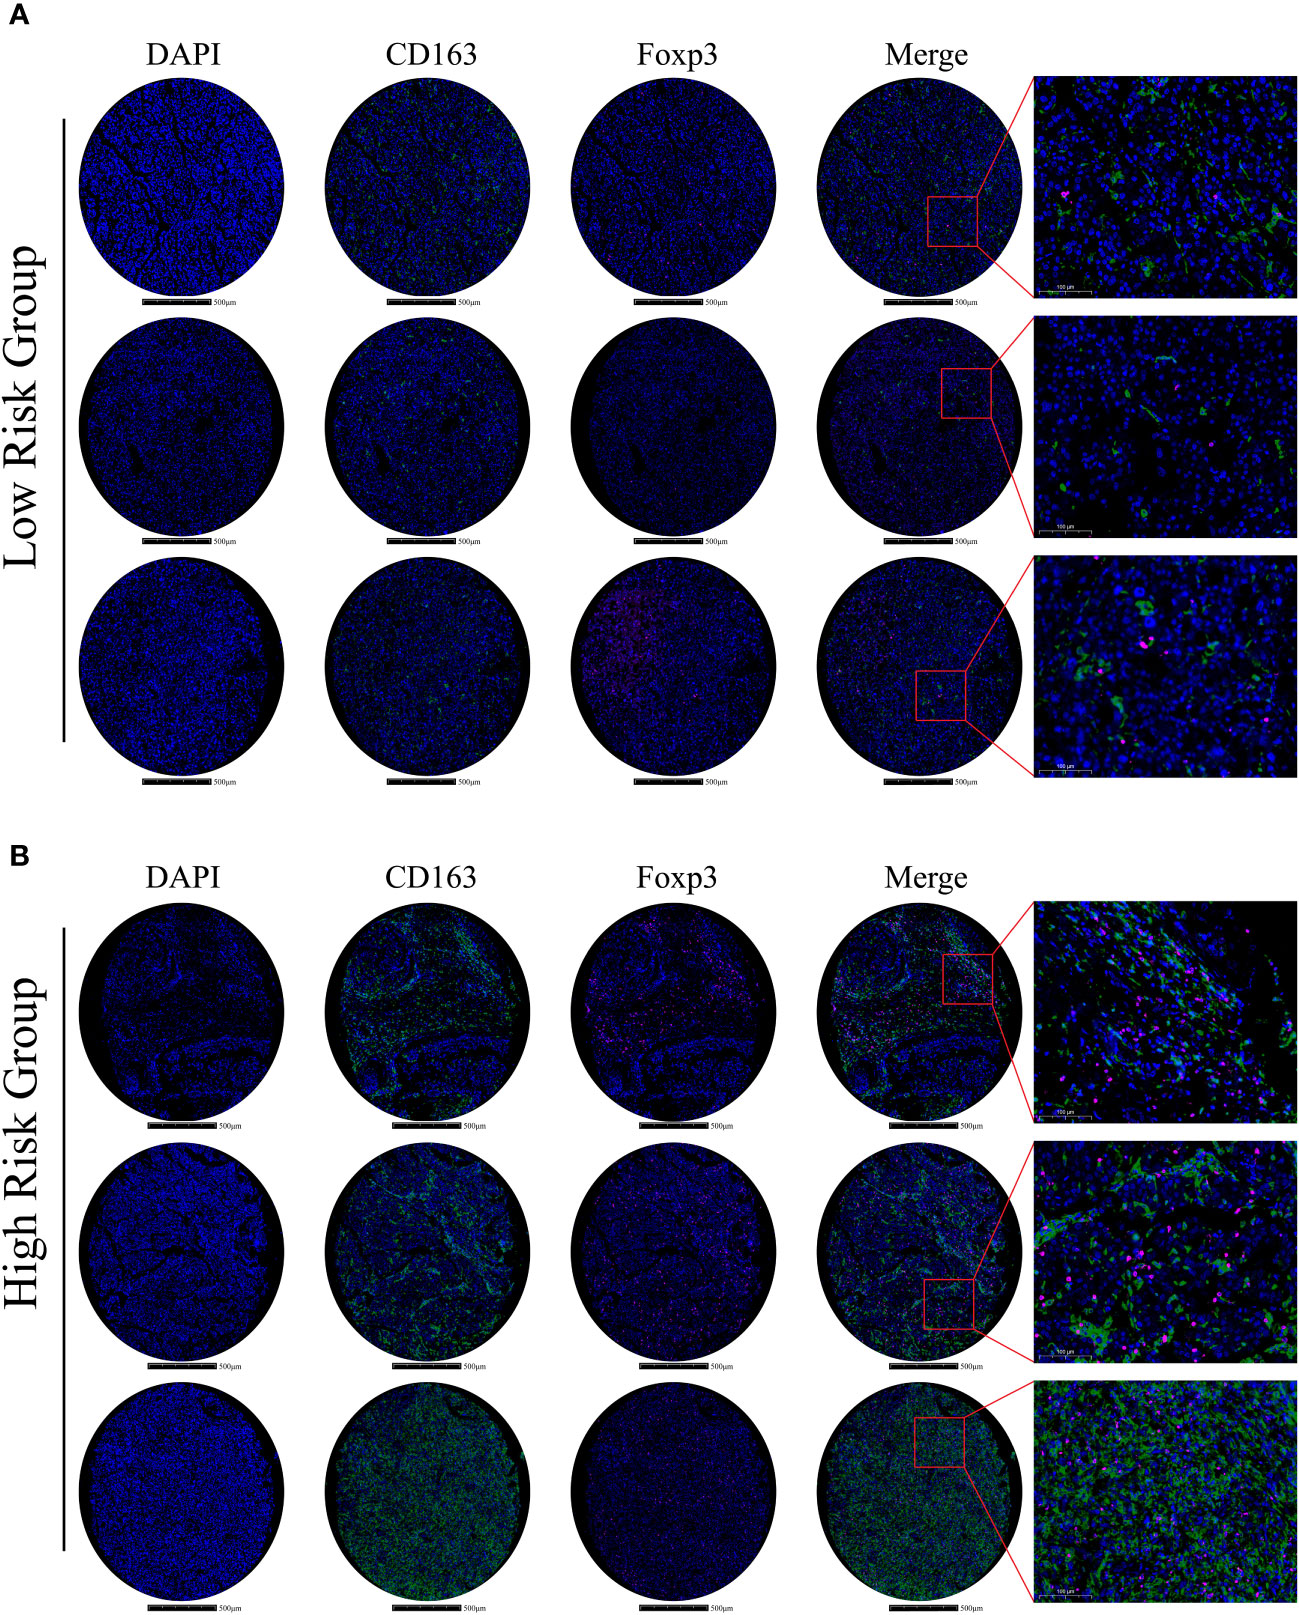
Figure 8 Immune-related gene expression and validation in HCC samples (A) In the low m6Ascore group, multiplex immunofluorescence staining was performed using DAPI, CD163, and Foxp3 stains; stains are shown separately and merged (Scale bars are shown in figures). (B) In the high m6Ascore group, the same multiplex immunofluorescence staining was conducted; stains are shown separately and merged (Scale bars are shown in figures).
Hence, these results indicate that m6A signature can characterize the tumor immune microenvironment and that the high-risk HCC group may form an immunosuppressive microenvironment with plenty of M2-macrophages and Treg infiltration.
Globally, HCC is a heavy health burden on society due to its high morbidity and mortality rates (1). Thus far, effective early diagnosis and prognostic evaluation strategies are lacking for the disease. HCC has highly heterogeneous characteristics, manifested by highly frequent genomic variation, aberrant epigenetic modification, and dysregulated transcriptomic expression (28). Currently, epi-transcriptomic modification, represented by m6A RNA methylation, has been shown to have essential roles in cancer development, including HCC (29). Several genes are m6A modification targets and help mediate tumorigenesis, metastasis, and drug resistance (30). Herein, we propose that m6A-related gene signatures have great potential as promising biomarkers and therapeutic targets. Recently, several m6A gene profiles were reportedly associated with HCC progression (16–18, 20). For instance, Zheng et al. constructed a signature comprising only three m6A regulators, namely YTHDF2, METTL14, and ZC3H13 (17). Shen et al. identified an m6A methylation panel that clustered HCC into three distinct metabolic subtypes (16). Furthermore, m6A- and ferroptosis-related long non-coding RNA profiles were identified in HCC (18). However, most signatures lack validation in independent cohorts; therefore, their reliability and accuracy remain unclear. In this study, we mainly focused on protein-coding genes as they are the essential executors of biological function. We established an m6A-related signature containing 20 protein-coding genes by analyzing TCGA-HCC transcriptomic data and MS-proteomic-based detection in HCC samples. This way, we stratified high-risk HCC patients and characterized the immunosuppressive tumor microenvironment. Moreover, we independently validated our m6A-related gene panel using proteomic analyses in 101 HCC samples from our center. We confirmed that the high m6AScore HCC subgroup often had shorter survival times. Furthermore, in multiplex immunofluorescence assays, we delineated tumor microenvironment features between low- and high-m6AScore samples and identified more Treg and M2 macrophage infiltration in high-risk samples. This successful validation suggested that our m6A-related gene signature was reliable and robust in evaluating HCC prognosis rates.
To preliminarily understand the m6A-related gene signature, the m6A status of 20 protein-coding genes was analyzed in the SRAMP database. Most genes contained high-confidential m6A clusters, suggesting that they functioned as potential m6A modification targets (Figure S3). Indeed, several genes in the m6A-related signature, such as HDAC2, GYS2, and IGFBP3, were previously shown to regulate cancer development in an m6A-dependent manner; IGFBP3 potentially functions as a downstream effector of the YTHDF2-mediated the m6A-MYC axis to promote glioblastoma stem cell growth (31). GYS2 mRNA was m6A modified by METTL3 and recognized by IGFBP2 to stabilize mRNA transcription, thereby controlling hepatic glycogenesis (32). HDAC2 downregulated expression of the m6A reader, YTHDF2, by modulating clear cell renal cell carcinoma sensitivity to sunitinib therapy (33). Additionally, our GO, KEGG, TMB, and ssGSEA immune cell infiltration analyses identified underlying mechanisms leading to high-risk HCC outcomes. Aberrant MAPK, mTOR, and VEGFA signaling activation and a high TMB potentially account for malignant progression in high-risk HCC patients (Figures 4B, 5B). With respect to the tumor immune microenvironment, the high-risk group tended to form an immunosuppressive microenvironment characterized by distinct Treg and M2 macrophage infiltration (Figures 7, 8). Treg cells can hinder protective immunosurveillance and hamper effective immune responses to tumors, thus accelerating cancer progression (34). M2 macrophages share characteristics with tumor-associated macrophages (TAMs), which promote tumor initiation, metastasis, and malignancy (35). Previous studies reported that dysregulated m6A modification modulated Treg cell and TAM infiltration in tumors (36, 37). Thus, the tumor immunosuppressive microenvironment induced by Treg and M2 macrophages may be another important factor leading to a poor prognosis in high-risk HCC patients.
Given malignant tumor stages and shorter OS rates in the high-risk group, we explored potential treatment strategies. First, using oncogenic signaling pathway enrichment in high-risk patients, potential inhibitor sensitivity toward these pathways was analyzed. High-risk patients may benefit from AKT, MAPK, JNK, and ERK inhibitor treatments, as these agents kill HCC cells at relatively low drug concentrations (Figures 5C–K). In previous decades, immune checkpoint inhibitors have revolutionized HCC treatment. Combined atezolizumab (anti-PD-L1) and bevacizumab (anti-angiogenesis) showed significant improvements in prolonging OS rates when compared with traditional first-line HCC treatments with sorafenib or lenvatinib (38). TMB and positive immune checkpoint molecule expression are both commonly used as biomarkers in selecting responsive patients (39). We found that CTLA4, PD-1, LAG3, and TIM3 were upregulated in high m6AScore HCC samples (Figure 6E). High-risk HCC patients may benefit from immunotherapy based on our TIDE analysis (Figure 6D). Accordingly, inhibitors targeting MAPK signaling, combined with immune checkpoint blockade, may be a promising strategy for high-risk HCC patients. Certainly, this approach requires comprehensive validation in future studies; however, our findings suggest that our m6A-related signature provides a rational therapeutic strategy for HCC patients.
Apart from the important clinical implications of our m6A-related signature, our study had some limitations. First, although some high-confidence m6A clusters were predicted for these genes, whether these 20 protein-coding genes are modified by m6A or whether they exert effects on m6A methylation remains to be clarified. Secondly, it is unclear how these genes cooperatively regulate HCC progression via m6A-associated mechanisms. Additionally, model reliability must be evaluated in future studies, and drug sensitivity validation in high-risk groups must be conducted in prospective, large HCC study cohorts.
In summary, we established an m6A-related protein-coding gene signature to stratify high-risk HCC patients. Moreover, we validated these findings in an independent HCC cohort by MS proteomic detection and characterized the tumor immune microenvironment by multiplex immunofluorescence assay. The model showed prominent potential to evaluate HCC survival and immunosuppressive status. Our m6A signature provides an alternative strategy for risk stratification and better clinical management of patients with HCC.
The data presented in the study are deposited in the TCGA repository, ICGC Data Portal, and supplementary material.The TCGA accession number: phs000178 (https://portal.gdc.cancer.gov/projects/TCGA-LIHC), and the ICGC Data Portal accession number: EGAS00001001692 (https://dcc.icgc.org/releases/current/Projects/LIRI-JP).
The studies involving human participants were reviewed and approved by Ethics Committee of Huashan Hospital Affiliated to Fudan University. The patients/participants provided their written informed consent to participate in this study.
JZ and ZW conceived and designed the study. EM, JL, CS, XZ, YG, and LL collected data, constructed the model, and collected hepatocellular carcinoma samples. EM, JL, and CS performed the experiments. JZ and ZW analyzed the data and drafted the manuscript. All authors critically revised the work and approved the final manuscript.
This study was supported by the Natural Science Foundation of China (No. 82071797, 82173093, 82241225) and the Shanghai Hospital Development Center (SHDC2020CR2021B).
The authors declare that the research was conducted in the absence of any commercial or financial relationships that could be construed as a potential conflict of interest.
All claims expressed in this article are solely those of the authors and do not necessarily represent those of their affiliated organizations, or those of the publisher, the editors and the reviewers. Any product that may be evaluated in this article, or claim that may be made by its manufacturer, is not guaranteed or endorsed by the publisher.
The Supplementary Material for this article can be found online at: https://www.frontiersin.org/articles/10.3389/fimmu.2023.1227593/full#supplementary-material
1. Sung H, Ferlay J, Siegel RL, Laversanne M, Soerjomataram I, Jemal A, et al. Global cancer statistics 2020: GLOBOCAN estimates of incidence and mortality worldwide for 36 cancers in 185 countries. CA Cancer J Clin (2021) 71:209–49. doi: 10.3322/caac.21660
2. Kudo M. Recent advances in systemic therapy for hepatocellular carcinoma in an aging society: 2020 update. Liver Cancer (2020) 9:640–62. doi: 10.1159/000511001
3. Kudo M. Combination cancer immunotherapy in hepatocellular carcinoma. Liver Cancer (2018) 7:20–7. doi: 10.1159/000486487
4. Meyer KD. DART-seq: an antibody-free method for global m6A detection. Nat Methods (2019) 16:1275–80. doi: 10.1038/s41592-019-0570-0
5. Yang Y, Hsu PJ, Chen Y-S, Yang Y-G. Dynamic transcriptomic m6A decoration: writers, erasers, readers and functions in RNA metabolism. Cell Res (2018) 28:616–24. doi: 10.1038/s41422-018-0040-8
6. Zhao J, Xu H, Su Y, Pan J, Xie S, Xu J, et al. Emerging regulatory mechanisms of N6-methyladenosine modification in cancer metastasis. Phenomics (2023) 3:83–100. doi: 10.1007/s43657-021-00043-w
7. Ma J-Z, Yang F, Zhou C-C, Liu F, Yuan J-H, Wang F, et al. METTL14 suppresses the metastatic potential of hepatocellular carcinoma by modulating N6 -methyladenosine-dependent primary MicroRNA processing. Hepatology (2017) 65:529–43. doi: 10.1002/hep.28885
8. Zhong L, Liao D, Zhang M, Zeng C, Li X, Zhang R, et al. YTHDF2 suppresses cell proliferation and growth via destabilizing the EGFR mRNA in hepatocellular carcinoma. Cancer Lett (2019) 442:252–61. doi: 10.1016/j.canlet.2018.11.006
9. Rong Z-X, Li Z, He J-J, Liu L-Y, Ren X-X, Gao J, et al. Downregulation of fat mass and obesity associated (FTO) promotes the progression of intrahepatic cholangiocarcinoma. Front Oncol (2019) 9:369. doi: 10.3389/fonc.2019.00369
10. Cheng X, Li M, Rao X, Zhang W, Li X, Wang L, et al. KIAA1429 regulates the migration and invasion of hepatocellular carcinoma by altering m6A modification of ID2 mRNA. Onco Targets Ther (2019) 12:3421–8. doi: 10.2147/OTT.S180954
11. Yang Z, Li J, Feng G, Gao S, Wang Y, Zhang S, et al. MicroRNA-145 modulates N6-methyladenosine levels by targeting the 3’-untranslated mRNA region of the N6-methyladenosine binding YTH domain family 2 protein. J Biol Chem (2017) 292:3614–23. doi: 10.1074/jbc.M116.749689
12. Chen M, Wei L, Law C-T, Tsang FH-C, Shen J, Cheng CL-H, et al. RNA N6-methyladenosine methyltransferase-like 3 promotes liver cancer progression through YTHDF2-dependent posttranscriptional silencing of SOCS2. Hepatology (2018) 67:2254–70. doi: 10.1002/hep.29683
13. Shi Y, Zhuang Y, Zhang J, Chen M, Wu S. METTL14 inhibits hepatocellular carcinoma metastasis through regulating EGFR/PI3K/AKT signaling pathway in an m6A-dependent manner. Cancer Manag Res (2020) 12:13173–84. doi: 10.2147/CMAR.S286275
14. Li Q, Ni Y, Zhang L, Jiang R, Xu J, Yang H, et al. HIF-1α-induced expression of m6A reader YTHDF1 drives hypoxia-induced autophagy and Malignancy of hepatocellular carcinoma by promoting ATG2A and ATG14 translation. Signal Transduct Target Ther (2021) 6:76. doi: 10.1038/s41392-020-00453-8
15. Bian X, Shi D, Xing K, Zhou H, Lu L, Yu D, et al. AMD1 upregulates hepatocellular carcinoma cells stemness by FTO mediated mRNA demethylation. Clin Transl Med (2021) 11:e352. doi: 10.1002/ctm2.352
16. Shen X, Hu B, Xu J, Qin W, Fu Y, Wang S, et al. The m6A methylation landscape stratifies hepatocellular carcinoma into 3 subtypes with distinct metabolic characteristics. Cancer Biol Med (2020) 17:937–52. doi: 10.20892/j.issn.2095-3941.2020.0402
17. Zheng X, Zhang Y, Wang Y, He Z, Zhang Q, Ren D, et al. Effect of N6-methyladenosine methylation-related gene signature for predicting the prognosis of hepatocellular carcinoma patients. Front Surg (2023) 10:1052100. doi: 10.3389/fsurg.2023.1052100
18. Xie H, Shi M, Liu Y, Cheng C, Song L, Ding Z, et al. Identification of m6A- and ferroptosis-related lncRNA signature for predicting immune efficacy in hepatocellular carcinoma. Front Immunol (2022) 13:914977. doi: 10.3389/fimmu.2022.914977
19. Zhang B, Wu Q, Li B, Wang D, Wang L, Zhou YL. m6A regulator-mediated methylation modification patterns and tumor microenvironment infiltration characterization in gastric cancer. Mol Cancer (2020) 19:53. doi: 10.1186/s12943-020-01170-0
20. Du Y, Ma Y, Zhu Q, Liu T, Jiao Y, Yuan P, et al. An m6A-related prognostic biomarker associated with the hepatocellular carcinoma immune microenvironment. Front Pharmacol (2021) 12:707930. doi: 10.3389/fphar.2021.707930
21. Wilkerson MD, Hayes DN. ConsensusClusterPlus: a class discovery tool with confidence assessments and item tracking. Bioinformatics (2010) 26:1572–3. doi: 10.1093/bioinformatics/btq170
22. Gao Y, Wang H, Li H, Ye X, Xia Y, Yuan S, et al. Integrated analyses of m1A regulator-mediated modification patterns in tumor microenvironment-infiltrating immune cells in colon cancer. Oncoimmunology (2021) 10:1936758. doi: 10.1080/2162402X.2021.1936758
23. Geeleher P, Cox N, Huang RS. pRRophetic: an R package for prediction of clinical chemotherapeutic response from tumor gene expression levels. PloS One (2014) 9:e107468. doi: 10.1371/journal.pone.0107468
24. Jiang P, Gu S, Pan D, Fu J, Sahu A, Hu X, et al. Signatures of T cell dysfunction and exclusion predict cancer immunotherapy response. Nat Med (2018) 24:1550–8. doi: 10.1038/s41591-018-0136-1
25. Subramanian A, Tamayo P, Mootha VK, Mukherjee S, Ebert BL, Gillette MA, et al. Gene set enrichment analysis: a knowledge-based approach for interpreting genome-wide expression profiles. Proc Natl Acad Sci USA (2005) 102:15545–50. doi: 10.1073/pnas.0506580102
26. Youden WJ. Index for rating diagnostic tests. Cancer (1950) 3:32–5. doi: 10.1002/1097-0142(1950)3:1<32::aid-cncr2820030106>3.0.co;2-3
27. Mahipal A, Tella SH, Kommalapati A, Lim A, Kim R. Immunotherapy in hepatocellular carcinoma: is there a light at the end of the tunnel? Cancers (Basel) (2019) 11:1078. doi: 10.3390/cancers11081078
28. Woo HG, Choi J-H, Yoon S, Jee BA, Cho EJ, Lee J-H, et al. Integrative analysis of genomic and epigenomic regulation of the transcriptome in liver cancer. Nat Commun (2017) 8:839. doi: 10.1038/s41467-017-00991-w
29. Sun T, Wu R, Ming L. The role of m6A RNA methylation in cancer. BioMed Pharmacother (2019) 112:108613. doi: 10.1016/j.biopha.2019.108613
30. Jiang X, Liu B, Nie Z, Duan L, Xiong Q, Jin Z, et al. The role of m6A modification in the biological functions and diseases. Signal Transduct Target Ther (2021) 6:74. doi: 10.1038/s41392-020-00450-x
31. Dixit D, Prager BC, Gimple RC, Poh HX, Wang Y, Wu Q, et al. The RNA m6A reader YTHDF2 maintains oncogene expression and is a targetable dependency in glioblastoma stem cells. Cancer Discov (2021) 11:480–99. doi: 10.1158/2159-8290.CD-20-0331
32. Zhang X, Yin H, Zhang X, Jiang X, Liu Y, Zhang H, et al. N6-methyladenosine modification governs liver glycogenesis by stabilizing the glycogen synthase 2 mRNA. Nat Commun (2022) 13:7038. doi: 10.1038/s41467-022-34808-2
33. Li W, Ye K, Li X, Liu X, Peng M, Chen F, et al. YTHDC1 is downregulated by the YY1/HDAC2 complex and controls the sensitivity of ccRCC to sunitinib by targeting the ANXA1-MAPK pathway. J Exp Clin Cancer Res (2022) 41:250. doi: 10.1186/s13046-022-02460-9
34. Togashi Y, Shitara K, Nishikawa H. Regulatory T cells in cancer immunosuppression - implications for anticancer therapy. Nat Rev Clin Oncol (2019) 16:356–71. doi: 10.1038/s41571-019-0175-7
35. Noy R, Pollard JW. Tumor-associated macrophages: from mechanisms to therapy. Immunity (2014) 41:49–61. doi: 10.1016/j.immuni.2014.06.010
36. Li N, Kang Y, Wang L, Huff S, Tang R, Hui H, et al. ALKBH5 regulates anti-PD-1 therapy response by modulating lactate and suppressive immune cell accumulation in tumor microenvironment. Proc Natl Acad Sci USA (2020) 117:20159–70. doi: 10.1073/pnas.1918986117
37. Dong F, Qin X, Wang B, Li Q, Hu J, Cheng X, et al. ALKBH5 facilitates hypoxia-induced paraspeckle assembly and IL8 secretion to generate an immunosuppressive tumor microenvironment. Cancer Res (2021) 81:5876–88. doi: 10.1158/0008-5472.CAN-21-1456
38. Finn RS, Qin S, Ikeda M, Galle PR, Ducreux M, Kim T-Y, et al. Atezolizumab plus bevacizumab in unresectable hepatocellular carcinoma. N Engl J Med (2020) 382:1894–905. doi: 10.1056/NEJMoa1915745
39. Massard C, Gordon MS, Sharma S, Rafii S, Wainberg ZA, Luke J, et al. Safety and efficacy of durvalumab (MEDI4736), an anti–programmed cell death ligand-1 immune checkpoint inhibitor, in patients with advanced urothelial bladder cancer. J Clin Oncol (2016) 34:3119–25. doi: 10.1200/JCO.2016.67.9761
Keywords: M 6 A modification, hepatocellular carcinoma, overall survival, cancer immunity, immunosuppressive microenvironment
Citation: Ma E, Li J, Shen C, Gu Y, Zhang X, Li L, Zhao J and Wang Z (2023) The m6A-related gene signature stratifies poor prognosis patients and characterizes immunosuppressive microenvironment in hepatocellular carcinoma. Front. Immunol. 14:1227593. doi: 10.3389/fimmu.2023.1227593
Received: 23 May 2023; Accepted: 04 August 2023;
Published: 25 August 2023.
Edited by:
Quanjun Yang, Shanghai Jiao Tong University, ChinaReviewed by:
Cheng Guo, Shanghai Jiao Tong University, ChinaCopyright © 2023 Ma, Li, Shen, Gu, Zhang, Li, Zhao and Wang. This is an open-access article distributed under the terms of the Creative Commons Attribution License (CC BY). The use, distribution or reproduction in other forums is permitted, provided the original author(s) and the copyright owner(s) are credited and that the original publication in this journal is cited, in accordance with accepted academic practice. No use, distribution or reproduction is permitted which does not comply with these terms.
*Correspondence: Jing Zhao, SmluZ1poYW9AZnVkYW4uZWR1LmNu; Zhengxin Wang, d2FuZ3poZW5neGluQGh1YXNoYW4ub3JnLmNu
†These authors have contributed equally to this work
Disclaimer: All claims expressed in this article are solely those of the authors and do not necessarily represent those of their affiliated organizations, or those of the publisher, the editors and the reviewers. Any product that may be evaluated in this article or claim that may be made by its manufacturer is not guaranteed or endorsed by the publisher.
Research integrity at Frontiers
Learn more about the work of our research integrity team to safeguard the quality of each article we publish.