
94% of researchers rate our articles as excellent or good
Learn more about the work of our research integrity team to safeguard the quality of each article we publish.
Find out more
ORIGINAL RESEARCH article
Front. Immunol., 06 October 2023
Sec. Autoimmune and Autoinflammatory Disorders : Autoimmune Disorders
Volume 14 - 2023 | https://doi.org/10.3389/fimmu.2023.1213008
This article is part of the Research TopicPulmonary Involvement in Systemic Autoimmune Rheumatic Diseases (SARDs): from Diagnostic Tools to Therapeutic StrategiesView all 7 articles
 Songnan Qin1
 Bingxuan Jiao1
 Bing Kang2
 Haiou Li3Hongwu Liu2Congshan Ji2Shifeng Yang2Hongtao Yuan1
 Ximing Wang1,2*
Rationale and introduction: It is of significance to assess the severity and predict the mortality of patients with connective tissue disease-associated interstitial lung disease (CTD-ILD). In this double-center retrospective study, we developed and validated a radiomics nomogram for clinical management by using the ILD-GAP (gender, age, and pulmonary physiology) index system.
Materials and methods: Patients with CTD-ILD were staged using the ILD-GAP index system. A clinical factor model was built by demographics and CT features, and a radiomics signature was developed using radiomics features extracted from CT images. Combined with the radiomics signature and independent clinical factors, a radiomics nomogram was constructed and evaluated by the area under the curve (AUC) from receiver operating characteristic (ROC) analyses. The models were externally validated in dataset 2 to evaluate the model generalization ability using ROC analysis.
Results: A total of 245 patients from two clinical centers (dataset 1, n = 202; dataset 2, n = 43) were screened. Pack-years of smoking, traction bronchiectasis, and nine radiomics features were used to build the radiomics nomogram, which showed favorable calibration and discrimination in the training cohort {AUC, 0.887 [95% confidence interval (CI): 0.827–0.940]}, the internal validation cohort [AUC, 0.885 (95% CI: 0.816–0.922)], and the external validation cohort [AUC, 0.85 (95% CI: 0.720–0.919)]. Decision curve analysis demonstrated that the nomogram outperformed the clinical factor model and radiomics signature in terms of clinical usefulness.
Conclusion: The CT-based radiomics nomogram showed favorable efficacy in predicting individual ILD-GAP stages.
● Assessment of the severity of CTD-ILD is difficult by conventional imaging modalities.
● Radiomics nomogram can predict the GAP stage with improved efficacy in comparison to clinical factors.
● The CT-based radiomics nomogram might provide treatment guidance for CTD-ILD.
Interstitial lung diseases (ILDs) are spread parenchymal lung disturbances frequently associated with connective tissue disease (CTD) (1). All patients with CTD face the risk of ILD, which may occur at any point during the period of CTD, even the first clinically apparent manifestation of their CTD (2). ILDs are mostly seen in systemic sclerosis (SSc), rheumatoid arthritis (RA), Sjögren’s syndrome (SjS), systemic lupus erythematosus (SLE), idiopathic inflammatory myositis [including polymyositis (PM)/dermatomyositis (DM) and anti-synthetase syndrome], and mixed connective tissue disease (MCTD) (3).
On account of the shortage of randomized controlled trials and recommendations, identifying which treatment to implement for CTD-ILD is currently a predicament for clinicians (3–5). Although it has been reported that ILD is associated with early mortality, which is responsible for up to 35% of CTD-related deaths in some cohorts (6–10), rushing into medical intervention may result in unnecessary drug toxicant exposure on stable patients and opportunity of infection (11, 12). Thus, staging approaches across CTD-ILD for individual treatment need to be developed to relieve impairments (3, 9).
The GAP (gender, age, and pulmonary physiology) index and staging scale were proposed for predicting the mortality risk of idiopathic pulmonary fibrosis (IPF) patients by Ley et al. (13) in 2012 and subsequently improved and validated to adapt non-IPF ILDs by Ryerson et al. (14). The ILD-GAP index scale used gender, age, predicted forced vital capacity (FVC), and diffusion capacity of carbon monoxide (DLCO) to estimate the severity and predict the mortality in patients with chronic ILD. It has been validated to be accurate in various kinds of CTDs (15–19).
Computed tomography (CT) scan remains the main method for ILD diagnosis at present because it is a noninvasive sensitive technique for detecting lung involvement in CTD patients (20–23). CT imaging together with PFT is the gold standard to assess and stage the severity of ILD noninvasively at present (24). However, visual analysis of ILDs on CT image presents difficulty in providing prognosis information because different stages of ILD share overlapping imaging features, conferring difficulty in diagnosing and assessing the severity of ILD by conventional imaging modalities. Radiomics technology can extract a large number of high-dimensional features from CT images, which could make up for the shortcomings of visual assessment. Radiomics has been investigated for diagnosis and prognosis in many diseases, but mostly in different kinds of tumors (25, 26). Radiomics were able to predict mortality and response to treatment in patients with CTD-ILDs, exploring prognostic information hiding beneath CT images that visual assessment has difficulty in acquiring (27, 28). There were correlations between radiomics features and GAP stages, indicating potentials in radiomics to stage patients in CTD-ILDs (29). In the present study, we aimed to establish a CT-based radiomics nomogram to differentiate and stage CTD-ILD phases.
Authorization of the institutional review board was granted, and informed consent was waived.
Patients who were clinically diagnosed with CTD (SSc, RA, SjS, PM/DM, SLE, and MCTD) from June 2015 to June 2021 in Shandong Provincial Hospital Affiliated to Shandong First Medical University (dataset 1) and Qilu Hospital of Shandong University (dataset 2) were screened consecutively. Patients were included when they satisfied all of the following conditions: 1) diagnosed with CTD fulfilling the American college of rheumatology/European league against rheumatism (ACR/EULAR) or other acknowledged classification criteria (30–35), 2) underwent CT scan with signs of ILD within 3 months after clinical diagnosis, and 3) underwent pulmonary function tests (PFTs) and laboratory examination within 30 days before or after the CT scan. Patients were ruled out when they fulfilled any of the following conditions: 1) diagnosed with tumors in the lung; 2) diagnosed with idiopathic interstitial pneumonia, sarcoidosis, or any disease other than CTD that may lead to ILD; 3) any surgical history of the thorax; and 4) incomplete demographic or clinical data. The PFT indices included the percentage predicted values (%predicted) of forced expiratory volume in 1 s (FEV1), FVC, total lung capacity (TLC), and diffusion capacity of carbon monoxide. The ILD-GAP index was calculated according to Ryerson et al. (14). The patients were divided into two groups where Group I included patients with ILD-GAP index ≤1, and Group II included patients with ILD-GAP index >1. All patients were followed up until October 2022 and all-cause mortality was the endpoint. The predictive performance of the ILD-GAP index was evaluated by using univariate variable Cox regression and Harrell’s C index. Patients in dataset 1 were then randomly split into training and internal validation cohorts at a ratio of 7:3. The external validation cohort was composed of patients in dataset 2.
All CT examinations were performed in supine position with maximum inspiration. The detailed scanning parameters are shown in Supplementary Table S1.
The CT images were reviewed by two radiologists (Qin S.N. with 5 years and Wang X.M. with 20 years of thoracic imaging experience) without awareness of any other characteristics of the patients, and divergences were unified by consensus. The presence of visual characteristics of ILD (yes/no), including subpleural lines, reticular changes, honeycombing, pulmonary emphysema, and traction bronchiectasis, was evaluated case-by-case. All CT characteristics mentioned met the Fleischner Society criteria proposed in 2008 (36). The proportion (%) of the parenchymal extent in total lung volume was calculated using the pneumonia diagnosis module of Dr. Turing® artificial intelligence-assisted diagnosis system (Huiying Medical Technology Co., Ltd.).
All CT images were reprocessed by resampling into 1.0-mm-thick slices and intensity normalization into a range of [–1, 1]. The region of interest (ROI) segmentation within the borders of the right lung (window width = 1,500; window level = -750) was manually delineated using the 3D Slicer software (version 4.11, www.slicer.org). The outline of the ROI was contoured avoiding the hilar vessels. The left lung was not segmented, since the presence of the heart may add to the difficulties of segmentation and potentially lead to alterations in the results.
Extraction of the radiomics features was conducted through the Radcloud platform (www.huiyihuiying.com, Huiying Medical Technology Co., Ltd.). Compliant with the definitions of the Imaging Biomarker Standardization Initiative (37), 1,409 radiomics features altogether were retrieved from each ROI, whose information are in the Supplementary Results.
Interclass and intraclass correlation coefficients (ICCs) were applied through the following steps: 20 cases containing 10 Group I patients and 10 Group II patients were randomly selected to perform ROI segmentation by the readers. Reader 1 repeated the segmentation a month later. Segmentation was considered well matched in terms of the interobserver reliability and intraobserver reproducibility when the ICC value was greater than 0.75. Reader 1 then completed the rest of the segmentation procedures.
The clinical factor model comprised significant difference variables between the two groups (p< 0.05) selected by univariate logistic regression analysis, including clinical data, laboratory examinations, and visual CT characteristics. Gender, age, and PFT parameters were excluded to prevent data leakage of the models. Then, the model was built using multivariable logistic regression analysis. Odds ratios (ORs) with 95% confidence intervals (CIs) were calculated for significantly correlated variables.
To prevent model overfitting, dimensionality reduction of the radiomics features was performed before the signature to be constructed. In the training cohort, the features for constructing the radiomics model should satisfy the following conditions: interobserver and intraobserver ICCs exceeding 0.75; remarkable variant from one another as confirmed by analysis of variance; and selected as major contributories for predicting by bringing into the least absolute shrinkage and selection operator (LASSO) regression model. Finally, the radiomics model was constructed using the support vector machine (SVM) with selected features. The radiomics score (Rad-score) representing the weighting coefficient of the features for each patient was calculated.
Incorporating the significant clinical factors and the radiomics signature, a radiomics nomogram was constructed using multivariable logistic regression analysis. Variance inflation factors (VIFs) of the predictors were calculated for multicollinearity. A calibration curve was drawn to estimate the calibration of the combined model. The goodness of fit of combined model was estimated using the Hosmer–Lemeshow test.
The classification performance of the clinical factor model, radiomics model, and combined model to differentiate Group II CTD-ILD from Group I was represented by the area under the curve (AUC) from receiver operating characteristic (ROC) curves. The comparison between the three models was assessed using the likelihood ratio test (LRT). The net benefits for a range of threshold probabilities were calculated by applying decision curve analysis (DCA) to measure the clinical benefit of the combined model. All three models were externally validated based on dataset 2 to evaluate the model generalization ability using ROC analysis.
SPSS (version 26.0) and R software (version 3.5.1) were used to perform statistical tests and analyses. Significantly different clinical characteristics were detected using chi-square test, Fisher exact test, or Mann–Whitney U test, where appropriate. The DeLong test was conducted to test whether the AUC of the models based on the same cohort significantly varied. Categorical and continuous variables are shown by form of frequency (percentages), mean ± standard deviation, or median (interquartile range), where appropriate. The regression analysis, nomogram development, calibration plots, ROC analysis, and DCA were performed by the packages “rms,” “glmnet,” “pROC,” and “dcurves” in R. A two-tailed p value of<0.05 was regarded as indicating significant variation.
Figure 1 showed the process of patients’ enrollment and model construction. Eventually, a total of 245 patients (dataset 1, n = 202; dataset 2, n = 43) were enrolled in this study. Group I included 158 ILD-GAP stage I patients, while Group II included 40 ILD-GAP stage II and four stage III patients. The distribution of their CTD subtypes is detailed in Supplementary Table S2. Table 1 listed the baseline patient characteristics in dataset 1. The ILD-GAP index exhibited increasing mortality in patents with higher stages by univariate Cox regression (Hazard Ratio, 5.364; 95% CI, 1.994–14.424; p = 0.01) and showed acceptable mortality predictive performance (C-index 0.703) in some of the patients of dataset 1 (n = 74). More detailed follow-up information was shown in the Supplementary Material. Table 2 exhibited the outputs of univariable and multivariable logistic regression analyses, which suggested that pack-years of smoking and traction bronchiectasis remained as independent predictors. Patients with a larger number of cigarettes smoked (OR, 1.036; 95% CI, 1.010–1.063) or traction bronchiectasis on CT image (OR, 3.705; 95% CI, 1.222–11.239) tended to have a higher mortality. We examined the two predictors in dataset 2, which showed parallel results (Supplementary Table S4).
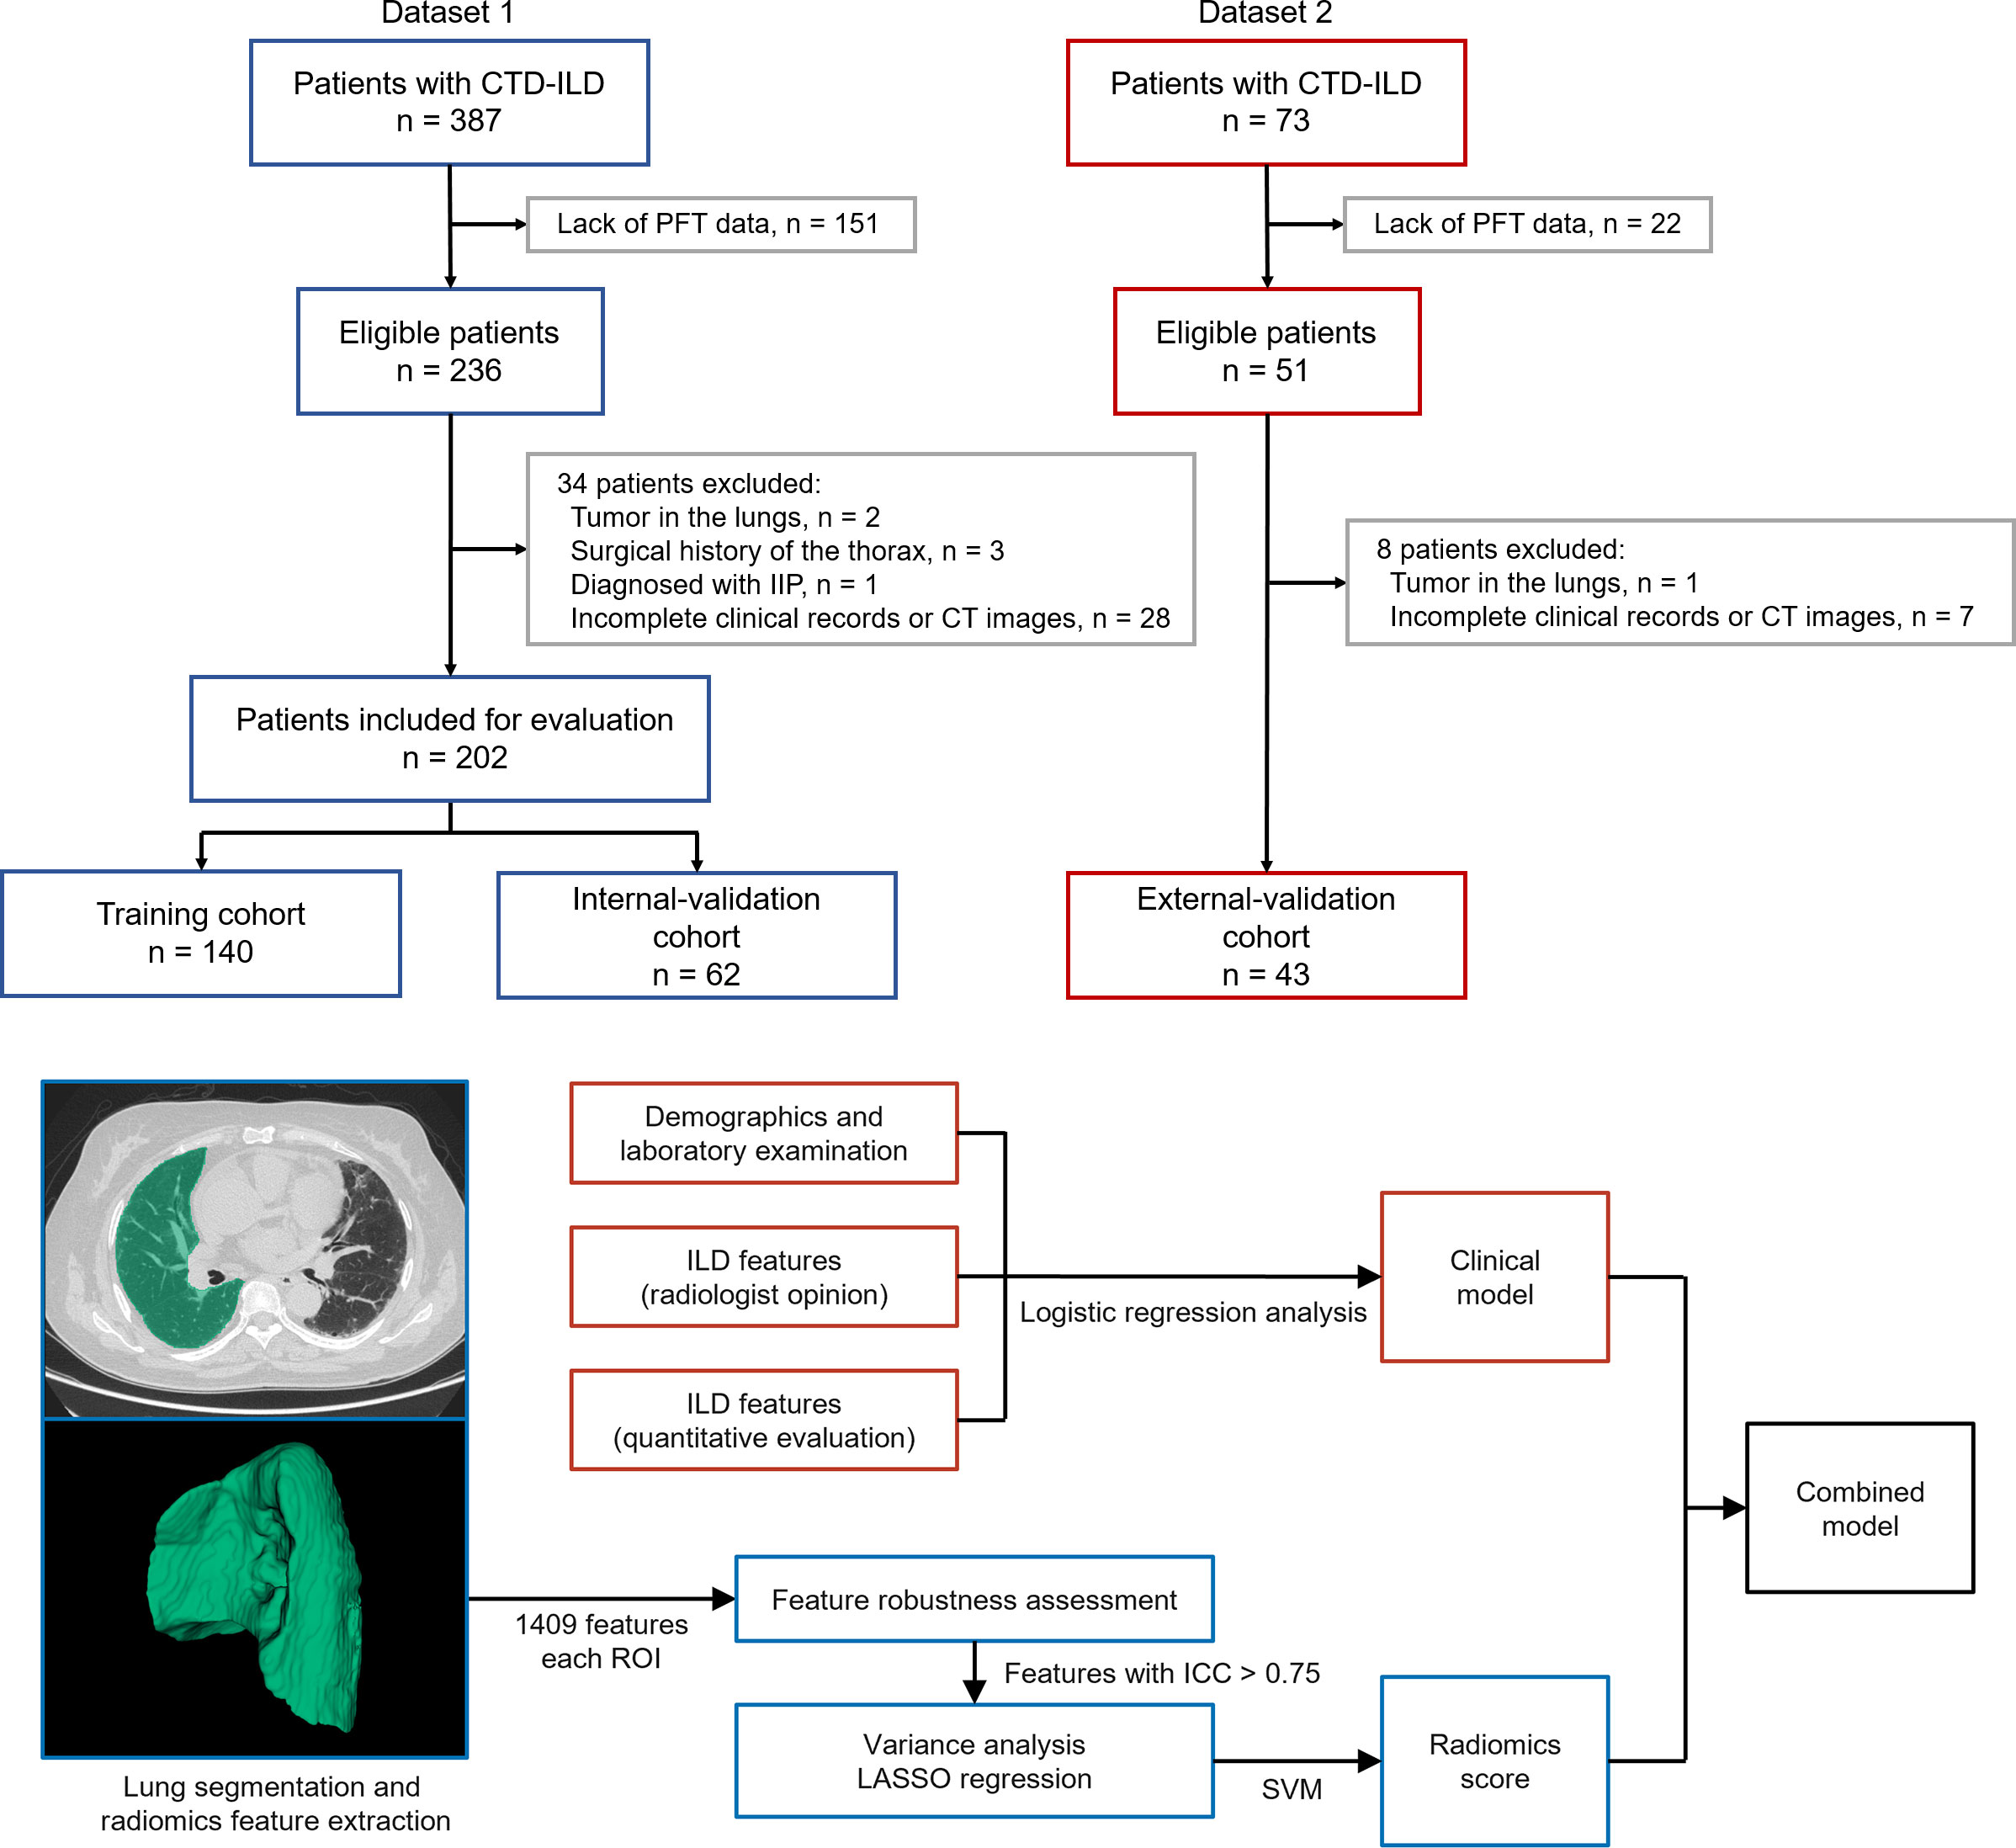
Figure 1 Flowchart of the study patients.
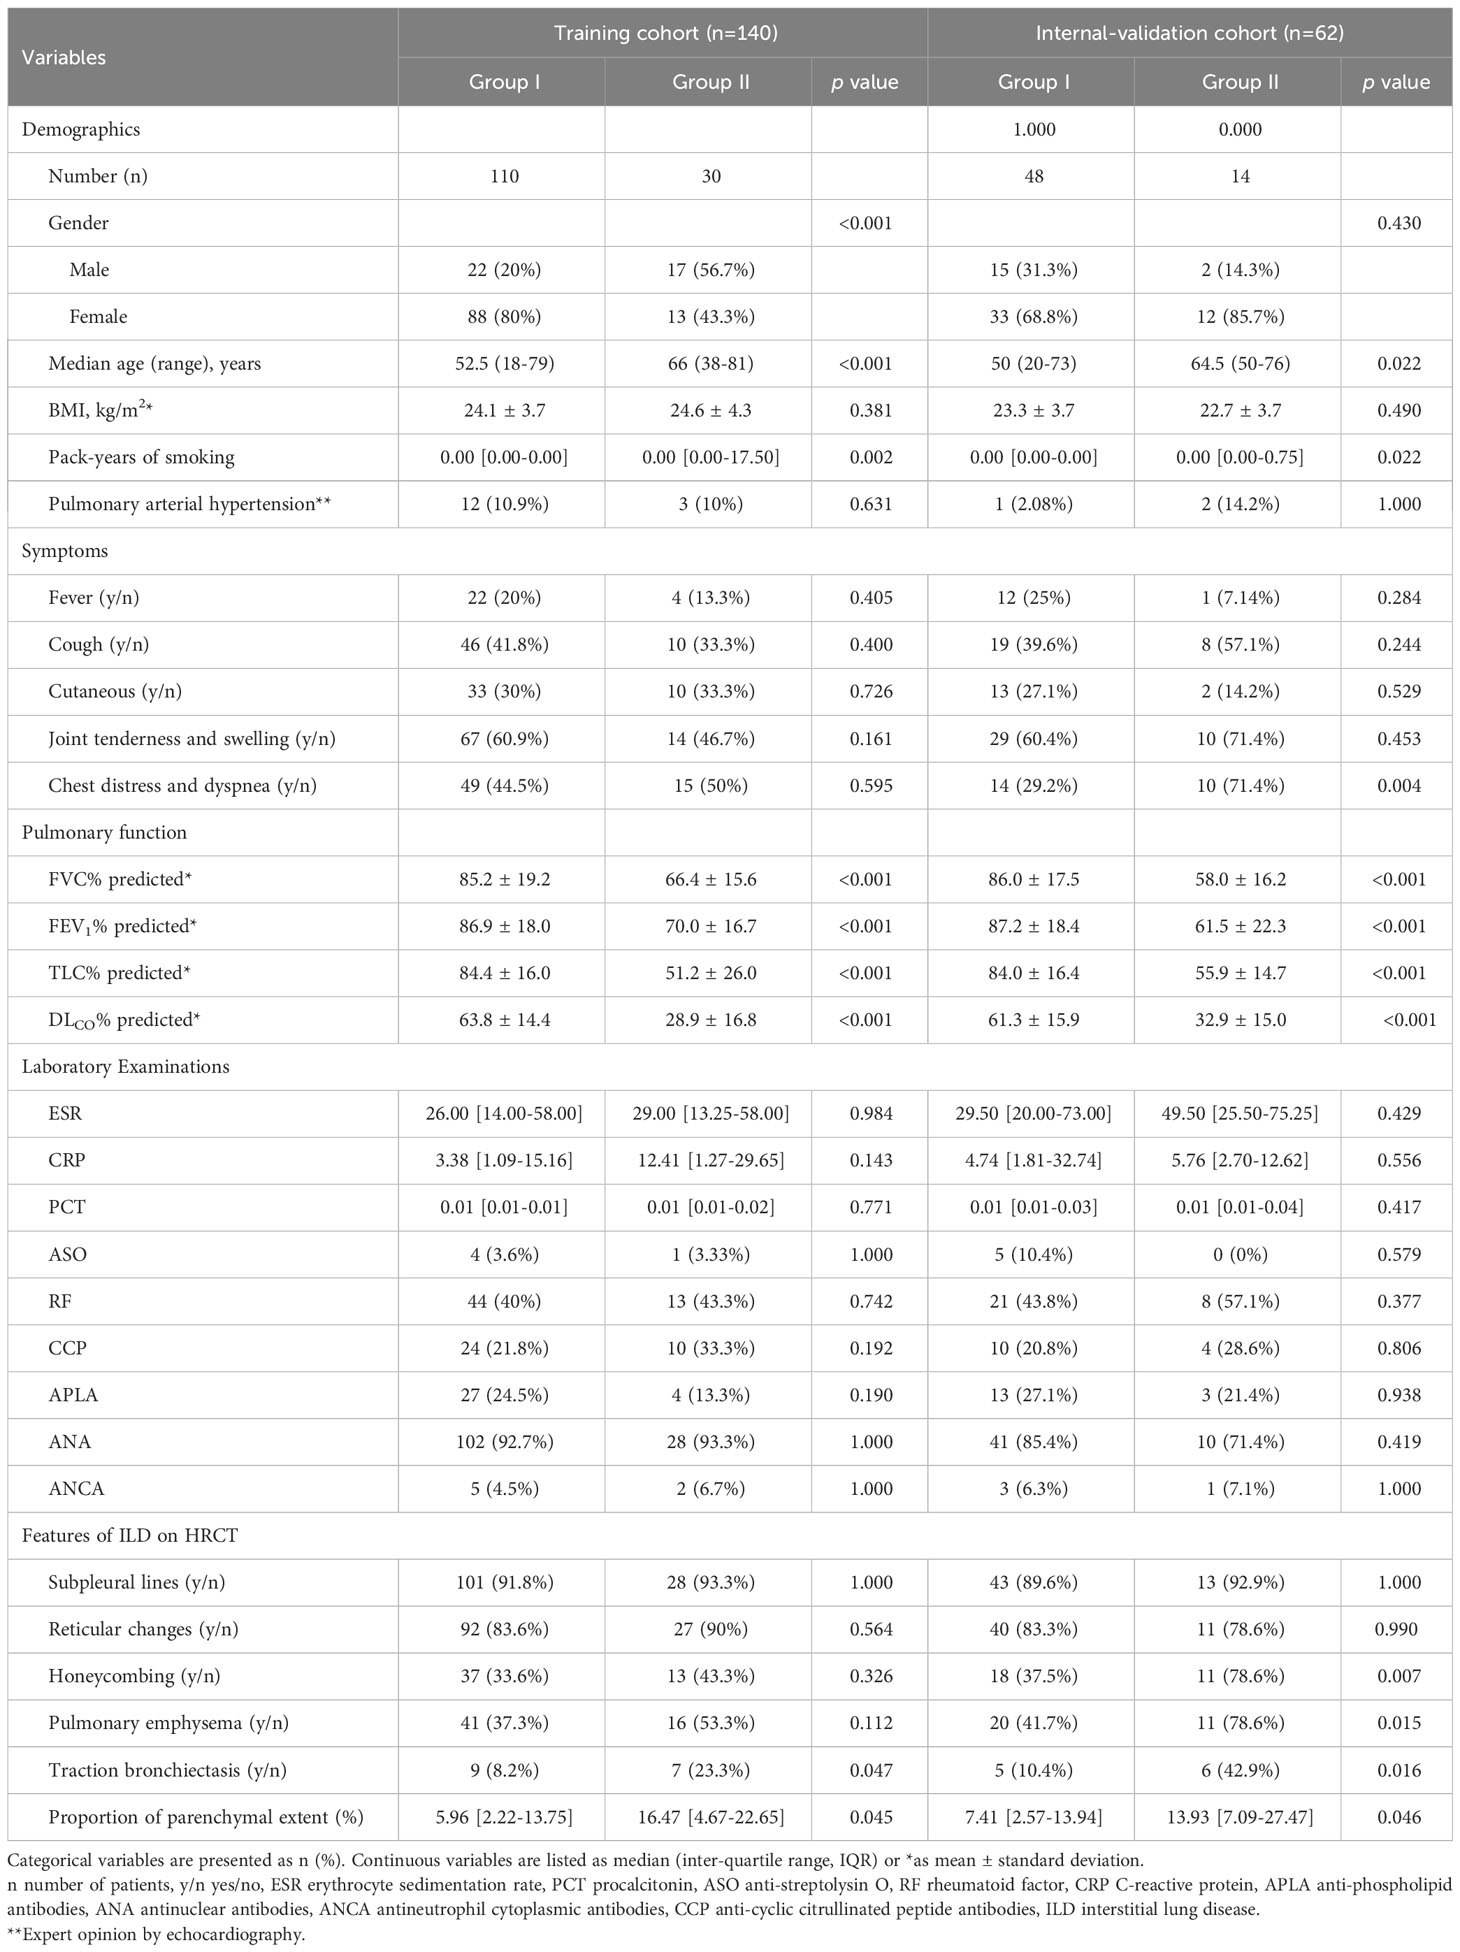
Table 1 Patients’ baseline clinical factors between group I with GAP stage I patients and group II with GAP stage II/III patients in dataset 1.
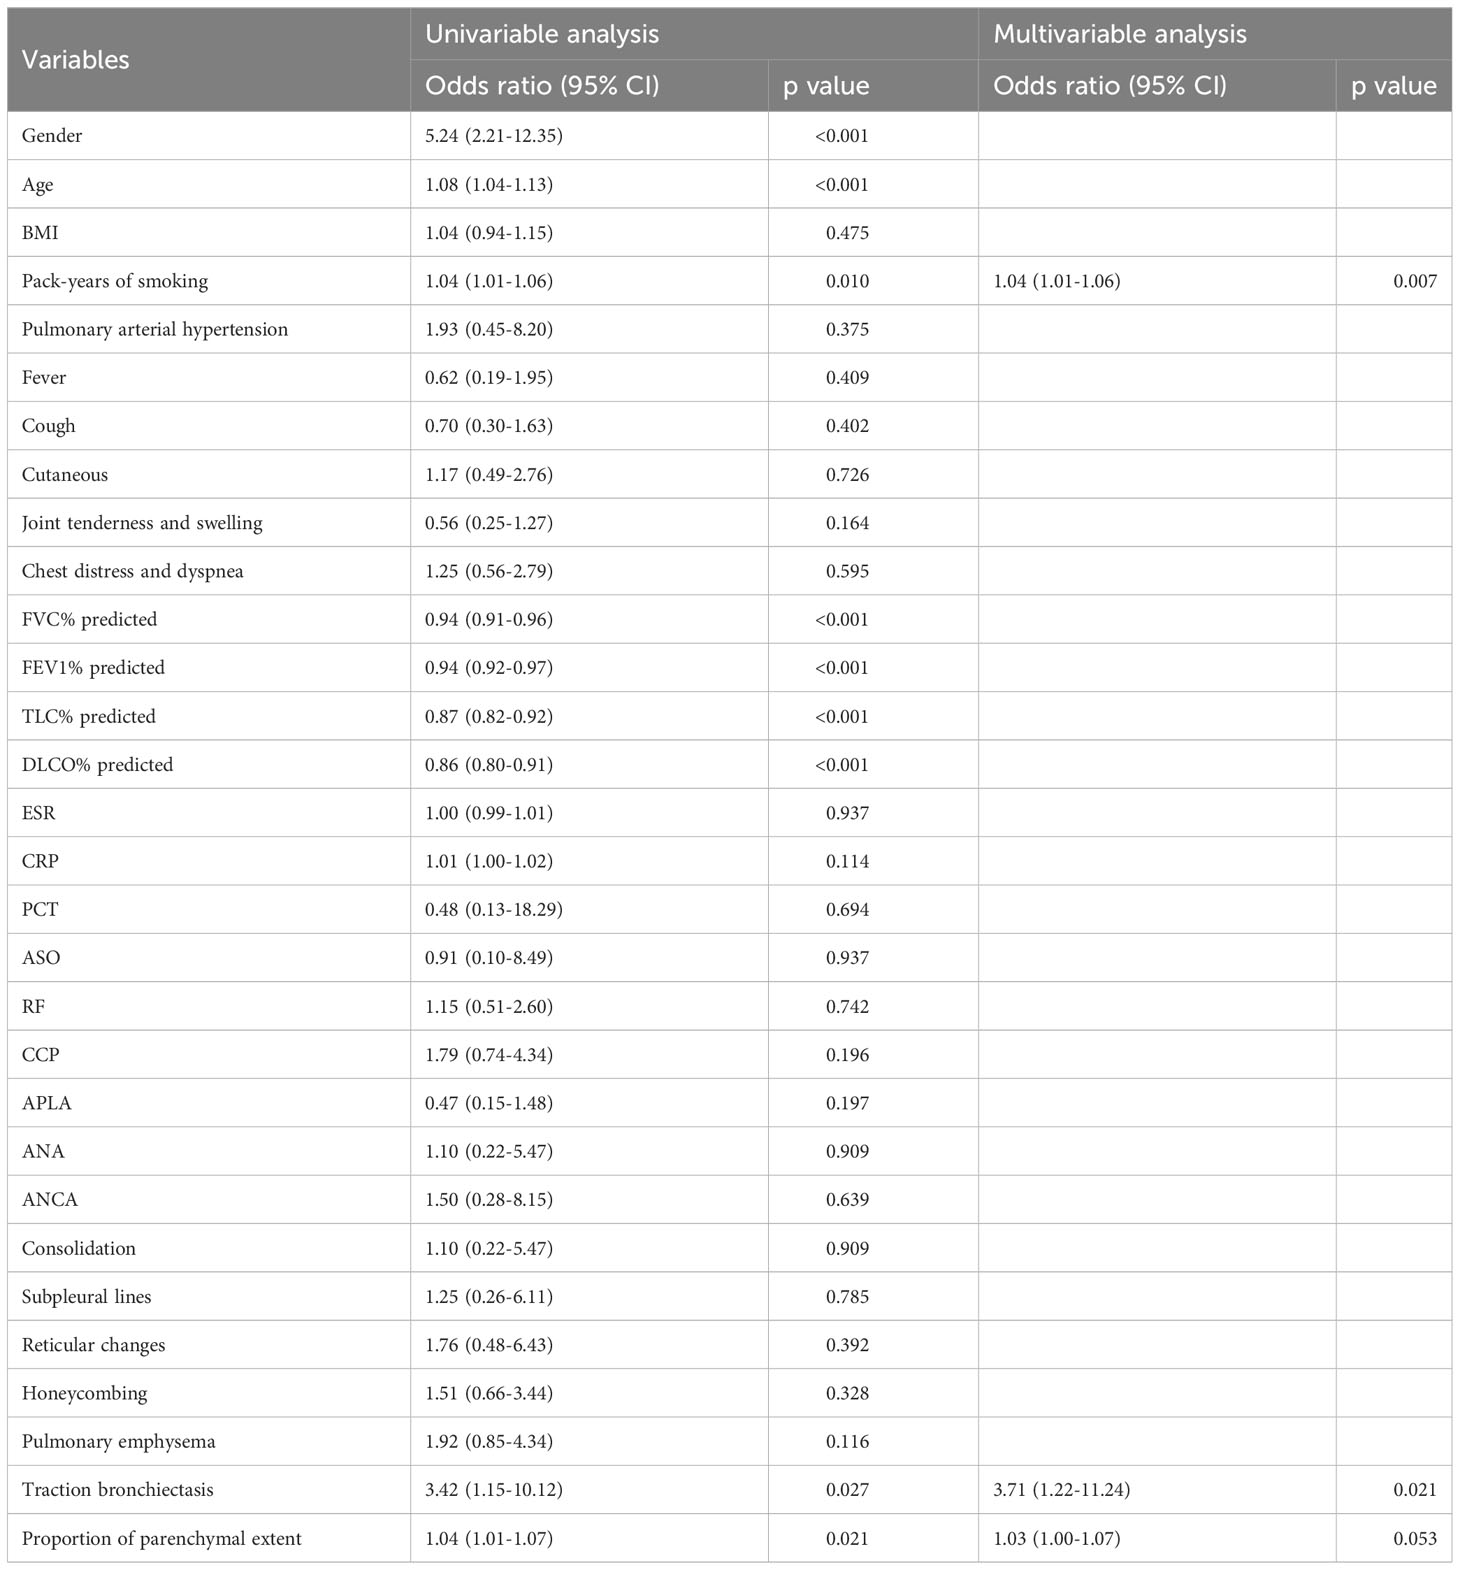
Table 2 Risk factors for Group II CTD-ILD in the training cohort.
A total of 1,409 radiomics features were obtained from the CT images; 1,367 of them were examined to be of promising interobserver and intraobserver accordance (intraclass correlation coefficient >0.75). Seventy significantly different (p< 0.05) radiomics features selected went through the LASSO logistic regression analysis to choose the optimally related features (Figure 2). Eventually, nine features were put into radiomics model construction. Supplementary Table S5 listed elaborated information of the features. The Rad-score was calculated according to the following equation:
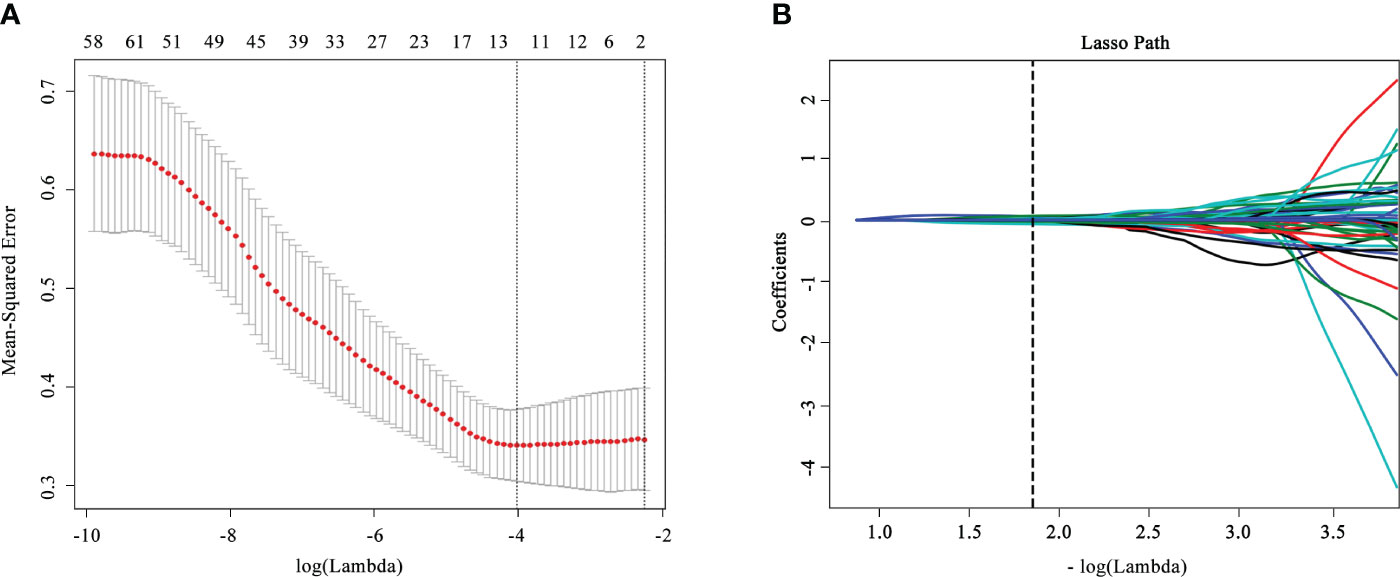
Figure 2 Feature selection and dimensionality reduction workflow. (A) Confirmation of the tuning parameter (λ) in the least absolute shrinkage and selection operator model. An optimal λ value of 0.015 with (vertical dash line) was selected. (B) The feature coefficients varied according to log(λ).
The Rad-score was a tested statistically significant variant between the two groups (p< 0.05; Supplementary Table S6) and presented in Figure 3.
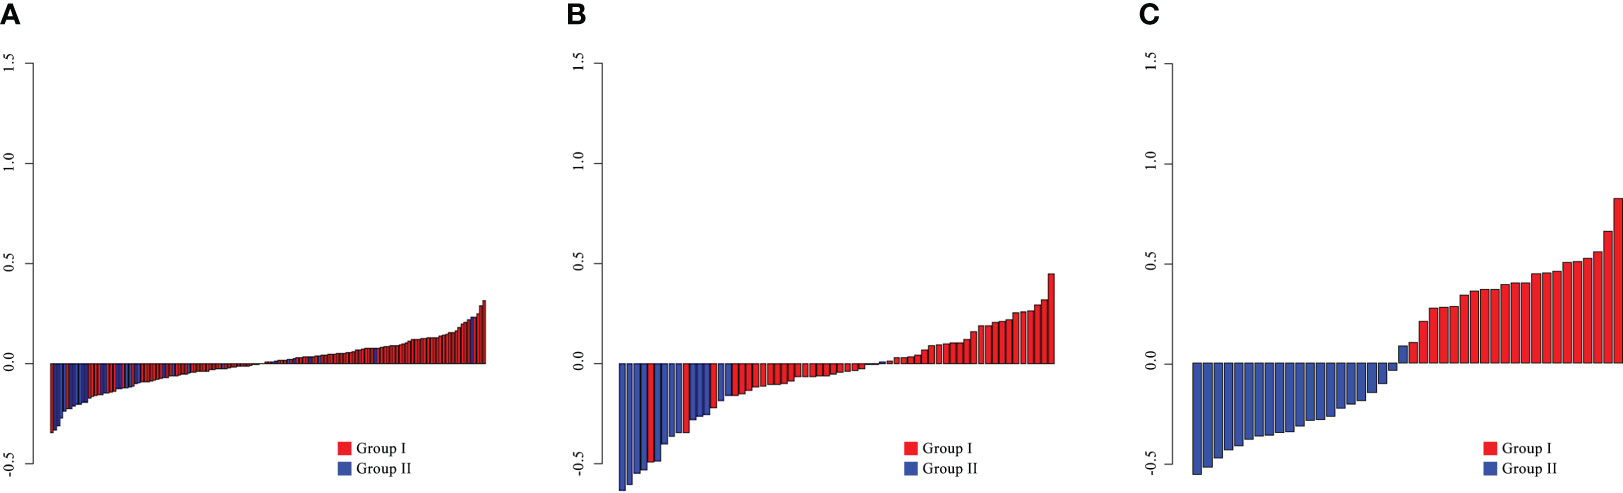
Figure 3 The radiomics scores for each patient in the training (A), internal validation (B), and external validation (C) cohorts.
By comprising the pack-years of smoking, traction bronchiectasis, and Rad-score, a combined model was built in the training cohort (Figure 4A). The VIFs of the predictors ranged from 1.04 to 1.08, indicating that there was no multicollinearity. The calibration curve of the radiomics nomogram is presented in Figures 4B–D, which represented acceptable calibration in the training cohort (p = 0.089), the internal validation cohort (p = 0.107), and the external validation cohort (p = 0.217) through the Hosmer–Lemeshow test. The nomogram score was calculated according to the following equation:
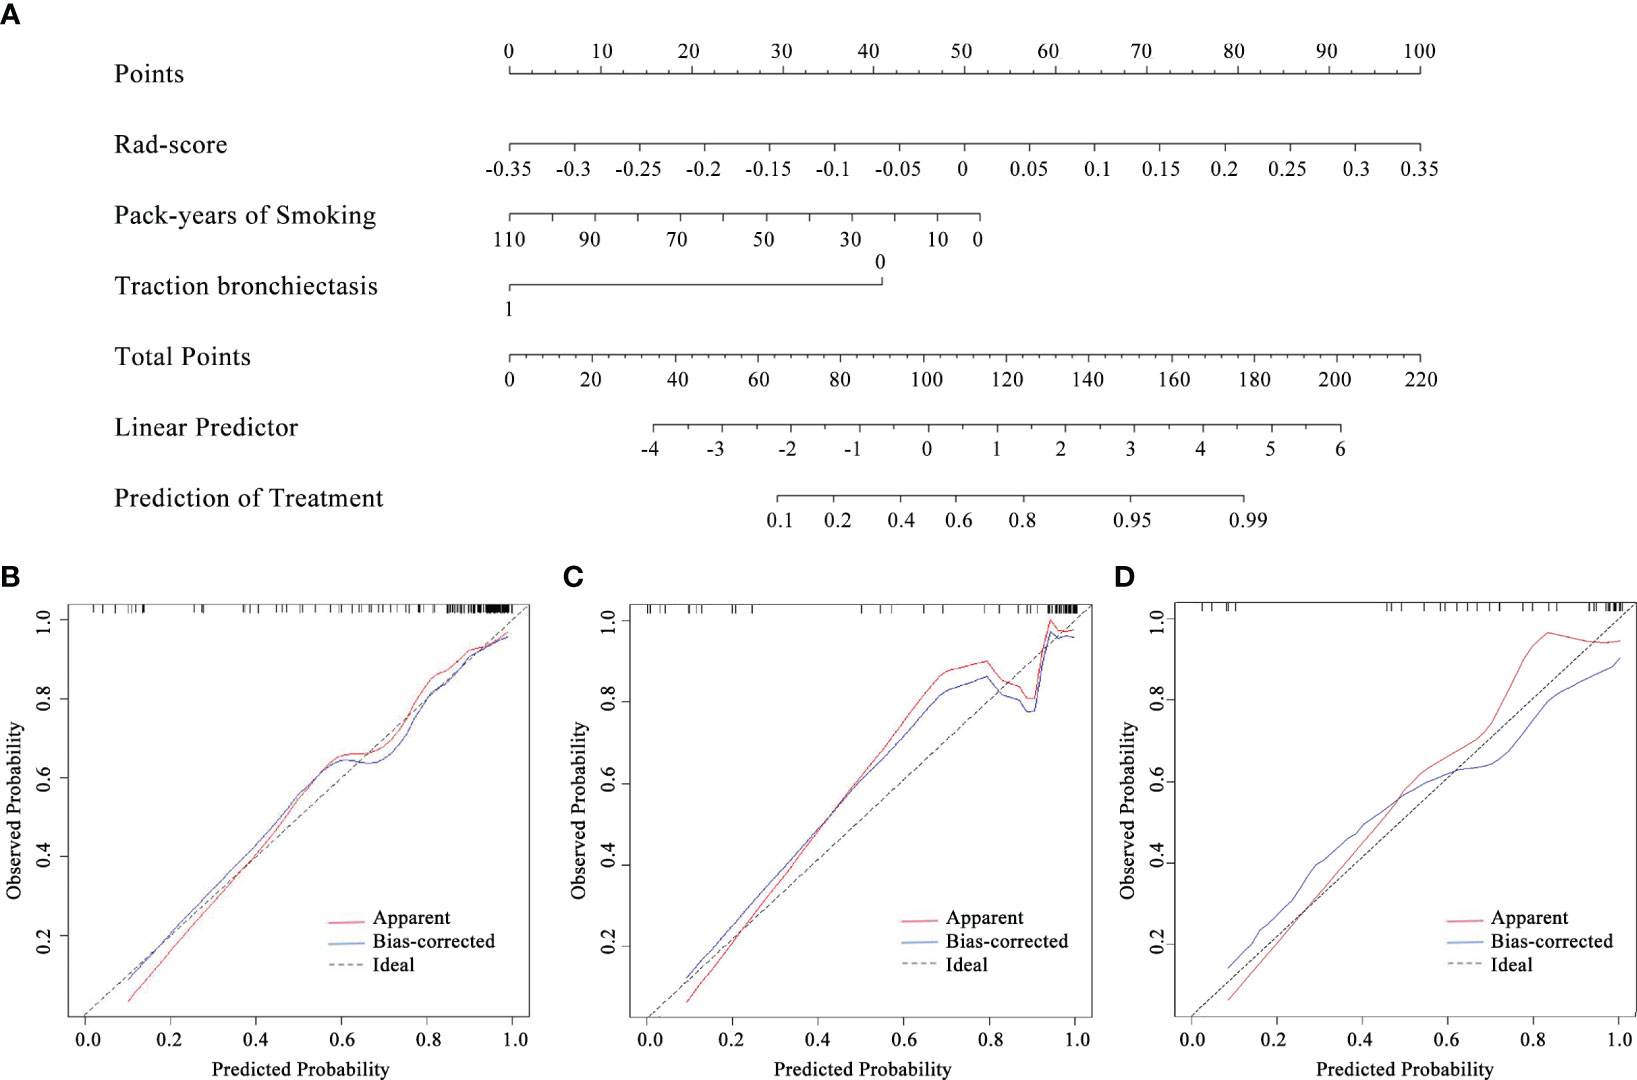
Figure 4 The radiomics nomogram (A) constructed combining pack-years of smoking, traction bronchiectasis, and Rad-score and the calibration curves of the radiomics nomogram in the training (B), internal validation (C), and external validation (D) cohorts.
The capability of the diagnostic efficiency for each model is presented in Table 3. The ROC curves of the clinical factor model and combined model are presented in Figure 5.
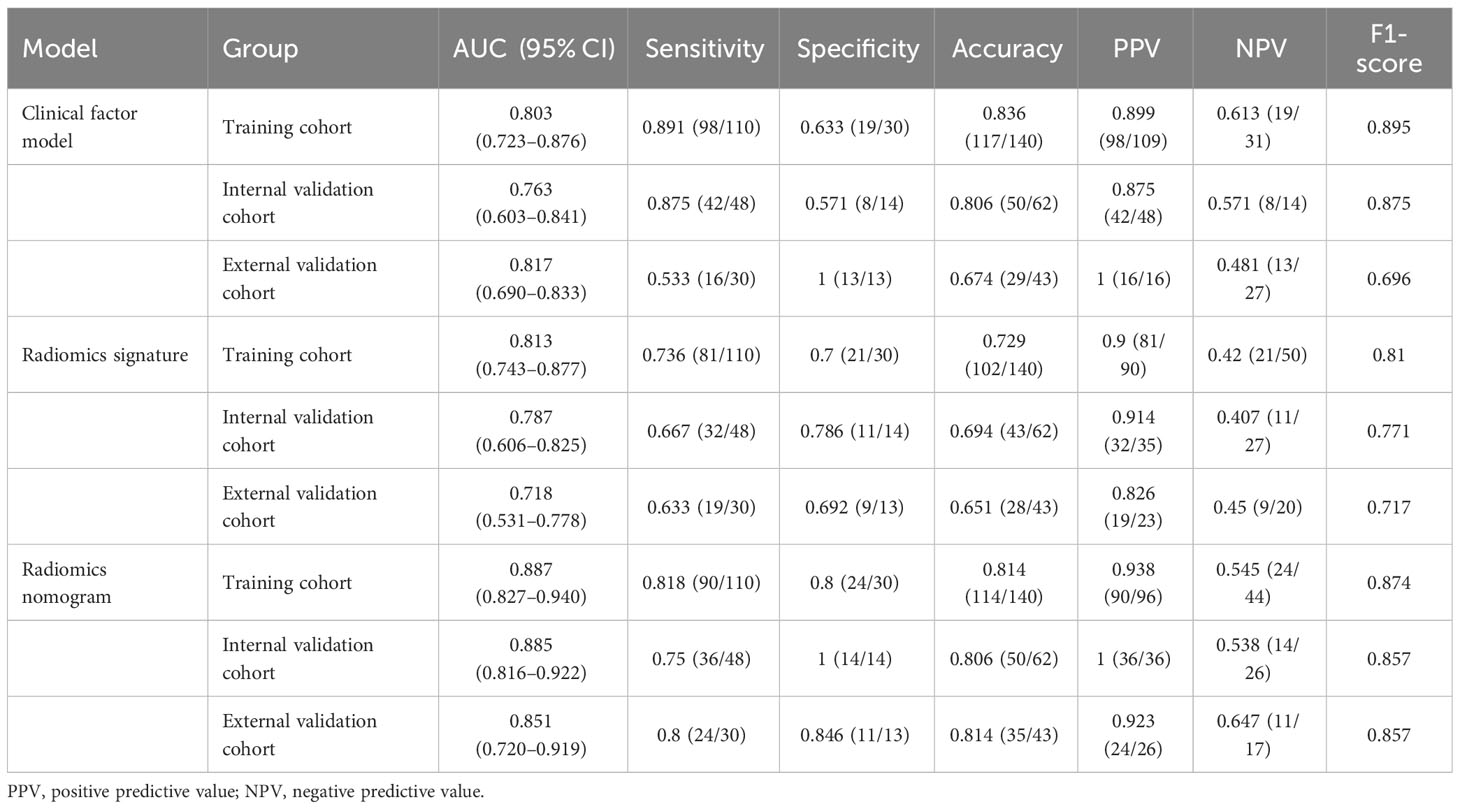
Table 3 Diagnostic performance of the clinical factor model, the radiomics signature, and the radiomics nomogram.
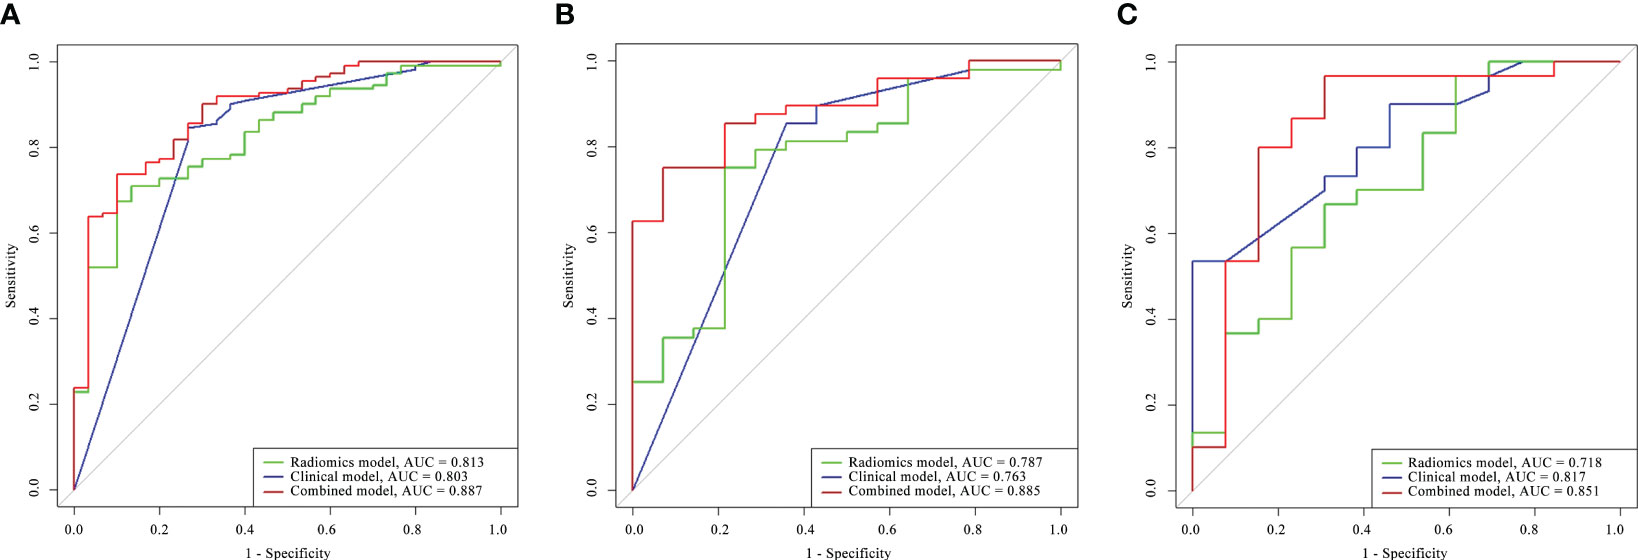
Figure 5 Comparison of the ROC curves for the radiomics model, clinical model, and combined model in the training cohort (A), the internal validation cohort (B), and the external validation cohort (C).
In the training cohort, the AUC of the combined model [AUC, 0.887 (95% CI: 0.827–0.940)] was significantly better than that of the radiomics model [AUC, 0.813 (95% CI: 0.743–0.877); p = 0.011] but not significantly different from that of the clinical factor model [AUC, 0.803 (95% CI: 0.723–0.876); p = 0.873]. The LRT indicated that there was a statistically significant improvement after the inclusion of Rad-score in the clinical factor model (p< 0.001) and after the inclusion of the Independent clinical predictors in the radiomics model (p = 0.036; Table 4). In the internal validation cohort, the combined model [AUC, 0.885 (95% CI: 0.816–0.922)] presented higher predictive efficacy than both the clinical factor model [AUC, 0.763 (95% CI: 0.603–0.841); p = 0.031] and the radiomics signature [AUC, 0.787 (95% CI: 0.606–0.825); p = 0.011]. In the external validation cohort, the combined model achieved an AUC of 0.851 (95% CI: 0.817–0.718) and showed similar predictive performance with the internal validation cohort.
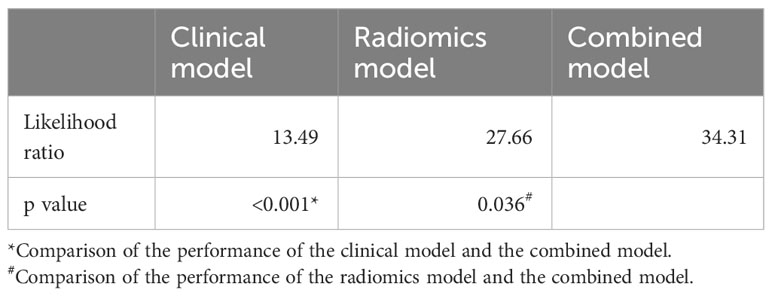
Table 4 Comparison among the three models.
The DCA for the three models presented that the combined model performed better than the clinical model and the radiomics model in distinguishing between different stages of CTD-ILD across the majority of the range of reasonable threshold probabilities (Figure 6).
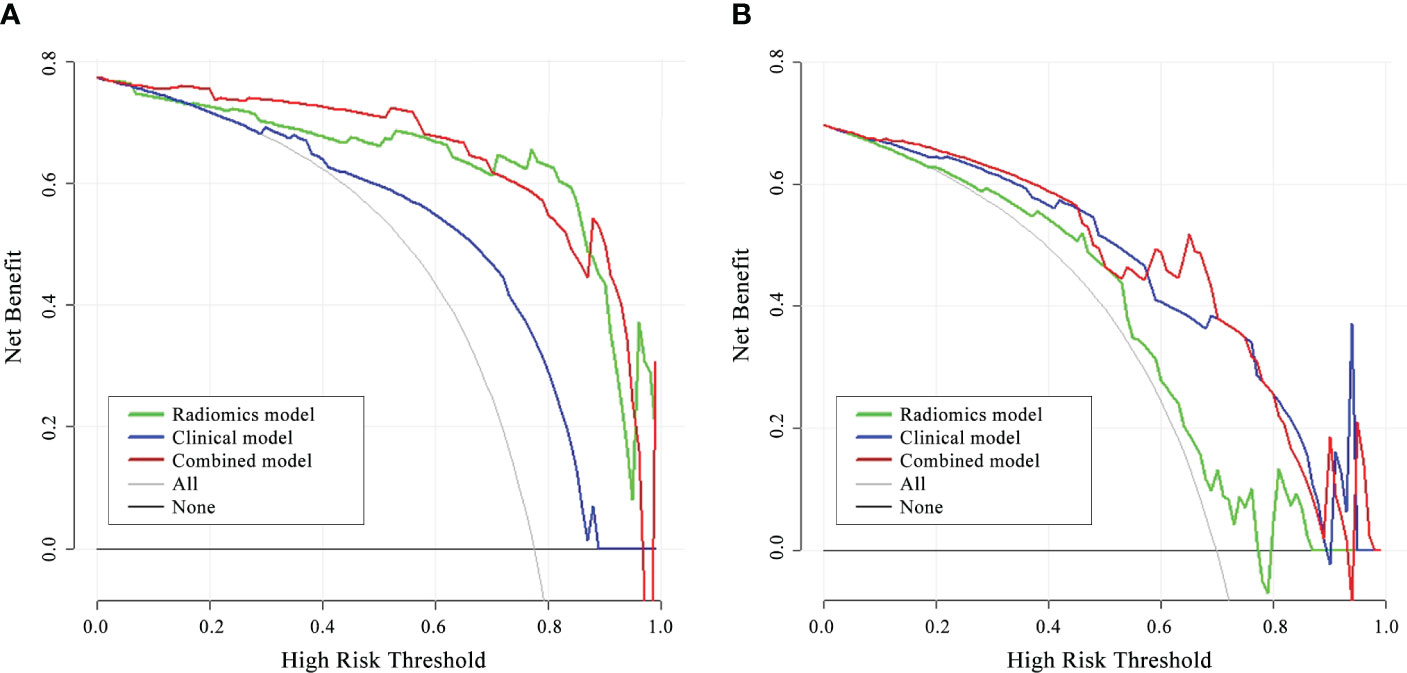
Figure 6 DCA of the three models in the internal validation cohort (A) and external validation cohort (B). The red line, blue line, and green line stand for net benefit of the combined model, the clinical model, and the radiomics model, respectively. The gray line indicates the hypothesis that all patients were Group II CTD-ILD, while the black line is on behalf of the assumption that no patients were Group II CTD-ILD. The net benefit of the combined model is higher than that of the other two models and treating all or none of the patients across the majority range of reasonable threshold probabilities.
The present study showed that the combined model, which incorporated the CT-based Rad-score and clinical variables, had favorable predictive efficacy to distinguish different ILD-GAP stage patients with an AUC of 0.887, 0.885, and 0.851 in the training, internal validation, and external validation cohorts, respectively. In the present study, clinical variables and visual characteristics on CT image were enrolled. Multiple logistic regression analysis revealed that a larger number of cigarettes smoked and traction bronchiectasis on CT were independent predictors. Only 30 patients (14.85%) ever smoked in our dataset, and we believe it is because the number of male patients is smaller (n = 55, 27.23%). This revealed not only actual gender distribution of the CTDs but also the significant influence that smoking exerted on the mortality of CTD-ILD patients. A clinical factor model to classify ILD-GAP stages was then developed, incorporating pack-years of smoking and traction bronchiectasis on CT image, and achieved a high AUC of 0.803, 0.763, and 0.817 in the training, internal validation, and external validation cohorts, respectively. Honeycombing was proven not associated with GAP stages in our study that, however, with traction bronchiectasis were both independent risk factors for mortality in some research (38, 39). This was probably because of some biases caused by the imbalance between the groups. Goh et al. (40) established a staging system using the extent of disease with 20% demarcation for predicting mortality. However, parenchymal extent was not an independent predictor in the GAP index system by multivariable logistic regression analysis (p = 0.053) in our study. This was probably because Goh’s model built for SSc-ILD patients might not be applicable for all kinds of CTD-ILDs. Another reason might be that we did not find an optimal cutoff for parenchymal extent.
Radiomics based on CT image is an objective technique that provides a more reliable and comprehensive quantitative assessment of the images, not hindered by inter-reader variability. In the 1,409 radiomics features obtained from the CT images, eight higher-order texture features extracted from wavelet transformed images were acquired as remarkable elements to build the radiomics model, resulting in an AUC of 0.813, 0.787, and 0.718 in the training, internal validation, and external validation cohorts, respectively. Texture features can quantify information that is difficult to perceive visually, such as texture patterns or tissue distribution (41). Wavelet transform can level it up by obtaining multifrequency domain and multiscale image information after turning original images into different frequency domains (42, 43). For diseases that are difficult to be described by simple visual features, high-dimensional abstract feature extracted from wavelet transformed images can often provide different angles in capturing hidden information that is not easily observed by visual assessment.
Radiomics features have been proven to have potential for the severity estimation of CTD-ILD and treatment decision guidance (29). In recent years, rapidly developed radiomics provided large quantities of radiomics features, enabling full-scale characterization of the images beyond visual analysis. The clinical factor model comprising visual assessment performed significantly poorer in predicting GAP stage than the radiomics nomogram, indicating that information gathered from clinical and radiologic practice might be insufficient, and radiomics had the advantages of capturing and identifying the subtle features of ILD on CT images that were imperceptible to the radiologist but may imply prognosis. At present, there are limited studies focusing on applying radiomics in CTD-ILDs. Martini et al. (29) applied radiomics methods to develop a multivariable model and differentiate GAP stages in 60 patients with SSc, resulting in an AUC of 0.96. Instead of focusing on one single type of CTD, we expanded our samples up to 245 patients with different subtypes of CTD, which improved the universality of our radiomics nomogram. Most of the studies focused on predicting mortality of CTD-ILDs (27, 44); instead, we aimed to stage patients using baseline data and reduce potential unnecessary examinations. The promising results underlined the great potential of radiomics in ILDs. In the future, radiomics could be applied to support treatment decision. Previous studies have also proven that quantitative analysis can be applied to patients with ILDs. Kaya et al. (45) established a quantitative model with an AUC of 0.80 to predict GAP stages in 40 patients with idiopathic pulmonary fibrosis, proven to have the underlying possibility to outperform subjective visual inspection. Jacob et al. (46) proved that the volume of pulmonary blood vessels and surrounding fibrosis in the lungs independently predicted outcome in patients with RA-ILD. Radiomics methods provided much more information on the CT images that cannot be obtained by regular quantitative methods. In the present study, eight out of the nine features were high-order features, which may cover and exceed the quantitative features that previous studies have extracted.
Certain limitations of our study were as follows. First, cases in the two groups of our study were not balanced, therefore reflecting the prevalence of different GAP stages in our clinical population but may have an impact on our results. Second, there is still a gap for the assessment whether and which radiomics features were correlated with pathological manifestations in ILD. Thus, a multidisciplinary method combining clinical, radiological, and pathophysiological information may be proposed to guide individual-based treatment and benefit the prognosis. Third, there are certain holdbacks that radiomics could not be applied to all medical centers regarding technical limitations. The retrospective nature of this study may also hamper its reproducibility and generalization. Therefore, well-designed prospective radiomics trials as well as one-stop services that automatically segment images, extract features, and calculate the Rad-score need to be developed. Moreover, the result of this cross-sectional study may be less precise for using the verified ILD-GAP index system rather than actual mortality of the patients. The exact mortality risk and follow-up results will be investigated in our further research.
In conclusion, a CT-based radiomics nomogram was developed in our study. It revealed better efficacy in staging the severity of CTD-ILD on CT image than visual assessment, which implies that this noninvasive and quantitative method may impact the clinical decision-making process.
The original contributions presented in the study are included in the article/Supplementary Material. Further inquiries can be directed to the corresponding author.
The studies involving humans were approved by Shandong Provincial Hospital Affiliated to Shandong First Medical University. The studies were conducted in accordance with the local legislation and institutional requirements. The ethics committee/institutional review board waived the requirement of written informed consent for participation from the participants or the participants’ legal guardians/next of kin because this was a retrospective study.
SQ, BK, and XW contributed to conception and design of the study. SQ, HL, HWL, BJ and HY organized the database. SQ performed the statistical analysis. SQ wrote the first draft of the manuscript. All authors contributed to manuscript revision, read, and approved the submitted version.
The present study was supported by the National Natural Science Foundation of China (grants 81871354 and 8227071252) and Academic Promotion Programme of Shandong First Medical University (2019QL023).
The authors declare that the research was conducted in the absence of any commercial or financial relationships that could be construed as a potential conflict of interest.
All claims expressed in this article are solely those of the authors and do not necessarily represent those of their affiliated organizations, or those of the publisher, the editors and the reviewers. Any product that may be evaluated in this article, or claim that may be made by its manufacturer, is not guaranteed or endorsed by the publisher.
The Supplementary Material for this article can be found online at: https://www.frontiersin.org/articles/10.3389/fimmu.2023.1213008/full#supplementary-material
1. Fischer A, du Bois R. Interstitial lung disease in connective tissue disorders. Lancet (2012) 380:689–98. doi: 10.1016/S0140-6736(12)61079-4
2. Fischer A, Strek ME, Cottin V, Dellaripa PF, Bernstein EJ, Brown KK, et al. Proceedings of the american college of rheumatology/association of physicians of great britain and Ireland connective tissue disease-associated interstitial lung disease summit: A multidisciplinary approach to address challenges and opportunities. Arthritis Rheumatol (2019) 71:182–95. doi: 10.1002/art.40769
3. Jee AS, Corte TJ. Current and emerging drug therapies for connective tissue disease-interstitial lung disease (CTD-ILD). Drugs (2019) 79:1511–28. doi: 10.1007/s40265-019-01178-x
4. Vacchi C, Sebastiani M, Cassone G, Cerri S, Della Casa G, Salvarani C, et al. Therapeutic options for the treatment of interstitial lung disease related to connective tissue diseases. A narrative review. J Clin Med (2020) 9(2):407. doi: 10.3390/jcm9020407
5. Bendstrup E, Moller J, Kronborg-White S, Prior TS, Hyldgaard C. Interstitial lung disease in rheumatoid arthritis remains a challenge for clinicians. J Clin Med (2019) 8(12):2038. doi: 10.3390/jcm8122038
6. Tyndall AJ, Bannert B, Vonk M, Airo P, Cozzi F, Carreira PE, et al. Causes and risk factors for death in systemic sclerosis: a study from the EULAR Scleroderma Trials and Research (EUSTAR) database. Ann Rheum Dis (2010) 69:1809–15. doi: 10.1136/ard.2009.114264
7. Steen VD, Medsger TA. Changes in causes of death in systemic sclerosis, 1972-2002. Ann Rheum Dis (2007) 66:940–4. doi: 10.1136/ard.2006.066068
8. Palm O, Garen T, Berge Enger T, Jensen JL, Lund MB, Aalokken TM, et al. Clinical pulmonary involvement in primary Sjogren’s syndrome: prevalence, quality of life and mortality–a retrospective study based on registry data. Rheumatol (Oxford) (2013) 52:173–9. doi: 10.1093/rheumatology/kes311
9. Kouranos V, Miranda G, Corte TJ, Renzoni EA. New treatment paradigms for connective tissue disease-associated interstitial lung disease. Curr Opin Pulm Med (2018) 24:453–60. doi: 10.1097/MCP.0000000000000508
10. Mira-Avendano I, Abril A, Burger CD, Dellaripa PF, Fischer A, Gotway MB, et al. Interstitial lung disease and other pulmonary manifestations in connective tissue diseases. Mayo Clin Proc (2019) 94:309–25. doi: 10.1016/j.mayocp.2018.09.002
11. Hyldgaard C, Hilberg O, Pedersen AB, Ulrichsen SP, Lokke A, Bendstrup E, et al. A population-based cohort study of rheumatoid arthritis-associated interstitial lung disease: comorbidity and mortality. Ann Rheum Dis (2017) 76:1700–6. doi: 10.1136/annrheumdis-2017-211138
12. Jee AS, Sheehy R, Hopkins P, Corte TJ, Grainge C, Troy LK, et al. Diagnosis and management of connective tissue disease-associated interstitial lung disease in Australia and New Zealand: A position statement from the Thoracic Society of Australia and New Zealand. Respirology (2021) 26:23–51. doi: 10.1111/resp.13977
13. Ley B, Ryerson CJ, Vittinghoff E, Ryu JH, Tomassetti S, Lee JS, et al. A multidimensional index and staging system for idiopathic pulmonary fibrosis. Ann Intern Med (2012) 156:684–91. doi: 10.7326/0003-4819-156-10-201205150-00004
14. Ryerson CJ, Vittinghoff E, Ley B, Lee JS, Mooney JJ, Jones KD, et al. Predicting survival across chronic interstitial lung disease: the ILD-GAP model. Chest (2014) 145:723–8. doi: 10.1378/chest.13-1474
15. Nurmi HM, Purokivi MK, Karkkainen MS, Kettunen HP, Selander TA, Kaarteenaho RL. Are risk predicting models useful for estimating survival of patients with rheumatoid arthritis-associated interstitial lung disease? BMC Pulm Med (2017) 17:16. doi: 10.1186/s12890-016-0358-2
16. Morisset J, Vittinghoff E, Lee BY, Tonelli R, Hu X, Elicker BM, et al. The performance of the GAP model in patients with rheumatoid arthritis associated interstitial lung disease. Respir Med (2017) 127:51–6. doi: 10.1016/j.rmed.2017.04.012
17. Mango RL, Matteson EL, Crowson CS, Ryu JH, Makol A. Assessing mortality models in systemic sclerosis-related interstitial lung disease. Lung (2018) 196:409–16. doi: 10.1007/s00408-018-0126-6
18. Cao H, Huan C, Wang Q, Xu G, Lin J, Zhou J. Predicting survival across acute exacerbation of interstitial lung disease in patients with idiopathic inflammatory myositis: the GAP-ILD model. Rheumatol Ther (2020) 7:967–78. doi: 10.1007/s40744-020-00244-1
19. Zamora-Legoff JA, Krause ML, Crowson CS, Ryu JH, Matteson EL. Patterns of interstitial lung disease and mortality in rheumatoid arthritis. Rheumatol (Oxford). (2017) 56:344–50. doi: 10.1093/rheumatology/kew391
20. Spagnolo P, Lee JS, Sverzellati N, Rossi G, Cottin V. The lung in rheumatoid arthritis: focus on interstitial lung disease. Arthritis Rheumatol (2018) 70:1544–54. doi: 10.1002/art.40574
21. Solomon JJ, Fischer A. Connective tissue disease-associated interstitial lung disease: A focused review. J Intensive Care Med (2015) 30:392–400. doi: 10.1177/0885066613516579
22. Bryson T, Sundaram B, Khanna D, Kazerooni EA. Connective tissue disease-associated interstitial pneumonia and idiopathic interstitial pneumonia: similarity and difference. Semin Ultrasound CT MR (2014) 35:29–38. doi: 10.1053/j.sult.2013.10.010
23. Hansell DM, Goldin JG, King TE, Lynch DA, Richeldi L, Wells AU. CT staging and monitoring of fibrotic interstitial lung diseases in clinical practice and treatment trials: a Position Paper from the Fleischner society. Lancet Respir Med (2015) 3:483–96. doi: 10.1016/S2213-2600(15)00096-X
24. Shao T, Shi X, Yang S, Zhang W, Li X, Shu J, et al. Interstitial lung disease in connective tissue disease: A common lesion with heterogeneous mechanisms and treatment considerations. Front Immunol (2021) 12:684699. doi: 10.3389/fimmu.2021.684699
25. Nie P, Yang G, Wang Z, Yan L, Miao W, Hao D, et al. A CT-based radiomics nomogram for differentiation of renal angiomyolipoma without visible fat from homogeneous clear cell renal cell carcinoma. Eur Radiol (2020) 30(2):1274–84. doi: 10.1007/s00330-019-06427-x
26. Huang Y, Liu Z, He L, Chen X, Pan D, Ma Z, et al. Radiomics signature: a potential biomarker for the prediction of disease-free survival in early-stage (I or II) non-small cell lung cancer. Radiology (2016) 281:947–57. doi: 10.1148/radiol.2016152234
27. Xu W, Wu W, Zheng Y, Chen Z, Tao X, Zhang D, et al. A computed tomography radiomics-based prediction model on interstitial lung disease in anti-MDA5-positive dermatomyositis. Front Med (Lausanne) (2021) 8:768052. doi: 10.3389/fmed.2021.768052
28. Feng DY, Zhou YQ, Xing YF, Li CF, Lv Q, Dong J, et al. Selection of glucocorticoid-sensitive patients in interstitial lung disease secondary to connective tissue diseases population by radiomics. Ther Clin Risk Manage (2018) 14:1975–86. doi: 10.2147/TCRM.S181043
29. Martini K, Baessler B, Bogowicz M, Bluthgen C, Mannil M, Tanadini-Lang S, et al. Applicability of radiomics in interstitial lung disease associated with systemic sclerosis: proof of concept. Eur Radiol (2021) 31:1987–98. doi: 10.1007/s00330-020-07293-8
30. van den Hoogen F, Khanna D, Fransen J, Johnson SR, Baron M, Tyndall A, et al. 2013 classification criteria for systemic sclerosis: an American college of rheumatology/European league against rheumatism collaborative initiative. Ann Rheum Dis (2013) 72:1747–55. doi: 10.1136/annrheumdis-2013-204424
31. Aletaha D, Neogi T, Silman AJ, Funovits J, Felson DT, Bingham CO 3rd, et al. 2010 rheumatoid arthritis classification criteria: an American College of Rheumatology/European League Against Rheumatism collaborative initiative. Ann Rheum Dis (2010) 69:1580–8. doi: 10.1136/ard.2010.138461
32. Shiboski CH, Shiboski SC, Seror R, Criswell LA, Labetoulle M, Lietman TM, et al. 2016 American college of rheumatology/European league against rheumatism classification criteria for primary sjogren’s syndrome: A consensus and data-Driven methodology involving three international patient cohorts. Arthritis Rheumatol (2017) 69:35–45. doi: 10.1002/art.39859
33. Lundberg IE, Tjarnlund A, Bottai M, Werth VP, Pilkington C, Visser M, et al. 2017 European League Against Rheumatism/American College of Rheumatology classification criteria for adult and juvenile idiopathic inflammatory myopathies and their major subgroups. Ann Rheum Dis (2017) 76:1955–64. doi: 10.1136/annrheumdis-2017-211468
34. Petri M, Orbai AM, Alarcon GS, Gordon C, Merrill JT, Fortin PR, et al. Derivation and validation of the Systemic Lupus International Collaborating Clinics classification criteria for systemic lupus erythematosus. Arthritis Rheumatol (2012) 64:2677–86. doi: 10.1002/art.34473
35. Sharp GC, Irvin WS, Tan EM, Gould RG, Holman HR. Mixed connective tissue disease–an apparently distinct rheumatic disease syndrome associated with a specific antibody to an extractable nuclear antigen (ENA). Am J Med (1972) 52:148–59. doi: 10.1016/0002-9343(72)90064-2
36. Hansell DM, Bankier AA, MacMahon H, McLoud TC, Müller NL, Remy J. Fleischner Society: glossary of terms for thoracic imaging. Radiology (2008) 246(3):697–722. doi: 10.1148/radiol.2462070712
37. Mathis T, Jardel P, Loria O, Delaunay B, Nguyen AM, Lanza F, et al. New concepts in the diagnosis and management of choroidal metastases. Prog Retin Eye Res (2019) 68:144–76. doi: 10.1016/j.preteyeres.2018.09.003
38. Walsh SL, Sverzellati N, Devaraj A, Keir GJ, Wells AU, Hansell DM. Connective tissue disease related fibrotic lung disease: high resolution computed tomographic and pulmonary function indices as prognostic determinants. Thorax (2014) 69:216–22. doi: 10.1136/thoraxjnl-2013-203843
39. Hoffmann-Vold AM, Aaløkken TM, Lund MB, Garen T, Midtvedt Ø, Brunborg C, et al. Predictive value of serial high-resolution computed tomography analyses and concurrent lung function tests in systemic sclerosis. Arthritis Rheumatol (2015) 67(8):2205–12. doi: 10.1002/art.39166
40. Goh NS, Desai SR, Veeraraghavan S, Hansell DM, Copley SJ, Maher TM, et al. Interstitial lung disease in systemic sclerosis: a simple staging system. Am J Respir Crit Care Med (2008) 177:1248–54. doi: 10.1164/rccm.200706-877OC
41. Haralick R, Shanmugam K, Dinstein I. Textural features for image classification. IEEE Trans Systems Man Cybernet (1973) SMC-3(6):610–21. doi: 10.1109/TSMC.1973.4309314
42. Jiang Z, Yin J, Han P, Chen N, Kang Q, Qiu Y, et al. Wavelet transformation can enhance computed tomography texture features: a multicenter radiomics study for grade assessment of COVID-19 pulmonary lesions. Quant Imaging Med Surg (2022) 12(10):4758–70. doi: 10.21037/qims-22-252
43. Zhou J, Lu J, Gao C, Zeng J, Zhou C, Lai X, et al. Predicting the response to neoadjuvant chemotherapy for breast cancer: wavelet transforming radiomics in MRI. BMC Cancer (2020) 20:100. doi: 10.1186/s12885-020-6523-2
44. Venerito V, Manfredi A, Lopalco G, Lavista M, Cassone G, Scardapane A, et al. Radiomics to predict the mortality of patients with rheumatoid arthritis-associated interstitial lung disease: A proof-of-concept study. Front Med (Lausanne) (2023) 9:1069486. doi: 10.3389/fmed.2022.1069486
45. Kaya F, Özgül E, Balcı A. Quantitative and visual analysis of idiopathic pulmonary fibrosis with different methods: the relationship between clinical correlation and mortality risk model. Eur Rev Med Pharmacol Sci (2021) 25:3254–63. doi: 10.26355/eurrev_202104_25734
Keywords: connective tissue diseases, interstitial lung diseases, radiomics, machine learning, computed tomography
Citation: Qin S, Jiao B, Kang B, Li H, Liu H, Ji C, Yang S, Yuan H and Wang X (2023) Non-contrast computed tomography-based radiomics for staging of connective tissue disease-associated interstitial lung disease. Front. Immunol. 14:1213008. doi: 10.3389/fimmu.2023.1213008
Received: 27 April 2023; Accepted: 15 September 2023;
Published: 06 October 2023.
Edited by:
Eirini Vasarmidi, University of Crete, GreeceReviewed by:
Nicol Bernardinello, University of Padua, ItalyCopyright © 2023 Qin, Jiao, Kang, Li, Liu, Ji, Yang, Yuan and Wang. This is an open-access article distributed under the terms of the Creative Commons Attribution License (CC BY). The use, distribution or reproduction in other forums is permitted, provided the original author(s) and the copyright owner(s) are credited and that the original publication in this journal is cited, in accordance with accepted academic practice. No use, distribution or reproduction is permitted which does not comply with these terms.
*Correspondence: Ximing Wang, d3htaW5nMzY5QDE2My5jb20=
Disclaimer: All claims expressed in this article are solely those of the authors and do not necessarily represent those of their affiliated organizations, or those of the publisher, the editors and the reviewers. Any product that may be evaluated in this article or claim that may be made by its manufacturer is not guaranteed or endorsed by the publisher.
Research integrity at Frontiers
Learn more about the work of our research integrity team to safeguard the quality of each article we publish.