
94% of researchers rate our articles as excellent or good
Learn more about the work of our research integrity team to safeguard the quality of each article we publish.
Find out more
ORIGINAL RESEARCH article
Front. Immunol., 11 July 2023
Sec. Alloimmunity and Transplantation
Volume 14 - 2023 | https://doi.org/10.3389/fimmu.2023.1192440
This article is part of the Research TopicRole of the Immune System in Renal Transplantation: Importance, Mechanism, and TherapyView all 12 articles
 Emilie Gaiffe1,2†
 Mathilde Colladant2,3†Maxime Desmaret1,2
 Jamal Bamoulid2,3Franck Leroux1Caroline Laheurte2Sophie Brouard4Magali Giral4
 Philippe Saas2
 Cécile Courivaud2,3
 Nicolas Degauque4
 Didier Ducloux1,2,3*
Background: Acute rejection persists as a frequent complication after kidney transplantation. Defining an at-risk immune profile would allow better preventive approaches.
Methods: We performed unsupervised hierarchical clustering analysis on pre-transplant immunological phenotype in 1113 renal transplant recipients from the ORLY-EST cohort.
Results: We identified three immune profiles correlated with clinical phenotypes. A memory immune cluster was defined by memory CD4+T cell expansion and decreased naïve CD4+T cell. An activated immune cluster was characterized by an increase in CD8+T cells and a decreased CD4/CD8 ratio. A naïve immune cluster was mainly defined by increased naïve CD4+T cells. Patients from the memory immune profile tend to be older and to have diabetes whereas those from the activated immune profile were younger and more likely to have pre-transplant exposure to CMV. Patients from the activated immune profile were more prone to experience acute rejection than those from other clusters [(HR=1.69, 95%IC[1.05-2.70], p=0.030) and (HR=1.85; 95%IC[1.16-3.00], p=0.011). In the activated immune profile, those without previous exposure to CMV (24%) were at very high risk of acute rejection (27 vs 16%, HR=1.85; 95%IC[1.04-3.33], p=0.039).
Conclusion: Immune profile determination based on principal component analysis defines clinically different sub-groups and discriminate a population at high-risk of acute rejection.
With progress in immunosuppression, acute rejection became less frequent during the last decades. However, it still concerns 15 to 20% of kidney transplant recipients and affects long-term graft survival (1, 2). Pre-transplant risk factors explaining why only some patients developed acute rejection while they are all exposed to similar immunosuppression are imperfectly defined. Clinical factors (age, race), Human Leucocyte Antigen (HLA) typing and alloantibody screening are practically the only determinants that can be used for risk stratification.
In this context, it is tempting to search for immune biomarkers that could be predictive of acute rejection. Several candidates have been evaluated. Patients with positive donor-reactive or panel T cell reactive IFNγ ELISPOT assay are more likely to experience acute rejection (3, 4). Pre-transplant soluble CD30 (Cluster of Differentiation) has been suggested to be predictive of acute rejection (5). Our group reported that pre-transplant Recent Thymic Emigrant (RTE) were strongly associated with the occurrence of acute rejection in antithymocyte globulin (ATG)-treated kidney transplant recipients (6). Finally, the incidence of acute rejection has been reported to depend on specific genetic polymorphisms (7–9). Nevertheless, it should be emphasized that most of these studies have not or could not be replicated.
All these studies suffered from a major bias. Every immune parameter, cell or molecule, interacts with virtually all the immune system and should be interpreted in a general context, taking into account for positive and negative interactions. Thus, a more global approach is needed to consider the complexity of the system. Nevertheless, the number of information to collect is very important and often redundant. Thus, the data have to be summarized and reduced for better analysis.
Principal component analysis (PCA) is a method of comprehensive multivariate statistics and data analysis that allows to reduce the dimensionality of a dataset, enhancing interpretation while preserving information diversity (10). In the clinical setting of kidney transplantation, PCA should permit to merge patients with a similar biological profile. Thus, detection of specific immune profiles would be critical for detection of at-risk patients for acute rejection and subsequent targeted prevention.
In this study, we used individual determination of a panel of immune cells obtained from flow cytometry (including both frequency and total amount). Using hierarchical clustering, we separated different groups of patients based on immune profile. We first correlated these biological profiles with clinical profiles and second, determined whether biological profile may help to discriminate patients at risk for acute rejection.
Research has been conducted in the 1113 kidney transplant recipients from the Influence de l’Orientation de la Réponse LYmphocytaire (ORLY-Est, NCT02843867) study. ORLY-Est is a prospective cohort study of incident renal transplant recipients in 7 French transplant centers (Besançon, Clermont-Ferrand, Dijon, Le Kremlin-Bicêtre, Nancy, Reims and Strasbourg) (6). The main objective of this study was to describe interactions between immune status and atherosclerosis after transplantation. For each patient, blood samples were collected at the time of transplantation and 1 year later. Clinical data were prospectively collected at the time of transplantation, 1 year, 3 years, 5 years and 10 years later. Sample collection was performed after regulatory approval by the French Ministry of Health (agreement number DC-2008-713, June 11, 2009). The ethics committee of the Franche-Comté study approved the study (2008). Patients enrolled in the ORLY-Est study gave their written informed consent.
To avoid the effects of previous immunosuppression on immune profile, we excluded patients having received a previous transplantation (n=126, 11.3%). Among the remaining 987 recipients of a first transplant, 205 patients (21%) had received T-cell depleting ATG therapy and 528 (63%) had received nondepleting aCD25 mAb therapy. One hundred and fifty five (15.7%) had missing data making inclusion in PCA impossible. Finally, eight hundred and thirty two were analyzed (Figure 1). Calcineurin inhibitors and mycophenolate mofetil were widely used as an immunosuppressive regimen. All the transplant procedures were performed with a negative cross match. Cytomegalovirus (CMV) prophylaxis was given according to each center’s practice. All patients received Pneumocystis antimicrobial prophylaxis with trimethoprim sulfamethoxazole for at least 6 months.
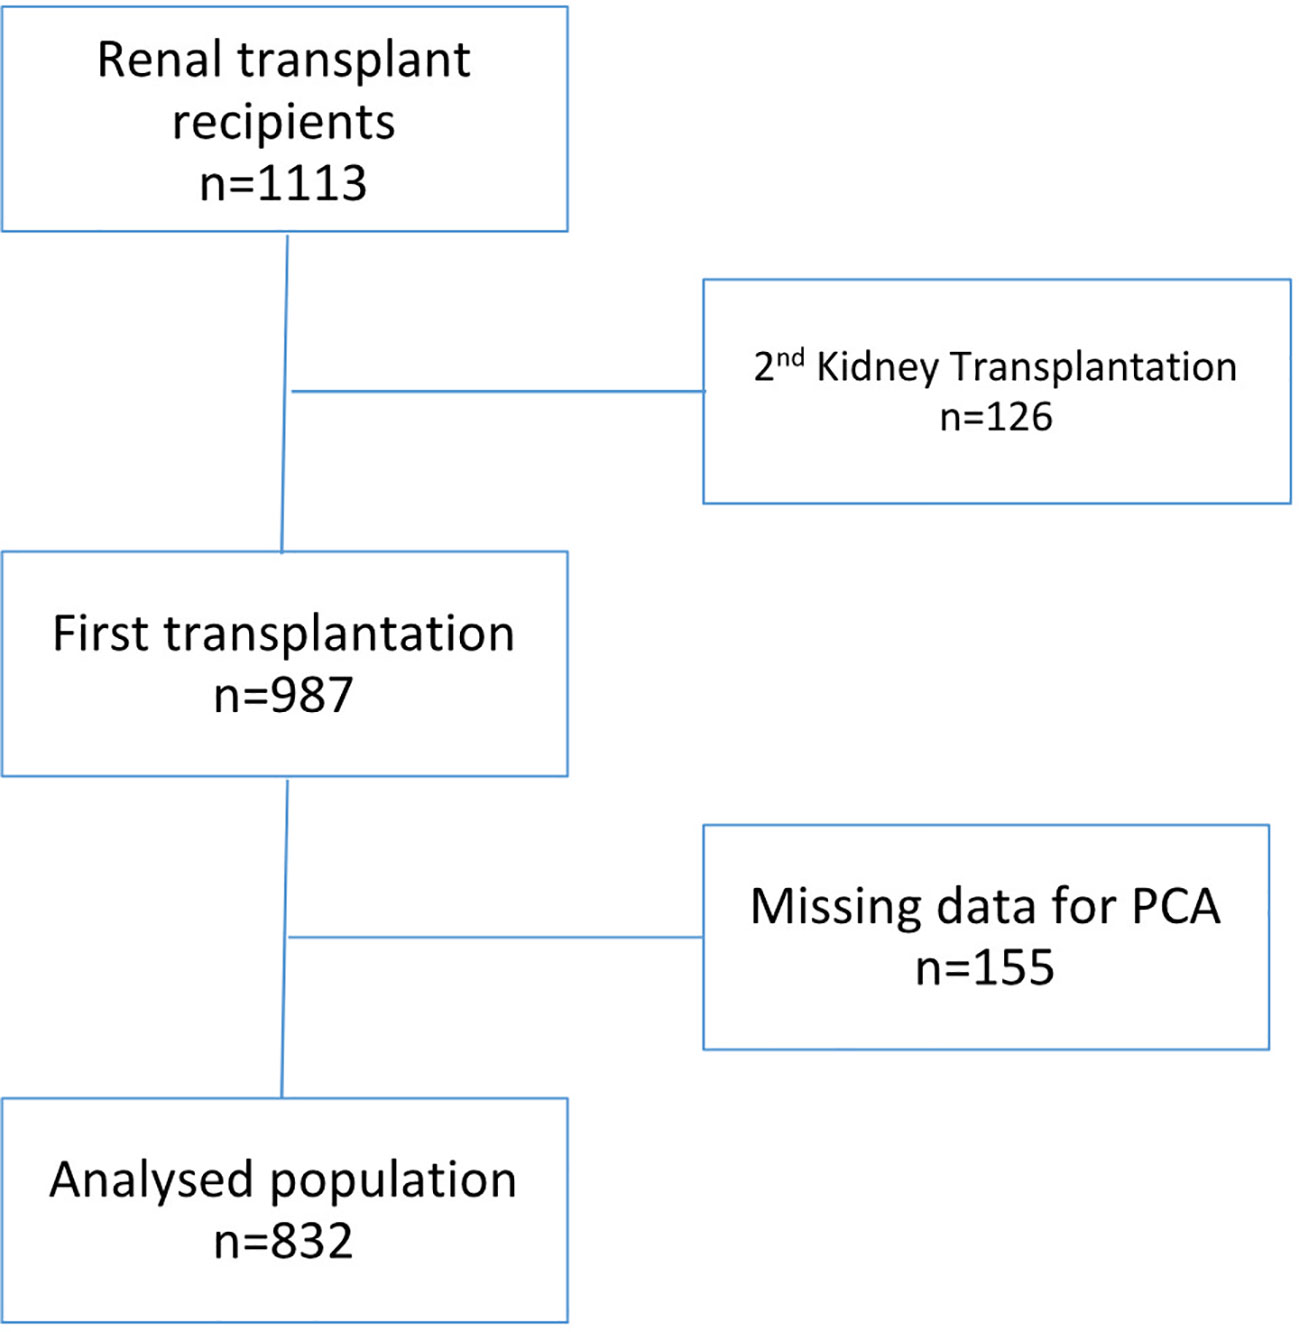
Figure 1 Patient flow chart.
Age, gender, body mass index, diabetes, dyslipidemia, hypertension, past history of cardiovascular events, previous neoplastic history, and chronic lung disease were analyzed as covariates. Dialysis mode (none, hemodialysis, or peritoneal dialysis), and its duration prior to transplantation were also recorded. HLA mismatches were recorded for HLA-A, -B, and -DR loci. Other relevant immunological parameters such as, pre-transplant panel reactive antibodies (0 vs. positive at any level), and transplant type (living/deceased) were analyzed as covariates. Cold ischemia time, donor age, and presence of delayed graft function were also considered. Methods of assessment and definitions of these variables have been previously described in details (6).
Peripheral blood mononuclear cells were isolated by density gradient centrifugation (Pancoll; Pan-Biotech GmBH, Aidenbach, Germany). Cells were stained with the following conjugated antibodies directed against CD3, CD4, CD8, CD31, CD45RA CD16, CD56, CD14 and CD45RO. The identification of lymphocyte subpopulations is carried out using four combinations of cluster of differentiation. The source and clone of each antibody is specified in the Supplementary materials and methods. Immune markers used in PCA included lymphocytes, monocytes and Natural Killer (NK) cells identified by: T cells (CD3+), CD4+ T cells (CD3+CD4+CD8-), CD8+ T cells (CD3+CD8+CD4-), B cells (CD19+), NK cells (CD56+CD3-), naive CD4+ T cells (CD4+CD45RA+), memory CD4+ T cells (CD4+CD45RO+), RTE (CD4+CD45RA+CD31+), classical monocytes (CD14+CD16-) and intermediate monocytes (CD14+CD16+). Antibody clones and gating strategies are detailed in Supplementary materials and methods. For exploring the association between lymphocytes subsets and acute rejection, CD45RA and CCR7 serve as defining four T cell subsets (naïve, CD45RA+CCR7+; effector memory, CD45RA-CCR7-; central memory, CD45RA-CCR7+; effector memory expressing CD45RA, CD45RA+CCR7-) (11).
Cell debris and doublets were excluded on the basis of side versus forward scatter. Percentage of T cells, B cells, NK cells and monocytes were determined on fresh samples by flow cytometry with an FC500 cytometer (Beckman Coulter, Villepinte, France) according to the manufacturer’s recommendations. Absolute numbers of different immune population, CD4+ and CD8+ T cells were determined on fresh samples by a single platform flow cytometry approach using the TetraCXP method, Flow-Count fluorospheres, and the same cytometer.
Acute rejection was considered in the presence of serum creatinine elevation. Only biopsy-proven acute rejections were considered. Acute rejection was defined according to the Banff classification (12). Only cellular acute rejections were considered.
Delayed Graft Function (DGF) was considered when dialysis is needed in the first week after transplantation.
Pre-transplant immunological populations were used for the Principal Component Analysis (PCA) (CD3+, CD3+CD4+, CD45RO+CD4+, CD45RA+CD4+, CD31+CD45RA+CD4+, CD3+CD8+, CD19+, CD3+CD56+, CD45CD14+, CD45CD14+DR+ cell count and frequency as well as CD4/CD8 ratio). Only patients with all available analyses were included. We retained components with eigenvalues above 1. We then performed unsupervised hierarchical clustering based on the significant components using Ward’s method with Euclidian distances. The number of clusters was selected based on the higher relative loss of inertia criteria [iclusters n+1/i(cluster n)]. Detailed analysis is depicted in Supplementary materials and methodes. PCA and clustering were performed using the FactoMineR version 2.3 package with R version 4.0.2 (R Core Team, Vienna, Austria).
Clinical characteristics of the participants were described with mean expressed as +/- SD, median with the interquartile range (IQR) and numbers of events with percentage. After PCA and clustering, each cluster was described using the 18 quantitative immunologic parameters as well as clinical characteristics. Cluster comparisons were based on analysis of variance (ANOVA) for quantitative variables and chi-2 test for categorical variables (or Fischer test when appropriate).
Survival without acute rejection analysis was then performed for the clusters using Kaplan-Meier survival curves. As patient may die or return to dialysis before experiencing the outcome of interest, death from any cause as well as graft failure were considered as competing risks. Therefore, we used a competing-risk approach. The time-to-event was calculated from the date of transplantation to the outcome (acute rejection). Cumulative incidence function curves were also constructed for each cluster. The Fine-Gray model was used to analyze the prognostic effect of belonging to a specific cluster on the sub-distribution hazard function of the outcome (13). Unadjusted as well as age- and gender-adjusted sub-distribution relative hazards were estimated with the corresponding 95% confidence intervals (CI). Competing risk analysis was performed with R using the survival and prodlim version 2019.11.13 packages or using Prism, version 5.0 software (GraphPad Software, San Diego, CA) and SAS software (SAS institute Inc., Cary, NC).
Characteristics of the study population were depicted in Table 1. Mean age was 53 ± 14 years and about two thirds of patients were male. Twenty percent had diabetes mellitus. All the patients had at least a one-year follow-up. The rate of missing data was < 5 percent for all studied parameters.
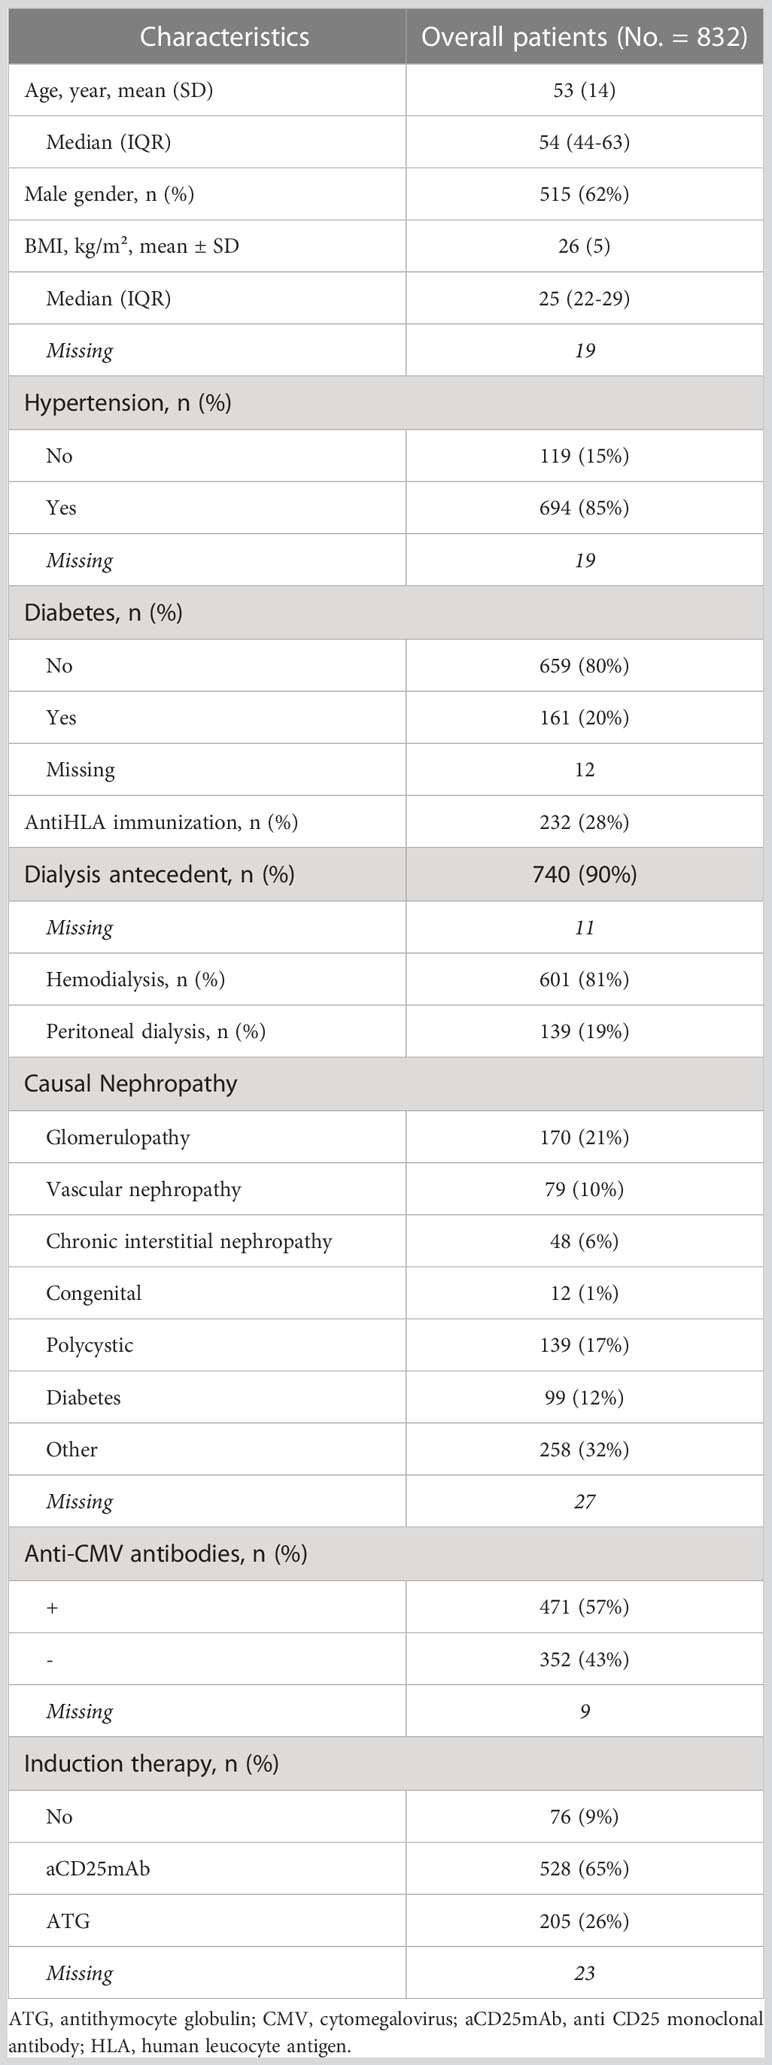
Table 1 Clinical characteristics of the study population.
A PCA was conducted on immune cells (frequency and total amount). PCA identified three clusters of individuals based on the distances between each branches of the dendogram (Figure 2A). Clusters, determined by the unsupervised hierarchical clustering analysis, were supposed to define immune profile and reflect groups of patients with similar immunophenotype. Three clusters were isolated (Figure 2B; Table 2).
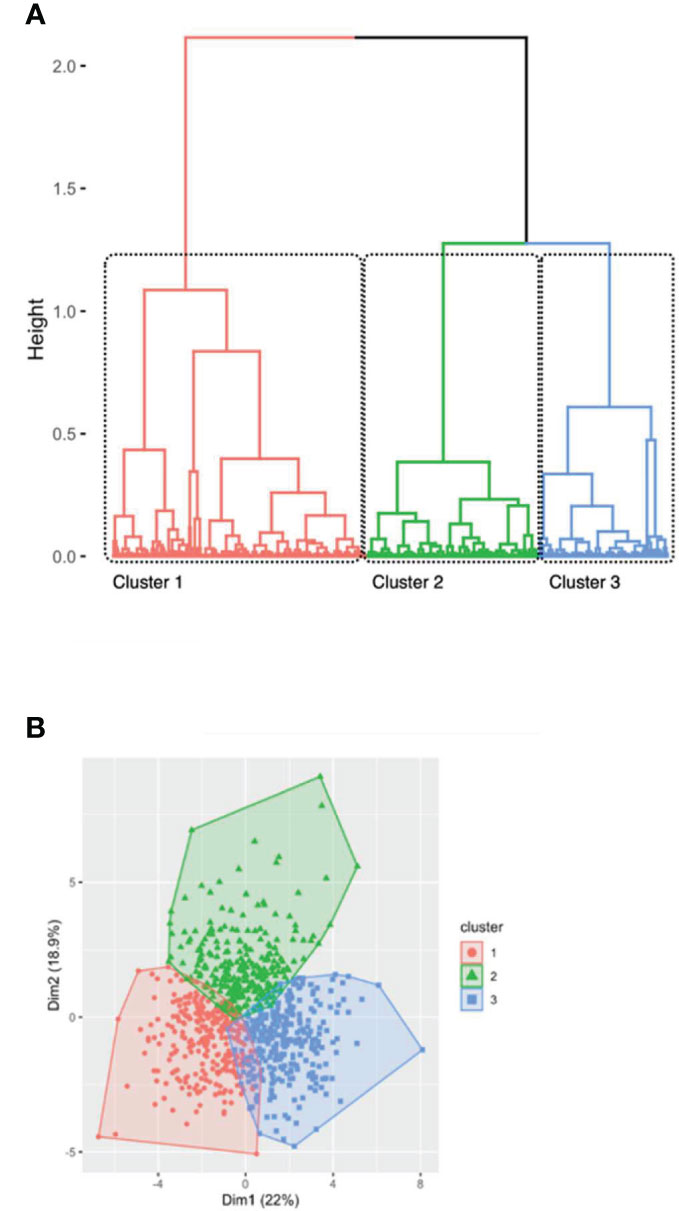
Figure 2 Hierarchical clustering of patients after principal component analysis (A) represented by the dendrogram of patients and (B) by a scatter view plot. (A) identification of 3 clusters among 832 first transplant recipients according to immunological data. Profiles were assigned based on the separation of the clustering trees. (B) Colors were based on clustering profile and mainly defined by dimension 2 and dimension 1 in our hierarchical clustering. Three clusters were identified: older immunity in red (cluster 1), activated immunity in green (cluster 2) and naïve immunity in blue (cluster 3).
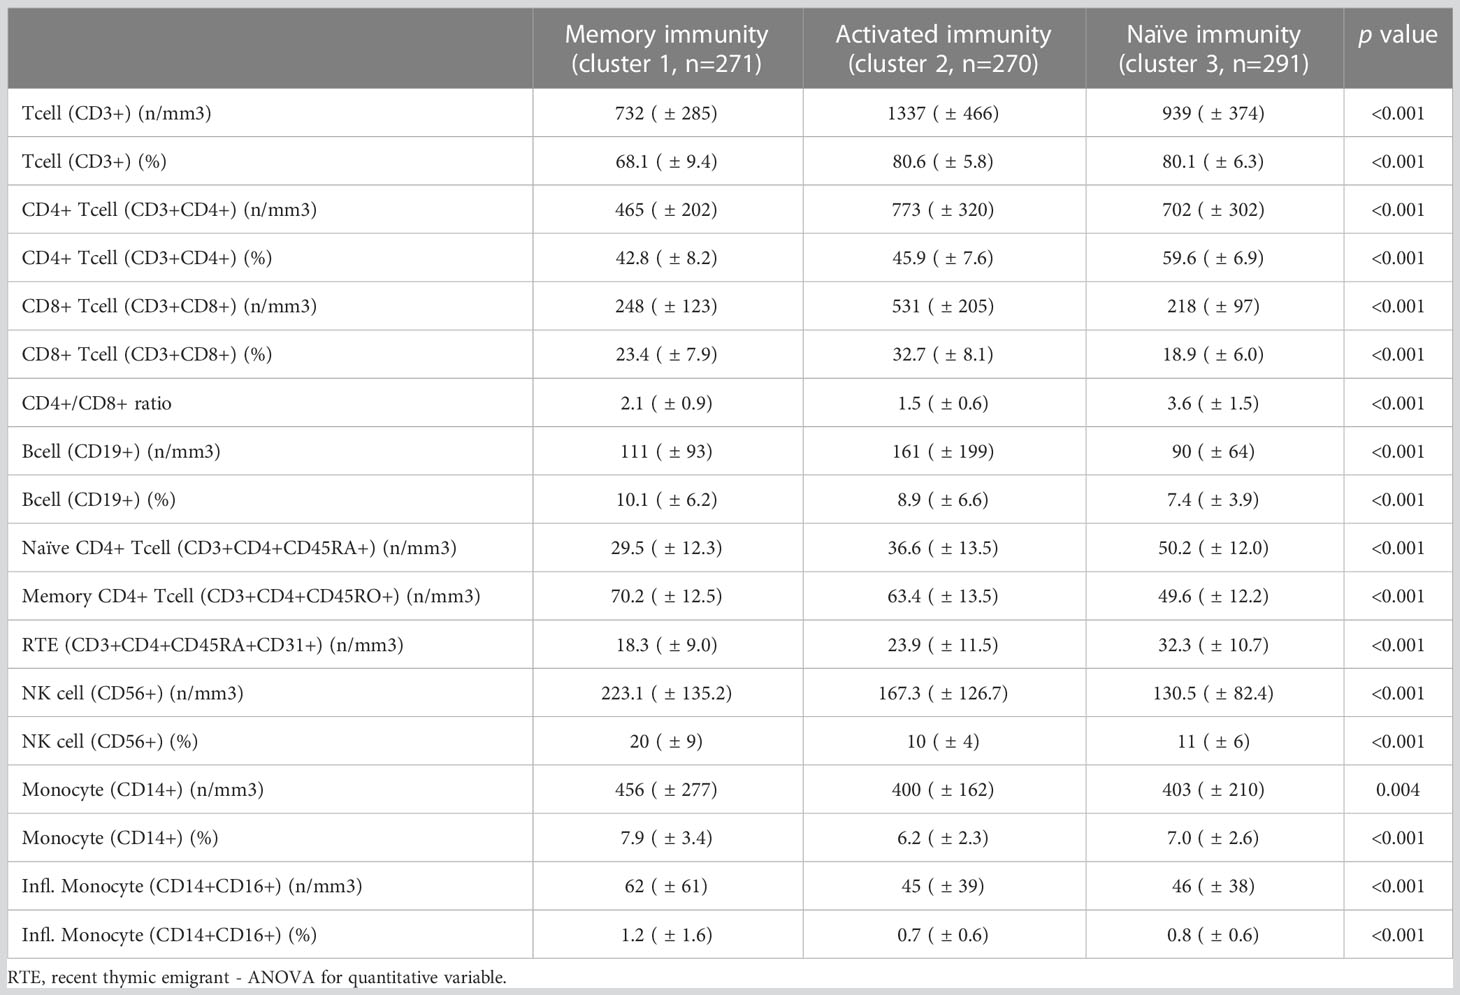
Table 2 Immune population phenotype at the day of transplantation among the different clusters determined by hierarchical clustering.
A first cluster (n=271 patients) was characterized by an increase in memory CD4+ T cells and a decrease in naive CD4+ T cells (including central CD4+ T cells). However, the absolute number of immune cell (representing by T cell count) was low. This cluster was called “memory immune profile”. A second cluster (n=270 patients) was characterized by an increased number of immune cells especially CD8+ T cells (in percentage and absolute number). The total rate of T cells was increased but the CD4/CD8 ratio was lower suggesting an “activated immune profile”. A third cluster (n=291 patients) was characterized by increased naive immune cells, mostly naive CD4+ T cells and central CD4+ T cells defining a “naïve immune profile”. Of note, all cell subsets counts and frequencies differed in all three groups (Table 2).
We analyzed and compared demographics and clinical characteristics of the three immune profiles. The results are summarized in Table 3.
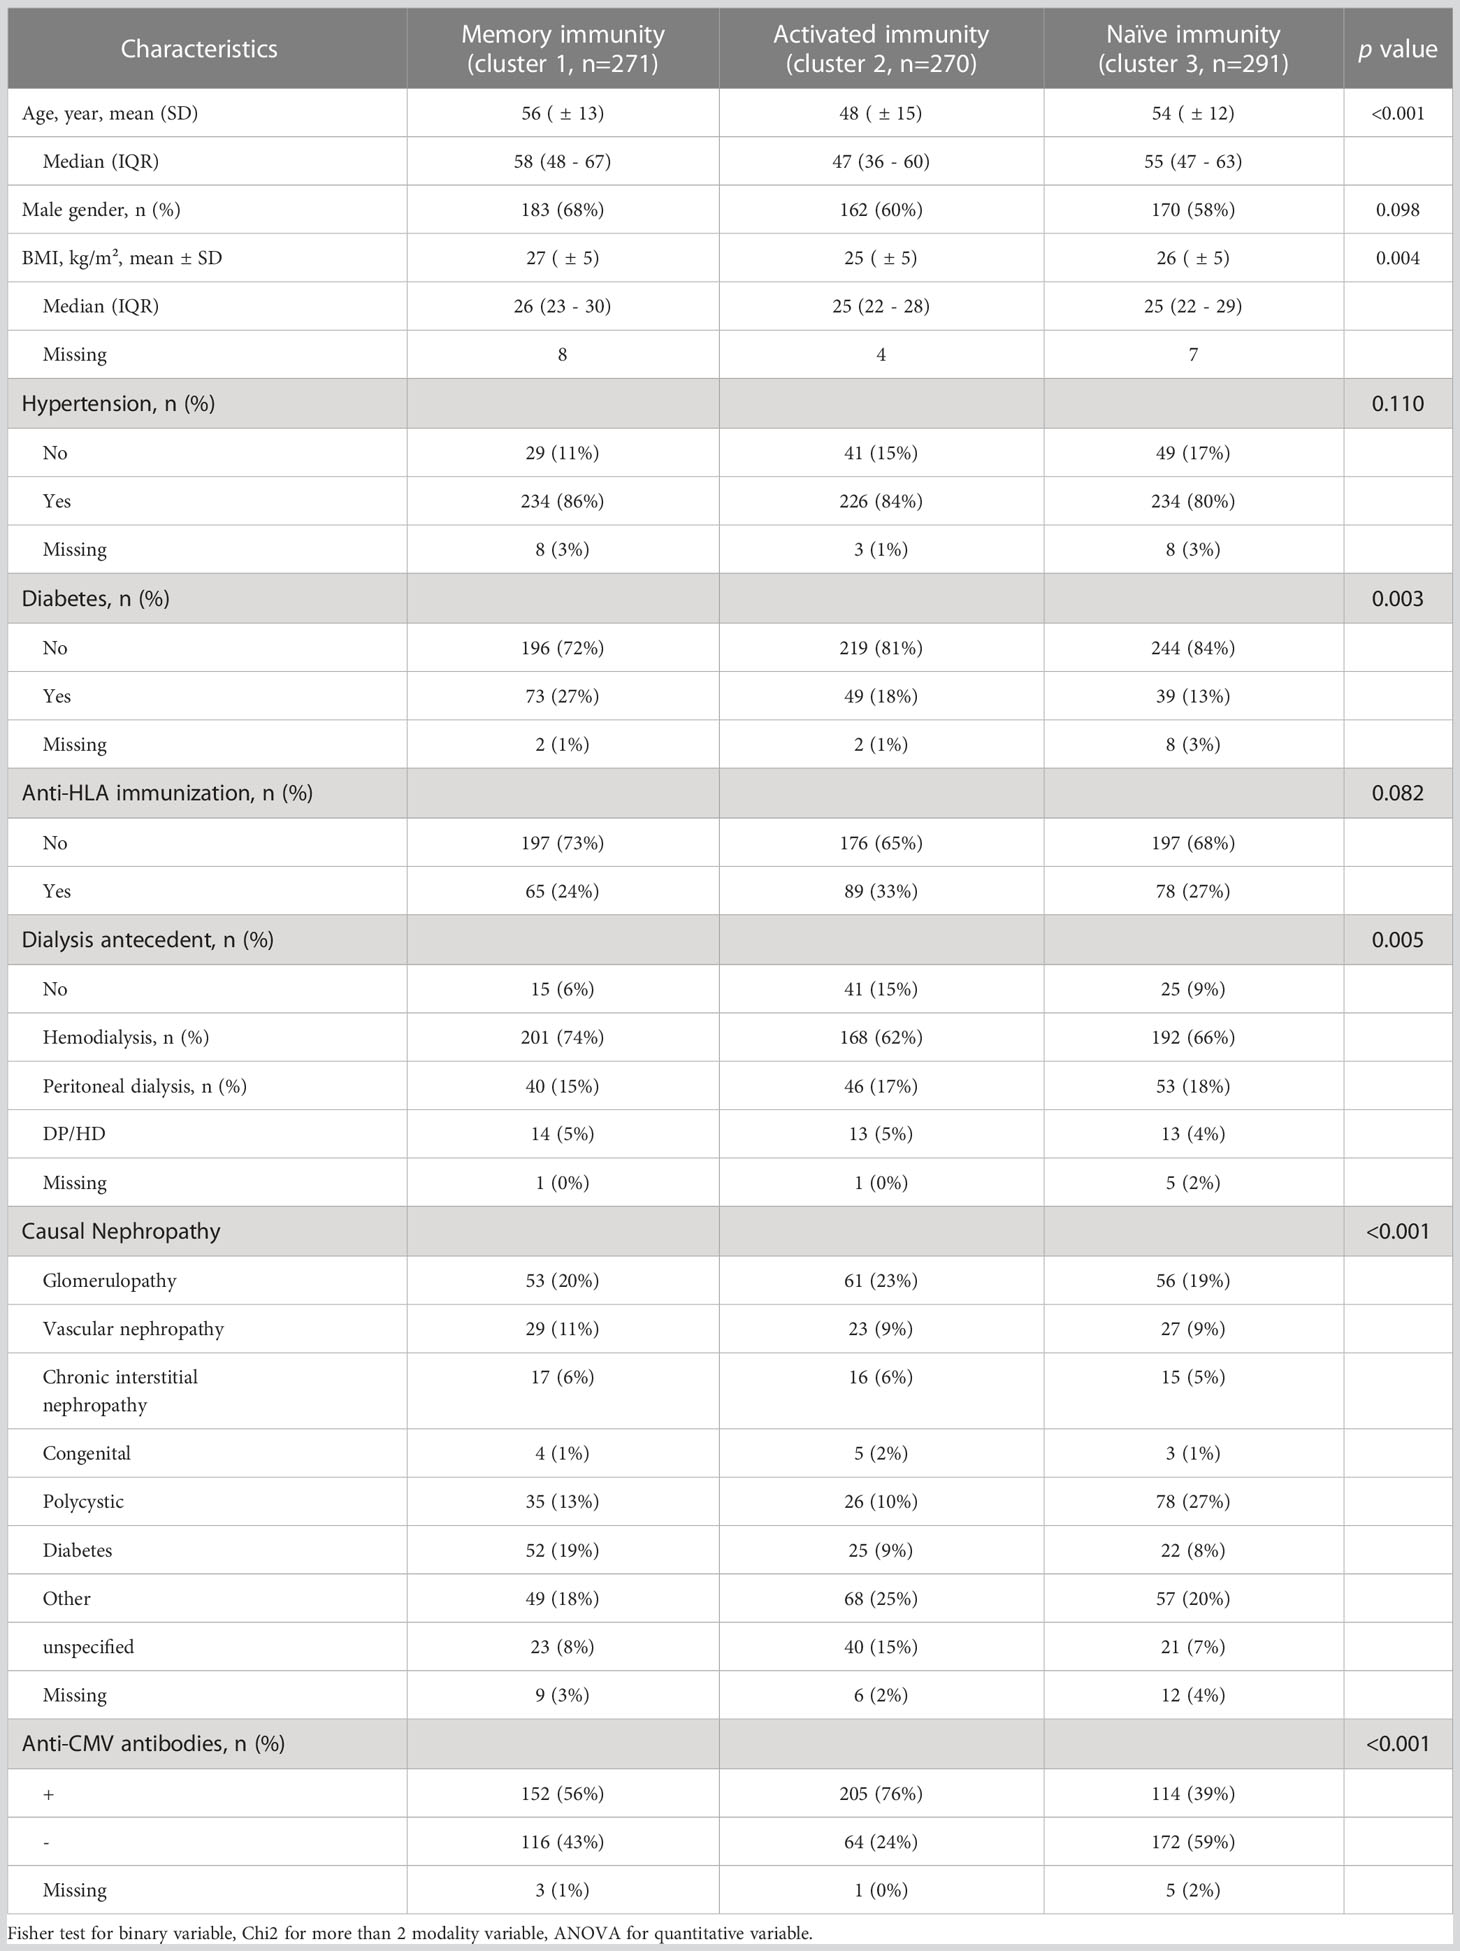
Table 3 Clinical characteristics among the 3 immune profiles determined with hierarchical clustering.
Patients classified as having a memory immune profile were older, had higher BMI, and were more prone to have type 2 diabetes. Patients assigned to the activated immune profile were younger and were more likely to have had pre-transplant CMV exposure. Patients allocated to the naïve immune profile were more frequently CMV-naïve. Other characteristics did not differ between the three immune profiles. Consequently, main demographic and clinical drivers of pre-transplant immune status were age, CMV status, and diabetes.
There was no difference in induction therapy or maintenance immunosuppressive treatments between the 3 immune profiles (Table 3). The proportion of patients with DGF was also similar in the 3 groups. One hundred and seven patients (13.6%) experienced acute rejection in the first year post-transplant. Mean time between transplantation and acute rejection was 105 +/- 88 days. Patients exhibiting an activated immune profile were more prone to develop acute rejection that both those with a naïve immune profile (HR=1.68, IC95% [1.06; 2.67], p=0.027) and those with a memory immune profile (HR 1.32, IC95% [0.95-1.88], p=0.096) (Figure 3). A competitive analysis taken death into account provided similar results (HR=1.606, 95%IC [1.00-2.58], p=0.0498) (Figure 4).

Figure 3 Kaplan Meier curves for survival without acute rejection according to cluster belinging. Three clusters were identified: memory immunity in red (cluster 1), activated immunity in green (cluster 2) and naïve immunity in blue (cluster 3).
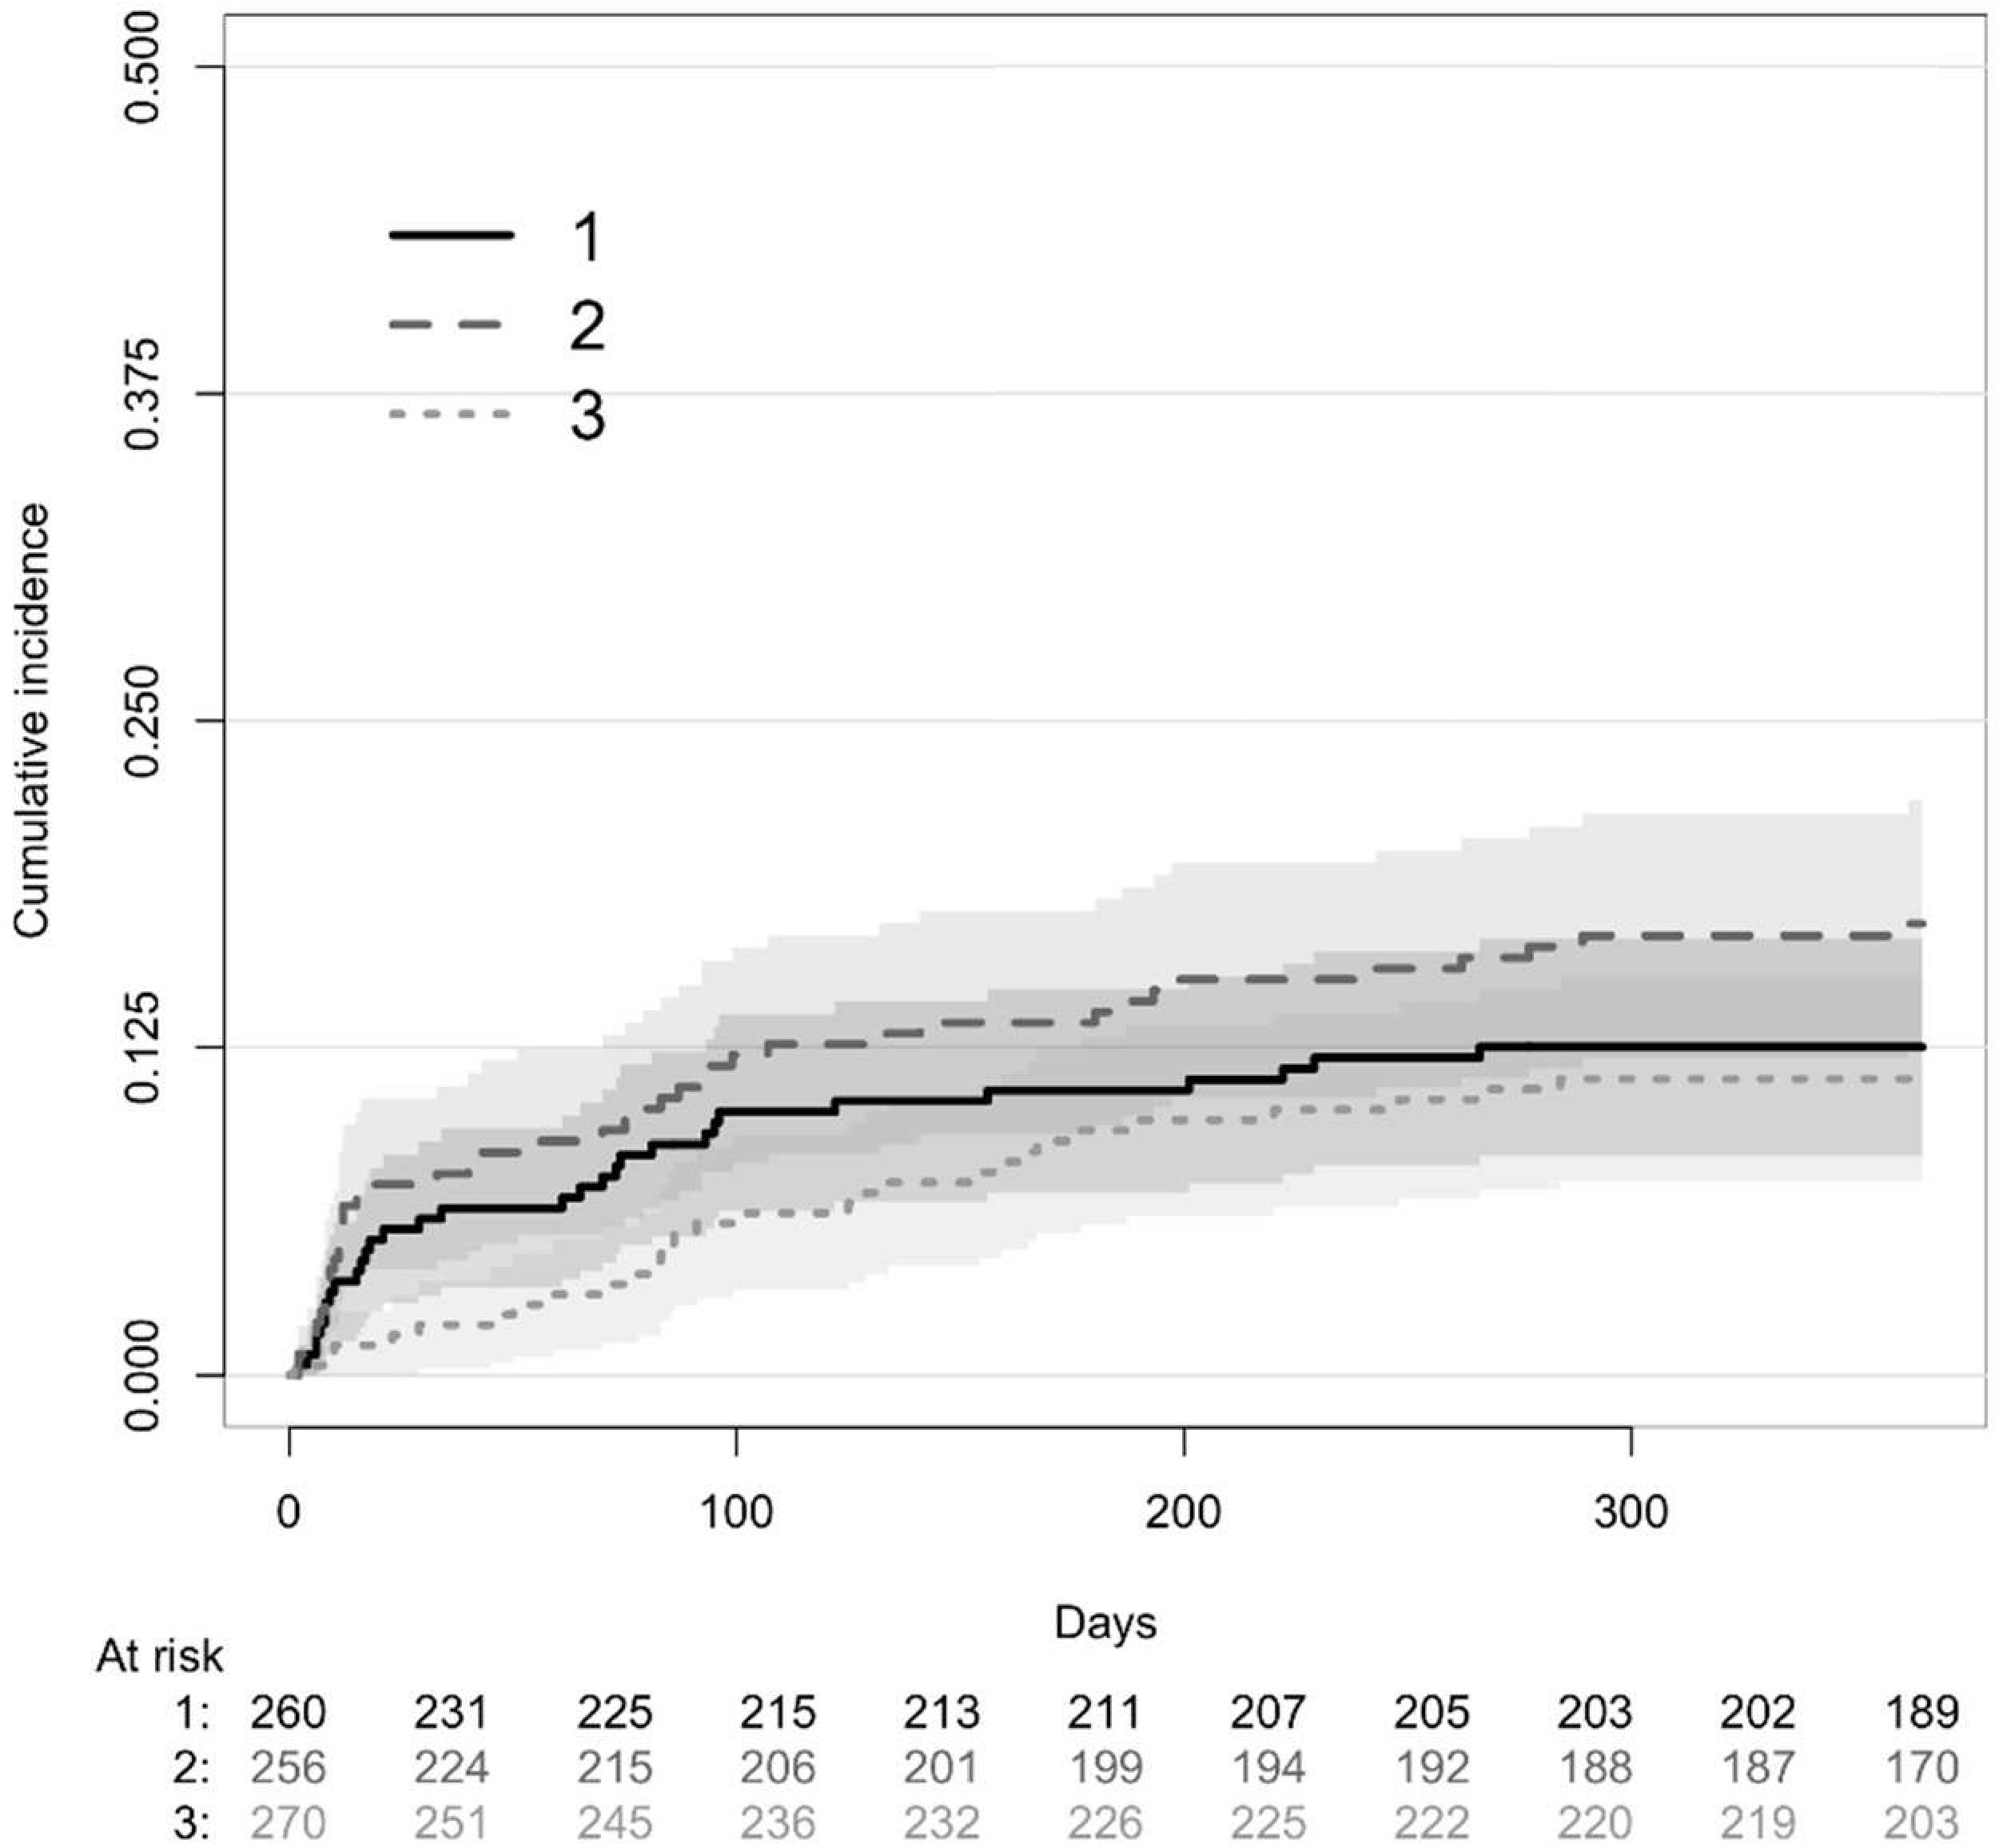
Figure 4 Competitive risk of death and acute rejection at 1 years post transplantation according to clusters determined with principal component analysis identified as older immunity (cluster 1), activated immunity (cluster 2) and naïve immunity (cluster 3). Three clusters were identified: memory immunity with full line (cluster 1), activated immunity with dashed line (cluster 2) and naïve immunity with dotted line (cluster 3).
Because activated immune profile is mainly defined by CD8+ T cell expansion, we analyzed whether CD8+ T cell count and/or frequency may replicate previous results. Neither CD8+ T cell count nor frequency were associated with the occurrence of acute rejection (Supplementary data, Tables S1A, B). Patients were divided into three groups corresponding to tertiles of CD8+ T cells count: 39 - 217 CD8+/mm3, 217 - 374 CD8+/mm3, 374 - 1400 CD8+/mm3. Frequency of acute rejection was similar in the three tertiles of CD8+ T cells (Supplementary data, Figure S1A). There was also no difference according to the percentage of CD8+ T cells (Supplementary data, Figure S1B). No other T cell subset was associated with acute rejection. ATG profoundly affects lymphocyte counts and phenotype. We separately studied the association between clusters and acute rejection in patients having or not received ATG. The association between clusters and acute rejection was similar in both groups of patients.
Delayed graft function (HR=1.48, IC95% [1.01-2.18], p=0.046) was also associated with acute rejection and retained in the multivariate analysis. Age, CMV status, and diabetes, closely linked to cluster definitions, were forced into the model. After multivariate analysis, the activated immune profile was still associated with acute rejection (HR=1.69, IC95% [1.05-2.70], p=0.030 and HR=1.85, IC95% [1.16; 3.00], p=0.011, versus the “memory immune profile” and the “naïve immune profile”, respectively). DGF (HR=1.50, IC95% [1.02-2.33], p=0.040) remained associated with acute rejection. Age, gender, and diabetes mellitus were not associated with acute rejection.
The activated immune profile shares some similarities with the immune risk profile, which is mainly characterized by CD8+ T cell expansion and CMV seropositivity. Nevertheless, 24% of patients assigned to the activated immune profile were CMV-naïve (Table 3). CMV-exposed patients tended to be older (49+/-14 vs 45+/-15 years, p=0.087). Although CMV-exposed patients had moderately higher CD8 T cell count than CMV-naïve patients, they had similar CD8 frequency (37 + 11 vs 39 + 11, p=0.399). We observed that acute rejection was less frequent in CMV-exposed patients (16 vs 27%, HR=0.54, IC95% [0.30; 0.97], p=0.039) (Figure 5; Supplementary data, Table S2).
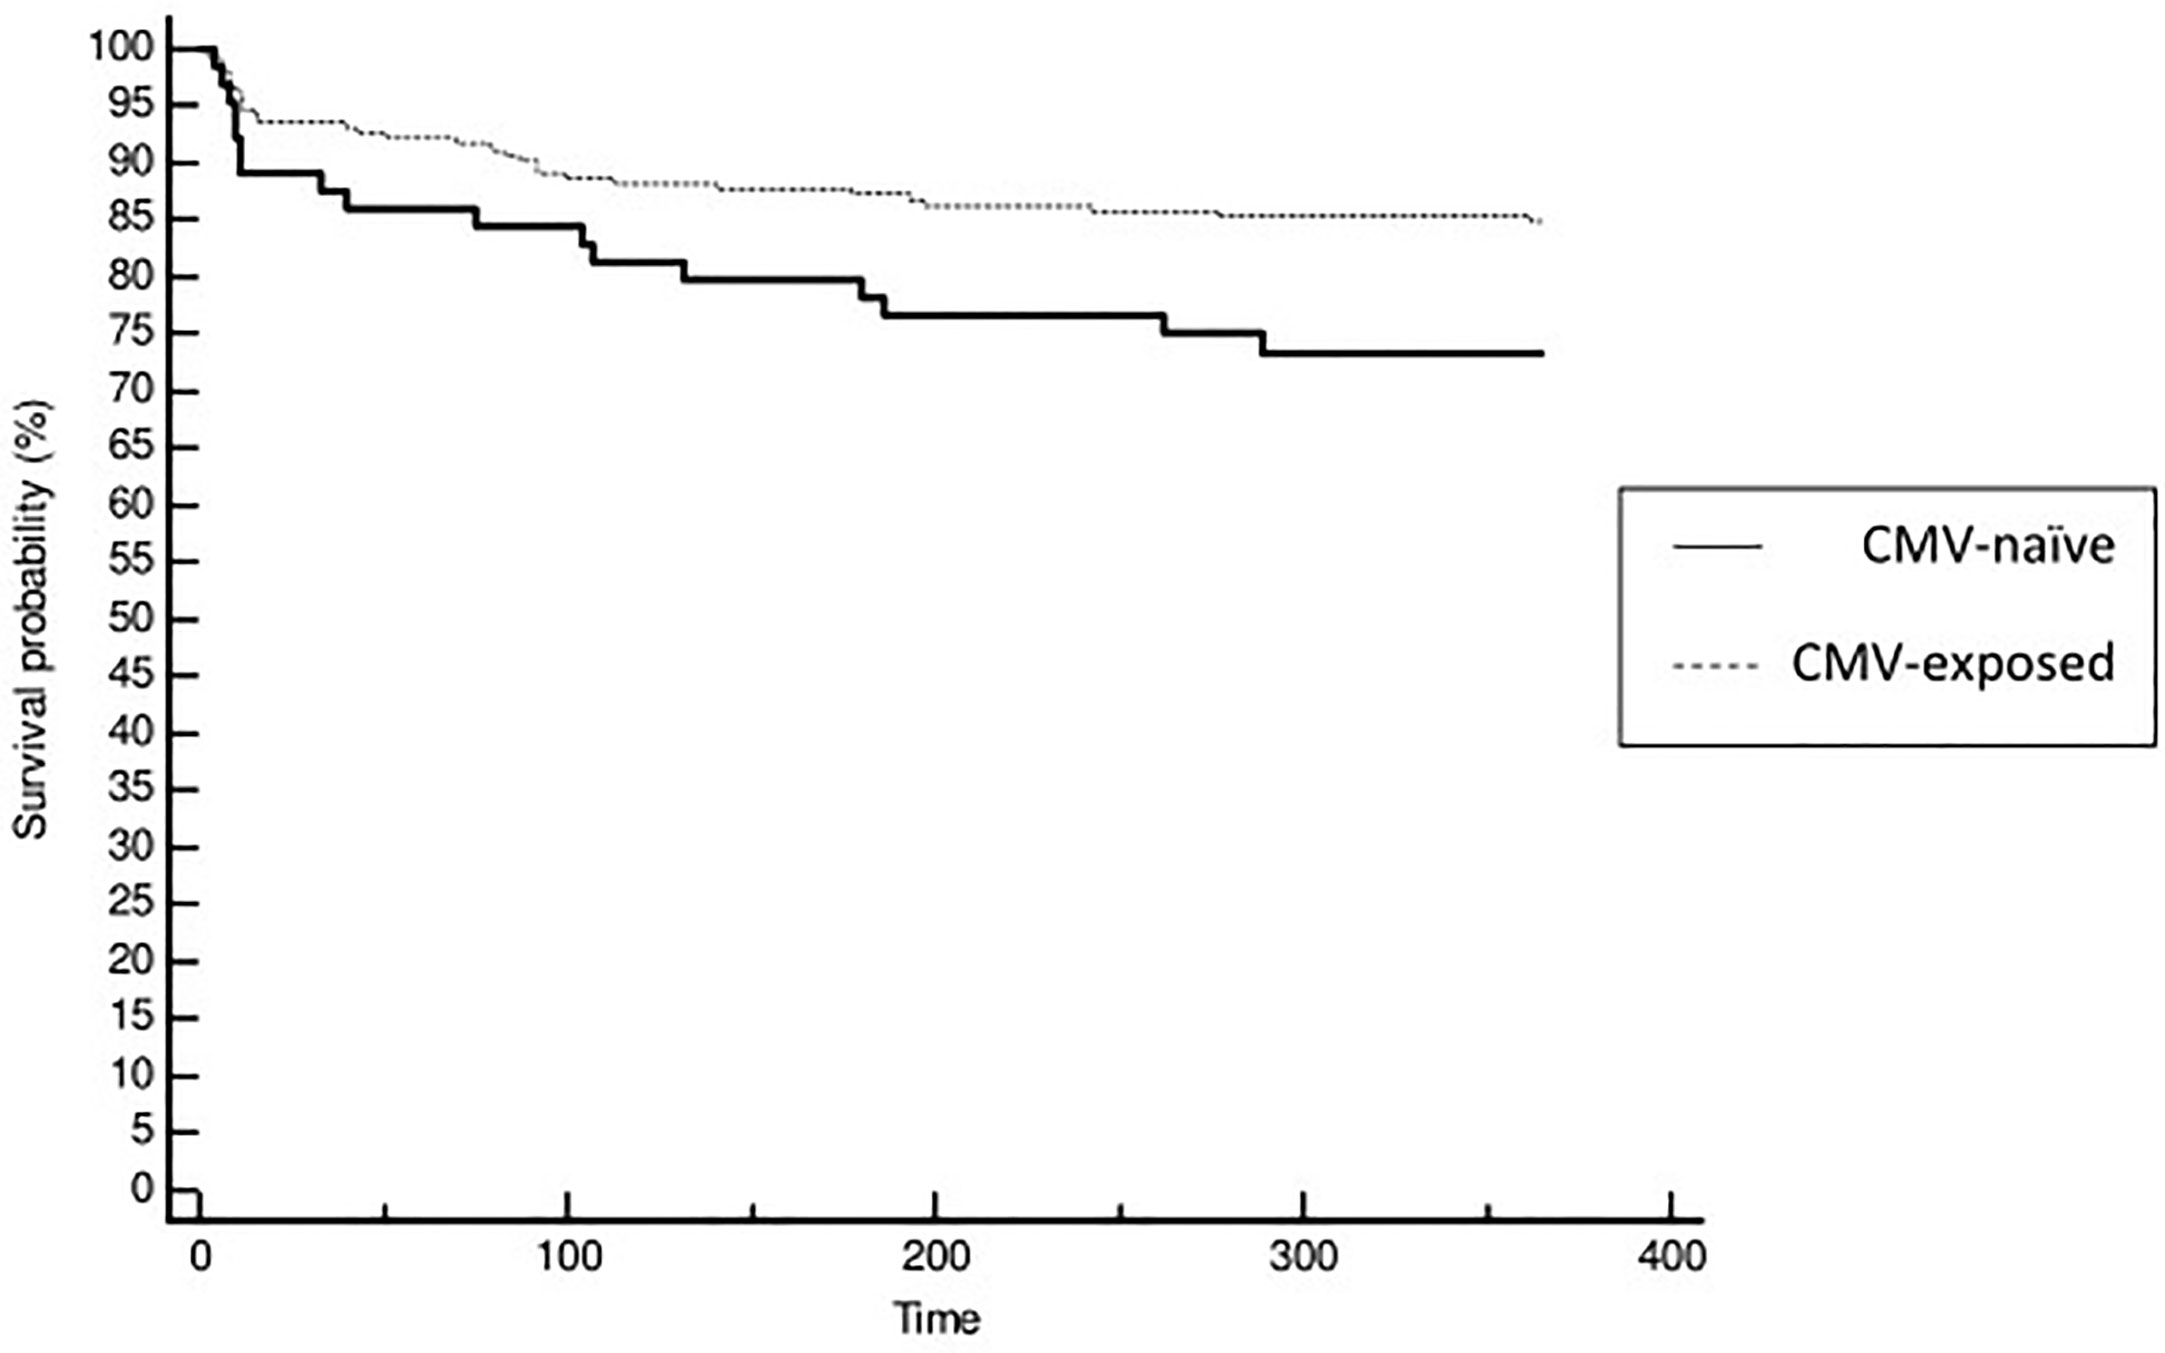
Figure 5 Kaplan Meier curves for survival without acute rejection according to patients CMV status of cluster 2 (activated immunity). Patients naïve to CMV exposure were identified with full line and patient exposed to CMV with dashed line.
We therefore hypothesized that CD8 subset distribution could be different between CMV-naïve and CMV-exposed patients. Naïve CD8+ T cell (CD8+CD45RA+CCR7+) frequency was much higher (35 + 18 vs 27 + 18%, p=0.006) in CMV-naïve patients, whereas frequency of TEMRA CD8 T cells (CD8+CDRA+CCR7-) tended to be lower (42 + 18 vs 47 + 16%, p=0.059) (Supplementary data, Table S2). Nevertheless, none of these subsets was associated with acute rejection.
We report in a large cohort of kidney transplant recipients that immune profile determination based on PCA defines clinically different sub-groups of population and may help to discriminate patients at-risk for acute rejection. The association between immune profiles and acute rejection was independent and observed in all sub-groups of patients. A specific category of patients with high CD8+ T cells level and no past exposure to CMV seems to be at the highest risk of acute rejection. Using a large panel of immune cellular subtypes, we isolated three immune profiles with distinct clinical phenotypes. Clinical phenotypes were concordant with expected immune profiles. Three main clinical characteristics seems to drive immune clustering, namely age, diabetes, and CMV exposure. Immune senescence is driven by ageing and some studies report increased senescence in patients with insulin resistance (14, 15). Persistent CMV infection leads to chronic stimulation of CD8 T cells, which expand clonally exhibiting an effector memory phenotype. Meijers et al. showed that TEMRA CD8+ T cell expansion in end-stage renal disease patients were highly associated with CMV exposure (16). Clinical correlation may be considered as an internal validation for the relevance of the immune clusters defined by PCA.
The “activated immune profile” shares some similarities with the immune risk phenotype (IRP). IRP was first defined as the association of high CD8 and low CD4 numbers, and poor proliferative response to concanavalin A (17). Further studies suggested that IRP could be defined using only the inverted CD4/CD8 ratio (18). Further studies have extended these results (19, 20). CMV exposure and an increase in the number of lately differentiated CD8+ CD28 effector cells have been linked to IRP. More recently, IRP was also found to be more prevalent in younger CMV-exposed patients (21). The “activated immune profile” is mainly characterized by high CD8+ T cells count, lower CD4/CD8, and CMV seropositivity, which are predominant features of the IRP. Nevertheless, the “activated immune profile” is likely to be different from IRP. Patients with IRP have typically low CD4+ T cells whereas this subset is high in patients with “activated immune profile”. Moreover, most patients do not have inverted CD4/CD8 ratio. Finally, one quarter of patients in the activated immune profile were CMV-naïve.
Distributions of both CD4+ and CD8+ T cells profiles are largely different between CMV-naïve and CMV-exposed patients and suggest more pronounced T cell exhaustion in CMV-positive patients. However, CMV-naïve patients assigned to the activated immune profile appear to be at very high risk of acute rejection. Consistent with this result, Betjes et al. reported that expansion of terminally differentiated CD8+ TEMRA protects against acute rejection after kidney transplantation (22). Consistent with this result, we also showed a trend towards a lower incidence of acute rejection in patients with pre-transplant IRP (23). Nevertheless, the role of TEMRA in acute rejection is probably more complex as recent studies identified this population as being associated with both acute rejection and graft loss (24, 25).
However, in our study, no specific T cell subset was associated with acute rejection.
Indeed, despite subsequent phenotyping of T cells, we were unable to identify a specific subset explaining the association between having “an activated immune profile” and an increased incidence of acute rejection. We assume that this point reinforces our primary hypothesis. It suggests that a combination of different immune actors and multiple interactions rather than a unique factor contributes to acute rejection. We now have to integrate the complexity of immune interactions in our predicting models.
It is possible to plot supplementary individuals onto the principal axes. Using the formulae allowing principal components computations, we simply have to compute linear combinations of these supplementary point characteristics. Thus, a next patient may be included in a defined cluster before, subject to determination of immune parameters. This offers the opportunity of external validation of the PCA. Finally, clinical use may be generalized to classify patients and predict their risk category regarding acute rejection.
Our study has some limitations. Even when acute rejection was clearly defined, there was no centralized analysis of graft histology. Nevertheless, misclassification remains unlikely. The indication for biopsy may have varied from one center to another, but without any possible relationship with PCA. Importantly, systematic biopsies were not considered and only for cause-biopsies were analyzed. Due to the prospective design of the study, the rate of missing data was very low (<5%). Underreporting of events is unlikely in the early post-transplant period when all the patients are still followed in the transplant center.
Using PCA, we defined a subset of kidney transplant recipients carrying a high risk of acute rejection. These patients are characterized by an “activated immune profile” in the absence of previous exposure to CMV. Global approach of immune equilibrium may be more relevant to predict immune-related events than analysis of a single parameter.
The raw data supporting the conclusions of this article will be made available by the authors, without undue reservation.
The studies involving human participants were reviewed and approved by the ethics committee of the Franche-Comté study. The patients/participants provided their written informed consent to participate in this study.
EG and DD are the guarantors. DD, EG, MC, MD, and PS designed the study. CL, MG, ND, and SB carried out experiments. CC, CL, DD, EG, FL, JB, MC, ND, and PS supported (administrative, technical or material) the study. DD, EG, and PS supervised the study. CL, DD, EG, FL, MC, MD, MG, ND, and SB acquired, analyzed or interpreted the data. DD, EG, MC, and MD drafted the manuscript; DD, EG, MD, ND, and PS revised the paper; DD and PS obtained funding. All authors contributed to the article and approved the submitted version.
This study was supported by grants from the national “Programme Hospitalier de Recherche Clinique” (PHRC 2005), The Fondation de France (2007), The Fondation transplantation (2008), The “Direction générale de l’Offre de soins – Institut national de la santé et de la recherche médicale” grant (DHOS INSERM 2008) and the interregional “Programme Hospitalier de Recherche Clinique” (PHRC-Interreg 2011).
The ORLY-Est Cohort constitution is supported by the French Programme Hospitalier de Recherche clinique (2005), the Fondation de France funding (2007), the Fondation transplantation funding (2008), the “Direction de l’Hospitalisation et de l’Organisation des Soins/Institut national de la santé et de la recherche médicale” funding (2008), the French interregional Programme Hospitalier de Recherche clinique (2011) and Besançon hospital.
The authors declare that the research was conducted in the absence of any commercial or financial relationships that could be construed as a potential conflict of interest.
All claims expressed in this article are solely those of the authors and do not necessarily represent those of their affiliated organizations, or those of the publisher, the editors and the reviewers. Any product that may be evaluated in this article, or claim that may be made by its manufacturer, is not guaranteed or endorsed by the publisher.
The Supplementary Material for this article can be found online at: https://www.frontiersin.org/articles/10.3389/fimmu.2023.1192440/full#supplementary-material
1. Koo EH, Jang HR, Lee JE, Park JB, Kim SJ, Kim DJ, et al. The impact of early and late acute rejection on graft survival in renal transplantation. Kidney Res Clin Pract (2015) 34:160–4. doi: 10.1016/j.krcp.2015.06.003
2. Matas AJ, Smith JM, Skeans MA, Thompson B, Gustafson SK, Schnitzler MA, et al. OPTN/SRTR 2012 annual data report: kidney. Am J Transplant (2014) 14(Suppl 1):11–44. doi: 10.1111/ajt.12579
3. Augustine JJ, Siu DS, Clemente MJ, Schulak JA, Heeger PS, Hricik DE. Pre-transplant IFN-gamma ELISPOTs are associated with post-transplant renal function in African American renal transplant recipients. Am J Transplant (2005) 5:1971–5. doi: 10.1111/j.1600-6143.2005.00958.x
4. Poggio ED, Augustine JJ, Clemente M, Danzig JM, Volokh N, Zand MS, et al. Pretransplant cellular alloimmunity as assessed by a panel of reactive T cells assay correlates with acute renal graft rejection. Transplantation (2007) 83:847–52. doi: 10.1097/01.tp.0000258730.75137.39
5. Chen Y, Tai Q, Hong S, Kong S, Shang S, Liang S, et al. Pretransplantation soluble CD30 level as a predictor of acute rejection in kidney transplantation: a meta-analysis. Transplantation (2012) 94:911–8. doi: 10.1097/TP.0b013e31826784ad
6. Bamoulid J, Courivaud C, Crepin T, Carron C, Gaiffe E, Roubiou C, et al. Pretransplant thymic function predicts acute rejection in antithymocyte globulin-treated renal transplant recipients. Kidney Int (2016) 89:1136–43. doi: 10.1016/j.kint.2015.12.044
7. Ge YZ, Wu R, Lu TZ, Jia RP, Li MH, Gao XF, et al. Combined effects of TGFB1 +869 T/C and +915 G/C polymorphisms on acute rejection risk in solid organ transplant recipients: a systematic review and meta-analysis. PloS One (2014) 9:e93938. doi: 10.1371/journal.pone.0093938
8. Hu X, Bai Y, Li S, Zeng K, Xu L, Liu Z, et al. Donor or recipient TNF-a -308G/A polymorphism and acute rejection of renal allograft: a meta-analysis. Transpl Immunol (2011) 25:61–71. doi: 10.1016/j.trim.2011.04.004
9. Ducloux D, Deschamps M, Yannaraki M, Ferrand C, Bamoulid J, Saas P, et al. Relevance of toll-like receptor-4 polymorphisms in renal transplantation. Kidney Int (2005) 67:2454–61. doi: 10.1111/j.1523-1755.2005.00354.x
10. Joliffe IT, Morgan BJ. Principal component analysis and exploratory factor analysis. Stat Methods Med Res (1992) 1:69–95. doi: 10.1177/096228029200100105
11. Okada R, Kondo T, Matsuki F, Takata H, Takiguchi M. Phenotypic classification of human CD4+ T cell subsets and their differentiation. Int Immunol (2008) 20:1189–99. doi: 10.1093/intimm/dxn075
12. Colvin RB, Cohen AH, Saiontz C, Bonsib S, Buick M, Burke B, et al. Evaluation of pathologic criteria for acute renal allograft rejection: reproducibility, sensitivity, and clinical correlation. J Am Soc Nephrol (1997) 8(12):1930–41. doi: 10.1681/ASN.V8121930
13. Austin PC, Fine JP. Practical recommendations for reporting fine-Gray model analyses for competing risk data. Stat Med (2017) 36(27):4391–400. doi: 10.1002/sim.7501
14. Daryabor G, Atashzar MR, Kabelitz D, Meri S, Kalantar K. The effects of type 2 diabetes mellitus on organ metabolism and the immune system. Front Immunol (2020) 11:1582. doi: 10.3389/fimmu.2020.01582
15. Frasca D, Blomberg BB, Paganelli R. Aging, obesity, and inflammatory age- related diseases. Front Immunol (2017) 8:1745. doi: 10.3389/fimmu.2017.01745
16. Meijers RWJ, Litjens NHR, de Wit EA, Langerak AW, van der Spek A, Baan CC, et al. Cytomegalovirus contributes partly to uremia associated premature immunological ageing of the T-cell compartment. Clin Exp Immunol (2013) 174:424–32. doi: 10.1111/cei.12188
17. Ferguson FG, Wikby A, Maxson P, Olsson J, Johansson B. Immune parameters in a longitudinal study of a very old population of Swedish people: a comparison between survivors and nonsurvivors. J Gerontol Biol Sci (1995) 50A:B378–82. doi: 10.1093/gerona/50A.6.B378
18. Wikby A, Maxson P, Olsson J, Johansson B, Ferguson FG. Changes in CD8 and CD4 lymphocyte subsets, T cell proliferation responses and non-survival in the very old: the Swedish longitudinal OCTO-immune study. Mech Ageing Dev (1998) 102:187–98. doi: 10.1016/S0047-6374(97)00151-6
19. Olsson J, Wikby A, Johansson B, Lofgren S, Nilsson BO, Ferguson FG. Age-related change in peripheral blood T-lymphocyte subpopulations and cytomegalovirus infection in the very old: the Swedish longitudinal OCTO immune study. Mech Ageing Dev (2000) 121:187–201. doi: 10.1016/S0047-6374(00)00210-4
20. Wikby A, Johansson B, Olsson J, Lofgren S, Nilsson BO, Ferguson F. Expansions of peripheral blood CD8 T-lymphocyte subpopulations and an association with cytomegalovirus seropositivity in the elderly: the Swedish NONA immune study. Exp Gerontol (2002) 37:445–53. doi: 10.1016/S0531-5565(01)00212-1
21. Strindhall J, Skog M, Ernerudh J, Bengner M, Löfgren S, Matussek A, et al. The inverted CD4/CD8 ratio and associated parameters in 66-year-old individuals: the Swedish HEXA immune study. Age (2013) 35:985–91. doi: 10.1007/s11357-012-9400-3
22. Betjes MGH, Litjens NHR. High numbers of differentiated CD28null CD8+ T cells are associated with a lowered risk for late rejection and graft loss after kidney transplantation. PloS One (2020) 15:e0228096. doi: 10.1371/journal.pone.0228096
23. Crepin T, Gaiffe E, Courivaud C, Roubiou C, Laheurte C, Moulin B, et al. Pre- transplant end-stage renal disease-related immune risk profile in kidney transplant recipients predicts post-transplant infections. Transpl Infect Dis (2016) 18:415–22. doi: 10.1111/tid.12534
24. Yap M, Boeffard F, Clave E, Pallier A, Danger R, Giral M, et al. Expansion of highly differentiated cytotoxic terminally differentiated effector memory CD8+ T cells in a subset of clinically stable kidney transplant recipients: a potential marker for late graft dysfunction. J Am Soc Nephrol (2014) 25(8):1856–68. doi: 10.1681/ASN.2013080848
Keywords: immune profile, biomarker, acute rejection, kidney transplantation, hierarchical clustering analysis
Citation: Gaiffe E, Colladant M, Desmaret M, Bamoulid J, Leroux F, Laheurte C, Brouard S, Giral M, Saas P, Courivaud C, Degauque N and Ducloux D (2023) Pre-transplant immune profile defined by principal component analysis predicts acute rejection after kidney transplantation. Front. Immunol. 14:1192440. doi: 10.3389/fimmu.2023.1192440
Received: 23 March 2023; Accepted: 26 June 2023;
Published: 11 July 2023.
Edited by:
Long Zheng, The Second Affiliated Hospital of Zhejiang University School of Medicine, ChinaCopyright © 2023 Gaiffe, Colladant, Desmaret, Bamoulid, Leroux, Laheurte, Brouard, Giral, Saas, Courivaud, Degauque and Ducloux. This is an open-access article distributed under the terms of the Creative Commons Attribution License (CC BY). The use, distribution or reproduction in other forums is permitted, provided the original author(s) and the copyright owner(s) are credited and that the original publication in this journal is cited, in accordance with accepted academic practice. No use, distribution or reproduction is permitted which does not comply with these terms.
*Correspondence: Didier Ducloux, ZGR1Y2xvdXhAY2h1LWJlc2FuY29uLmZy
†These authors have contributed equally to this work
Disclaimer: All claims expressed in this article are solely those of the authors and do not necessarily represent those of their affiliated organizations, or those of the publisher, the editors and the reviewers. Any product that may be evaluated in this article or claim that may be made by its manufacturer is not guaranteed or endorsed by the publisher.
Research integrity at Frontiers
Learn more about the work of our research integrity team to safeguard the quality of each article we publish.