
94% of researchers rate our articles as excellent or good
Learn more about the work of our research integrity team to safeguard the quality of each article we publish.
Find out more
ORIGINAL RESEARCH article
Front. Immunol., 14 June 2023
Sec. Cancer Immunity and Immunotherapy
Volume 14 - 2023 | https://doi.org/10.3389/fimmu.2023.1187850
This article is part of the Research TopicCell Therapies for Solid TumorsView all 6 articles
 Cooper J. Sailer1,2
 Yeonsun Hong1Ankit Dahal1Allison T. Ryan1Sana Mir1Scott A. Gerber3Patrick M. Reagan4
 Minsoo Kim1*
Chimeric antigen receptor (CAR)-T cell therapy has emerged as a promising treatment option for several hematologic cancers. However, efforts to achieve the same level of therapeutic success in solid tumors have largely failed mainly due to CAR-T cell exhaustion and poor persistence at the tumor site. Although immunosuppression mediated by augmented programmed cell death protein-1 (PD-1) expression has been proposed to cause CAR-T cell hypofunction and limited clinical efficacy, little is known about the underlying mechanisms and immunological consequences of PD-1 expression on CAR-T cells. With flow cytometry analyses and in vitro and in vivo anti-cancer T cell function assays, we found that both manufactured murine and human CAR-T cell products displayed phenotypic signs of T cell exhaustion and heterogeneous expression levels of PD-1. Unexpectedly, PD-1high CAR-T cells outperformed PD-1low CAR-T cells in multiple T cell functions both in vitro and in vivo. Despite the achievement of superior persistence at the tumor site in vivo, adoptive transfer of PD-1high CAR-T cells alone failed to control tumor growth. Instead, a PD-1 blockade combination therapy significantly delayed tumor progression in mice infused with PD-1high CAR-T cells. Therefore, our data demonstrate that robust T cell activation during the ex vivo CAR-T cell manufacturing process generates a PD-1high CAR-T cell subset with improved persistence and enhanced anti-cancer functions. However, these cells may be vulnerable to the immunosuppressive microenvironment and require combination with PD-1 inhibition to maximize therapeutic functions in solid tumors.
CAR-T cell therapy has become an effective treatment for patients with advanced cancers, including lymphomas, leukemias, and multiple myeloma (1, 2). However, many patients fail to respond in part due to functional exhaustion of the CAR-T cell and failure to persist after infusion (3). Indeed, recent studies have revealed that patients receiving CD19 CAR-T cell products with features of T cell exhaustion, such as co-expression of multiple inhibitory receptors, are not likely to respond to this therapy (4–6). Therefore, CAR-T cell hypofunction driven by inhibitory receptors is likely to be a critical roadblock in the pursuit of translating CAR-T cell therapy into solid tumors, where complete response was achieved in only 4% of patients across available data from current solid tumor CAR-T clinical trials (7).
PD-1 is a cell-surface inhibitory receptor that shares sequence homology with members of the CD28 family of receptors, such as CTLA-4 and ICOS (8). PD-1 is expressed by all T cells during T cell activation and is often associated with T cell dysfunction and exhaustion during settings of chronic infections and cancer (9, 10). Upon ligation to its ligands (PD-L1/2), PD-1 functions by recruiting phosphatases to the immune synapse that dampen activating signals received primarily from the T-cell receptor (TCR) and CD28 activations and their downstream signaling pathways, such as PI3K, RAS, ERK and PLCγ (11, 12). These inhibitory signals from PD-1 negatively affect many aspects of cytotoxic T cell functions, including T cell activation, proliferation, effector cytokine production, T cell metabolism (13–15), migration (16–18), and target cell killing (19–21).
The expression of PD-1 has been implicated in the efficacy of CAR-T cell therapies. Patients with higher proportions of CD8+PD-1+ T cells in their CAR-T infusion product were less likely to respond to CD19 CAR-T cell therapy against chronic lymphocytic leukemia (4). Elevated proportions of CD8 and CD4 T cells expressing PD-1 and LAG3 found in apheresis starting materials for patients receiving CD19 CAR-T cell therapy were more likely to experience an early treatment failure (6). Interestingly, PD-1 expression level in CD4+ CAR-T cells was associated with engraftment and progression-free survival in glioblastoma patients receiving EGFRvIII CAR-T cell therapy (22), suggesting correlations between PD-1 expression and CAR-T cell therapeutic response may be disease type specific.
Several approaches have been tested to relieve the functional impacts of inhibitory receptors on CAR-T cells. However, genetic knockdown of PD-1 expression was shown to impair the proliferation of CAR-T cells in vitro (23). Additionally, PD-1 knockout (KO) via CRISPR/Cas9 in TCR-transgenic T cells showed only 5% of T cell survival at 4 months post-infusion, indicating the limited ability of PD-1 KO T cells to persist long-term (24, 25). Instead, multiple clinical trials testing the combination therapy of CAR-T cells with anti-PD-1 blockade are currently underway for solid tumors, including an anti-GD2-CAR for neuroblastoma (NCT01822652), anti-mesothelin CAR for malignant pleural diseases (NCT02414269) and a HER2-tareted CAR for sarcoma (NCT04995003) (26–31).
The goal of this study is to better understand the underlying mechanisms for PD-1-mediated alterations in CAR-T cell functions. We addressed critical knowledge gaps regarding the biological consequences of PD-1 expression in therapeutic T cells that determine the function and fate of PD-1+ CAR-T cells in solid tumors. We observed a heterogeneous expression of PD-1 (PD-1high vs. PD-1low) in in vitro activated CAR-T cells. PD-1high CAR-T exhibited greater cytotoxic effector functions and superior tumor retention after adoptive transfer. Importantly, the increased cancer control of PD-1high CAR-T cells in vivo was observed only when anti-PD-1 blocking antibody was co-injected with PD-1high CAR-T cell infusion. Thus, our data suggest that augmented CAR-T cell functions in solid tumors may paradoxically depend on a unique subpopulation of PD-1high CAR-T cells that possess optimal anti-cancer functions and that a combination strategy with a PD-1 inhibition is required to maximize therapeutic functions of CAR-T cells.
UltraComp eBeads, CellTrace CFSE, CellTrace Violet, CellTrace FarRed and AF700-CD101 (Moushi101) were purchased from Invitrogen. Recombinant Human ICAM-1/CD54 Fc Chimera Protein, Recombinant Mouse CXCL12/SDF-1 alpha Protein, Recombinant Mouse PD-L1/B7-H1 Fc Chimera Protein, Recombinant mouse CXCL10/IP-10/CRG-2, and Recombinant Human ErbB2/Her2 Fc Chimera Protein were purchased from R&D Biosystems. anti-mouse PD-1 (29F.1A12), rat IgG2a isotype control (2A3), anti-mouse IFNy (XMG1.2) and anti-mouse LFA-1 (M17/4) were purchased from Bioxcell. Monensin 1000x solution and Brefeldin A 1000x solution were purchased from eBiosciences. The antibody BV421-PD-1 (EH12.1) was purchased from BD Biosciences. Antibodies against FITC-CD223 (C9B7W), AF488-CD25 (PC61.5), FITC-Perforin (eBioOMAK-D), and PE-anti-Human IgG Fc secondary antibody were purchased from eBioscience. Antibodies against APC-Annexin-V, PE-Cy7-CD69 (H1.2F3), PE-Cy7-CD107a (1D4B), and purified NA/LE Hamster anti-mouse CD3e (145-2C11) was purchased from BD Pharmingen. Antibodies against BV421-PD-1 (RMP1-30), AF647-CD340 (24D2), APC-CD45.1 (A20), APC-CD366 (RMT3-23), purified anti-mouse CD28 (37.51), BV711-CD274 (10F.9G2), AF647-CD54 (YN1/1.74), BV605-IFNγ (XMG1.2), PE-TNFα (MP6-XT22), PE-Ly108 (330-AJ), APC-CD44 (IM7), PE-CD11a/CD18 (LFA-1, H155-78), APC-CD184 (1.276F12), APC-Granzyme B (QA16A02), FITC-CD366 (F38-2E2), 7-AAD Viability Staining, PE-Cy7-CD62L (MEL-14), AF647-CCR7 (4B12), BV711-CX3CR1 (SA011F11), BV421-CXCR3 (CXCR3-173), BV421-CXCR5 (L138D7), BV605-CD127 (A7R34), APC-PD-1 (RMP1-30), BV711-PD-L1 (10F-9G2), APC-IL-2 (JES6-5H4), APC-Ki67 (16A8), APC-Cy7-CD45 (30-F11) and Recombinant Mouse IFNγ was purchased from BioLegend. RetroNectin was purchased from Takara. IL-2 was purchased from PeproTech.
B6.SJL-Ptprca Pepcb/BoyJ (B6-CD45.1) and C57BL/6-Tg(UBC-GFP)30Scha/J (B6-GFP) mice were purchased from the Jackson Laboratory. Human-HER2 transgenic mice (hHER2-TG) were obtained from Genentech (32). Genotyping for each strain was performed according to the corresponding reference. All mice were further backcrossed with C57BL/6J mice for at least more than 12 generations. Mice were maintained in a pathogen-free environment of the University of Rochester animal facility, and the animal experiments were approved by the University Committee on Animal Resources at the University of Rochester (Rochester, NY).
B16-hHER2 cells were cultured in DMEM supplemented with 10% FBS, 1% penicillin/streptomycin and 1 mg/mL G418 (Gibco). BT474 cells were cultured in DMEM supplemented with 10% FBS and 1% penicillin/streptomycin. E0771-hHER2 cells were cultured in RPMI 1640 supplemented with 10% FBS, 1% antibiotic-antimycotic (Gibco), 2 mM L-glutamine (Gibco), 20 mM HEPES buffer (Gibco), 1% MEM Non-Essential Amino Acids (Gibco), 50 µM ß-mercaptoethanol (Sigma-Aldrich) and 1 mg/mL G418 (Gibco). Platinum-E cells were cultured in DMEM supplemented with 10% FBS, 1% penicillin/streptomycin, 20 mM HEPES buffer (Gibco), 1% MEM Non-Essential Amino Acids (Gibco) and 50 µM ß-mercaptoethanol (Sigma-Aldrich)1 μg/ml of puromycin and 10 μg/ml of blasticidin S HCl. Purified mouse and human CD8+ T cells were cultured in RPMI 1640 supplemented with 10% FBS, 1% antibiotic-antimycotic (Gibco), 2 mM L-glutamine (Gibco), 20 mM HEPES buffer (Gibco), 1% MEM Non-Essential Amino Acids (Gibco), 50 µM ß-mercaptoethanol (Sigma-Aldrich) and 80 U/mL IL-2. All cells were maintained at 37°C in 5% CO2. For E0771 and B16-hHER2 stable cell line, B16F10 mouse melanoma cells (ATCC) were transfected with human HER2 pcDNA3.1 mammalian expression plasmid (Addgene #16257) using Lipofectamine 2000 according to the manufacturer’s protocol. Antibiotic selection (G418, 1 mg/mL) was added to the media 24 hours post-transfection. Cells were stained with anti-human HER2 antibody and sorted for the top 5% of HER2 expressers. Sorted cells were plated in 96-well plates at 1 cell per well to generate single cell clones. When thawed, stable cells were cultured in the presence of G418, and used within 2 weeks.
Mouse CD8 T cells were purified from single-cell suspensions of the spleen and lymph nodes of C57BL/6 mice. Single-cell suspensions were prepared by mechanical disruption in a 70μm cell strainer. CD8 T cells were enriched by magnetic-bead depletion with rat anti-mouse MHC II antibody (M5/114) and rat anti-mouse CD4 antibody (GK1.5), followed by sheep anti-rat IgG magnetic beads (Invitrogen 11035). Isolated CD8 enriched T cells were cultured in complete RPMI medium supplemented with 80 U/mL IL-2 and activated with plate-bound CD3e Ab (1 μg/mL) and CD28 Ab (1.6 μg/mL) for 24 hours.
Activated mouse CD8+ T cells were transduced with a 3rd generation trastuzumab (4D5; anti-HER2)-based CAR with CD8 transmembrane domain, CD28 and 4-1BB costimulatory domains, and CD3ζ (33). CAR sequence was first cloned into the pMSCV vector (631461, Clontech). Retrovirus was generated using the Platinum-E packaging cell line. Platinum-E cells were plated at 0.8x10⁶ cells per well in a 6-well plate. The following day, Platinum-E cells were transfected with HER2-CAR pMSCV using Lipofectamine 2000 according to the manufacturer’s protocol. Media was swapped 6 hours post-transfection. Filtered (0.45 μM) Retroviral-containing supernatants were collected 24- and 48-hours post-transfection. For T cell transduction, 1x10⁶ activated CD8 T cells were plated on RetroNectin (Takara) coated 12-well plates (10 μg/mL) with retrovirus-containing supernatants, supplemented with 80 U/mL IL-2, and spun twice at both 24- and 48 hours post-transfection at 2500 RPM. T cells are then detached from RetroNectin at least 24 hours post transduction and analyzed for HER2-CAR expression. After transduction, CAR-T cell were cultured and expanded with 80 U/mL IL-2 and plate-bound CD3e Ab (1 μg/mL). Cells were collected, dead cells removed, washed and plated on new CD3-coated plates with fresh media every 2-3 days.
Peripheral blood mononuclear cells (PBMCs) and plasma samples are being collected from patients with B-cell lymphoma that received axicabtagene ciloleucel (2x10⁶ cells/kg). Patients consent for blood collection under the University of Rochester Medical Center Wilmot Cancer Center’s lymphoma research program tissue collection protocol ULAB-03012 in accordance with the Institutional Review Board. Peripheral blood was obtained in sodium heparin tubes before treatment and after axicabtagene ciloleucel infusion from forty patients 5 days prior to CAR-T cell infusion. T cells were isolated from the blood using STEMCELL Human T cell isolation kit per manufacturers protocol. Cells were cryopreserved for later analysis. These same patients were undergoing CAR-T cell therapy treatment. CAR-T cells are prepared commercially and returned to the Wilmot Cancer Center for infusion. After infusion, some cells typically remain in the infusion tubing and storage bag. These cells are usually discarded but were recovered and used in the current studies. After completion of CAR-T cell infusion, the infusion bag was washed with PBS to obtain residual cells and cryopreserved for later analysis for inhibitory receptor expression.
To sort PD-1high and PD-1low CAR-T cells, CAR-T cells were collected from cell culture and washed in PBS. To detect CAR expression level on T cells, 1x10⁶ CAR-T cells were pre-incubated with 2 μg Fc blocker (BD Biosciences) for 10 min at 4°C and incubated with recombinant human ErbB2/Her2 Fc chimera protein (R&D systems) at 4°C for 30 min. After washing in PBS, the cells were incubated with PE-conjugated anti-human IgG Fc secondary antibody (eBioscience) and BV421-conjugated mouse anti-PD-1 (Biolegend) at 4°C for 30 min. Cells were washed and sorted by BD FACSAria II cell for CAR-positive cells and the top and bottom 20% of PD-1 levels. For intracellular cytokine staining, cancer cells were labeled with CFSE per manufacturers protocol and plated and cultured overnight. CAR-T cells were sorted by their PD-1 expression and added to the plate for 4 hours. CAR T cells were added to anti-CD3/CD28 coated plates for intracellular IL-2 experiments. Cells were cultured in the presence of monensin (1:1000) and brefeldinA (1:1000). Intracellular proteins or cytokines were stained with following antibodies at RT for 1 hr after fixation and permeabilization via eBioscience Intracellular Fixation and Permeabilization Buffer Set: IFN-γ-BV421 (XMG1.2), TNF-α-BV421 (MP6-XT22), FITC-Perforin (eBioOMAK-D), APC-IL-2 (JES6-5H4), APC-Ki67 (16A8) and GranzymeB-APC (QA18A28). Mean fluorescence intensity or percent of cells expression cytokines was determined by flow cytometry. For analytical cytometry, stained cells were detected by BD LSR II or Symphony A1 flow cytometer and analyzed via FlowJo.
Cell migration chambers (Millicell EZ slide eight-well glass, Millipore) were prepared by coating with Protein A (Invitrogen, 20 μg/mL), ICAM-1 (2.75 μg/mL), CXCL10 and CXCL12 (400 ng/mL) in PBS. 5x10⁴ PD1-sorted CD8+ T cells were plated in Leibovitz’s medium supplemented with 2 mg/mL D-glucose in a 37°C chamber. Video microscopy was conducted using a TE2000-U microscope (Nikon) coupled to a CoolSNAP HQ CCD camera with a 10x objective and 0.45 numerical aperture. T Cells and cancer cells were stained with CellTrace CFSE, CellTrace Violet, or CellTrace FarRed per manufacturers protocol (ThermoFisher). T cells were plated in L-15 medium at least 20 min at 37°C before imaging. For T cells alone, bright field or DIC images were acquired every 15 sec for 20 min. For T cell and cancer cell coculture movies, the stained cancer cells were plated 24 hours before the start of imaging. Bright field and fluorescent images were captured every 30 seconds for at least 2 hours.
Migration analysis was performed in Volocity software (PerkinElmer). In order to select which T cell tracks to analyze in Volocity, we excluded cells that are smaller than 10 μm and greater than 200 μm. Additionally, static cells were ignored, broken tracks were automatically joined, and cell tracks less than 20 μm were excluded. We also omitted T cells that were migrating for less than 5 minutes of the 20-minute movie and removed cells that Volocity incorrectly tracked. For PD1 hi and lo T cell and cancer cell coculture movies, cells to analyze were selected using their fluorescence (CellTrace Violet or CellTrace FarRed). The velocity (μm min-1), displacement (net displacement, μm), track length (total path length, μm), and meandering index (net displacement/track length) of each cell track was measured.
Tumor spheroids were generated using AggreWell 800 culture plates (STEMCELL). Wells were pre-treated with anti-adherence rinsing solution (STEMCELL) and centrifuged at 1200 RPM for 5 minutes. Wells were rinsed with media, and BT474 breast cancer cells were added to generate spheroids with between 4,000 and 5,000 cells per microwell, and spun at 1200 RPM for 5 minutes. After 24 hours, the spheroids were collected by gentle pipetting and allowed to settle in a 1.4 mL Eppendorf tube and excess media was aspirated. HER2-CAR T cells were stained with CellTrace FarRed or CellTrace Violet (ThermoFisher) per manufacturers protocol. Stained CAR-T cells were resuspended in 50 uL of complete RPMI and mixed with the tumor spheroids. 50 ul of Matrigel (Corning) was added to the stained CAR-T cell/spheroid mixture and mixed thoroughly. The total volume (100 μL) pipetted to the center of a ΔT-dish (Bioptechs), and incubated at 37°C and 5% CO2 for 30 minutes to allow the gel to polymerize into a 3D matrix. Once solidified, 1 mL of Leibovitz’s media supplemented with 20 mg/mL glucose was added to the dish and live-imaging time-lapse microscopy was performed. Video microscopy was conducted using a TE2000-U microscope (Nikon) coupled to a CoolSNAP HQ CCD camera with a 10x objective and 0.45 numerical aperture. The ΔT-dish was maintained in a 37°C chamber. Brightfield and fluorescent images were acquired every 60 seconds for up to 24 hours. For quantification, a single region of interest (ROI) was drawn around the tumoroid, and the mean fluorescence intensity increase within the ROI over time for PD-1high (green) and PD-1low (red) was measured.
Cancer cells were labeled with CFSE per manufacturers protocol. CAR-T cells were sorted on PD-1 expression. The cells were added to 24-well TC-treated plates and left overnight at various effector to target ratios. Anti-PD-1 and anti-IFNγ antibodies were added at a final concentration of 20 μg/mL in specified experiments. All cells were recovered from the plate after trypsinization into separate conical tubes. Cells were washed in PBS and 7-AAD was added to flow tubes. Cancer cell death (CFSE+7-AAD+) was measured by flow cytometry. Specific cell death was calculated using the following formula: (CAR-T Target % - Control Target %)/(100 – Control Target %) x 100
Cancer cells were labeled with CFSE per manufacturers protocol. CAR-T cells were sorted by PD-1 expression and added to the plate. Cells were cultured for 4 hours in the presence of monensin (1:1000) and PECy7-conjugated anti-CD107a (1 μL per mL of media) added directly into the media. T cells were recovered from the plate, washed, and CD107a expression was detected by flow cytometry.
Cancer cells were labeled with CFSE per manufacturers protocol. Sorted CAR-T cells were stained with CTFR. Labeled cancer cells and CAR-T cells were mixed in an Eppendorf tube containing 100 μL total volume for 2 hours. Cells were fixed directly in the Eppendorf tube by addition of 4% PFA (Paraformaldehyde, 16% w/v aq. Soln., methanol free, ThermoFisher Scientific) for 30 min. Cells were gently spun and washed and transferred to a flow tube. Events double positive for CTFR and CFSE were identified to determine the percent of CAR-T cells in conjugation with cancer cells.
HER2-TG mice were inoculated with 5x10⁵ B16-hHER2. After 7 days, approximately 1 million CAR T cells were injected either intravenously via retro-orbital injection or intratumorally in 10 μL PBS. For tumor growth analysis, tumors were measured using electronic calipers at the time of T cell injection and every 2 days thereafter. Tumor were allowed to grow for 7 or 8 more days or until tumors reached their endpoints. Mice were treated with 100 μg of anti-PD-1 antibody (29F.1A12) or rat IgG2a isotype control (2A3) at tumor day 7 and 11 by I.P. injection. Tumor volumes were estimated using the following calculation: (l x w2 x 0.52). At experimental endpoints, mice were sacrificed and tumors were removed, manually disrupted, and digested in collagense/dispase (Roche) for 30 min at 37°C. Digested tumor suspensions were filtered through a 100 μm strainer, washed, and analyzed using flow cytometry.
All statistical tests were performed with GraphPad Prism (v9). Statistical analysis was performed using Two-way ANOVA, ordinary One-Way ANOVA with a Tukey’s multiple-comparison post-test, unpaired t-test, and Mann– Whitney test when appropriate. Differences were considered significant when P values were <0.05.
Exhausted T cells express PD-1, which mainly limits immunopathology in the setting of chronic TCR stimulation (34). Similarly, given the repeated TCR activations and continued cytokine stimulation involved, ex vivo manufacturing procedures for CAR-T cells often inevitably induce terminal differentiation and senescence of T cells with cell surface expression of exhaustion markers (35). Despite the clear role of PD-1/PD-L1 in regulating the anti-tumor responses of effector T cells, the biological impact of this inhibitory receptor expression on CAR-T cell function remains largely unexplored. To investigate how PD-1 controls the function of CAR-T cells, we first measured PD-1 expression on naïve T cells isolated from CD19 CAR-T cell (axicabtagene ciloleucel) patients (on day -5 before CAR-T cell injection) and compared the PD-1 expression level with that of their CAR-T cell product. Flow cytometry analysis confirmed a significantly higher (Figure 1A), and heterogeneous expression pattern for PD-1 (PD-1high vs. PD-1low) in the CAR-T cell infusion products compared to the corresponding naïve T cells (Figure 1B).
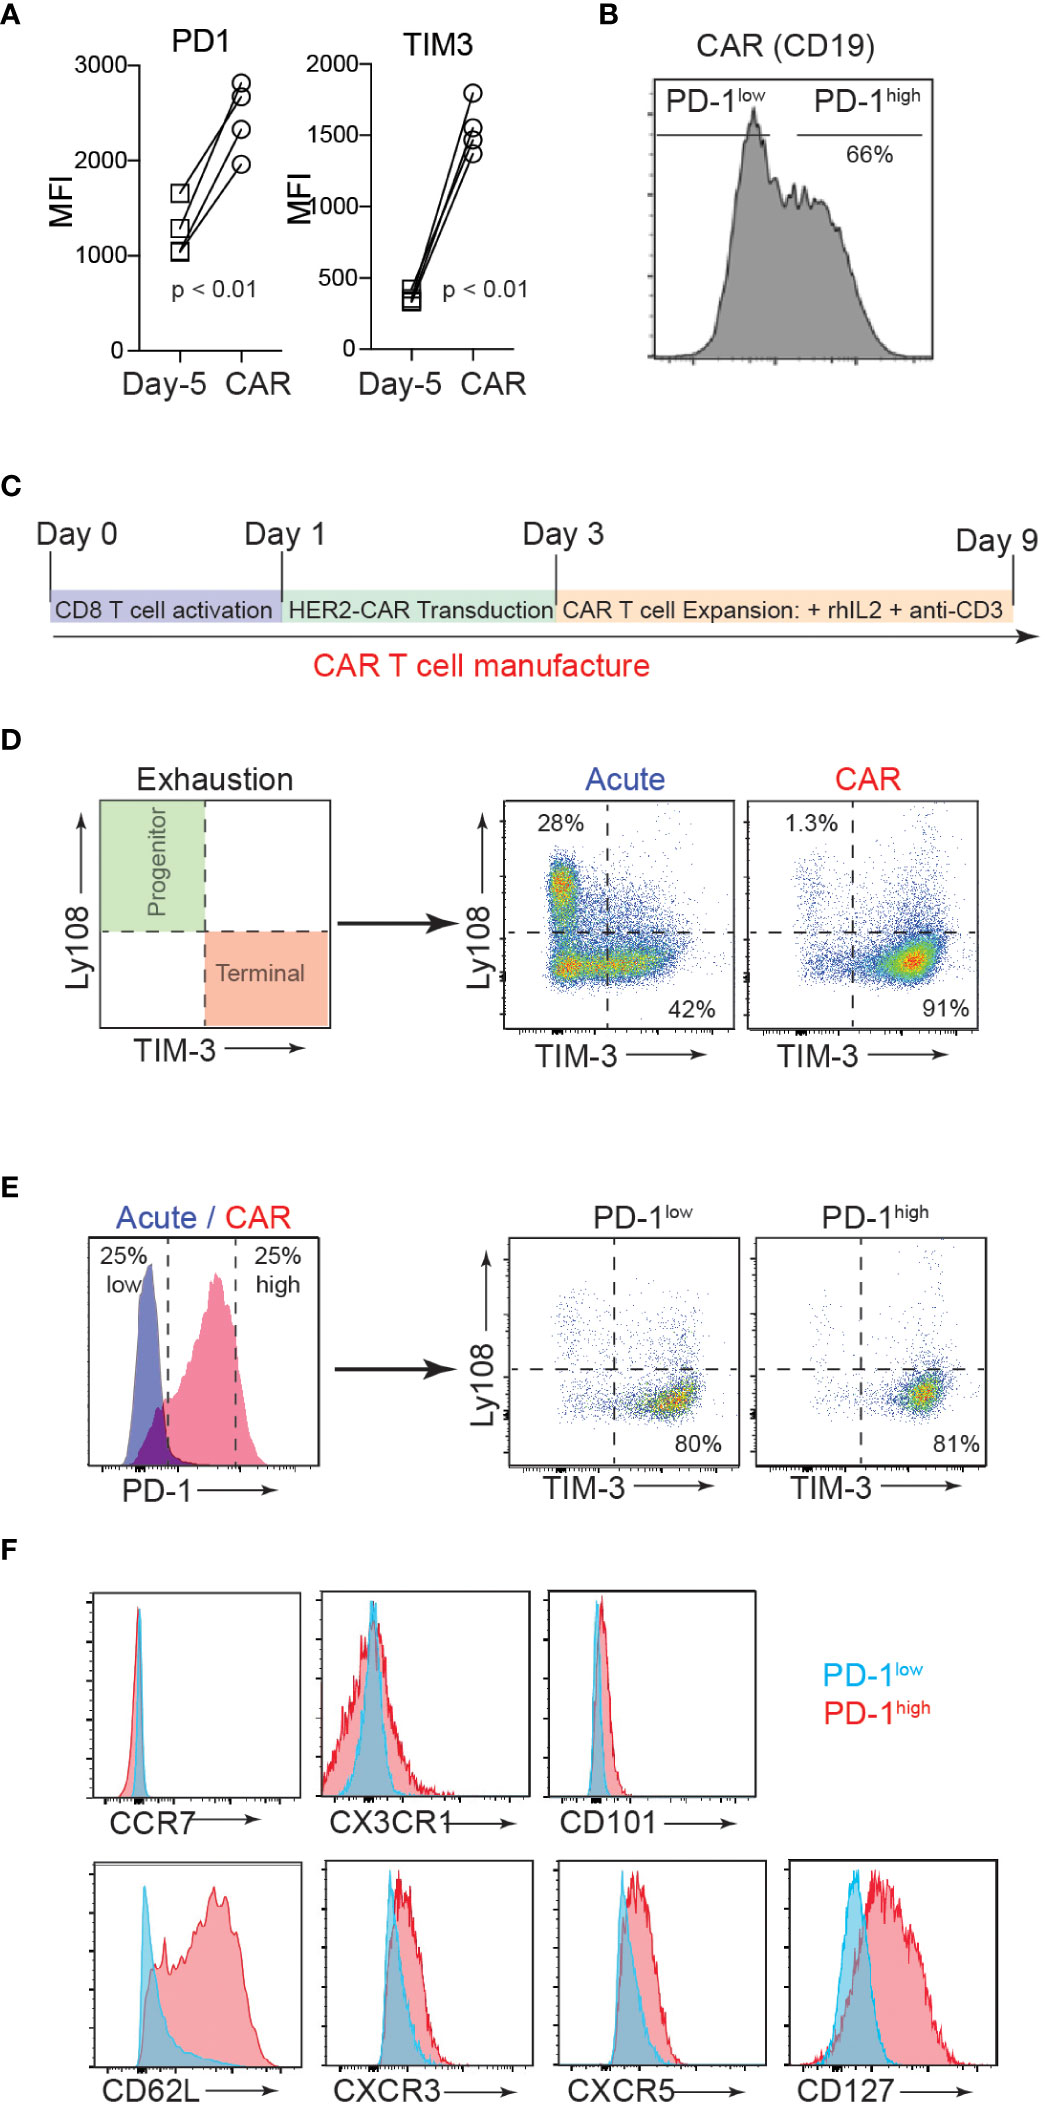
Figure 1 CAR-T cell production induces heterogenous PD-1 expression. (A) T cells were isolated from axicabtagene ciloleucel patient peripheral blood 5 days prior to infusion (D-5, squares) and the CAR-T cell infusion bag (CAR, circles). Flow cytometry analysis of surface inhibitory receptors PD-1 and TIM3 mean fluorescence intensity (MFI) on four patient-derived CD19 CAR T cell samples is depicted. P value was determined by paired, two-sided Student’s t-test. (B) Representative flow cytometry histogram of PD-1 expression in CD19 CAR T cell infusion product. (C) Schematic of murine CD8 CAR-T cell manufacturing process. (D) Flow cytometry analysis showing the surface expression of progenitor (Ly108+TIM3-) and terminal (Ly108-TIM3+) exhausted subsets after murine CAR-T cell manufacturing (CAR) or expansion in the absence of plate-bound anti-CD3 (Acute). (E) Flow cytometry analysis showing surface PD-1 expression after murine CAR-T cell manufacturing (left) and exhaustion subsets of high and low PD-1 expressors (right). (F) Representative flow cytometry histograms showing expression of select surface markers for PD-1low (blue) and PD-1high (red) CAR T cells.
The current therapeutic T cell manufacturing process (both for tumor-infiltrating lymphocyte (TIL) and CAR-T cell therapy) includes the selection and activation of T cells from patient apheresis products using CD3/CD28 beads and large clinical scale T cell expansion with high concentrations of IL-2 (36). We adapted this process to generate trastuzumab (4D5; anti-human HER2)-based murine hHER2-CAR-T cells (Supplementary Figure 1A) (33). In vitro activated mouse CD8 T cells were retrovirally transduced with the CAR at 90% efficiency (Supplementary Figure 1B). Coincubation of E0771 mouse breast cancer cell line, which stably expresses human HER2 antigen (E0771-hHER2), with hHER2-CAR expressing mouse CD8 T cells induced dramatic cytotoxicity compared to the control CD8 T cells (Supplementary Figures 1C-E), confirming that HER2-CAR expression redirects CD8 T cells to eliminate HER2-expressing target cells. After transduction, HER2-CAR T cells were then expanded in vitro with anti-CD3 and recombinant IL-2 to replicate the activation and expansion method used in relevant clinical trials (Figure 1C) (36). With this in vitro T cell activation protocol, we found that the mouse CAR-T cell product expressed cell surface markers that traditionally represent a “terminally exhausted” T cell population (TIM3+Ly108-), while “acute” in vitro activation of T cells (CAR-T cell expansion in the absence of persistent anti-CD3-mediated TCR activation (37, 38)) induced a “progenitor exhausted” phenotype (Figure 1D) (39). Consistent with the data for human CAR-T cells, mouse CAR-T cells expressed heterogeneous levels of surface PD-1 (PD-1high vs. PD-1low) and both PD-1high and PD-1low CAR T cells showed a predominantly “terminally exhausted” phenotype and (Figure 1E). Flow cytometry analyses of CAR-T cells further revealed that compared to PD-1low CAR T cells, PD-1high CAR T cells display elevated levels of a lymph node homing adhesion molecule, CD62L, but similar expression levels of CCR7, CX3CR1, and CD101 (Figure 1F). PD-1high CAR T cells also expressed slightly elevated levels of CXCR3, CXCR5, and CD127 (Figure 1F). Collectively, these results indicate that both human and mouse CAR T manufacturing promotes phenotypic signs of exhaustion, yet a spectrum of PD-1 expression and other important surface markers, that are potentially associated with distinct functionalities.
PD-1 expression is often associated with functional exhaustion of in vitro activated T cells chronically stimulated with high levels of plate-bound anti-CD3 (37, 38). To test this in our in vitro manufactured CAR-T cells, CD8 T cells were transduced with anti-HER2 CAR and sorted based on their cell surface PD-1 expression level (Supplementary Figure 1F). Unlike our prediction, PD-1high hHER2-CAR-T cells exhibited superior cytotoxicity against E0771-hHER2 cells (Figure 2A). Note that PD-1high and PD-1low hHER2-CAR-T cells used in the cancer-killing assay expressed comparable cell surface levels of CAR (Figure 2B).
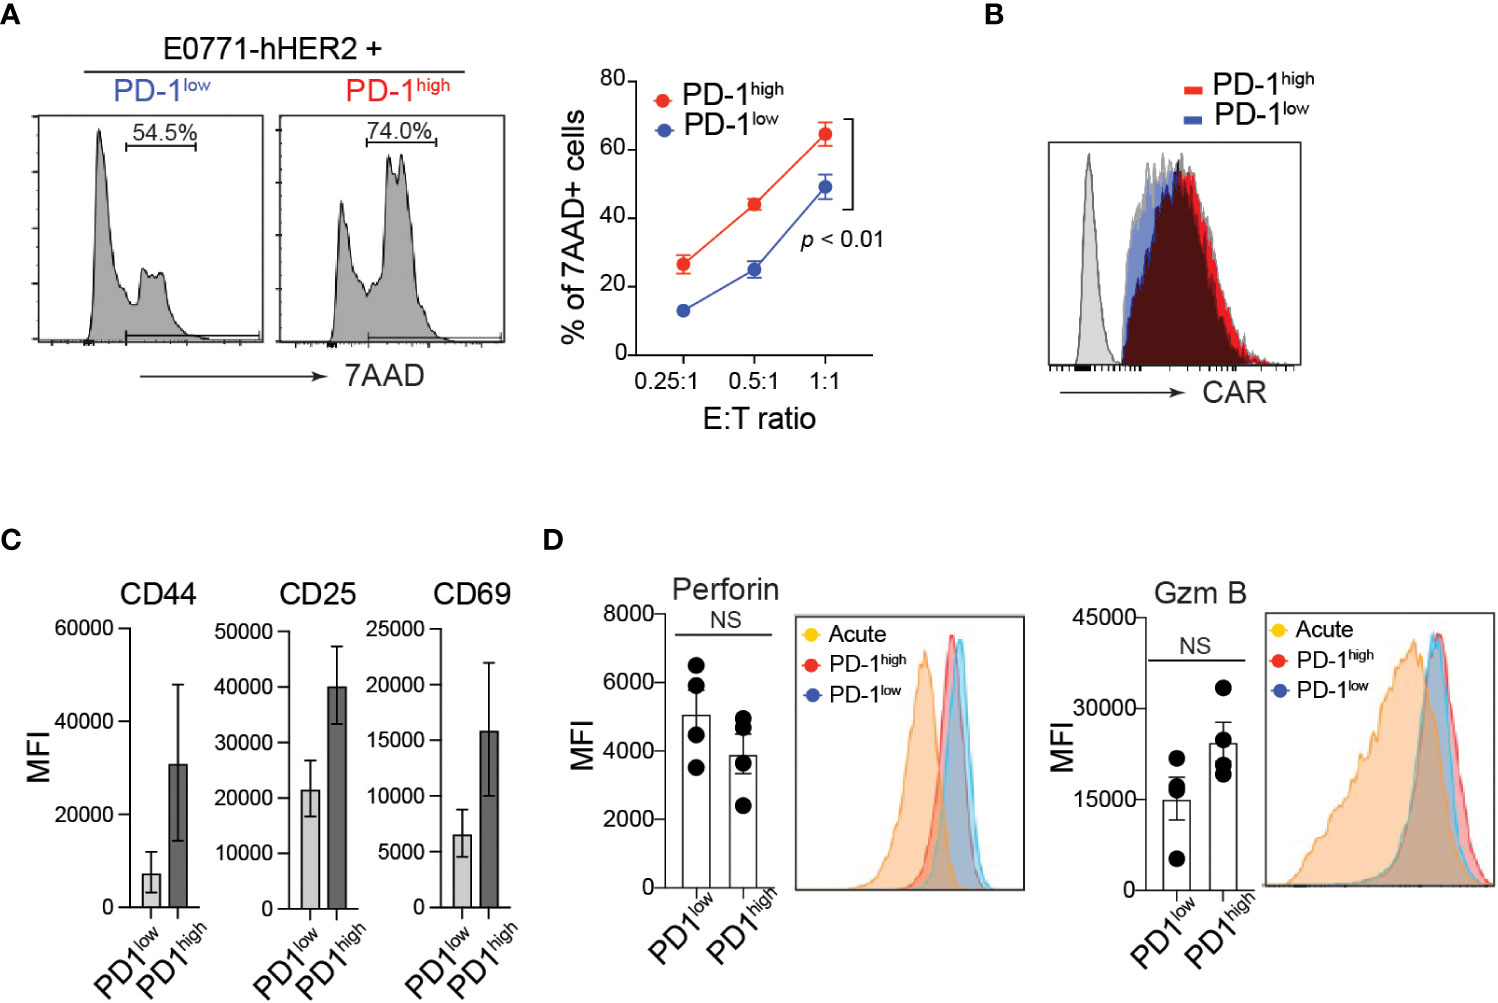
Figure 2 Elevated cytotoxicity of PD-1high CAR-T cells. (A) Representative flow cytometry analysis of CFSE-labeled hHER2-E0771 positive for 7-AAD staining after 16-hour co-culture with sorted PD-1high or PD-1low CAR-T cells (left) and quantification at stated effector to target ratios (right) from three independent experiments in triplicate is shown (mean +/- SEM). P value was determined by one-way ANOVA. (B) Representative flow cytometry data of surface hHER2-CAR expression on non-transduced T cells (gray) and PD-1low (blue)- or PD-1high (red)-CAR-T cells. (C) Flow cytometry MFI of CD44, CD25, and CD69 cell surface expression on PD-1high and PD-1low CAR-T cells from four independent experiments is depicted (mean +/- SEM). (D) Representative flow cytometry analysis of intracellular levels of perforin and Granzyme B in PD-1high and PD-1low CAR-T cells and MFI from 4 independent experiments is shown (mean +/- SEM). NS; not significant. P value was determined by unpaired, Student’s t-test.
Although PD-1 expression is often used as an indication of T cell exhaustion, it is quickly upregulated on the cell surface within 24 h of T cell activation. Thus, PD-1 can also serve as a marker of T cell activation both in vitro and in vivo (40). Indeed, PD-1high hHER2-CAR-T cells showed enhanced T cell activation compared with PD-1low hHER2-CAR-T cells (Figure 2C). To test whether the enhanced cytotoxicity of PD-1high CAR-T cells is associated with the differential expression of anti-cancer effector molecules after T cell activation, we measured intracellular perforin and granzyme B levels. Flow cytometry analysis of intracellular molecules revealed that PD-1high hHER2-CAR-T cells and PD-1low hHER2-CAR-T cells express comparable levels of effector molecules (Figure 2D).
The finding that PD-1high CAR-T cells exert stronger tumoricidal functions than PD-1low CAR-T cells despite the similar cell surface levels of CAR and intracellular levels of anti-cancer effector molecules suggests the presence of unique T cell-target cell interaction patterns that may promote T cell-mediated killing in PD-1high CAR-T cells. Indeed, elevated PD-1 expression has been previously implicated in the altered migration patterns of cytotoxic T cells in viral infection and cancer (17, 41). To investigate the impact of PD-1 expression on CAR-T cell motility, PD-1high and PD-1low hHER2-CAR-T cells were allowed to migrate on ICAM-1 + CXCL12 coated cover glass. PD-1high hHER2-CAR-T cells showed decreases in track length, cell velocity, and cell meandering index compared to PD-1low hHER2-CAR-T cells (Figure 3A and Movie 1). The reduced cell motility patterns were unlikely to be due to differential expression levels of the chemokine receptor CXCR4 or integrin LFA-1 (Figure 3B). The IFNγ-CXCL10-CXCR3 axis has been implicated in the recruitment of T cells to sites of inflammation and responses to immunotherapy (42, 43). Indeed, PD-1high CAR T cells express slightly elevated levels of chemokine receptor CXCR3 (Figure 1F), which may be associated with improved recruitment and retention to tumor sites. However, like the experiments with CXCL12, in vitro T cell motility assay with ICAM-1 and CXCL10 coated cover glass showed shorter track length, lower cell meandering index, and slower velocity in PD-1high CAR T cells (Supplementary Figure 2). Therefore, our data suggest that the difference in motility is cell intrinsic and not dependent on their response to differential chemokine signals. Interestingly, the reduced velocity of PD-1high CAR-T cells concurred with more stable cell-cell interactions and a prolonged dwelling time within close proximity to target tumor cells (Figures 3C-E and Movie 2). Furthermore, the unique migration pattern of PD-1high CAR-T cells led to rapid and greater T cell accumulation toward the HER2+ BT474 spheroids in 3D migration assays (Figure 3F and Movie 3). Therefore, our data suggest that CAR-T cells undergo significant molecular and cellular reprogramming during the in vitro manufacturing process and that the intrinsic changes in the motility of PD-1high subpopulations allows for more stable interaction with target cells.
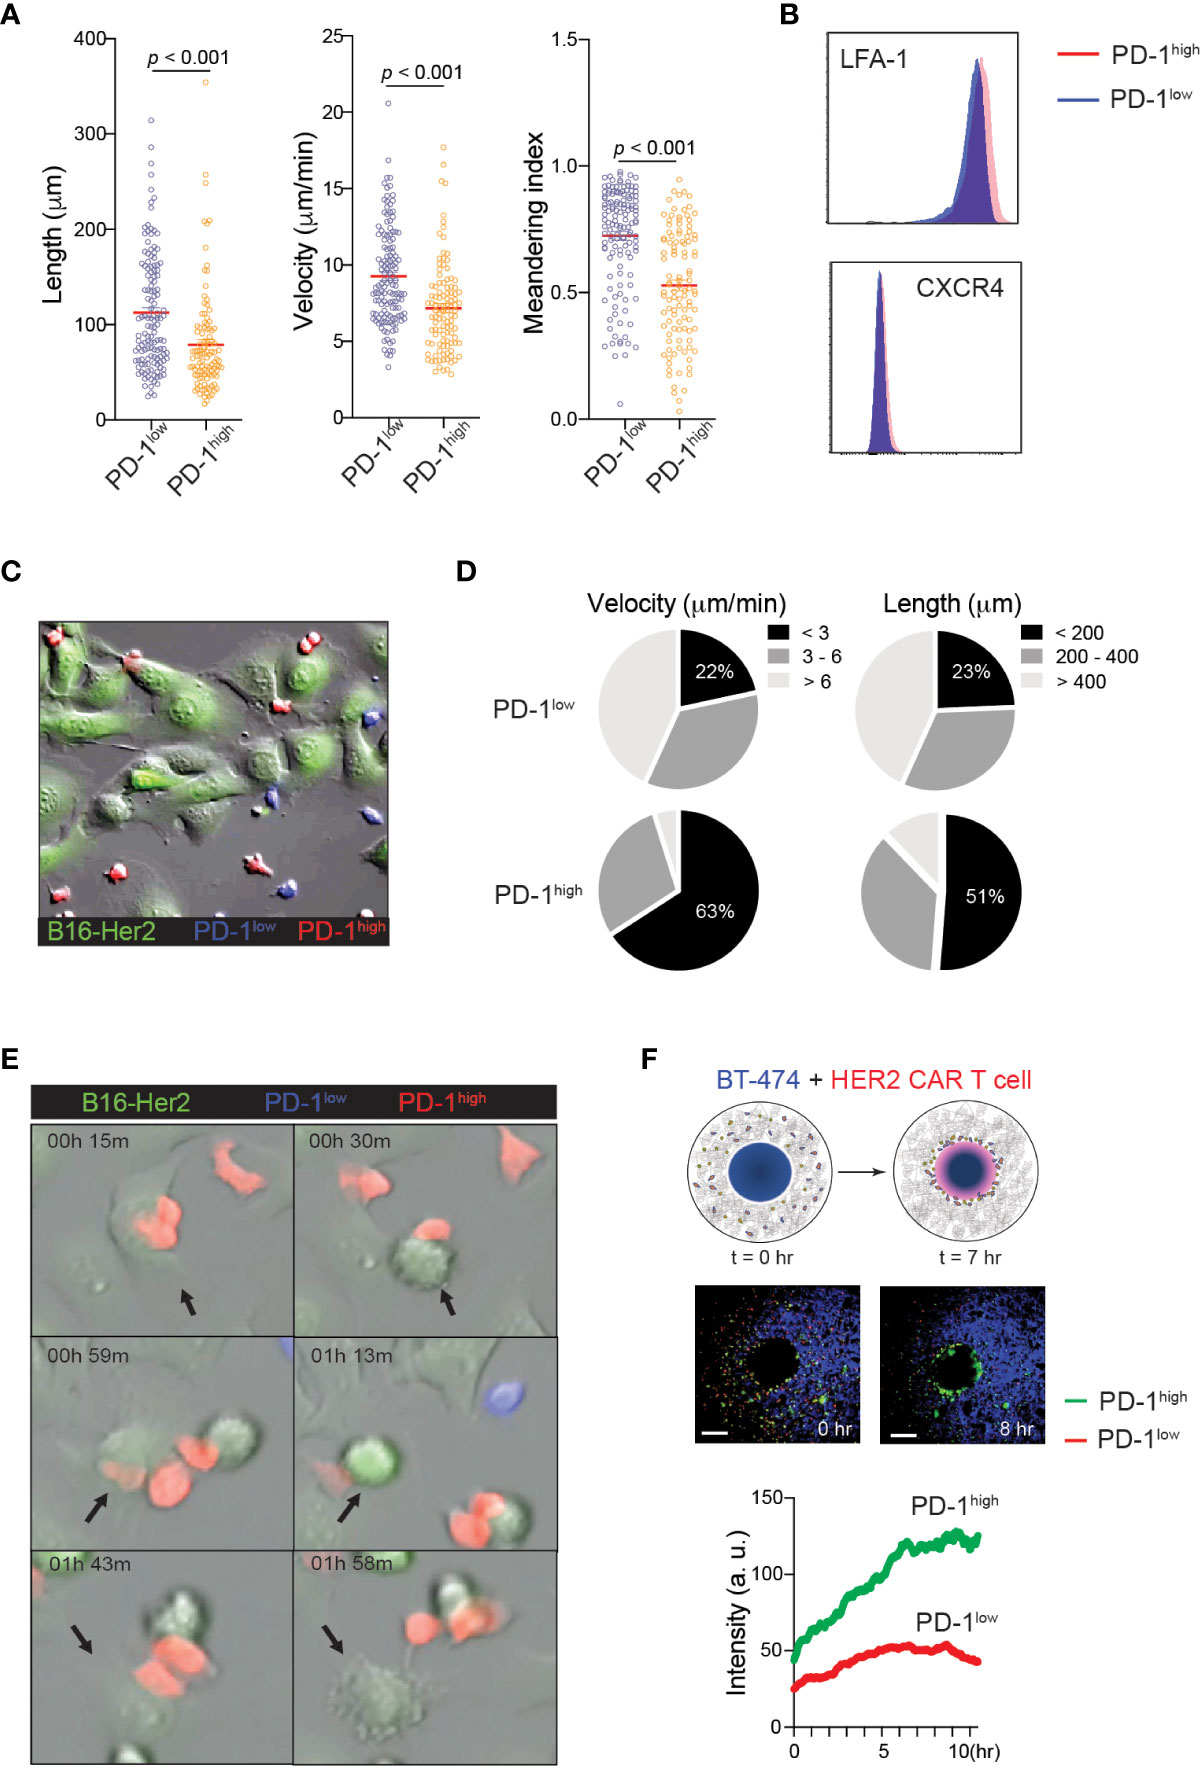
Figure 3 Distinct motility patterns of PD-1high vs. PD-1low CAR-T cells. (A) Track length, velocity, and meandering index were calculated from PD-1high and PD-1low CAR-T cells migration on ICAM-1 and CXCL12 coated dishes. Data shown are representative results from one of 4 independent experiments. Solid red line indicates the mean, and P value was determined by unpaired, two-sided Student’s t-test. (B) Representative flow cytometry data showing surface expression of LFA-1 and CXCR4 on PD-1high and PD-1low CAR-T cells. (C) Time-lapse sequencing of PD-1high (red) and PD-1low (blue) CAR-T cells with hHER2-expressing B16F10 cells (green) was imaged every 30 seconds for 2 hours. (D) Velocity (left) and track length (right) for PD-1high and PD-1low CAR-T cells were quantified. Cell tracks for PD-1high and PD-1low CAR-T cells were stratified into slowest (<3 μm/min), middle (3-6 μm/min), and fastest (> 6 μm/min) migrating cells and shortest (<200 μm), middle (200-400 μm) and furthest (> 400 μm) migrators while in the presence of target cancer cells. (E) Selected still images from the cell migration movie 2 indicating cytotoxic events of PD-1high and PD-1low CAR-T cells targeting hHER2-B16F10 cancer cells on ICAM-1 and CXCL12 coated plates. (F) Schematic of in vitro 3D CAR-T cell migration assay. hHER2-CAR-T cells swarm to cognate tumoroids in Matrigel over time (upper). Still images from the movie showing the start point (0 hr) and 8 hours later showing increased engagement of PD-1high (green) CAR-T cells with BT474 tumoroids (middle). A single region of interest was drawn around the tumoroid, and mean fluorescence intensity was quantified for recruited PD-1high (green) and PD-1low (red) CAR-T cells over time (lower). Data represent 4 experiments with BT474 and HER2-B16 (mouse) tumoroids with similar results.
In addition to active cell migration to form stable conjugations with target cells, CAR-T cells can produce various cytokines, such as TNFα and IFNγ, in the tumor microenvironment. Importantly, recent studies have demonstrated that the adhesion between CAR-T cells and target cancer cells is directly regulated by IFNγ, which induces an upregulation of ICAM-1 on target tumor cells, promoting the formation of conjugations with CAR-T cells (44, 45). Consistent with these studies, after co-culturing with hHER2-expressing target cancer cells, we identified that a significantly higher proportion of PD-1high hHER2-CAR-T cells than PD-1low CAR-T cells produced IFNγ (Figure 4A). We also tested the ability of PD-1high and PD-1low CAR T cells to produce IL-2 following stimulation with plate-bound anti-CD3/CD28. Despite their lack of IL-2 production relative to acute in vitro activation, both PD-1high and PD-1low CAR T cells remained highly proliferative as measured by Ki67 staining (Figures 4B, C). Note that Ki67 is also expressed on recently divided and terminally exhausted T cell populations with decreased effector functions (41, 46). Furthermore, co-culture of PD-1high hHER2-CAR-T cells with hHER2-B16 or hHER2-E0771 upregulated ICAM-1 expression on the target tumor cells to a level similar to that on B16 cells treated with recombinant IFNγ alone (Figures 4D-F). Enhanced ICAM-1 expression on target tumor cells led to an increase in conjugation formation with PD-1high hHER2-CAR-T cells (Figure 4G) followed by greater lytic granule exocytosis (measured as CD107a expression), compared to PD-1low CAR-T cells (Figure 4H and Supplementary Figure 3). IFNγ and ICAM-1 dependent conjugation formation between hHER2-CAR-T cells and target tumor cells was further confirmed by incubating tumor cells with recombinant IFNγ with/without an anti-LFA-1 blocking antibody (Figure 4I). Our data suggest that PD-1high CAR-T cells are able to produce more IFNγ than PD-1low CAR-T cells, resulting in robust upregulation of ICAM-1 on target cancer cells, which then supports more stable T cell-tumor cell conjugation formations to improve T cell-mediated killing. Consistent with ICAM-1 expression, coculture with PD-1high and PD-1low CAR-T cells induced PD-L1 expression on the target HER2-B16 cells (Figure 4J). Importantly, PD-1high CAR-T cells maintain superior killing capacity despite the greater increase in PD-L1 expression on target cells (Figures 4K, 2A). However, CAR-T cell-mediated cancer cell killing was not further enhanced with the addition of anti-PD-1 antibody (Figure 4K), indicating that PD-1/PD-L1 axis does not directly regulate CAR-T cell cytotoxicity in vitro (47). Instead, treatment of IFNγ neutralizing antibody during the coculture reduced ICAM-1 expression on target cancer cells and suppressed the killing function of CAR-T cells (Figures 4L, 4M), indicating that CAR-T cell cytotoxicity is dependent on the production of IFNγ and subsequent ICAM-1 expression on their target cells (48). Importantly, enhanced IFNγ production and improved target cell killing by PD-1high CAR T cells was observed in human anti-IL-13 receptor α2 (IL13Rα2) CAR-T cells co-incubated with a human melanoma cell (Supplementary Figure 4).
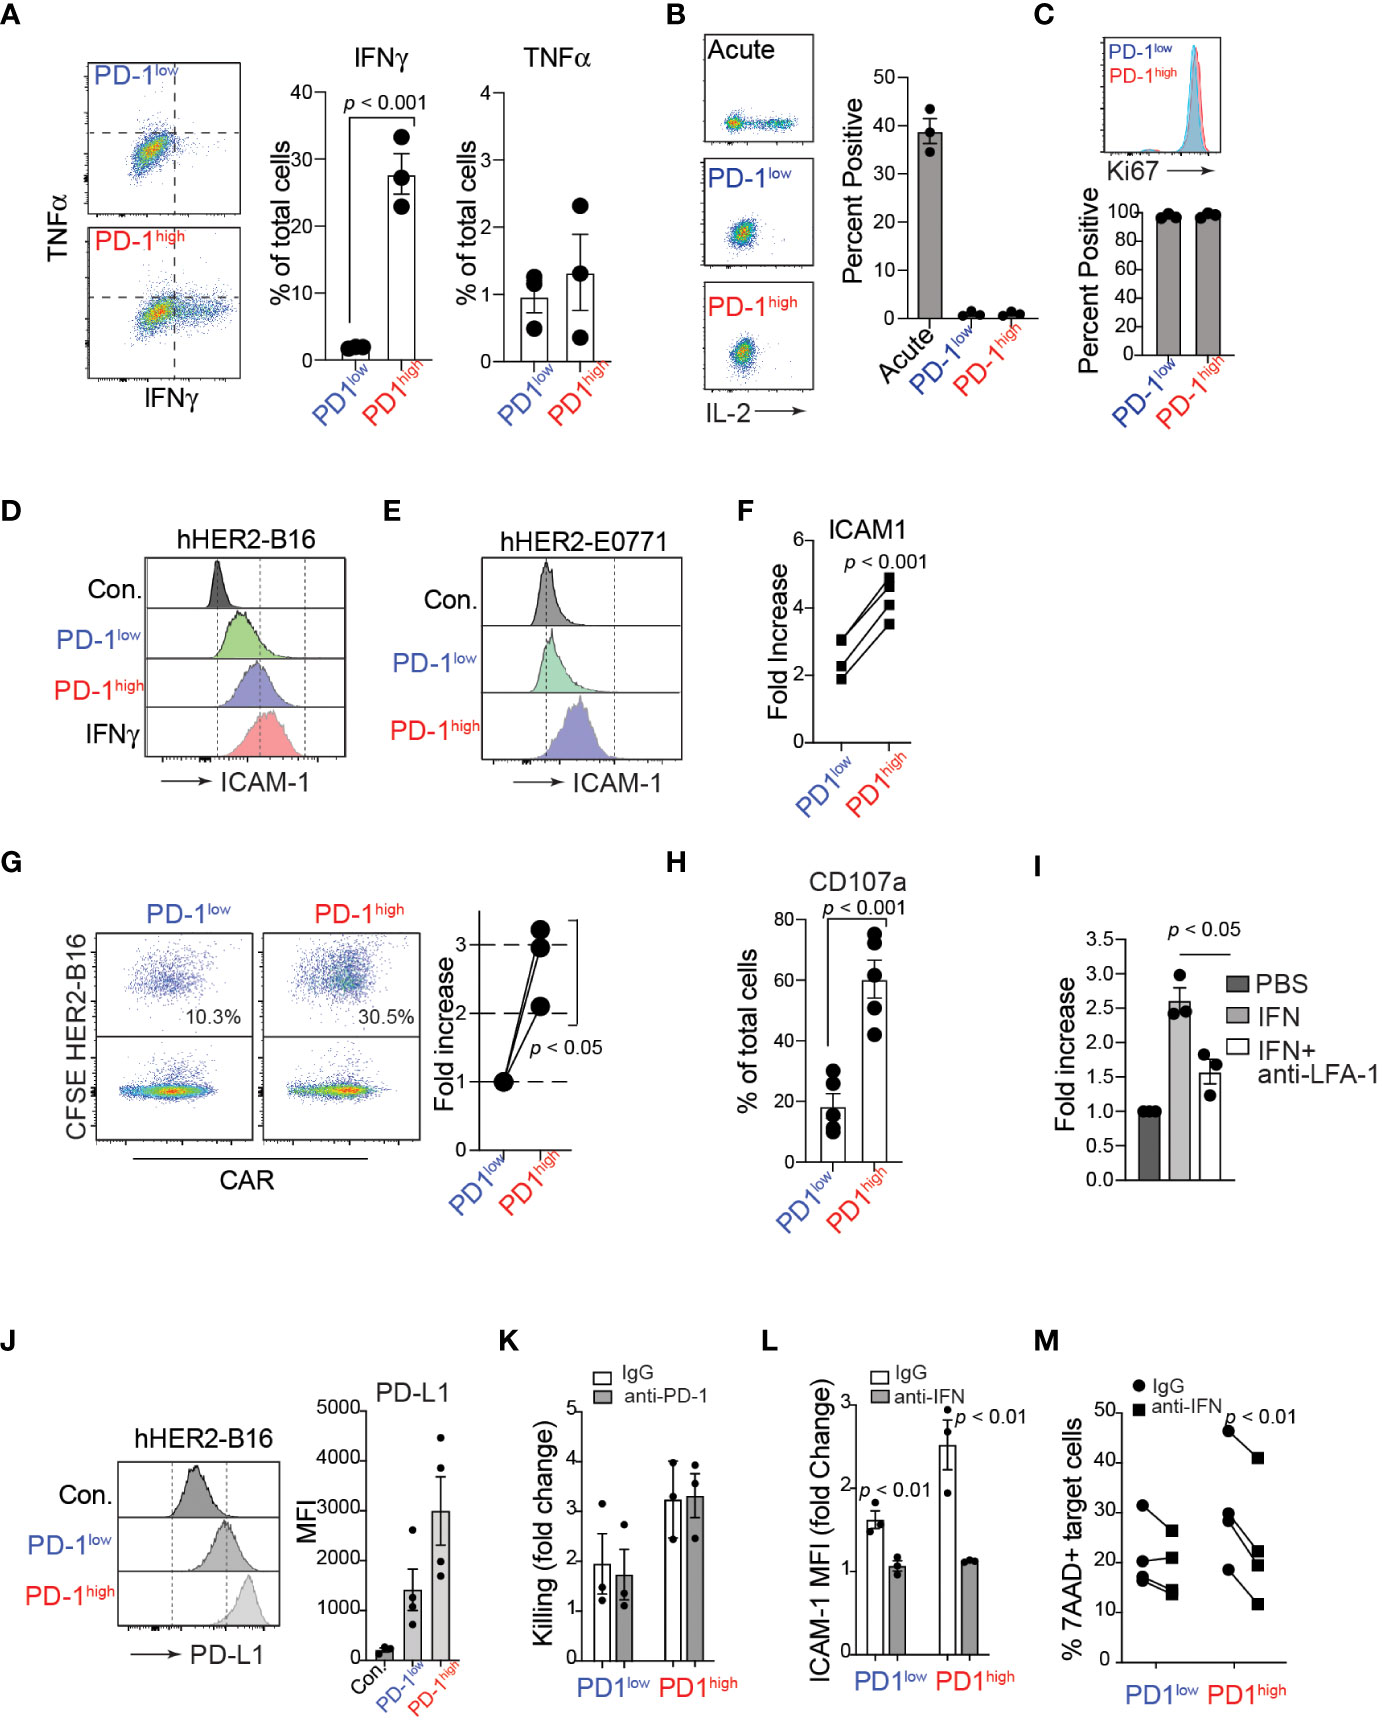
Figure 4 IFNγ production of PD-1high CAR-T cells and enhanced engagement with target cancer cells. (A) Flow cytometry analysis of TNFα and IFNγ intracellular levels in PD-1high and PD-1low CAR-T cells after 4-hour co-cultures with target cancer cells in the presence of monensin (1:1000) and brefeldin A (1:1000). A representative experiment is shown from 3 independent experiments. On the right, quantification of the percent of PD-1high and PD-1low CAR-T cells producing TNFα and IFNγ is shown from 3 independent experiments performed in triplicate. P value was determined by unpaired, two-sided Student’s t-test. (B) Representative flow cytometry analysis (left) and quantification (right) of intracellular IL-2 staining after stimulation with plate-bound anti-CD3/CD28 antibodies for acute, PD-1low and PD-1high CAR T cells from 3 experiments performed in triplicate. (C) Representative flow cytometry analysis (upper) and quantification (lower) of intracellular Ki67 staining for sorted PD-1low and PD-1high CAR T cells from 3 independent experiments performed in triplicate. (D, E) Flow cytometry histograms of surface ICAM-1 expression on hHER2-B16 (D) and hHER2-E0771 (E) after 16 hour co-culture with PD-1high and PD-1low CAR-T cells, or with 100 ng/mL recombinant mouse IFNγ. (F) Quantification of the increase in hHER2-B16 ICAM-1 expression after co-culture with PD-1high and PD-1low CAR-T cells relative to untreated hHER2-B16 from 4 independent experiments in triplicate is shown. P value was determined by unpaired, two-sided Student’s t-test. (G) CAR-T cells were sorted on PD-1 expression and labeled with CellTrace FarRed and mixed with CFSE-labelled hHER2-B16 for 2 hours. Events double-positive for CellTrace FarRed and CFSE were measured using flow cytometry to assess the percent of CAR-T cells in conjugation with target hHER2-B16 (left). Quantification of the relative increase from PD-1low to PD-1high is shown on the right from 3 independent experiments. P value was determined by unpaired, two-sided Student’s t-test. (H) PD-1high and PD-1low CAR-T cells were cultured with CFSE-labelled target cancer cells for 4 hours in the presence of monensin (1:1000). The percent of cells positive for CD107a staining was measured for PD-1high and PD-1low CAR-T cells by flow cytometry from 5 independent experiments performed in triplicate. P value was determined by unpaired, two-sided Student’s t-test. (I) hHER2-B16 cells were treated with 100 ng/mL recombinant mouse IFNγ or PBS overnight. Cancer cells (CFSE) were used for the conjugation assay with CAR-T cells (CellTrace FarRed) in the presence or absence of anti-LFA-1 antibody. The fold increase in conjugation formation from PBS alone was quantified from 3 independent experiments. P value was determined by unpaired, two-sided Student’s t-test. (J) Representative flow cytometry histogram (left) and mean fluorescence intensity quantification (right) of surface PD-L1 expression on hHER2-B16 after coculture with PD-1low or PD-1high CAR T cells from 4 independent experiments performed in triplicate. (K) Quantification of target tumor cell killing relative to control T cells for PD-1low and PD-1high CAR T cells in the presence of 20 μg/mL anti-PD-1 antibody from 3 independent experiments performed in triplicate. (L) Quantification of the fold change in ICAM-1 MFI on target tumor cells after coculture with PD-1low or PD-1high CAR T cells with 20 μg/mL anti-IFNγ antibody from 3 independent experiments performed in triplicate. (M) Quantification of percent 7AAD+ target cancer cells after after coculture with PD-1low or PD-1high CAR T cells with 20 μg/mL anti-IFNγ antibody from 4 independent experiments performed in triplicate.
To further confirm the superior anti-cancer functions of PD-1high CAR-T cells in vivo, we first performed a competitive tumor retention assay. For in vivo assays, we used human-HER2 (hHER2) transgenic (tg) C57BL/6 mice that overexpress the human erbB-2 gene under the mouse mammary tumor virus promoter (obtained from Genentech (32, 49)). hHER2 Tg mice bearing hHER2-B16 tumors received equal numbers (1:1) of PD-1high hHER2-CAR-T cells (GFP+CD45.1+) and PD-1low hHER2-CAR-T cells (GFP+CD45.2+) injected intratumorally (Figure 5A). The ratio of PD-1high/PD-1low CAR-T cells remained close to 1 after 24 hours, but by day 7, the majority of intratumoral CAR-T cells were PD-1high hHER2-CAR-T cells (Figure 5A). A similar change in the PD-1high/PD-1low CAR-T cell ratio on day 7 was also observed at the tumor site after i.v. injection of hHER2-CAR-T cells (Figure 5B). More importantly, PD-1high hHER2-CAR-T cells at the tumor site on day 7 did not exhibit diminished cell surface expression of PD-1 (Figure 5C). These results demonstrated a greater capability of PD-1high CAR-T cells to migrate and persist at target tumor sites in vivo.
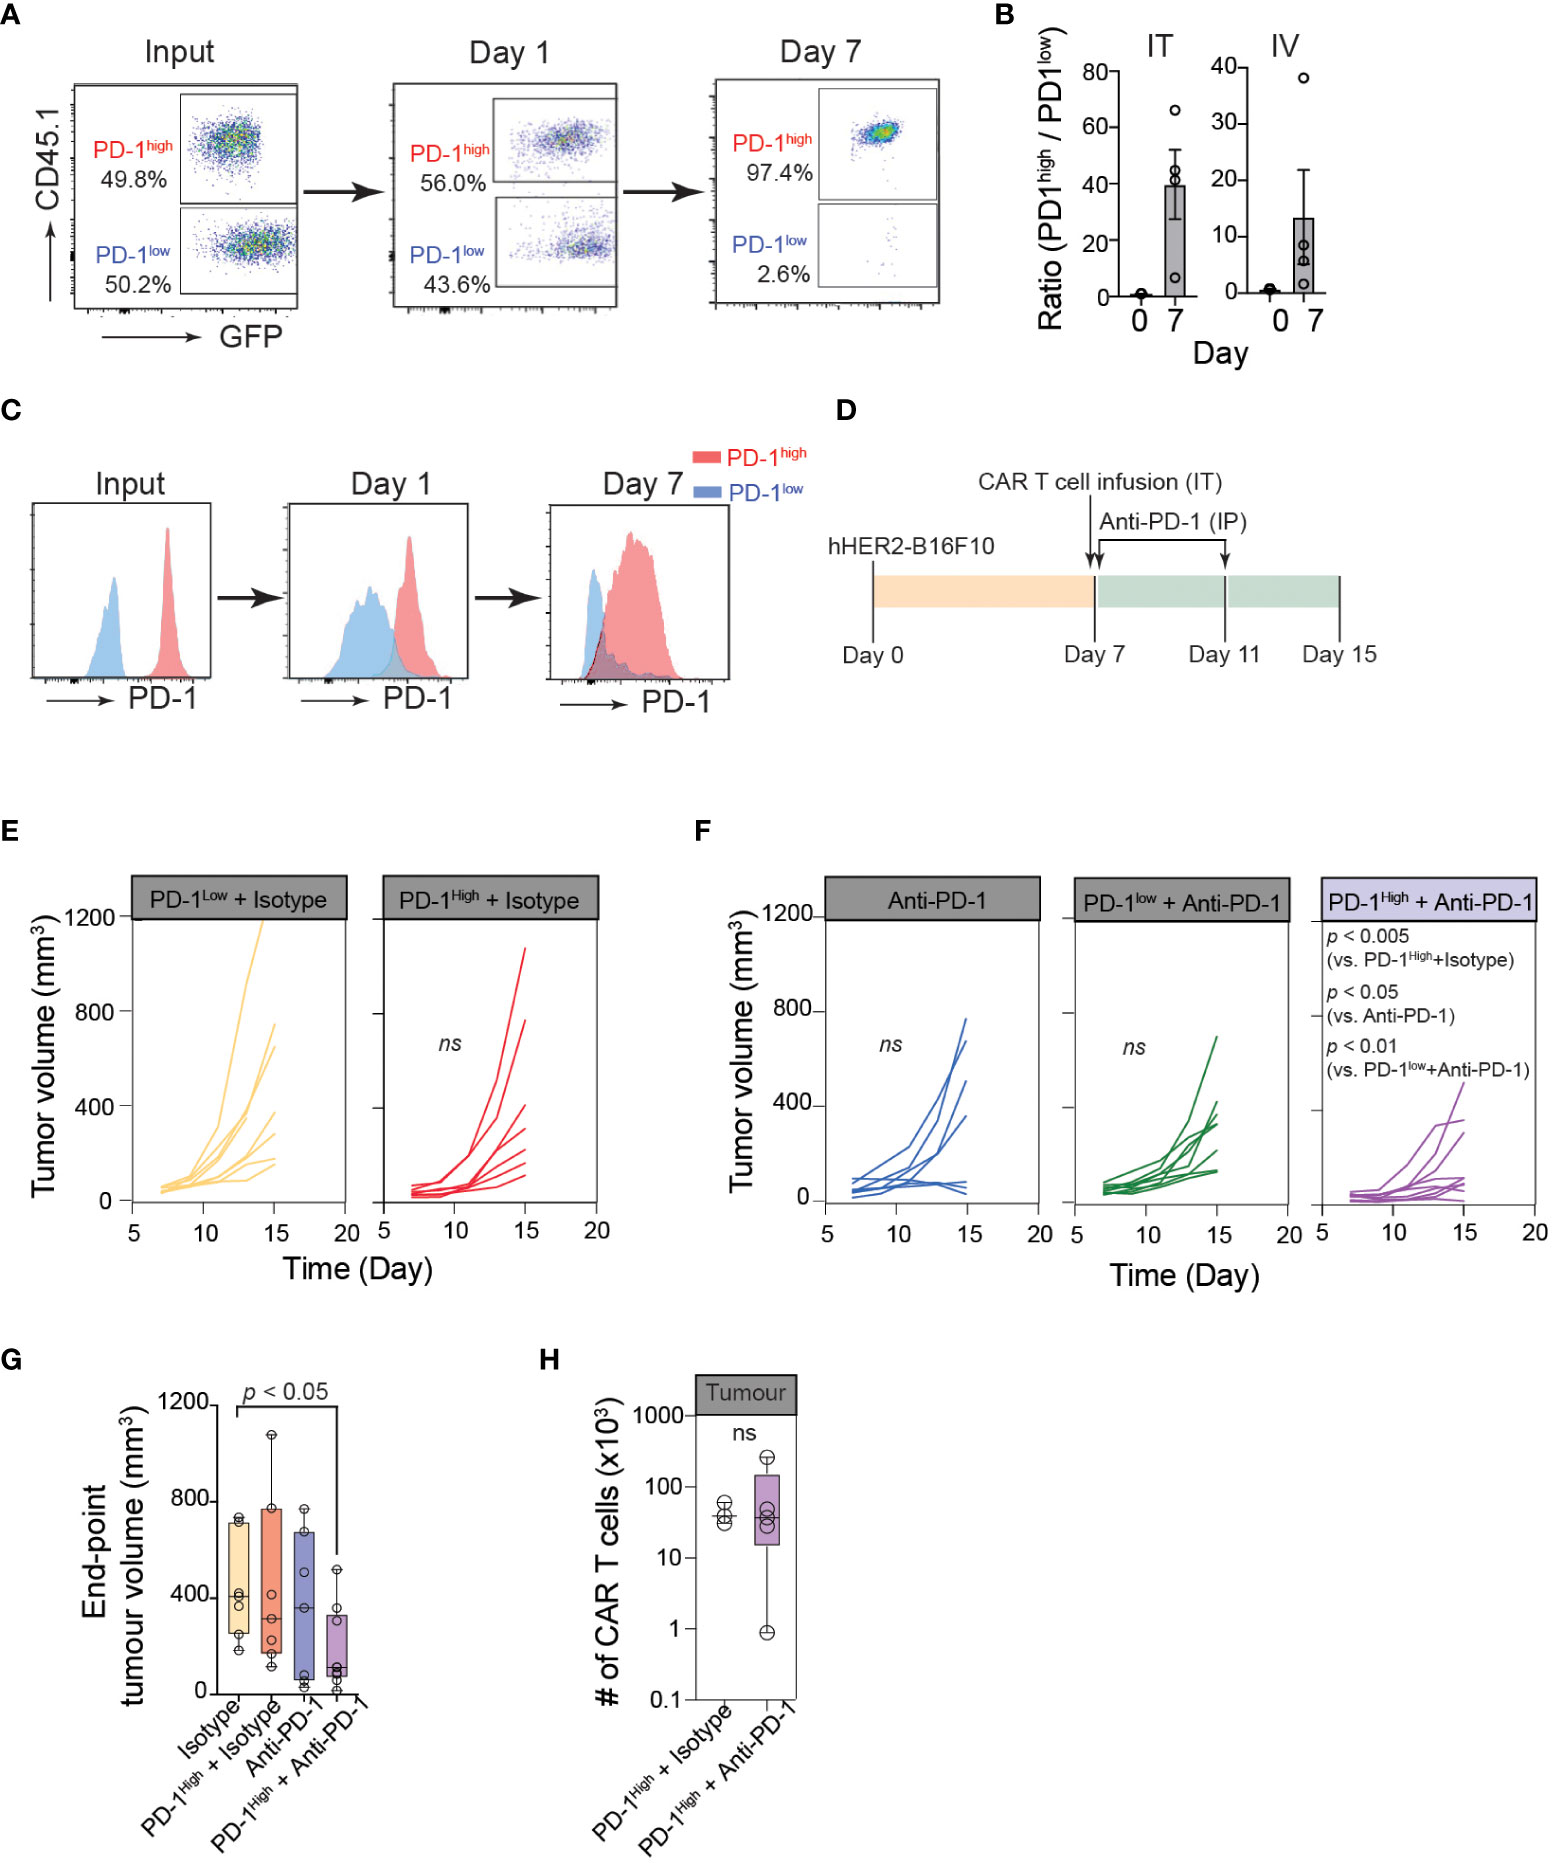
Figure 5 Optimum cancer control by PD-1high CAR-T cells is achieved with PD-1 blockade. (A) Representative flow cytometric data showing PD-1high (CD45.1+GFP+) to PD-1low (GFP+) ratio at the time of injection (input), and the intratumoral PD-1high to PD-1low ratio 24 hours and 7 days post-intratumoral injection. (B) Quantification of PD-1high to PD-1low ratio at the time of injection (Day 0) and 7 days after both intratumoral injection (IT; left) or intravenous injection (IV; right) from 4 independent experiments. (C) Representative data of surface PD-1 expression for PD-1high and PD-1low CAR-T cells 1 day and 7 days post-intratumoral injection. (D) Schematic of experimental design for combination therapy. Mice were inoculated with hHER2-B16 on the mouse flank. PD-1high or PD-1low CAR-T cells were injected intratumorally on Day 7 and mice were given anti-PD-1 or isotype antibody injections I.P. on days 7 and 11. (E, F) Longitudinal tumor burden (volume, mm3) of hHER2-B16 tumor-bearing mice treated with 1x10⁶ PD-1high or PD-1low CAR-T cells (E) with or without a combination of 100 μg anti-PD-1 immune checkpoint blockade (F). Tumor volume was calculated using the following formula: (tumor lx tumor w2x0.52), and tracked every 2 days. Isotype only n=8, anti-PD-1 only n=7, PD-1high + isotype n=7, PD-1high + anti-PD-1 n=9. P value was determined by ordinary One-Way ANOVA with a Tukey’s multiple-comparison post-test. (G) Quantification of tumor volume 8 days after PD-1high CAR-T cell injection plus isotype or anti-PD-1 blockade, as well as isotype and anti-PD-1 alone. P value was determined by two-way ANOVA. (H) Quantification of intratumoral CAR-T cells per tumor for mice treated with PD-1high CAR-T cells treated with Isotype (n=3) or anti-PD-1 antibodies (n=4). P value was determined by unpaired, two-sided Student’s t-test.
Because PD-1high CAR-T cells outcompeted PD-1low CAR-T cells in multiple anti-cancer functional assays, we speculated that PD-1high CAR-T cells would show superior cancer control in vivo. However, in contrast to our prediction, hHER2 tumor-bearing mice adoptively transferred with PD-1high hHER2-CAR-T cells did not show an improved tumor regression pattern compared to mice received PD-1low hHER2-CAR-T cell infusion (Figures 5D, E). Similar to various other tumor cell lines, B16 cells dramatically upregulate PD-L1 expression in vivo (50). Therefore, it is possible that PD-1high hHER2-CAR-T cells are more susceptible to PD-L1-mediated immune inhibition within the tumor microenvironment. Indeed, upon combination with an anti-PD-1 blocking antibody, tumor growth was significantly diminished in hHER2 tumor-bearing mice infused with PD-1high hHER2-CAR-T cells, but not with PD-1low hHER2-CAR-T cells (Figures 5D, F, G). Interestingly, PD-1 blockade did not lead to a significant increase in the PD-1high hHER2-CAR-T cell number at the tumor site (Figure 5H), suggesting that the anti-PD-1 blocking antibody augmented the cytotoxic capability of PD-1high hHER2-CAR-T cells in vivo but not the recruitment and/or retention of the T cells at the tumor site.
Our functional analysis of in vitro manufactured CAR-T cells based on their PD-1 expression revealed that the highest PD-1 expressers had enhanced cytotoxic function, with improved abilities to bind target cancer cells and release lytic granules. Despite their subdued migration pattern in vitro, PD-1high CAR-T cells exhibited greater accumulation and retention in melanoma tumors than their PD-1low counterparts in vivo and were more responsive to combination therapy with PD-1-targeting immune checkpoint blockade, helping to drive a potent early anti-tumor response.
In our CAR T cell activation and expansion model, both PD-1high and PD-1low CAR T cells were largely LY108- (a surrogate for TCF1), thus unlikely to be members of the progenitor exhausted T cell population (Figures 1D, E). They also displayed low surface expression of markers for previously identified “transitory” (CX3CR1+) and “dysfunctional” (CD101+) exhausted states that arise during chronic LCMV infection (51), suggesting that CAR-T cells do not fall into known exhausted subsets, despite heightened surface expression of inhibitory receptors such as PD-1, TIM3 and LAG3. Our functional analysis of PD-1high cells shows that these cells produce low levels of IL-2 and TNFα, and remain highly proliferative, highly cytolytic, produce IFNγ, and persist within tumors, suggesting that PD-1high CAR-T cells may be in the early stages of T cell dysfunction, but not fully exhausted (10).
Compared to PD-1low CAR T cells, PD-1high CAR T cells displayed elevated levels of lymph node homing adhesion molecule CD62L, often associated with central memory T cells. They also expressed slightly elevated levels of CXCR5, a chemokine receptor associated with distinct functional capabilities in a variety of disease contexts. Interestingly, superior cell survival and effector functions were reported in CXCR5+ T cells from follicular lymphoma patients (52). PD-1high CAR T cells also expressed elevated levels of the IL-7 receptor, CD127, which is a marker of memory precursor effector cells (MPECs) that can give rise to long-lived memory cells (53, 54). Additionally, our live imaging of T cell - cancer cell interaction (Video 2) strongly suggests that the increased synapse stability is a feature of the dampened motility in PD-1high CAR T cells. In addition to supporting the enhanced killing of target cells, the increased synapse duration in PD-1high CAR T cells may provide extended CAR stimulation, and increase cell survival, as seen in antigen-specific CD8 T cells that become dependent on TCR stimulation (55). Together, all of these are features that may lend to the enhanced survival and persistence of PD-1high CAR T cells shown in our in vivo studies. PD-1high CAR T cells, despite continuous anti-CD3 stimulation and expression of multiple inhibitory receptors, seemingly fall more into the category of traditional memory subsets, or potentially long-lived effector cells, rather than the exhausted lineage.
Memory phenotypes and T cell stemness have been linked with the response in both CD19 CAR-T cell and solid tumor therapies, as this population has been linked with better engraftment in patients and responses against solid tumors (56). However, even if a stem-like phenotype may be optimal for early T cell proliferation and reactivation in vivo, it often cannot be attained in patients with certain cancer types who have been heavily pretreated in the clinic (57). Recent studies suggested important differences in the killing mechanisms of CAR-T cells between solid and liquid cancers; specifically, the IFNγR pathway is critical for solid tumor killing but dispensable for the killing of B-cell cancers (45). It is possible that elimination of solid tumors may require T cells with a unique phenotype that are more highly activated, produces more inflammatory cytokines such as IFNγ and are more efficiently recruited to tumor beds. Interestingly, a recent study using TCR transgenic therapy for pancreatic tumors showed that a responding patient had higher proportions of cells expressing the inhibitory receptors PD-1 and TIM3 and tissue-resident markers than the patient who failed to respond (58), and this cell phenotype has also been strongly linked with early response to immune checkpoint blockades (59). Thus, it is possible that modifying the manufacturing protocol to promote the highly activated CAR-T cell phenotype may be better going forward for solid tumors with immune checkpoint combination therapies depending on the type of tumor being targeted.
Exhausted CAR-T cells have shown anti-tumor functions in vitro but ultimately failed in vivo (60). Many clinical studies highlight that patients given infusion products showing features of T cell exhaustion are overall less likely to respond to T cell immunotherapy (4, 5). Consistent with these results, although our in vitro data showed that PD-1high CAR-T cells outcompeted PD-1low CAR-T cells in multiple anti-cancer functional assays, PD-1high CAR-T cells did not show superior cancer control in vivo (Figure 5). Instead, our data suggest that patients with higher expression levels of inhibitory receptors (particularly PD-1) in their CAR-T cell infusion products are more susceptible to immune inhibition within the tumor microenvironment, thus would be strong candidates for combination therapy with checkpoint inhibitions to drive a stronger overall clinical response (5). In addition, most 2nd generation CAR constructs with CD28 cytoplasmic domain may have the potential to tonically signal and become further exhausted, albeit to various degrees, accompanied by loss of effector functions (61, 62). In contrast, our study used the 3rd generation HER2-CAR construct containing 4-1BB, suggesting this CAR construct does not induce strong tonic signals, thus not driving greater exhaustion programs (62).
The optimal regimens for both immune checkpoint blockade and solid tumor CAR-T therapy are still under active investigation, so the best way to combine these therapies is not yet well understood. Successful clinical response to immune checkpoint blockade has been linked with multiple features, such as IFNγ signatures, PD-1/PD-L1 expression, size and quantity of tumor-associated tertiary lymphoid organs, presence of B cells, and memory T cell phenotypes (59, 63–65). This immune information in individual patients would help define a model where checkpoint blockade may work best when a limited, yet ongoing immune response is already taking place. Based on our results, it is tempting to speculate that the combination of immune checkpoint blockades with a more highly activated CAR-T cell product extends the functionality of the highly activated CAR-T cells and potentially mitigates the negative functions of inhibitory receptors.
The raw data supporting the conclusions of this article will be made available by the authors, without undue reservation.
The studies involving human participants were reviewed and approved by University of Rochester Medical Center Institutional Review Board. The patients/participants provided their written informed consent to participate in this study. The animal study was reviewed and approved by University Committee on Animal Resources at the University of Rochester.
CS and MK designed research. CS, YH, AD, AR, SM performed research. SG provided mouse protocols. PR provided CAR-T cell patient samples. CS and MK analyzed the data and wrote the paper. All authors contributed to the article and approved the submitted version.
National Institutes of Health grant AI102851 (MK). National Institutes of Health grant AI147362 (MK). National Institutes of Health grant T32AI007285 (CS).
We thank Dr. Moonsoo Jin (Weill Cornell) for the anti-HER2 CAR DNA construct and all members of the Kim Laboratory for their comments during the course of these studies and input during preparation of the manuscript. We thank Phil Rock for CAR-T cell patient sample acquisition. We obtained hHER2 tg mice from Genentech.
The authors declare that the research was conducted in the absence of any commercial or financial relationships that could be construed as a potential conflict of interest.
All claims expressed in this article are solely those of the authors and do not necessarily represent those of their affiliated organizations, or those of the publisher, the editors and the reviewers. Any product that may be evaluated in this article, or claim that may be made by its manufacturer, is not guaranteed or endorsed by the publisher.
The Supplementary Material for this article can be found online at: https://www.frontiersin.org/articles/10.3389/fimmu.2023.1187850/full#supplementary-material
1. June CH, O’Connor RS, Kawalekar OU, Ghassemi S, Milone MC. CAR T cell immunotherapy for human cancer. Science (2018) 359:1361–5. doi: 10.1126/science.aar6711
2. Parikh RH, Lonial S. Chimeric antigen receptor T-cell therapy in multiple myeloma: a comprehensive review of current data and implications for clinical practice. CA: A Cancer J Clin (2023) 73:275–85. doi: 10.3322/caac.21771
3. Larson RC, Maus MV. Recent advances and discoveries in the mechanisms and functions of CAR T cells. Nat Rev Cancer (2021) 21:145–61. doi: 10.1038/s41568-020-00323-z
4. Fraietta JA, Lacey SF, Orlando EJ, Pruteanu-Malinici I, Gohil M, Lundh S, et al. Determinants of response and resistance to CD19 chimeric antigen receptor (CAR) T cell therapy of chronic lymphocytic leukemia. Nat Med (2018) 24:563–71. doi: 10.1038/s41591-018-0010-1
5. Deng Q, Han G, Puebla-Osorio N, Ma MCJ, Strati P, Chasen B, et al. Characteristics of anti-CD19 CAR T cell infusion products associated with efficacy and toxicity in patients with large b cell lymphomas. Nat Med (2020) 26:1878–87. doi: 10.1038/s41591-020-1061-7
6. Finney OC, Brakke H, Rawlings-Rhea S, Hicks R, Doolittle D, Lopez M, et al. CD19 CAR T cell product and disease attributes predict leukemia remission durability. J Clin Invest (2019) 129:2123–32. doi: 10.1172/JCI125423
7. Rossetti R, Brand H, Lima SCG, Furtado IP, Silveira RM, Fantacini DMC, et al. Combination of genetically engineered T cells and immune checkpoint blockade for the treatment of cancer. Immunother Adv (2022) 2:1–14. doi: 10.1093/immadv/ltac005
8. Okazaki T, Honjo T. PD-1 and PD-1 ligands: from discovery to clinical application. Int Immunol (2007) 19:813–24. doi: 10.1093/intimm/dxm057
9. Wherry EJ, Ha S-J, Kaech SM, Haining WN, Sarkar S, Kalia V, et al. Molecular signature of CD8+ T cell exhaustion during chronic viral infection. Immunity (2007) 27:670–84. doi: 10.1016/j.immuni.2007.09.006
11. Sharpe AH, Pauken KE. The diverse functions of the PD1 inhibitory pathway. Nat Rev Immunol (2018) 18:153–67. doi: 10.1038/nri.2017.108
12. Patsoukis N, Wang Q, Strauss L, Boussiotis VA. Revisiting the PD-1 pathway. Sci Adv (2020) 6:eabd2712. doi: 10.1126/sciadv.abd2712
13. Bengsch B, Johnson AL, Kurachi M, Odorizzi PM, Pauken KE, Attanasio J, et al. Bioenergetic insufficiencies due to metabolic alterations regulated by the inhibitory receptor PD-1 are an early driver of CD8+ T cell exhaustion. Immunity (2016) 45:358–73. doi: 10.1016/j.immuni.2016.07.008
14. Chamoto K, Chowdhury PS, Kumar A, Sonomura K, Matsuda F, Fagarasan S, et al. Mitochondrial activation chemicals synergize with surface receptor PD-1 blockade for T cell-dependent antitumor activity. Proc Natl Acad Sci U.S.A. (2017) 114:E761–e770. doi: 10.1073/pnas.1620433114
15. Yu Y-R, Imrichova H, Wang H, Chao T, Xiao Z, Gao M, et al. Disturbed mitochondrial dynamics in CD8+ TILs reinforce T cell exhaustion. Nat Immunol (2020) 21:1540–51. doi: 10.1038/s41590-020-0793-3
16. Peng W, Liu C, Xu C, Lou Y, Chen J, Yang Y, et al. PD-1 blockade enhances T-cell migration to tumors by elevating IFN-γ inducible chemokines. Cancer Res (2012) 72:5209–18. doi: 10.1158/0008-5472.CAN-12-1187
17. Zinselmeyer BH, Heydari S, Sacristán C, Nayak D, Cammer M, Herz J, et al. PD-1 promotes immune exhaustion by inducing antiviral T cell motility paralysis. J Exp Med (2013) 210:757–74. doi: 10.1084/jem.20121416
18. Brunner-Weinzierl MC, Rudd CE. CTLA-4 and PD-1 control of T-cell motility and migration: implications for tumor immunotherapy. Front Immunol (2018) 9:2737. doi: 10.3389/fimmu.2018.02737
19. Fife BT, Pauken KE, Eagar TN, Obu T, Wu J, Tang Q, et al. Interactions between PD-1 and PD-L1 promote tolerance by blocking the TCR–induced stop signal. Nat Immunol (2009) 10:1185–92. doi: 10.1038/ni.1790
20. Ambler R, Edmunds GL, Tan SL, Cirillo S, Pernes JI, Ruan X, et al. PD-1 suppresses the maintenance of cell couples between cytotoxic T cells and target tumor cells within the tumor. Sci Signal (2020) 13:eaau4518. doi: 10.1126/scisignal.aau4518
21. Wei F, Zhong S, Ma Z, Kong H, Medvec A, Ahmed R, et al. Strength of PD-1 signaling differentially affects T-cell effector functions. Proc Natl Acad Sci U.S.A. (2013) 110:E2480–9. doi: 10.1073/pnas.1305394110
22. Tang OY, Tian L, Yoder T, Xu R, Kulikovskaya I, Gupta M, et al. PD1 expression in EGFRvIII-directed CAR T cell infusion product for glioblastoma is associated with clinical response. Front Immunol (2022) 13. doi: 10.3389/fimmu.2022.872756
23. Wei J, Luo C, Wang Y, Guo Y, Dai H, Tong C, et al. PD-1 silencing impairs the anti-tumor function of chimeric antigen receptor modified T cells by inhibiting proliferation activity. J ImmunoTher Cancer (2019) 7:209. doi: 10.1186/s40425-019-0685-y
24. Stadtmauer EA, Fraietta JA, Davis MM, Cohen AD, Weber KL, Lancaster E, et al. CRISPR-engineered T cells in patients with refractory cancer. Science (2020) 367:eaba7365. doi: 10.1126/science.aba7365
25. Pauken KE, Godec J, Odorizzi PM, Brown KE, Yates KB, Ngiow SF, et al. The PD-1 pathway regulates development and function of memory CD8(+) T cells following respiratory viral infection. Cell Rep (2020) 31:107827. doi: 10.1016/j.celrep.2020.107827
26. John LB, Devaud C, Duong CPM, Yong CS, Beavis PA, Haynes NM, et al. Anti-PD-1 antibody therapy potently enhances the eradication of established tumors by gene-modified T cells. Clin Cancer Res (2013) 19:5636–46. doi: 10.1158/1078-0432.CCR-13-0458
27. Cherkassky L, Morello A, Villena-Vargas J, Feng Y, Dimitrov DS, Jones DR, et al. Human CAR T cells with cell-intrinsic PD-1 checkpoint blockade resist tumor-mediated inhibition. J Clin Invest (2016) 126:3130–44. doi: 10.1172/JCI83092
28. Chong EA, Melenhorst JJ, Lacey SF, Ambrose DE, Gonzalez V, Levine BL, et al. PD-1 blockade modulates chimeric antigen receptor (CAR)-modified T cells: refueling the CAR. Blood (2017) 129:1039–41. doi: 10.1182/blood-2016-09-738245
29. Hill BT, Roberts ZJ, Xue A, Rossi JM, Smith MR. Rapid tumor regression from PD-1 inhibition after anti-CD19 chimeric antigen receptor T-cell therapy in refractory diffuse large b-cell lymphoma. Bone Marrow Transplant (2020) 55:1184–7. doi: 10.1038/s41409-019-0657-3
30. McGowan E, Lin Q, Ma G, Yin H, Chen S, Lin Y. PD-1 disrupted CAR-T cells in the treatment of solid tumors: promises and challenges. Biomed Pharmacother (2020) 121:109625. doi: 10.1016/j.biopha.2019.109625
31. Song W, Zhang M. Use of CAR-T cell therapy, PD-1 blockade, and their combination for the treatment of hematological malignancies. Clin Immunol (2020) 214:108382. doi: 10.1016/j.clim.2020.108382
32. Finkle D, Quan ZR, Asghari V, Kloss J, Ghaboosi N, Mai E, et al. HER2-targeted therapy reduces incidence and progression of midlife mammary tumors in female murine mammary tumor virus huHER2-transgenic mice. Clin Cancer Res (2004) 10:2499–511. doi: 10.1158/1078-0432.CCR-03-0448
33. Morgan RA, Yang JC, Kitano M, Dudley ME, Laurencot CM, Rosenberg SA. Case report of a serious adverse event following the administration of T cells transduced with a chimeric antigen receptor recognizing ERBB2. Mol Ther (2010) 18:843–51. doi: 10.1038/mt.2010.24
34. Budimir N, Thomas GD, Dolina JS, Salek-Ardakani S. Reversing T-cell exhaustion in cancer: lessons learned from PD-1/PD-L1 immune checkpoint blockade. Cancer Immunol Res (2022) 10:146–53. doi: 10.1158/2326-6066.CIR-21-0515
35. Watanabe N, Mo F, McKenna MK. Impact of manufacturing procedures on CAR T cell functionality. Front Immunol (2022) 13:876339. doi: 10.3389/fimmu.2022.876339
36. Vormittag P, Gunn R, Ghorashian S, Veraitch FS. A guide to manufacturing CAR T cell therapies. Curr Opin Biotechnol (2018) 53:164–81. doi: 10.1016/j.copbio.2018.01.025
37. Belk JA, Yao W, Ly N, Freitas KA, Chen Y-T, Shi Q, et al. Genome-wide CRISPR screens of T cell exhaustion identify chromatin remodeling factors that limit T cell persistence. Cancer Cell (2022) 40:768–786.e7. doi: 10.1016/j.ccell.2022.06.001
38. Vardhana SA, Hwee MA, Berisa M, Wells DK, Yost KE, King B, et al. Impaired mitochondrial oxidative phosphorylation limits the self-renewal of T cells exposed to persistent antigen. Nat Immunol (2020) 21:1022–33. doi: 10.1038/s41590-020-0725-2
39. Beltra JC, Manne S, Abdel-Hakeem MS, Kurachi M, Giles JR, Chen Z, et al. Developmental relationships of four exhausted CD8(+) T cell subsets reveals underlying transcriptional and epigenetic landscape control mechanisms. Immunity (2020) 52:825–841 e8. doi: 10.1016/j.immuni.2020.04.014
40. Jubel JM, Barbati ZR, Burger C, Wirtz DC, Schildberg FA. The role of PD-1 in acute and chronic infection. Front Immunol (2020) 11:487. doi: 10.3389/fimmu.2020.00487
41. You R, Artichoker J, Fries A, Edwards AW, Combes AJ, Reeder GC, et al. Active surveillance characterizes human intratumoral T cell exhaustion. J Clin Invest (2021) 131:e144353. doi: 10.1172/JCI144353
42. Cremasco F, Menietti E, Speziale D, Sam J, Sammicheli S, Richard M, et al. Cross-linking of T cell to b cell lymphoma by the T cell bispecific antibody CD20-TCB induces IFNγ/CXCL10-dependent peripheral T cell recruitment in humanized murine model. PloS One (2021) 16:e0241091. doi: 10.1371/journal.pone.0241091
43. Li J, Ybarra R, Mak J, Herault A, De Almeida P, Arrazate A, et al. IFNγ-induced chemokines are required for CXCR3-mediated T-cell recruitment and antitumor efficacy of anti-HER2/CD3 bispecific antibody. Clin Cancer Res (2018) 24:6447–58. doi: 10.1158/1078-0432.CCR-18-1139
44. Kantari-Mimoun C, Barrin S, Vimeux L, Haghiri S, Gervais C, Joaquina S, et al. CAR T-cell entry into tumor islets is a two-step process dependent on IFNgamma and ICAM-1. Cancer Immunol Res (2021) 9:1425–38. doi: 10.1158/2326-6066.CIR-20-0837
45. Larson RC, Kann MC, Bailey SR, Haradhvala NJ, Llopis PM, Bouffard AA, et al. CAR T cell killing requires the IFNgammaR pathway in solid but not liquid tumours. Nature (2022) 604:563–70. doi: 10.1038/s41586-022-04585-5
46. Paley MA, Kroy DC, Odorizzi PM, Johnnidis JB, Dolfi DV, Barnett BE, et al. Progenitor and terminal subsets of CD8+ T cells cooperate to contain chronic viral infection. Science (2012) 338:1220–5. doi: 10.1126/science.1229620
47. Klement JD, Redd PS, Lu C, Merting AD, Poschel DB, Yang D, et al. Tumor PD-L1 engages myeloid PD-1 to suppress type I interferon to impair cytotoxic T lymphocyte recruitment. Cancer Cell (2023) 41:620–636 e9. doi: 10.1016/j.ccell.2023.02.005
48. Dong E, Yue XZ, Shui L, Liu BR, Li QQ, Yang Y, et al. IFN-gamma surmounts PD-L1/PD1 inhibition to CAR-T cell therapy by upregulating ICAM-1 on tumor cells. Signal Transduct Target Ther (2021) 6:20. doi: 10.1038/s41392-020-00357-7
49. Globerson-Levin A, Waks T, Eshhar Z. Elimination of progressive mammary cancer by repeated administrations of chimeric antigen receptor-modified T cells. Mol Ther (2014) 22:1029–38. doi: 10.1038/mt.2014.28
50. Iwai Y, Terawaki S, Honjo T. PD-1 blockade inhibits hematogenous spread of poorly immunogenic tumor cells by enhanced recruitment of effector T cells. Int Immunol (2005) 17:133–44. doi: 10.1093/intimm/dxh194
51. Hudson WH, Gensheimer J, Hashimoto M, Wieland A, Valanparambil RM, Li P, et al. Proliferating transitory T cells with an effector-like transcriptional signature emerge from PD-1+ stem-like CD8+ T cells during chronic infection. Immunity (2019) 51:1043–1058.e4. doi: 10.1016/j.immuni.2019.11.002
52. Chu F, Li HS, Liu X, Cao J, Ma W, Ma Y, et al. CXCR5+CD8+ T cells are a distinct functional subset with an antitumor activity. Leukemia (2019) 33:2640–53. doi: 10.1038/s41375-019-0464-2
53. Herndler-Brandstetter D, Ishigame H, Shinnakasu R, Plajer V, Stecher C, Zhao J, et al. KLRG1(+) effector CD8(+) T cells lose KLRG1, differentiate into all memory T cell lineages, and convey enhanced protective immunity. Immunity (2018) 48:716–729.e8. doi: 10.1016/j.immuni.2018.03.015
54. Renkema KR, Huggins MA, Borges da Silva H, Knutson TP, Henzler CM, Hamilton SE. KLRG1(+) memory CD8 T cells combine properties of short-lived effectors and long-lived memory. J Immunol (2020) 205:1059–69. doi: 10.4049/jimmunol.1901512
55. Wherry EJ, Kurachi M. Molecular and cellular insights into T cell exhaustion. Nat Rev Immunol (2015) 15:486–99. doi: 10.1038/nri3862
56. Krishna S, Lowery FJ, Copeland AR, Bahadiroglu E, Mukherjee R, Jia L, et al. Stem-like CD8 T cells mediate response of adoptive cell immunotherapy against human cancer. Science (2020) 370:1328–34. doi: 10.1126/science.abb9847
57. Arcangeli S, Falcone L, Camisa B, De Girardi F, Biondi M, Giglio F, et al. Next-generation manufacturing protocols enriching TSCM CAR T cells can overcome disease-specific T cell defects in cancer patients. Front Immunol (2020) 11. doi: 10.3389/fimmu.2020.01217
58. Leidner R, Sanjuan Silva N, Huang H, Sprott D, Zheng C, Shih Y-P, et al. Neoantigen T-cell receptor gene therapy in pancreatic cancer. New Engl J Med (2022) 386:2112–9. doi: 10.1056/NEJMoa2119662
59. Luoma AM, Suo S, Wang Y, Gunasti L, Porter CBM, Nabilsi N, et al. Tissue-resident memory and circulating T cells are early responders to pre-surgical cancer immunotherapy. Cell (2022) 185:2918–2935.e29. doi: 10.1016/j.cell.2022.06.018
60. Gargett T, Yu W, Dotti G, Yvon ES, Christo SN, Hayball JD, et al. GD2-specific CAR T cells undergo potent activation and deletion following antigen encounter but can be protected from activation-induced cell death by PD-1 blockade. Mol Ther (2016) 24:1135–49. doi: 10.1038/mt.2016.63
61. Chen J, Qiu S, Li W, Wang K, Zhang Y, Yang H, et al. Tuning charge density of chimeric antigen receptor optimizes tonic signaling and CAR-T cell fitness. Cell Res (2023) 33:341–54. doi: 10.1038/s41422-023-00789-0
62. Long AH, Haso WM, Shern JF, Wanhainen KM, Murgai M, Ingaramo M, et al. 4-1BB costimulation ameliorates T cell exhaustion induced by tonic signaling of chimeric antigen receptors. Nat Med (2015) 21:581–90. doi: 10.1038/nm.3838
63. Reijers ILM, Dimitriadis P, Rozeman EA, Krijgsman O, Cornelissen S, Bosch LJW, et al. The interferon-gamma (IFN-y) signature from baseline tumor material predicts pathologic response after neoadjuvant ipilimumab (IPI) + nivolumab (NIVO) in stage III melanoma. J Clin Oncol (2022) 40:9539–9. doi: 10.1200/JCO.2022.40.16_suppl.9539
64. Ayers M, Lunceford J, Nebozhyn M, Murphy E, Loboda A, Kaufman DR, et al. IFN-γ-related mRNA profile predicts clinical response to PD-1 blockade. J Clin Invest (2017) 127:2930–40. doi: 10.1172/jci91190
Keywords: car-t, PD-1, immune checkpoint blockade, T cell migration, cancer immune cell therapy
Citation: Sailer CJ, Hong Y, Dahal A, Ryan AT, Mir S, Gerber SA, Reagan PM and Kim M (2023) PD-1Hi CAR-T cells provide superior protection against solid tumors. Front. Immunol. 14:1187850. doi: 10.3389/fimmu.2023.1187850
Received: 16 March 2023; Accepted: 30 May 2023;
Published: 14 June 2023.
Edited by:
MIchael E. Hurwitz, Yale University, United StatesReviewed by:
Mario Perro, Roche, SwitzerlandCopyright © 2023 Sailer, Hong, Dahal, Ryan, Mir, Gerber, Reagan and Kim. This is an open-access article distributed under the terms of the Creative Commons Attribution License (CC BY). The use, distribution or reproduction in other forums is permitted, provided the original author(s) and the copyright owner(s) are credited and that the original publication in this journal is cited, in accordance with accepted academic practice. No use, distribution or reproduction is permitted which does not comply with these terms.
*Correspondence: Minsoo Kim, bWluc29vX2tpbUB1cm1jLnJvY2hlc3Rlci5lZHU=
Disclaimer: All claims expressed in this article are solely those of the authors and do not necessarily represent those of their affiliated organizations, or those of the publisher, the editors and the reviewers. Any product that may be evaluated in this article or claim that may be made by its manufacturer is not guaranteed or endorsed by the publisher.
Research integrity at Frontiers
Learn more about the work of our research integrity team to safeguard the quality of each article we publish.