 Ori Scott1,2,3
 Shagana Visuvanathan2
 Emily Reddy4Deeqa Mahamed4
 Bin Gu5,6
 Chaim M. Roifman1,7
 Ronald D. Cohn2,3,8†
 Cynthia J. Guidos4,9*†Evgueni A. Ivakine10*†
- 1Division of Immunology and Allergy, Department of Paediatrics, Hospital for Sick Children and University of Toronto, Toronto, ON, Canada
- 2Program for Genetics & Genome Biology, Hospital for Sick Children Research Institute, Toronto, ON, Canada
- 3Institute of Medical Science, University of Toronto, Toronto, ON, Canada
- 4Program in Developmental and Stem Cell Biology, The Hospital for Sick Children, Toronto, ON, Canada
- 5Department of Obstetrics, Gynecology and Reproductive Biology, Michigan State University, East Lansing, MI, United States
- 6Institute for Quantitative Health Science and Engineering, Michigan State University, East Lansing, MI, United States
- 7The Canadian Centre for Primary Immunodeficiency and The Jeffrey Modell Research Laboratory for the diagnosis of Primary Immunodeficiency, The Hospital for Sick Children, Toronto, ON, Canada
- 8Division of Clinical & Metabolic Genetics, Department of Paediatrics, Hospital for Sick Children and University of Toronto, Toronto, ON, Canada
- 9Department of Immunology, University of Toronto, Toronto, ON, Canada
- 10Department of Physiology, University of Toronto, Toronto, ON, Canada
Introduction: Humans with gain-of-function (GOF) mutations in STAT1 (Signal Transducer and Activator of Transcription 1), a potent immune regulator, experience frequent infections. About one-third, especially those with DNA-binding domain (DBD) mutations such as T385M, also develop autoimmunity, sometimes accompanied by increases in T-helper 1 (Th1) and T-follicular helper (Tfh) CD4 effector T cells, resembling those that differentiate following infection-induced STAT1 signaling. However, environmental and molecular mechanisms contributing to autoimmunity in STAT1 GOF patients are not defined.
Methods: We generated Stat1T385M/+ mutant mice to model the immune impacts of STAT1 DBD GOF under specific-pathogen free (SPF) conditions.
Results: Stat1T385M/+ lymphocytes had more total Stat1 at baseline and also higher amounts of IFNg-induced pStat1. Young mutants exhibited expansion of Tfh-like cells, while older mutants developed autoimmunity accompanied by increased Tfh-like cells, B cell activation and germinal center (GC) formation. Mutant females exhibited these immune changes sooner and more robustly than males, identifying significant sex effects of Stat1T385M-induced immune dysregulation. Single cell RNA-Seq (scRNA-Seq) analysis revealed that Stat1T385M activated transcription of GC-associated programs in both B and T cells. However, it had the strongest transcriptional impact on T cells, promoting aberrant CD4 T cell activation and imparting both Tfh-like and Th1-like effector programs.
Discussion: Collectively, these data demonstrate that in the absence of overt infection, Stat1T385M disrupted naïve CD4 T cell homeostasis and promoted expansion and differentiation of abnormal Tfh/Th1-like helper and GC-like B cells, eventually leading to sex-biased autoimmunity, suggesting a model for STAT1 GOF-induced immune dysregulation and autoimmune sequelae in humans.
1 Introduction
Humans with gain-of-function (GOF) mutations in Signal Transducer and Activator of Transcription (STAT)1 exhibit widespread immune dysregulation. The major function of this STAT family transcription factor is to mediate the biological effects of pro-inflammatory cytokines, such as interferons (IFN), and to a lesser extent interleukin 6 (IL-6), which are produced when certain cells sense microbial products (1, 2). Although transcriptional complexes containing unphosphorylated STAT1 can mediate baseline expression of IFN-stimulated genes (ISG) (3–6), canonical infection-induced STAT1-mediated ISG expression involves a phosphorylation cascade following IFN receptor ligation. Type I IFNα/β cytokines activate Janus kinases (JAK) to phosphorylate STAT1 and STAT2, promoting their dimerization to induce transcription of genes that limit viral replication, enhance CD8 T cell cytotoxic effector function, and induce CD4 T cells to provide B cell help (7). IFNγ (Type II IFN) induces pSTAT1 homodimers to activate macrophage/monocytes and dendritic cell pro-inflammatory functions, enhance antigen presentation and secretion of cytokines that promote differentiation of Th1 cells from naïve CD4 T cells (8). IL6 activates STAT1 and STAT3 to to promote differentiation of naïve CD4 cells into Tfh cells, important mediators of humoral immunity (9). In contrast, IL6 stimulation of activated CD4 cells induces only STAT3, driving differentiation of Th17 cells that orchestrate the immune response to extra-cellular fungi (10, 11). Interestingly, STAT family members often cross-inhibit each other, and the hallmark clinical manifestation of STAT1 GOF is chronic mucocutaneous candidiasis (CMC), resulting from impaired Th17 differentiation due to partial STAT3 loss of function (12). STAT1 GOF patients frequently experience other severe invasive/opportunistic infections, and one third also develop autoimmune disease (13, 14). However, the underlying molecular and cellular mechanisms of autoimmunity in STAT1 GOF patients are unknown.
STAT1 GOF has been linked to dominant mutations in all STAT1 domains, but most patients have mutations in the coiled-coil domain, essential for protein-protein interactions, or in the DBD, which orchestrates nuclear migration and DNA binding (13, 15, 16). Cells from STAT1 GOF patients typically show elevated pSTAT1 (Tyr701) levels after stimulation with IFNs (15), suggesting that autoimmunity could be linked to IFN hyper-responsiveness. In patients with STAT1 DBD mutations, the most common of which is T385M (13, 17–19), STAT1 nuclear accumulation can also occur without IFN stimulation, suggesting a constitutive role for unphosphorylated STAT1 in the pathogenesis of these mutations (20). We recently showed that individuals with DBD mutations had a higher prevalence of autoimmunity compared with other STAT1 GOF patients, including endocrinopathies, autoimmune gastrointestinal disease (enteropathy or hepatitis), autoimmune cytopenia’s and interstitial lung disease (21). However, these patients also had a high rate of invasive and opportunistic infections that typically preceded autoimmunity. Thus, it is unclear whether abnormal responses to pathogenic microbes promote autoimmunity in STAT1 GOF patients with T385M and other DBD mutations. Many autoimmune disorders are more prevalent in females due to a variety of IFN-dependent and -independent mechanisms (22), so sex may also modulate autoimmunity in STAT1 GOF these patients. However, sex effects on autoimmunity have not been studied in these patients.
In addition to compromising Th17 differentiation, STAT1 GOF may also promote the differentiation of effector CD4 lineages linked to autoimmunity. T cell receptor (TCR) signals plus IFNγ-induced pSTAT1 upregulate Tbet, the regulator of Type I cytotoxic responses (23), driving differentiation of Th1 cells, implicated in inflammatory bowel disease (24) and rheumatoid arthritis (25). Th1 cells are increased in many (26, 27) yet not all (28, 29) STAT1 GOF patients. TCR signals plus IL6-induced pSTAT1 and pSTAT3 regulate early differentiation of Tfh cells, implicated in SLE and Type 1 diabetes (T1D) (30–32). Tfh cell differentiation and function is regulated by inducible T cell co-stimulator (ICOS), programmed death 1 (PD1; Pdcd1) and the transcriptional repressor Bcl6 (31). The transcription factors Tcf1 (Tcf7) and Lef1 also support Tfh differentiation (33), while restraining expression of co-inhibitory receptors such as Ctla4 and Lag3 (30, 33–35). Circulating Tfh-like cells (cTfh) are also increased in some STAT1 GOF patients (27, 28, 36). Foxp3+ T-regulatory (Treg) cells are another key subset in autoimmunity (37, 38) that range from low-normal in STAT1 GOF patients (18, 28, 29, 36, 39, 40). Thus, CD4 effector and regulatory subsets are variably affected in STAT1 GOF patients, however it remains unclear if this variability reflects specific STAT1 GOF mutation impacts and/or environmental influences such as infections or immunosuppressive treatments.
Here, we generated a mouse model to identify potential cellular, molecular and environmental mechanisms linked to autoimmunity in STAT1 GOF patients with the DBD T385M mutation. To limit the environmental impact of infection with pathogens, we studied Stat1T385M/+ mice raised in a specific-pathogen-free (SPF) facility. Stat1T385M/+ lymphocytes had more total Stat1 at baseline and also higher amounts of IFNγ-induced pStat1. By 15-20 weeks of age, Stat1T385M/+ mice exhibited excessive splenic GC formation and multiple autoimmune manifestations compared to their co-housed wild-type (WT) littermates. High parameter immune profiling identified early and sustained expansions of splenic “memory phenotype” (MP) CD4 cells with Tfh-like features, as well as increases in activated B cells. scRNA-Seq analysis suggested that Stat1T385M activated transcription of GC-associated programs in both B and T cells, promoted aberrant activation of naïve CD4 cells and induced their differentiation into hybrid Tfh/Th1-like effector cells. Collectively, these data demonstrate that in the absence of overt infection, Stat1T385M induced aberrant B cell activation, disrupted CD4 T cell homeostasis and promoted differentiation of abnormal T helper cells, eventually leading to autoimmunity, with both processes occurring sooner and more robustly in females.
2 Materials and Methods
Supplementary Tables 1–3 list key reagents and resources used in this study, sequences of the oligonucleotides, primers and repair templates used.
Supplementary Table 2 lists vendors and catalogue numbers for key reagents and antibodies used.
Supplementary Table 3 lists genes included in the BD Rhapsody™ Mouse Immune Response Targeted Panel.
2.1 Mouse husbandry
Mice were kept in a specific-pathogen free (SPF) facility (Toronto Centre for Phenogenomics; TCP) on a 12-hour light/dark cycle and provided with food and water ad-libitum. CD1 mice from Charles River (strain code: 022) and C57Bl/6J mice from JAX (strain code 000664) and TCP in-house breeding were used in this study. Mice of both sexes were used; mutants and WT littermates of the same sex were co-housed. Mouse procedures were carried out in compliance with the Animal for Research Act of Ontario and Guidelines of the Canadian Council on Animal Care. All procedures were reviewed and approved by the TCP Animal Care Committee, animal use protocol 25-0379H.
2.2 Generation of stat1t385m/+ mice
A single guide RNA (sgRNA; Synthego) was used to target a protospacer adjacent motif within mouse Stat1 exon 14. A homology-directed repair (HDR) construct (Integrated DNA Technologies) included the human STAT1 exon 14 with containing the T385M mutation (C>T). The cassette was amplified using 5’-biotinylated primers to generate a repair template. Super-ovulated CD1 females were bred to C57Bl/6J male. Following the two-cell homologous recombination CRISPR approach (41), two-cell embryos collected at 1.5 days post-coitus were microinjected with sgRNA (50ng/μL), Cas9 conjugated with monomeric streptavidin (75ng/μL) and biotinylated repair template (20ng/μL). One day later, embryos were transferred into the oviducts of 0.5-post coitus days pseudo-pregnant CD1 females. Pups were genotyped as described below. After breeding back to C57Bl6/J, verification of congenic status was performed via 384-SNP background analysis (Mini Mouse Universal Genotyping Array, Transnetyx). Supplementary Table 1 lists sequences of the oligonucleotides, primers and repair templates used.
2.3 Nucleic acid isolation, PCR, Sanger and whole genome sequencing
Genotyping of founder mice, as well as determination of correct splicing, were done via a combination of Sanger sequencing, quantitative real-time PCR (qRT-PCR) and whole genome sequencing (WSG). Founder mice underwent genomic DNA isolation followed by PCR amplification and Sanger sequencing. Samples were sequenced on Applied Biosystems SeqStudio Genetic Analyzer (Thermo Fisher). Sequencing files were analyzed using SnapGene version 5.0.8 (Insightful Science; available at snapgene.com). For splicing evaluation, RNA was extracted and reverse-transcribed, followed by qRT-PCR evaluating expression of Stat1 transcript using QuantStudio Real-Time PCR system (Thermo Fisher). For WGS, DNA samples were extracted as described above and underwent sequencing using the Illumina NovaSeq 6000 system performed by The Centre for Applied Genomics (TCAG) at the Hospital for Sick Children. Analysis was done using Integrative Genomics Viewer (IGV) version 2.9.4 with GRCm38/mm10 as the reference genome. Routine genotyping was done via Sanger sequencing as described above.
2.4 Immunoblotting for Stat1 and pStat1
Single cell suspensions of splenocytes from 6–12 week-old mice were treated with PBS or murine recombinant IFNγ (100ng/mL) for 30 minutes at 37°CC. To assess Stat1 de-phosphorylation kinetics, splenocytes were IFNγ stimulated for 30 minutes, washed in PBS and transferred to IFNγ-free media. They were then lysed immediately (0 minutes), or cultured for an additional 60 minutes or 120 minutes in IFNγ-free media at 37°C. Cells were lysed in RIPA buffer supplemented with protease and phosphatase inhibitors. Protein lysates (10μg protein/sample) were loaded onto and separated by pre-cast polyacrylamide (4-12% Bis-Tris) gels, and then transferred to a nitrocellulose membrane using iBlot 2 Dry Blotting System (Thermo Fisher). Membranes were blocked for 1 hour at room temperature in Tris-Buffered Saline containing 5% bovine serum albumin prior to incubating overnight with anti-pSTAT1 (pY701) or anti-STAT1 plus anti-β-actin. The following day, membranes were incubated AlexaFluor-647-labelled secondary antibodies. Membranes were imaged using ChemiDoc MP imaging system (Bio-Rad) and analyzed with Image Lab software version 6.0.1 (Bio-Rad). For assessment of pStat1 phosphorylation and de-phosphorylation kinetics, pStat1 normalized to β-actin at the time of IFNγ withdrawal (0 minutes) was designated as the baseline (100%), which was compared to normalized pStat1 levels 60 and 120 minutes after withdrawal of IFNγ. Supplementary Table 2 lists vendors and catalogue numbers for key reagents and antibodies used.
2.5 Measurement of serum immunoglobulin isotypes and liver panel
Sera collected from 20 week-old mice were sent to Eve Technologies (Calgary, AB) for immunoglobulin isotyping, using the Custom Mouse Immunoglobulin Isotyping 6-Plex Luminex panel (IgA, IgM, IgG1, IgG2a, IgG2b, IgG3). Liver enzymes and function, including alanine aminotransferase (ALT), aspartate aminotransferase (AST), alkaline phosphatase (ALP) and albumin were assessed in sera from 20 week-old mice by the TCP pathology core.
2.6 Histology and ANA detection
Pancreata collected from mice at 15-20 weeks and 49-52 weeks of age were fixed in 10% neutral-buffered formalin, sectioned, stained with hematoxylin and eosin (H&E) using standard techniques. To assess splenic architecture, spleen cryosections from 15–20 week-old mice (6 mice per genotype) were stained with H&E or with a panel consisting of GL7-FITC, CD21-TRITC, Cy5-B220 and DAPI as a nuclear counterstain. Slides were scanned using Olympus VS-120 microscope and images were analyzed using OlyVIA version 2.4 and ImageJ version 2.1.0/1.53c. These procedures were performed by the TCP pathology core. Mouse sera collected at 6-9 weeks and 15-20 weeks were screened at 1/40 for ANA using via indirect immunofluorescence on Hep-2 cells, according to the manufacturer’s (Bio-Rad) protocol.
2.7 Flow and mass cytometric immune profiling
Spleen and mLN were processed into single-cell suspensions. After washing with 1 mL staining media (SM: PBS+ 1% BSA), 1-2x10⁶ cells/sample were Fc-receptor blocked in SM at RT for 15’ prior to staining for mass or flow cytometry. For mass cytometry, cells were then stained with a 50μL cocktail of metal-tagged antibodies (Supplementary Table 2), washed and stained with 1 μM natural abundance Cisplatin as previously described (42). Samples were then barcoded using the Cell-ID 20-Plex PD Barcoding Kit (Fluidigm) following the manufacturer’s instructions prior to pooling up to 20 samples/tube and staining of nuclear DNA with 191/193Iridium. Final washes, addition 4-element EQ normalization beads and Helios acquisition were then performed as previously described (42). Helios software (v7.0.8493) was used to generate and normalize FCS 3.0 datafiles that were uploaded to CytoBank (Beckman Coulter Enterprise version) to perform sample-specific barcode stringency filtering as described (43). Additional gating removed debris, dead cells and doublets, before gating specific populations (Figure S2). For flow cytometry, cells were stained with 50μL of a T cell or B cell antibody cocktail (Supplementary Table 2) in SM (RT, 30’). After 2 PBS washes, T cell panel samples were stained with a fixable viability dye, fixed, permeabilized, and stained with anti-FoxP3 in 50μL (RT, 30’). Cells were washed, resuspended in SM and run on a 5-laser LSRFortessa analyzer running FACS-DIVA v8.0.1 (BD Biosciences). Exported FCS 3.0 files were uploaded to CytoBank, where data were compensated and pre-gated to remove debris, dead cells and doublets, prior to population gating (Figure S3).
2.8 Targeted scRNA-Seq analysis of immune gene expression
Single cell mouse splenocyte suspensions from 15 week-old female mice (3 per genotype) were stained with multiplexing antibodies, pooled, and stained with oligonucleotide-barcoded “AbSeq” antibodies. Single cells were paired with barcoded beads in a microwell cartridge using the BD Biosciences Rhapsody Express Single Cell Analysis System and Scanner, which documented retrieval of 36,059 beads with cells (8.3% multiplets). In-well single cell lysis allowed capture of RNA and AbSeq reagents bound to cells by barcoded beads prior to synthesizing cDNA and removing genomic DNA following the manufacturer’s instructions. These procedures were performed by SickKids’ Center for Advanced Single Cell Analysis (CASCA). Preparation of cDNA and AbSeq libraries followed by paired-end sequencing in an Illumina SP Nova-Seq flow cell (2x100 bp) was carried out by The Center for Genomic Analysis at the SickKids’ Research Institute.
After uploading the Fastq sequence files and Fasta mRNA+ AbSeq reference files, the SevenBridges BD Targeted Multiplex Rhapsody Analysis Pipeline (v1.10) was used to filter by read-quality prior to aligning, annotating and combining R1+R2 reads. The pipeline annotated molecules, identified putative cells and originating samples for each molecule, and output files containing expression matrices and sequencing quality metrics, yielding 6.33x10⁸ aligned mRNA reads assigned to 21,583 cells (mean=29,343 RSEC-adjusted molecule counts/cell). The RSEC_MolsperCell.csv file was uploaded to BD’s SeqGeq v1.8 where all additional analyses were performed. Briefly, data were normalized (counts/10,000 reads) and cells with low gene expression gated-out (0.4%). Of 397 mouse immune response genes analyzed (Supplementary Table 3), 378 were expressed at ≥100 molecules/cell in ≥ 10 cells.
Sample de-multiplixing was performed using the Lex_BDSMK Plugin (v. 0.6.0) to yield 2,810-3,734 cells/sample. Boolean “Or” gating was then used to combine samples by genotype for gating specific populations based on surface protein expression detected by AbSeq (Figure S4). The Seurat v.4.0.4 plugin was also used to perform unsupervised dimensionality reduction (uniform manifold approximation and projection, UMAP), multimodal (mRNA and AbSeq) clustering and identifying clusters with differentially expressed genes (mRNA) and/or proteins (AbSeq) (44). Differentially-expressed genes (DEG) between samples grouped by genotype for each population were identified using Volcano plots of fold change (FC) difference vs the negative logarithm of false-discovery rate (FDR)-adjusted q-value. The threshold for differential expression was ≥40% FC (corresponding to +/- 0.49 Log2 FC) with FDR-adjusted q-value <0.05.
The MyGeneSet tool from the Immunological Genome Project data-browser (http://rstats.immgen.org/MyGeneSet_New/index.html (45)) was used to visualize how genes over-expressed in mutant CD4 T cells were expressed in reference WT CD4 and CD8 T cell subsets from the microarray V1 dataset. Heatmaps were median-normalized by row (gene).
2.9 Statistical analysis
Statistical analyses were performed using GraphPad Prism 9 (version 9.3.1). The Shapiro-Wilk method was used to test for normal distribution of data. For normally-distributed data, unpaired two-tailed Student’s t‐tests with Welch’s correction were performed, whereas a Mann-Whitney test was performed for non-normally-distributed data, to evaluate differences between genotypes. Two-way ANOVA was used to identify the main effects of genotype versus sex as well as the interaction between these independent variables on the measured values. Post-hoc t-tests were performed via a two-stage linear step-up method of Benjamini, Krieger and Yekutieli. A false discovery rate (FDR) adjusted-p value of <0.05 represented discovery. Observed frequencies of serum ANA positivity were compared using Fisher’s exact test. Graphical data were represented as means ± standard deviation. Statistical significance was represented as: *p < 0.05, **p < 0.01, ***p < 0.001, ****p < 0.0001.
3 Results
3.1 Stat1T385M/+ in mice recapitulates biochemical features of human STAT1 GOF
We used CRISPR/Cas9 technology to replace the murine Stat1 exon 14 with the human counterpart, which introduced a C>T substitution to cause the T385M mutation in the Stat1 DBD (Figure 1A) (13, 17–19). WT human and murine exon 14 differ by 11 base-pairs, but encode amino acid sequences which are 100% conserved between species. Exchanging the human for the mouse exon was done so that this model may be used in future studies, to test therapeutic genome-editing strategies specifically targeting the human exon 14. Splenocytes and thymocytes from Stat1T385M/+ mice showed enhanced induction of pStat1(Y701) in response to acute IFNγ stimulation (Figure 1B). Total Stat1, both at baseline and following stimulation, was also increased as has been observed in STAT1 GOF patients (15, 46) and consistent with the known positive feedback regulation of STAT1 (6). Importantly, de-phosphorylation in mutants was neither diminished nor delayed (Figure 1C), in agreement with results from STAT1 GOF patient lymphocytes (46). These data demonstrate that, similar to patients with STAT1 GOF, lymphocytes from Stat1T385M/+ mice exhibited pronounced dysregulation of basal and cytokine-stimulated Stat1 activation.
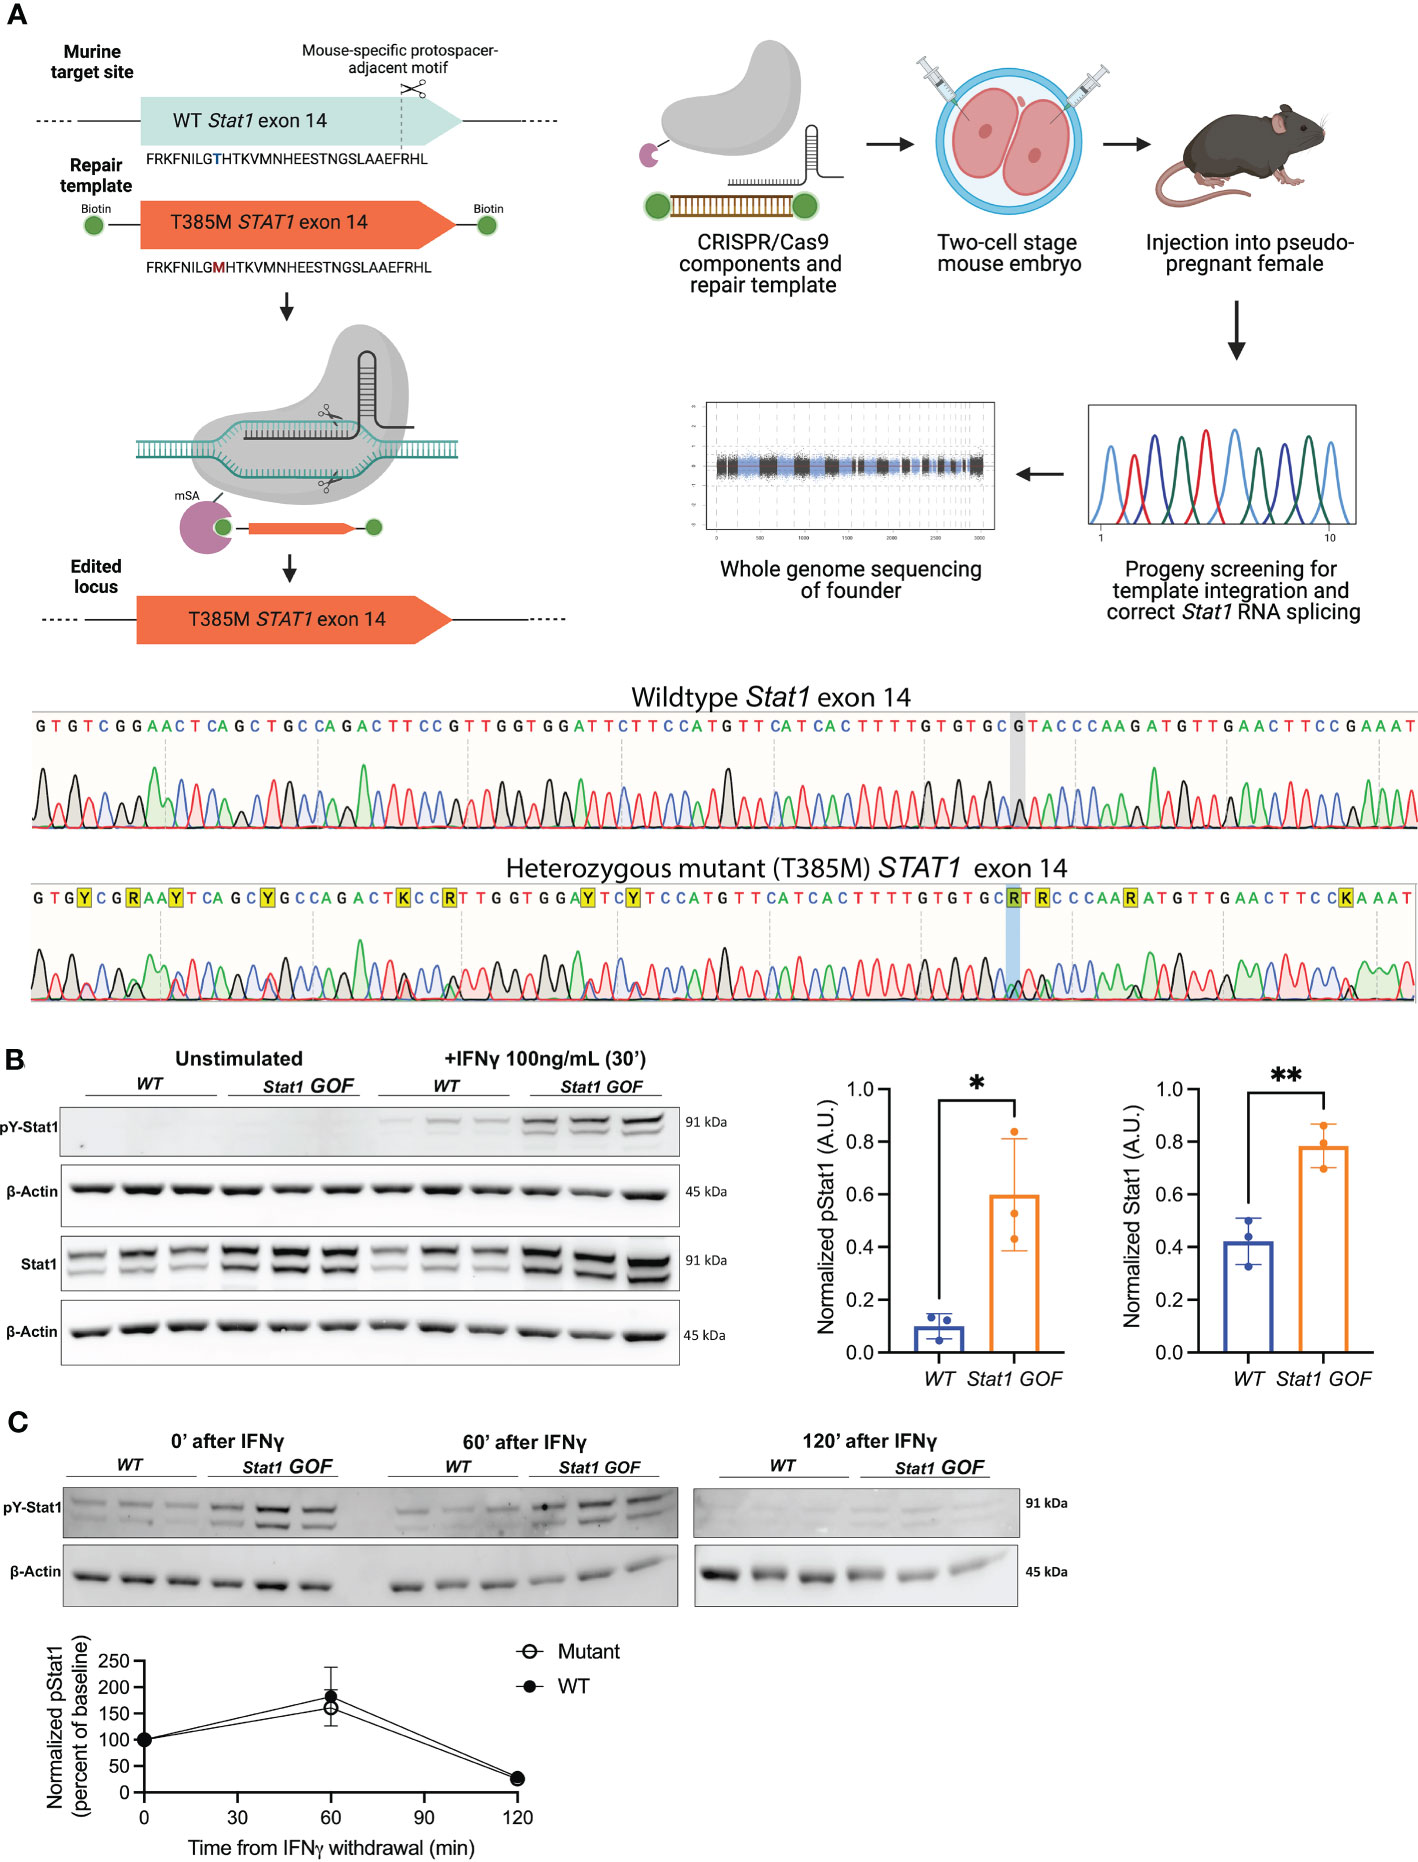
Figure 1 Stat1T385M/+ recapitulates key biochemical hallmarks of human STAT1 gain-of-function (GOF). (A) Top: Schematic of CRISPR/Cas9 strategy used to replace WT murine Stat1 exon 14 with human exon 14 harboring the T385M point mutation in the DBD. Bottom: Sanger sequencing confirmed the WT mouse exon 14 with the heterozygous mutant exon 14 in Stat1T385M/+ mice. Heterozygous changes between mouse and human exon 14 are highlighted in yellow (Y: C/T; A/G; K: G/T). The T385M heterozygous point mutation on the negative strand is highlighted in blue (C>T, resulting in a G>A on the negative strand) (B) Left: Immunoblotting of splenocytes from 6–12 week-old WT and mutant mice (n=3/group) for total Stat1 and pStat1 (Tyr701) at baseline and after in vitro stimulation with 100 ng/mL IFNγ for 30 minutes. Stat1 isoforms α (91kDa) and β (84kDa) were detected.Densitometric quantification was performed on total Stat1 from unstimulated cells and on pStat1(Tyr701) from IFNγ-stimulated cells, each normalized to the β-actin loading control. Bar graphs show mean +/- SD. Unpaired 2-tailed student’s t-test with Welch’s correction: *p<0.05 (pStat1) and **p<0.01 (Stat1). (C) Top: Immunoblotting of splenocytes from WT and mutant mice (n=3/group) for pStat1 (Tyr701) at 0, 60 and 120 minutes following withdrawal of IFNγ stimulation (as above). Bottom: densitometry quantification of pStat1 (normalized to β-actin loading control) plotted as percent of starting pStat1 at time 0, immediately after IFNγ withdrawal. Unpaired 2-tailed student’s t-test with Welch’s correction: p=0.6077 (60 minutes) and p=0.6183 (120 minutes).
3.2 Spontaneous GC formation and development of age-dependent autoimmunity in Stat1T385M/+ mice
Previous mouse models of autoimmunity demonstrated splenic abnormalities including increased spontaneous GC formation (47, 48). Therefore, we evaluated spleen size and histology in roughly equal numbers of male and female mutant mice and their WT littermates at different ages. At 6-9 weeks of age, female but not male mutants exhibited significant splenomegaly (Figure S1A). However, by 15-20 weeks of age mutants of both sexes exhibited significant splenomegaly (Figure 2A). To evaluate architecture of B cell follicles and to assess GC formation at this age, we performed immunofluorescence using the B cell marker B220, the mature B cell/follicular dendritic cell marker CD21, and the GC B cell marker GL7. Both male and female mutants showed abnormal splenic architecture with loss of clear follicular borders. Mutant spleens also had increased density (number/mm2) of GL7+ GC, suggesting ongoing GC reactions and B cell activation (Figure 2B). In accordance with this notion, mutants had elevated serum levels of IgM, IgA, and IgG2a, but reduced levels of IgG1 (Figure 2C). These findings, and in particular the changes noted to IgG sub-classes, mirror the reported effect of enhanced IFNγ/Th1 signaling on immunoglobulin isotypes (49). Thus, by ~4 months of age, mutants displayed splenomegaly, increased GC formation and increase serum concentrations of several Ig isotypes, suggesting immune dysregulation.
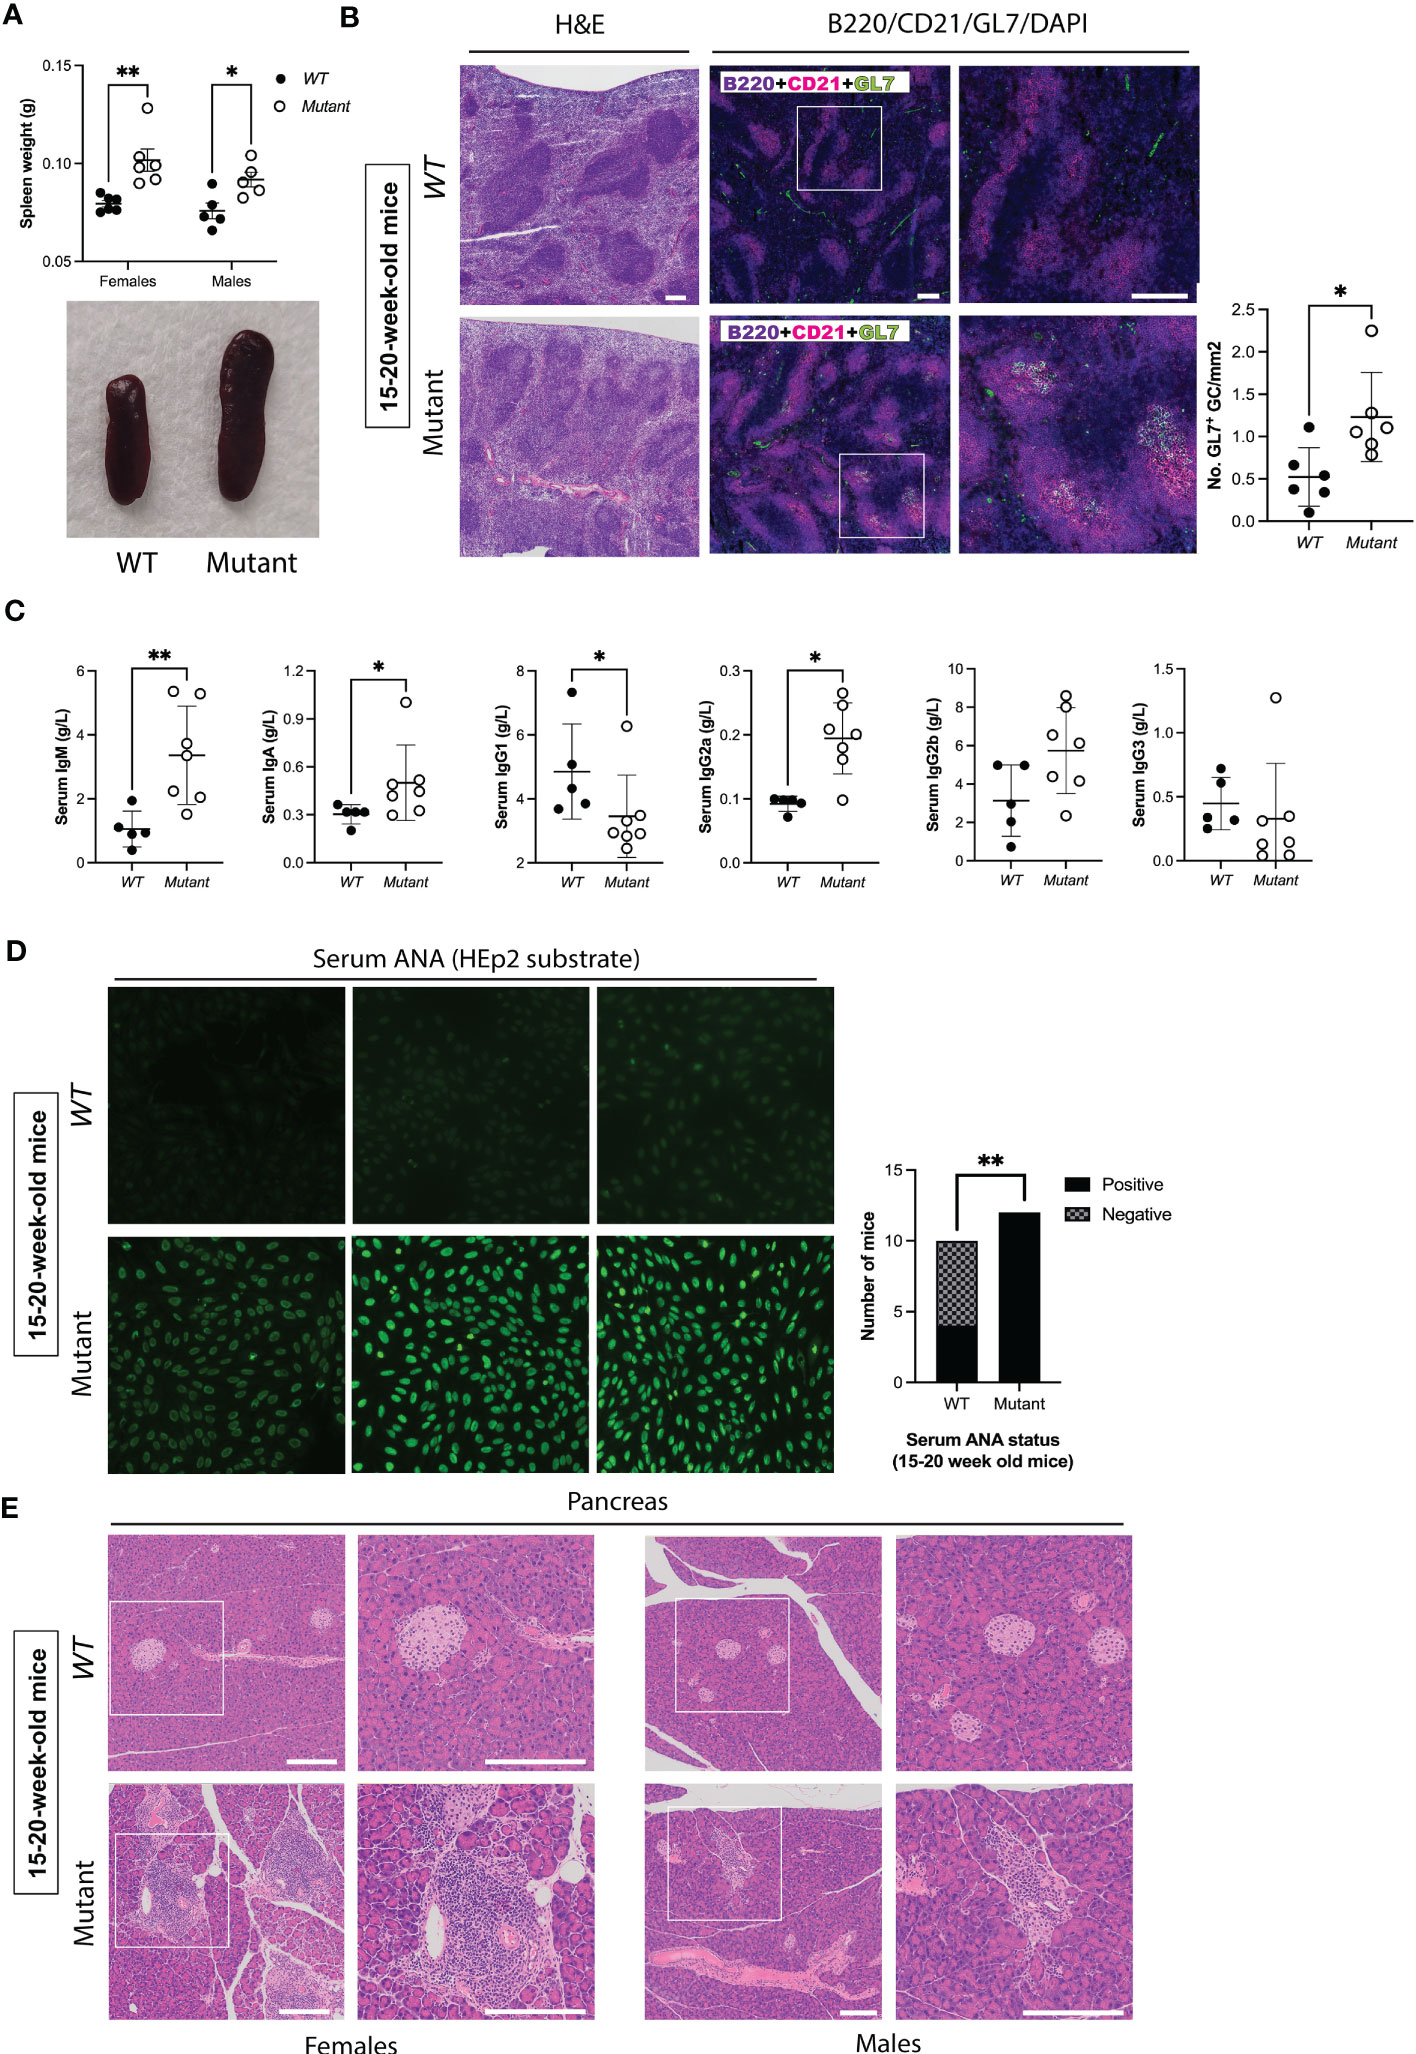
Figure 2 Stat1T385M/+ mice develop spontaneous splenomegaly, increased germinal center formation, abnormal immunoglobulin isotype profiles and autoimmunity between 15-20 weeks of age. (A) Dot plots (left) show spleen weights in males and females, with means +/- SD indicated. Exemplar pictures are shown on the bottom. Two-way ANOVA FDR-adjusted p-values: **p<0.01 (females) vs *p<0.05 (males). (B) Left: H&E staining of spleen sections. Middle: Immunofluorescence staining of spleen sections with DAPI (blue), B220 (violet), CD21 (magenta) and GL7 (green). Panels on the right show area enlarged view of boxed area shown at lower magnification on the left, scale bar=200μm. Right: Quantification of the number of GL7+ germinal centers (GC)/mm2 per spleen (6 mice per genotype). Mann-Whitney test: *p<0.05. (C) Dot plots show serum levels of immunoglobulin isotypes, with means +/- SD indicated. Mann-Whitney p-values: **p<0.01 (IgM), *p<0.05 (IgA, IgG1, IgG2a), p=0.1061 (IgG2b), and p=0.2020 (IgG3). (D) Bar graphs (left) show the observed number of 20-week-old mice with negative or positive ANA detected by indirect immunofluorescence using HEp-2 cells at a screening dilution of 1:40. Fischer’s exact test **p<0.01. Exemplar images shown on the left (40X magnification) demonstrate the spectrum of fluorescence observed for each genotype, and are representative of 12/12 mutants with positive serum ANA, and 6/10 WT with no detectable serum ANA at this age. (E) Histological assessment of pancreas by hematoxylin and eosin (H&E) staining. Left: Exemplar images are representative of 4/4 mutant females and 0/4 WT females by 20 weeks of age who developed pancreatic leukocytic infiltration. Right: Exemplar images are representative of 3/3 mutant males and 0/4 WT males who developed pancreatic leukocytic infiltration by 20 weeks of age. Panels on the right show enlarged views of boxed area shown at lower magnification on the left (scale bar=200μm).
To evaluate whether Stat1T385M/+ mice born and raised in a SPF environment developed autoimmune manifestations, we screened sera for the presence of anti-nuclear autoantibodies (ANA) that bind HEp-2 liver cells, the gold standard method for ANA testing (50). ANA were undetectable in most mice of both genotypes between 6-9 weeks of age (Figure S1B). In contrast, by 15-20 weeks of age significantly more mutants were ANA+ compared with their WT littermates (Figure 2D). Importantly, fluorescence intensity of ANA+ sera was higher in mutants (Figure 2D), suggesting higher ANA concentrations.
We used several approaches to assess organ-specific autoimmunity. At 20 weeks of age, sera from WT and mutants had similar levels of liver enzymes (ALT, AST, ALP) and albumin, suggesting that mutants did not have autoimmune hepatitis (Figure S1C). In contrast, all mutants at this age displayed leukocytic infiltration in the pancreas manifesting as either peri-insulitis or insulitis of β-cell islets, a typical feature of T1D in mouse models (51), compared with none in WT (Figure 2E). Mutant females had higher insulitis grades at 15–20 weeks of age compared with males (Figure 2E), whereas mutant males developed high grade insulitis by 1 year (Figure S1D). Overall, these data demonstrate age-dependent and female-biased excessive spontaneous splenic GC formation and autoimmune manifestations in Stat1T385M/+ mice raised in SPF conditions.
3.3 Expansion of PD1+ “memory phenotype” CD4 T cells precedes development of autoimmunity
To identify immune abnormalities that precede development of frank autoimmunity at 15-20 weeks of age, we used mass cytometry to profile immune cell lineages and activation states in spleen and mesenteric lymph nodes (LN) from a 9-week-old cohort of Stat1T385M/+and WT littermates. WT and mutant spleens had similar numbers of B, NK, and most myeloid cell populations, except for a small increase in macrophages in mutants (Figures S2A–D). Although splenic T cell numbers were similar in mutant versus WT mice (Figure S2A), the ratios of CD4/CD8 T cell number were significantly higher in mutant females and males (Figure 3A), reflecting significantly more CD44+ CD62L- CD4 cells in mutants (Figure 3B). These non-naïve “memory phenotype” (MP) cells, also known as “natural memory” T cells, develop in unimmunized mice under SPF conditions in response to low levels of tonic TCR and cytokine signaling (52). Interestingly, more mutant MP CD4 cells expressed PD1, a co-inhibitory receptor that marks the Tfh sub-lineage of CD4 T cells (Figure 3C), and the activation marker CD69 (Figure 3D), suggesting that mutant MP CD4 T cells were more activated. Importantly, numbers of PD1+ CD44+ and CD69+ CD44+ CD4 T cells were significantly increased only in female mutants (Figures 3C, D). Mutants also had more PD1+ MP CD4 T cells in mesenteric LN, but the increase was less pronounced than in spleen (data not shown). In contrast to these significant impacts of Stat1T385M on CD4 T cells, PD1 was not elevated in mutant CD8 T cells and they had similar numbers of MP CD8 T cells (defined as CD44+ CD122+) as WT (Figure S2E and data not shown). In addition, 2-way ANOVA showed that sex significantly modified the impact of genotype on the abundance of MP CD44+ CD62L- CD4 cells (interaction P=0.009). These data demonstrate that an early, selective expansion of PD1+ MP CD4 T cells precedes the development of frank autoimmunity in both sexes, but in a more variable and robust fashion in females.
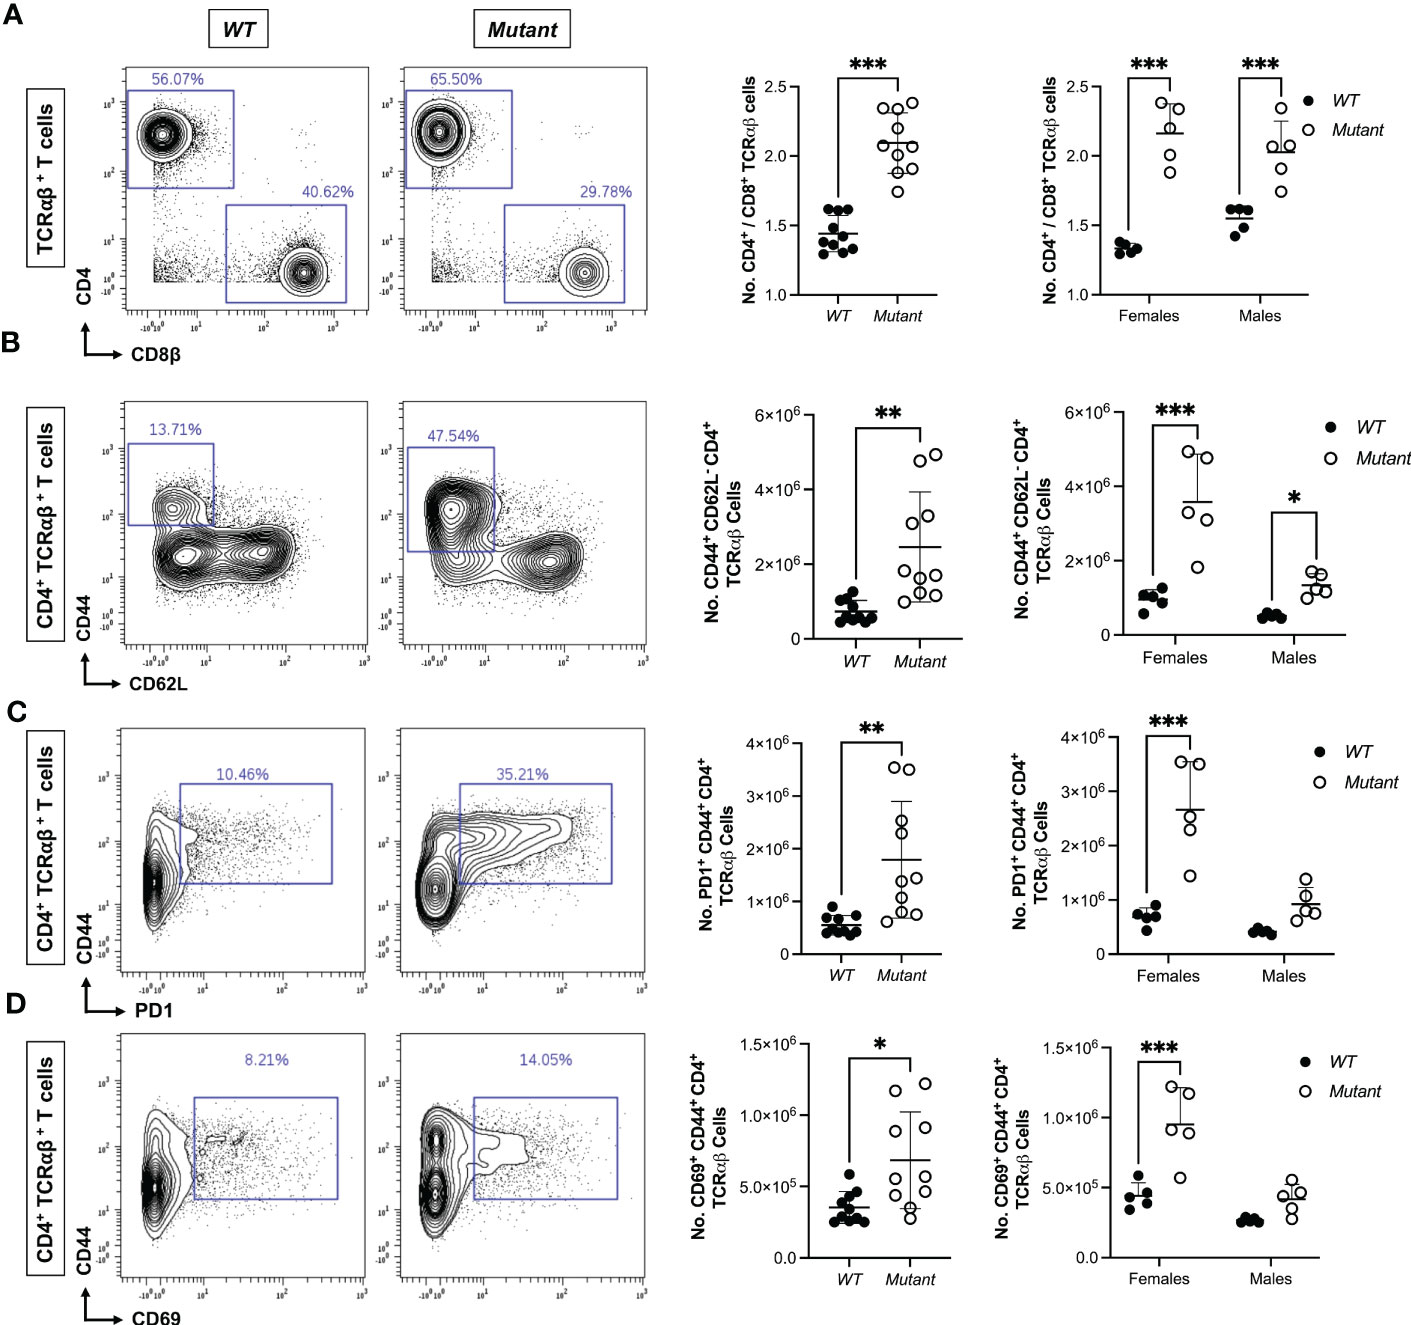
Figure 3 Expansion of activated splenic CD4 T cells precedes autoimmunity in Stat1T385M/+ mice. Mass cytometric immune profiling of splenic T cells in 9 week-old mice. Unpaired Student’s t-test with Welch’s correction was used for all sex-aggregated genotype comparisons. Two-way ANOVA with post-hoc t-test was used for all genotype comparisons dis-aggregated by sex. (A) Left: Contour plots show CD4 vs CD8 expression gated on TCRαβ+ splenic T cells from exemplar mice of each strain. Right: summary dot plots show ratio of CD4+/CD8+ T cell numbers in all mice by genotype. Sex-aggregated (***p<0.001) and dis-aggregated [***p<0.001 (mutant vs. WT females), ***p<0.001 (mutant vs. WT males), interaction *p=0.03] data are shown. (B) Left: CD44 vs CD62L expression gated on CD4+ TCRαβ+ splenic T cells from exemplar mice of each strain. Right: summary dot plots show absolute numbers of CD44+ CD62L- (MP) CD4+ T cells in all mice by genotype. Sex-aggregated (**p<0.01) and dis-aggregated [***p<0.001 (mutant vs. WT females), *p<0.05 (mutant vs. WT males), interaction **p=0.009] data are shown. (C) Left: Contour plots show CD44 vs PD1 expression gated on CD4+ TCRαβ+ splenic T cells from exemplar mice of each strain. Right: summary dot plots show absolute numbers of PD1+ CD44+ CD4+ T cells in all mice by genotype. Sex-aggregated (**p<0.01) and dis-aggregated [***p<0.001 (mutant vs. WT females), P=0.11 (mutant vs. WT males), interaction **p=0.003] data are shown. (D) Left: Contour plots show CD44 vs CD69 expression gated on CD4+ TCRαβ+ splenic T cells from exemplar mice of each strain. Right: summary dot plots show absolute numbers of CD69+ CD44+ CD4+ T cells in all mice by genotype. Sex-aggregated (*p<0.05) and dis-aggregated [***p<0.001 (mutant vs. WT females), P=0.07 (mutant vs. WT males), interaction *p=0.02] data are shown. For all dot plots, mean +/- SD are presented.
3.4 Expansion of ICOS+ Tfh-like cells and activated B cells in 15-week-old mutant mice
Since Stat1T385M/+ mice exhibited autoimmune manifestations by 15-20 weeks of age, we performed immune profiling on another cohort of WT and mutant mice aged to 15 weeks, adding additional markers for Tfh (ICOS) and T regulatory (FoxP3) CD4 cells. The ratio of CD4/CD8 T cell number was again increased, but the number of Foxp3+ CD4 T cells was similar to WT (Figures S3A, B), revealing no impact of Stat1T385M on abundance of this important immunosuppressive subset. In contrast, mutants had more non-naïve CD62L- Foxp3- CD4 T cells (Figure 4A). Within this population, mutants had significantly more CD44+ ICOS+ cells (Figure 4B) and more PD1+ ICOS+ cells (Figure 4B), suggesting expansion of Tfh-like cells. Similar to our findings in 9 week-old mice, T cell differences in 15 week-old mice were generally more significant but also more variable in females (Figures 4A, B). T cell changes in mLN were similar to those identified in spleen, though slightly less robust (Figure S3C).
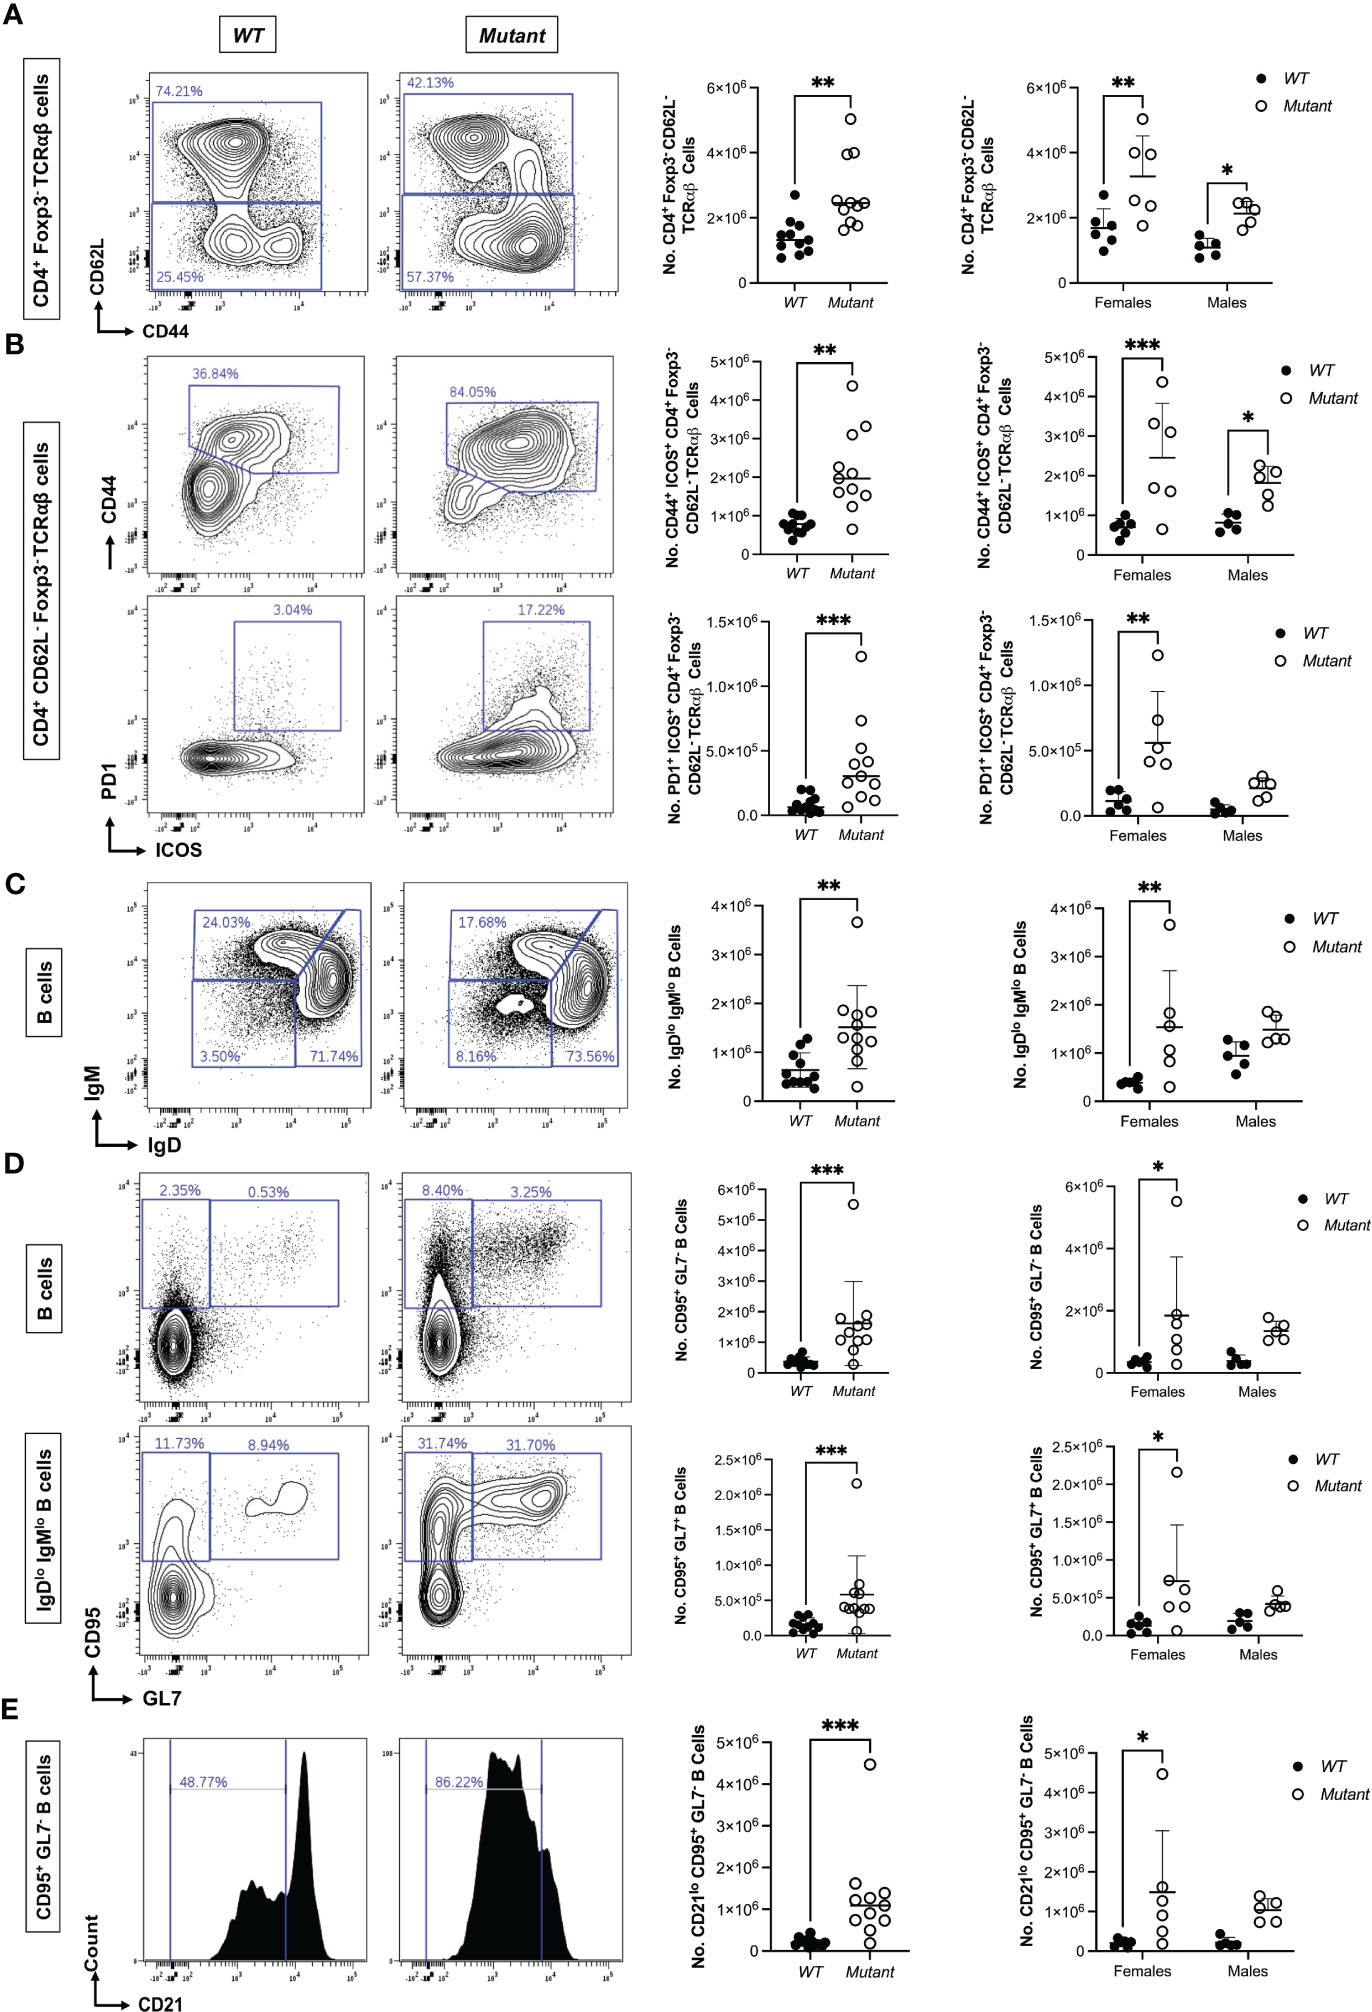
Figure 4 Expansion of ICOS+ PD1+ Tfh-like MP CD4 cells and activated B cells in 15 week-old Stat1T385M/+ mice. Flow cytometric immune profiling of splenic T cells in 15 week-old mice. Unpaired student’s t-test with Welch’s correction was used for all sex-aggregated genotype comparisons except where Mann-Whitney tests are indicated below. Two-way ANOVA with post-hoc t-test was used for all genotype comparisons dis-aggregated by sex. (A) Left: Exemplar contour plots of CD44 vs CD62L expression gated on CD4+ Foxp3- TCRαβ+ splenic T cells from each strain. Right: Summary dot plots of CD62L- CD4+ Foxp3- T cell numbers per spleen by genotype. Sex-aggregated (Mann-Whitney **p<0.01) and dis-aggregated [**p<0.01 (females) vs *p<0.05 (males), interaction p=0.42] data are shown. (B) Top left: Exemplar contour plots of CD44 vs ICOS expression gated on CD4+ Foxp3- CD62L- TCRαβ+ splenic T cells from each strain. Bottom left: Exemplar contour plots of PD1 vs ICOS expression gated on CD4+ Foxp3- CD62L- TCRαβ+ splenic T cells from each strain. Top right: Summary dot plots of numbers of ICOS+ CD44+ CD62L- CD4 cells per spleen by genotype. Sex-aggregated (**p<0.01) and dis-aggregated [***p<0.001 (females) vs *p<0.05 (males), interaction p=0.27] data are shown. Bottom right: Summary dot plots of numbers of ICOS+ PD1+ CD62L- CD4 cells per spleen by genotype. Sex-aggregated (Mann-Whitey ***p<0.001) and dis-aggregated [**p<0.01 (females) vs p=0.13 (males), interaction p=0.14] data are shown. (C) Left: Exemplar contour plots of IgM vs IgD gated on CD19+ splenic B cells from each strain. Right: Summary dot plots of IgMlo IgDlo B cell numbers per spleen by genotype. Sex-aggregated (**p<0.01) and dis-aggregated [**p<0.01 (females) vs p=0.11 (males), interaction p=0.29] data are shown. (D) Left: Exemplar contour plots of CD95 vs GL7 expression gated on either total (top) or IgMlo IgDlo (bottom) splenic B cells. Right: Summary dot plots of absolute number of activated CD95+ GL7- (top) or CD95+ GL7+ (bottom) B cells per spleen. For CD95+ GL7- B cells, sex-aggregated (Mann-Whitney ***p<0.001) and dis-aggregated [*p<0.05 (females) vs p=0.08 (males), interaction p=0.55] data are shown. For CD95+ GL7+ B cells, sex-aggregated (Mann-Whitney ***p<0.001) and dis-aggregated [*p<0.05 (females) vs p=0.2 (males), interaction p=0.3] data are shown. (E) Left: Exemplar histogram of CD21 gated on CD95+ GL7- splenic B cells. Right: Summary dot plots of CD21lo CD95+ GL7- B cell numbers in all mice by genotype. Sex-aggregated (Mann-Whitney ***p<0.001) and dis-aggregated [*p<0.05 (females) vs p=0.07 (males), interaction p=0.52] data are shown. For all dot plots, mean +/- SD are presented.
Tfh cells also promote differentiation and isotype class-switching in GC (31), and our histological analysis revealed increased GC B cells in 15-20 week-old mice (Figure 2B). Therefore, we profiled B cell differentiation states using CD21, IgM, IgD, CD95 and GL7. WT and mutant mice had similar numbers of total B cells, as well as classically defined follicular, marginal zone and transitional B cells (Figure S3D). However, mutants had more IgMlo IgDlo class-switched and more activated CD95+ and CD95+ GL7+ GC B cells in the spleen (Figures 4C, D) and mLN (Figure S3E). Mutants also had more splenic CD21lo CD95+ GL7- B cells (Figure 4E), a phenotype associated with Tbet+ B cells found in certain autoimmune conditions in humans (53). Both CD95+ subsets were greatly enriched among IgMlo IgDlo B cells, suggesting that in mutants, there were more activated B cells engaged in class-switching. Interestingly, in contrast to the T cell data, when the B cell data were dis-aggregated by sex the Stat1T385M impacts were only significant in females (Figures 4C–E). However, similar to the T cell data female mutants again showed greater variability than male mutants. Thus at 15 weeks of age, while both sexes exhibited significant expansion of Tfh-like MP CD4 cells, only female Stat1T385M/+ mice exhibited a significant increase in activated and class-switched B cells.
Collectively, these immune profiling experiments revealed that Stat1T385M/+ mice raised in SPF conditions exhibit early and prolonged expansion of Tfh-like MP CD4 in both sexes. These effects were more robust on average in females but also more variable and were seen in spleen and mLN. The Stat1T385M impacts on B cells were not evident until 15 weeks of age and were restricted to females at this timepoint.
3.5 Stat1T385M enhances CD4 T cell activation and imparts Tfh-like and Th1-like effector programs
To elucidate the transcriptional impact of Stat1T385M in T and B cells, we performed targeted scRNA-seq analysis of splenocytes from 15 week-old WT and mutant (n=3/group), quantifying transcripts encoding 397 immune genes as well as surface expression of 10 proteins detected with oligo-nucleotide tagged “AbSeq” antibodies. After de-multiplexing, we gated on CD19+ IgD+ B cells, TCRβ+ CD4+ and TCRβ+ CD4- T cell subsets (Figure S4A). Importantly, mutants in this small cohort had higher ratios of CD4/CD8 T cells and of CD62L-/CD62L+ cells within the CD4 T cell compartment (Figure S4B), similar to flow cytometric profiling of the larger cohort reported above. We then merged the individual samples from each group to identify genes whose expression differed significantly (≥40% with FDR-adjusted q-value of <0.05) between WT vs mutant in each of the 3 subsets. Stat1 itself was among the top DEG and was over-expressed in all mutant lymphocyte populations (Figure 5A; Figures S4C, D, Tables S1–S3), in keeping with its known capacity to positively regulate its own expression (6). There were more over-expressed than under-expressed genes in mutants relative to WT, suggesting that Stat1T385M acted primarily as a transcriptional activator in all lineages. Interestingly, Stat1 was more highly upregulated in mutant T cells relative to mutant B cells. CD4 T cells had ~3-4 times as many DEG as CD8 T cells or B cells and most were over-expressed in mutants (n=33; Figure 5A), suggesting that Stat1T385M had the greatest transcriptional impact on CD4 T cells.
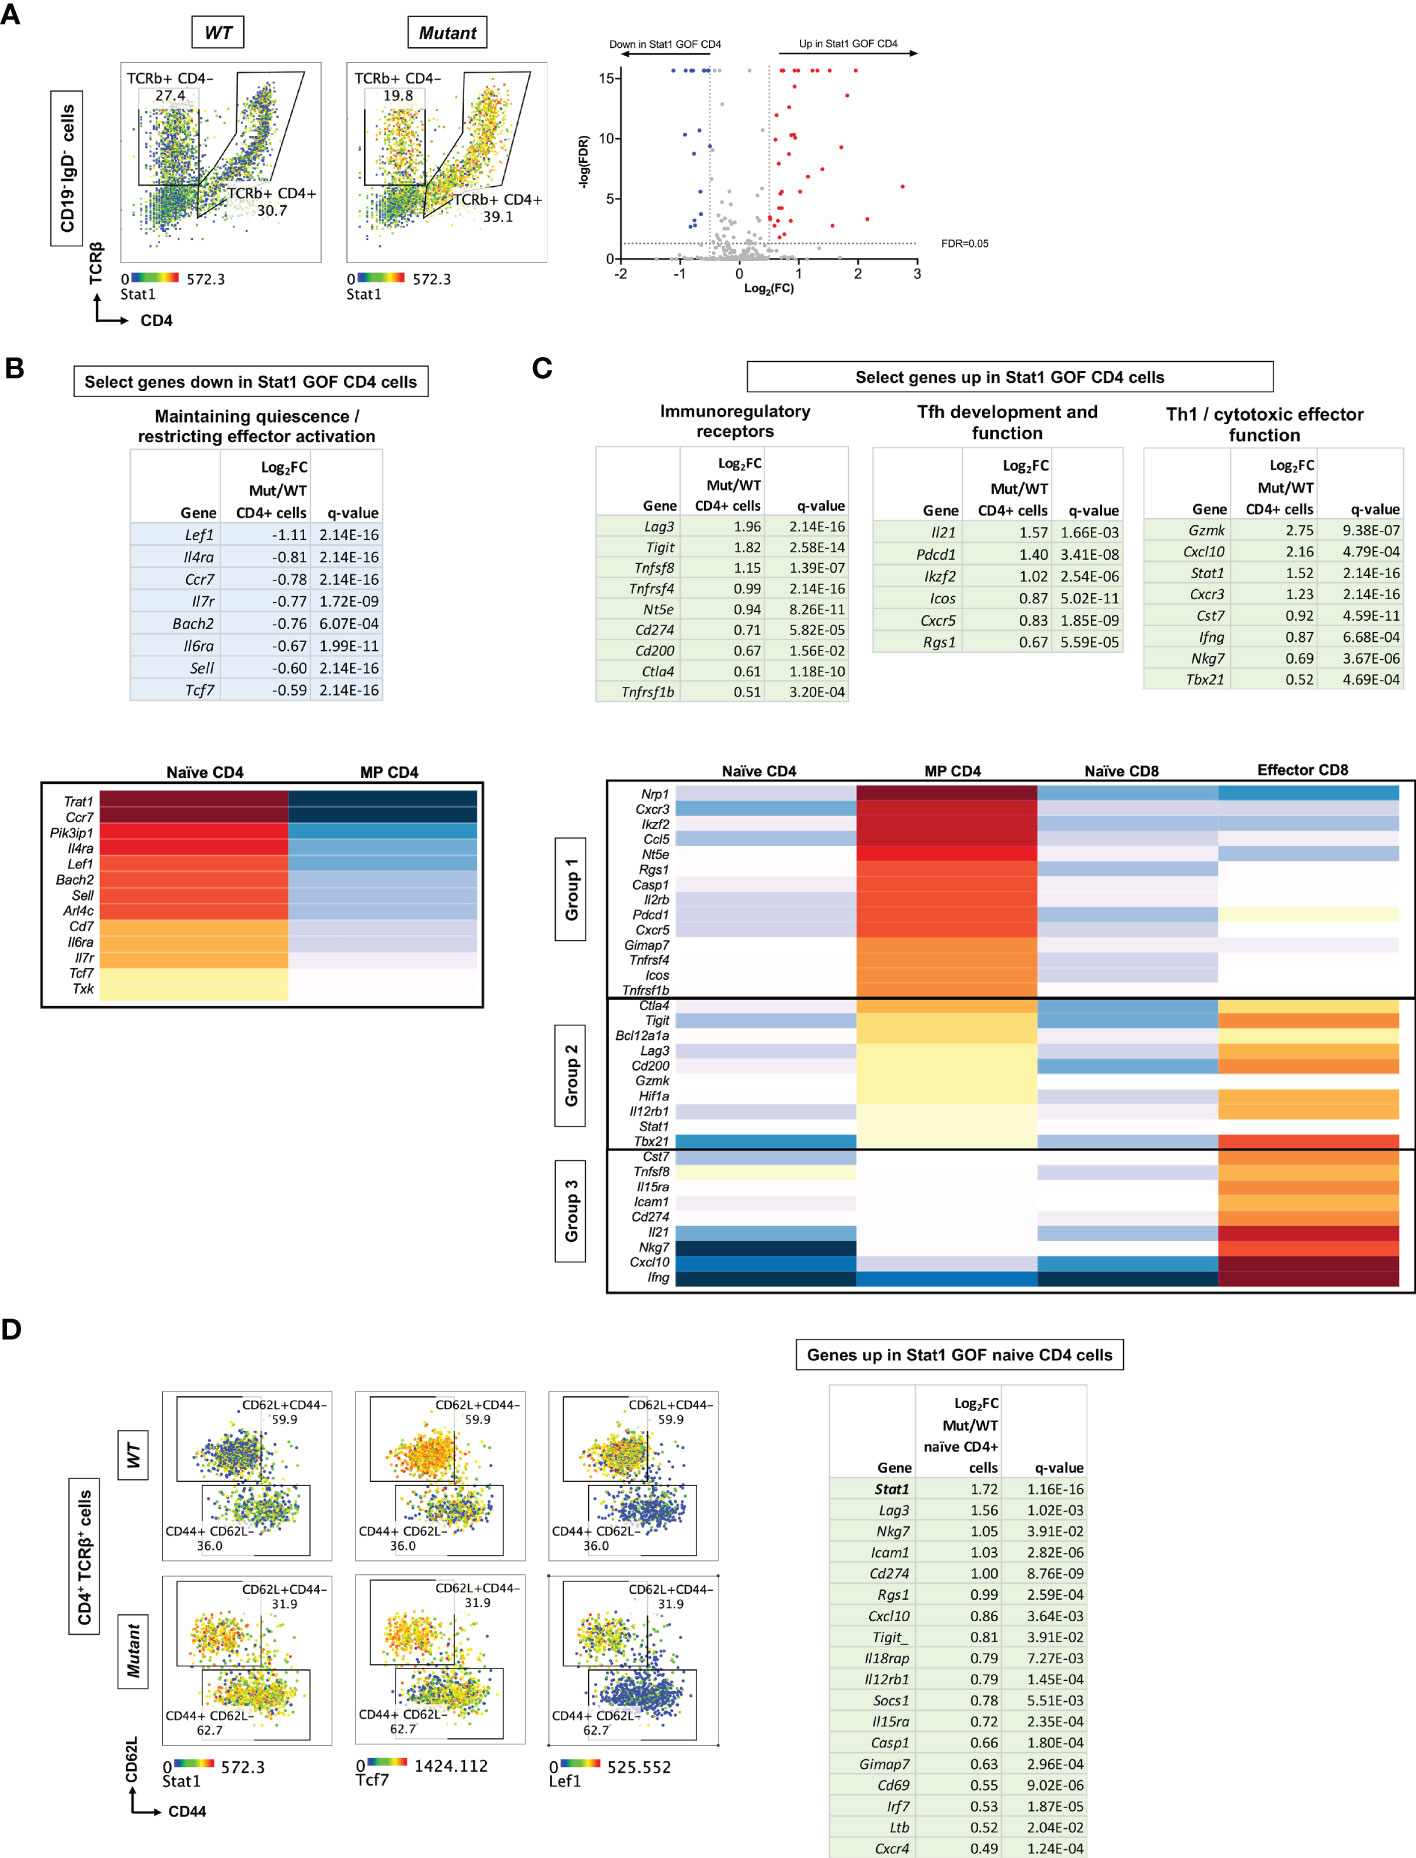
Figure 5 scRNA-Seq profiling of immune gene expression in WT versus Stat1T385M/+ spleen cells from 15 week-old mice. (A) (Left): Dot plots show CD4 and TCRβ expression on CD19- IgD- cells, defining CD4 T cells (CD4+ TCRβ+) and CD8 T cells (CD4- TCRβ+ expressing Cd8b1- see Figure S4D). Overlaid heatmap shows Stat1 expression in CD4 and CD8 T cells. (Right): Volcano plots show DEG between mutant and WT CD4 T cells, plotted according to Log2fold change [Log2FC (mutant/WT)], against the negative logarithmic value of the false discovery rate (-logFDR). Genes up-regulated or down-regulated in mutant are denoted in red and blue, respectively. (B, C) Top: Tables show select genes down-regulated (B) or up-regulated (C) in mutant CD4 T cells by 40% or more. Gene expression tables show Log2FC values and FDR-adjusted q-values <0.05. Bottom: Heatmap visualization of genes down-regulated (B) or up-regulated (C) in mutant CD4 cells in selected splenic T cell reference populations from the Immunological Genome Project (45): naïve CD4 or CD8 cells, MP CD4 cells and effector CD8 cells (isolated 12h following infection with Listeria). Upregulated genes were grouped (1–3) according to their pattern of expression in the reference populations. (D) Left: Dot plots show CD44 vs CD62L expression on CD4+ TCRβ+ cells in mutants and WT, distinguishing naïve CD62L+CD44- from MP CD44+ CD62L- CD4 cells. Expression levels of genes of interest are overlaid as heatmaps. Right: Table shows genes upregulated in mutant naive CD4 T cells by 40% or more. FC values are presented along with FDR-adjusted q-values <0.05.
Among the genes significantly down-regulated in mutant CD4 T cells were several associated with a naïve quiescent state (54, 55), such as Sell (encoding CD62L), Ccr7, Il6ra, Il7ra, and Bach2 (Figure 5B top), suggesting that they were more activated. This group also included Lef1 and Tcf7, which restrain induction of co-inhibitory receptors and promote expression of Tfh genes during anti-virus responses (33–35); Tcf7 also restrains induction of cytotoxicity genes in CD8 T cells (55). Conversely, mutant CD4 T cells significantly over-expressed several genes encoding immunoregulatory receptors known to be induced during T cell activation (56) (Figure 5C top), including Tnfrsf4 (encoding Ox40), Tnfsfr1b (encoding Tnfr2), Pdcd1, Lag3, Cd200, Tigit, Ctla4 and Nt5e (encoding CD73). Mutant CD4 T cells also over-expressed the Tfh-associated genes Icos, Cxcr5, Il21 and Ikzf2 (31, 57, 58); however, Bcl6, the master Tfh regulator (31), was not differentially expressed. Several cytotoxicity/Th1-associated molecules were also overexpressed: Tbx21 encoding Tbet, Ifng, Cst7, Nkg7 and Gzmk (Figure 5C top). This signature suggested that Stat1T385M may enhance CD4 T cell activation while also imparting both Tfh-like and Th1-like effector programs.
To better understand the unusual differentiation state of CD4 T cells from Stat1T385M/+ mice, we visualized how the DEG were expressed by reference WT CD4 and CD8 T cell populations profiled by the Immunological Genome Project (45). Notably, all genes expressed at lower levels in mutant CD4 cells were more highly expressed by reference naïve compared to reference MP CD4 cells (Figure 5B, bottom). This finding confirms that Stat1T385M downregulates genes associated with the naïve state of normal CD4 T cells. We also visualized how genes up-regulated in mutant CD4 T cells were expressed in reference naïve and MP CD4 subsets. We added a reference effector CD8 subset, since we had observed several cytotoxicity-associated genes among those upregulated by Stat1T385M. Interestingly, the Stat1T385M-upregulated genes fell into 3 groups (Figure 5C, bottom). Group 1 genes were most highly expressed by reference MP CD4 cells, and included Nrp1, Icos, Pdcd1 and Cxcr5, suggesting that these Tfh-associated genes are also up-regulated as part of the natural CD4 memory program. Group 2 genes were highly expressed by reference MP CD4 and effector CD8 cells, and included Ctla4, Lag3, Tigit, Stat1, Tbx21 and Gzmk. Finally, Group 3 genes were most highly expressed by reference effector CD8 cells, and included Cst7, Nkg7, Ifng, Cxcl10, Il21, Il15ra and Cd274 (encoding PD-L1). This analysis confirmed that mutant CD4 T cells over-express Tfh-associated and other genes that distinguish WT naïve from MP CD4 cells, but they also expressed genes associated with cytotoxic differentiation.
To determine which aspects of the Stat1T385M-associated gene expression program identified above were already present in the naïve state, we performed DEG analysis comparing WT vs mutant naïve CD62L+ CD44- as well as MP CD44+ CD62L- CD4 cells (Figure 5D; Tables S4, S5). Interestingly, Stat1 was the most highly over-expressed gene in mutant naive CD4 T cells, which also over-expressed certain activation (Lag3, Tigit, Cd69, Icam1), IFN-regulated (Cd274, Socs1, Cxcl10), cytokine receptor (Il12rb1 and Il15ra) and cytotoxicity (Nkg7) genes (Figure 5D; Table S2). Indeed, several genes belonging to each of the 3 Groups of up-regulated genes identified in total CD4 cells (Figure 5C) were overexpressed specifically in mutant naive CD4 cells. As expected, many of the up-regulated genes in total mutant CD4 cells were also up-regulated specifically in mutant MP CD4 cells (Table S4). Additionally, mutant MP CD4 cells had decreased expression of Ccr6 and Rorc (encoding RORγt), suggesting that Stat1T385M inhibited Stat3 activation and impaired Th17 effector differentiation, as previously observed in STAT1 GOF patients (15). Other lineage-defining transcription factors (Gata3, Foxp3) were not differentially expressed between WT and mutants.
We also used Seurat to perform unsupervised multimodal (mRNA and AbSeq) dimensionality reduction and clustering to ask whether mutants contained T or B cell subsets with unique immune gene profiles. Among the 14 clusters with >100 cells in merged WT or mutant samples, there were two myeloid (macrophages and monocytes), seven B cell and five T cell clusters that were all present in both WT and mutant samples (Figures 6A, B and Table S6A). Thus, targeted single cell profiling of immune gene and protein expression by total splenocytes identified multiple clusters of naïve and activated/effector of T and B cells. However, mutant-specific T or B cell clusters were not detected, suggesting that Stat1T385M did not promote differentiation of a trancriptionally unique T or B cell effector subset.
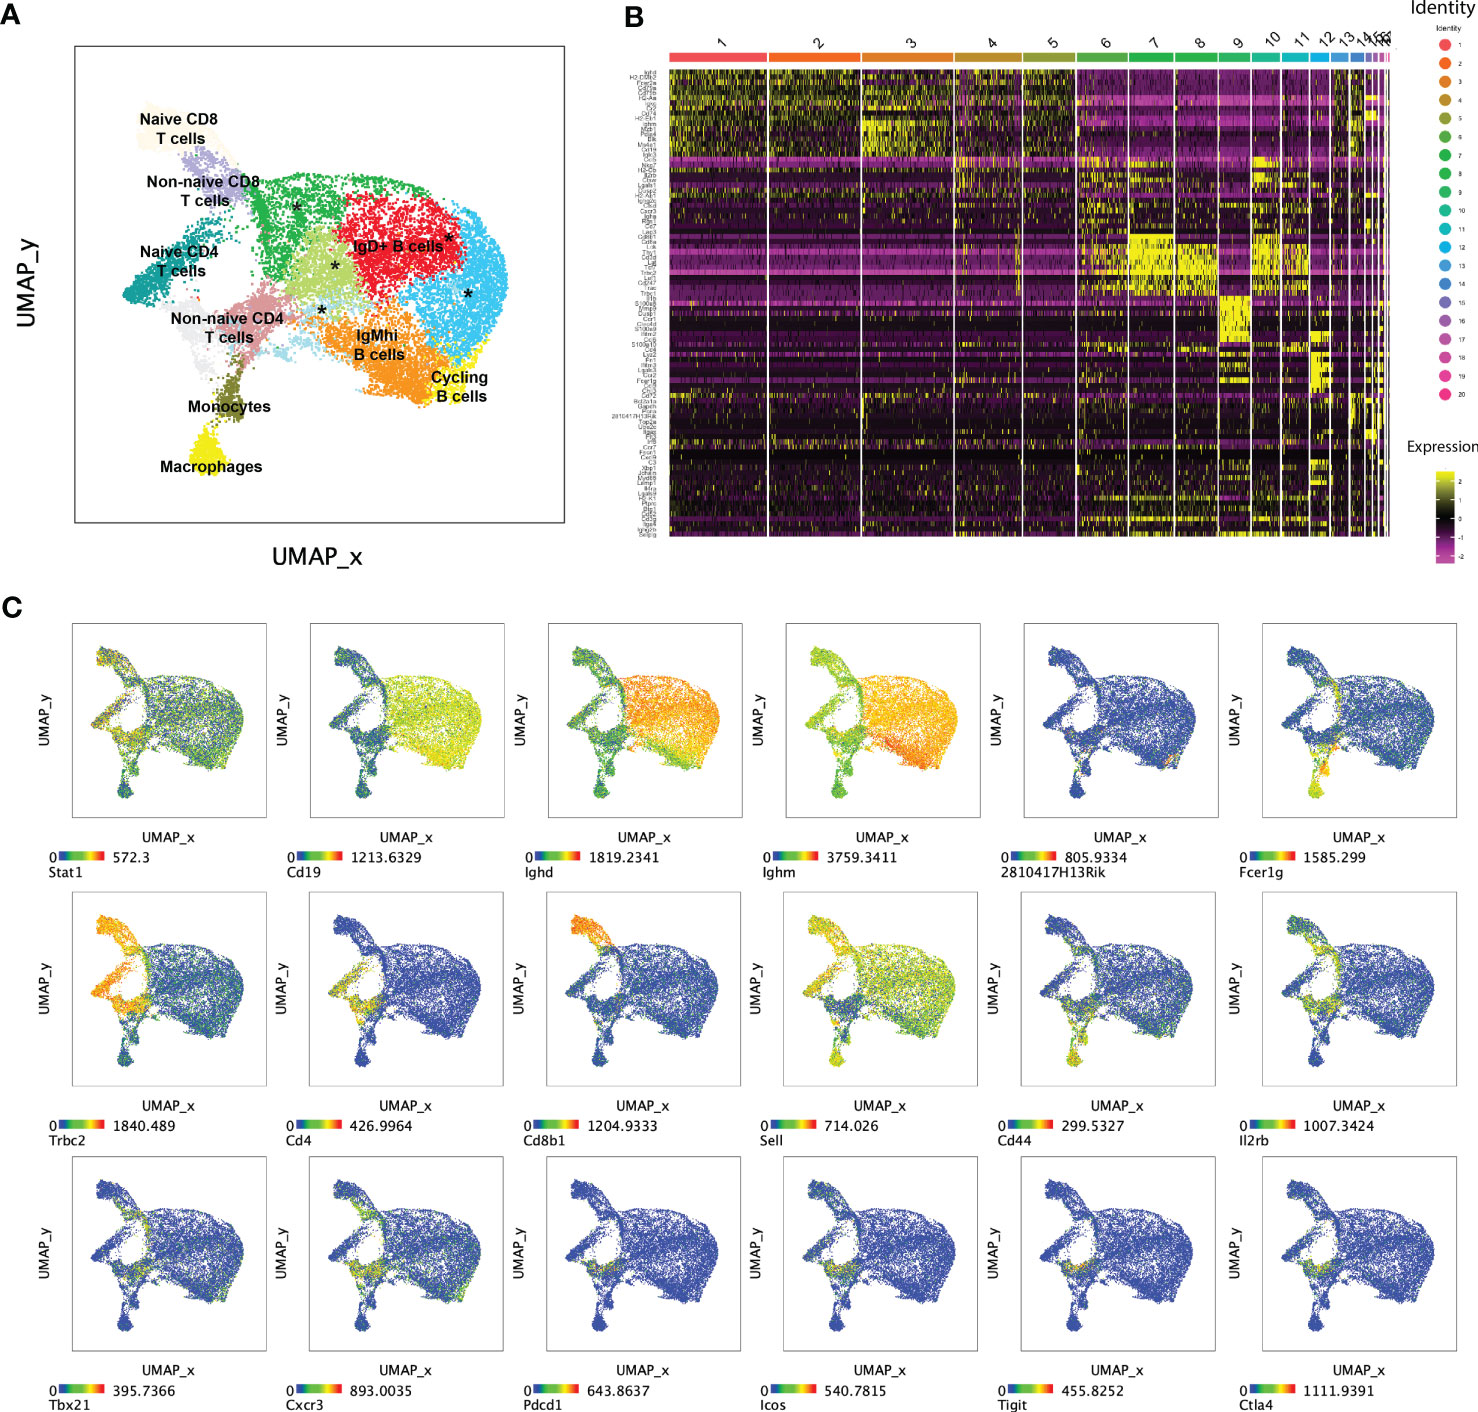
Figure 6 Seurat multi-modal clustering of 15 week-old mouse splenocytes. (A) Plot shows uniform manifold approximation and projection (UMAP) dimensionality reduction overlayed with Seurat-generated clusters on aggregated WT and mutant cells. Clusters marked with an asterisk (*) represent IgD+ B cells. (B) Heatmap shows relative expression of Seurat-defined “marker” genes across 20 Seurat-generated clusters. (C) Dot plots show UMAP of aggregated WT and mutant cells colored by expression levels of informative transcripts. Note that 2810417H13Rik encodes Pclaf (PCNA clamp associated factor), a cell cycle regulatory gene.
All mutant B cell clusters expressed more Stat1 than their WT counterparts (Figure 6C; Table S6C). Five of seven also over-expressed Tbx21 and/or its target Cxcr3; both are known to regulate B cell proliferation and migration to the GC dark zone during malaria infection (59). Indeed, several mutant B cell clusters over-expressed one or more GC-associated genes such as Fas/CD95 (60), Irf8 (61) and Icam1 (62), as well as Igh isotypes that result from class-switching. A similar set of GC-associated genes were also up-regulated in our comparison of total mutant versus WT B cells (Table S3). GC B cells are highly proliferative, but high levels of cell cycle-associated genes such as Pclaf, Mki67 and Pcna, were restricted to a single small B cell cluster (#14), which was more abundant in mutants (Figure 6C; Table S6B). This unsupervised analysis showed that Stat1T385M activated aspects of the GC B cell program, though not Bcl6, across multiple B cell subsets.
Among the five T cell clusters, Seurat identified Sell+ (encoding CD62L) naïve and Sell- non-naïve CD4 and CD8 T cell subsets. A comparison of mutant/WT CD8 clusters yielded a small number of DEG highly similar to those identified in our analysis of total CD8 T cells, with the addition of Gzmk in naïve CD8 cells (Figure S4). The two non-naïve CD4 T cell clusters (6 and 11) expressed high levels of Il2rb, Tbx21, Cxcr3, together with the Tfh-associated genes Pdcd1, Icos, Ctal4 and Tigit, suggesting a hybrid Tfh/Th1 program (Figure 6C). Mutant clusters 6 and 11 expressed higher levels of these genes and/or proteins together with more Stat1, Gzmk, Cxcl10, Il21, Lag3, Nt5e and Tnfrsf4 to name a few (Table S6C). Overall, unsupervised and immunophenotype-guided analysis of single cell immune gene expression identified highly overlapping sets of DEG which collectively suggested that Stat1T385M activated transcription of GC-associated programs in both B and T cells. However, Stat1T385M had the strongest transcriptional impact on T cells, promoting aberrant activation of naïve CD4 cells and inducing their differentiation into hybrid Tfh/Th1-like effector cells.
4 Discussion
We generated and characterized Stat1T385M/+mice to model the impact of the DBD class of STAT1 GOF mutations on immune homeostasis under SPF conditions in both males and females. Similar to patients with STAT1 GOF (46), Stat1T385M/+ lymphocytes had more total Stat1 at baseline and also higher amounts of IFNγ-induced pStat1. By 9 weeks of age, Stat1T385M/+ mice showed expansion of MP CD4 cells expressing Tfh-like markers, in spleen and in gut-draining mLN, with no observed autoimmunity. By 15-20 weeks of age mutants also displayed B cell activation, increased GC formation, abnormal immunoglobulin isotype profiles and development of autoimmunity. Notably, females developed these immune abnormalities sooner and more robustly than males, identifying significant sex effects for this mouse model of STAT1 DBD GOF. Single cell analysis showed that although Stat1 was significantly up-regulated in both T and B cells from Stat1T385M mutants, its most predominant impact was to promote aberrant activation of naïve CD4 cells and induce their differentiation into hybrid Tfh/Th1-like effector cells. Collectively, these data demonstrate that Stat1T385M increased basal and cytokine-stimulated Stat1 activation in lymphocytes, disrupting naïve CD4 T cell homeostasis and promoting differentiation of abnormal T helper cells with cytotoxic features (63) as well as GC-like B cells, eventually resulting in autoimmunity in the absence of overt infection. These findings potentially explain how human STAT1 GOF causes immune dysregulation and autoimmunity.
The biochemical, immunophenotypic and overt autoimmune abnormalities we observed in Stat1T385M/+ mice differ from previously published studies modeling the immune impacts of STAT1 GOF mutations in the coiled-coil domain. In Stat1R274W/+ (64) mice, total Stat1 was not increased at baseline, and IFN-induced Stat1 hyper-phosphorylation was noted in T cells; however T cell numbers were normal (64). Stat1R274Q/+ mice also showed increased IFN-stimulated pStat1 in gut CD4+ T-cells (65). However, autoimmunity was not reported in either model, and viral or fungal infection was required to induce overt immunophenotypic or transcriptional changes in both. In contrast, splenocytes from our Stat1T385M/+ mice had more total Stat1 at baseline and in IFNγ-induced pStat1 but normal Stat1 dephosphorylation kinetics, all in keeping with observations made in patient cells (46). The immunophenotypic and transcriptional profiles of Stat1T385M/+ mice were also significantly different from WT in our SPF colony. These findings suggest that there is differential pathogenicity of STAT1 GOF mutations; the T385M DBD mutation selectively disrupted immune homeostasis and promoted autoimmunity in the absence of deliberate stimulation or infection.
Here we report significant sex effects for both the kinetics and magnitude of immune abnormalities in our Stat1T385M/+ GOF mouse model. Female mutants developed splenomegaly earlier, and also displayed more robust increases in MP CD4 cells between 9-15 weeks. These cells also expressed significantly higher amounts of PD1 and ICOS, suggesting that MP CD4 cells were more activated than in males. By 15 weeks, activated IgDlo IgMlo GC B cells were significantly elevated only in females. In contrast, studies of humans or other mouse models with STAT1 GOF did not report sex effects on development of immune abnormalities and autoimmunity. Most human autoimmune diseases preferentially affect females due to a combination of factors, including increased expression of X-linked innate and adaptive immune genes, heightened type I IFN secretion mediated by estrogens, and microbiome differences (22, 66). Additionally, STAT1 contains an estrogen-response element, suggesting an IFN-independent role for estrogens in STAT1 activation (67). However, sex effects identified in mice do not always apply to humans. For instance, while female mice show a higher predisposition than males to developing T1D, whereas humans of both sexes develop T1D in nearly equal ratios (22). Investigation of the possible sex effect of autoimmunity in human STAT1 DBD GOF is therefore warranted, including assessment of the types of autoimmune manifestation, age of onset and severity.
Stat1T385M had the greatest immunophenotypic impact on MP CD4 T cells, which in WT mice, differentiate in response to homeostatic TCR signaling and cytokine stimulation. MP CD4 T cells are generated in mice free of all microbes and exogenous food antigens (52), suggesting that they differentiate cell autonomously and/or in response to self-antigens. While we cannot rule out the contribution of commensal microbes to the immune changes observed in our SPF Stat1T385M/+ mice, these changes were not more prominent in gut-draining mLN, as would be expected if commensal gut microbiota drove CD4 T cell activation. Further studies will be required to determine the role of self- versus foreign- antigens as well TCR and cytokine signaling in driving aberrant MP CD4 T cell differentiation in this mouse model of STAT1 DBD GOF.
Stat1T385M had also the greatest transcriptional impact on CD4 T cells, which over-expressed several Tfh-associated genes a well as immunoregulatory receptors associated with Tfh and also with chronic T cell activation and exhaustion. Elevated expression of co-inhibitory activation markers, such as PD-L1 and Fas was previously reported in STAT1 GOF patient CD4 T cells, and was suggested as a mechanism potentially leading to T cell exhaustion over time (39, 68, 69). Although Stat1T385M MP CD4 T cells did not over-express Bcl6, which encodes the master regulator of Tfh differentiation (70), they over-expressed several other Tfh-associated genes such as Icos, Pdcd1, Icam1, Ikzf2, Il21and Cxcr5, suggesting that Bcl6 up-regulation is not required to induce these genes when Stat1 is activated. Similar to early Tfh cells, mutant CD4 T cells also expressed Il21 but not Il4; the latter cytokine is made only by fully differentiated Tfh cells (31). IL21 together with other signals can drive B cell proliferation and differentiation both within and outside of the GC. Therefore, it seems likely that, in addition to a primary impact of Stat1T385M on B cells, the expanded Tfh-like cells may also have contributed to the increase in activated B cells and excessive splenic GC formation. Interestingly, T cell-intrinsic overproduction of IFNγ also causes accumulation of Tfh cells, GC B cell activation and SLE (71), phenomena that are likely linked to Stat1 activation. Our scRNA-Seq based immune gene profiling showed that in addition to early Tfh-like features, Stat1T385M CD4 T cells also expressed a cytotoxic CD8/Th1-like effector program. Although multiple lines of evidence show that Bcl6 and Tbet cross inhibit each other, infection-induced Tfh cells can transiently express Tbet and Th1 features (70, 72–75). Thus, STAT1 GOF mimics some aspects of infection-induced Tfh differentiation. During acute viral infection, IL6 activates both Stat1 and Stat3, with the latter being required to limit IL2/Stat5-induced Th1 differentiation (9, 76, 77). However, this break on Th1 differentiation may be impaired in Stat1T385M CD4 T cells since activated Stat1 inhibits Stat3. Peripheral blood from STAT1 GOF patients shows variable in Th1 cells, circulating Tfh (cTfh) cells as well as cTfh with “Th1-like” features (such as increased Tbet and CXCR3 expression) (26–28, 36, 78). Thus, our Stat1T385M/+ mouse model recapitulates several features of abnormal CD4 T cell differentiation seen in STAT1 GOF patients, but in the absence of infection.
Interestingly, naïve CD4 T cells highly over-expressed Stat1 and also displayed some aspects of the Stat1T385M-driven abnormal program, which became more prominent in MP CD4 T cells. However, these phenotypically naïve cells also exhibited unique transcriptional changes, likely setting the stage for abnormal differentiation. They overexpressed Il2rb and Il15ra, cytokine receptors that drive differentiation of MP CD4 cells (52). Notably, mutant CD4 T cells expressed significantly lower amounts of Tcf7 and Lef1, transcription factors which restrain expression of the Ctla4 and Lag3 co-inhibitory receptors in Tfh cells (35), providing a potential mechanism for over-expression of these genes in mutant CD4 T cells. Tcf7 and Lef1 also restrain expression of cytotoxicity genes in naïve CD8 cells (55), so their downregulation, together with Stat1 GOF, could contribute to the up-regulation of a Type I/cytotoxicity program marked by expression of Tbx21, Gzmk, Nkg7, Cst7, Cxcr3 and Cxcl10. Tcf7 and Lef1 also critically regulate Tfh differentiation and Bcl6 induction during infection-induced Tfh differentiation (33, 35), so their Stat1T385M-induced down-regulation could contribute to the lack of Bcl6 expression by mutant Tfh-like CD4 cells. Stat1T385M-induced Tbx21 could also contribute to the lack of Bcl6 expression. While the precise molecular mechanisms remain to be elucidated, our findings suggest that Stat1T338M alters expression of key transcription factors to aberrantly activate naïve CD4 T and promote their differentiation into hybrid Tfh/Th1-like CD4 cells under homeostatic conditions, ultimately promoting autoimmunity in the absence of infection.
Data availability statement
The datasets presented in this study can be found in online repositories. The names of the repository/repositories and accession number(s) can be found below: PRJNA949654 (SRA).
Ethics statement
The animal study was reviewed and approved by The Centre for Phenogemonics Animal Care Committee.
Author contributions
Study conceptualization by OS, CG, CR, EA, RC. Methodology by OS, SV, BG, CG. Investigation by OS, SV, ER, DM, CG. Data analysis by OS, CG. Visualization by OS, CG. Supervision by RC, CR, CG and EI. Funding acquisition by OS, CR, RC. Writing - original draft by OS. Writing – review and editing by OS, SV, ER, DM, BG, CR, DC, CG, EI. All authors contributed to the article and approved the submitted version.
Funding
Funding for this work was provided by Rare Disease Models and Mechanisms Network (RDMM) Catalyst Grant (190829-001-002; PIs: CMR and RDC), the Primary Immunodeficiency Treatment Consortium Fellowship Award (PIDTC 12082sc; PI: OS), Canadian Institutes for Health Research Operating Grant 165973 (PI: CJG) and Immunodeficiency Canada Young Investigator Award (PI: OS). Salary support for OS has been provided by the Ontario Ministry of Health Clinician Investigator Program (MOH-CIP), Empowering Next Generation Researchers in perinatal and Child Health (ENRICH), The Hospital for Sick Children Clinician Scientist Training Program (CSTP), and the Canadian Institutes of Health Research (CIHR) Canada Graduate Scholarship Doctoral Award (CGS-D).
Acknowledgments
Figure 1 was generated using Biorender (app.biorender.com). RNA-Seq was performed at The Centre for Applied Genomics with support from Genome Canada/Ontario Genomics Institute and the Canada Foundation for Innovation (CFI). Flow cytometry, mass cytometry and Rhapsody single cell multi-omics were performed at the SickKids Flow Cytometry Facility and the Centre for Advanced Single Cell Analysis, supported by the SickKids Foundation and a CFI John Evans Fund Leaders grant to CJG.
Conflict of interest
The authors declare that the research was conducted in the absence of any commercial or financial relationships that could be construed as a potential conflict of interest.
Publisher’s note
All claims expressed in this article are solely those of the authors and do not necessarily represent those of their affiliated organizations, or those of the publisher, the editors and the reviewers. Any product that may be evaluated in this article, or claim that may be made by its manufacturer, is not guaranteed or endorsed by the publisher.
Supplementary material
The Supplementary Material for this article can be found online at: https://www.frontiersin.org/articles/10.3389/fimmu.2023.1183273/full#supplementary-material
Supplementary Figure 1 | Autoimmune manifestations in Stat1T385M/+ mice from 6 weeks to 1 year of age. (A) Dot plots show spleen weights in 9-week-old males and females, with means +/- SD indicated. Two-way ANOVA: FDR-adjusted p-values: *p<0.05 (females) vs p=0.42 (males). (B) Bar graphs show the observed frequency of serum positivity for anti-nuclear antibodies (ANA) as detected in 6-9-week-old mice via indirect immunofluorescence using HEp-2 substrate, at a screening dilution of 1:40. Fischer’s exact test **p>0.999. (C) Dot plots show serum values of liver parameters including alanine amino transferase (ALT), aspartate aminotransferase (AST), alkaline phosphatase (ALP) and albumin in 20 week-old mutants and WT littermates, with means +/- SD indicated. Mann-Whitney test: p=0.5224 (ALT), p=0.6482 (AST), p=0.6601 (ALP) and p=0.8911 (albumin). (D) Histological assessment of pancreas from 1-year-old males by H&E staining. Data shown are representative of 3/3 mutants and 0/3 WT mice who developed pancreatic insulitis. Panels on the right show area-enlarged view of boxed area shown at lower magnification on the left, scale bar= 200µm.
Supplementary Figure 2 | Mass cytometric immune profiling of splenocytes in 9 week-old mice. (A) Left: Exemplar contour plots show CD3 vs CD19 expression gated on live single splenic cells from each strain. Two-way ANOVA with post-hoc t-test was used for all genotype comparisons dis-aggregated by sex. Right: summary dot plots show absolute numbers of B, T, and non-T, non-B cells by sex and genotype. B cells: p=0.06 (females) vs p=0.34 (males). T cells: p=0.72 (females) vs p=0.72 (males). Non-T, non-B cells: p=0.56 (females) vs p=0.41 (males). (B) Left: Exemplar contour plots show CD122 vs NK1.1 expression gated on non-T non-B cells from each strain. Right: summary dot plots show absolute numbers of NK cells by sex and genotype: p=0.79 (females) vs p=0.79 (males). (C) Left: Exemplar contour plots show Sirpα vs Ly6G expression gated on non-T/B/NK cells from each strain. Right: summary dot plots show absolute numbers of granulocytes by sex and genotype: p=0.53 (females) vs p=0.11 (males). (D) Left: Exemplar contour plots show SiglecF vs CD64 expression gated on Sirpα+ Ly6G- non-dendritic cells from each strain. Right: summary dot plots show absolute numbers of SiglecF- CD64+ macrophages by sex and genotype: *p<0.05 (females) vs *p>0.05 (males). (E) Left: Exemplar contour plots show CD44 vs CD122 expression gated on CD8+ TCRαβ+ cells from each strain. Right: summary dot plots show absolute numbers of MP CD44+ CD122+ CD8 T cells by sex and genotype: p>0.99 (females) vs p=0.85 (males). For all dot plots, mean +/- SD are presented.
Supplementary Figure 3 | Flow cytometric immune profiling of splenocytes and mLN in 15 week-old mice. Two-way ANOVA with post-hoc t-test was used for all genotype comparisons dis-aggregated by sex. (A) Left: Exemplar contour plots show CD4 vs CD8a expression gated on live single splenic CD3+ TCRβ+ cells from each strain. Right: summary dot plots show ratios of CD4/CD8 cells by sex and genotype. *p=0.01 (females) vs *p=0.01 (males). (B) Left: Exemplar contour plots show CD25 vs Foxp3 expression gated on CD4+ TCRβ+ T cells from each strain. Right: summary dot plots show absolute numbers of Foxp3+ T regulatory cells (Treg) cells by sex and genotype: p=0.53 (females) vs p=0.53 (males). (C) Summary dot plots show absolute numbers of CD62L- Foxp3- CD4 T cells, and ICOS+ CD44+ CD62L- CD4 T cells, from mLN by sex and genotype. Non-naïve CD4 cells: p=0.11 (females) vs p=0.14 (males). ICOS+ MP CD4 cells: **p=0.005 (females) vs *p=0.04 (males). (D) Left: Summary dot plots show absolute numbers of splenic CD19+ B220+ B cells by sex and genotype: p=0.15 (females) vs p=0.67 (males). Middle: Exemplar contour plots show CD21 vs CD24 expression gated on B cells from each strain. Right: summary dot plots show absolute numbers of follicular (CD21med CD24lo), T1 (CD24hi CD21lo) and T2 plus marginal zone (CD21hi CD24hi) B cells by sex and genotype. Follicular B cells: p=0.09 (females) vs p=0.4 (males). T1 B cells: p=0.41 (females) vs p=0.94 (males). T2+marginal zone B cells: p=0.56 (females) vs p=0.79 (males). (E) Summary dot plots show absolute numbers of class-switched (IgMlo IgDlo) B cells, activated pre-germinal center (GC; CD95+ GL7-) and GC (CD95+ GL7+) B cells, from mesenteric LN by sex and genotype. IgMlo IgDlo B cells: **p=0.002 (females) vs p=0.02 (males). CD95+ GL7- B cells: **p=0.003 (females) vs p=0.15 (males). CD95+ GL7+ B cells: **p=0.001 (females) vs p=0.1 (males). For all dot plots, mean +/- SD are presented.
Supplementary Figure 4 | ScRNA-seq analysis of 15 week-old mouse splenocytes. (A) Pre-gating strategy for each subset is shown on aggregated WT cells. Left: Dot plots show CD19 vs IgD protein expression showing gates for B cells (CD19+IgD+) vs. non-B cells (CD19-IgD-). Overlayed heatmap display Ighm expression which guided gating. Middle: CD4 vs TCRβ protein expression gated on CD19-IgD- non-B cells with overlayed heatmaps showing Trac expression which guided gating decisions for CD4 cells (TCRβ+ CD4+) and CD8 (TCRβ + CD4-) cells. Right: CD44 vs CD62L protein expression gated on CD4+ TCRβ + T cells. Gates used for CD62L+CD44- (naïve) and CD44+ CD62L- MP CD4 cells are shown with overlayed heatmap of Sell encoding CD62L. (B) Left: summary dot plots show ratios of CD4/CD8 cells by genotype. Unpaired Student’s t-test with Welch’s correction p=0.16. Right: summary dot plots show ratios of CD62L+CD44- / CD44+ CD62L- CD4 cells by genotype, unpaired Student’s t-test with Welch’s correction **p<0.01. For all dot plots, mean +/- SD are presented. (C) Left: IgD vs CD44 protein expression on B cells from each strain, overlayed with heatmap of Stat1. Middle: Volcano plots show DEG between mutant and WT B cells, plotted according to Log2 fold change [Log2FC (mutant/WT)], against the negative logarithmic value of the false discovery rate [-log(FDR)]. Genes up- and down-regulated in mutant are denoted in red and blue, respectively. Right: Tables show genes up- or down regulated in mutant B cells by 40% or more. Log2FC values are presented along with FDR-adjusted q-values <0.05. (D) Left: dot plots show CD4 vs TCRβ protein expression gated on CD19-IgD- non-B cells for aggregated samples from each strain, with overlayed heatmaps showing Cd8b1 expression. Middle: Volcano plots show DEG between mutant and WT CD8 T cells, plotted according to Log2FC (mutant/WT)] against -log(FDR). Genes up- and down-regulated in mutant are denoted in red and blue, respectively. Right: Tables show genes up- or down regulated in mutant CD8 T cells by 40% or more. Log2FC values are presented along with FDR-adjusted q-values <0.05.
Abbreviations
Anti-nuclear autoantibody (ANA), Differentially-expressed genes (DEG), Chronic mucocutaneous candidiasis (CMC), DNA-binding domain (DBD), Gain-of-function (GOF), Germinal center (GC), Inducible co-stimulator (ICOS), Interferon (IFN), Interferon-stimulated genes (ISG), Memory phenotype (MP), Programmed death1 (PD1), Single-cell RNA-sequencing (scRNA-Seq), Systemic lupus erythematosus (SLE), Specific-pathogen free (SPF), Signal transducer and activator of transcription (STAT), T cell receptor (TCR), T-follicular helper (Tfh), T-helper 1 (Th1), Type 1 diabetes (T1D).
References
1. Stark GR, Darnell JE. The JAK-STAT pathway at twenty. Immunity (2012) 36(4):503–14. doi: 10.1016/j.immuni.2012.03.013
2. Hirahara K, Onodera A, Villarino AV, Bonelli M, Sciumè G, Laurence A, et al. Asymmetric action of STAT transcription factors drives transcriptional outputs and cytokine specificity. Immunity (2015) 42(5):877–89. doi: 10.1016/j.immuni.2015.04.014
3. Chatterjee-Kishore M, Wright KL, Ting JP, Stark GR. How Stat1 mediates constitutive gene expression: a complex of unphosphorylated Stat1 and IRF1 supports transcription of the LMP2 gene. EMBO J (2000) 19(15):4111–22. doi: 10.1093/emboj/19.15.4111
4. Cheon H, Stark GR. Unphosphorylated STAT1 prolongs the expression of interferon-induced immune regulatory genes. Proc Natl Acad Sci U S A (2009) 106(23):9373–8. doi: 10.1073/pnas.0903487106
5. Majoros A, Platanitis E, Szappanos D, Cheon H, Vogl C, Shukla P, et al. Response to interferons and antibacterial innate immunity in the absence of tyrosine-phosphorylated STAT1. EMBO Rep (2016) 17(3):367–82. doi: 10.15252/embr.201540726
6. Michalska A, Blaszczyk K, Wesoly J, Bluyssen HAR. A positive feedback amplifier circuit that regulates interferon (IFN)-stimulated gene expression and controls type I and type II IFN responses. Front Immunol (2018) 9:1135. doi: 10.3389/fimmu.2018.01135
7. Wang BX, Fish EN. Global virus outbreaks: interferons as 1st responders. Semin Immunol (2019) 43:101300. doi: 10.1016/j.smim.2019.101300
8. Burke JD, Young HA. IFN-γ: a cytokine at the right time, is in the right place. Semin Immunol (2019) 43:101280. doi: 10.1016/j.smim.2019.05.002
9. Choi YS, Eto D, Yang JA, Lao C, Crotty S. Cutting edge: STAT1 is required for IL-6–mediated Bcl6 induction for early follicular helper cell differentiation. J Immunol (2013) 190(7):3049–53. doi: 10.4049/jimmunol.1203032
10. Stepkowski SM, Chen W, Ross JA, Nagy ZS, Kirken RA. STAT3: an important regulator of multiple cytokine functions. Transplantation (2008) 85(10):1372–7. doi: 10.1097/TP.0b013e3181739d25
11. Teague TK, Schaefer BC, Hildeman D, Bender J, Mitchell T, Kappler JW, et al. Activation-induced inhibition of interleukin 6–mediated T cell survival and signal transducer and activator of transcription 1 signaling. J Exp Med (2000) 191(6):915–26. doi: 10.1084/jem.191.6.915
12. Zheng J, van de Veerdonk FL, Crossland KL, Smeekens SP, Chan CM, Al Shehri T, et al. Gain-of-function STAT1 mutations impair STAT3 activity in patients with chronic mucocutaneous candidiasis (CMC). Eur J Immunol (2015) 45(10):2834–46. doi: 10.1002/eji.201445344
13. Toubiana J, Okada S, Hiller J, Oleastro M, Lagos Gomez M, Aldave Becerra JC, et al. Heterozygous STAT1 gain-of-function mutations underlie an unexpectedly broad clinical phenotype. Blood (2016) 127(25):3154–64. doi: 10.1182/blood-2015-11-679902
14. Depner M, Fuchs S, Raabe J, Frede N, Glocker C, Doffinger R, et al. The extended clinical phenotype of 26 patients with chronic mucocutaneous candidiasis due to gain-of-Function mutations in STAT1. J Clin Immunol (2016) 36(1):73–84. doi: 10.1007/s10875-015-0214-9
15. Liu L, Okada S, Kong XF, Kreins AY, Cypowyj S, Abhyankar A, et al. Gain-of-function human STAT1 mutations impair IL-17 immunity and underlie chronic mucocutaneous candidiasis. J Exp Med (2011) 208(8):1635–48. doi: 10.1084/jem.20110958
16. van de Veerdonk FL, Plantinga TS, Hoischen A, Smeekens SP, Joosten LAB, Gilissen C, et al. STAT1 mutations in autosomal dominant chronic mucocutaneous candidiasis. N Engl J Med (2011) 365(1):54–61. doi: 10.1056/NEJMoa1100102
17. Sampaio EP, Hsu AP, Pechacek J, Bax HI, Dias DL, Paulson ML, et al. Signal transducer and activator of transcription 1 (STAT1) gain-of-function mutations and disseminated coccidioidomycosis and histoplasmosis. J Allergy Clin Immunol (2013) 131(6):1624-1634.e17. doi: 10.1016/j.jaci.2013.01.052
18. Uzel G, Sampaio EP, Lawrence MG, Hsu AP, Hackett M, Dorsey MJ, et al. Dominant gain-of-function STAT1 mutations in FOXP3 wild-type immune dysregulation–polyendocrinopathy–enteropathy–X-linked–like syndrome. J Allergy Clin Immunol (2013) 131(6):1611–23. doi: 10.1016/j.jaci.2012.11.054
19. Verbsky JW, Chatila TA. Immune dysregulation, polyendocrinopathy, enteropathy, X-linked (IPEX) and IPEX-related disorders: an evolving web of heritable autoimmune diseases. Curr Opin Pediatr (2013) 25(6):708–14. doi: 10.1097/MOP.0000000000000029
20. Scott O, Lindsay K, Erwood S, Mollica A, Roifman CM, Cohn RD, et al. STAT1 gain-of-function heterozygous cell models reveal diverse interferon-signature gene transcriptional responses. NPJ Genom Med (2021) 6(1):34. doi: 10.1038/s41525-021-00196-7
21. Scott O, Dadi H, Vong L, Pasternak Y, Garkaby J, Willett Pachul J, et al. DNA-Binding domain mutations confer severe outcome at an early age among STAT1 gain-of-function patients. Pediatr Allergy Immunol (2022) 33(1):e13694. doi: 10.1111/pai.13694
22. Rubtsova K, Marrack P, Rubtsov AV. Sexual dimorphism in autoimmunity. J Clin Invest (2015) 125(6):2187–93. doi: 10.1172/JCI78082
23. Lazarevic V, Glimcher LH, Lord GM. T-Bet: a bridge between innate and adaptive immunity. Nat Rev Immunol (2013) 13(11):777–89. doi: 10.1038/nri3536
24. Imam T, Park S, Kaplan MH, Olson MR. Effector T helper cell subsets in inflammatory bowel diseases. Front Immunol (2018) 9. doi: 10.3389/fimmu.2018.01212
25. Skapenko A, Leipe J, Lipsky PE, Schulze-Koops H. The role of the T cell in autoimmune inflammation. Arthr Res Ther (2005) 7(2):S4. doi: 10.1186/ar1703
26. Baris S, Alroqi F, Kiykim A, Karakoc-Aydiner E, Ogulur I, Ozen A, et al. Severe early-onset combined immunodeficiency due to heterozygous gain-of-Function mutations in STAT1. J Clin Immunol (2016) 36(7):641–8. doi: 10.1007/s10875-016-0312-3
27. Weinacht KG, Charbonnier LM, Alroqi F, Plant A, Qiao Q, Wu H, et al. Ruxolitinib reverses dysregulated T helper cell responses and controls autoimmunity caused by a novel signal transducer and activator of transcription 1 (STAT1) gain-of-function mutation. J Allergy Clin Immunol (2017) 139(5):1629–40. doi: 10.1016/j.jaci.2016.11.022
28. Chen X, Xu Q, Li X, Wang L, Yang L, Chen Z, et al. Molecular and phenotypic characterization of nine patients with STAT1 GOF mutations in China. J Clin Immunol (2020) 40(1):82–95. doi: 10.1007/s10875-019-00688-3
29. Bloomfield M, Kanderová V, Paračková Z, Vrabcová P, Svatoň M, Froňková E, et al. Utility of ruxolitinib in a child with chronic mucocutaneous candidiasis caused by a novel STAT1 gain-of-Function mutation. J Clin Immunol (2018) 38(5):589–601. doi: 10.1007/s10875-018-0519-6
30. Qin L, Waseem TC, Sahoo A, Bieerkehazhi S, Zhou H, Galkina EV, et al. Insights into the molecular mechanisms of T follicular helper-mediated immunity and pathology. Front Immunol (2018) 9:1884. doi: 10.3389/fimmu.2018.01884
31. Crotty S. T Follicular helper cell biology: a decade of discovery and diseases. Immunity (2019) 50(5):1132–48. doi: 10.1016/j.immuni.2019.04.011
32. Gensous N, Charrier M, Duluc D, Contin-Bordes C, Truchetet ME, Lazaro E, et al. T Follicular helper cells in autoimmune disorders. Front Immunol (2018) 9:1637. doi: 10.3389/fimmu.2018.01637
33. Wu T, Shin HM, Moseman EA, Ji Y, Huang B, Harly C, et al. TCF1 is required for the T follicular helper cell response to viral infection. Cell Rep (2015) 12(12):2099–110. doi: 10.1016/j.celrep.2015.08.049
34. Li F, Zhao X, Zhang Y, Shao P, Ma X, Paradee WJ, et al. TFH cells depend on Tcf1-intrinsic HDAC activity to suppress CTLA4 and guard b-cell help function. Proc Nat Acad Sci (2021) 118(2):e2014562118. doi: 10.1073/pnas.2014562118
35. Choi YS, Gullicksrud JA, Xing S, Zeng Z, Shan Q, Li F, et al. LEF-1 and TCF-1 orchestrate TFH differentiation by regulating differentiation circuits upstream of the transcriptional repressor Bcl6. Nat Immunol (2015) 16(9):980–90. doi: 10.1038/ni.3226
36. Breuer O, Daum H, Cohen-Cymberknoh M, Unger S, Shoseyov D, Stepensky P, et al. Autosomal dominant gain of function STAT1 mutation and severe bronchiectasis. Respir Med (2017) 126:39–45. doi: 10.1016/j.rmed.2017.03.018
37. Cepika AM, Sato Y, Liu JMH, Uyeda MJ, Bacchetta R, Roncarolo MG. Tregopathies: monogenic diseases resulting in regulatory T-cell deficiency. J Allergy Clin Immunol (2018) 142(6):1679–95. doi: 10.1016/j.jaci.2018.10.026
38. Shevyrev D, Tereshchenko V. Treg heterogeneity, function, and homeostasis. Front Immunol (2020) 10. doi: 10.3389/fimmu.2019.03100
39. Sharfe N, Nahum A, Newell A, Dadi H, Ngan B, Pereira SL, et al. Fatal combined immunodeficiency associated with heterozygous mutation in STAT1. J Allergy Clin Immunol (2014) 133(3):807–17. doi: 10.1016/j.jaci.2013.09.032
40. Tanimura M, Dohi K, Hirayama M, Sato Y, Sugiura E, Nakajima H, et al. Recurrent inflammatory aortic aneurysms in chronic mucocutaneous candidiasis with a gain-of-function STAT1 mutation. Int J Cardiol (2015) 196:88–90. doi: 10.1016/j.ijcard.2015.05.183
41. Gu B, Posfai E, Rossant J. Efficient generation of targeted large insertions by microinjection into two-cell-stage mouse embryos. Nat Biotechnol (2018) 36(7):632–7. doi: 10.1038/nbt.4166
42. Fortin J, Chiang MF, Meydan C, Foox J, Ramachandran P, Leca J, et al. Distinct and opposite effects of leukemogenic idh and Tet2 mutations in hematopoietic stem and progenitor cells. Proc Natl Acad Sci U S A (2023) 120(4):e2208176120. doi: 10.1073/pnas.2208176120
43. Fread KI, Strickland WD, Nolan GP, Zunder ER. AN UPDATED DEBARCODING TOOL FOR MASS CYTOMETRY WITH CELL TYPE-SPECIFIC AND CELL SAMPLE-SPECIFIC STRINGENCY ADJUSTMENT. Pac Symp Biocomput (2017) 22:588–98. doi: 10.1142/9789813207813_0054
44. Hao Y, Hao S, Andersen-Nissen E, Mauck WM, Zheng S, Butler A, et al. Integrated analysis of multimodal single-cell data. Cell (2021) 184(13):3573-3587.e29. doi: 10.1016/j.cell.2021.04.048
45. Heng TSP, Painter MW, Elpek K, Lukacs-Kornek V, Mauermann N, Turley SJ, et al. The immunological genome project: networks of gene expression in immune cells. Nat Immunol (2008) 9(10):1091–4. doi: 10.1038/ni1008-1091
46. Zimmerman O, Olbrich P, Freeman AF, Rosen LB, Uzel G, Zerbe CS, et al. STAT1 gain-of-Function mutations cause high total STAT1 levels with normal dephosphorylation. Front Immunol (2019) 10:1433. doi: 10.3389/fimmu.2019.01433
47. Vinuesa CG, Cook MC, Angelucci C, Athanasopoulos V, Rui L, Hill KM, et al. A RING-type ubiquitin ligase family member required to repress follicular helper T cells and autoimmunity. Nature (2005) 435(7041):452–8. doi: 10.1038/nature03555
48. Yang BH, Wang K, Wan S, Liang Y, Yuan X, Dong Y, et al. TCF1 and LEF1 control treg competitive survival and tfr development to prevent autoimmune diseases. Cell Rep (2019) 27(12):3629–45. doi: 10.1016/j.celrep.2019.05.061
49. Snapper CM, Peschel C, Paul WE. IFN-gamma stimulates IgG2a secretion by murine b cells stimulated with bacterial lipopolysaccharide. J Immunol (1988) 140(7):2121–7. doi: 10.4049/jimmunol.140.7.2121
50. Meroni PL, Schur PH. ANA screening: an old test with new recommendations. Ann Rheum Dis (2010) 69(8):1420–2. doi: 10.1136/ard.2009.127100
51. Markle JGM, Mortin-Toth S, Wong ASL, Geng L, Hayday A, Danska JS. γδT cells are essential effectors of type 1 diabetes in the NOD mouse model. J Immunol (2013) 190(11):5392–401. doi: 10.4049/jimmunol.1203502
52. Kawabe T, Yi J, Sprent J. Homeostasis of naive and memory T lymphocytes. Cold Spring Harb Perspect Biol (2021) 13(9):a037879. doi: 10.1101/cshperspect.a037879
53. Keller B, Strohmeier V, Harder I, Unger S, Payne KJ, Andrieux G, et al. The expansion of human T-bethighCD21low b cells is T cell dependent. Sci Immunol (2021) 6(64):eabh0891. doi: 10.1126/sciimmunol.abh0891
54. Cano-Gamez E, Soskic B, Roumeliotis TI, So E, Smyth DJ, Baldrighi M, et al. Single-cell transcriptomics identifies an effectorness gradient shaping the response of CD4+ T cells to cytokines. Nat Commun (2020) 11(1):1801. doi: 10.1038/s41467-020-15543-y
55. Danilo M, Chennupati V, Silva JG, Siegert S, Held W. Suppression of Tcf1 by inflammatory cytokines facilitates effector CD8 T cell differentiation. Cell Rep (2018) 22(8):2107–17. doi: 10.1016/j.celrep.2018.01.072
56. Chen L, Flies DB. Molecular mechanisms of T cell co-stimulation and co-inhibition. Nat Rev Immunol (2013) 13(4):227–42. doi: 10.1038/nri3405
57. Serre K, Bénézech C, Desanti G, Bobat S, Toellner KM, Bird R, et al. Helios Is associated with CD4 T cells differentiating to T helper 2 and follicular helper T cells In vivo independently of Foxp3 expression. PloS One (2011) 6(6):e20731. doi: 10.1371/journal.pone.0020731
58. Hale JS, Youngblood B, Latner DR, Mohammed AUR, Ye L, Akondy RS, et al. Distinct memory CD4+ T cells with commitment to T follicular helper- and T helper 1-cell lineages are generated after acute viral infection. Immunity (2013) 38(4):805–17. doi: 10.1016/j.immuni.2013.02.020
59. Ly A, Liao Y, Pietrzak H, Ioannidis LJ, Sidwell T, Gloury R, et al. Transcription factor T-bet in b cells modulates germinal center polarization and antibody affinity maturation in response to malaria. Cell Rep (2019) 29(8):2257–2269.e6. doi: 10.1016/j.celrep.2019.10.087
60. Hao Z, Duncan GS, Seagal J, Su YW, Hong C, Haight J, et al. Fas receptor expression in germinal-center b cells is essential for T and b lymphocyte homeostasis. Immunity (2008) 29(4):615–27. doi: 10.1016/j.immuni.2008.07.016
61. Wang H, Jain S, Li P, Lin JX, Oh J, Qi C, et al. Transcription factors IRF8 and PU.1 are required for follicular b cell development and BCL6-driven germinal center responses. Proc Natl Acad Sci USA (2019) 116(19):9511–20. doi: 10.1073/pnas.1901258116
62. Zaretsky I, Atrakchi O, Mazor RD, Stoler-Barak L, Biram A, Feigelson SW, et al. ICAMs support b cell interactions with T follicular helper cells and promote clonal selection. J Exp Med (2017) 214(11):3435–48. doi: 10.1084/jem.20171129
63. Cenerenti M, Saillard M, Romero P, Jandus C. The era of cytotoxic CD4 T cells. Front Immunol (2022) 13. doi: 10.3389/fimmu.2022.867189
64. Qian W, Miner CA, Ingle H, Platt DJ, Baldridge MT, Miner JJ. A human STAT1 gain-of-Function mutation impairs CD8 + T cell responses against gammaherpesvirus 68. J Virol (2019) 93(19):e00307–19. doi: 10.1128/JVI.00307-19
65. Tamaura M, Satoh-Takayama N, Tsumura M, Sasaki T, Goda S, Kageyama T, et al. Human gain-of-function STAT1 mutation disturbs IL-17 immunity in mice. Int Immunol (2020) 32(4):259–72. doi: 10.1093/intimm/dxz079
66. Laffont S, Guéry JC. Deconstructing the sex bias in allergy and autoimmunity: from sex hormones and beyond. Adv Immunol (2019) 142:35–64. doi: 10.1016/bs.ai.2019.04.001
67. Young NA, Valiente GR, Hampton JM, Wu LC, Burd CJ, Willis WL, et al. Estrogen-regulated STAT1 activation promotes TLR8 expression to facilitate signaling via microRNA-21 in systemic lupus erythematosus. Clin Immunol (2017) 176:12–22. doi: 10.1016/j.clim.2016.12.005
68. Romberg N, Morbach H, Lawrence MG, Kim S, Kang I, Holland SM, et al. Gain-of-function STAT1 mutations are associated with PD-L1 overexpression and a defect in b-cell survival. J Allergy Clin Immunol (2013) 131(6):1691–3. doi: 10.1016/j.jaci.2013.01.004
69. Zhang Y, Ma CA, Lawrence MG, Break TJ, O’Connell MP, Lyons JJ, et al. PD-L1 up-regulation restrains Th17 cell differentiation in STAT3 loss- and STAT1 gain-of-function patients. J Exp Med (2017) 214(9):2523–33. doi: 10.1084/jem.20161427
70. Choi J, Crotty S. Bcl6-mediated transcriptional regulation of follicular helper T cells (TFH). Trends Immunol (2021) 42(4):336–49. doi: 10.1016/j.it.2021.02.002
71. Lee SK, Silva DG, Martin JL, Pratama A, Hu X, Chang PP, et al. Interferon-γ excess leads to pathogenic accumulation of follicular helper T cells and germinal centers. Immunity (2012) 37(5):880–92. doi: 10.1016/j.immuni.2012.10.010
72. Nakayamada S, Kanno Y, Takahashi H, Jankovic D, Lu KT, Johnson TA, et al. Early Th1 cell differentiation is marked by a tfh cell-like transition. Immunity (2011) 35(6):919–31. doi: 10.1016/j.immuni.2011.11.012
73. Oestreich KJ, Mohn SE, Weinmann AS. Molecular mechanisms that control the expression and activity of bcl-6 in TH1 cells to regulate flexibility with a TFH-like gene profile. Nat Immunol (2012) 13(4):405–11. doi: 10.1038/ni.2242
74. Weinstein JS, Laidlaw BJ, Lu Y, Wang JK, Schulz VP, Li N, et al. STAT4 and T-bet control follicular helper T cell development in viral infections. J Exp Med (2018) 215(1):337–55. doi: 10.1084/jem.20170457
75. Fang D, Cui K, Mao K, Hu G, Li R, Zheng M, et al. Transient T-bet expression functionally specifies a distinct T follicular helper subset. J Exp Med (2018) 215(11):2705–14. doi: 10.1084/jem.20180927
76. Papillion A, Powell MD, Chisolm DA, Bachus H, Fuller MJ, Weinmann AS, et al. Inhibition of IL-2 responsiveness by IL-6 is required for the generation of GC-TFH cells. Sci Immunol (2019) 4(39):eaaw7636. doi: 10.1126/sciimmunol.aaw7636
77. Osum KC, Jenkins MK. Toward a general model of CD4+ T cell subset specification and memory cell formation. Immunity (2023) 56(3):475–84. doi: 10.1016/j.immuni.2023.02.010
Keywords: STAT1, autoimmunity, chronic activation, T helper, immune dysregulation, Specific pathogen free (SPF), mouse model, gain of function (GOF)
Citation: Scott O, Visuvanathan S, Reddy E, Mahamed D, Gu B, Roifman CM, Cohn RD, Guidos CJ and Ivakine EA (2023) The human Stat1 gain-of-function T385M mutation causes expansion of activated T-follicular helper/T-helper 1-like CD4 T cells and sex-biased autoimmunity in specific pathogen-free mice. Front. Immunol. 14:1183273. doi: 10.3389/fimmu.2023.1183273
Received: 09 March 2023; Accepted: 10 May 2023;
Published: 19 May 2023.
Edited by:
Anna Sediva, University Hospital in Motol, CzechiaCopyright © 2023 Scott, Visuvanathan, Reddy, Mahamed, Gu, Roifman, Cohn, Guidos and Ivakine. This is an open-access article distributed under the terms of the Creative Commons Attribution License (CC BY). The use, distribution or reproduction in other forums is permitted, provided the original author(s) and the copyright owner(s) are credited and that the original publication in this journal is cited, in accordance with accepted academic practice. No use, distribution or reproduction is permitted which does not comply with these terms.
*Correspondence: Cynthia J. Guidos, Q3ludGhpYS5ndWlkb3NAc2lja2tpZHMuY2E=; Evgueni A. Ivakine, emhlbnlhLml2YWtpbmVAc2lja2tpZHMuY2E=
†These authors have contributed equally to this work and share senior authorship