 Cameron W. Paterson1,2,3
 Craig M. Coopersmith
 Mandy L. Ford
- 1Department of Surgery, Emory University School of Medicine, Atlanta, GA, United States
- 2Medical Corps, United States Navy, Navy Reserve Officer Training Corps (NROTC), Atlanta, GA, United States
- 3Emory Critical Care Center, Emory University School of Medicine, Atlanta, GA, United States
- 4Emory Transplant Center, Emory University School of Medicine, Atlanta, GA, United States
Introduction: Chronic alcohol use poses significant negative consequences to public health and, among its many biologic effects, is associated with significant T cell dysregulation within the adaptive immune system that has yet to be fully characterized. Novel, automated strategies for high dimensional flow cytometric analysis of the immune system are rapidly improving researchers’ ability to detect and characterize rare cell types.
Methods: Using a murine model of chronic alcohol ingestion in conjunction with viSNE and CITRUS analysis tools, we performed a machine-driven, exploratory analysis comparing rare splenic subpopulations within the conventional CD4+, regulatory CD4+ and CD8+ T cell compartments between alcohol- and water-fed animals.
Results: While there were no differences in the absolute numbers of bulk CD3+ T cells, bulk CD4+ T cells, bulk CD8+ T cells, Foxp3- CD4+ conventional T cells (Tconv) or Foxp3+ CD4+ regulatory T cells (Treg), we identified populations of naïve Helios+ CD4+Tconv and naïve CD103+ CD8+ splenic T cells that were decreased in chronically alcohol exposed mice versus water-fed controls. In addition, we identified increased CD69+ Treg and decreased CD103+ effector regulatory T cell (eTreg) subsets in conjunction with increased frequency of a population that may represent a transitional phenotype between central regulatory T cell (cTreg) and eTreg.
Discussion: These data provide further resolution into the character of decreased naïve T cell populations known to be present in alcohol exposed mice, as well as describe alterations in effector regulatory T cell phenotypes associated with the pathogenesis of chronic alcohol-induced immune dysfunction.
Introduction
Alcohol use disorder (AUD) affects approximately 33 million individuals in the United States (1) and excessive alcohol consumption is a leading cause of premature mortality accounting for 1-in-10 deaths among working-age adults (2). Among its numerous effects, chronic alcohol exposure is associated with a variety of inflammatory, infectious and malignant pathologies that reflect both pro- and anti-inflammatory immune dysregulation (3). Our laboratory has investigated adaptive immune responses in murine models of chronic alcohol exposure followed by sepsis, and reported that alcohol-drinking mice exhibit increased sepsis mortality as compared to water-drinking mice (4). Specifically, we reported a number of T cell-specific perturbations, including altered subset frequencies (4), impaired activation (5), and enhanced proinflammatory cytokine release (5, 6). Other investigators have also noted T cell alterations in response to chronic alcohol exposure alone (7), including significant leukopenia in both humans (8) and rodents (9, 10) resulting in T cell homeostatic proliferation and, secondarily, an increase in peripheral memory T cells and a decrease in naïve T cells (11–14). Similarly, T cells of alcohol drinking humans (12, 15, 16) and mice (13, 14) show increased activation and inflammatory cytokine release consistent with a host phenotype marked by chronic inflammation (7). T cell subsets show differential responses to chronic alcohol exposure, with studies demonstrating loss of CD4+ T cells (17, 18) and overactivation of CD8+ T cells (18), as well as decreased numbers of regulatory T cells (Treg) in the dermis (19). Investigators have also reported that alcohol exposure impairs murine T cell tissue extravasation in response to inflammatory stimuli (10, 20), while in vivo (21) and in vitro (21, 22) human studies have shown alcohol-exposed T cells to undergo enhanced activation-induced cell death (23). Alcohol has additionally been shown to interfere with thymocyte development (7) and to predispose CD4+ T cells to Th2 polarization and suppress Th1 and Th17 responses (24). T cell-to-antigen presenting cell (APC) signaling is also impaired as a result of co-stimulatory molecule downregulation following alcohol exposure (13, 24, 25).
Flow cytometry is an indispensable tool for characterizing immune cells (26) that traditionally relies on biaxial plots to visualize expression of up to two parameters simultaneously, on which gates can be drawn to delineate specific subpopulations (26). However, this approach has critical limitations including logistical barriers to manual analysis of all possible comparison permutations, particularly as new generations of cytometers facilitate measurement of over twenty parameters simultaneously (26). Additionally, user-driven gating approaches rely on prior knowledge of anticipated subpopulations is itself inherently biased (26). Recent advances in cytometry, however, have introduced a series of computational analysis approaches that bypass manual gating and allow for unbiased, high dimensional analysis of single-cell cytometry data (26). These approaches can be categorized by their degree of supervision (supervised vs. unsupervised) and use of a clustering versus dimensionality-reduction strategy, which can be further classified as linear or nonlinear (27). T-stochastic neighbor embedding (t-SNE) (28) and its derivative used for data visualization-viSNE (29)-is a popular nonlinear algorithm that analyzes the similarity of cells in high-dimension before reducing them into an easily visualized two-dimensional scatter plot where their spatial proximity is reflective of their high dimensional relationship and allows for visualization of subpopulations as small as 0.25% (26). Cluster identification, characterization, and regression (CITRUS) (30) is an unsupervised clustering-based algorithm (26, 27, 31) that hierarchically groups phenotypically similar cells together into clusters with a minimum frequency threshold set by the user followed by calculation of cluster characteristics and, finally, a regularized classification model to identify stratifying clusters that predict a user-defined experimental endpoint (26).
Our laboratory has previously used a predecessor to CITRUS - spanning-tree progression analysis of density-normalized events (SPADE)- that follows similar principles but lacks the ability to compare experimental endpoints (27) in order perform high dimensional characterization of CD4+ T cells in tumor-bearing mice subject to sepsis (32). Similarly, other groups have effectively utilized CITRUS in a variety of disease-specific applications for T cell analysis (33–36). Here, we sought to apply high dimensional analysis techniques to characterize T cell alterations resulting from chronic alcohol exposure and explore the effect of chronic alcohol exposure on both effector and regulatory T cell subsets using this machine-based analysis strategy. We aimed to characterize rare T cell subpopulations in the CD8+, conventional CD4+ (CD4+ Tconv) and regulatory CD4+ (CD4+ Treg) compartments in a murine model of chronic alcohol exposure using an iterative series of viSNE and CITRUS analyses and multimodal data visualization strategies similar to those described by Polikowsky et al. (33). To accomplish this, we employed an exploratory panel of T cell markers, including those delineating lineage (CD3, CD4, CD8, Foxp3), trafficking behavior (CCR4, CD103, CD62L), activation (CD25, CD69, Helios), co-stimulation (CD28, GITR, ICOS), co-inhibition (CTLA-4, KLRG1) immunologic memory (CD44, Ly6C), and proliferation (Ki67).
Materials and methods
Animals
Male and female 6-week-old B6 mice were purchased from Charles River Laboratories. This study was approved by the Emory University Institutional Animal Care and Use Committee (IACUC) [Protocol: PROTO201800161] and animal care was performed in accordance with all relevant IACUC and federal rules and guidelines. Animals randomized to either water (H2O) or alcohol (EtOH) drinking groups. Animals were sacrificed by isofluorane inhalation plus cervical dislocation at the conclusion of the 12-week drinking period for splenocyte analysis.
Chronic alcohol ingestion model
Animals were equally randomized to receive either a water or alcohol diet. Animals in the alcohol arm received increasing concentrations of alcohol-in-water from 0% to 20% (by volume) over a two-week period (5% for 5 days, 10% for 5 days, 15% for 5 days), followed by 20% alcohol in water for ten additional weeks with weekly replacement of the alcohol solution. Water drinking animals received standard drinking water for an equivalent duration of time. Previous work from our lab has demonstrated that this protocol does not alter liver histology, renal function (6, 37), or body weight (4), and achieves a blood alcohol concentration (BAC) of 28mg/dl (4), which is approximately the BAC achieved in a 150 lb. person after one alcoholic drink.
Flow cytometry
Animals were sacrificed and their spleens harvested at the conclusion of the 12-week drinking protocol. Splenocytes were first treated with Fc blocking agent (TruStain FcX, Biolegend). Surface staining was performed using anti-CD4-BUV395 (GK1.5, BD), anti-CD3-BUV496 (145-2c11, BD), anti-CD8-BUV737 (53-67, BD), anti-CD44-BUV805 (IM7, BD), anti-CCR4-eFluor450 (2G12, Biolegend), anti-Ly6C-BV510 (HK1.4, Biolegend), anti-CD103-BV605 (2E7, Biolegend), anti-CD69-BV650 (H1.2F3, Biolegend), anti-ICOS-BV711 (C398.4A, Biolegend), anti-GITR-BV786 (DTA-1, BD), anti-KLRG1-FITC (2F1/KLRG1, Biolegend), anti-CD62L-PE-Dazzle (MEL-14, Biolegend), anti-CD28-PE-Cy7 (E18, Biolegend), and anti-CD25-APC-Cy7 (PC61, Biolegend). Cells were then fixed and permeabilized (Foxp3/Transcription Factor Fixation/Permeabilization Concentrate and Diluent, eBioscience).
Intracellular/intranuclear staining was performed using the BD Foxp3 Kit per manufacturer’s instruction and anti-Helios-PerCP-Cy5.5 (22F6, Biolegend), anti-CTLA-4-PE (UC10-4B9, Biolegend), anti-Foxp3-APC (FJK-16s, eBioscience), and anti-Ki67-Alexa700 (16A8, Biolegend). CTLA-4 was measured as an intracellular stain because it is rapidly internalized/recycled on the plasma membrane, making detection of the surface protein difficult (38–40). Accucheck Counting Beads (Thermo Fisher Scientific) were added to calculate absolute T cell numbers per spleen. An LSRFortessa flow cytometer (BD Biosciences) was used to collect all samples. Data was analyzed using FlowJo v10.6 software (FlowJo, LLC) prior to transfer to the Cytobank platform (Cytobank.org).
Cytobank analysis
Traditional flow cytometry gating techniques were applied to isolate lymphocytes, followed by single cells and CD3+ T cells using FlowJo v10.6 (FlowJo, LLC). CD3+ T cells were then exported as new FCS files with applied internal compensation and uploaded to the Cytobank (Cytobank.org) platform (31). Within Cytobank, the following protocol was followed using strategies adapted from Polikowsky et al. (33).
Data preparation
Samples were examined for data tidying and quality control. Arcsinh transformations were applied and scaling adjusted to achieve appropriate marker display on each channel. Staining was examined to confirm presence of a positive signal for each channel. Pre-gating. Within Cytobank, CD3+ cells were further manually gated to facilitate downstream analysis of three distinct T cell populations: 1. CD8+CD4- (CD8+ T cells), 2. CD8-CD4+Foxp3- (CD4+ TConv), and 3. CD8-CD4+Foxp3+ (CD4+ Treg) (as shown in Figure 1).
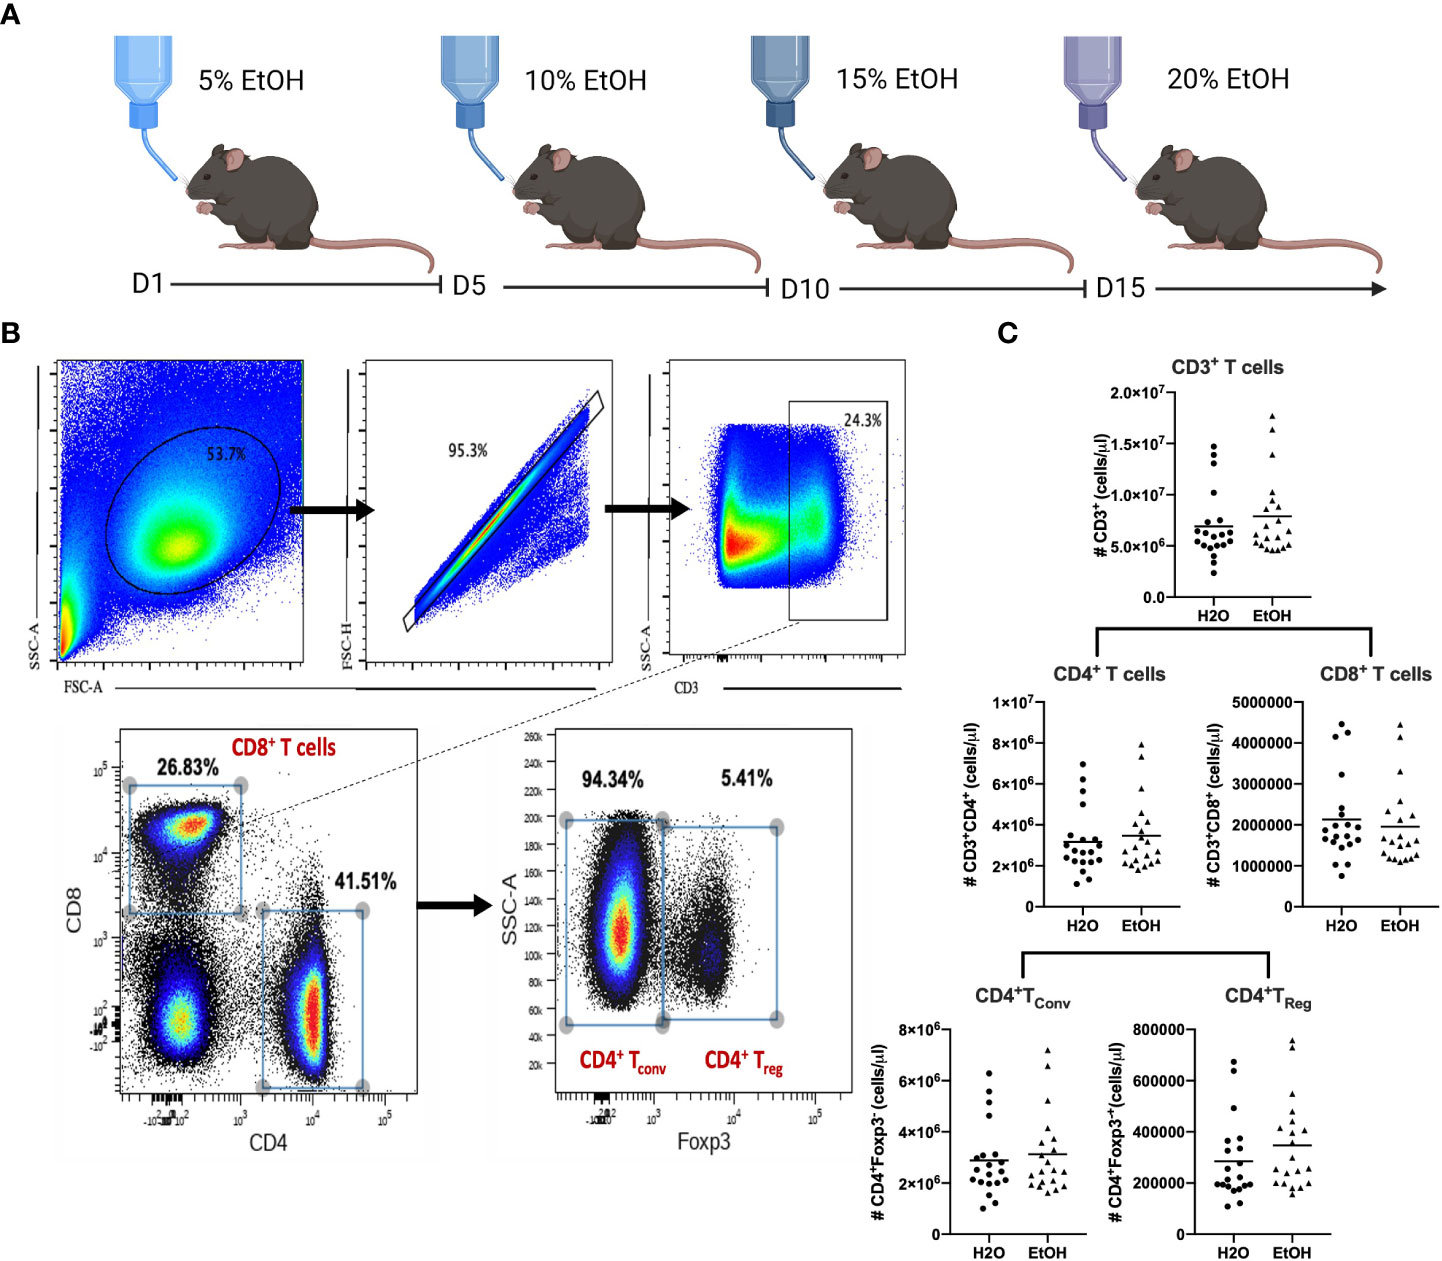
Figure 1 Chronic alcohol exposure does not impact absolute numbers of CD4+ or CD8+ T cells. (A), Mice (n=20/group) were subjected to 12-weeks of an alcohol or water diet as described in Materials and Methods followed by sacrifice and collection of splenocytes for flow cytometry. (B), Gating strategy to identify conventional CD4+ and CD8+ T cells as well as Foxp3+ Treg. (C), The number of CD3+ T cells, CD8+ T cells, CD4+ T cells, CD4+Tconv or CD4+TReg did not differ between water- vs. alcohol-exposed mice. Data were tested for normality and compared with either t test or Mann-Whitney test.
Data visualization using viSNE
viSNE analysis was performed for each of the three T cell populations. For analysis of CD8+ T cells and CD4+ TConv, downsampling was performed to 20,000 events per sample to allow detection of subpopulations as small as 2% with a 5% coefficient of variation (CV) (33, 41). CD4+ Treg were downsampled to 4000 events to allow detection of 10% subpopulations at a CV of 5%. Samples lacking an adequate number of respective events were excluded. All available markers were selected for clustering, with the exception of CD3/CD8/CD4 (for CD8+ T cells) and CD3/CD8/CD4/Foxp3 (for CD4+ TConv and CD4+ Treg). Perplexity was set to 70, theta to 0.5, and iterations set to 7500 for CD8+ T cells and CD4+ TConv and 2000 for CD4+ TReg. Individual sample files from the viSNE analysis for each T cell population were downloaded from Cytobank as FCS files and concatenated into a single viSNE file using the R script (R-project.org) made available on the Cytobank platform and these files were then loaded into Cytobank for further analysis and visualization.
Clustering and predictive biomarker model development using CITRUS
To identify cell clusters predictive of water versus alcohol drinking animals, we utilized the CITRUS algorithm available within Cytobank. The same downsampled events used to generate each viSNE analysis for a respective T cell population were also used to perform the CITRUS modeling. Samples were assigned into water or alcohol-fed groups as appropriate and equal event sampling was selected for the analyses (i.e. 20,000 events/sample for CD8+ T cells and CD4+ TConv and 4,000 events/sample for CD4+ TReg). The same channels used for each respective viSNE analyses were selected for clustering and cluster characterization was performed by abundance. Minimum cluster size was again set to 2% for CD8+ T cells and CD4+ TConv, and 10% for TReg. Cross validation folds were set to 10 and scales were selected for normalization. L1-Penalized Regression (LASSO) was selected as the association model for biomarker prediction (note: false discovery rate settings do not influence the analysis when using the LASSO model). This process was repeated 3 times for both viSNE maps of each respective T cell subset, yielding a total of 6 CITRUS runs each for CD8+ T cells, CD4+TConv and CD4+TReg.
Selecting reproducible clusters of interest
For each T cell population, model error rate plots from the six CITRUS runs were examined to ensure an acceptable number of features and low cross validation error rate were generated. For each run the “CV.MIN” model was selected for analysis. Histograms from the “clusters” CITRUS output file were visually compared and clusters with similar phenotypes identified consistently across runs were selected for downstream analysis. If two or more of the selected clusters were identified as having “parent-child” relationships on the CITRUS feature plots, then only the parent cluster was used for downstream analysis unless the parent cluster split into more than one distinct branch, in which case only the child clusters were used for downstream analysis. The files for the selected clusters of interest for each T cell population were concatenated and their spatial locations visualized on their respective viSNE plots.
Phenotyping clusters of interest
Four multimodal data visualization strategies were employed to characterize clusters of interest that had high (hi) or low (lo) expression of a given marker. 1) observing the marker expression on the corresponding region of the cluster’s viSNE plot, 2) observing the marker expression on the corresponding region of the CITRUS marker plot, 3) observing histograms of marker expression produced by the CITRUS run, 4) observing Cytobank-generated heatmaps of concatenated median marker expression for each cluster (arcsinh transform) relative to the concatenated sample control. Clusters were assigned (hi) or (lo) expression of a given marker only if there was phenotypic agreement across 3 or more of these modalities.
viSNE visualization of validation cohort
Samples from the validation cohort for each T cell population were used to create new viSNE plots using identical settings as the original cohort, however only markers involved in characterizing the phenotype of the clusters of interest were selected for clustering the viSNE map. The results of the viSNE analysis for each T cell population were concatenated for the entire cohort as well as for the water and alcohol drinking experimental arms separately. Manual gating was performed on the viSNE plot within Cytobank to identify and isolate cell clusters with phenotypes analogous to the clusters of interest defined via CITRUS.
Analysis of validation cohort
Median marker expression heatmaps of each manually gated cluster on the validation cohort viSNE map were utilized to confirm that the phenotypes of these clusters were similar to those identified in the modeling cohort (arcsinh transformation using the concatenated total sample subset as a control). viSNE contour plots colored by density were utilized to visually compare cluster population density in the gated regions for water versus alcohol samples and confirm that the cluster behavior (increased or decreased) correlated with the behavior predicted by the CITRUS algorithm from the Modeling Cohort. Individual sample statistics (frequency) for each manually gated cluster were then exported from Cytobank and analyzed using Prism v9.0 software (GraphPad San Diego, CA) to quantitatively confirm changes to cluster frequency between alcohol and water drinking groups.
Statistical analysis
For frequency analysis of exported manually gated clusters from the validation cohort, Prism v9.0 software (GraphPad San Diego, CA) was utilized. Outliers were identified and excluded using Grubb’s test with α=0.05. Data was then tested for Gaussian distribution using the Shapiro-Wilk normality test with α=0.05. Normally distributed data was compared using a two-tailed unpaired t test while non-normal data was compared with a two-tailed Mann-Whitney test. Data are expressed as mean ± SEM. The significance level was set to α=0.05.
Results
Absolute numbers of CD8+ T cells, CD4+ conventional T cells, and CD4+ Foxp3+ Treg are not different in water vs. alcohol-exposed mice
To determine the effects of chronic alcohol exposure on the magnitude and phenotype of CD4+ and CD8+ T cells, B6 mice were exposed to increasing concentrations of alcohol ad libitum in their drinking water over a period of 12 weeks as described in Materials and Methods (Figure 1A). Animals were subsequently euthanized and splenocytes were enumerated via flow cytometry using the gating strategy shown in Figure 1B. Results indicated no differences in the absolute numbers of bulk CD3+ T cells, bulk CD4+ T cells, bulk CD8+ T cells, Foxp3- CD4+ conventional T cells (Tconv) or Foxp3+ CD4+ regulatory T cells (Treg) (Figure 1C). These results indicate that prior to any immunologic or antigenic challenge, chronic exposure to alcohol does not change the magnitude of major T cells subsets in the mouse.
Chronic alcohol exposure results in alterations in three CD4+ Treg subpopulations
Given the above results demonstrating that chronic alcohol exposure did not impact the quantity of T cell subsets, we next asked whether chronic alcohol exposure impacted the quality of T cell subsets. To identify changes in the CD4+Treg compartment during chronic exposure to alcohol, CD3+ CD4+ CD8- Foxp3+ Treg were gated using FlowJo. All samples, both alcohol- and water-drinking, were downsampled and clustered by all 14 available markers to generate a viSNE map visualizing subpopulations as small as 10% of CD4+Treg (Figure 2A). This process was repeated once to generate a second viSNE map from randomly sampled events.
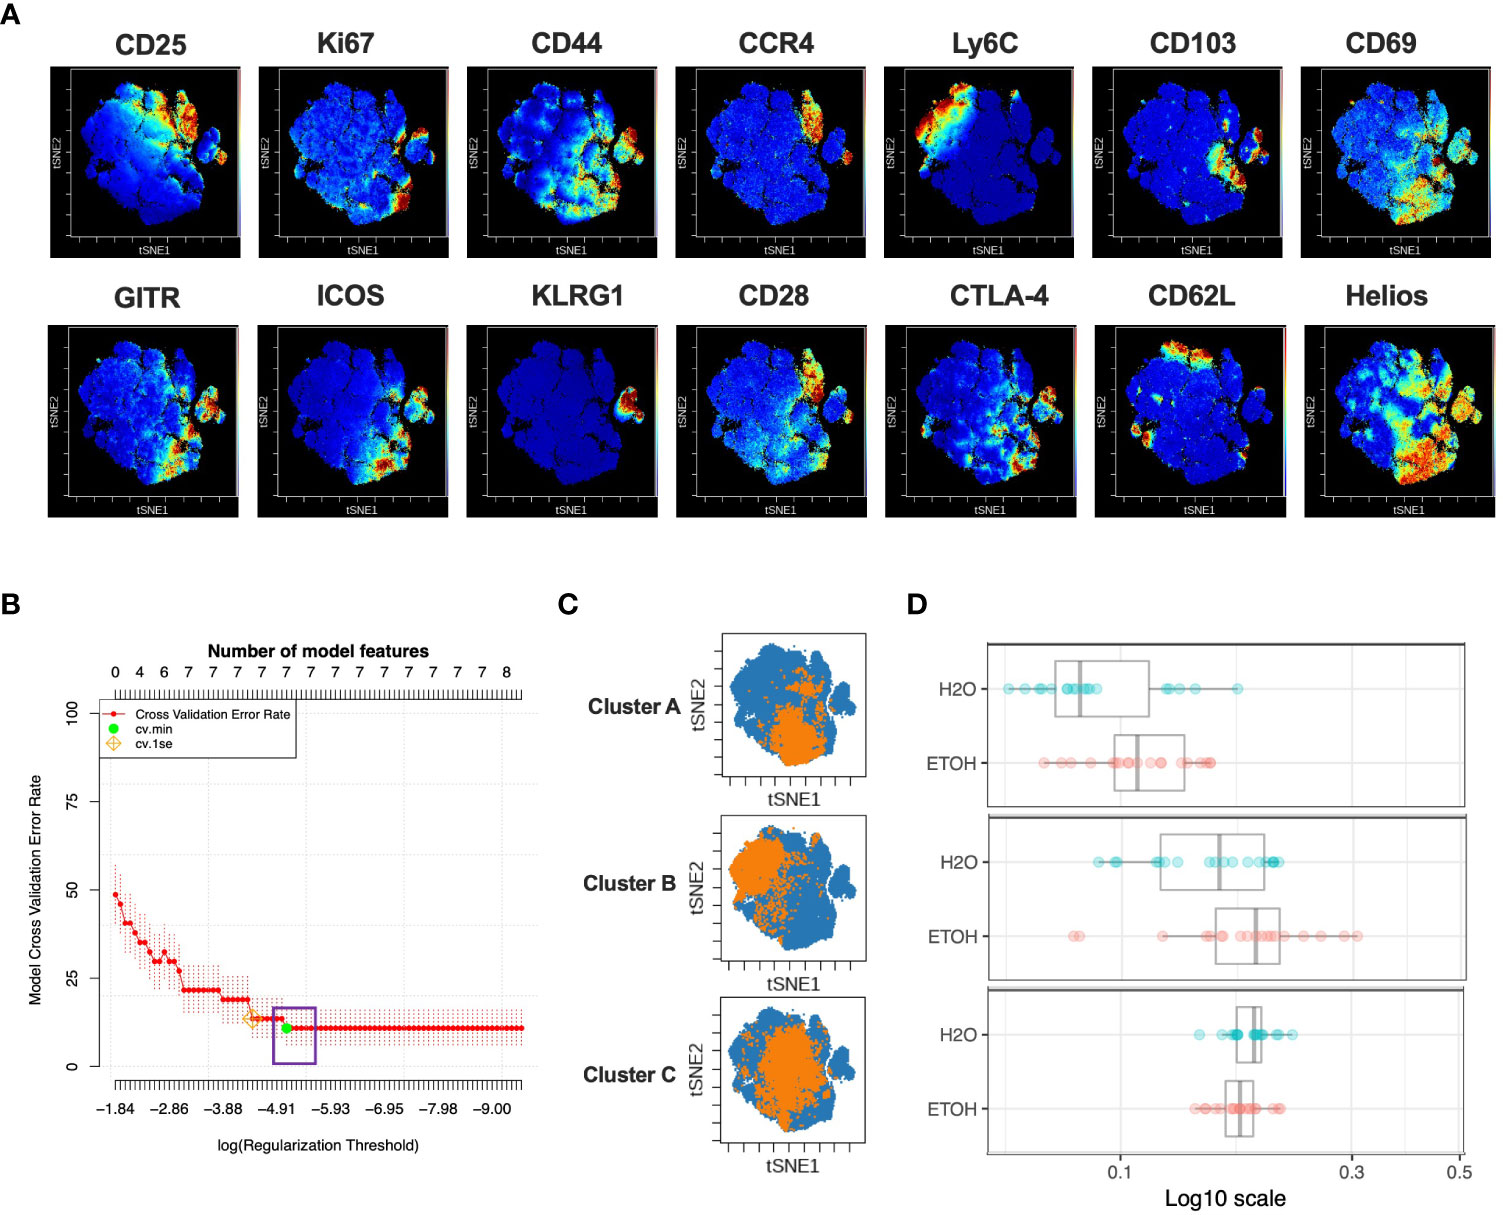
Figure 2 Combined CITRUS and viSNE analysis revealed three CD4+Treg clusters associated with chronic alcohol exposure. (A) CD4+ Treg subset samples from water- and alcohol-drinking mice were equally downsampled to 4000 events to detect 10% subpopulations with CV=5%. viSNE mapping was performed using all 14 available markers for clustering (CD3, CD4, CD8 and Foxp3 were excluded). Iterations were set to 2000, perplexity 70 and theta 0.5. (B) CITRUS analyses were performed on the events comprising each viSNE plot. Samples were grouped by alcohol versus water exposure, the same 14 channels used for viSNE were selected for clustering by abundance. LASSO modeling was selected, minimum cluster size was set to 10%, false discovery rate 1% (note: this is irrelevant for LASSO), cross validation folds 10, and scales were normalized. The CV.MIN output was selected from the LASSO analysis. A representative model error rate plot is show. (C) CITRUS replicates were compared using the “clusters-cv_min” output file histograms. Clusters that were altered in alcohol versus water drinkers were identified Clusters (A–C). Representative clusters from one CITRUS run were concatenated and individually overlaid onto their corresponding viSNE plot shown in (A). (D) Representative CITRUS feature plot corresponding to (C) showing differences in cluster frequency between alcohol and water exposed animals. E) The statistical frequencies of Clusters A (8.7 ± 0.6% vs. 6.8 ± 0.6%, p=0.04) and B (4.6 ± 0.4% vs. 2.8 ± 0.3%, p=0.002) were increased in alcohol exposed mice, while the frequency of Cluster C (2.4 ± 0.1% vs. 4.5 ± .2%, p <0.0001) was decreased. Data were tested for normality and compared with either t test or Mann-Whitney test.
In order to identify CD4+Treg subpopulations as small as 10% that were associated with chronic exposure to alcohol, the LASSO association model of the CITRUS algorithm was performed with the same downsampled events and clustering channels used to create the corresponding viSNE map to allow the results of CITRUS to be visualized with viSNE. Three CITRUS models were generated in this manner for both CD4+Treg viSNE plots, yielding six total models generated for this subset, all of which demonstrated a sufficient number of features and acceptably low error rate (Figure 2B). Given that CITRUS models can differ between replicates when more than one subpopulation is by itself adequately predictive of an endpoint, we only selected phenotypically-identical clusters that were present in all six replicates for downstream use in order to guard against false positives and restrict our analyses to a manageable number of subpopulations. This strategy identified three CITRUS clusters with phenotypes consistently present across all iterations, and these were then concatenated and overlaid onto their respective regions of the viSNE map (Figure 2C). Clusters A and B were consistently increased in alcohol exposed animals, while Cluster C was decreased (Figure 2D).
We then employed a multimodal visualization strategy in order to phenotype these clusters First, we assessed marker expression on the corresponding region (Figure 2C) of a cluster’s viSNE plot (Figure 3A). In addition, marker expression on the corresponding region (Figure 3A) of the CITRUS marker plots (Figure 3B) and histograms of marker expression produced by the CITRUS run (Figure 3C) were assessed. Cluster A was determined to be CD25loCD44hiLy6CloCD103loCD69hiGITRhiICOShiKLRG1loCD62LloHelioshi, Cluster B was determined to be CD44loLy6ChiCD69loICOSloCD28loCTLA-4loCD62LloHelioslo, and Cluster C was determined to be CD25hiLy6CloCD103hiKLRG1loCD62LloHelioshi (Figure 3D).
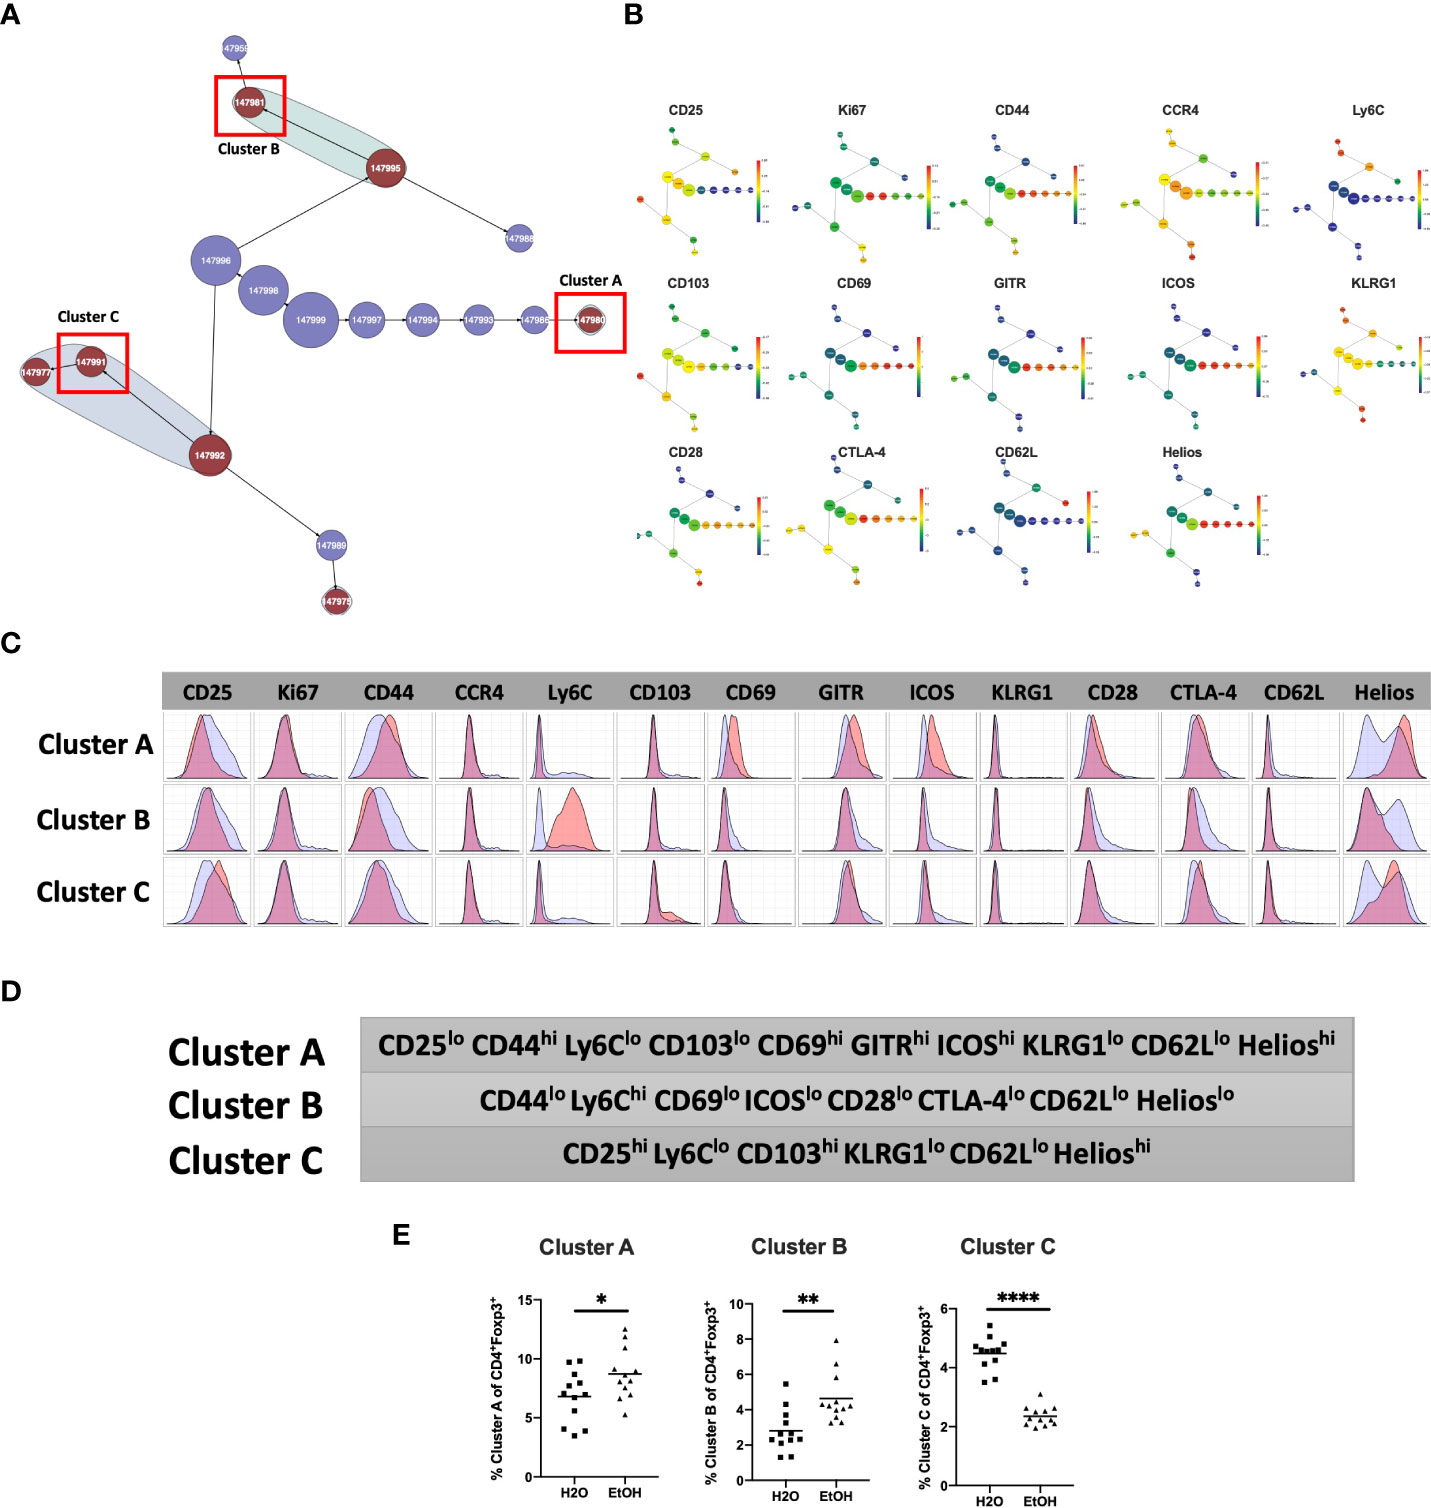
Figure 3 Phenotypic analysis of three CD4+ Treg clusters that are significantly different in water- vs. alcohol-exposed mice. Following CITRUS modeling and identification of three CD4+TReg clusters predictive of alcohol drinking mice, phenotypic cluster characterization was performed by assessing (A), marker expression on the viSNE map with the overlaid clusters, (B), CITRUS clusters of interest shown in the feature plots in (A) were compared to expression on corresponding the heatmap marker plots in (B, C) CITRUS marker histogram expression was visualized where blue represents background expression and red represents expression within the cluster of interest. The final phenotypic characterization profile assigned to the three clusters of interest is shown in (D, E). Manual gating demonstrated that the statistical frequencies of Clusters (A) (8.7 ± 0.6% vs. 6.8 ± 0.6%, p=0.04) and (B) (4.6 ± 0.4% vs.2.8 ± .3%, p=0.002) were increased in alcohol exposed mice, while the frequency of Cluster (C) (2.4 ± 0.1% vs. 4.5 ± 0.2%, p <0.0001) was decreased. Data were tested for normality and compared with either t test or Mann-Whitney test. *p<0.05, **p<0.01, ****p<0.0001.
To confirm the generalizability of our findings, we tested for the presence of similar differences between in Treg subpopulations between alcohol and water exposed mice in a separate validation cohort. Manual gating was then performed within Cytokbank on the validation cohort viSNE map to locate regions with corresponding phenotypes to CD4+Treg Clusters A, B and C (Figures 3A, C) (gating strategy shown in Supplemental Figure 1). Frequencies of these manually gated regions were exported for each sample and analyzed using traditional statistical techniques and quantitatively verified that Clusters A and B were significantly increased, and C significantly decreased, in alcohol-fed relative to water-fed animals as predicted by the CITRUS model (Figure 3E).
Chronic alcohol exposure results in decreased frequency of Ki67loCD44loCCR4loLy6CloCD69loKLRG1loCD28loCD62LhiHelioshi CD4+TConv
Analysis of the CD4+Tconv compartment to identify subpopulations predictive of chronic alcohol exposure was performed in a manner analogous to that of CD4+Treg above. The CD4+Tconv subset of the modeling cohort underwent viSNE analysis and mapping to detect subpopulations as small as 2% (Figure 4A). CITRUS analysis was performed and again generated models with sufficient numbers of features and acceptably low error rate (Figure 4B). We identified one CITRUS cluster- Cluster D - (Figure 4C) with a phenotype consistently present across all CITRUS iterations and whose frequency was decreased in alcohol exposed animals (Figure 4D).
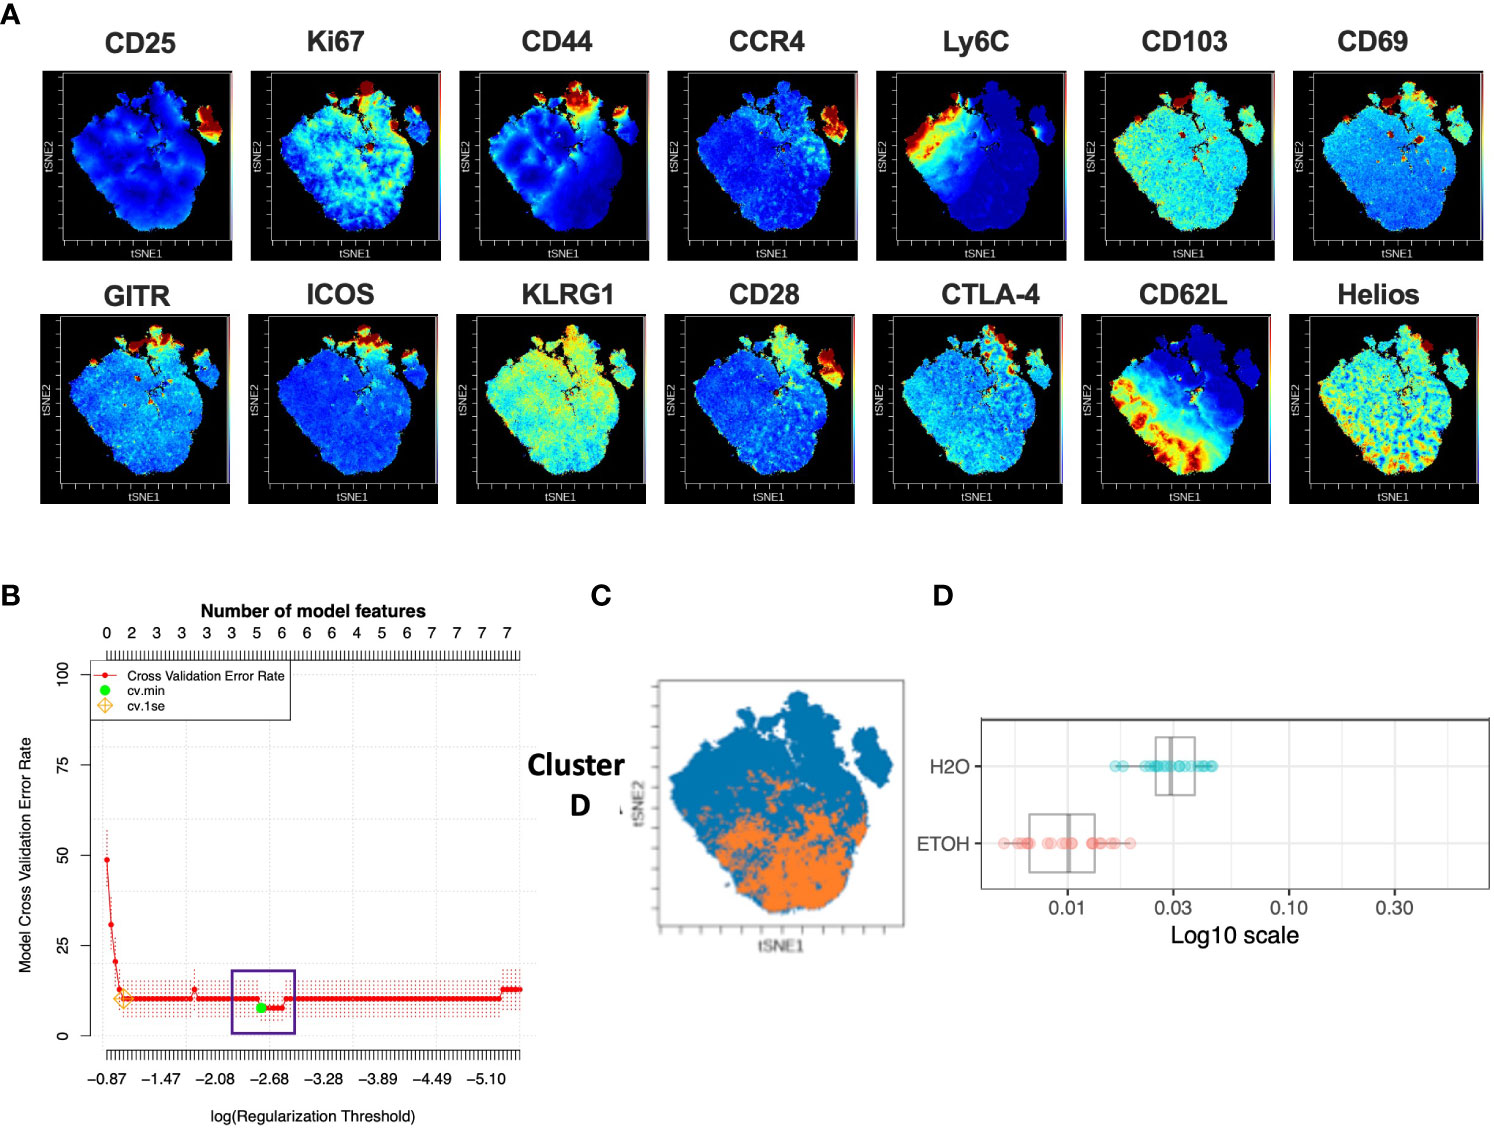
Figure 4 Combined CITRUS and viSNE analysis revealed one CD4+TConv cluster associated with alcohol-drinking mice. (A) CD4+TConv subset samples from the modeling cohort were equally downsampled to 20000 events to detect 2% subpopulations with CV=5%. 1 water drinking sample was excluded due to insufficient event count. viSNE mapping was performed using all 14 available markers for clustering (CD3, CD4, CD8 and Foxp3 were excluded). Iterations were set to 7500, perplexity 70 and theta 0.5. This process was repeated to create two total viSNE maps, one of which was concatenated and displayed above. (B) CITRUS analyses was performed on the events comprising each viSNE plot. Samples were grouped by alcohol versus water exposure, the same 14 channels used for viSNE were selected for clustering by abundance. LASSO modeling was selected, minimum cluster size was set to 2%, false discovery rate 1% (note: this is irrelevant for LASSO), cross validation folds 10, and scales were normalized. The CV.MIN output was selected from the LASSO analysis. This process was repeated 3 times for each of the two viSNE maps yielding 6 total CITRUS replicates. A representative model error rate plot is show. (C) 6 CITRUS replicates were compared using the “clusters-cv_min” output file histograms. 1 cluster predictive of alcohol versus water drinkers was present across all replicates Cluster (D) and was selected for downstream analyses. Representative clusters from one CITRUS run were concatenated and individually overlaid onto their corresponding viSNE plot shown in (A). (D) Representative CITRUS feature plot corresponding to (C) showing differences in cluster frequency between alcohol and water exposed animals.
The phenotype of cells in CD4+TConv Cluster D was then interrogated by assessing marker expression on the corresponding region (Figure 4C) of the cluster’s viSNE plot (Figure 5A), marker expression on the corresponding region (Figure 5A) of the CITRUS marker plots (Figure 5B), and histograms of marker expression produced by the CITRUS run (Figure 5C). Based on these, Cluster D within the CD4+ T cell compartment was determined to be Ki67loCD44loCCR4loLy6CloCD69loKLRG1loCD28loCD62LhiHelioshi (Figure 5D).
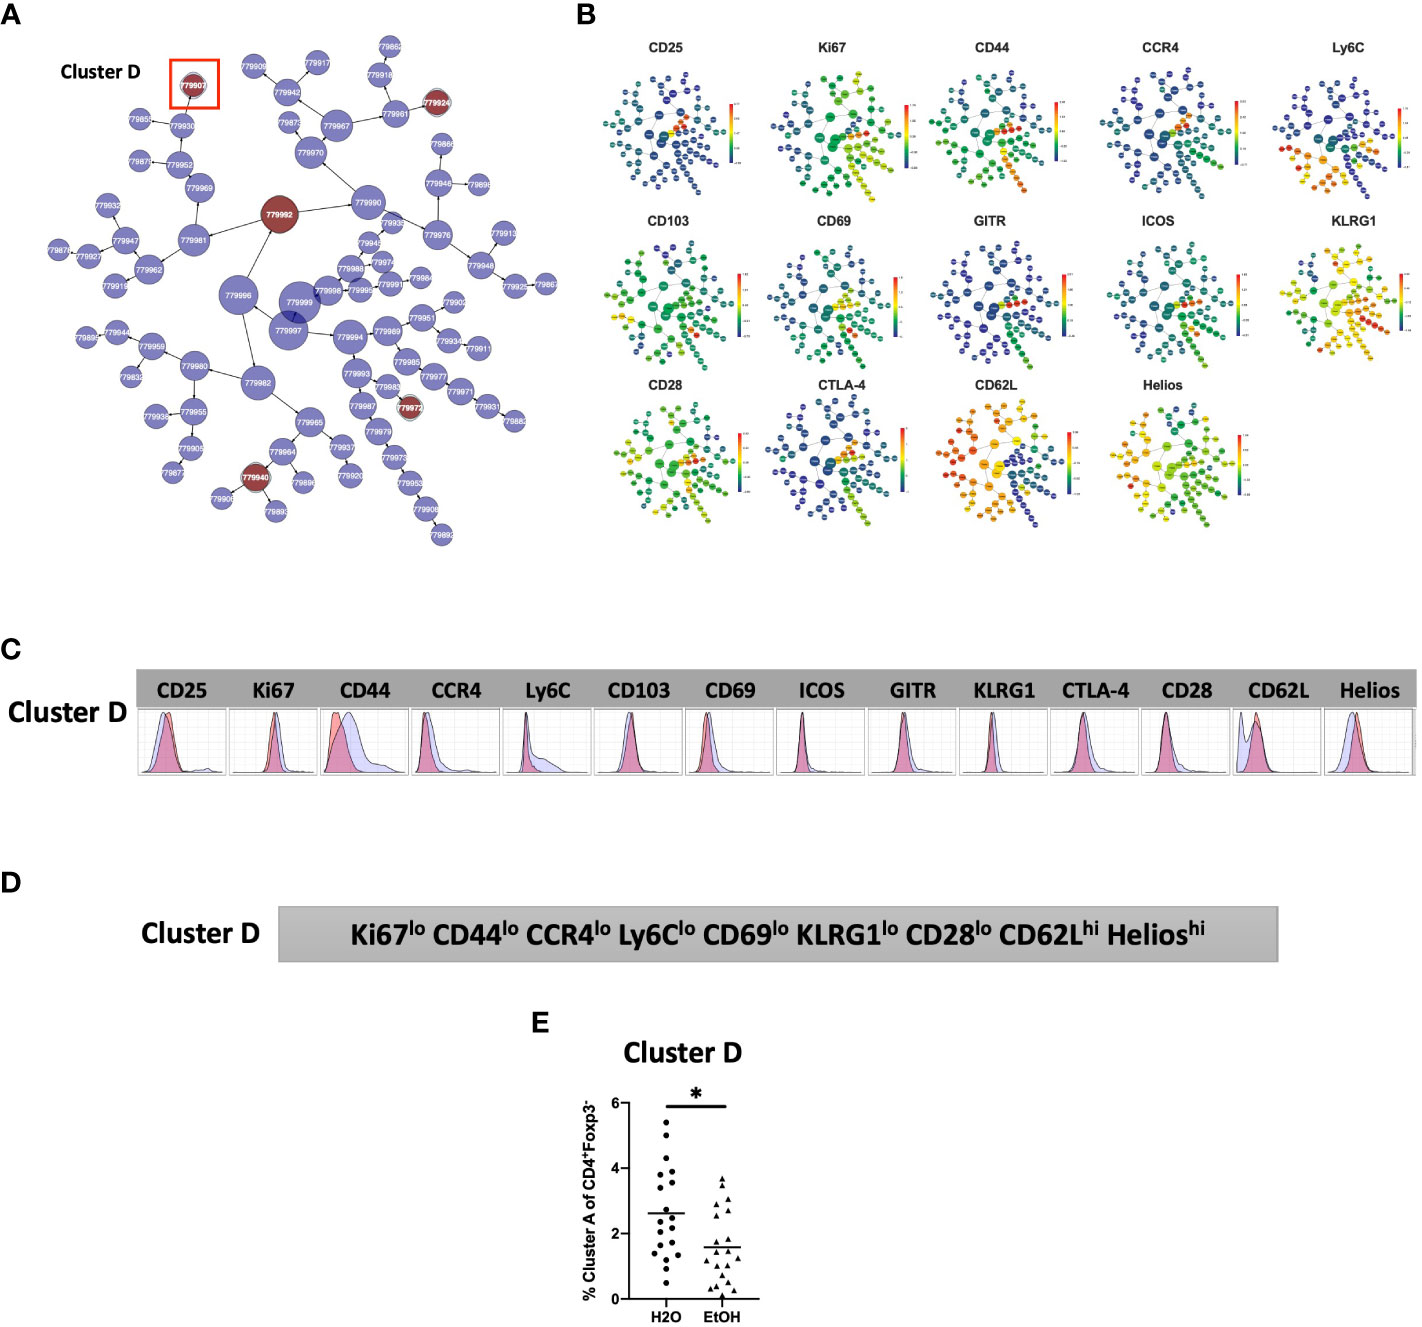
Figure 5 Phenotypic analysis of one CD4+ TConv cluster that is significantly different in alcohol-exposed mice. Following CITRUS modeling and identification of three CD4+TConv clusters predictive of alcohol drinking mice, phenotypic cluster characterization was performed by assessing (A) marker expression on the viSNE map with the overlaid clusters, (B) CITRUS clusters of interest shown in the feature plots in (A) were compared to expression on corresponding the heatmap marker plots in (B, C) CITRUS marker histogram expression was visualized where blue represents background expression and red represents expression within the cluster of interest. The final phenotypic characterization profile assigned to the cluster of interest is shown in (D). (E) Manual gating demonstrated that the frequency of cells within Cluster (D) (1.6 ± 0.3% vs. 2.6 ± 0.3%, p=0.01) was statistically significantly decreased in alcohol exposed mice relative to water exposed. Data were tested for normality and compared using t test. *p<0.05.
To confirm the generalizability of our findings, we again performed manual gating within Cytobank on a validation cohort to identify a region on the viSNE map with a similar phenotype to CD4+TConv Cluster D (Supplemental Figure 2). Statistical analysis demonstrated that the frequency of cells within CD4+TConv Cluster D was significantly decreased in alcohol exposed mice (Figure 5E).
Chronic alcohol exposure results in decreased frequency of CD25lo CD44lo Ly6Clo CD103hi CD8+ T cells
Analysis of the CD8+ T cell compartment to identify subpopulations predictive of chronic alcohol exposure was performed in a manner analogous to that of CD4+Treg and CD4+Tconv above. The CD8+ T cell subset of the modeling cohort underwent viSNE analysis and mapping to detect subpopulations as small as 2% (Figure 6A). CITRUS analysis was performed and again generated models with sufficient numbers of features and acceptably low error rate (Figure 6B). We identified one CITRUS cluster- Cluster E - (Figure 6C) with a phenotype consistently present across all CITRUS iterations and the frequency of which was decreased in alcohol exposed animals (Figure 6D).
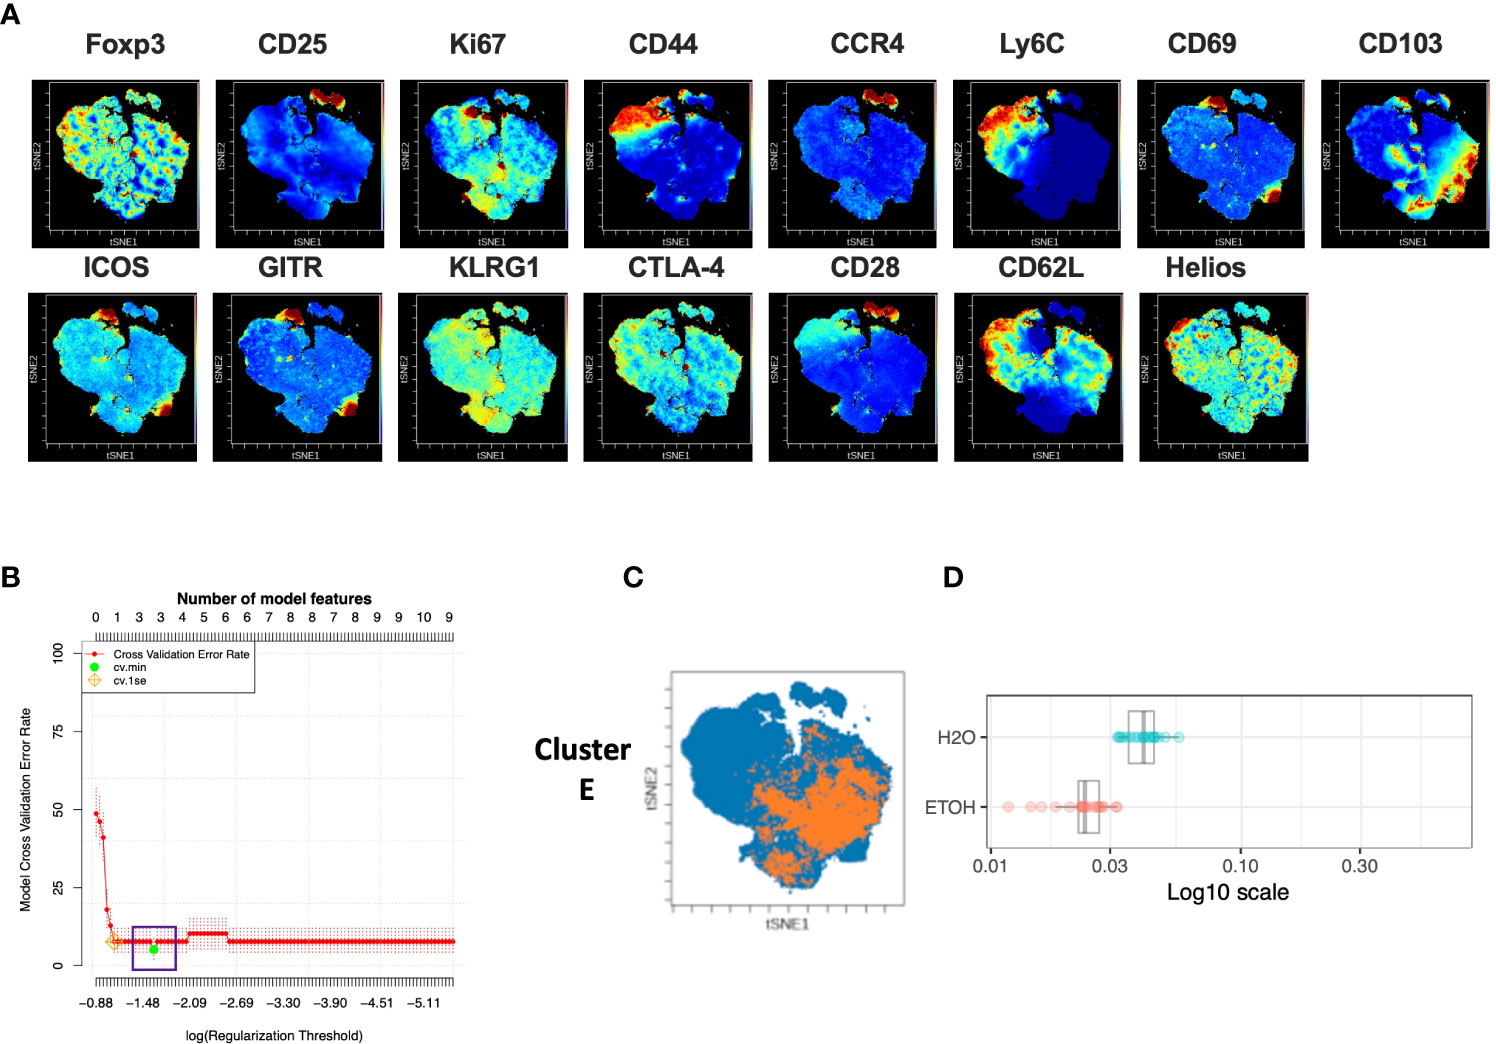
Figure 6 Combined CITRUS and viSNE analysis revealed one CD8+ T cell cluster associated with alcohol-drinking mice. (A) CD8+Tcell subset samples from the modeling cohort were equally downsampled to 20000 events to detect 2% subpopulations with CV=5%. 1 water drinking sample was excluded due to insufficient event count. viSNE mapping was performed using all 15 available markers for clustering (CD3, CD4 and CD8 were excluded). Iterations were set to 7500, perplexity 70 and theta 0.5. This process was repeated to create two total viSNE maps, one of which was concatenated and displayed above. (B) CITRUS analyses was performed on the events comprising each viSNE plot. Samples were grouped by alcohol versus water exposure, the same 14 channels used for viSNE were selected for clustering by abundance. LASSO modeling was selected, minimum cluster size was set to 2%, false discovery rate 1% (note: this is irrelevant for LASSO), cross validation folds 10, and scales were normalized. The CV.MIN output was selected from the LASSO analysis. This process was repeated 3 times for each of the two viSNE maps yielding 6 total CITRUS replicates. A representative model error rate plot is show. (C) 6 CITRUS replicates were compared using the “clusters-cv_min” output file histograms. 1 cluster predictive of alcohol versus water drinkers was present across all replicates Cluster (E) and was selected for for downstream analyses. Representative clusters from one CITRUS run were concatenated and individually overlaid onto their corresponding viSNE plot shown in (A). (D) Representative CITRUS feature plot corresponding to (C) showing differences in cluster frequency between alcohol and water exposed animals.
The phenotype of cells in Cluster E was then interrogated by assessing marker expression on the corresponding region (Figure 6C) of the cluster’s viSNE plot (Figure 7A), assessing marker expression on the corresponding region of the CITRUS marker plots (Figure 7B), and histograms of marker expression produced by the CITRUS run (Figure 7C). Cluster E within the CD8+ T cell compartment was determined to be CD25loCD44loLy6CloCD103hi (Figure 7D).
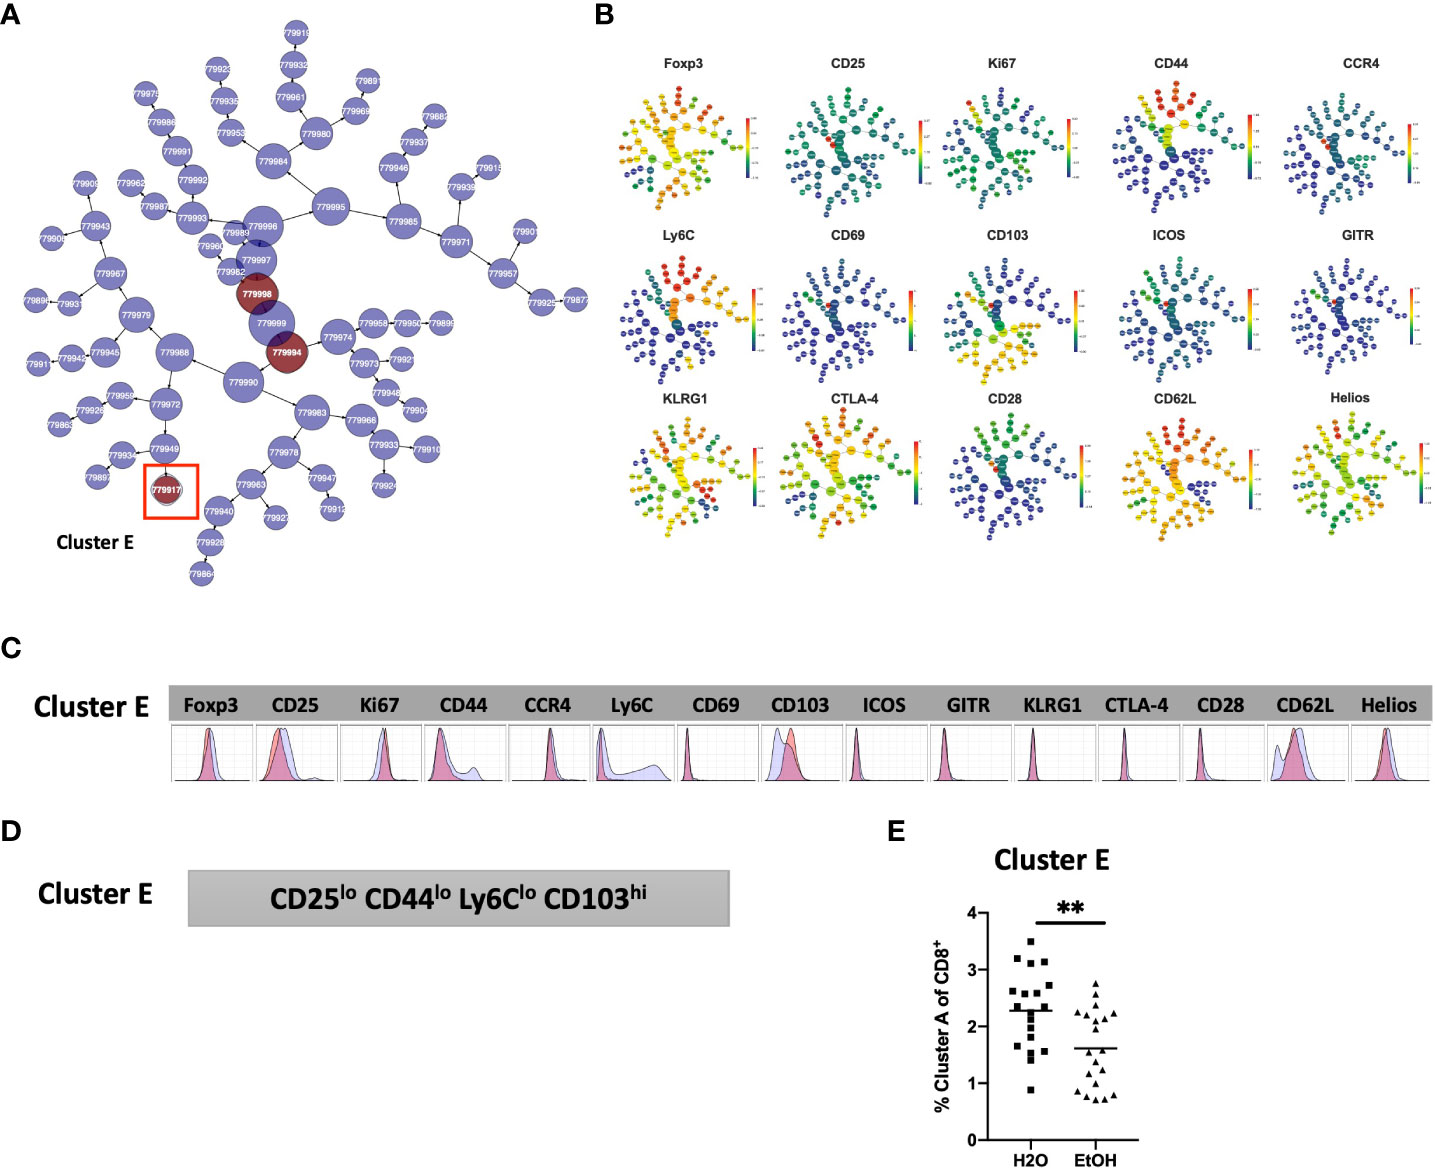
Figure 7 Phenotypic analysis of one CD8+ T cell cluster that is significantly different in alcohol exposed mice. Following CITRUS modeling and identification of one CD8+ T cell clusters predictive of alcohol drinking mice, phenotypic cluster characterization was performed (A), assessing marker expression on the viSNE map with the overlaid clusters, (B) CITRUS clusters of interest shown in the feature plots in (A) were compared to expression on corresponding the heatmap marker plots in (B, C) CITRUS marker histogram expression was visualized where blue represents background expression and red represents expression within the cluster of interest. The final phenotypic characterization profile assigned to the cluster of interest is shown in (D). (E) The frequency of Cluster E (1.6 ± 0.2% vs. 2.3 ± 0.2%, p=0.005) was significantly decreased in alcohol exposed mice relative to water exposed. Data were tested for normality and compared a t test.
To confirm the generalizability of our findings, manual gating was again performed within Cytobank to identify a region on the viSNE map with a similar phenotype to CD8+ T cell Cluster E (gating strategy shown in Supplemental Figure 3). Statistical analysis verified that the frequency of Cluster E within the CD8+ T cell compartment was significantly decreased in alcohol exposed mice, also as predicted by the CITRUS model (Figure 7E).
Discussion
High dimensional, single-cell flow cytometry analysis techniques continue to evolve and provide increased ability to characterize rare immune cell populations. Here, we have presented an application of algorithms available through the Cytobank platform to perform an exploratory characterization of rare T cell populations that are present in mice which are chronically exposed to alcohol. We used an iterative series of viSNE and CITRUS analyses to identify subpopulations within the CD8+, CD4+TConv and CD4+Treg compartments, the frequencies of which are reproducibly different between alcohol- and non-alcohol-exposed animals. This was followed by a multimodal approach to phenotype these clusters and then, finally, validation of these findings in a testing cohort by identifying analogous subpopulations with identical frequency differences between alcohol and water-fed mice. Specifically, we identified CD25loCD44loLy6CloCD103hi CD8+ T cell, Ki67loCD44loCCR4loLy6CloCD69loKLRG1loCD28loCD62LhiHelioshi CD4+Tconv, and CD25hiLy6CloCD103hiKLRG1loCD62LloHelioshi CD4+Treg populations that were decreased in alcohol exposed animals. Conversely, two CD4+Treg populations – CD25loCD44hiLy6CloCD103loCD69hiGITRhiICOShiKLRG1loCD62LloHelioshi, and CD44loLy6ChiCD69loICOSloCD28loCTLA-4loCD62LloHelioslo were both increased in alcohol-exposed relative to water-fed animals.
Within the CD8+ T cell compartment, the identification of a population with low expression of both CD44 and Ly6C is strongly suggestive of a naïve phenotype, as both these markers are known to be upregulated in antigen-experienced T cells (42–44), with Ly6C specifically associated with CD8+ central memory (CD8+TCM) cells (45). Similarly, CD25, the receptor for IL-2, is recognized as a general marker of activation and antigen-experience (46) and low expression of CD25 in this setting is likely further indicative of a naïve phenotype. CD103 is a well-described marker of tissue homing that allows cells to bind E-cadherin expressed on peripheral epithelial tissues (47). In this context, expression of CD103 on CD8+ T cells is a characteristic feature of the tissue resident memory phenotype (CD8+TRM) and distinguishes these cells from effector memory CD8+ T cells (CD8+TEM), both of which lack expression of CD62L (L-selectin) to facilitate retention in secondary lymphoid organs. Similar to the CD8+ compartment, our analysis of the CD4+TConv compartment also revealed loss of a subpopulation that shared low expression of CD44 and Ly6C in addition to low expression of proliferative marker Ki67 (48), co-stimulatory molecule CD28 (49), activation marker CD69 (50) and terminal differentiation marker KLRG1 (51). CCR4, a chemokine receptor associated with Th2 polarization and cutaneous T cell migration (52) as well as cell retention in inflamed tissues (53) was also decreased in this subpopulation. Conversely, this CD4+TConv cluster showed high expression of CD62L, rather than CD103, in addition to high expression of Helios, which has been shown to be critical for the activation of naïve T cells (54, 55). Together, these findings suggest that chronic alcohol exposure in mice leads to loss of naïve subsets of CD8+ T cells and CD4+TConv cells that specifically possess CD103+ and Helios+ phenotypes, respectively. Given that loss of naïve T cell subsets is a known consequence of chronic alcohol exposure (6, 14), the data presented here both confirm this conclusion as well as provide more detailed phenotypic characterization of this population that may inform future mechanistic studies into the sequalae of chronic alcohol exposure in the adaptive immune system.
In the CD4+Treg compartment, chronic alcohol exposure led to altered frequencies of Clusters A, B and C, all of which were found to demonstrate phenotypic characteristics that are largely consistent with those known to describe eTreg, a highly proliferative TReg subset that migrates to, and suppresses, end-organ inflammation (56). eTreg are defined as CD62L-CD44+ (57) and express increased ICOS (56) and decreased CD25 (58) given their dependence on TCR stimulation (59), rather than IL-2 (58), for maintenance. eTreg generally show increased markers of Treg activation such as GITR (60), Helios (61), CTLA-4 (56), and KLRG1 (62), as they are unidirectionally derived from the activation and differentiation of the quiescent cTreg subset (62). cTreg conversely possess a CD62L+CD44- phenotype (57), depend on IL-2 signaling via CD25 (58) and suppress inflammation in secondary lymphoid organs in addition to serving as an eTreg precursor pool (62). The transition from cTreg to eTreg characteristically involves loss of Ly6C, indicative of senescence (62), and gain of CD69 and/or CD103. As described by Toomer 5 CD69- CD103- eTReg likely represent a transitional phenotype between cTreg and eTreg, while CD69+ and CD103+ eTreg are two distinct activated subsets (62). Collectively, these data suggest that our findings in the CD4+Treg compartment of alcohol exposed mice may represent increased frequency of a CD69+ eTreg population (Cluster A), along with decreased frequency of a CD103+ eTreg population also expressing increased CD25 (Cluster C). Interestingly, CD4+Treg Cluster B demonstrated features suggestive of both cTreg (i.e. CD44loLy6Chi) and eTreg (i.e. CD62Llo) and therefore, given its increased frequency in alcohol exposed animals, may be a manifestation of a transitional phenotype between the two.
The increased computational power offered to investigators by automated cytometry analyses is still not without notable limitations. Both viSNE and CITRUS effectively require investigators to decide what minimum subpopulation frequency they wish to target and with what statistical power. We considered the selection of 10% subpopulations for CD4+TReg and 2% subpopulations for CD4+TConv and CD8+ T cells reasonable given our interest in rare events (41), but any cut-off will inherently bias the results simply by the nature of the algorithms the software employs. However, our use of a validation cohort to test the predictions of the modeling cohort strengthens the generalizability of our findings and guards against the risk of over-fitting of CITRUS models to the underlying data. In addition, we employed a conservative approach as to which CITRUS clusters were selected for downstream analysis, increasingly the likelihood that our findings are generalizable to alcohol exposed mice, but at the cost of decreased sensitivity to identify all possible subpopulations differing in alcohol exposed animals. The current study is also limited by the fact that only splenocytes were analyzed. Because tissue microenvironment is known to affect T cell phenotype, it is possible that the T cell phenotypes we identified to be differentially expressed in the spleens of water- vs.- alcohol drinking animals may not be observed in other tissues. In prior analyses we have found that phenotypes in the spleen closely mirror those in the peripheral blood, given the large amount of blood circulating through the spleen. Follow up studies are planned to analyze other tissue microenvironments, such as the peritoneal lymph nodes, peritoneal exudate cells, the bone marrow, and intestinal lymphocytes.
In sum, using a series of machine-driven, multiparameter flow cytometry analyses strategies, we have successfully identified rare populations of naïve Helios+ CD4+Tconv and naïve CD103+ CD8+ splenic T cells that are decreased in chronically alcohol exposed mice versus water-fed controls, as well as increased CD69+ and decreased CD103+ eTreg subsets in conjunction with increased frequency of a population that may represent a transitional phenotype between cTreg and eTreg. These data provide further resolution into the character of decreased naïve T cell populations known to be present in alcohol exposed mice, as well as describe alterations in effector regulatory T cell phenotypes as consequence of chronic exposure to alcohol that are worthy of future study.
Data availability statement
The raw data supporting the conclusions of this article will be made available by the authors, without undue reservation.
Ethics statement
This study was approved by the Emory University Institutional Animal Care and Use Committee (IACUC) [Protocol: PROTO201800161].
Author contributions
Conceptualization: MF and CC. Data curation: CP and MG. Formal analysis: CP and MG. Funding acquisition: MF and CC. Investigation: CP and MG. Project administration: CC and MF. Supervision: CC and MF. Visualization: CP, MG, and MF. Writing – original draft: CP and MF. Writing – reviewing and editing: MF and CC. All authors contributed to the article and approved the submitted version.
Funding
This work was supported by funding from the National Institutes of Health (NIAAA R01 AA027396 to CC and MF) and the United States Navy.
Conflict of interest
The authors declare that the research was conducted in the absence of any commercial or financial relationships that could be construed as a potential conflict of interest.
Publisher’s note
All claims expressed in this article are solely those of the authors and do not necessarily represent those of their affiliated organizations, or those of the publisher, the editors and the reviewers. Any product that may be evaluated in this article, or claim that may be made by its manufacturer, is not guaranteed or endorsed by the publisher.
Author disclaimer
The views expressed in this article reflect the results of research conducted by the author and do not necessarily reflect the official policy or position of the Department of the Navy, Department of Defense, nor the United States Government.” LT CP is a military service member or federal/contracted employee of the United States government. This work was prepared as part of his official duties. Title 17 U.S.C. 105 provides that `copyright protection under this title is not available for any work of the United States Government.’ Title 17 U.S.C. 101 defines a U.S. Government work as work prepared by a military service member or employee of the U.S. Government as part of that person’s official duties.
Supplementary material
The Supplementary Material for this article can be found online at: https://www.frontiersin.org/articles/10.3389/fimmu.2023.1142614/full#supplementary-material
References
1. Grant BF, Goldstein RB, Saha TD, Chou SP, Jung J, Zhang H, et al. Epidemiology of DSM-5 alcohol use disorder: Results from the national epidemiologic survey on alcohol and related conditions III. JAMA Psychiatry (2015) 72(8):757–66. doi: 10.1001/jamapsychiatry.2015.0584
2. Stahre M, Roeber J, Kanny D, Brewer RD, Zhang X. Contribution of excessive alcohol consumption to deaths and years of potential life lost in the united states. Prev Chronic Dis (2014) 11:E109. doi: 10.5888/pcd11.130293
4. Klingensmith NJ, Fay KT, Lyons JD, Chen CW, Otani S, Liang Z, et al. Chronic alcohol ingestion worsens survival and alters gut epithelial apoptosis and CD8+ T cell function after pseudomonas aeruginosa pneumonia-induced sepsis. Shock (2019) 51(4):453–63. doi: 10.1097/SHK.0000000000001163
5. Margoles LM, Mittal R, Klingensmith NJ, Lyons JD, Liang Z, Serbanescu MA, et al. Chronic alcohol ingestion delays T cell activation and effector function in sepsis. PloS One (2016) 11(11):e0165886. doi: 10.1371/journal.pone.0165886
6. Yoseph BP, Breed E, Overgaard CE, Ward CJ, Liang Z, Wagener ME, et al. Chronic alcohol ingestion increases mortality and organ injury in a murine model of septic peritonitis. PloS One (2013) 8(5):e62792. doi: 10.1371/journal.pone.0062792
7. Pasala S, Barr T, Messaoudi I. Impact of alcohol abuse on the adaptive immune system. Alcohol Res (2015) 37(2):185–97.
8. Tonnesen H, Andersen JR, Pedersen AE, Kaiser AH. Lymphopenia in heavy drinkers–reversibility and relation to the duration of drinking episodes. Ann Med (1990) 22(4):229–31. doi: 10.3109/07853899009148931
9. Helm RM, Wheeler G, Burks AW, Hakkak R, Badger TM. Flow cytometric analysis of lymphocytes from rats following chronic ethanol treatment. Alcohol (1996) 13(5):467–71. doi: 10.1016/0741-8329(96)00036-5
10. Percival SS, Sims CA. Wine modifies the effects of alcohol on immune cells of mice. J Nutr (2000) 130(5):1091–4. doi: 10.1093/jn/130.5.1091
11. Cook RT, Waldschmidt TJ, Ballas ZK, Cook BL, Booth BM, Stewart BC, et al. Fine T-cell subsets in alcoholics as determined by the expression of l-selectin, leukocyte common antigen, and beta-integrin. Alcohol Clin Exp Res (1994) 18(1):71–80. doi: 10.1111/j.1530-0277.1994.tb00883.x
12. Cook RT, Ballas ZK, Waldschmidt TJ, Vandersteen D, LaBrecque DR, Cook BL. Modulation of T-cell adhesion markers, and the CD45R and CD57 antigens in human alcoholics. Alcohol Clin Exp Res (1995) 19(3):555–63. doi: 10.1111/j.1530-0277.1995.tb01548.x
13. Zhang H, Meadows GG. Chronic alcohol consumption in mice increases the proportion of peripheral memory T cells by homeostatic proliferation. J Leukoc Biol (2005) 78(5):1070–80. doi: 10.1189/jlb.0605317
14. Song K, Coleman RA, Zhu X, Alber C, Ballas ZK, Waldschmidt TJ, et al. Chronic ethanol consumption by mice results in activated splenic T cells. J Leukoc Biol (2002) 72(6):1109–16. doi: 10.1189/jlb.72.6.1109
15. Cook RT, Garvey MJ, Booth BM, Goeken JA, Stewart B, Noel M. Activated CD-8 cells and HLA DR expression in alcoholics without overt liver disease. J Clin Immunol (1991) 11(5):246–53. doi: 10.1007/BF00918182
16. Song K, Coleman RA, Alber C, Ballas ZK, Waldschmidt TJ, Mortari F, et al. TH1 cytokine response of CD57+ T-cell subsets in healthy controls and patients with alcoholic liver disease. Alcohol (2001) 24(3):155–67. doi: 10.1016/S0741-8329(01)00146-X
17. Barve SS, Kelkar SV, Gobejishvilli L, Joshi-Barve S, McClain CJ. Mechanisms of alcohol-mediated CD4+ T lymphocyte death: Relevance to HIV and HCV pathogenesis. Front Biosci (2002) 7:d1689–96. doi: 10.2741/A872
18. Zuluaga P, Sanvisens A, Martinez-Caceres E, Teniente A, Tor J, Muga R. Over-expression of CD8(+) T-cell activation is associated with decreased CD4(+) cells in patients seeking treatment of alcohol use disorder. Drug Alcohol Depend (2017) 180:7–13. doi: 10.1016/j.drugalcdep.2017.07.023
19. Parlet CP, Waldschmidt TJ, Schlueter AJ. Chronic ethanol feeding induces subset loss and hyporesponsiveness in skin T cells. Alcohol Clin Exp Res (2014) 38(5):1356–64. doi: 10.1111/acer.12358
20. Zacharias ZR, Legge KL. Chronic ethanol consumption reduces existing CD8 T cell memory and is associated with lesions in protection against secondary influenza a virus infections. J Immunol (2019) 203(12):3313–24. doi: 10.4049/jimmunol.1900770
21. Kapasi AA, Patel G, Goenka A, Nahar N, Modi N, Bhaskaran M, et al. Ethanol promotes T cell apoptosis through the mitochondrial pathway. Immunology (2003) 108(3):313–20. doi: 10.1046/j.1365-2567.2003.01584.x
22. Kelkar S, Dong Q, Xiao Y, Joshi-Barve S, McClain CJ, Barve SS. Ethanol enhances activation-induced caspase-3 dependent cell death in T lymphocytes. Alcohol Clin Exp Res (2002) 26(3):363–70. doi: 10.1111/j.1530-0277.2002.tb02547.x
23. Rehman S, Chandel N, Salhan D, Rai P, Sharma B, Singh T, et al. Ethanol and vitamin d receptor in T cell apoptosis. J Neuroimmune Pharmacol (2013) 8(1):251–61. doi: 10.1007/s11481-012-9393-9
24. Molina PE, Happel KI, Zhang P, Kolls JK, Nelson S. Focus on: Alcohol and the immune system. Alcohol Res Health (2010) 33(1-2):97–108.
25. Fan J, Edsen-Moore MR, Turner LE, Cook RT, Legge KL, Waldschmidt TJ, et al. Mechanisms by which chronic ethanol feeding limits the ability of dendritic cells to stimulate T-cell proliferation. Alcohol Clin Exp Res (2011) 35(1):47–59. doi: 10.1111/j.1530-0277.2010.01321.x
26. Mair F, Hartmann FJ, Mrdjen D, Tosevski V, Krieg C, Becher B. The end of gating? an introduction to automated analysis of high dimensional cytometry data. Eur J Immunol (2016) 46(1):34–43. doi: 10.1002/eji.201545774
27. Newell EW, Cheng Y. Mass cytometry: blessed with the curse of dimensionality. Nat Immunol (2016) 17(8):890–5. doi: 10.1038/ni.3485
28. van der Maaten L, Hinton G. Visualizing data using t-SNE. J Mach Learn Res (2008) 9(86):2579–605.
29. Amir el AD, Davis KL, Tadmor MD, Simonds EF, Levine JH, Bendall SC, et al. viSNE enables visualization of high dimensional single-cell data and reveals phenotypic heterogeneity of leukemia. Nat Biotechnol (2013) 31(6):545–52. doi: 10.1038/nbt.2594
30. Bruggner RV, Bodenmiller B, Dill DL, Tibshirani RJ, Nolan GP. Automated identification of stratifying signatures in cellular subpopulations. Proc Natl Acad Sci USA. (2014) 111(26):E2770–7. doi: 10.1073/pnas.1408792111
31. Kotecha N, Krutzik PO, Irish JM. Web-based analysis and publication of flow cytometry experiments. Curr Protoc Cytom. (2010) 53:10.17.1–24. doi: 10.1002/0471142956.cy1017s53
32. Xie J, Robertson JM, Chen CW, Zhang W, Coopersmith CM, Ford ML. Pre-existing malignancy results in increased prevalence of distinct populations of CD4+ T cells during sepsis. PloS One (2018) 13(1):e0191065. doi: 10.1371/journal.pone.0191065
33. Polikowsky HG, Drake KA. Supervised machine learning with CITRUS for single cell biomarker discovery. Methods Mol Biol (2019) 1989:309–32. doi: 10.1007/978-1-4939-9454-0_20
34. Subrahmanyam PB, Dong Z, Gusenleitner D, Giobbie-Hurder A, Severgnini M, Zhou J, et al. Distinct predictive biomarker candidates for response to anti-CTLA-4 and anti-PD-1 immunotherapy in melanoma patients. J Immunother Cancer (2018) 6(1):18. doi: 10.1186/s40425-018-0328-8
35. Fraietta JA, Lacey SF, Orlando EJ, Pruteanu-Malinici I, Gohil M, Lundh S, et al. Determinants of response and resistance to CD19 chimeric antigen receptor (CAR) T cell therapy of chronic lymphocytic leukemia. Nat Med (2018) 24(5):563–71. doi: 10.1038/s41591-018-0010-1
36. Ben-Shaanan TL, Azulay-Debby H, Dubovik T, Starosvetsky E, Korin B, Schiller M, et al. Activation of the reward system boosts innate and adaptive immunity. Nat Med (2016) 22(8):940–4. doi: 10.1038/nm.4133
37. Klingensmith NJ, Yoseph BP, Liang Z, Lyons JD, Burd EM, Margoles LM, et al. Epidermal growth factor improves intestinal integrity and survival in murine sepsis following chronic alcohol ingestion. Shock (2017) 47(2):184–92. doi: 10.1097/SHK.0000000000000709
38. Alegre ML, Noel PJ, Eisfelder BJ, Chuang E, Clark MR, Reiner SL, et al. Regulation of surface and intracellular expression of CTLA4 on mouse T cells. J Immunol (1996) 157(11):4762–70. doi: 10.4049/jimmunol.157.11.4762
39. Chuang E, Alegre ML, Duckett CS, Noel PJ, Vander Heiden MG, Thompson CB. Interaction of CTLA-4 with the clathrin-associated protein AP50 results in ligand-independent endocytosis that limits cell surface expression. J Immunol (1997) 159(1):144–51. doi: 10.4049/jimmunol.159.1.144
40. Shiratori T, Miyatake S, Ohno H, Nakaseko C, Isono K, Bonifacino JS, et al. Tyrosine phosphorylation controls internalization of CTLA-4 by regulating its interaction with clathrin-associated adaptor complex AP-2. Immunity (1997) 6(5):583–9. doi: 10.1016/S1074-7613(00)80346-5
42. Pihlgren M, Dubois PM, Tomkowiak M, Sjogren T, Marvel J. Resting memory CD8+ T cells are hyperreactive to antigenic challenge in vitro. J Exp Med (1996) 184(6):2141–51. doi: 10.1084/jem.184.6.2141
43. Kaech SM, Ahmed R. Memory CD8+ T cell differentiation: Initial antigen encounter triggers a developmental program in naive cells. Nat Immunol (2001) 2(5):415–22. doi: 10.1038/87720
44. Wherry EJ, Teichgraber V, Becker TC, Masopust D, Kaech SM, Antia R, et al. Lineage relationship and protective immunity of memory CD8 T cell subsets. Nat Immunol (2003) 4(3):225–34. doi: 10.1038/ni889
45. Hanninen A, Maksimow M, Alam C, Morgan DJ, Jalkanen S. Ly6C supports preferential homing of central memory CD8+ T cells into lymph nodes. Eur J Immunol (2011) 41(3):634–44. doi: 10.1002/eji.201040760
46. Kalia V, Sarkar S, Subramaniam S, Haining WN, Smith KA, Ahmed R. Prolonged interleukin-2Ralpha expression on virus-specific CD8+ T cells favors terminal-effector differentiation in vivo. Immunity (2010) 32(1):91–103. doi: 10.1016/j.immuni.2009.11.010
47. Mackay LK, Stock AT, Ma JZ, Jones CM, Kent SJ, Mueller SN, et al. Long-lived epithelial immunity by tissue-resident memory T (TRM) cells in the absence of persisting local antigen presentation. Proc Natl Acad Sci USA (2012) 109(18):7037–42. doi: 10.1073/pnas.1202288109
48. Soares A, Govender L, Hughes J, Mavakla W, de Kock M, Barnard C, et al. Novel application of Ki67 to quantify antigen-specific in vitro lymphoproliferation. J Immunol Methods (2010) 362(1-2):43–50. doi: 10.1016/j.jim.2010.08.007
49. Beyersdorf N, Kerkau T, Hunig T. CD28 co-stimulation in T-cell homeostasis: a recent perspective. Immunotargets Ther (2015) 4:111–22. doi: 10.2147/ITT.S61647
50. Yamashita I, Nagata T, Tada T, Nakayama T. CD69 cell surface expression identifies developing thymocytes which audition for T cell antigen receptor-mediated positive selection. Int Immunol (1993) 5(9):1139–50. doi: 10.1093/intimm/5.9.1139
51. Beyersdorf N, Ding X, Tietze JK, Hanke T. Characterization of mouse CD4 T cell subsets defined by expression of KLRG1. Eur J Immunol (2007) 37(12):3445–54. doi: 10.1002/eji.200737126
52. Yoshie O, Matsushima K. CCR4 and its ligands: From bench to bedside. Int Immunol (2015) 27(1):11–20. doi: 10.1093/intimm/dxu079
53. Al-Banna NA, Vaci M, Slauenwhite D, Johnston B, Issekutz TB. CCR4 and CXCR3 play different roles in the migration of T cells to inflammation in skin, arthritic joints, and lymph nodes. Eur J Immunol (2014) 44(6):1633–43. doi: 10.1002/eji.201343995
54. Skadow M, Shevach EM, Thornton AM. Helios Plays a critical role in the effective differentiation of naive CD4+ T cells in vivo. J Immunol (2017) 198(1 Supplement):223.8–.8. doi: 10.4049/jimmunol.198.Supp.223.8
55. Akimova T, Beier UH, Wang L, Levine MH, Hancock WW. Helios Expression is a marker of T cell activation and proliferation. PloS One (2011) 6(8):e24226. doi: 10.1371/journal.pone.0024226
56. Koizumi SI, Ishikawa H. Transcriptional regulation of differentiation and functions of effector T regulatory cells. Cells. (2019) 8(8):939. doi: 10.3390/cells8080939
57. Hayes ET, Hagan CE, Khoryati L, Gavin MA, Campbell DJ. Regulatory T cells maintain selective access to IL-2 and immune homeostasis despite substantially reduced CD25 function. J Immunol (2020) 205(10):2667–78. doi: 10.4049/jimmunol.1901520
58. Smigiel KS, Richards E, Srivastava S, Thomas KR, Dudda JC, Klonowski KD, et al. CCR7 provides localized access to IL-2 and defines homeostatically distinct regulatory T cell subsets. J Exp Med (2014) 211(1):121–36. doi: 10.1084/jem.20131142
59. Mempel TR, Marangoni F. Guidance factors orchestrating regulatory T cell positioning in tissues during development, homeostasis, and response. Immunol Rev (2019) 289(1):129–41. doi: 10.1111/imr.12761
60. Togashi Y, Shitara K, Nishikawa H. Regulatory T cells in cancer immunosuppression - implications for anticancer therapy. Nat Rev Clin Oncol (2019) 16(6):356–71. doi: 10.1038/s41571-019-0175-7
61. Thornton AM, Lu J, Korty PE, Kim YC, Martens C, Sun PD, et al. Helios(+) and helios(-) treg subpopulations are phenotypically and functionally distinct and express dissimilar TCR repertoires. Eur J Immunol (2019) 49(3):398–412. doi: 10.1002/eji.201847935
Keywords: T cell, regulatory T cell, alcohol, T cell activation, effector T cell
Citation: Paterson CW, Gutierrez MB, Coopersmith CM and Ford ML (2023) Impact of chronic alcohol exposure on conventional and regulatory murine T cell subsets. Front. Immunol. 14:1142614. doi: 10.3389/fimmu.2023.1142614
Received: 11 January 2023; Accepted: 07 March 2023;
Published: 17 March 2023.
Edited by:
Guang Sheng Ling, The University of Hong Kong, Hong Kong SAR, ChinaReviewed by:
Judith F. Ashouri, University of California, San Francisco, United StatesRobert Wade Siggins, Louisiana State University, United States
Copyright © 2023 Paterson, Gutierrez, Coopersmith and Ford. This is an open-access article distributed under the terms of the Creative Commons Attribution License (CC BY). The use, distribution or reproduction in other forums is permitted, provided the original author(s) and the copyright owner(s) are credited and that the original publication in this journal is cited, in accordance with accepted academic practice. No use, distribution or reproduction is permitted which does not comply with these terms.
*Correspondence: Mandy L. Ford, bWFuZHkuZm9yZEBlbW9yeS5lZHU=
†These authors have contributed equally to this work