
95% of researchers rate our articles as excellent or good
Learn more about the work of our research integrity team to safeguard the quality of each article we publish.
Find out more
ORIGINAL RESEARCH article
Front. Immunol. , 10 March 2023
Sec. Cancer Immunity and Immunotherapy
Volume 14 - 2023 | https://doi.org/10.3389/fimmu.2023.1135657
This article is part of the Research Topic The challenge of immunity evaluation and immunotherapy in gynecologic and urologic oncology View all 7 articles
 Shijie Yao1,2,3†
 Liyang Zhao4,5†
 Siming Chen6†Hua Wang1,2,3
 Yang Gao1,2,3
 Ning-Yi Shao4,5*
 Mengyuan Dai1,2,3*
 Hongbing Cai1,2,3*
Background: The immune microenvironment is of great significance in cervical cancer. However, there is still a lack of systematic research on the immune infiltration environment of cervical cancer.
Methods: We obtained cervical cancer transcriptome data and clinical information from the Cancer Genome Atlas (TCGA) and the Gene Expression Omnibus (GEO) databases, evaluated the immune microenvironment of cervical cancer, determined immune subsets, constructed an immune cell infiltration scoring system, screened key immune-related genes, and performed single-cell data analysis and cell function analysis of key genes.
Results: We combined the TCGA and GEO data sets and obtained three different immune cell populations. We obtained two gene clusters, extracted 119 differential genes, and established an immune cell infiltration (ICI) scoring system. Finally, three key genes, IL1B, CST7, and ITGA5, were identified, and single-cell sequencing data were mined to distribute these key genes in different cell types. By up-regulating CST7 and down-regulating IL1B and ITGA5, cervical cancer cells’ proliferation ability and invasion ability were successfully reduced.
Conclusion: We conducted a comprehensive assessment of the state of the tumor immune microenvironment in cervical cancer, constructed the ICI scoring system, and identified the ICI scoring system as a potential indicator of susceptibility to immunotherapy for cervical cancer, identifying key genes suggesting that IL1B, CST7, and ITGA5 play an essential role in cervical cancer.
With almost 311,000 women dying from cervical cancer in 2018 (1), it is one of the most prevalent malignancies in humans (2) and one of the leading global causes of mortality for women (3). Cervical cancer also has a substantial influence on the physical and mental health of women. It is generally recognized that the primary causes of cervical cancer are chronic HPV infection and failure of HPV clearance (4). Early injection of the HPV vaccine can effectively prevent cervical cancer (5, 6). However, it does not remove the HPV that has already been infected (7). Surgery, radiation, and chemotherapy are the most prevalent treatment options for cervical cancer, depending on the stage (8). However, most patients are already in critical condition when diagnosed (9, 10) and have missed the window for surgical intervention (11). The prognosis for people with metastatic and recurring forms of the illness remains dismal despite improvements in cervical cancer detection, treatment, diagnosis, and prevention (12). Additionally, a patient’s heterogeneity may cause certain cervical cancer patients’ resistance to immunotherapy, targeted therapy, and chemotherapy (13). Finding new therapeutic targets to improve cervical cancer patients’ prognoses is thus essential (14, 15).
There is mounting evidence that cancer and immune microenvironment modification are tightly connected (16–18). Immune cells and tumor cells interact, and an imbalance between them controls the formation of tumors. All forms of cancer are characterized by immunological escape from immune monitoring (19). One of the critical mechanisms of immunological escape is thought to be the activation of immune checkpoints. Immune checkpoint inhibitors are regarded as a successful treatment strategy, and Immunotherapy has a smaller off-target effect than chemotherapy drugs (20). Immune checkpoint inhibitors have now received FDA approval for first- and second-line treatment for various cancers (21), and favorable effectiveness has been seen in patients with metastasis and recurrence (22), such as the cytokines interferon-alpha (20), the interleukin-2 (IL-2) (23). Immunotherapy has grown in importance as a treatment for cervical cancer (24–26); precise regulation of immune targets can maximize its effectiveness (27, 28). For instance, activating immunological targets makes it easier for T lymphocytes to get activated, which is beneficial for immunotherapy, for example, cytotoxic T lymphocyte-associated protein 4 (CTLA-4) and programmed cell death 1 (PD-1) (25). A novel technique for assessing the tumor immune microenvironment was also established by Yoshihara et al. (29, 30), which is more beneficial for tumor immunotherapy and for determining which patients may benefit from immunotherapy.
The TCGA and GEO databases provided transcriptome and clinical data on patients with cervical cancer for this investigation. We measured and assessed the immune microenvironment of cervical cancer and performed a cluster analysis on the patient population using the ICI score. The intrinsic association of gene mutations was assessed using the ICI score group to forecast the possible chemical advantages of immunotherapy for cervical cancer patients.
We retrieved the Cancer Genome Atlas (TCGA) (https://portal.gdc.cancer.gov/) database’s microarray data set and associated clinical information for cervical cancer, and 306 cervical cancer samples were utilized for further investigation. The Gene Expression Omnibus (GEO) database was searched for, and the microarray data set for the GSE30759 chip was acquired; it comprises data on 48 cervical cancer patients. Only cervical cancer patients with comprehensive data, such as status and overall survival time, were gathered. Transcripts per kilobase million (TPM value) of the microarray data set (FPKM value) were translated to preserve compatibility between the two databases. The original data of the GSE30759 chip obtained from the GEO database was unified, and then the gene probes were annotated.
Combined TCGA and GEO databases to assess cervical cancer’s tumor immune microenvironment level. Based on 547 gene expression values, the proportion of cervical cancer samples with mixed cell types in 22 different immune cell subpopulations was evaluated using the CIBERSORT algorithm to obtain the ICI score matrix for different immune cells. Used the R package “ConsensuClusterPlus” for analysis and iterated 1,000 times to obtain stable classification results. Analyzed the distinctive characteristics of the stromal and immune cell transcription patterns in cervical cancer and deduced tumor cellularity and tumor purity using the ESTIMATE algorithm.
Using the R package “limma,” differentially expressed genes (DEGs) were found, where the absolute folding change>1 and the critical value standard P<0.05 were considered to be statistically different. The data were split into different genomic clusters according to the DEGs value using unsupervised clustering. Gene features are positively correlated with gene cluster A, whereas gene characteristics are negatively correlated with gene cluster B. The first principal component (PC1) produced by principal component analysis (PCA), after dimensionality reduction analysis using the Boruta approach, was chosen as the feature score, two PC1 values were obtained for each sample, the optimal cutoff value was taken as the dividing line and divided into high ICI score group or low ICI score group. ICI scores were generated for each instance using the gene expression rank index approach, using the formula:
Gene ontology (GO) analysis was carried out on the two gene clusters to understand their biological roles better. Gene Set Enrichment Analysis (GSEA) based on two ICI score grouping, P<0.05, was determine statistically different.
The TCGA database gathered data on somatic mutations in cervical cancer. Data on somatic mutations were examined and categorized using the ICI score system. The “maftools” package was used to identify the 20 mutated genes in both mutation data sets.
The Genomics of Drug Sensitivity in Cancer (GDSC) website (https://www.cancerrxgene.org/) provided information on the drug’s predicted half-maximal inhibitory concentration (IC50), and variations in drug sensitivity to Cisplatin, 5-Fluorouracil, Vinblastine, Vincristine, Paclitaxel, Docetaxel, Gemcitabine, Cyclophosphamide, Topotecan, Epirubicin, Olaparib, Dactinomycin were evaluated among ICI score groups.
Cervical cancer tissue samples were collected from patients before receiving immunotherapy at Wuhan University Central South Hospital. Tissues were fixed with formalin and then embedded with paraffin. All samples were stored at room temperature 20°C-25°C. All specimens were diagnosed and agreed upon by at least two pathologists based on pathological features. Finally, this study included 16 cases of cervical cancer tissues that had received immunotherapy. The Zhongnan Hospital of Wuhan University ethical committee approved the research (ethics number: 2020029).
Cervical cancer tissues were fixed with formalin, followed by paraffin embedding to obtain 4um thick sections of tumor tissue. Paraffin-embedded portions were dewaxed with xylene and ethanol, hydrated and blocked paraffin sections. Sections were treated with primary antibodies, which were then incubated with them overnight in a moist box kept at 4°C. After that, PBS was used to wash the parts three times for a total of eight minutes each. The sections were then treated with secondary antibodies for 30 minutes at room temperature before being rinsed with PBS. Visualized with 3,5-diaminobenzidine (DAB) substrate kit and restrained with hematoxylin for 2 min. We divided the staining intensity of CD8A, CXCL10 and GZMB into 1, 2, 3 or 4. The stronger the staining, the higher the score. Two pathologists evaluated the expression of CD8A, CXCL10, and GZMB in the tissue microarrays in a blind manner.
Xylene was used to dewax paraffin-embedded (FFPE) tissue sections (4 m) before they were hydrated with a series of graded ethanol solutions in deionized water. Blocking was performed by adding 3% H2O2 and left for 25min at room temperature protected from light, then rinsed three times with PBS for 5min each. 3% BSA was added and incubated for 30min. Serial staining was performed with the following antibodies, CD3, CD4, CXCL10, CD8A, and GZMB, and incubation was maintained overnight at 4°C. Next, the sections were shaken in PBST (pH 7.4) for three washes, each lasting 8 min. Anti-rabbit polymeric horseradish peroxidase-labeled secondary antibody was subsequently added and incubated for 50 min, protected from light. Tyrosine-CY3 was then introduced and continued to work for 20 minutes. Three PBST washes were then performed, each lasting for five minutes. DAPI staining solution was added to stain nuclei for 10 min. Sections were sealed with anti-fluorescence quenching sealer. Under the excitation of UV light, blue light represents DAPI-stained nuclei, and red light, green light, and pink light represent the corresponding fluorescein-labeled nuclei, respectively.
Univariate Cox regression analysis was used to assess each DEG’s expression levels. Multivariate Cox regression analysis was used to identify the three key genes, CST7, IL1B, and ITGA5, with the greatest predictive power. Patients were divided into high and low risk groups based on the results of the median risk assessment. Kaplan-Meier curves were used to describe overall survival rates, and the precision of the model’s predictions was evaluated using the AUC of the ROC curve.
Data used in this study were publically available and downloaded from the Gene Expression Omnibus and Genome Sequence Archive (GSE168652) (31), included two samples: tumor and normal), and Seurat (32) was used to perform the next analysis. Low-quality cells were filtered according to the original articles and our requirement: cells with less than 200 expressed genes or > 15% of mitochondrion-derived counts or< 0.8 of the number of genes detected per UMI were removed. All cells that passed QC were normalized to identify the top 2000 high-variable genes. Mitochondrial score and ribosome score and cell cycle were regressed in the ScaleData function to remove batch effects. Then the top 20 principal components (PCs) were selected by the RunPCA function and were set in the RunUMAP function and RunTSNE function to reduce dimensions and in cell clustering. Subsequently, the main cell clusters were identified with the FindClusters function with the method “original Louvain algorithm”. Method “MAST” in FindAllMarkers function was used to identify marker genes of different clusters, DEGs were selected by P<0.05, and cell types of clusters are first identified by singleR and Cell Markers database, then they are manually corrected by the markers in the original article. The different immune cells and non-immune cell expression matrices and metadata were imported into monocle2 (33). The high variable genes identified by monocle2 were used for pseudo-trajectory analysis to identify cell differentiation trajectories and identify dynamical expression genes. The dynamical expression heatmaps were shown by the plot-pseudotime-heatmap function. Then we imported the expression matrix and metadata into CellChat (34), CellChat provides a database of ligand receptors in humans and mice to identify cell-cell actions in single-cell datasets. We first identified the different numbers and strengths of cell interactions between immune cells and non-immune cells to find the main sources and outputs of different types of cells, and we used Euclidean distance and information flow to infer the conservative and specific cell-cell communication signal pathways and ligand-receptor pairs that mediate cell communication of cell groups(thresh<0.05).
In DMEM conditions containing 10% FBS, cells from the Hela and Siha cell lines were cultured. We purchased si-IL1B and si-ITGA5 from GenePharma. The following is the corresponding assay sequence of IL1B and ITGA5: si-IL1B: 5’-GATGTCTGGTCCATATGAA-3’; si-ITGA5: 5’-ACGAACCTCTTCTGTGATGGA-3’. We obtained the pGL4.10-CST7 promoter plasmid from Obio Technologies, Inc. Lipofectamine 2000 was used for cell transfection.
Cells (3000/well) were inoculated on 96-well plates for the MTT assay, and absorbance was recorded at various time intervals to gauge cell viability.
Cells (2000/well) were inoculated in 6-well plates for the clonogenic assay, fixed after 14 days, and stained with crystal violet.
Thirty thousand cells were inoculated in the top chamber (Corning) of the Transwell migration test using serum-free media to promote migration to the bottom chamber. Then, cells were added in transwell chambers with or without matrigel covered in the chambers for invasion andmigration detection, respectively. The cells were fixed and stained after 24 hours. Using NIH ImageJ software, migratory cells were counted in three randomly chosen fields in each well.
Following the manufacturer’s instructions, we extracted total RNA using the RNeasy mini kit (Cat. #74,101, Qiagen). The amount of RNA was then measured, and cDNA was produced using the reverse transcription. Real-time reverse transcription-PCR (qRT-PCR) was used to evaluate the cDNA, and the iQ™ SYBR® Green Super Mix (Bio-RAD) was used. The following were the primer sequences:
GAPDH:5’-GGAGCGAGATCCCTCCAAAAT-3’,5’-GGCTGTTGTCATACTTCTCATGG-3’.
IL1B: 5’-ATGATGGCTTATTACAGTGGCAA-3’, 5’-GTCGGAGATTCGTAGCTGGA-3’; ITGA5:5’-AGACATTCGATCCCTCTACAACT-3’, 5’-AATCGGCCAAACTCATCATGG-3’;
CST7: 5’-TTGTTCAAGGAGTCCCGCATC-3’, 5’-GTCACAGTCATCCAGACGCA-3’;
After placing the cells in RIPA buffer (MilliporeSigma), which contains phosphatase inhibitor and protease inhibitor, and lysing them on ice for 30 minutes, the supernatant was collected by high-speed centrifugation. Protein extract samples were run through SDS-PAGE gels to separate them. They were then put on PVDF membranes, covered with 5% skim milk, and subjected to primary and secondary antibody incubation.
The Wilcoxon test compared two sets of data, while the Kruskal-Wallis test was used when there are more than two data groups. The Kaplan-Meier curve was used to visualize the results of the survival analysis (log-rank test). Built heat maps using the “pheatmap” package. The link between the ICI score subgroups and the incidence of somatic mutations was examined using a chi-square test and Spearman correlation analysis. Further analysis of the results of the CIBERSORT method was found statistically meaningful with a P<0.05. Each analysis was performed using the R program (version 4.1.1).
We searched public databases and merged 354 cervical cancer date from the TCGA and GEO databases. Based on the ESTIMATE and CIBERSORT algorithms, evaluated the immune cell subsets of cervical cancer and the immune characteristics of cervical cancer. According to the results of the CIBERSORT algorithm, unsupervised clustering of 22 immune cell types led to the discovery of three separate ICI clusters (Supplementary Figure 1; Figure 1A). The three separate ICI clusters’ overall survival rates were significantly different from one another(P=0.019) (Figure 1B); among them, the prognosis for Cluster B is the best, while Cluster C is the worst. To investigate potential relationships between immune cell infiltration and immune cell clusters, we examined the immune cell composition in three distinct clusters (Figure 1C). We discovered significant differences in immune scores between the three clusters but no differences in stromal scores. The relationship between the different immune cell infiltrates was shown using a heat map (Figure 1D). T cells CD8 and T cells CD4 memory activated demonstrated greater levels of activation in cluster B. In Cluster C, there are more Dendritic cells resting, NK cells activated, Mast cells resting, and T cells CD4 memory resting. Additionally, in order to more thoroughly examine the innate immunotherapy potential of various immune cell clusters, we analyzed the level of prominent immune checkpoints in these three ICI clusters. It showed that CTLA4 (Figure 1E), PD-L1 (Figure 1F), and PD-1 (Figure 1G) had higher expression levels in cluster B.
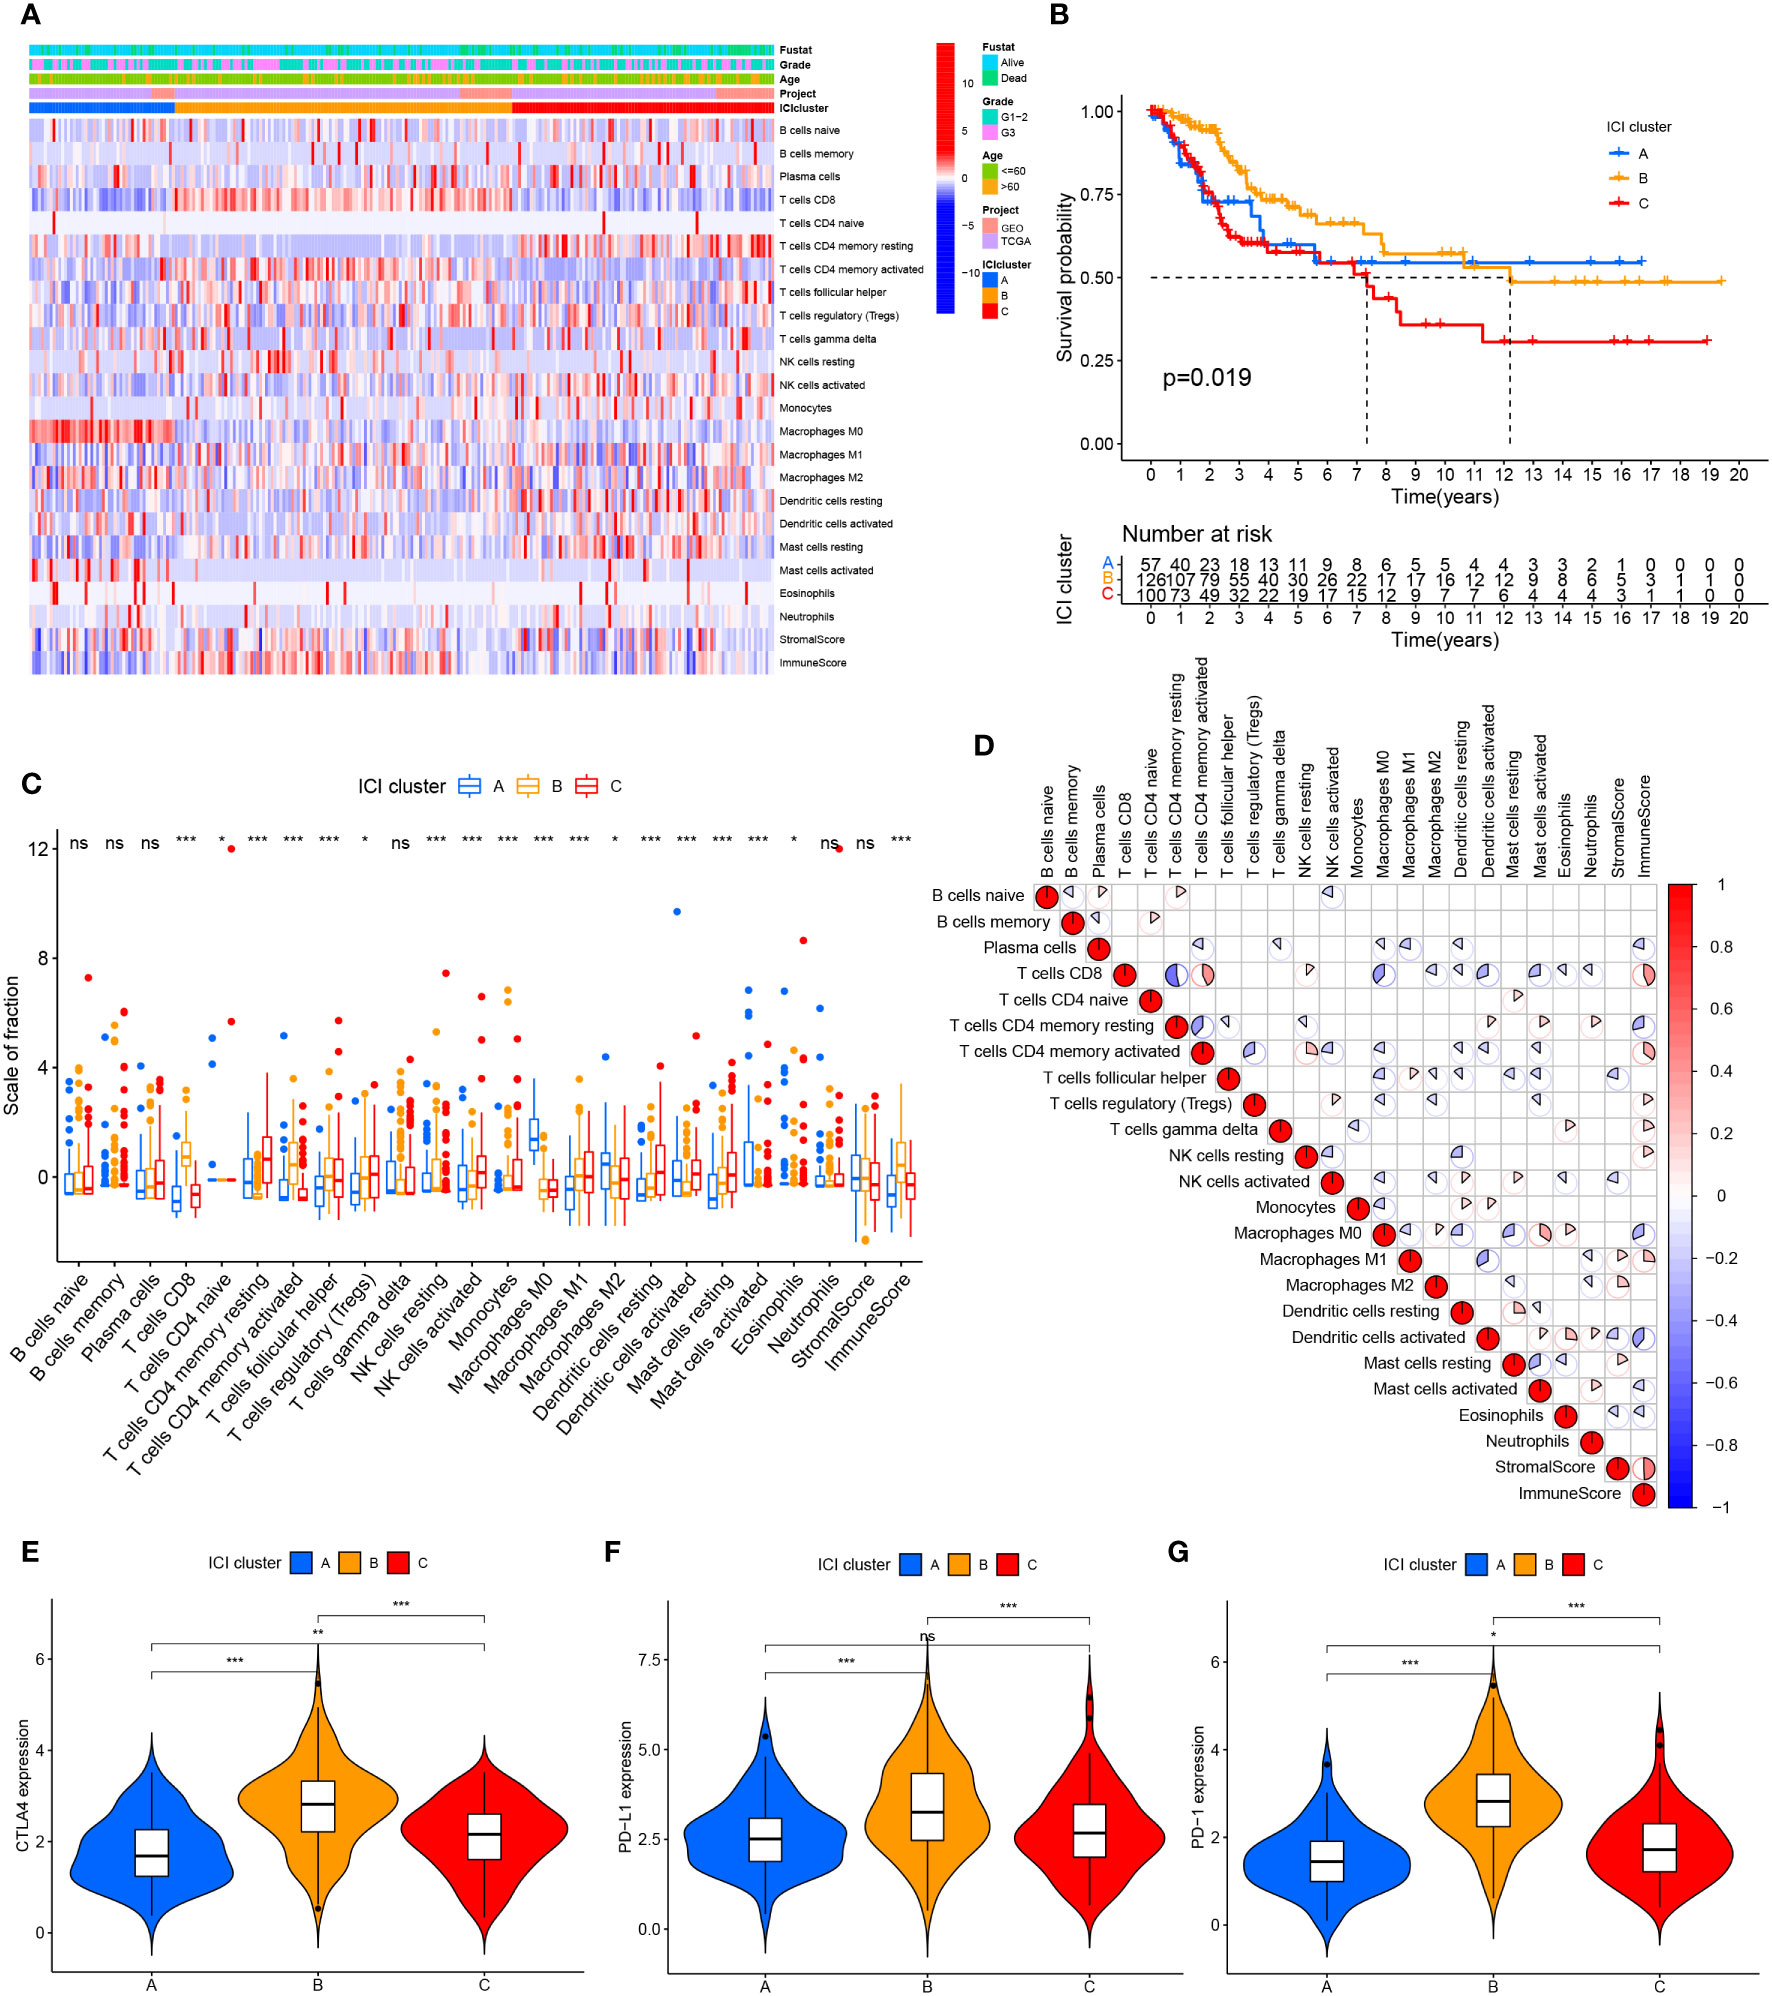
Figure 1 Cervical cancer tumor immune cell microenvironment landscape. (A) Used CIBERSORT algorithm unsupervised clustering of 22 immune cells on cervical cancer patients from TCGA and GEO databases. Clustered patients into three groups based on the degree of immune infiltration. Tumor immune infiltrating cells were represented by rows, and cervical cancer patient samples were represented by columns. (B) ICI clusters A, B, and C cervical cancer patients’ overall survival was shown using the Kaplan-Meier curve, log-rank test, P=0.019. (C) ICI clusters A, B, and C’s stromal scores, immune scores, and subgroups of 22 tumor immune cell infiltration levels are all included. (D) Intrinsic relationship between immunological score and tumor immune cell invasion. (E–G) differences in the three ICI clusters’ CTLA4, PD-L1, and PD-1 expression levels. ns, No significance, *P < 0.05, **P < 0.01, ***P < 0.001.
To compare the variations in transcriptional expression across the three distinct ICI clusters, we utilized the “limma” package to obtain 119 DEGs from 3 ICI clusters. Unsupervised clustering was used to separate the samples from the TCGA and GEO datasets into distinct gene groups, which were given gene cluster A and B (Figure 2A; Supplementary Figure 2), genes in gene cluster A are connected with characteristics in a positive way, whereas genes in gene cluster B are correlated with traits in a negative one. The Kaplan-Meier curve was used to compare the overall survival between the two gene clusters. There was no significant difference in the overall survival between the two gene clusters (P=0.441) (Supplementary Figure 3A). However, when comparing the median survival time between the two, we found that the median survival time was higher for gene cluster A. We performed GO enrichment analysis on two gene clusters, and it showed that gene cluster A was mainly enriched in immune cell activation and immune signal transmission pathway, and it was an important part of the cell transmembrane signal transmission process (Figure 2B). In gene cluster B, it showed strong enrichment characteristics during the development and differentiation of the epidermis and matrix (Figure 2C). The infiltration level of 22 immune cells in two gene clusters was examined using the CIBERSORT algorithm to learn more about the potential roles of different gene clusters in the immunological milieu (Figure 2D). The majority of the immune cells in gene cluster B have been discovered to have a higher active degree of immune infiltration. This implied that gene cluster B was in a state of immune activation. In addition, in gene cluster B, immune-related genes CTLA4, PD-L1, and PD-1 all had higher levels of expression (Figures 2E–G), which indicates that immunotherapy can exert a better effect in gene cluster B.
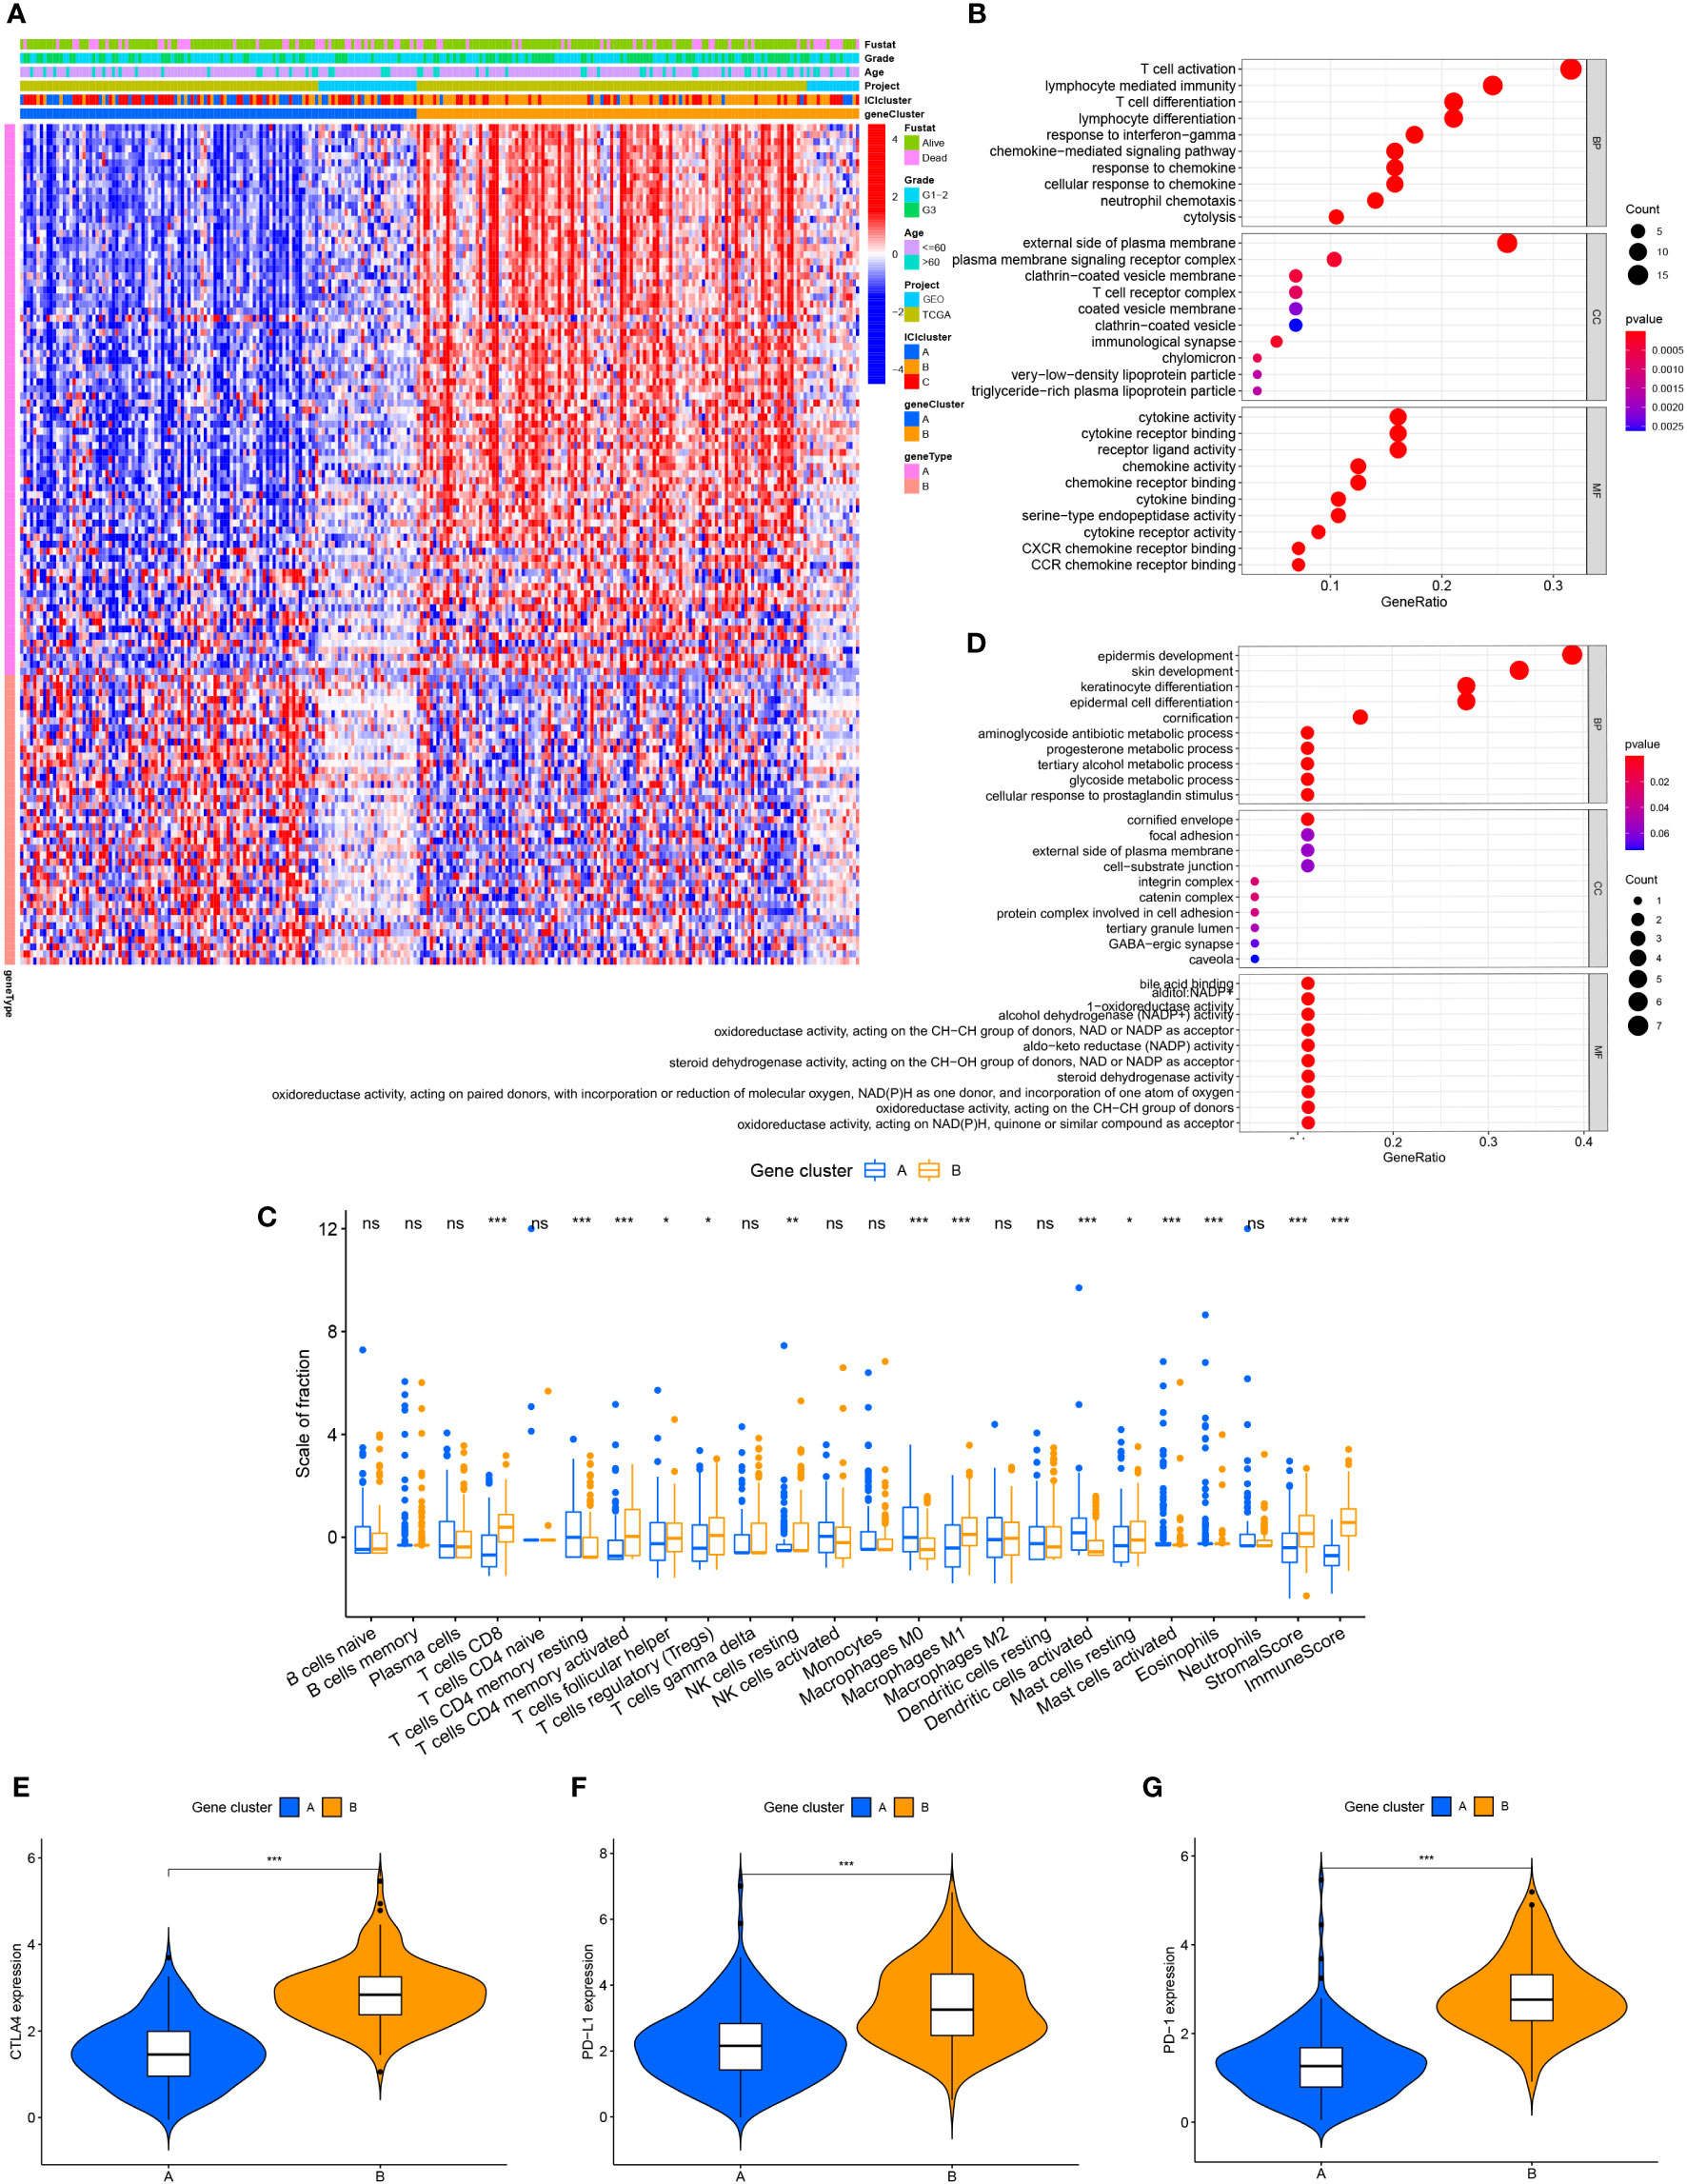
Figure 2 The production of immune internal genes and subtype classification. (A) Gene clusters A and B were used to separate patients into two categories using unsupervised clustering of shared DEGs generated from three ICI cluster groupings. (B) Gene ontology (GO) enrichment analysis of gene cluster A. (C) Gene ontology (GO) enrichment analysis of gene cluster B. (D) Tumor immune cell infiltration subgroups of gene cluster A and B, as well as stromal score and immune score. (E–G) The differences in CTLA4, PD-L1, and PD-1 expression between gene clusters A and B. ns, No significance, *P < 0.05, **P < 0.01, ***P < 0.001.
We performed a PCA analysis to quantify the combined factors of immune cell infiltration in cervical cancer. Recorded the sum of the individual scores of each sample as the ICI scores of two gene clusters to construct an ICI scoring system based on ICI phenotypic characteristics. Sankey diagrams depict the pattern of various gene clusters, ICI scores, and patient survival rates for cervical cancer (Figure 3A). When the survival prognosis of the high and low ICI score groups was compared using the Kaplan-Meier curve, the overall survival of the high ICI score group was greater (P=0.002) (Figure 3B). Used GSEA to analyze the function of the KEGG cell pathway, immune cell activation, immune cell killing and antigen presentation, and other immune cell working pathways were the main enriched pathways in the high ICI score group; growth of stromal cells was the main enrichment pathway in the low ICI score group (Figure 3C). To more effectively assess the ICI score’s effectiveness in predicting the prognosis of cervical cancer, we combined different clinical traits and performed a correlation analysis of the clinical traits between different ICI score groups (Supplementary Figure 3B), it showed that for patients with different grades, the patients with the worse grade had higher ICI scores (P=0.04). However, when we examined the relationship between various age groups and ICI scores, we discovered no statistically significant difference (P=0.23) (Supplementary Figure 3C). We also analyzed the survival prognosis in these two ICI score groups with different clinical characteristics. In patients under 60 years of age, overall survival was higher in patients with high ICI scores (p=0.005) (Figure 3D), and the same findings were also seen in the G1-2 patient group with high ICI scores (P=0.024) (Figure 3F). However, in the group of people older than 60 years (Figure 3E) and the G3 stage group (Figure 3G), there were no significant differences between the two ICI score groups.
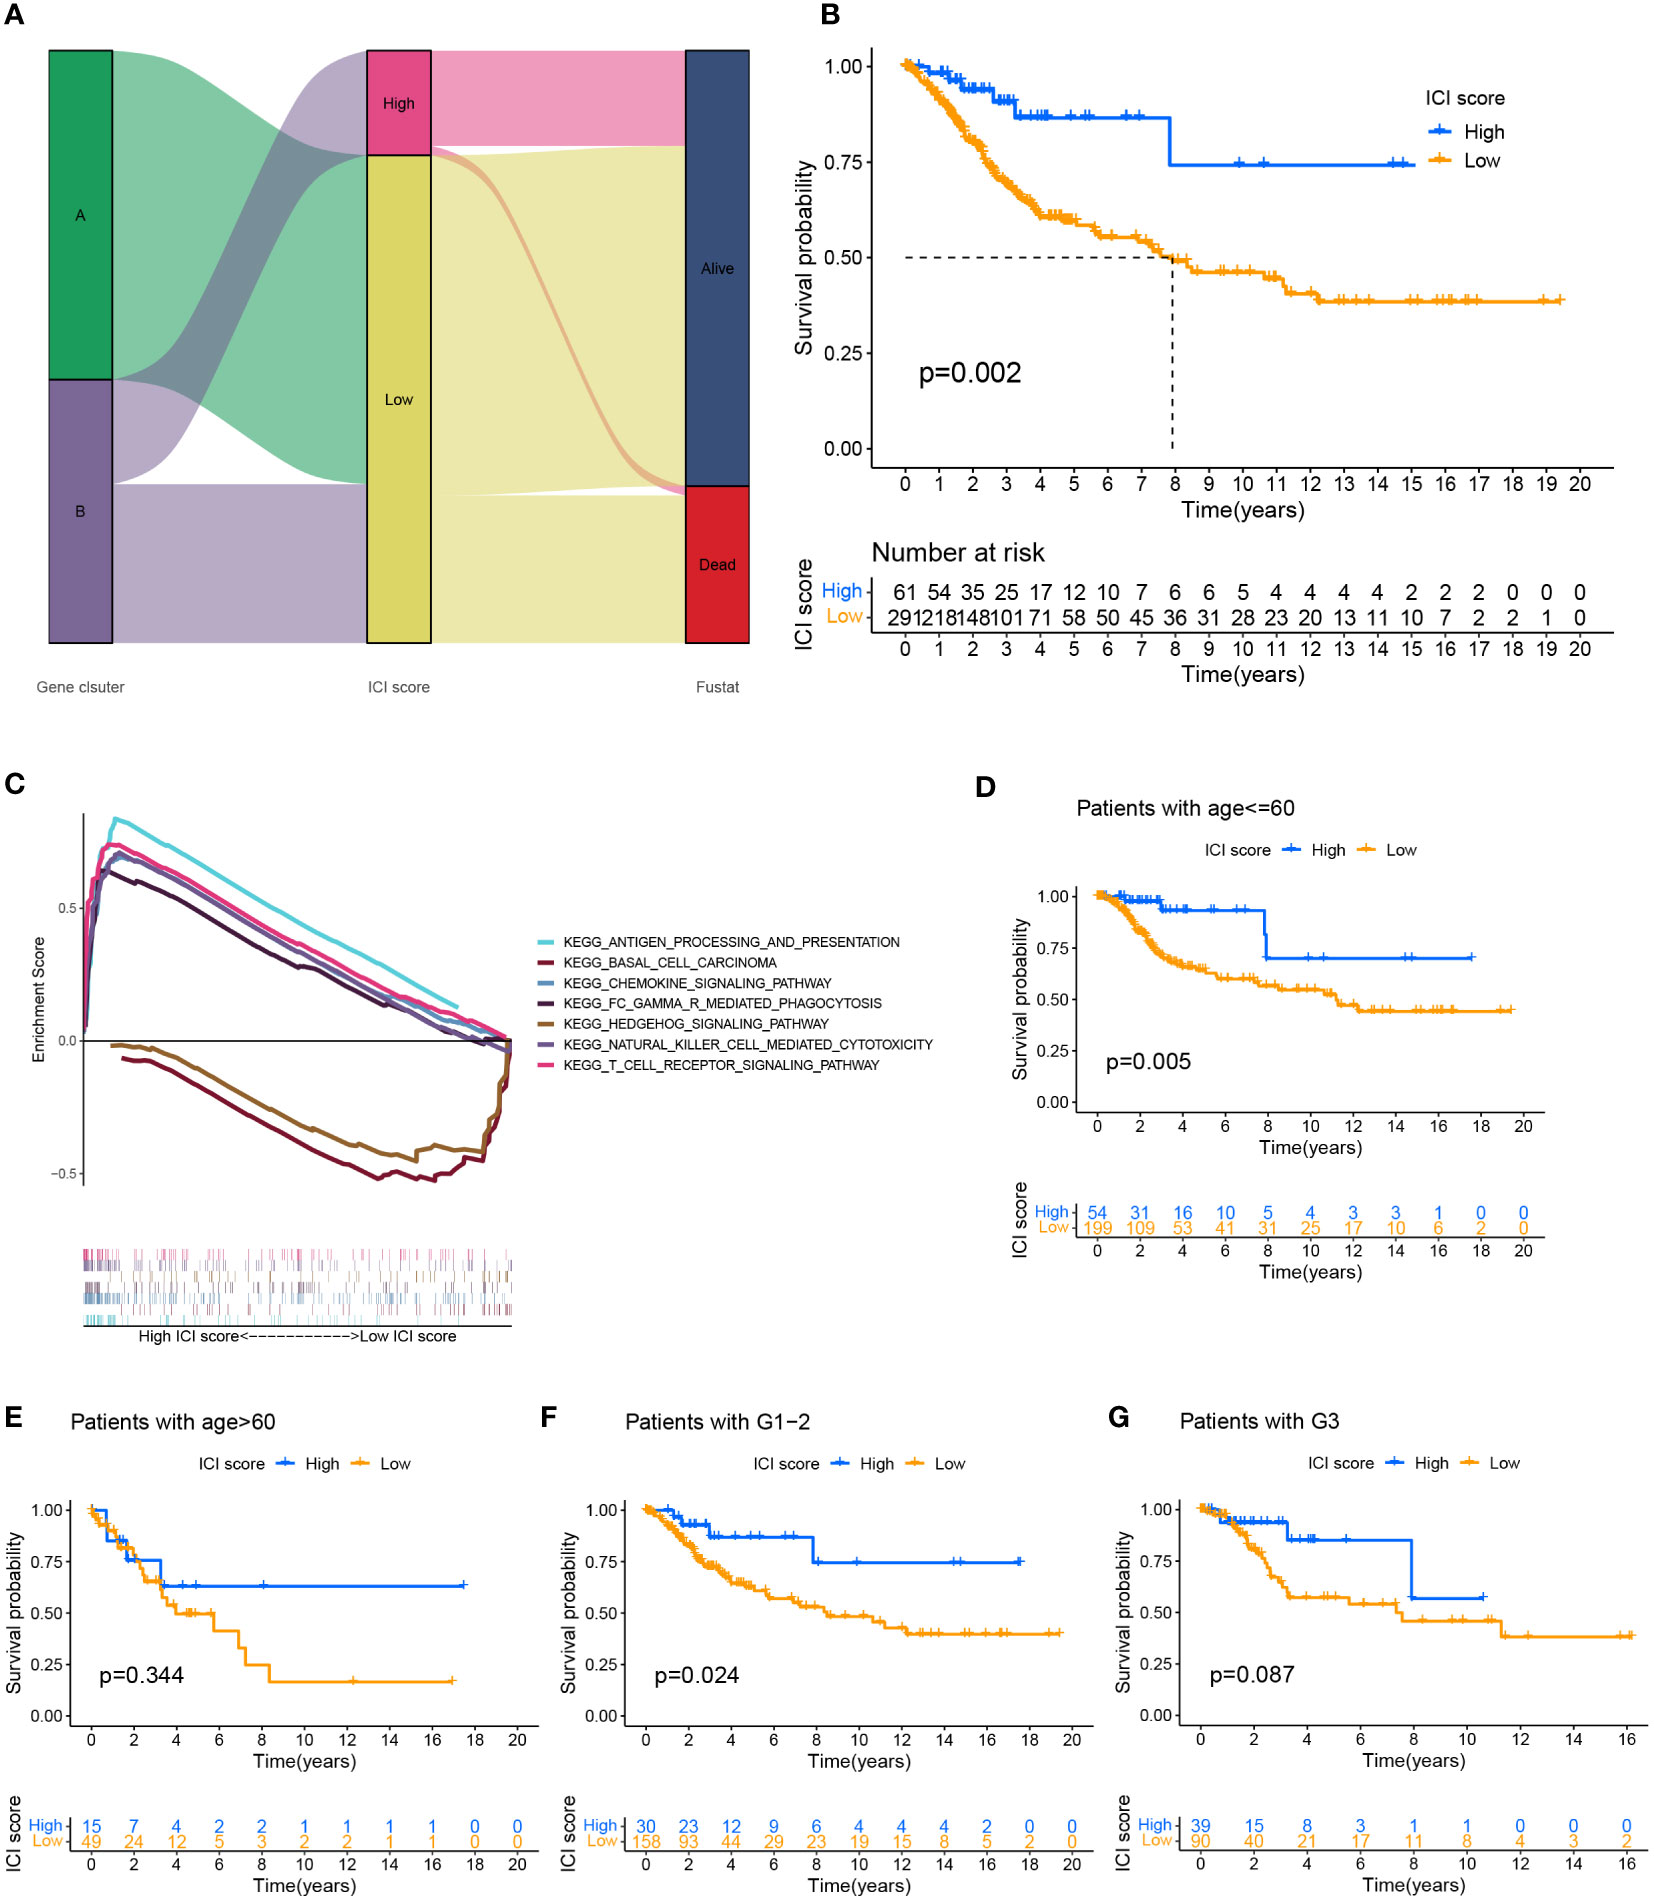
Figure 3 Establishment of ICI scoring system. (A) Used the Sankey chart to depict the correlation between two gene clusters, different ICI scores, and different living conditions. (B) Plotted the Kaplan-Meier curve (log-rank test) to display the two ICI score groups’ overall survival rates (P=0.002). (C) GSEA analysis of high and low ICI score groups associated with KEGG enrichment. Survival analysis of ICI score subgroups of different clinical traits. (D, E) The overall survival rate of cervical cancer patients of various ages in two ICI score groups was shown using the Kaplan-Meier curve. Patients with cervical cancer under the age of 60 showed higher overall survival in the group with high ICI scores (P=0.005). The overall survival rate for individuals older than 60 years old was not significantly different between the groups with high and low ICI scores (P=0.334). (F, G) Kaplan-Meier curve of cervical cancer patients in two ICI score groups with varying grades, log-rank test. High ICI scores among cervical cancer patients with low grades were associated with improved overall survival (P=0.024). There was no variation in the survival prognosis of high-grade patients across ICI score categories (P=0.087).
Somatic mutations often occur in nature; when the tumor mutation burden (TMB) increases, it can lead to the production of new antigens and induce anti-cancer responses in immune cells, which also provides opportunities for immunotherapy, high TMB suggests benefit for immunotherapy of tumors (35). Somatic mutations (SNVs) data for cervical cancer were obtained from the TCGA database to investigate the potential relationship between tumor mutation burden in the immune microenvironment of cervical cancer and ICI scores. Exploring the difference in TMB between the two ICI score groups revealed that the group with higher ICI score had a higher TMB index (p=0.0017) (Supplementary Figure 4A) and a positive correlation between the two variables (Spearman coefficient: R=0.19, P=0.0013) (Supplementary Figure 4B). In addition, overall survival was more satisfactory in the high mutation burden group compared to the low mutation burden group (P=0.042) (Supplementary Figure 4C). In order to do a stratified survival prognosis analysis, we integrated the ICI scores and TMB. The survival outcomes of these four different subgroups were significantly different (P=0.007) (Supplementary Figure 4D).
The “maftools” package was used to identify the top 20 genes most likely to be mutated in each ICI score group to determine the genes with the most significant mutation risk in each ICI score subgroup (Supplementary Figures 4E, F), including missense, nonsense. Additionally, we discussed a possible connection between TMB and ICI scores (Table 1).
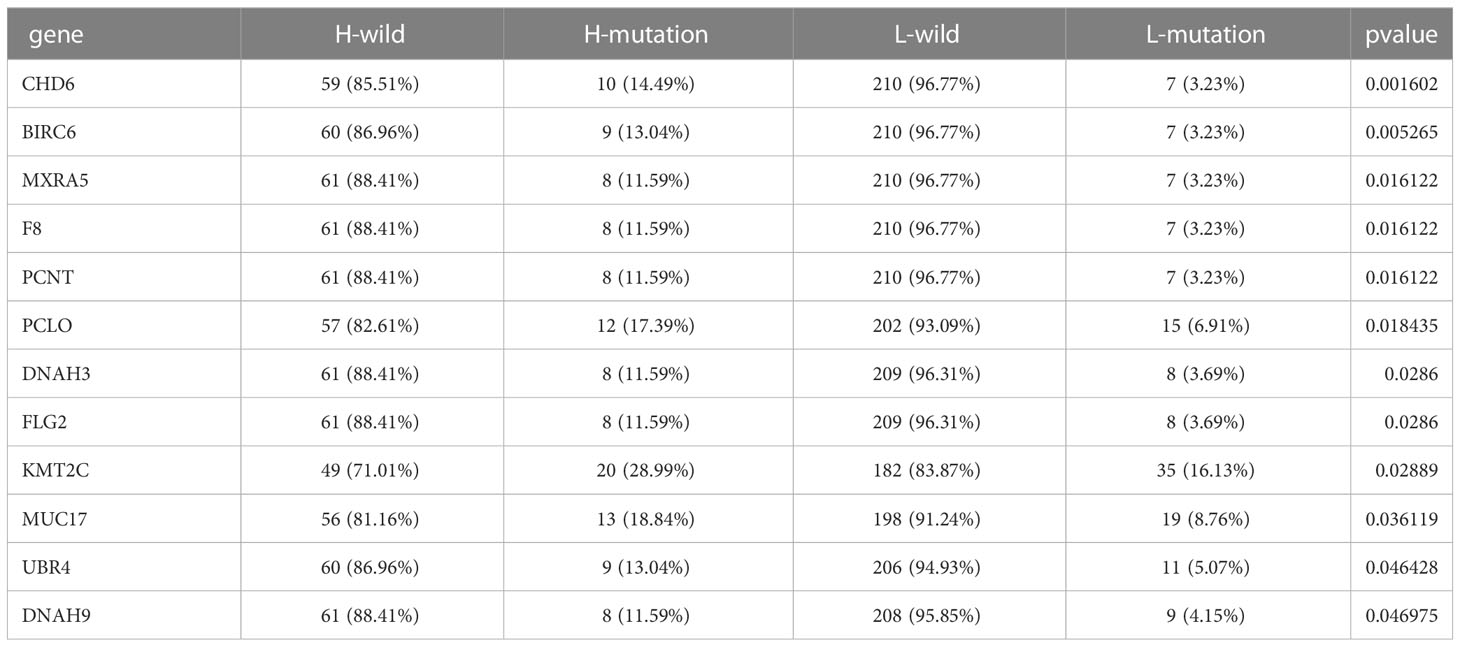
Table 1 The internal connection between ICI score and mutation load.
Immune checkpoint-related genes such as PDCD1(PD-1), GZMB, CD274(PD-L1), and CTLA4, as well as immune activation-related genes CD8A and CXCL10, were used as characteristic genes to assess the immune activity of the two ICI score groups. The expression levels of these genes were compared. The results revealed that the expression of all these genes was higher in the high ICI score group (Figure 4A). To investigate the potential correlation between ICI scores and immunotherapy, we included 16 cervical cancer patients who had received PD1, PDL1, and VEGF immunotherapy, and obtained cervical tissues from these patients prior to receiving immunotherapy. The Response Evaluation Criteriain Solid Tumours (RECIST) efficacy assessment method was used to evaluate the immunotherapy effect of these patients, among which 5 patients were sensitive to immunotherapy and 11 patients were resistant to immunotherapy. IHC results revealed that patients who responded well to immunotherapy had higher expressions of CD8A, CXCL10, and GZMB (Figure 4B). Next, we performed a further evaluation using mIHC, in which patient1 showed immunotherapy resistance and patient2 and patient3 showed immunotherapy sensitivity. It can be seen that in the immunotherapy-sensitive group, the expressions of CD45, CD3 and CD4 were all increased, in addition, the expressions of CD8A, CXCL10 and GZMB were also increased (Figure 5).
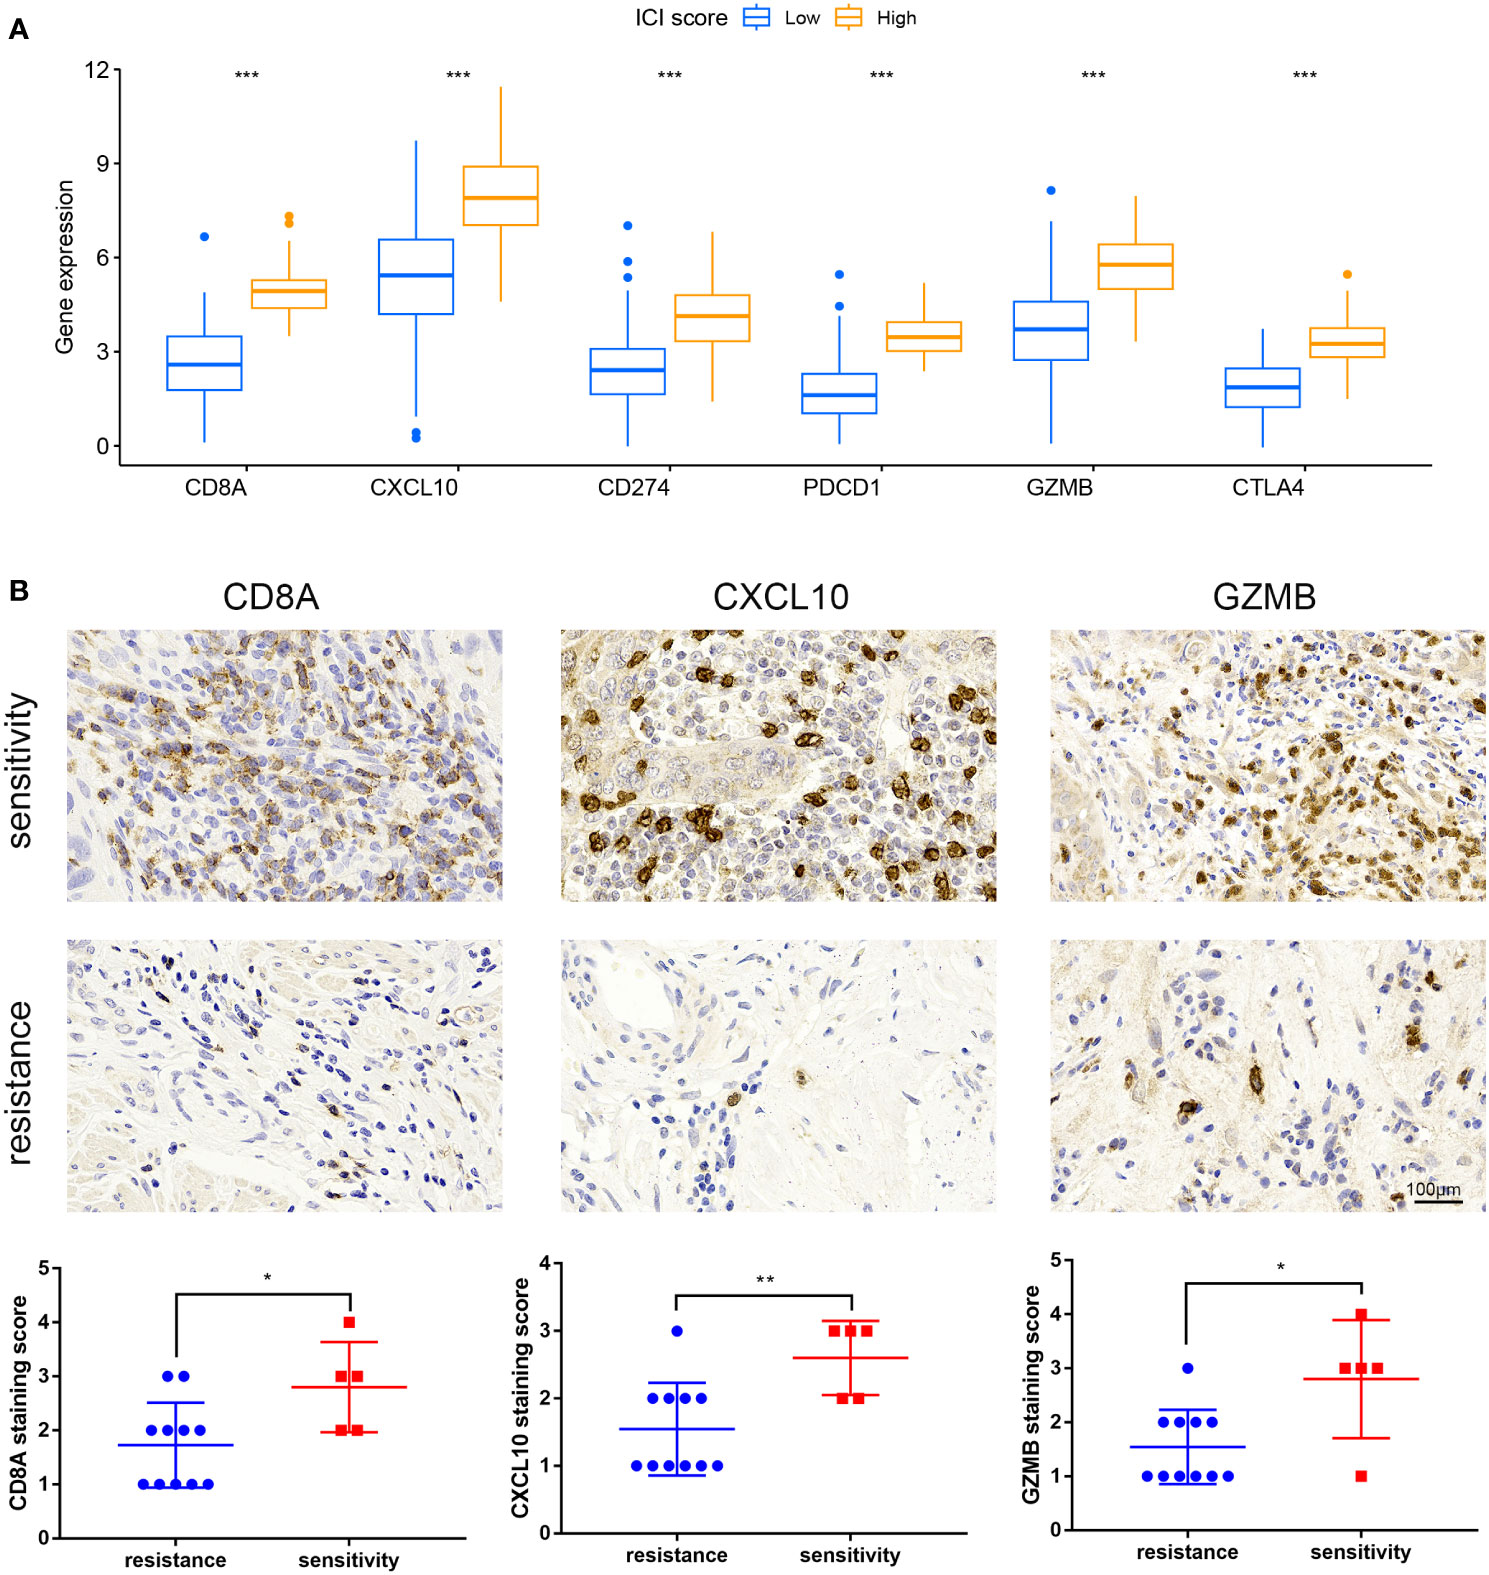
Figure 4 Expression of immune checkpoint and immunological activation-related genes and ICI score. (A) Expression levels of CD8A, CXCL10, CD274, PDCD1, GZMB, and CTLA4 were compared across groups with high and low ICI scores. (B) IHC staining of samples from our hospital to detect CD8A, CXCL10, GZMB expression. *P < 0.05, **P < 0.01, ***P < 0.001.
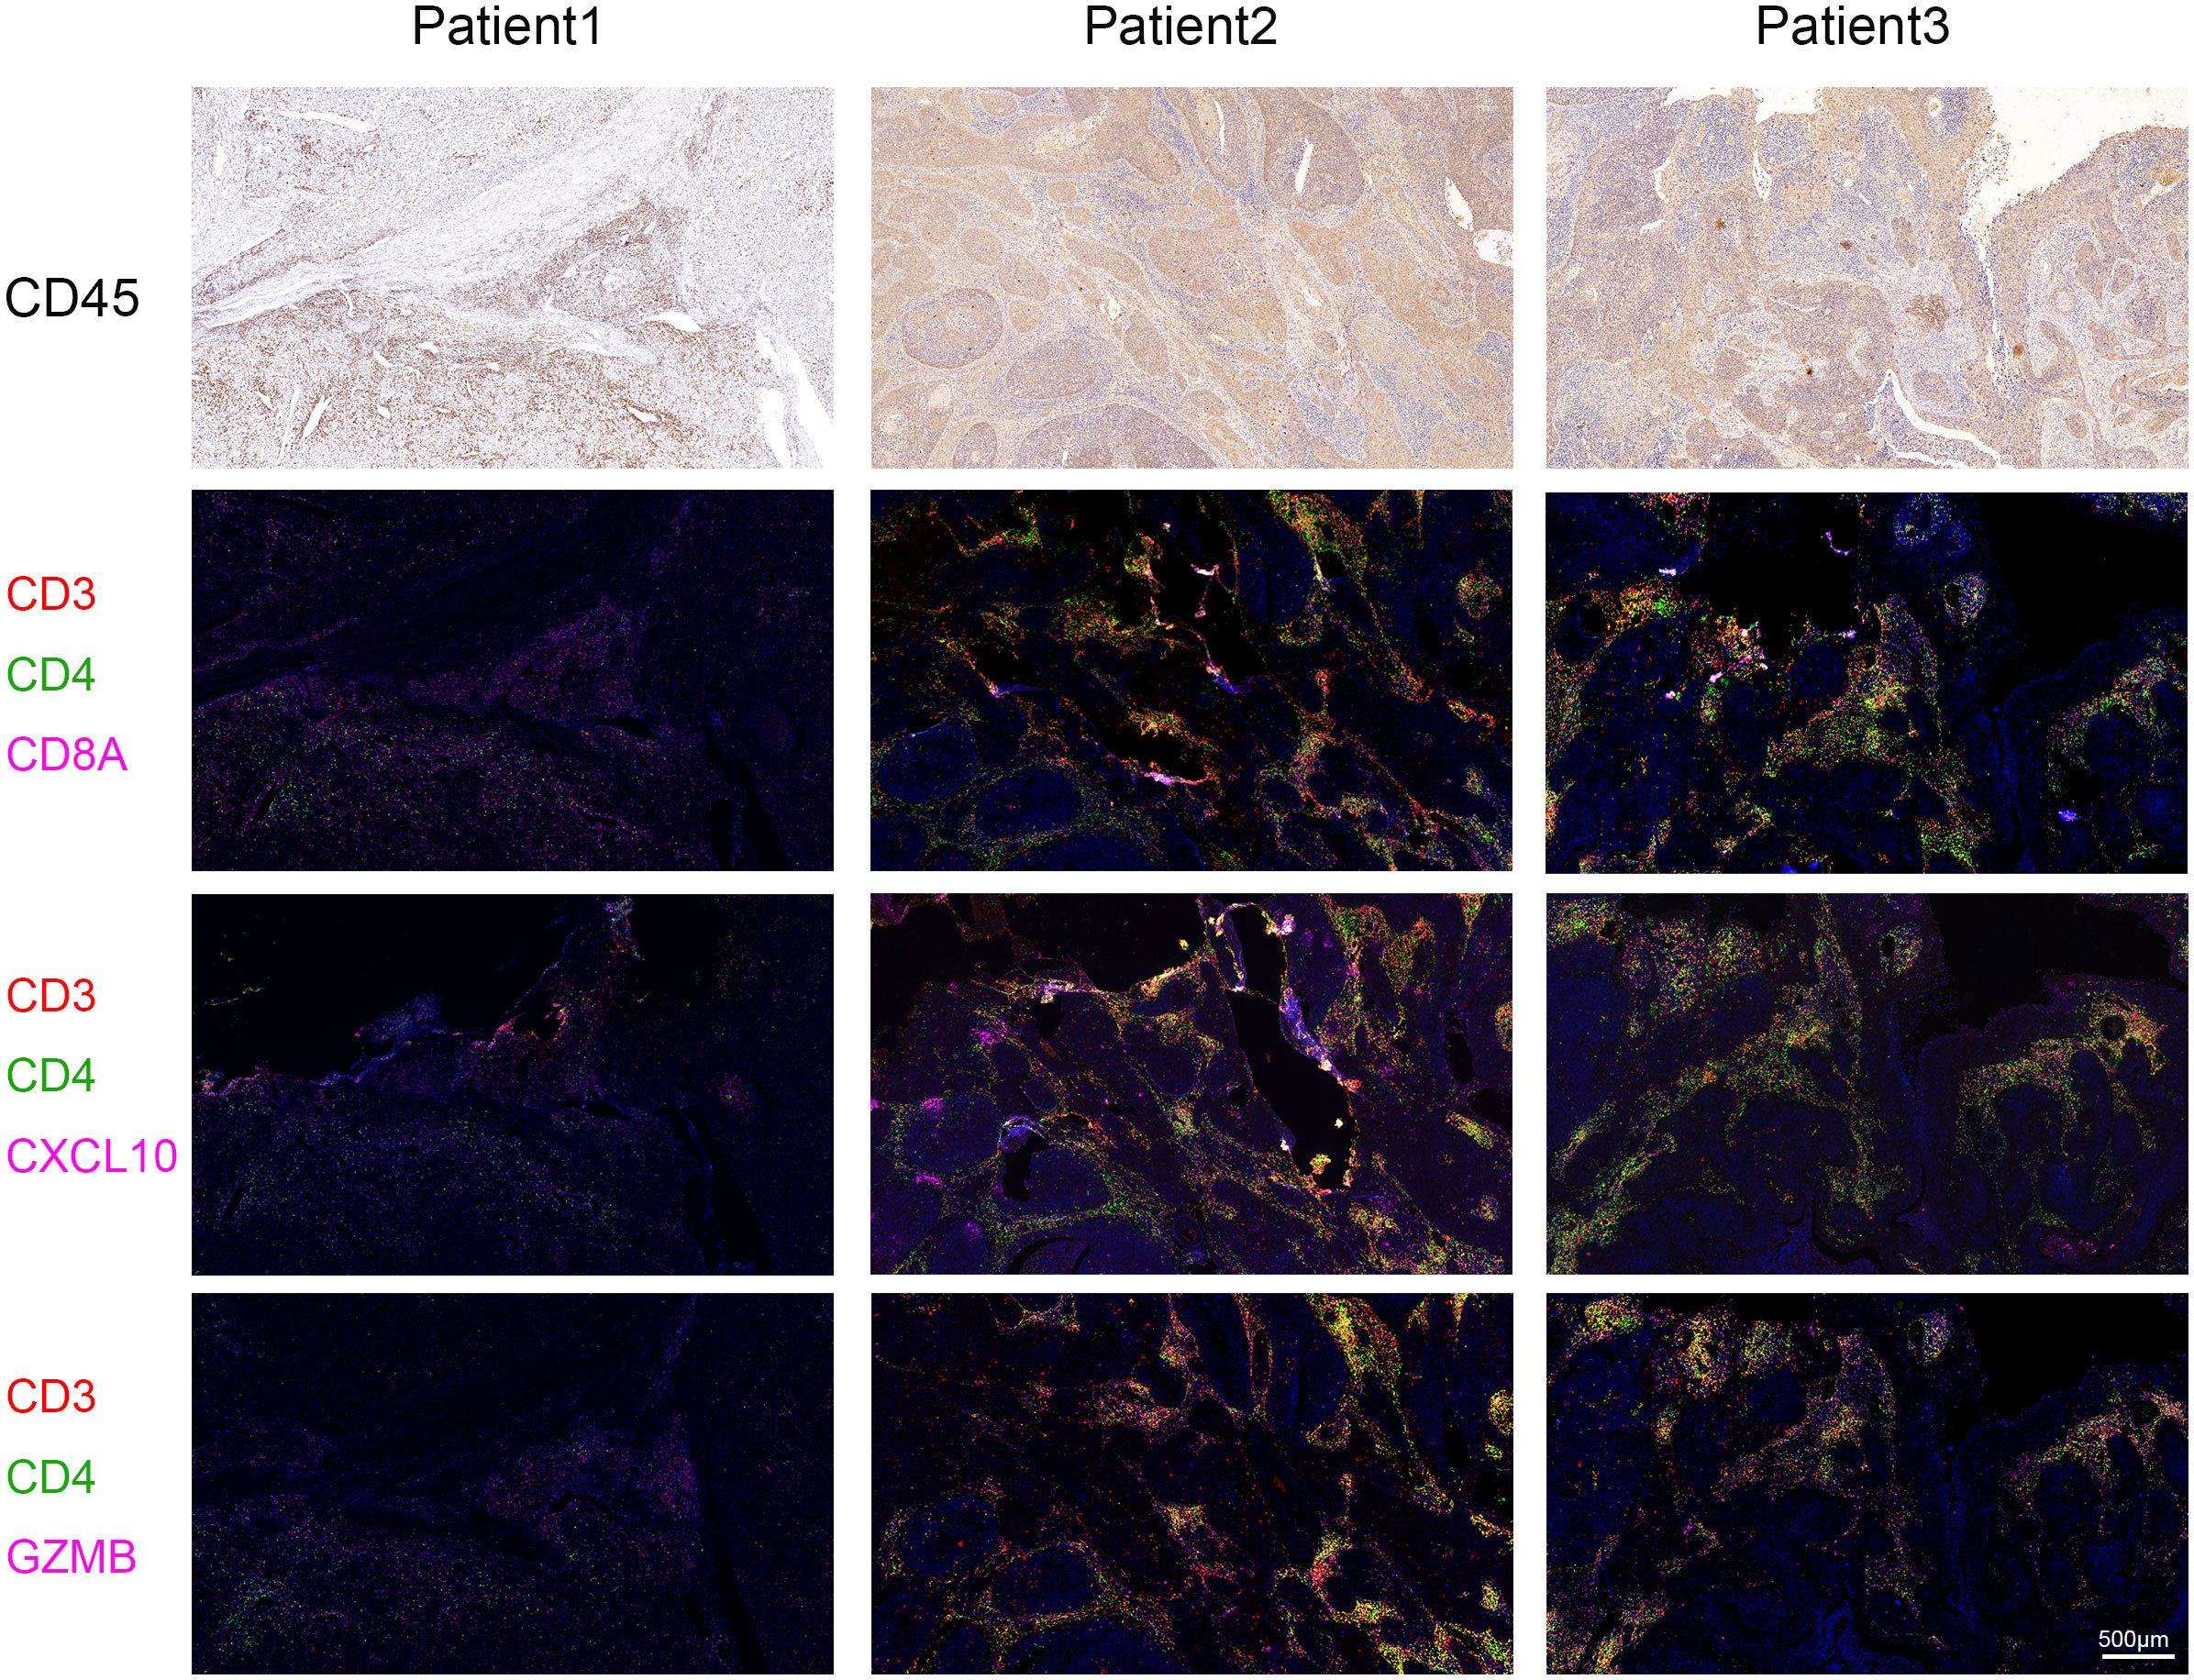
Figure 5 Multiplex Immunofluorescence. The expressions of CD8A, CXCL10 and GZMB were detected by mIHC staining in specimens of our hospital. Immunotherapy efficacy of patient1 was evaluated as resistant and immunotherapy efficacy of patient2 and patient3 was evaluated as sensitive. CD3 is represented by red fluorescence, CD4 by green fluorescence, and CD8A, CXCL10, and GZMB by pink fluorescence.
We evaluated the IC50 of Cisplatin, 5-Fluorouracil, Vinblastine, Vincristine, Paclitaxel, Docetaxel, Gemcitabine, Cyclophosphamide, Topotecan, Epirubicin, Olaparib, Dactinomycin in cervical cancer, and found that the drug sensitivity was higher in the high ICI score group (Supplementary Figure 5). This indicates that ICI score has great potential in predicting chemotherapy drug sensitivity.
Univariate COX analysis was used to filter important genes from 119 DEGs, and 21 genes associated with the prognosis of cervical cancer were eliminated. Then, three important genes were found using the multivariate COX analysis, namely CST7, IL1B, and ITGA5 (Supplementary Figure 6A). These three key genes were used to build a prognostic model (Supplementary Figures 6B–D), and the results of the 1, 3, 5year ROC curves created using the model demonstrated that they could make accurate predictions (Supplementary Figures 6E, F).
We then performed cellular experiments to investigate the role of CST7, IL1B and ITGA5 in cervical cancer cells. We treated CST7 with plasmid overexpression and verified the knockdown efficiency of IL1B and ITGA5 and the overexpression efficiency of CST7 by qRT-PCR and western blot. The findings demonstrated that si-IL1B and si-ITGA5 had substantial knockdown efficiencies, and that CST7 overexpression was clearly present (Figures 6A–F). According to Transwell data, the capacity of cervical cancer cells to migrate was dramatically reduced when IL1B and ITGA5 were knocked down and CST7 was overexpressed in comparison to the control group (Figures 6G–L), similarly, the invasive ability of cervical cancer cells was significantly down-regulated (Figures 6M–R). MTT results showed that knockdown of IL1B and ITGA5 and overexpression of CST7 significantly reduced the proliferation of cervical cancer cells (Figures 7A–F). Additionally, the findings of the clonogenic assay demonstrated that overexpressing CST7 and knocking down IL1B and ITGA5 decreased the capacity of cervical cancer cells to proliferate (Figures 7G–L).
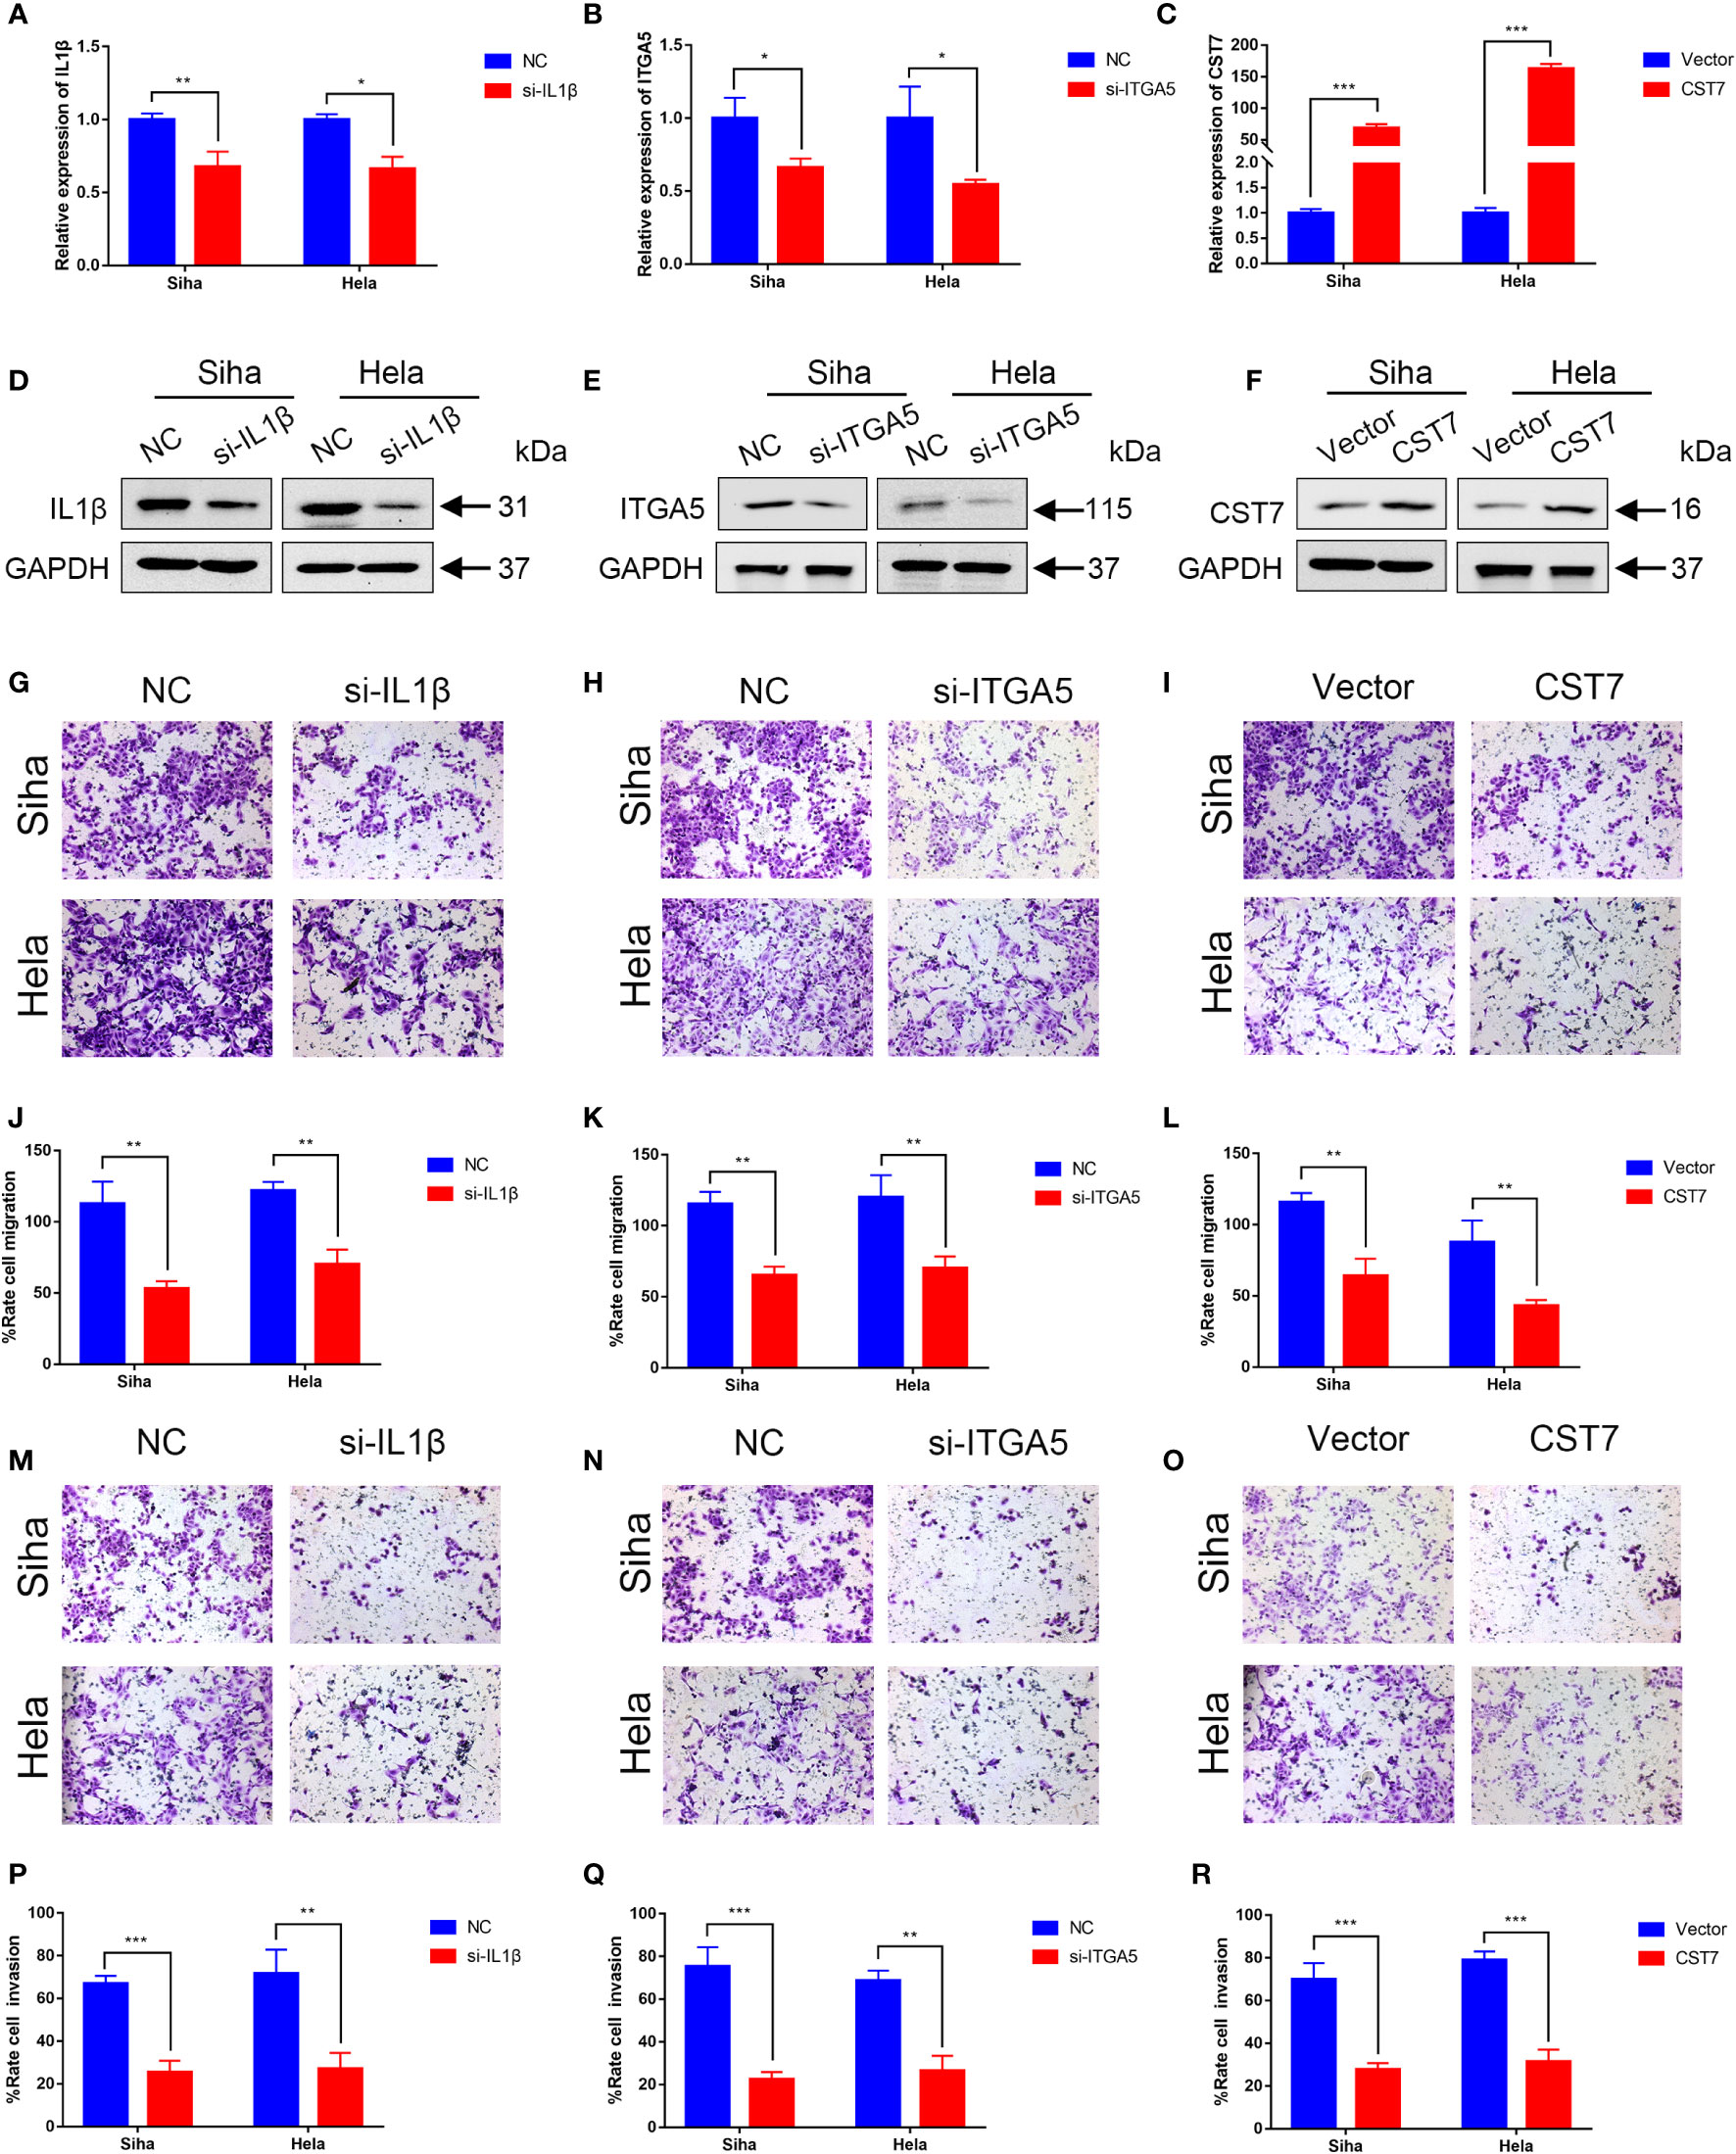
Figure 6 Validation of IL1B, ITGA5 and CST7 in cervical cancer cell lines. (A–C) The knockdown levels of IL1B and ITGA5 and the overexpression of CST7 in Siha and Hela cell lines were verified by qRT-PCR. (D–F) Western blot was utilized to confirm the overexpression of CST7 and the knockdown of IL1B and ITGA5 in Siha and Hela cell lines (G–L) Transwell migration tests were utilized to quantify the degree of cell migration in Siha and Hela cells after IL1B and ITGA5 were knocked down and CST7 was overexpressed, as well as to statistically evaluate the proportion of moved cells (n = 3). (M–R) Transwell migration tests were utilized to quantify the degree of cell invasion in Siha and Hela cells after IL1B and ITGA5 were knocked down and CST7 was overexpressed, as well as to statistically evaluate the proportion of moved cells (n = 3). *P < 0.05, **P < 0.01, ***P < 0.001.
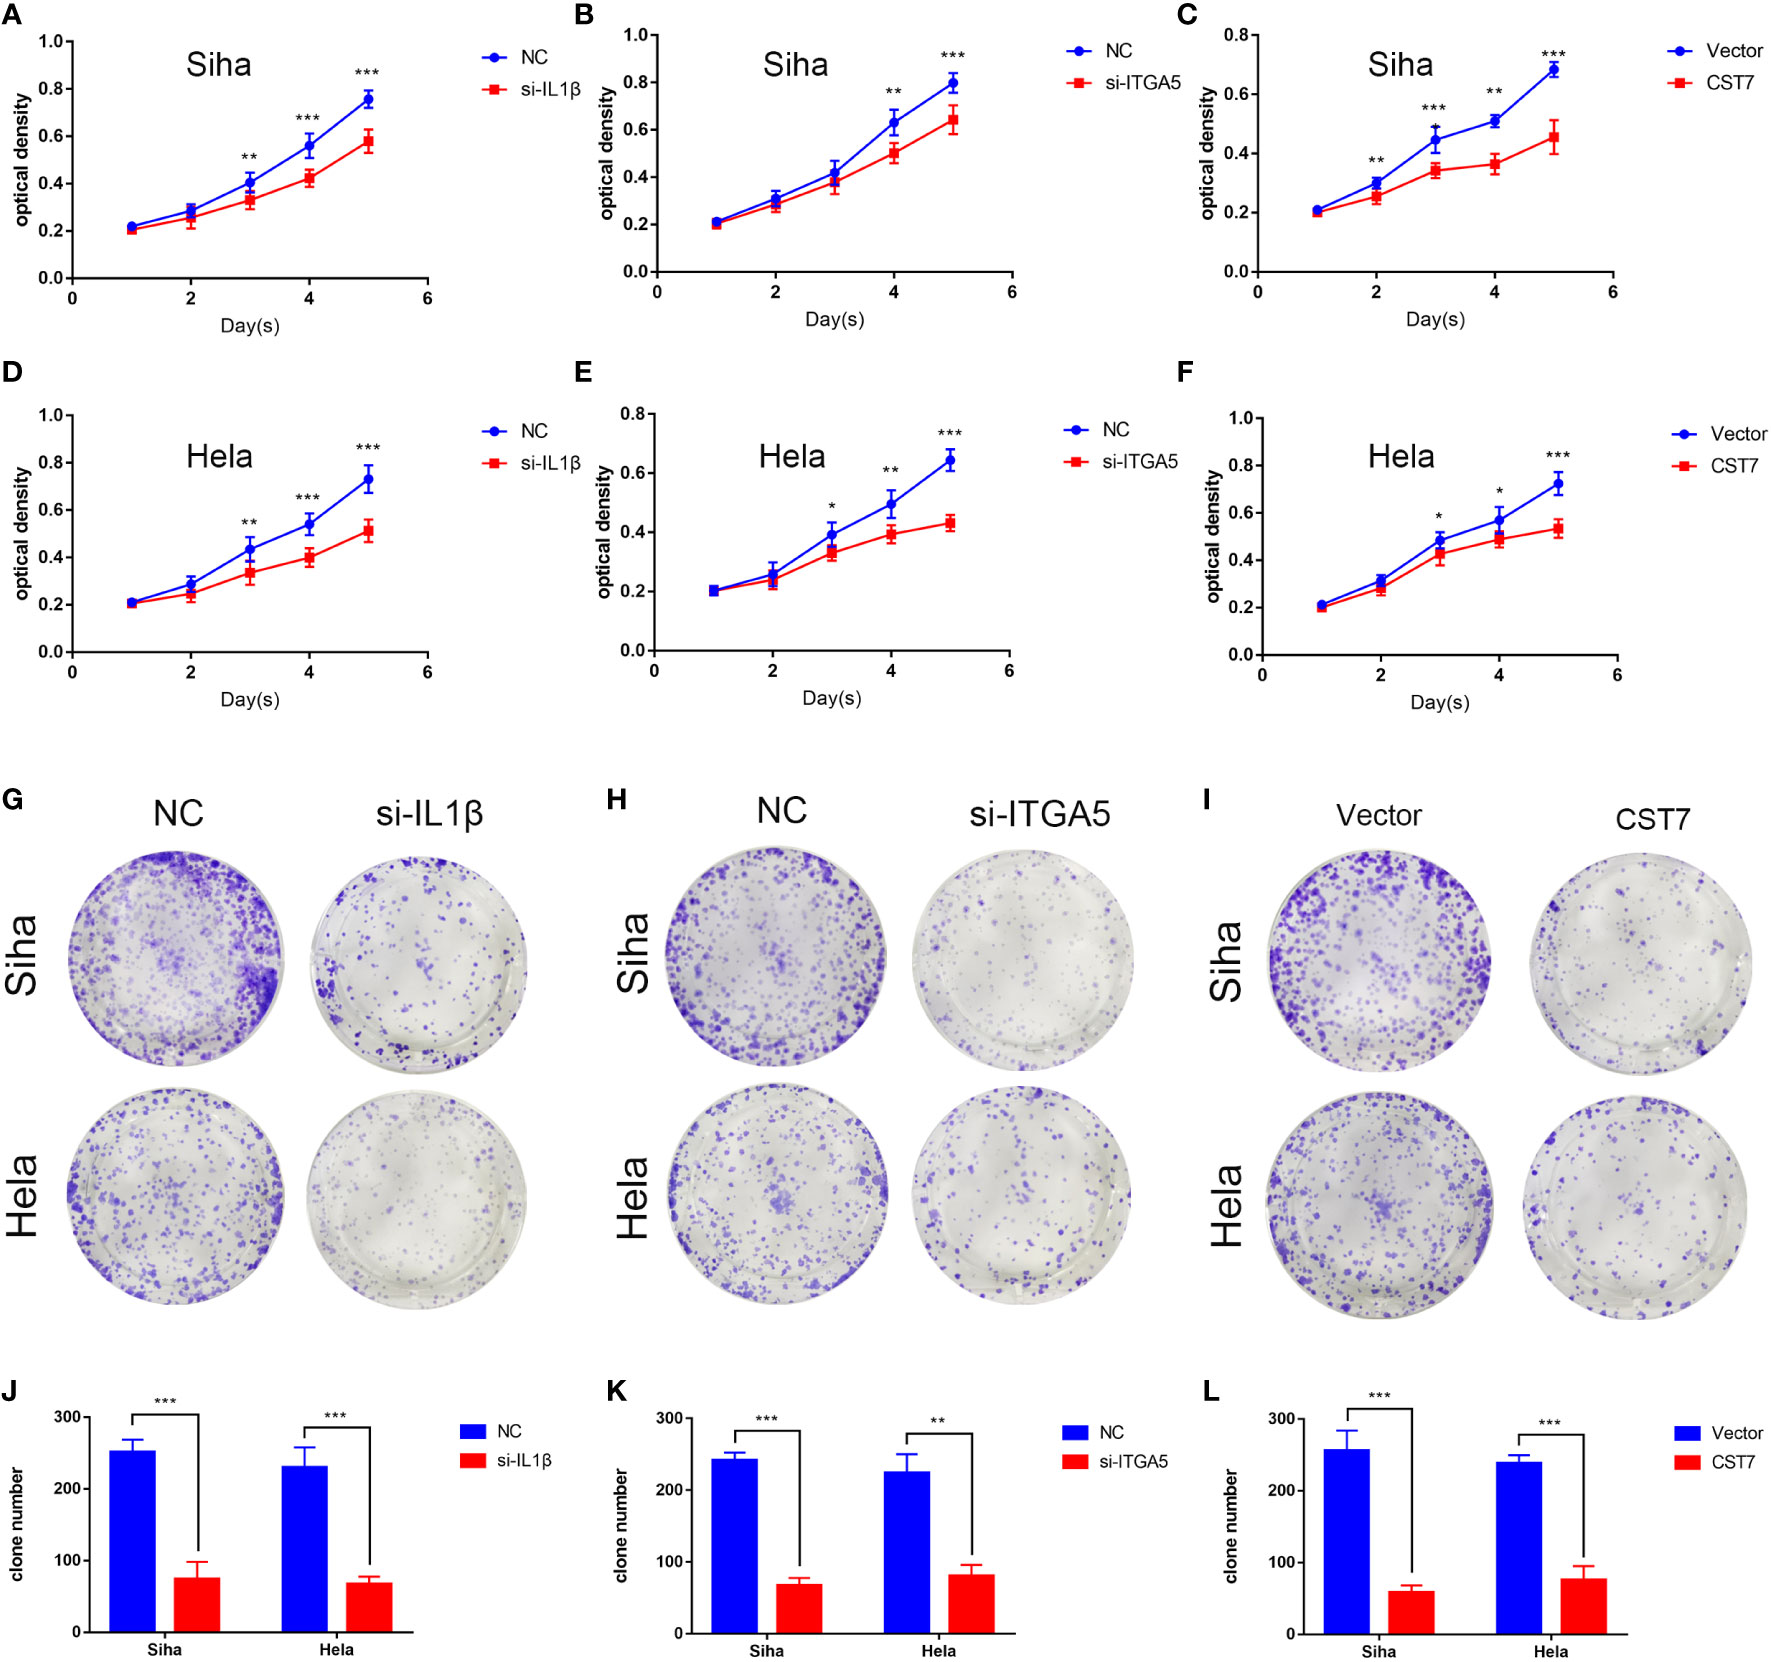
Figure 7 IL1B and ITGA5 knockdown and CST7 overexpression inhibit the proliferation of cervical cancer cells. (A–F) IL1B and ITGA5 knockdown and CST7 overexpression were assessed using the MTT test to assess the viability and proliferation of Siha and Hele cells (n = 3). (G–L) Cell proliferation after knockdown of IL1B and ITGA5 and overexpression of CST7 was determined by clonal assay. Statistical analysis of the colony-forming ability of Siha and Hele cells was performed (n = 3). *P < 0.05, **P < 0.01, ***P < 0.001.
To explore the potential role of IL1b, CST7, and ITGA5 in the immune microenvironment, we downloaded single-cell data of cervical cancer in GEO to validate our results and explore a more precise transcriptional landscape. The data set GSE168652 includes two samples, one from a tumor and one from adjacent normal tissue. After filtering low-quality cells, a total of 24498 cells (Normal: 11394; Tumor: 13104) remained to participate in downstream analysis. We used t-distributed stochastic neighbor embedding (t-SNE) to visualize the global distribution of cells (Figures 8A–C). Tumor tissue and normal tissue showed heterogeneity, with a distinct distribution of cells of different origins (Figure 8A). On this basis, unsupervised cluster analysis identified 13 clusters, and then we divided the cells into 7 main cell types according to the differentially expressed genes of each cluster and the cell-specific marker genes provided by the original article, including epithelial cells, smooth muscle cells, fibroblasts, endothelial cells, endometrial stromal cells, t cells and macrophages (Figures 8B, C). Then we showed the expression levels of these three key genes, CTS7, IL1B, and ITGA5, in different types of cells on the map (Figures 8D–G). All three genes were indeed expressed in immune cells. In particular, CST7 is highly expressed in T cells and IL1B is highly expressed in macrophages. Interestingly, ITGA5 is more widely expressed in non-immune cells, such as endothelial and epithelial cells. However, the expression of ITGA5 is concentrated in the epithelial subgroup Epithelial_02, suggesting that there may be some underlying knowledge in this cluster. The analysis of cell communication also shows that there are frequent interactions among cells expressing these three genes (Figures 8H, I).
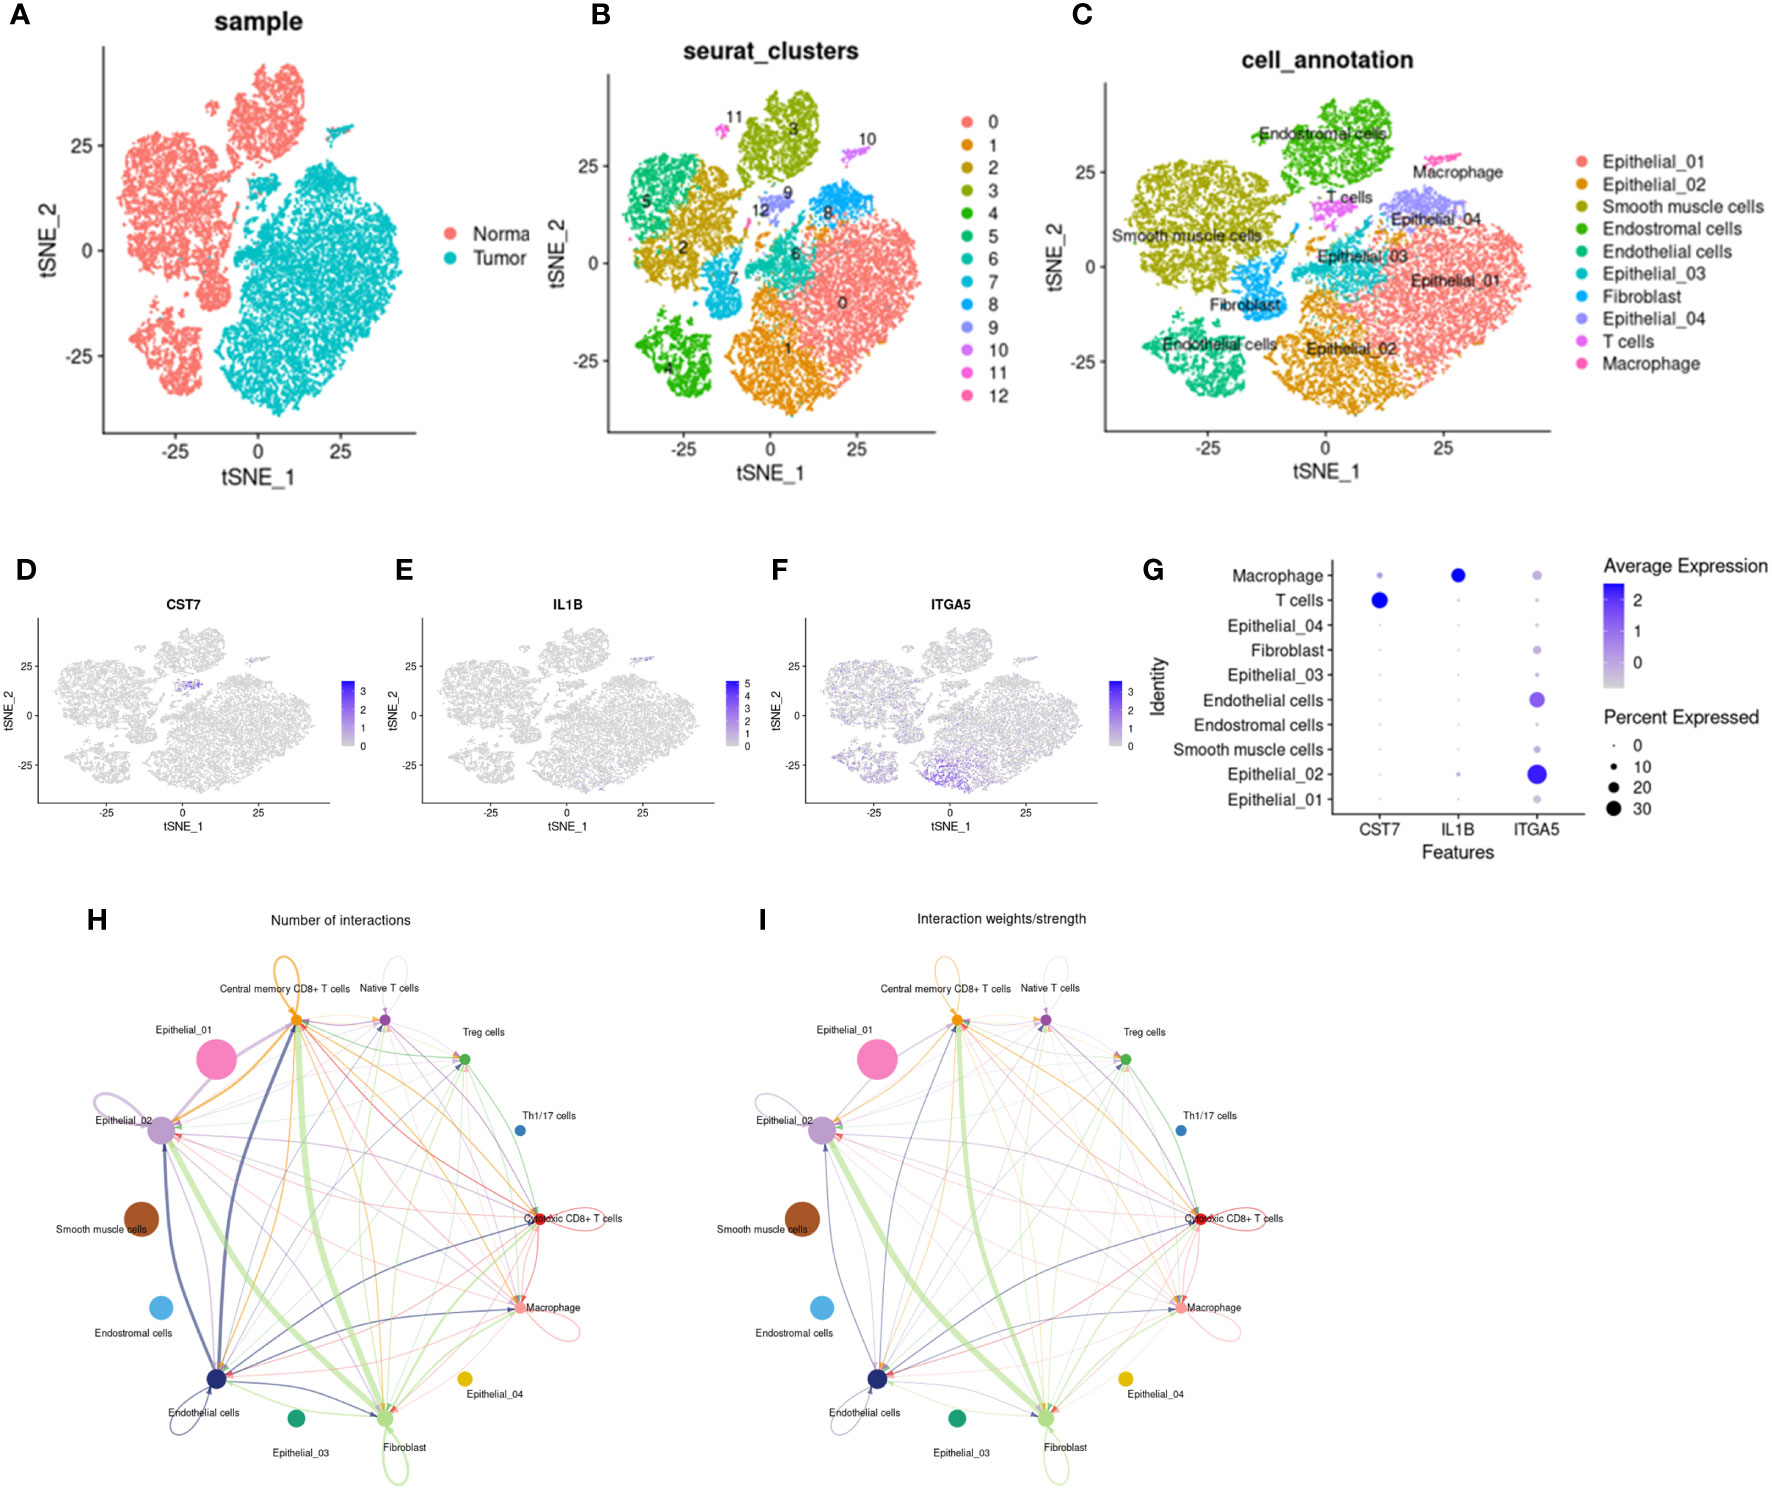
Figure 8 Distribution and cell communication of IL1B, CST7 and ITGA5 in immune cells. (A) Distribution of 24,499 cells in tumor tissue and normal tissue, with 11,394 cells in normal tissue and 13,104 cells in tumor tissue. (B) Cells were divided into 13 clusters by unsupervised clustering. (C) Cells were divided into 7 types based on cell-specific marker genes, including epithelial cells, smooth muscle cells, fibroblasts, endothelial cells, endometrial stromal cells, T cells, and macrophages. (D–F) Distribution of IL1B, CST7 and ITGA5 on different cell types. (G) Expression levels of IL1B, CST7 and ITGA5 on different cell types. (H) Communication pathways between cells distributed by IL1B, CST7 and ITGA5 (I) intensity of cell communication pathways.
We use monocle2 to explore the temporal order of immune cells and epithelial cells. We further subdivided T cells into 5 T cell subtypes according to the differentially expressed genes and classical marker genes of T cell subsets, including cytotoxic CD8+ T cells, helper T cells, regulatory T cells, naive T cells, and central memory CD8+ T cells. Four nodes and nine branches appeared on the pseudo-trajectories of T cells. Consistent with the results of pseudo-trajectories analysis, naive T cells first appeared and mainly gathered in state1, differentiated into other T cell subtypes, besides, helper T cells and regulatory T cells interacted with cytotoxic T cells along pseudo-trajectories (Figures 9A–G). However, macrophages show three cell states and differentiate from one starting point to two directions (Supplementary Figures 7A–E), which is consistent with our known knowledge. Under the influence of various cytokines, macrophages are polarized into M1/M2 macrophages, M1 macrophages are mainly involved in pro-inflammatory responses, and M2 macrophages are mainly involved in anti-inflammatory responses (36–38). Epithelial cells in tumor tissues exhibit complex diversity. We extracted Epithelial_02, a subpopulation highly expressing ITGA5, to reconstruct differentiation trajectories (Supplementary Figures 7H–J). Epithelial_02 is a malignant tumor cell that highly expresses some genes that promote tumor migration, invasion, and metastasis, such as the S100 family and CEACAM family genes (39–41). The expression patterns of 3 key genes were different in the pseudo-trajectories of the 3 types of cells, but IL1B and ITGA5 were more similar (Figures 9H–J; Supplementary Figures 7F–G, Supplementary Figures 7K–L), suggesting that CST7 and the other two work in a different mode of action in cancer.
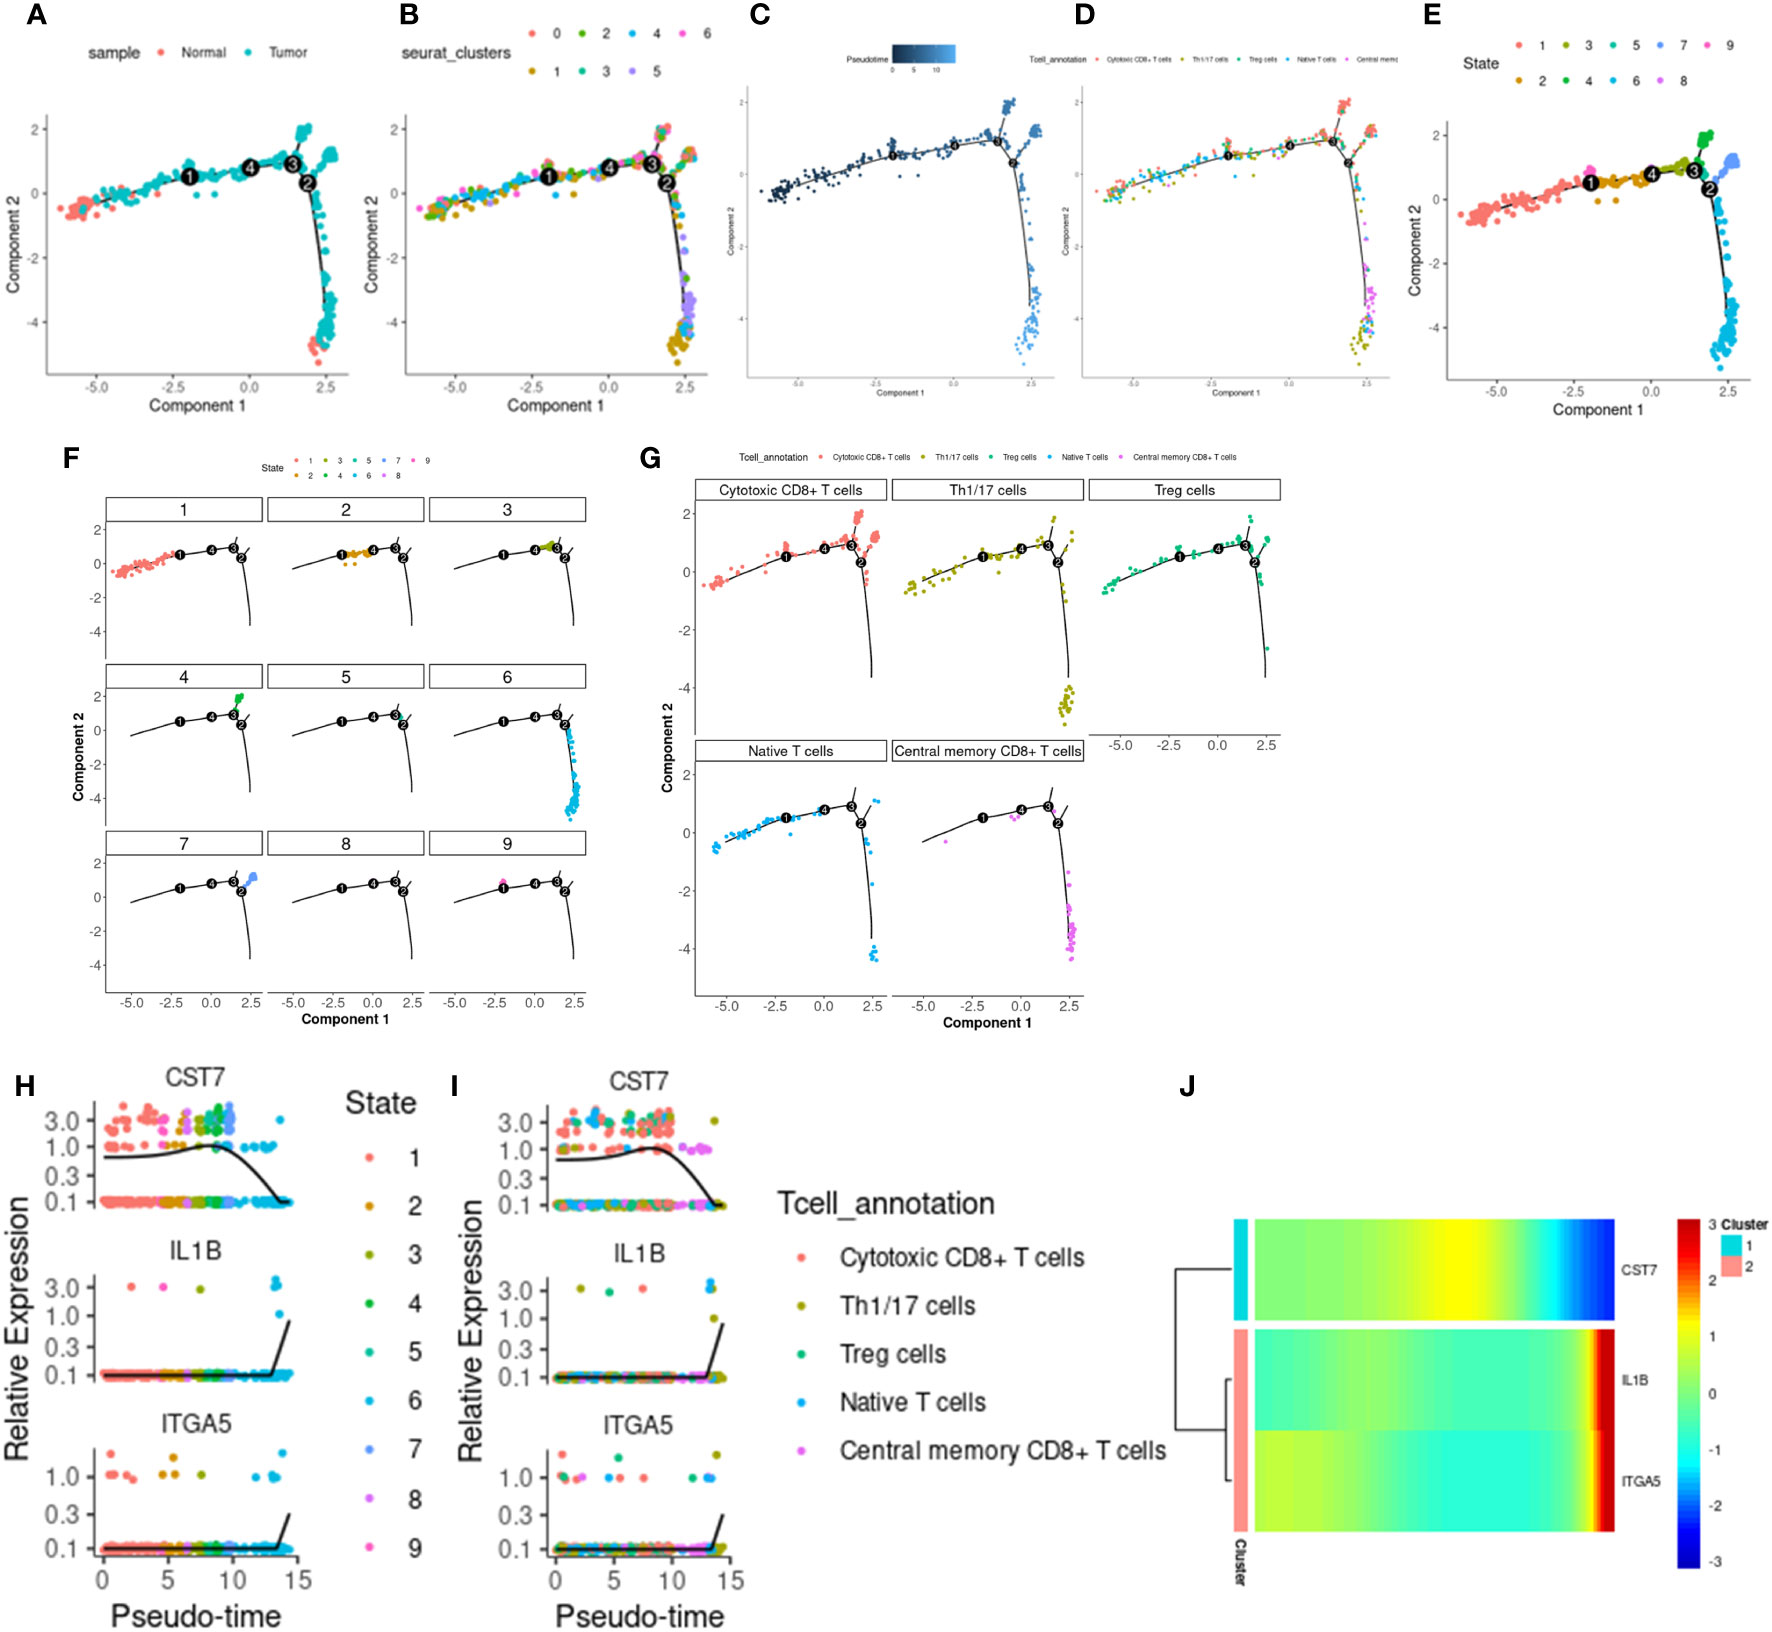
Figure 9 T cell differentiation track. (A) The distribution of tumor and normal cells in the T cell differentiation locus, which produced four differentiation nodes. (B) Branches generated by T cell differentiation locus, 7 branches in total. (C) The time distribution along the differentiation trajectory. The darker the color, the earlier the differentiation time. (D) Distribution of immune cells along the T cell differentiation trail. (E) Branches generated by immune cell differentiation in the T cell differentiation locus, with a total of 9 branches. (F) The corresponding cell positions of the nine branches on the differentiation trajectory. (G) cytotoxic CD8+ T cells, helper T cells, regulatory T cells, naive T cells, and central memory corresponding differentiation trajectory of CD8+ T cells. (H) Expression levels of IL1B, CST7 and ITGA5 in 9 branch cells. (I) IL1B, CST7, ITGA5 in cytotoxic CD8+ T cells, helper T cells, regulatory T cells, naive T cells, and central memory on CD8+ T cells. (J) Heat maps of expression patterns of IL1B, CST7 and ITGA5 on T cell differentiation trajectories.
The tumor immune microenvironment is a complex state, a suppressive tumor immune microenvironment is created due to specific immune cell infiltration, which is hypothesized to be connected to immunotherapy resistance and tumor growth (42). When tumorigenesis occurs, the organism triggers an immune response. When the balance between immunosurveillance and immunosuppressive cells in the tumor microenvironment is tilted, the body eventually loses immune surveillance of tumor cells, which promotes tumor progression (43).
Immunotherapeutic systems, such as immune checkpoint inhibitors, modified T cells like CAR T and T cell receptor (TCR) T cells, and other recently discovered immunotherapeutic methods, such as lysing viruses and bispecific antibodies, have evolved fast in recent years (44). In cervical cancer, immunotherapy has increasingly become a hot topic for researchers (45–47), immunotherapy is more customized than surgical intervention, neoadjuvant therapy, radiation, and chemotherapy. Immune checkpoint inhibitor use is crucial in the treatment of cervical cancer; for example, PD-1 and PD-L1 inhibitors can effectively benefit patients with cervical cancer (48–50). Protein kinase, DNA-activated, catalytic polypeptide (PRKDC) has a high mutational burden in cervical cancer (51), PRKDC has the function of repairing cervical cancer DNA, blocking the PRKDC pathway can effectively block the occurrence of this process, thereby increasing the sensitivity of chemotherapeutics (52). Studies have also found that the susceptibility of cervical cancer may be related to the polymorphisms of CTLA4 and IL-1 (53, 54). Additionally, the creation of immune cells by HPV to bypass host T cell monitoring and escape detection is linked to the development of cervical cancer (55, 56), immune escape clearance can effectively prevent and treat HPV persistent infection (57). Cervical cancer has a complex immune microenvironment. The chemotherapy process will activate local immune cells. The combined immune checkpoint inhibitor may become a new treatment direction (58–60).
In this study, we obtained cervical cancer patient information from the TCGA and GEO databases, assessed the immune microenvironment of cervical cancer, and divided the immune cells into three clusters, between various immune cells, it was shown that the correlation between active CD8+ T cells and CD4+ T cells was strongest. T cell activity and the expression levels of CTLA4, PD-1, and PD-L1 were highest in cluster B. Similarly, the survival prognosis of cluster B was also the best, which was consistent with previous research results (61–63). We obtained differential genes from three immune cell clusters and defined two gene clusters related to immune activation. The two gene clusters had differences in immune cell activation and matrix maturation. Additionally, we developed an ICI score network to present clinical characteristics, gauge the effectiveness of immunotherapy, and gauge the overall survival status of cervical cancer patients. The high ICI score group played an important role in immune cell activation, immune cell killing, antigen presentation and other processes. Elevated TMB levels can mediate immune cell activation, thereby benefiting immunotherapy (64, 65), we combined TMB and ICI scores in order to look into any possible association between them. The TMB and ICI scores showed a statistically significant positive connection. When comparing the overall survival rates of the various TMB subgroups, it was discovered that the high tumor mutation burden group had a higher prognosis for survival, which was in line with earlier research (66, 67). We examined the immune checkpoint- and immunological activation-related genes CXCL10, GZMB, CD8A, PD-1, PD-L1, and CTLA4 to evaluate the association between IC score and immunotherapy. The statistics show that the high ICI score group had greater expression of these genes. Therefore, we obtained tissues of cervical cancer patients from the hospital, and it was found that CXCL10, GZMB and CD8A were increased in patients sensitive to the efficacy of immunotherapy, suggesting that CXCL10, GZMB and CD8A may be potential therapeutic targets for cervical cancer immunotherapy. Drug sensitivity was correspondingly higher in subgroups with high ICI scores, according to the examination of chemotherapeutic drug sensitivity. We also identified 3 key genes, including IL1B, ITGA5 and CST7, from 119 differential genes. IL1B may encourage the development of tumor cells. By inhibiting IL1B, one may counteract breast cancer’s immunosuppressive effects and boost their anti-PD-1 counterparts, resulting in an anti-tumor impact (68). IL1B can also enhance the signal transduction of CTLA4, and targeting the IL1B-CTLA4 axis can effectively inhibit the occurrence of metastatic and recurrent colon cancer (69). ITGA5 is a crucial immunotherapy predictive target that is thought to be crucial in the incidence and progression of many cancers (70–72). CST7 is associated with activation of CD4T and CD8T cells in liver cancer (73). In our study, IL1B and ITGA were up-regulated in cervical cancer, while CST7 was down-regulated in cervical cancer, we conducted cell experiments on 3 key genes, and the results showed that down-regulation of IL1B and ITGA5 and overexpression of CST7 could reduce the growth and migration ability of cervical cancer cells. Analysis of single cell sequencing data showed that CST7 and IL1B were mainly distributed in immune cells, among which CST7 was distributed in T cells, IL1B was distributed in macrophages, and ITGA5 was mainly expressed in epithelial cells.
In our study, immune cells in the subgroup with high ICI scores were in an activated state, the expression of several immune checkpoints was elevated, the high expression of immune checkpoints was consistent with immunotherapy sensitivity. Three key genes were identified from 119 DGEs of ICI score, and cell experiments confirmed that Key genes had an impact on the proliferation and migration ability of cervical cancer cells, moreover, single-cell sequencing data suggested that CST7 and IL1B were mainly distributed in immune cells, which suggested the potential important role of CST7 and IL1B in the immune microenvironment of cervical cancer. Therefore, we think that the ICI score is one of the predictors of cervical cancer survival and prognosis and that including the ICI score as a separate predictor of immunotherapy for cervical cancer is a project that might be investigated in the future.
However, research has a certain degree of limitations. The research data came from public database platforms. We also need more clinical research data to support the predictive value of ICI scores.
The datasets presented in this study can be found in online repositories. The names of the repository/repositories and accession number(s) can be found in the article/Supplementary Material.
The Zhongnan Hospital of Wuhan University ethical committee approved the research (ethics number: 2020029). Written informed consent for participation was not required for this study in accordance with the national legislation and the institutional requirements.
SY, LZ, and SC led and supervised the study as co-authors. LZ, HW, and YG performed the public dataset collection, bioinformatics analysis, and generated graphs and tables; SY and SC performed the experiments; SY and LZ collected the tumor samples. SY and SC wrote the manuscript, and HC, MD, and N-YS revised the manuscript. All authors contributed to the article and approved the submitted version.
The work in the lab was supported by the National Natural Science Foundation of China (81972447, 81272866), National Natural Science Foundation of China Youth Project (82002770). Key research and development plan in Hubei Province (2022BCA004). N-YS was supported by SRG2019-00177-FHS, 0004/2021/AKP and FDCT0038/2020/AFJ. The funders had no role in study design, data collection and analysis, decision to publish, or preparation of the manuscript.
We are very grateful to all the staff and participants of TCGA databases and GEO databases.
The authors declare that the research was conducted in the absence of any commercial or financial relationships that could be construed as a potential conflict of interest.
All claims expressed in this article are solely those of the authors and do not necessarily represent those of their affiliated organizations, or those of the publisher, the editors and the reviewers. Any product that may be evaluated in this article, or claim that may be made by its manufacturer, is not guaranteed or endorsed by the publisher.
The Supplementary Material for this article can be found online at: https://www.frontiersin.org/articles/10.3389/fimmu.2023.1135657/full#supplementary-material
Supplementary Figure 1 | Unsupervised clustering of immune infiltration of cervical cancer. (A-H) The matrix heat map of cervical cancer samples when K=2-9, the darker the color in the group, the higher the homogeneity in the group. The fewer the blank parts between groups, the more obvious the difference between the groups. (I) The unsupervised clustering area under the curve for K=2–9. (J) Based on the cumulative distribution consensus index of tumor immune cell infiltration, K=2-9.
Supplementary Figure 2 | Co-identification of unsupervised clustering differential genes based on ICI score. (A-H) Co-identification clustering heat map when K=2-9. (I) The unsupervised clustering area under the curve for K=2–9. (J) According to the cumulative distribution consistency index of tumor immune cell infiltration, K=2-9.
Supplementary Figure 3 | (A) Compared the survival prospects of gene clusters A and B using the Kaplan-Meier curve, P=0.441. (B) The correlation between grades and ICI scores shows that the better the grade, the higher the ICI score (P=0.04). (C)There was no correlation between different age groups and ICI scores(P=0.23).
Supplementary Figure 4 | Correlation between tumor mutation burden and ICI score. (A) Tumor mutation burden between different ICI score groups(P=0.0017). (B)Used a scatter plot to display the relationship between ICI score and TMB, which revealed a favorable relationship (R=0.19, P=0.0013). (C) Kaplan-Meier curves for cervical cancer overall survival in the high-TMB and low-TMB groups, the overall survival of the high TMB group was better (P=0.042). (D) The overall survival rate of the stratified combination of TMB and ICI scores was shown using the Kaplan-Meier curve. (E-F) OncoPrint of the high ICI score group (left) and the low ICI score group (right), the samples were displayed on the horizontal axis, and the genes were displayed on the vertical axis. The filled colors represented different types of mutations.
Supplementary Figure 5 | Correlation between risk score and chemotherapy drug response. Difference between chemotherapeutic drug IC50 between the high ICI score group and the low ICI score group.
Supplementary Figure 6 | Construction of key genes risk model. (A) Multifactorial analysis was used to evaluate three important genes. (B) the distribution of cervical cancer patients’ risk indices. (C) The survival status chart of cervical cancer. (D) The heatmap of three key genes. (E) Examination of the risk model survival curve. (F) ROC curve to verify the ability of the risk model to predict prognosis.
Supplementary Figure 7 | Differentiation trajectories of macrophages and epithelial cells. (A) The distribution of normal and tumor cells along the macrophage differentiation trail. One differentiation node is generated. (B) The time distribution on the differentiation trajectory of macrophages. The darker the color, the earlier the differentiation time. (C) Branches generated by macrophage differentiation locus, including 3 branches. (D) The distribution of tumor and normal cells on three branches. (E) Corresponding differentiation positions of cells on the three branches. (F) Expression levels of IL1B, CST7 and ITGA5 in three branch cells. (G) Heat maps of expression patterns of IL1B, CST7 and ITGA5 on macrophage differentiation trajectories. (H) The time distribution of epithelial cell differentiation tracks, the darker the color, the earlier the differentiation. (I) The branching of epithelial cells along the differentiation path, with a total of 7 branches. (J) The corresponding position of cells on each branch of the epithelial differentiation pathway. (K) Expression levels of IL1B, CST7 and ITGA5 in 7 branch cells. (L) Heat map of expression patterns of IL1B, CST7 and ITGA5 in epithelial cell differentiation tracks.
1. Arbyn M, Weiderpass E, Bruni L, de Sanjosé S, Saraiya M, Ferlay J, et al. Estimates of incidence and mortality of cervical cancer in 2018: A worldwide analysis. Lancet Global Health (2020) 8(2):e191–203. doi: 10.1016/s2214-109x(19)30482-6
2. Buskwofie A, David-West G, Clare CA. A review of cervical cancer: Incidence and disparities. J Natl Med Assoc (2020) 112(2):229–32. doi: 10.1016/j.jnma.2020.03.002
3. Shen S, Zhang S, Liu P, Wang J, Du H. Potential role of micrornas in the treatment and diagnosis of cervical cancer. Cancer Genet (2020) 248-249:25–30. doi: 10.1016/j.cancergen.2020.09.003
4. Zhang S, Batur P. Human papillomavirus in 2019: An update on cervical cancer prevention and screening guidelines. Cleveland Clinic J Med (2019) 86(3):173–8. doi: 10.3949/ccjm.86a.18018
5. Okunade KS. Human papillomavirus and cervical cancer. J obstetrics gynaecology J Institute Obstetrics Gynaecology (2020) 40(5):602–8. doi: 10.1080/01443615.2019.1634030
6. Canfell K. Towards the global elimination of cervical cancer. Papillomavirus Res (Amsterdam Netherlands) (2019) 8:100170. doi: 10.1016/j.pvr.2019.100170
7. Hancock G, Hellner K, Dorrell L. Therapeutic hpv vaccines. Best Pract Res Clin obstetrics gynaecology (2018) 47:59–72. doi: 10.1016/j.bpobgyn.2017.09.008
8. Annede P, Gouy S, Haie-Meder C, Morice P, Chargari C. [Place of radiotherapy and surgery in the treatment of cervical cancer patients]. Cancer radiotherapie J la Societe francaise radiotherapie oncologique (2019) 23(6-7):737–44. doi: 10.1016/j.canrad.2019.07.151
9. Li H, Wu X, Cheng X. Advances in diagnosis and treatment of metastatic cervical cancer. J gynecologic Oncol (2016) 27(4):e43. doi: 10.3802/jgo.2016.27.e43
10. Menderes G, Black J, Schwab CL, Santin AD. Immunotherapy and targeted therapy for cervical cancer: An update. Expert Rev Anticancer Ther (2016) 16(1):83–98. doi: 10.1586/14737140.2016.1121108
11. Yee GP, de Souza P, Khachigian LM. Current and potential treatments for cervical cancer. Curr Cancer Drug Targets (2013) 13(2):205–20. doi: 10.2174/1568009611313020009
12. Marquina G, Manzano A, Casado A. Targeted agents in cervical cancer: Beyond bevacizumab. Curr Oncol Rep (2018) 20(5):40. doi: 10.1007/s11912-018-0680-3
13. Zhu H, Luo H, Zhang W, Shen Z, Hu X, Zhu X. Molecular mechanisms of cisplatin resistance in cervical cancer. Drug design Dev Ther (2016) 10:1885–95. doi: 10.2147/dddt.S106412
14. Zagouri F, Sergentanis TN, Chrysikos D, Filipits M, Bartsch R. Molecularly targeted therapies in cervical cancer. A Systematic Review. Gynecologic Oncol (2012) 126(2):291–303. doi: 10.1016/j.ygyno.2012.04.007
15. Willmott LJ, Monk BJ. Cervical cancer therapy: Current, future and anti-angiogensis targeted treatment. Expert Rev Anticancer Ther (2009) 9(7):895–903. doi: 10.1586/era.09.58
16. Gajewski TF, Schreiber H, Fu YX. Innate and adaptive immune cells in the tumor microenvironment. Nat Immunol (2013) 14(10):1014–22. doi: 10.1038/ni.2703
17. Koukourakis MI, Giatromanolaki A. Tumor microenvironment, immune response and post-radiotherapy tumor clearance. Clin Trans Oncol (2020) 22(12):2196–205. doi: 10.1007/s12094-020-02378-8
18. Qiao LY, Shen S, Liu M, Xia C, Kay JC, Zhang QL. Inflammation and activity augment brain-derived neurotrophic factor peripheral release. Neuroscience (2016) 318:114–21. doi: 10.1016/j.neuroscience.2016.01.018
19. Hanahan D, Weinberg RA. Hallmarks of cancer: The next generation. Cell (2011) 144(5):646–74. doi: 10.1016/j.cell.2011.02.013
20. Quesada JR, Hersh EM, Manning J, Reuben J, Keating M, Schnipper E, et al. Treatment of hairy cell leukemia with recombinant alpha-interferon. Blood (1986) 68(2):493–7. doi: 10.1182/blood.V68.2.493.493
21. Chitsike L, Duerksen-Hughes P. The potential of immune checkpoint blockade in cervical cancer: Can combinatorial regimens maximize response? a review of the literature. Curr Treat options Oncol (2020) 21(12):95. doi: 10.1007/s11864-020-00790-4
22. Smyth MJ, Ngiow SF, Ribas A, Teng MW. Combination cancer immunotherapies tailored to the tumour microenvironment. Nat Rev Clin Oncol (2016) 13(3):143–58. doi: 10.1038/nrclinonc.2015.209
23. Rosenberg SA. Il-2: The first effective immunotherapy for human cancer. J Immunol (Baltimore Md 1950) (2014) 192(12):5451–8. doi: 10.4049/jimmunol.1490019
24. Ventriglia J, Paciolla I, Pisano C, Cecere SC, Di Napoli M, Tambaro R, et al. Immunotherapy in ovarian, endometrial and cervical cancer: State of the art and future perspectives. Cancer Treat Rev (2017) 59:109–16. doi: 10.1016/j.ctrv.2017.07.008
25. Otter SJ, Chatterjee J, Stewart AJ, Michael A. The role of biomarkers for the prediction of response to checkpoint immunotherapy and the rationale for the use of checkpoint immunotherapy in cervical cancer. Clin Oncol (Royal Coll Radiologists (Great Britain)) (2019) 31(12):834–43. doi: 10.1016/j.clon.2019.07.003
26. Kitamura T, Suzuki M, Nishimatsu H, Kurosaki T, Enomoto Y, Fukuhara H, et al. Final report on low-dose estramustine phosphate (Emp) monotherapy and very low-dose emp therapy combined with lh-Rh agonist for previously untreated advanced prostate cancer. Aktuelle Urologie (2010) 41 Suppl 1:S34–40. doi: 10.1055/s-0029-1224657
27. Crusz SM, Miller RE. Targeted therapies in gynaecological cancers. Histopathology (2020) 76(1):157–70. doi: 10.1111/his.14009
28. Van de Wall S, Nijman HW, Daemen T. Hpv-specific immunotherapy: Key role for immunomodulators. Anti-cancer Agents medicinal Chem (2014) 14(2):265–79. doi: 10.2174/187152061402140128163306
29. Yoshihara K, Shahmoradgoli M, Martínez E, Vegesna R, Kim H, Torres-Garcia W, et al. Inferring tumour purity and stromal and immune cell admixture from expression data. Nat Commun (2013) 4:2612. doi: 10.1038/ncomms3612
30. Yang J, Gao C, Liu M, Liu YC, Kwon J, Qi J, et al. Targeting an inducible Sall4-mediated cancer vulnerability with sequential therapy. Cancer Res (2021) 81(23):6018–28. doi: 10.1158/0008-5472.Can-21-0030
31. Li C, Guo L, Li S, Hua K. Single-cell transcriptomics reveals the landscape of intra-tumoral heterogeneity and transcriptional activities of ecs in cc. Mol Ther Nucleic Acids (2021) 24:682–94. doi: 10.1016/j.omtn.2021.03.017
32. Hao Y, Hao S, Andersen-Nissen E, Mauck WM 3rd, Zheng S, Butler A, et al. Integrated analysis of multimodal single-cell data. Cell (2021) 184(13):3573–87.e29. doi: 10.1016/j.cell.2021.04.048
33. Qiu X, Mao Q, Tang Y, Wang L, Chawla R, Pliner HA, et al. Reversed graph embedding resolves complex single-cell trajectories. Nat Methods (2017) 14(10):979–82. doi: 10.1038/nmeth.4402
34. Jin S, Guerrero-Juarez CF, Zhang L, Chang I, Ramos R, Kuan CH, et al. Inference and analysis of cell-cell communication using cellchat. Nat Commun (2021) 12(1):1088. doi: 10.1038/s41467-021-21246-9
35. Chan TA, Yarchoan M, Jaffee E, Swanton C, Quezada SA, Stenzinger A, et al. Development of tumor mutation burden as an immunotherapy biomarker: Utility for the oncology clinic. Ann Oncol (2019) 30(1):44–56. doi: 10.1093/annonc/mdy495
36. Shapouri-Moghaddam A, Mohammadian S, Vazini H, Taghadosi M, Esmaeili SA, Mardani F, et al. Macrophage plasticity, polarization, and function in health and disease. J Cell Physiol (2018) 233(9):6425–40. doi: 10.1002/jcp.26429
37. Orecchioni M, Ghosheh Y, Pramod AB, Ley K. Macrophage polarization: Different gene signatures in M1(Lps+) vs. classically and M2(Lps-) vs. alternatively activated macrophages. Front Immunol (2019) 10:1084. doi: 10.3389/fimmu.2019.01084
38. Qiao Z, Xia C, Shen S, Corwin FD, Liu M, Guan R, et al. Suppression of the Pi3k pathway in vivo reduces cystitis-induced bladder hypertrophy and restores bladder capacity examined by magnetic resonance imaging. PloS One (2014) 9(12):e114536. doi: 10.1371/journal.pone.0114536
39. Pantano F, Croset M, Driouch K, Bednarz-Knoll N, Iuliani M, Ribelli G, et al. Integrin Alpha5 in human breast cancer is a mediator of bone metastasis and a therapeutic target for the treatment of osteolytic lesions. Oncogene (2021) 40(7):1284–99. doi: 10.1038/s41388-020-01603-6
40. Mishra S, Charan M, Shukla RK, Agarwal P, Misri S, Verma AK, et al. Cpla2 blockade attenuates S100a7-mediated breast tumorigenicity by inhibiting the immunosuppressive tumor microenvironment. J Exp Clin Cancer Res CR (2022) 41(1):54. doi: 10.1186/s13046-021-02221-0
41. Iizuka T, Sawabe M, Takubo K, Liu M, Homma Y, Suzuki M, et al. Htert promoter polymorphism, -1327c>T, is associated with the risk of epithelial cancer. SpringerPlus (2013) 2(1):249. doi: 10.1186/2193-1801-2-249
42. Shimizu K, Iyoda T, Okada M, Yamasaki S, Fujii SI. Immune suppression and reversal of the suppressive tumor microenvironment. Int Immunol (2018) 30(10):445–54. doi: 10.1093/intimm/dxy042
43. Fan X, Jin J, Yan L, Liu L, Li Q, Xu Y. The impaired anti-tumoral effect of immune surveillance cells in the immune microenvironment of gastric cancer. Clin Immunol (Orlando Fla) (2020) 219:108551. doi: 10.1016/j.clim.2020.108551
44. Riley RS, June CH, Langer R, Mitchell MJ. Delivery technologies for cancer immunotherapy. Nat Rev Drug Discovery (2019) 18(3):175–96. doi: 10.1038/s41573-018-0006-z
45. Che Y, Yang Y, Suo J, An Y, Wang X. Induction of systemic immune responses and reversion of immunosuppression in the tumor microenvironment by a therapeutic vaccine for cervical cancer. Cancer immunology immunotherapy CII (2020) 69(12):2651–64. doi: 10.1007/s00262-020-02651-3
46. Chen YP, Zhang Y, Lv JW, Li YQ, Wang YQ, He QM, et al. Genomic analysis of tumor microenvironment immune types across 14 solid cancer types: Immunotherapeutic implications. Theranostics (2017) 7(14):3585–94. doi: 10.7150/thno.21471
47. Smola S. Immunopathogenesis of hpv-associated cancers and prospects for immunotherapy. Viruses (2017) 9(9):254. doi: 10.3390/v9090254
48. Tuyaerts S, Van Nuffel AMT, Naert E, Van Dam PA, Vuylsteke P, De Caluwé A, et al. Primmo study protocol: A phase ii study combining pd-1 blockade, radiation and immunomodulation to tackle cervical and uterine cancer. BMC Cancer (2019) 19(1):506. doi: 10.1186/s12885-019-5676-3
49. Wang Y, Li G. Pd-1/Pd-L1 blockade in cervical cancer: Current studies and perspectives. Front Med (2019) 13(4):438–50. doi: 10.1007/s11684-018-0674-4
50. Liu M, Shen S, Kendig DM, Mahavadi S, Murthy KS, Grider JR, et al. Inhibition of nmdar reduces bladder hypertrophy and improves bladder function in cyclophosphamide induced cystitis. J Urol (2015) 193(5):1676–83. doi: 10.1016/j.juro.2014.12.092
51. Tan KT, Yeh CN, Chang YC, Cheng JH, Fang WL, Yeh YC, et al. Prkdc: New biomarker and drug target for checkpoint blockade immunotherapy. J Immunother Cancer (2020) 8(1):e000485. doi: 10.1136/jitc-2019-000485
52. Zhou Y, Liu F, Xu Q, Yang B, Li X, Jiang S, et al. Inhibiting importin 4-mediated nuclear import of cebpd enhances chemosensitivity by repression of prkdc-driven DNA damage repair in cervical cancer. Oncogene (2020) 39(34):5633–48. doi: 10.1038/s41388-020-1384-3
53. Xu HB, Yang H, Liu T, Chen H. Association of Ctla4 gene polymorphism (Rs5742909) with cervical cancer: A meta-analysis. Tumour Biol J Int Soc Oncodevelopmental Biol Med (2014) 35(2):1605–8. doi: 10.1007/s13277-013-1221-1
54. Lee YH, Song GG. A meta-analysis of the association between ctla-4 +49 a/G, -318 C/T, and il-1 polymorphisms and susceptibility to cervical cancer. Neoplasma (2014) 61(4):481–90. doi: 10.4149/neo_2014_060
55. Chauhan SR, Bharadwaj M. Gearing up T-cell immunotherapy in cervical cancer. Curr problems Cancer (2018) 42(2):175–88. doi: 10.1016/j.currproblcancer.2018.04.001
56. He Y, Li XM, Yin CH, Wu YM. Killing cervical cancer cells by specific chimeric antigen receptor-modified T cells. J Reprod Immunol (2020) 139:103115. doi: 10.1016/j.jri.2020.103115
57. Conesa-Zamora P. Immune responses against virus and tumor in cervical carcinogenesis: Treatment strategies for avoiding the hpv-induced immune escape. Gynecologic Oncol (2013) 131(2):480–8. doi: 10.1016/j.ygyno.2013.08.025
58. Zhang Y, Yu M, Jing Y, Cheng J, Zhang C, Cheng L, et al. Baseline immunity and impact of chemotherapy on immune microenvironment in cervical cancer. Br J Cancer (2021) 124(2):414–24. doi: 10.1038/s41416-020-01123-w
59. Dyer BA, Feng CH, Eskander R, Sharabi AB, Mell LK, McHale M, et al. Current status of clinical trials for cervical and uterine cancer using immunotherapy combined with radiation. Int J Radiat oncology biology Phys (2021) 109(2):396–412. doi: 10.1016/j.ijrobp.2020.09.016
60. Hashmi F, Liu M, Shen S, Qiao LY. Express: Phospholipase c gamma mediates endogenous brain-derived neurotrophic factor - regulated calcitonin gene-related peptide expression in colitis - induced visceral pain. Mol Pain (2016) 12:1744806916657088. doi: 10.1177/1744806916657088
61. Chen J, Hu Y, Teng Y, Yang B. Increased nuclear transporter importin 7 contributes to the tumor growth and correlates with Cd8 T cell infiltration in cervical cancer. Front Cell Dev Biol (2021) 9:732786. doi: 10.3389/fcell.2021.732786
62. Kol A, Lubbers JM, Terwindt ALJ, Workel HH, Plat A, Wisman GBA, et al. Combined sting levels and Cd103+ T cell infiltration have significant prognostic implications for patients with cervical cancer. Oncoimmunology (2021) 10(1):1936391. doi: 10.1080/2162402x.2021.1936391
63. Stevanović S, Draper LM, Langhan MM, Campbell TE, Kwong ML, Wunderlich JR, et al. Complete regression of metastatic cervical cancer after treatment with human papillomavirus-targeted tumor-infiltrating T cells. J Clin Oncol (2015) 33(14):1543–50. doi: 10.1200/jco.2014.58.9093
64. Merino DM, McShane LM, Fabrizio D, Funari V, Chen SJ, White JR, et al. Establishing guidelines to harmonize tumor mutational burden (Tmb): In silico assessment of variation in tmb quantification across diagnostic platforms: Phase I of the friends of cancer research tmb harmonization project. J Immunother Cancer (2020) 8(1):e000147. doi: 10.1136/jitc-2019-000147
65. Budczies J, Allgäuer M, Litchfield K, Rempel E, Christopoulos P, Kazdal D, et al. Optimizing panel-based tumor mutational burden (Tmb) measurement. Ann Oncol (2019) 30(9):1496–506. doi: 10.1093/annonc/mdz205
66. Samstein RM, Lee CH, Shoushtari AN, Hellmann MD, Shen R, Janjigian YY, et al. Tumor mutational load predicts survival after immunotherapy across multiple cancer types. Nat Genet (2019) 51(2):202–6. doi: 10.1038/s41588-018-0312-8
67. Marabelle A, Fakih M, Lopez J, Shah M, Shapira-Frommer R, Nakagawa K, et al. Association of tumour mutational burden with outcomes in patients with advanced solid tumours treated with pembrolizumab: Prospective biomarker analysis of the multicohort, open-label, phase 2 keynote-158 study. Lancet Oncol (2020) 21(10):1353–65. doi: 10.1016/s1470-2045(20)30445-9
68. Kaplanov I, Carmi Y, Kornetsky R, Shemesh A, Shurin GV, Shurin MR, et al. Blocking il-1β reverses the immunosuppression in mouse breast cancer and synergizes with anti-Pd-1 for tumor abrogation. Proc Natl Acad Sci United States America (2019) 116(4):1361–9. doi: 10.1073/pnas.1812266115
69. Imazeki H, Ogiwara Y, Kawamura M, Boku N, Kudo-Saito C. Cd11b(+)Ctla4(+) myeloid cells are a key driver of tumor evasion in colorectal cancer. J Immunother Cancer (2021) 9(7):e002841. doi: 10.1136/jitc-2021-002841
70. Guo Y, Pan WK, Wang ZW, Su WH, Xu K, Jia H, et al. Identification of novel biomarkers for predicting prognosis and immunotherapy response in head and neck squamous cell carcinoma based on cerna network and immune infiltration analysis. BioMed Res Int (2021) 2021:4532438. doi: 10.1155/2021/4532438
71. Shaim H, Shanley M, Basar R, Daher M, Gumin J, Zamler DB, et al. Targeting the Av Integrin/Tgf-B axis improves natural killer cell function against glioblastoma stem cells. J Clin Invest (2021) 131(14):e142116. doi: 10.1172/jci142116
72. Qin Y, Yang J, Liang C, Liu J, Deng Z, Yan B, et al. Pan-cancer analysis identifies migrasome-related genes as a potential immunotherapeutic target: A bulk omics research and single cell sequencing validation. Front Immunol (2022) 13:994828. doi: 10.3389/fimmu.2022.994828
Keywords: ICI score, cervical cancer, TMB, immune infiltration, immune microenvironment
Citation: Yao S, Zhao L, Chen S, Wang H, Gao Y, Shao N-Y, Dai M and Cai H (2023) Cervical cancer immune infiltration microenvironment identification, construction of immune scores, assisting patient prognosis and immunotherapy. Front. Immunol. 14:1135657. doi: 10.3389/fimmu.2023.1135657
Received: 01 January 2023; Accepted: 01 March 2023;
Published: 10 March 2023.
Edited by:
Yiguan Zhang, Southwest Medical University, ChinaReviewed by:
Xiaohan Ning, Dana–Farber Cancer Institute, United StatesCopyright © 2023 Yao, Zhao, Chen, Wang, Gao, Shao, Dai and Cai. This is an open-access article distributed under the terms of the Creative Commons Attribution License (CC BY). The use, distribution or reproduction in other forums is permitted, provided the original author(s) and the copyright owner(s) are credited and that the original publication in this journal is cited, in accordance with accepted academic practice. No use, distribution or reproduction is permitted which does not comply with these terms.
*Correspondence: Hongbing Cai, Y2hiMjEwNTFAMTYzLmNvbQ==; Mengyuan Dai, bWVuZ3l1YW5kYWlAd2h1LmVkdS5jbg==; Ning-Yi Shao, bnNoYW9AdW0uZWR1Lm1v
†These authors have contributed equally to this work and share first authorship
Disclaimer: All claims expressed in this article are solely those of the authors and do not necessarily represent those of their affiliated organizations, or those of the publisher, the editors and the reviewers. Any product that may be evaluated in this article or claim that may be made by its manufacturer is not guaranteed or endorsed by the publisher.
Research integrity at Frontiers
Learn more about the work of our research integrity team to safeguard the quality of each article we publish.