- 1Department of Gastrointestinal Surgery, Nanjing Drum Tower Hospital, The Affiliated Hospital of Nanjing University Medical School, Nanjing, China
- 2Department of Gastrointestinal Surgery, Nanjing Drum Tower Hospital, Drum Tower Clinical Medical College of Nanjing Medical University, Nanjing, China
- 3Department of Critical Care Medicine, Nanjing Drum Tower Hospital, The Affiliated Hospital of Nanjing University Medical School, Nanjing, China
Introduction: Innate lymphoid cells (ILCs) are key components of the immune system, yet the similarity and distinction of the properties across tissues under homeostasis, inflammation and tumor process remain elusive.
Methods: Here we performed integrative inference of ILCs to reveal their transcriptional profiles and heterogeneity from single-cell genomics. We collected a large number of ILCs from human six different tissues which can represent unique immune niches (circulation, lymphoid tissue, normal and inflamed mucosa, tumor microenvironment), to systematically address the transcriptional imprinting.
Results: ILCs are profoundly imprinted by their organ of residence, and tissue-specific distinctions are apparent under pathological conditions. In the hepatocellular carcinoma microenvironment, we identified intermediate c-kit+ ILC2 population, and lin-CD127- NK-like cells that expressed markers of cytotoxicity including CCL5 and IFNG. Additionally, CD127+CD94+ ILC1s were preferentially enriched in inflamed ileum from patients with Crohn’s disease.
Discussion: These analyses depicted a comprehensive characterization of ILC anatomical distribution and subset heterogeneity, and provided a base line for future temporal or spatial studies focused on tissue-specific ILC-mediated immunity.
Introduction
Innate lymphoid cells (ILCs) are newly discovered lymphocytes which are functionally analogous to polarized CD4+ T helper (Th) cells, acting as important contributors to the regulation of immunity, inflammation, and tissue homeostasis (1). ILCs lack antigen-specific receptors on their surface, making them distinct from dendritic cells (DCs), macrophages, B and T lymphocytes (termed Lineage negative, Lin-) (1, 2). ILCs have the capacity to adjust to tissue-specific environments and respond to shocks or infections by producing cytokines, which direct and enhance immune responses on the front line of attack (2–4). Currently, ILCs are well characterized into five categories: NK cells, lymphoid-tissue inducer (LTi) cells together with group 1, 2 and 3 ILCs (ILC1s, ILC2s and ILC3s, respectively). ILC1s (CD127+CD117−CRTH2−) and NK cells (CD127−) share several common features, including their expression of the transcription factor T-bet (encoded by TBX21), the responsiveness to IL-15, IL-12 and IL-18, and the capacity to secrete interferon-γ (IFN-γ). Most NK cells are also dependent on EOMES for lineage specification, and it appears the characteristics of killer cells in immunosurveillance, whereas ILC1s are innate helper cells with weaker cytotoxic activity (5–7). With regard to ILC2s (CD127+CD117 ± CRTH2+), GATA3 is the master transcriptional regulator for their development, as well as their capacity of producing IL-5 and IL-13 that govern a wide spectrum of features, including type 2 immune response, helminth infection and tissue fibrosis (8). ILC3s (CD127+CD117+CRTH2−) are defined by RORγt (encoded by RORC) expression, produce IL-17and IL-22, which have important functions in lymphoid tissue development and protection against extracellular bacteria and fungi (9, 10).
Recently, the single-cell RNA sequencing (scRNA-seq) technologies have been increasingly applied to characterize tissue-specific imprinting of ILCs, which improved our knowledge of the human immune system’s diversity. For example, Mazzurana et al. identified a novel unconventional ILC2 subpopulation (CRTH2– ILC2) in the lung, expressing receptors for IL-33 and IL-25, by full-length Smart-seq2 scRNA-seq (11). Heinrich et al. discovered c-Kit+ ILC2s increased in frequency from non-tumor liver to tumor tissue in contrast to NKp44− ILC3s (12). Among the ILC3s, Rethacker et al. identified a CD56+ILC3 subset expressed cytotoxicity genes (such as PRF1, GZMA and GZMB) shared with NK cells, which infiltrated metastatic breast cancer lymph nodes (13). Besides, combination of measurements of many cellular properties by flow cytometry and unbiased cell type identification by scRNA-seq allowed us to find the best cellular parameters to purify any cell type of interest (14).
In this study, using a combination of published scRNA-seq data, we painted the landscapes of ILCs across six human tissues including blood, colon, lung, tonsil, inflamed ileum from Crohn’s disease patients and hepatocellular carcinoma (HCC). By characterizing the degree of commonalities and differences of those subsets in different tissues, we aim to reveal the diversity and plasticity of human ILCs, and extend understanding of innate immune system.
Methods
Single-cell RNA-seq datasets collected in this study
We searched PubMed databases through September 2022 using the following search terms: single-cell RNA sequencing OR scRNA-seq AND ILC. In order to find any relevant studies, the manual search was augmented by carefully reading the reference lists from those retrieved publications. For inclusion, the study must meet the following criteria: (1) human tissue samples were obtained from adult or pediatric donors (excluding fetal tissues); (2) for the scRNA-seq characterization, ILCs were purified by flow cytometry (CD45+ Lineage-); (3) raw sequencing reads or count matrix could be obtained. When study populations were overlapped or duplicated in some studies, we chose the most complete and suitable research.
Single-cell RNA-seq data processing and integration
For collected scRNA-seq datasets, cell annotation tables (ILC types) were obtained from the original publications; otherwise, we applied Seurat (version 4) with default parameters to filter and identify ILC types. Briefly, cells with fewer than 200 genes detected or > 40% mitochondrial counts or > 50% ribosomal counts were filtered out; genes detected in > 3 cells and UMI count > 1000 were kept. The GSE179795 dataset was run via Scrublet to eliminate any potential doublets, setting the expected doublet rate to 0.05 (15).
Considering the heterogeneity from different platforms and different studies, we applied “computesumFactors” function from scran R package to compute the size factor of each cell, which in turn was used to normalized the counts (16). A log2 transformation was also performed on normalized counts. Next, we used the “modelGeneVar” function to compute the biological variation for each gene, and the top 2000 genes were identified as highly variable features (HVGs). Mitochondrion, ribosomal and cell cycle genes were not interesting in our research, and thus were excluded in HVGs. Then gene expression matrix was scaled to z-score which could remove much of the batch effect caused by differences in platforms. To further handle more batches, “harmony” (17) or “LIGER” (18) was applied immediately after PCA. For visualization, the dimensionality of this combined dataset was further reduced using Uniform Manifold Approximation and Projection (UMAP).
In order to quantitatively evaluate the performance on integration, the Local Inverse Simpson Index (LISI) that defines the effective number of datasets in a neighborhood of a cell was calculated (17). LISI represents the local neighborhood of a sample with respect to the batch (integration LISI, iLISI) or accuracy (cell-type LISI, cLISI), respectively. While in good and accurate integration, higher iLISI value indicated that neighborhoods presented by more datasets and lower batch effect; lower cLISI value reflected a separation of unique cell types throughout the embedding and thus accurate integration.
Tissue distribution of clusters
To quantify the tissue preference of ILC subsets, odds ratios (OR) were calculated. As Zheng et al. described, the OR is a disproportional measure based on the ratio of the odds of one ILC subset in a specifical tissue, compared to the odds of remaining ILC subsets in the other tissues (19). One subset was identified as being enriched in a specific tissue if OR > 1.5.
Differential expression analysis
To identify differentially expressed genes for cluster demarcation, “FindAllMarkers” function in Seurat was used. GO enrichment analysis was performed using the clusterProfiler R package separately for differentially upregulated genes (adjusted p-value < 0.05) for each cluster (20). The functional gene sets belonging to biological process were focused and selected with an adjusted p-value cutoff of 0.05. Cytokines were annotated according to the “KEGG_CYTOKINE_CYTOKINE_RECEPTOR_INTERACTION” gene set. Only the cytokine genes that were detected in at least 0.25 percent of cells in either of the two populations were retained.
Pseudo-bulk differential expression analysis across different tissues
Given that our samples are from different tissues, it was crucial to consider sample-to-sample variation. Therefore, pseudo-bulk samples were created for differential expression testing based on the subpopulation-stratified scRNA-Seq data (21, 22). Specifically, we summed counts transcript per gene for each subpopulation per sample, and then performed DESeq2 differential analysis (21). Pseudo-bulk samples consisting of fewer than 10 cells were removed.
Results
Integration of multiple scRNA-seq datasets
We compiled an integration of single-cell transcriptomics of ILC across six human tissues (Supplementary Table 1). As Mazzurana et al. described, one minor cluster of cells lacking expression of PTPRC (encoding CD45) and another minor cluster of cells coordinating antigen-presenting function (e.g., high expression of HLA-DQA1, HLA-DRA and HLA-DPA1) were identified and removed (11). After stringent quality-control filtering, we obtained 6670 ILCs from 20 samples, derived from three single-cell RNA-seq datasets [GSE150050 (11), GSE179795 (12) and GSE173642 (23)]. As shown in Figures 1A, B, we used Harmony and LIGER to integrate the above three datasets, respectively. Both Harmony and LIGER successfully removed batch effects from different platforms, whereas Harmony exhibited low bio-conservation score (Figures 1C, D). Thus, we used LIGER to integrate the above three scRNA-seq datasets for further analysis.
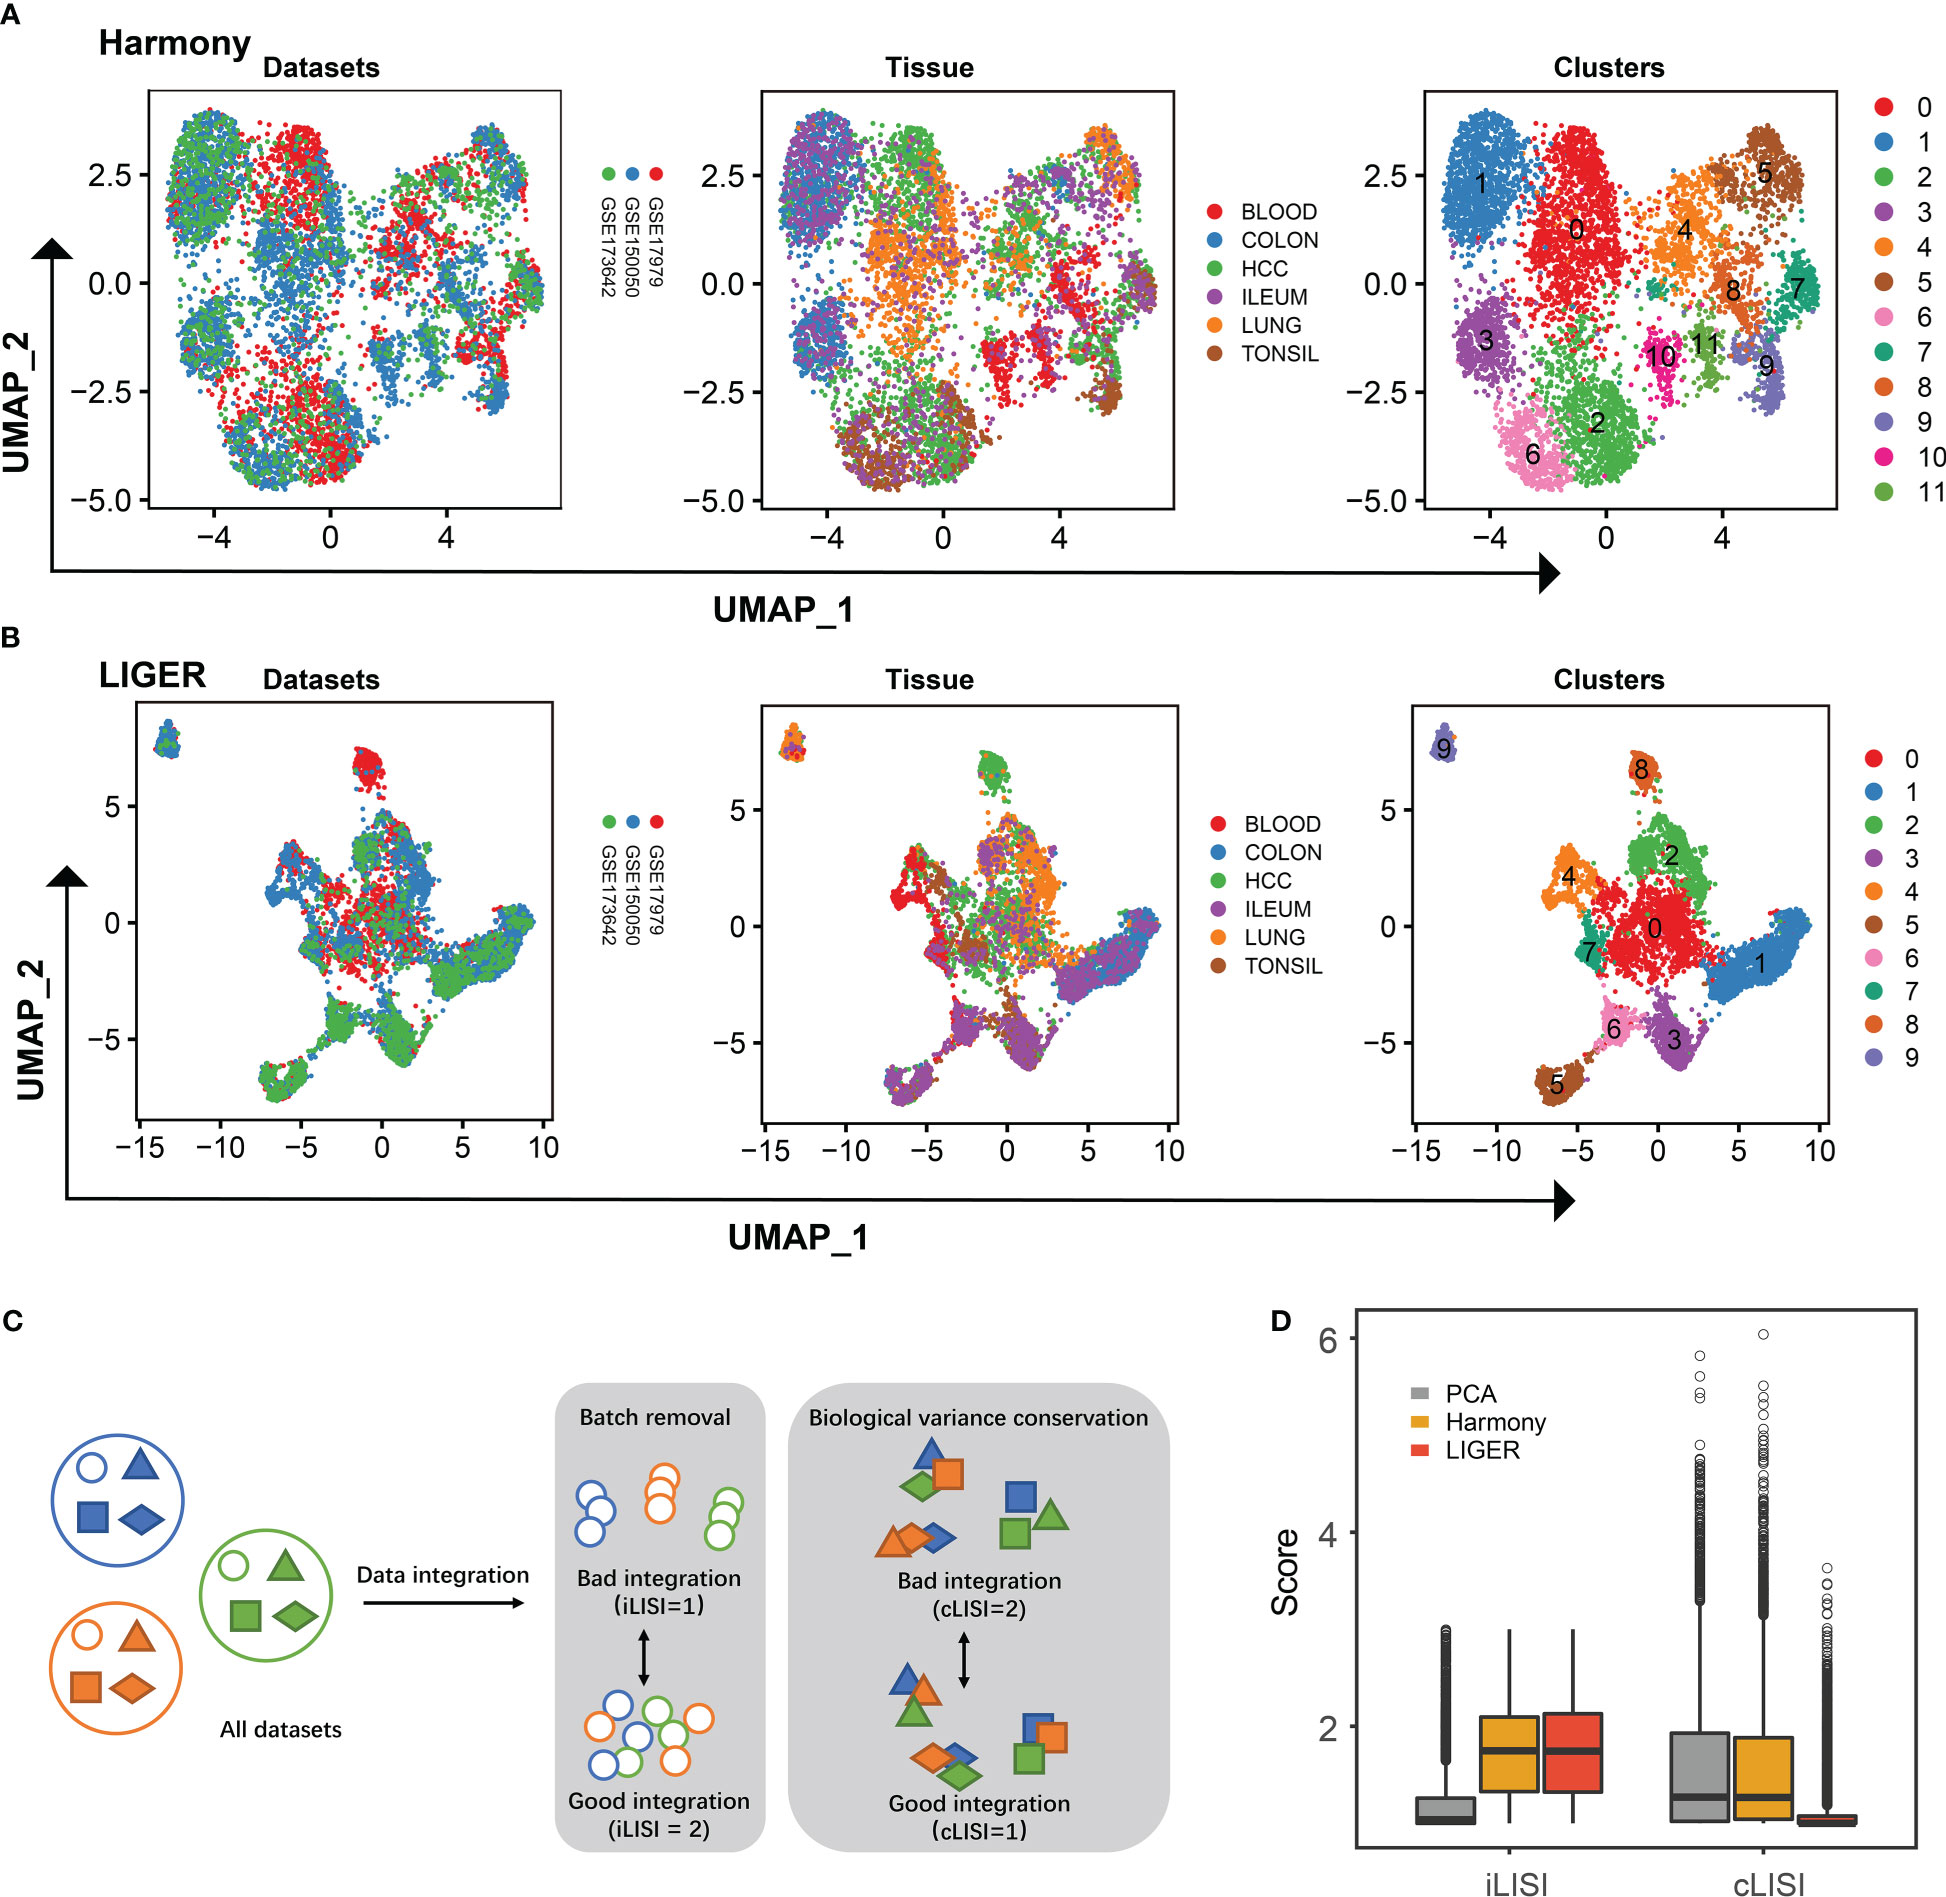
Figure 1 Integration of ILCs from three scRNA-seq datasets. (A) UMAP plots showing the integration of three scRNA-seq datasets by Harmony. (B) UMAP plots showing the integration of three scRNA-seq datasets by LIGER. (C) Schematic workflow to the quantitative assessment of data integration and batch-correction fidelity. iLISI metrics and cLISI provide measures of the degree of mixing among datasets and integration accuracy on cell types, respectively. (D) Boxplot showing the iLISI and cLISI distribution of data integrated by PCA, Harmony and LIGER.
Single-cell transcriptional landscape of ILCs in different tissues
To characterize the subsets of 6670 ILCs among different tissues (blood, colon, lung, tonsil, ileum and HCC), we performed unsupervised graph-based clustering and then identified 10 clusters based on canonical cell markers (Figures 2A, B). Two clusters expressed NKG7, EOMES, GZMA/B, NCAM1 (CD56), KLRF1 and KLRD1 (CD94) but lacking IL7R were annotated as NK cells (NK_c1 and NK_c2). One cluster lacked expression of IL7R, NCAM1 and KLRD1, but expressed IL1 related genes (IKZF3), which shared characteristics of both NK cells and ILC1s, and thus named “NK_like” subset (12). One cluster was identified as ILC1_c1 subset, with higher levels of expression of specific transcription factor (IKZF3), and T cell markers (CD3D, CD3G and CD3E). One ILC2 subset (ILC2_c1) shared common ILC2s markers (GATA3, MAF and RORA). The ILC2-specialized gene PTGDR2 (encoding CRTH2) was not examined because it was absent in GSE173642 dataset. Four clusters were characterized as ILC3s (ILC3_c1, ILC3_c2, ILC3_c3 and ILC3_c4) on the basis of uniquely high RORC, IL23R, IL1R1, KIT, AHR, TOX and TTN expression. We discovered c-Kit+ ILC2 specific clusters in the GSE179795 dataset and CD127+CD94+ ILC1 subset in GSE173642 dataset as a result of independent analysis of the included datasets (Supplementary Figure 1). Therefore, one cluster in this integrated graph with both GATA3 and KIT high expressing, was annotated as CD127+c-Kit-/+CD94-/+ ILC subset for further analysis. The proportion of cells in these lineages varied highly among different tissues, indicating a heterogeneous cellular condition (Figure 2C). To further dissect in variability within the CD127+c-Kit-/+CD94-/+ ILC subset, 1537 aligned cells were re-clustered. Intriguingly, we found 5 clusters: one CD94+ ILC1 subset (ILC1_c2), two c-Kit+ ILC2 subsets, one c-Kit- ILC2 subset (ILC2_c2) and one ILC3 subset (ILC3_c5) using above cell markers (Figures 2D, E; Supplementary Figure 2). Interestingly, ILC1_c2 subset consisted primarily of CD127+CD94+ ILCs from inflamed ileum in GSE173642 dataset (Supplementary Figure 2). Moreover, Krabbendam et al. reported that no IL-22 expression was detected when IL-23, IL-1, or IL-15 were used to cultivate with ex vivo isolated CD127+CD94+ ILCs; whereas IFN-γ expression was clearly detected in response to IL-15 or IL-12+IL-1β stimulation, which confirming that CD127+CD94+ cells belong to the group 1 ILCs (23). We also assigned each cluster to a cell type using gating strategy base on gene expression, which validated the clustering strategy is considerably accurate (Supplementary Figure 3).
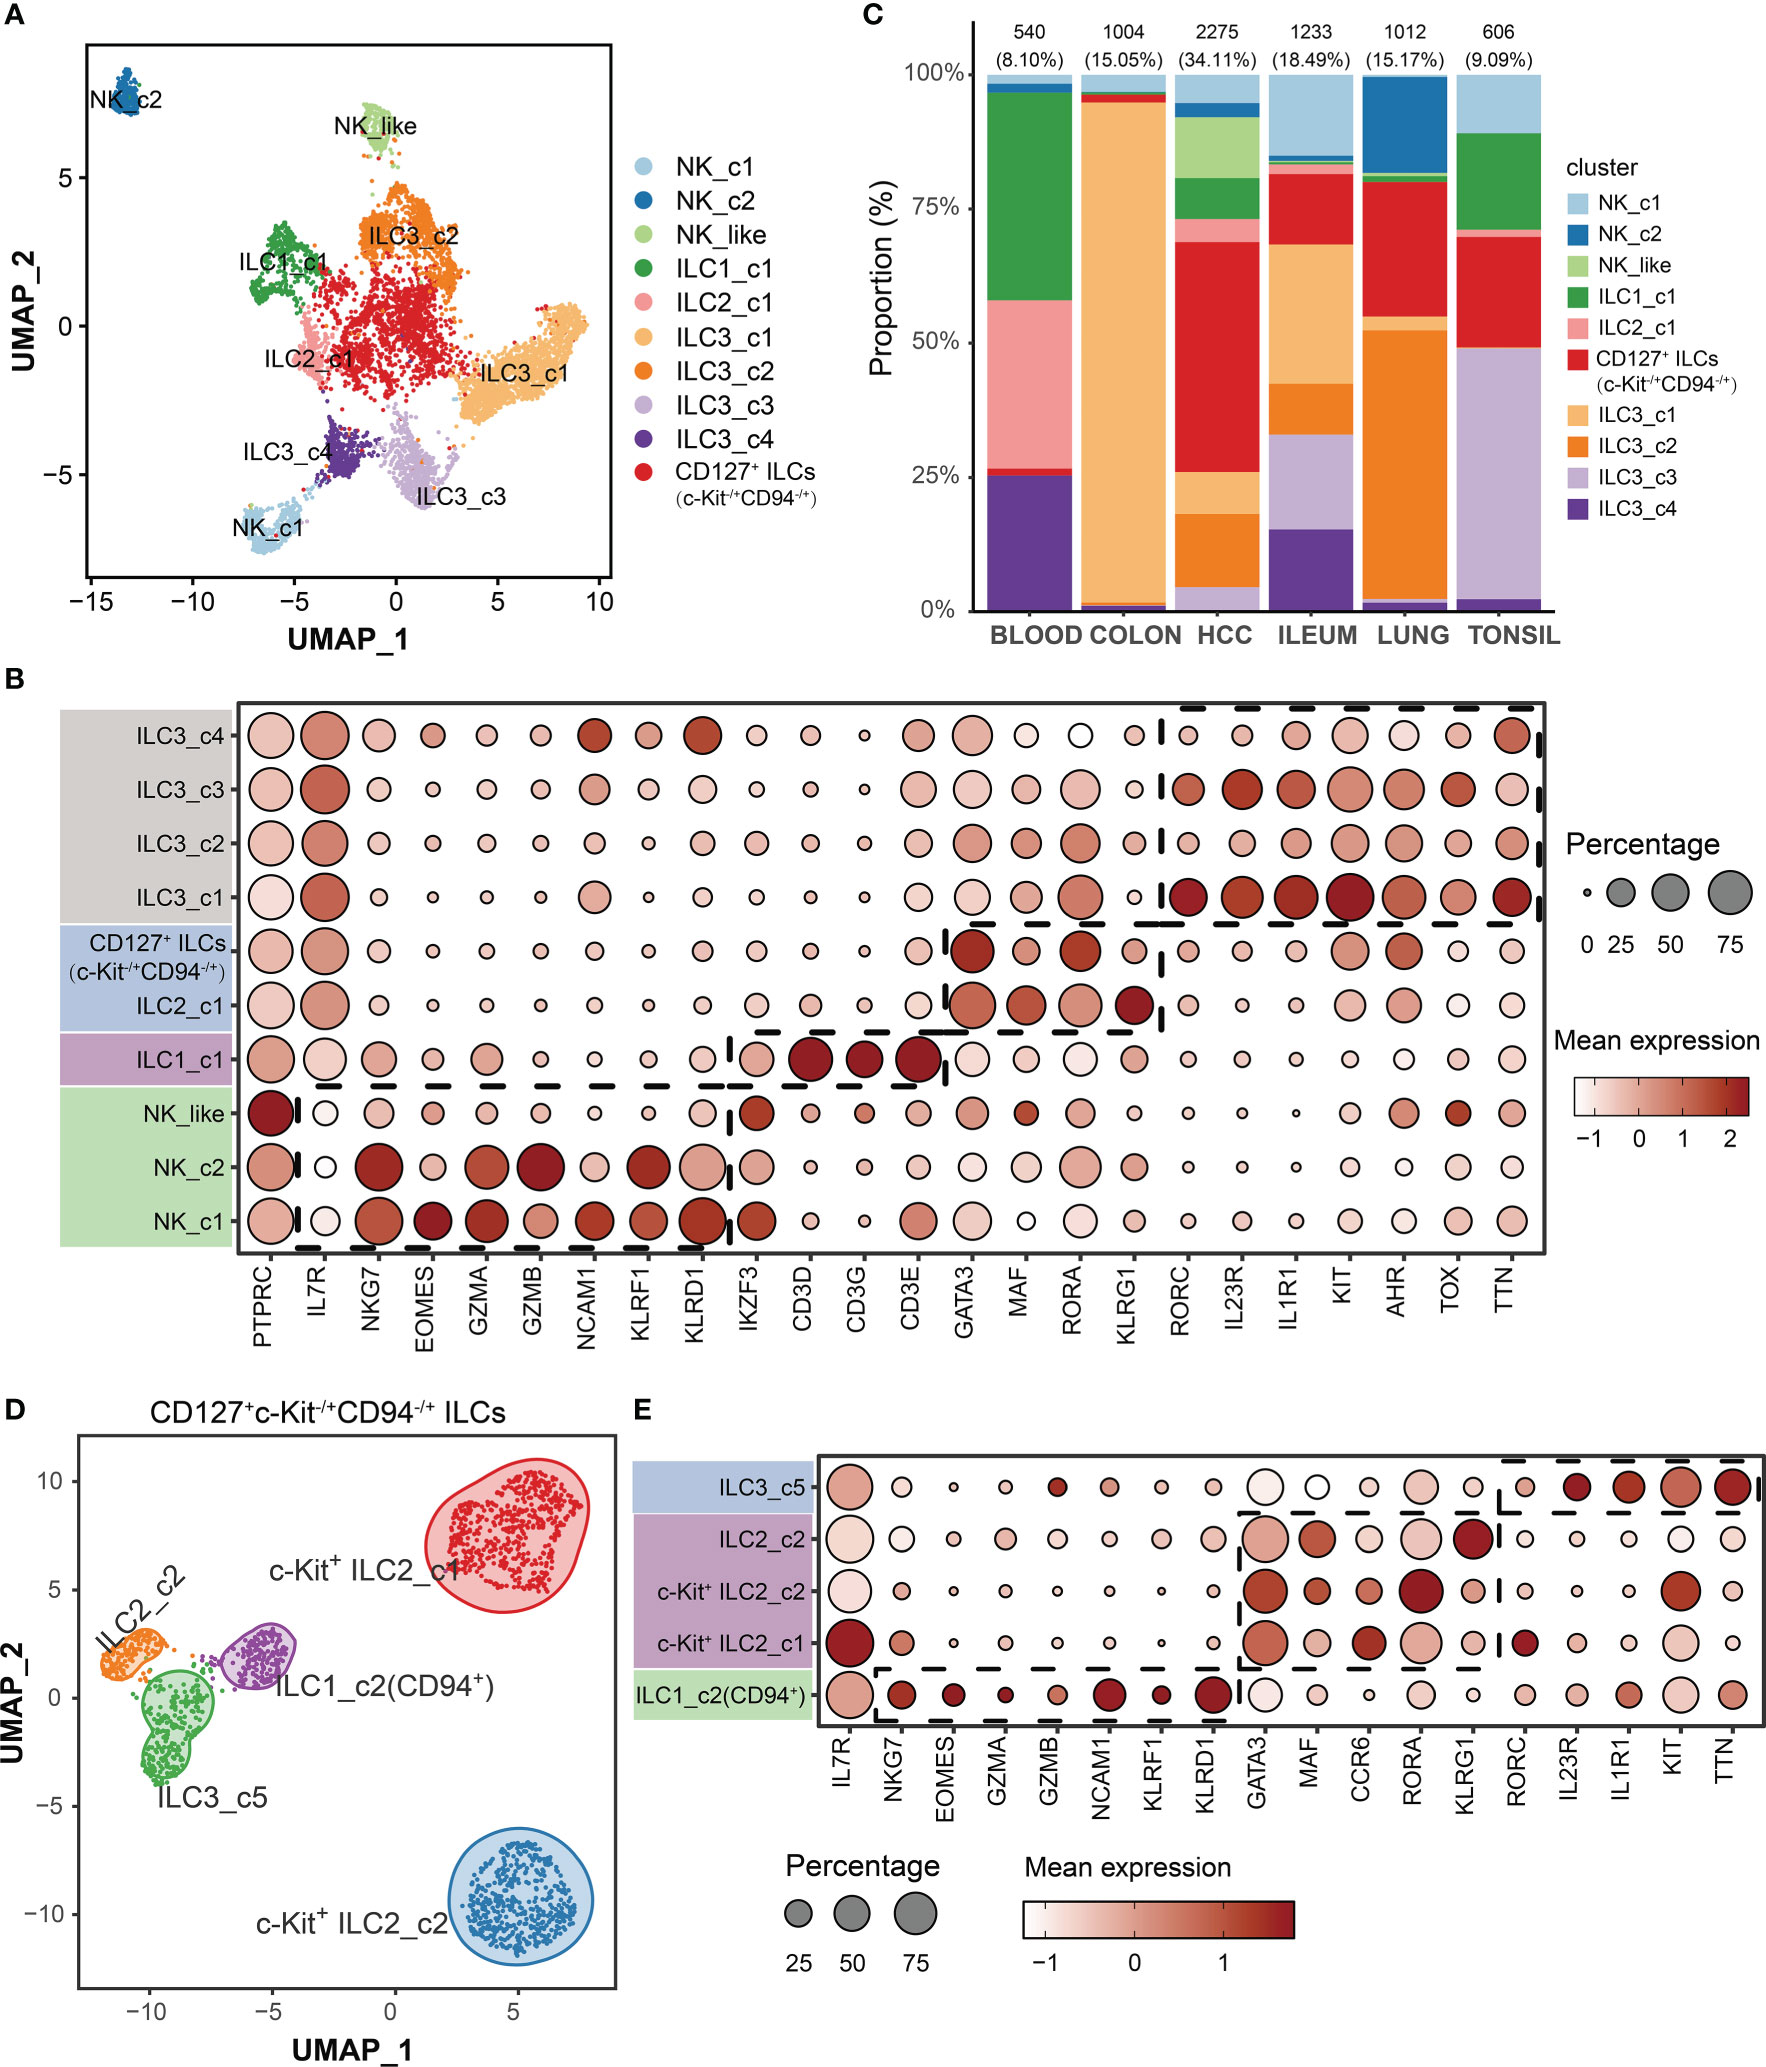
Figure 2 Single-cell transcriptome profiles of ILCs among different tissues. (A) UMAP visualization of all cells (6670) color-coded on the basis of annotated clusters. (B) Dot plot displaying average and percent expression of marker genes across ten ILC clusters. (C) Proportion of each cell type among different tissues. (D) UMAP visualization of c-Kit-/+ ILC2/ILC3 subset (1537 cells). (E) Dot plot displaying average and percent expression of marker genes for c-Kit-/+ ILC2/ILC3 subset across five clusters.
Transcriptome analysis of ILC1s
As shown in Figure 3A, we identified two ILC1 subsets: ILC1_c1 and ILC1_c2 (CD94+). ILC1_c1 population were mainly distributed in blood and tonsil. To identify unique profiles to the ILC1 populations, we compared the gene expression of ILC1s with the combined expression profile of genes in the other populations pooled together. Notably, ILC1_c1 cells had significantly higher expression of CD3D, CD3E, CD3G and CD8A, as previously described (11, 24), which were involved in T-cell development and signal transduction. Among these markers, CD3D was most strongly transcribed. This subset also expressed TCR-associated signaling molecules such as LCK, which has previously been regarded as T-cell specific gene, and glycolysis-associated transcript LDHB (Figure 3B). Furthermore, ILC1_c1 cells displayed differential expression of genes encoding transcription factors (LEF1, BCL11B, IKZF3, GTF3A and ARID5B) and secreted effectors (TNFSF8 and CCL5). ILC1_c2 populations (CD127+CD94+ ILC1) co-expressed IL7R, KLRD1, GNLY, and shared characteristics of both NK cells and conventional ILCs. Theses ILC1s accumulated within inflamed ileum, and were proposed to contribute to inflammation. The ILC1_c2 subset also specifically expressed genes encoding JUND and FOSB (Figure 3B; Supplementary Table 2), belonging to functional component of the AP1 transcription factor complex, which appeared to have distinct effects on cell proliferation and transformation (25). By performing GO analysis, we noted the upregulation of functions associated with regulation of T cell activation and cellular homeostasis related to focal/cell adhesion. Besides, the ILC1_c2 subset of genes were enriched for cytoplasmic translation and ribosome biogenesis. (Figure 3C; Supplementary Table 3).
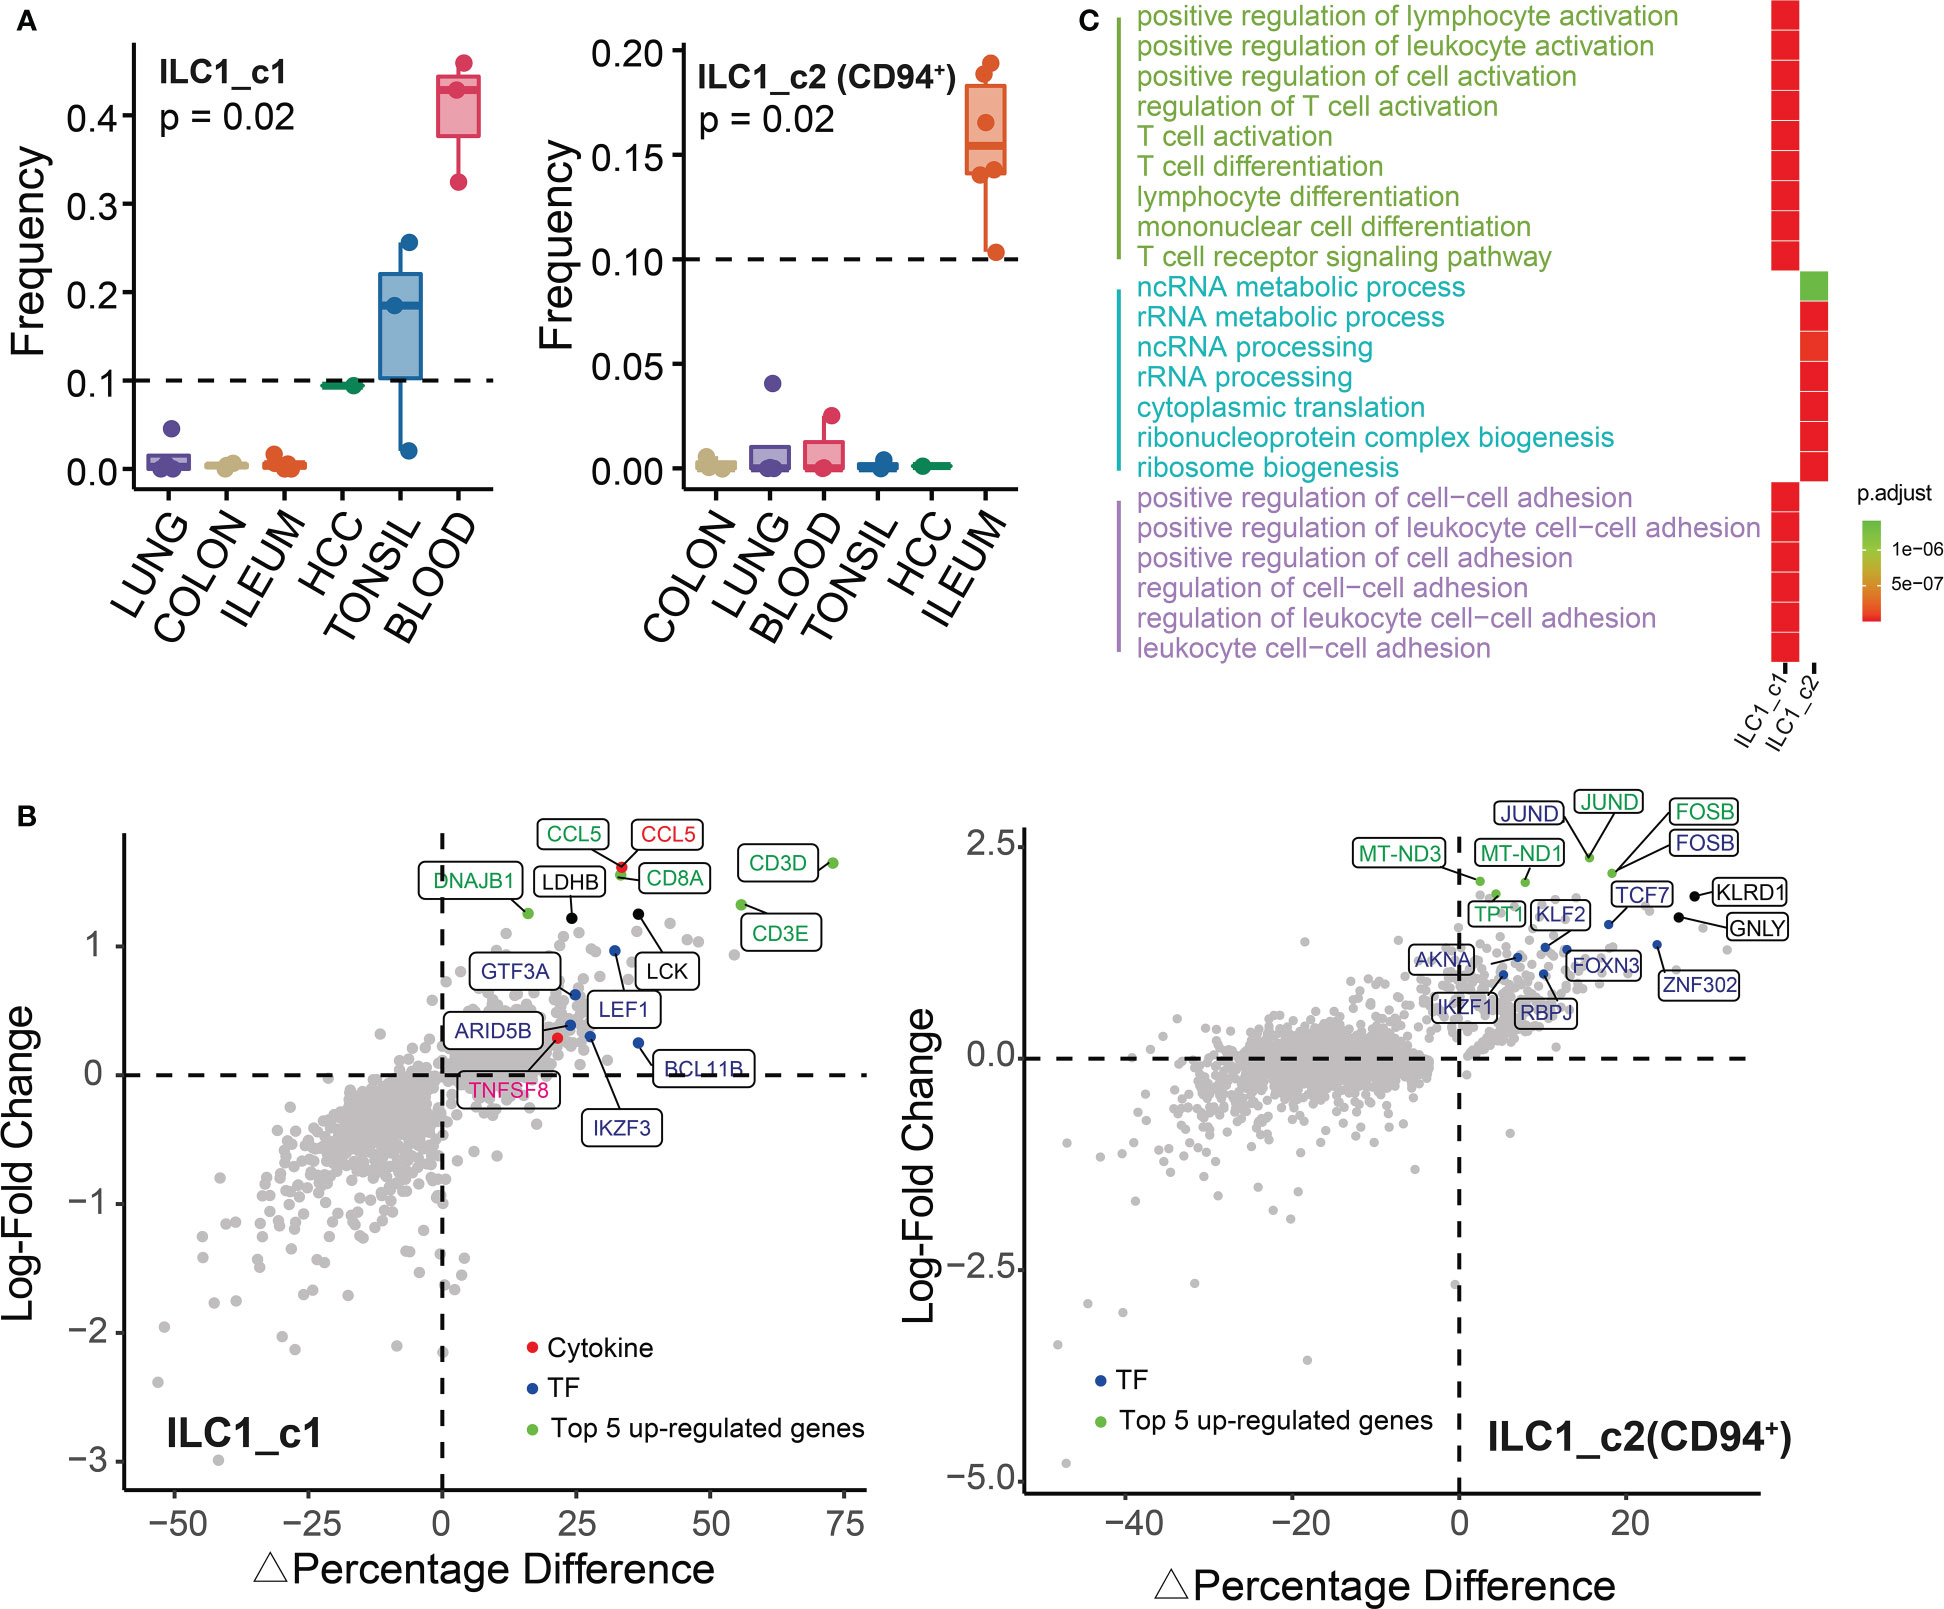
Figure 3 Characterization of ILC1s in different tissues. (A) Box plots showing the frequencies of ILC1s (divided by the total CD127+ ILC number) in lung, colon, ileum, tonsil, blood and HCC. P value were calculated from Kruskal-Wallis test. (B) The percentage of differentially expressed transcripts (△Percent of Cells and log-fold change) in ILC1s is shown. (C) Gene ontology analysis (biological processes) of differentially expressed genes showing top 15 GO terms in each ILC1 subset.
Transcriptome analysis of ILC2s
The distribution of ILC2s exhibited obvious cross-group differences, indicating surprising levels of heterogeneity among cells. We totally identified four subsets of ILC2s, and ILC2_c1 (KLRG1+) and ILC2_c2 (CD69+) were major ILC populations in the blood and tonsil, respectively. The other two subsets (c-Kit+ ILC2_c1 and c-Kit+ ILC2_c2) were only detected in HCC (Figure 4A). All subsets had high expression of transcription factor GATA3 required for ILC2 development (Figure 4B; Supplementary Table 2). The TNF family-related transcripts TNFSF10 (encoding TRAIL, also known as APO-2 ligand) were also highly expressed by ILC2_c1 and ILC2_c2 subsets, acting as a cytotoxic protein which activates rapid apoptosis in tumor cells, but not in normal cells (26). In addition, early differentiation markers, including SELL, IL10RA, and KLRG1, were expressed differentially in ILC2_c1 subset, that appeared to be in an immune quiescence state (27). Interestingly, circulating KLRG1+ ILC2s from individuals with allergic disease were unable to generate IL-10, but this ability was recovered after effective allergen immunotherapy (8, 28). CD200R1 encoding a receptor for the OX-2 membrane glycoprotein was also shown to be expressed most highly on ILC2_c1 subset (Supplementary Table 2). The tissue-residency marker CD69 was mostly expressed in ILC2_c2 subset. Within the ILC2_c2 population, several endogenous regulators of the anti-inflammatory response (DUSP1 and EGR1) were identified (28). Specifically, one study analyzed the nasal epithelium exposed to grass-pollen allergen, and found IL-10-producing ILC2s reduced the expression of pro-inflammatory genes NFKB1 and MYC in an IL-10-dependent manner and increased the expression of the anti-inflammatory transcription factor EGR1 (28).
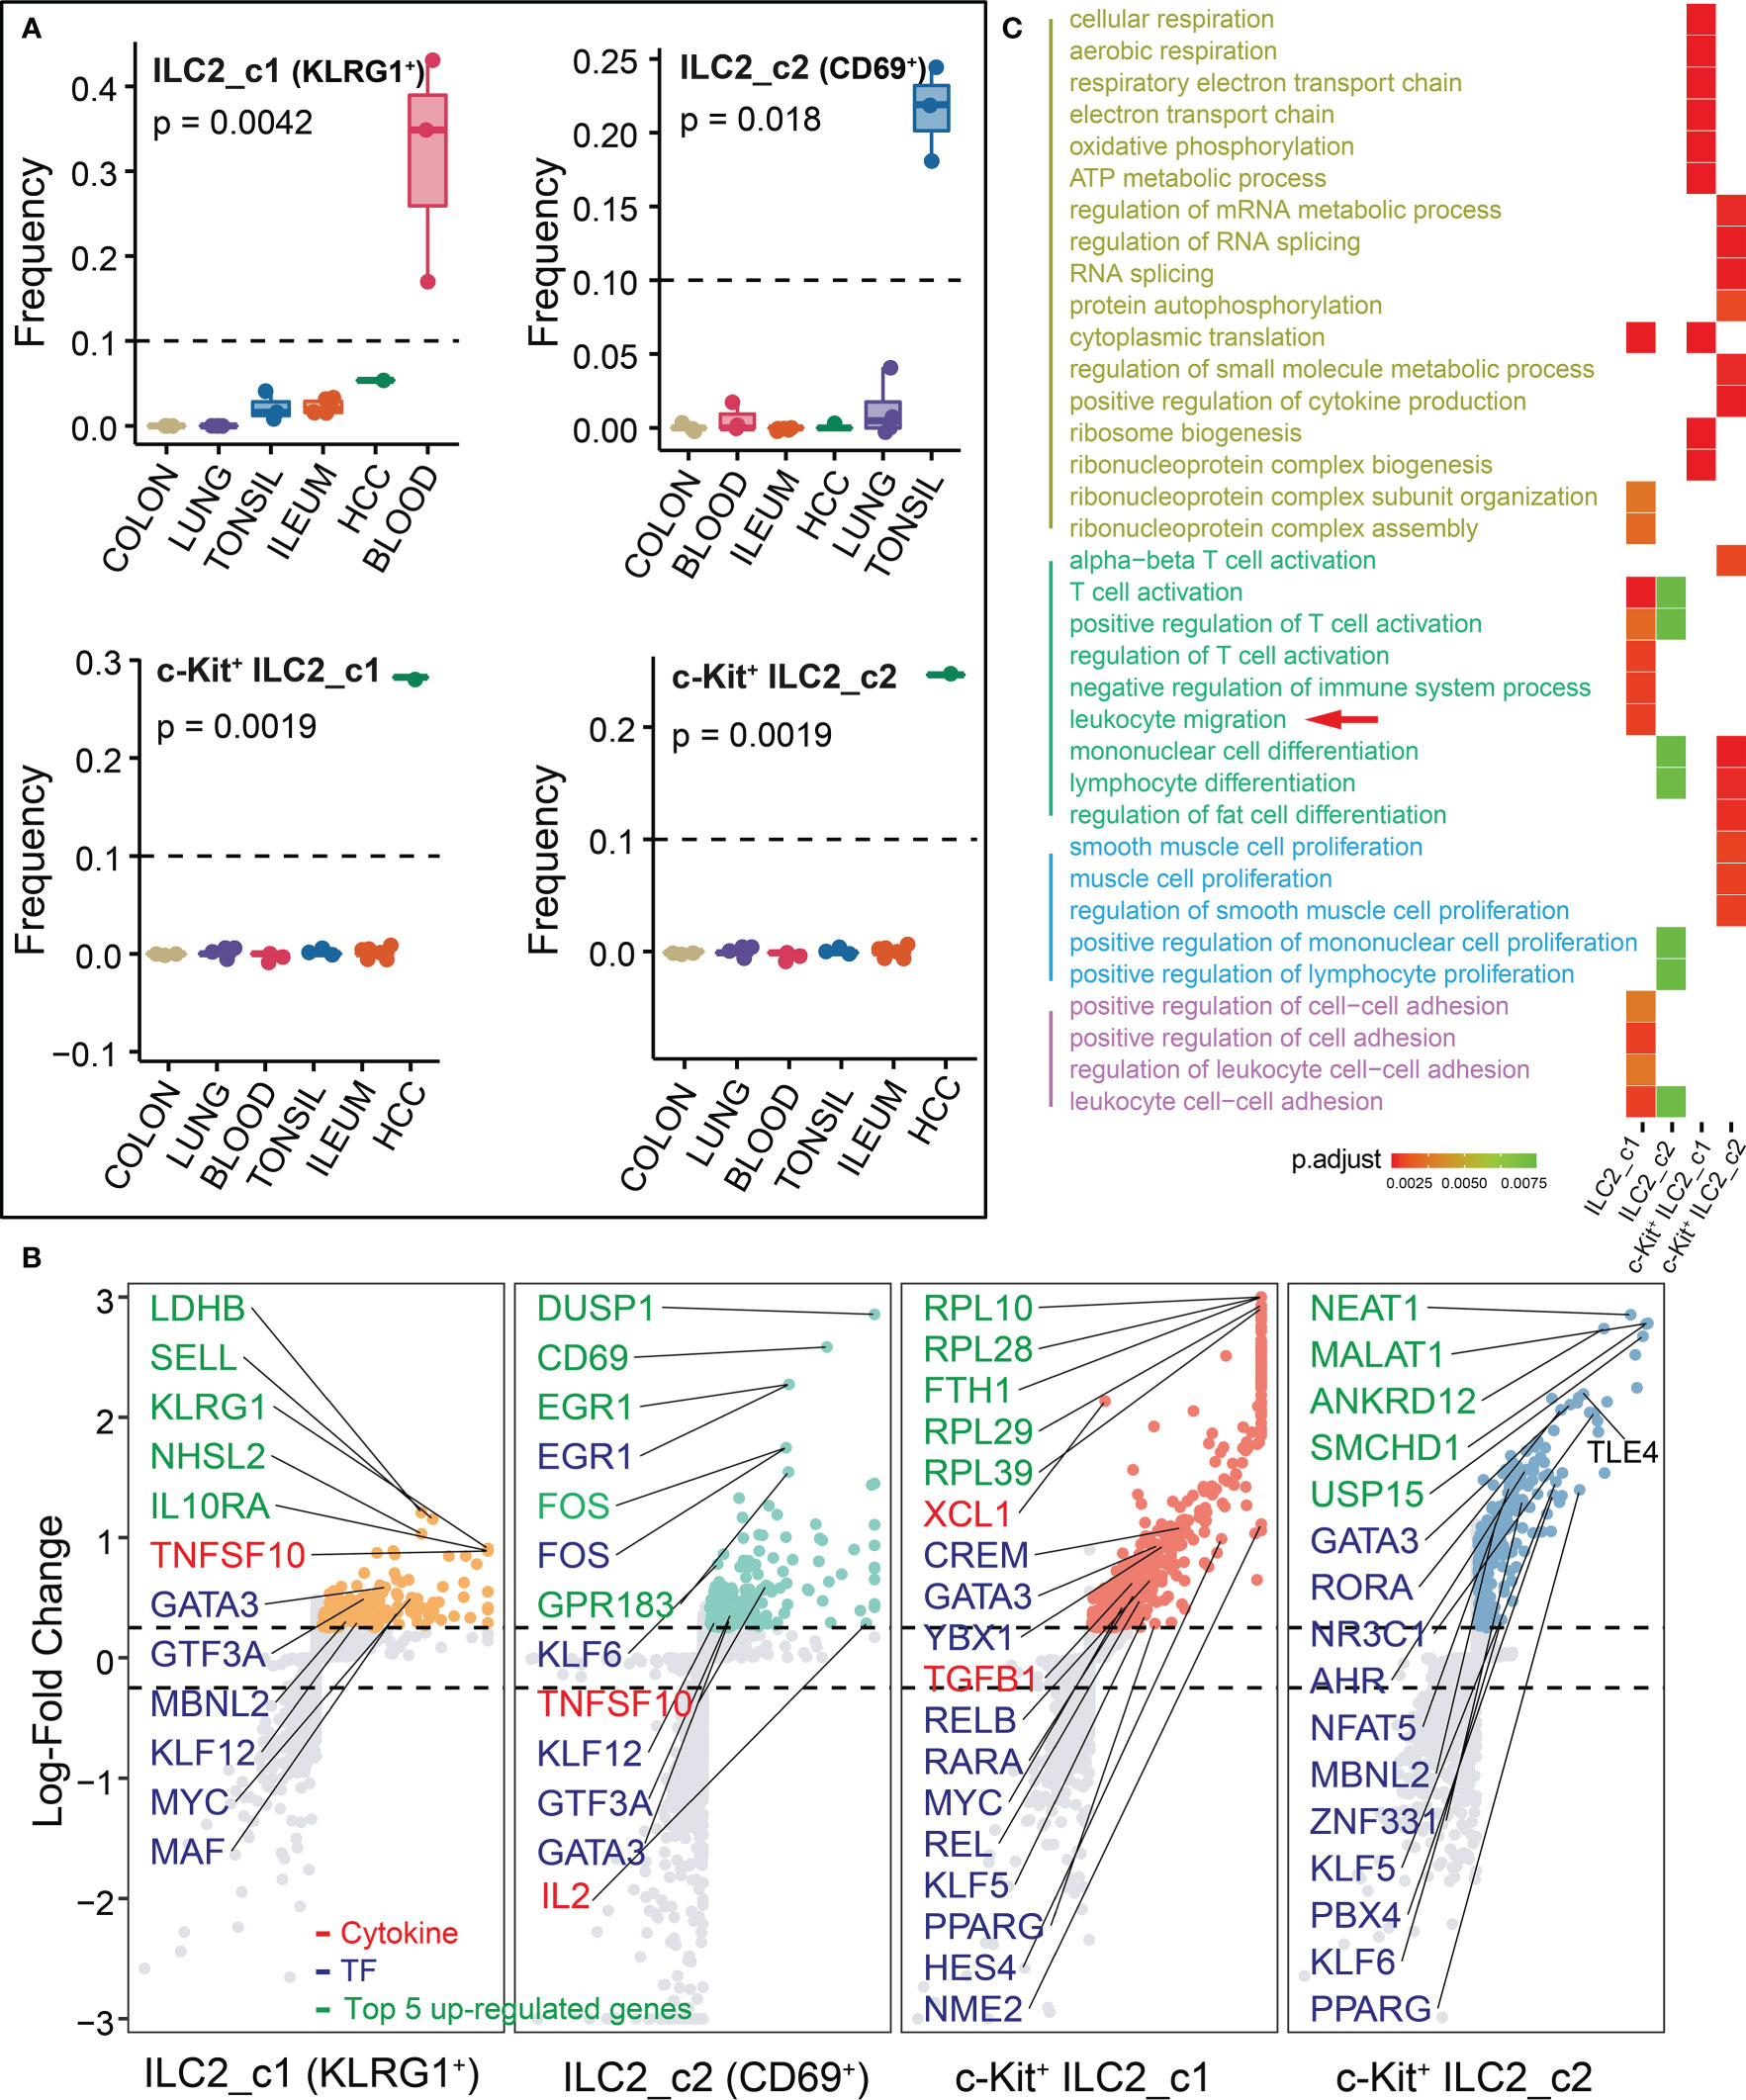
Figure 4 Characterization of ILC2s in different tissues. (A) Box plots showing the frequencies of four ILC2 subsets (divided by the total CD127+ ILC number) in lung, colon, ileum, tonsil, blood and HCC. P values were calculated from Kruskal-Wallis test. (B) Differential gene expression analysis showing up- and down-regulated transcripts across four ILC2 subsets. (C) Functional enrichment analysis showing top 15 GO terms in each ILC2 subset of biological process.
A strong enrichment of ribosomal protein encoding genes (starting with RPL- or RPS-) and metabolism-related gene (FTH1) in c-Kit+ ILC2_c1 subset, indicating a higher level of oxidative phosphorylation and metabolic changes which was similar with our previous work (29). Among the genes encoding secreted proteins, the c-Kit+ ILC2_c1 population expressed XCL1 that involved in the recruitment of dendritic cells (30), and fibrosis-associated gene TGFB1 with either tumor-suppressing or tumor-promoting effects (31, 32). The c-Kit+ ILC2_c2 population highly expressed TLE4, which belongs to Groucho family members function as transcription co-repressors within the context of Wnt signaling (33). We next performed GO analysis on all populations, leading us to note that the pathways mainly involved in T cell activation (typical associated genes: LEF1, PAG1, TESPA1, B2M, IL2; ILC2_c1 and c2 subsets), leukocyte migration (S1PR1, SELL, CD200R1, ANXA1, SELPLG; ILC2_c1 subset), metabolic process (cytoplasmic translation, RPS26, RPL36A, RPL10; ATP metabolic process, ALDOA, CHCHD10, TMSB4X; c-Kit+ ILC2_c1 subset), and regulation of RNA splicing (AHNAK, FUS, RBM39, PIK3R; c-Kit+ ILC2_c2 subset; Figure 4C; Supplementary Table 3).
Transcriptome analysis of ILC3s
Each tissue has its unique ILC3 subsets distribution. For instance, in the colon ILC3_c1 subset is the most predominant; the lung is populated by ILC3_c2 and ILC3_c5 (CD69+) subsets; ILC3_c3 (CD74+) subset is most relevant in tonsil; while ILC3_c4 (CD94+) are widely localized in blood and ileum, respectively (Figure 5A). To further reveal the features of these ILC3 clusters, we next examined the top five highly expressed genes, transcriptional factors, cytokines, respectively (Figure 5B; Supplementary Table 2). The ILC3_c1 populations expressed high levels of transcription factors including Fos gene family (FOS, FOSB and FOSL2), steroid-thyroid hormone-retinoid receptor superfamily (NR4A1, NR4A2 and NR4A3), indicating that Fos/Jun signaling and calcineurin/NFAT might be important for this subset differentiation (34, 35). In addition to the cytokines, this subset also expressed LIF, CSF2, TNFSF11 and TNFSF13B, resulting in strong intestinal inflammation. In all this subset shared a common transcriptomic signature characteristic of typical ILC3s. The ILC3_c2 subset was enriched for heat shock proteins (HSPA6, HSPA1B, HSPH1 and DNAJB1), suggesting that the unfolded protein response best distinguishes this population. The ILC3_c3 subset showed abundant amounts of LTB and CD74 which have been demonstrated to have in vivo significance in murine models (36, 37), and OTUD5 that also been shown to regulate RORγt stability (38). Nagasawa et al. reported that NKp46+ ILCs and tonsillar ILC3 populations shared the expression of CD74 that associated with antigen presentation for immune response, suggesting it as a distinctive marker for ILC3 (39). LST1 was specifically upregulated in this subcluster, which can inhibit the proliferation of lymphocytes (Supplementary Table 2). The ILC3_c4 subset was transcriptionally less active, and could be characterized by expression of SELL and ITGAX, involved in cell adhesion and migration, and KLRD1 with GNLY, expressed in T and NK cells, might correspond to cytotoxic ILC3s. The residency marker CD69 was strongly expressed in ILC3_c5 subset. Strikingly, consistent with ILC3_c1 subset, the high expression of proliferation genes NR4A1, NR4A2 and FOSL2, cytokine genes CSF2 and LIF were also highly expressed in the ILC3_c5 subset, further indicating colon and lung might share associated transcriptional imprinting of ILC3. ILC3-derived CSF2 controlled macrophages and dendritic cells to maintain colonic Treg homeostasis (40). Besides, high expression of TNFSF4 (encoding OX40 ligand) was observed in ILC3_c3 and c5 subsets. Deng et al. revealed the importance of OX40-OX40L signaling for intestinal homeostasis by the crosstalk between Tregs (OX40) and ILC3s (OX40L) (41). Consistently, we found that the enriched GO terms were in line with the function of aforementioned genes (such as regulation of immune effector processes and responses, Figure 5C; Supplementary Table 3).
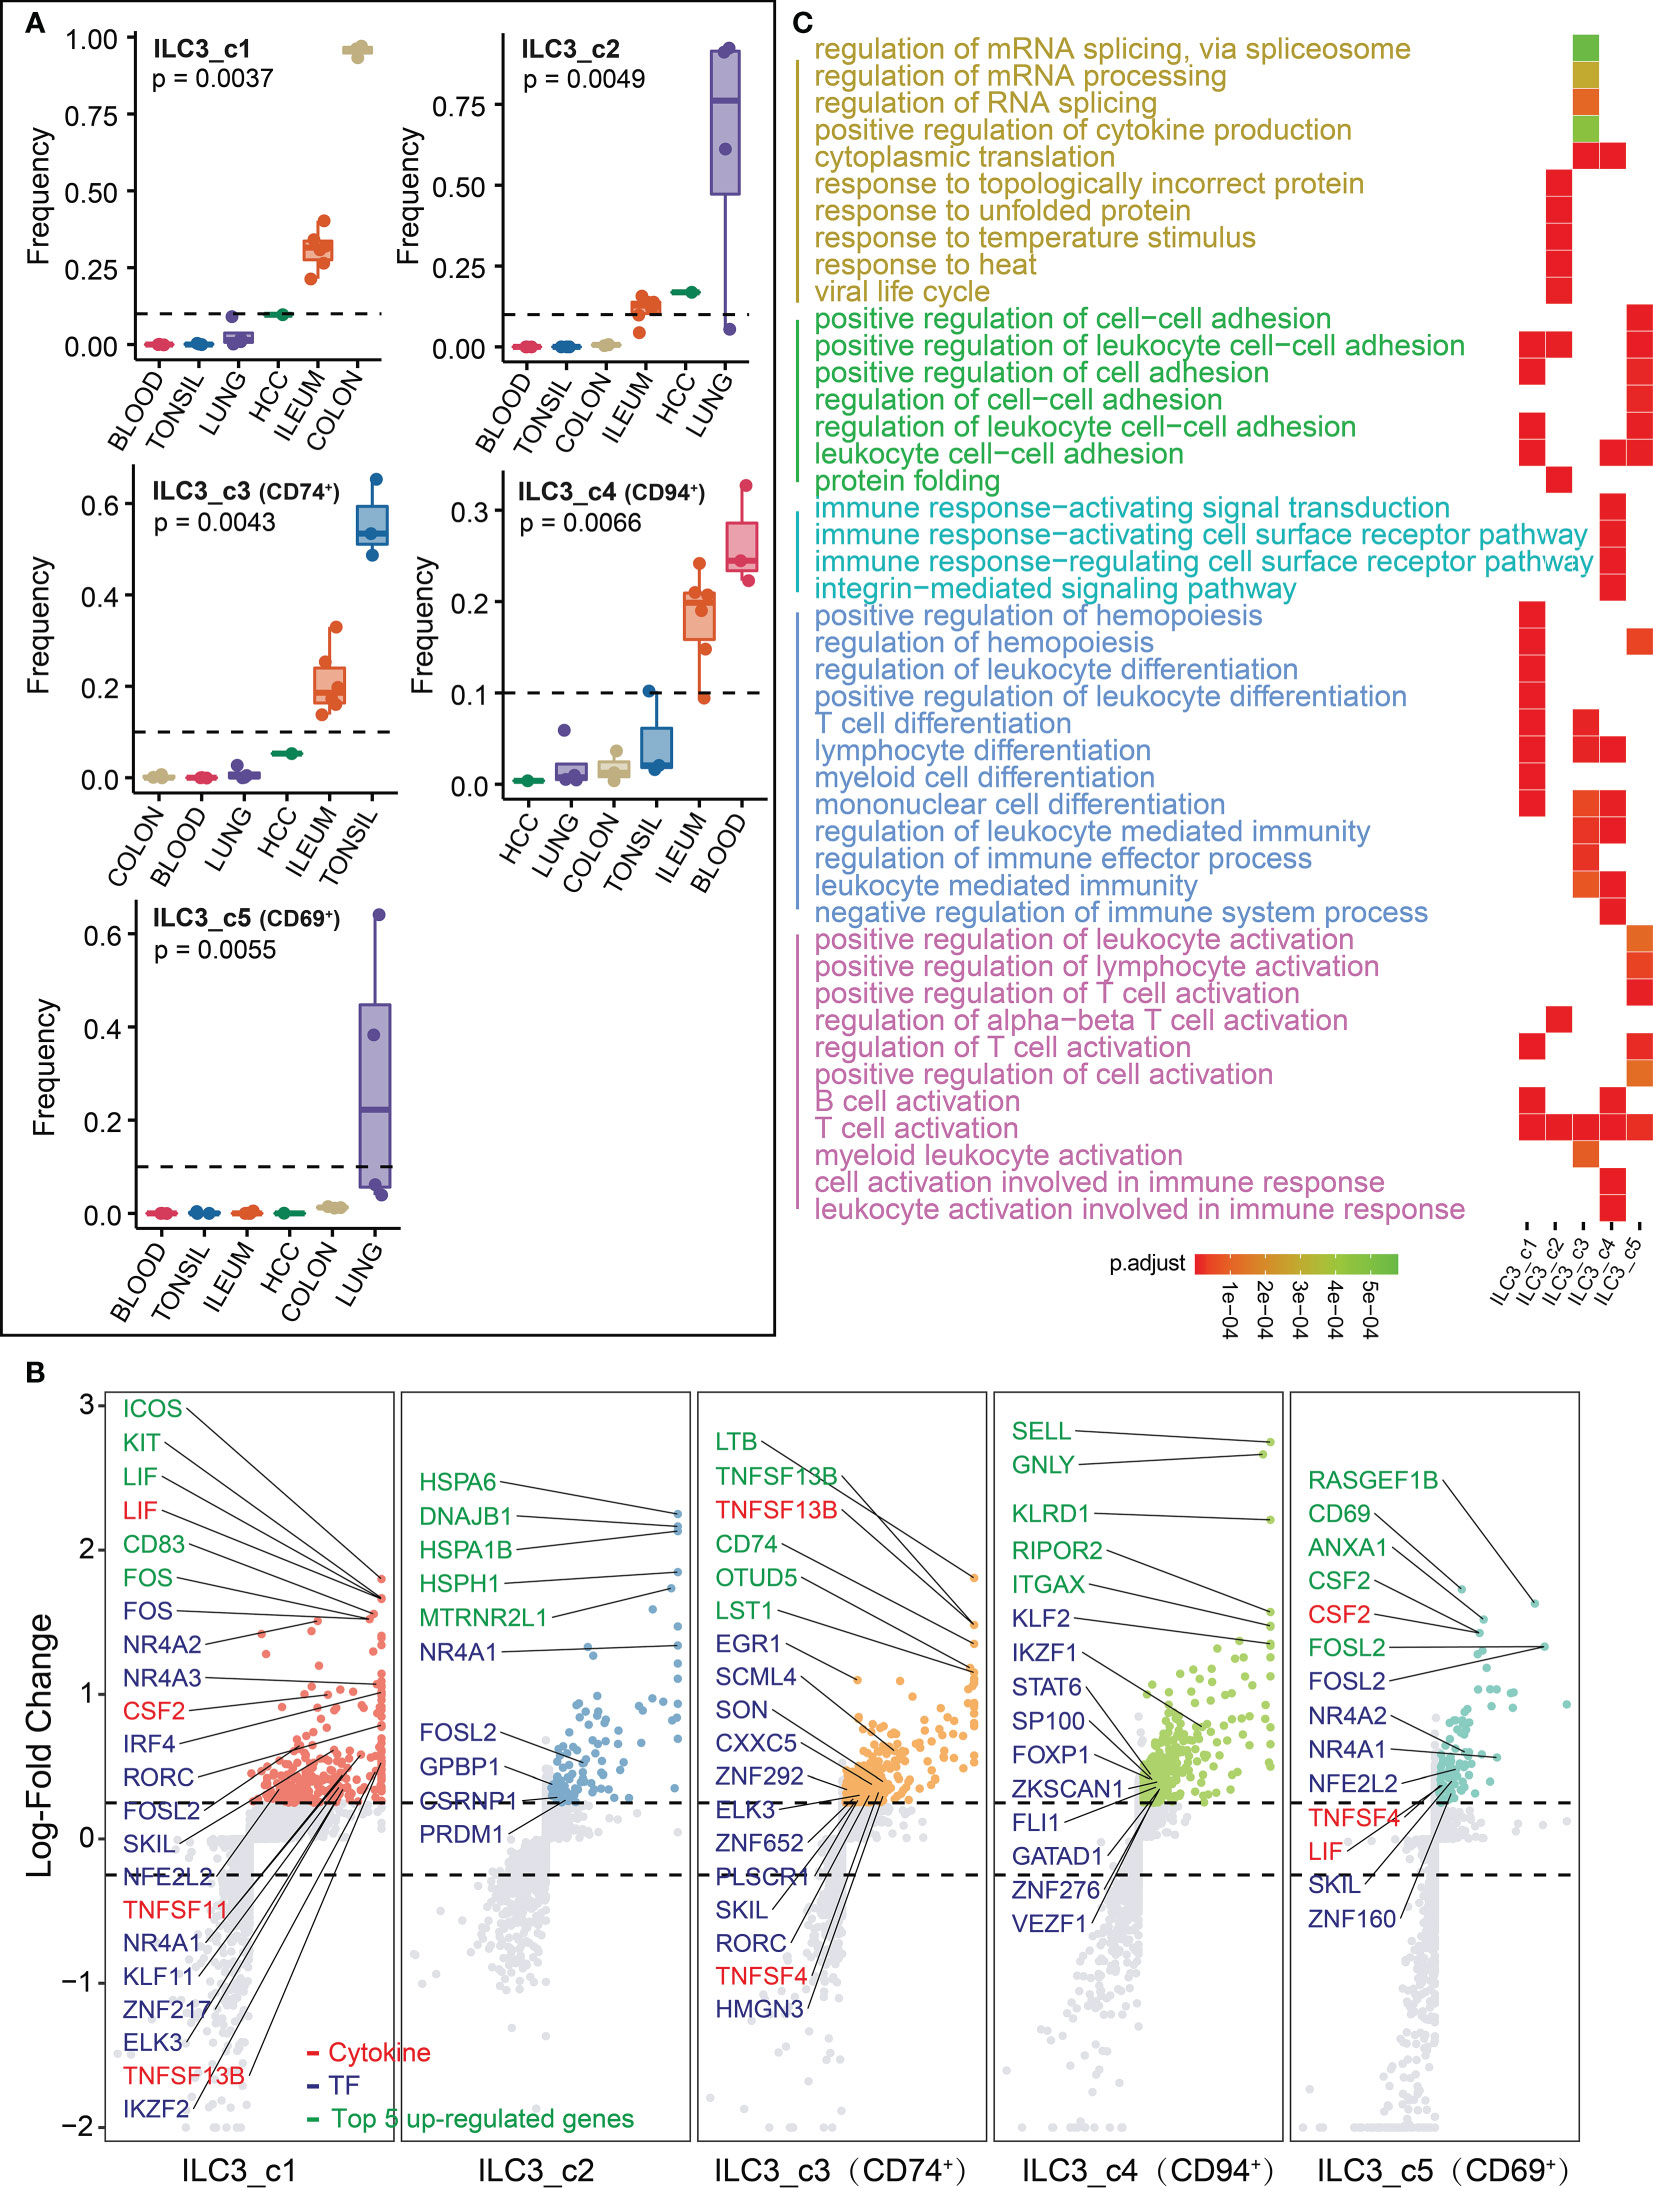
Figure 5 Characterization of ILC3s in different tissues. (A) Box plots showing the frequencies of four ILC3 subsets (divided by the total CD127+ ILC number) in lung, colon, ileum, tonsil, blood and HCC. P values were calculated from Kruskal-Wallis test. (B) Differential gene expression analysis showing up- and down-regulated transcripts across six ILC3 subsets. (C) Functional enrichment analysis showing top 15 GO terms in each ILC3 subset of biological process.
Transcriptome analysis of NK and NK_like cells
We next explored the transcriptome changes for NK and NK_like cells, and found that differentiated NK cells predominated in tonsil, ileum (NK_c1) and lung (NK_c2), and NK_like cells distributed in HCC (Figure 6A). Differential expression analysis showed that NK cell subsets shared relatively high expression of cytokines (CCL3, CCL4, CCL5, CCL4L2, FASLG and IFNG, Figure 6B; Supplementary Table 2). The NK_c1 population highly expressed EOMES that are related T-box transcription factors that control NK cell development (7). The NK_c2 and NK_like population uniquely expressed ZEB2 encoding a transcriptional regulator involved in terminal NK cell maturation (42). Biological process enrichment analysis demonstrated that the transcriptome of NK and NK_like cells was specifically enriched in cell cytotoxicity and immune response (Figure 6C; Supplementary Table 3).
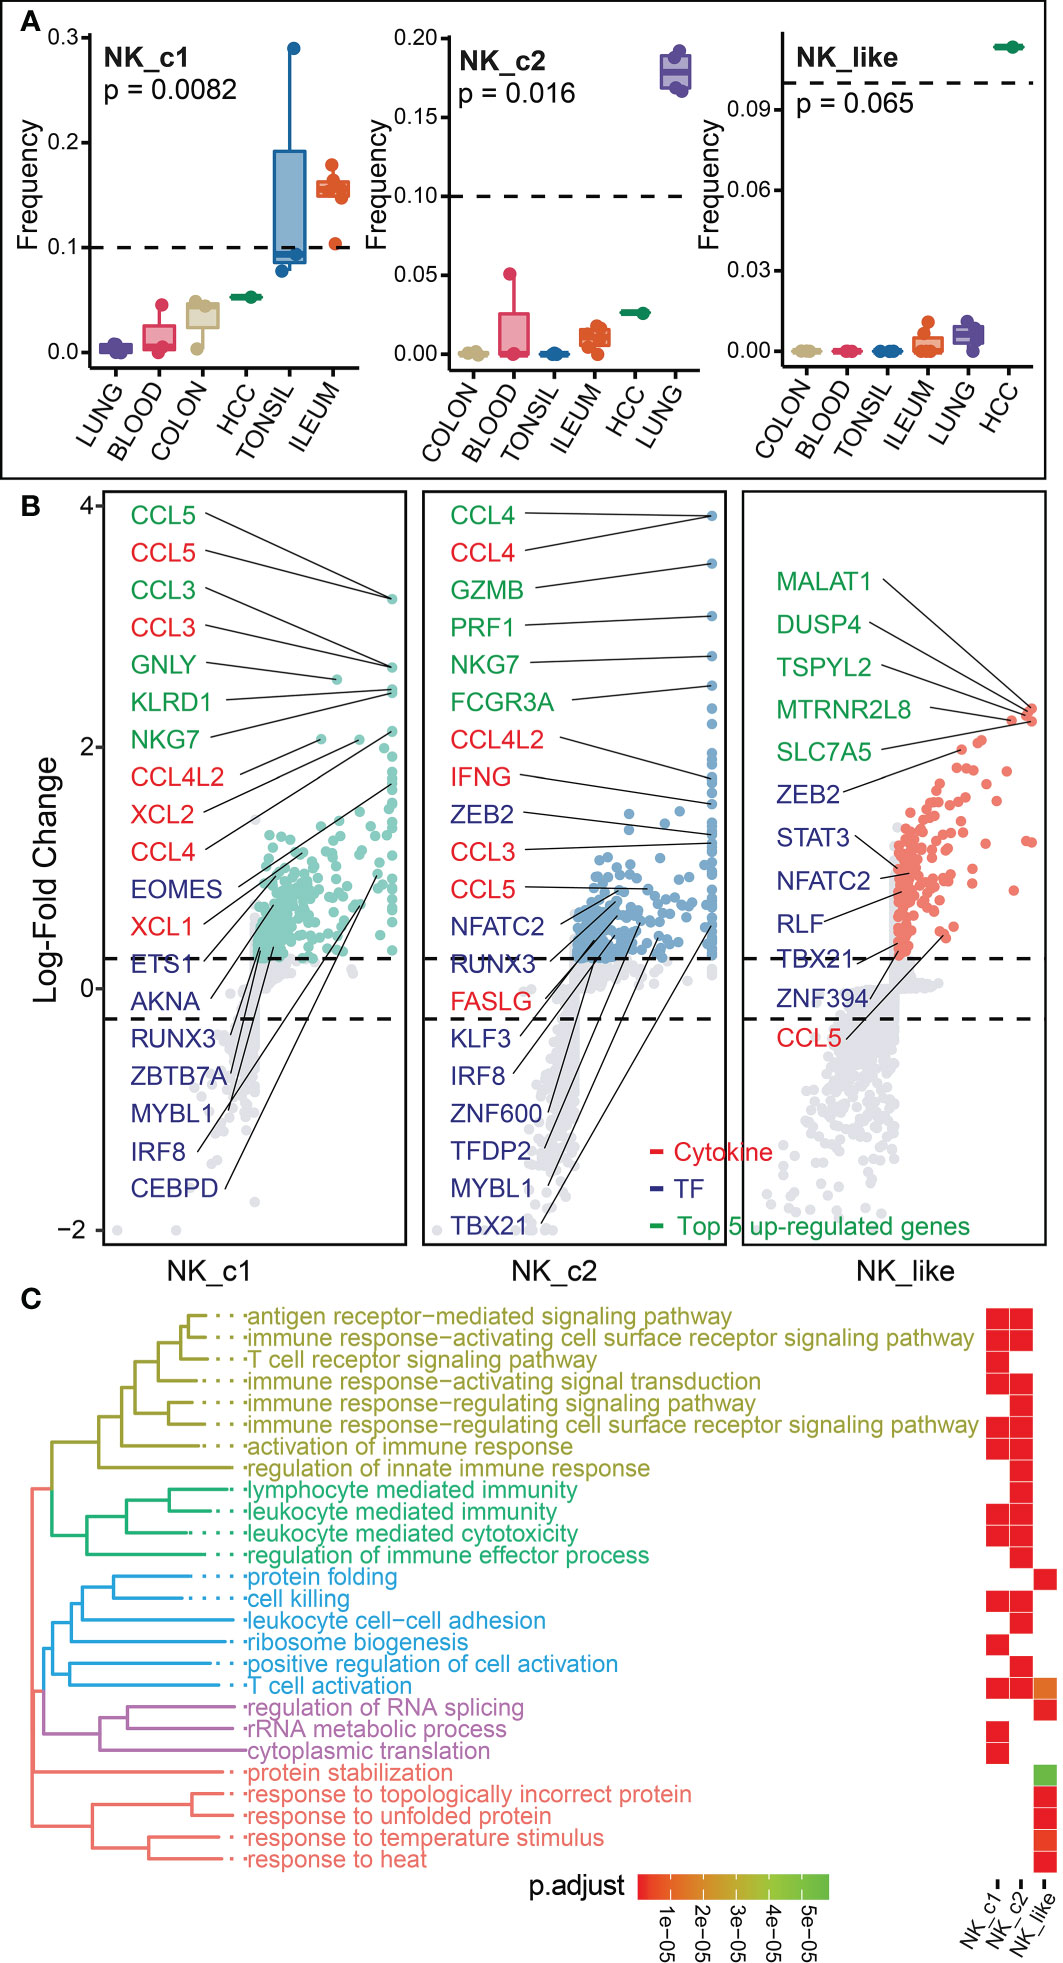
Figure 6 Characterization of NK and NK_like cells in different tissues. (A) Box plots showing the frequencies of four NK subsets (divided by the total ILC number) in lung, colon, ileum, tonsil, blood and HCC. P values were calculated from Kruskal-Wallis test. (B) Differential gene expression analysis showing up- and down-regulated transcripts across three NK subsets. (C) Functional enrichment analysis showing top 15 GO terms in each NK subset of biological process.
Characteristics and pseudotemporal analysis of ILCs
To explore the profile of ILC subsets across different tissues, we continued the analysis of pseudo-bulk samples. As shown in Figure 7, the specificity of ILC distribution was also observed in pseudobulk data (Supplementary Table 4). ILC1_c2, ILC2_c2, c-Kit+ ILC2_c1/2, ILC3_c5 and NK-like subsets were the predominant ILC populations in the corresponding tissues, since the number of related ILCs within the other tissues was less than 10. Several encoding transcription factors (KLF4, FOS, JUN and JUND) and early activation markers (CD69 and DUSP1) were unregulated in unique tissues or different disease state (43). We further used OR values to quantified tissue enrichment of ILC subsets across different tissues (Figure 8A). The compositions of ILCs from different tissues displayed prominent differences, especially to c-Kit+ ILC2 groups that appeared to be tumor-enriched. The proximity in UMAP coordinates of ILCs (excluding NK and NK_like cells) indicated that their transcriptomes might be connected continuously. Next, we searched for a potential developmental path by applying the pseudotime algorithm. As shown in Figure 8B, the trajectory evinced a pseudotemporal order of ILCs, and placed individual ILCs into different states with striking fidelity to our annotations. The root of the trajectory was mainly populated by ILC1s, and the two termini of the tree were populated mainly by ILC3_c1 and ILC3_c2. This pseudotemporal analysis further helped identify genes associated ILC1s from the root to both fates such as CD27, CD3D, CD3G, and also genes related with ILC3s that were up-regulated in cells differentiating into both fates such as IL1R1, IL23R and KIT (Figure 8C). Additionally, ILC2-associated genes LMNA (highly expressed in c-Kit+ ILC2_c1 subset), MTRNR2L12 (highly expressed in c-Kit+ ILC2_c2 subset) were mostly expressed in the intermediate state, indicating the plasticity of ILC2s (44) (Figure 8D).
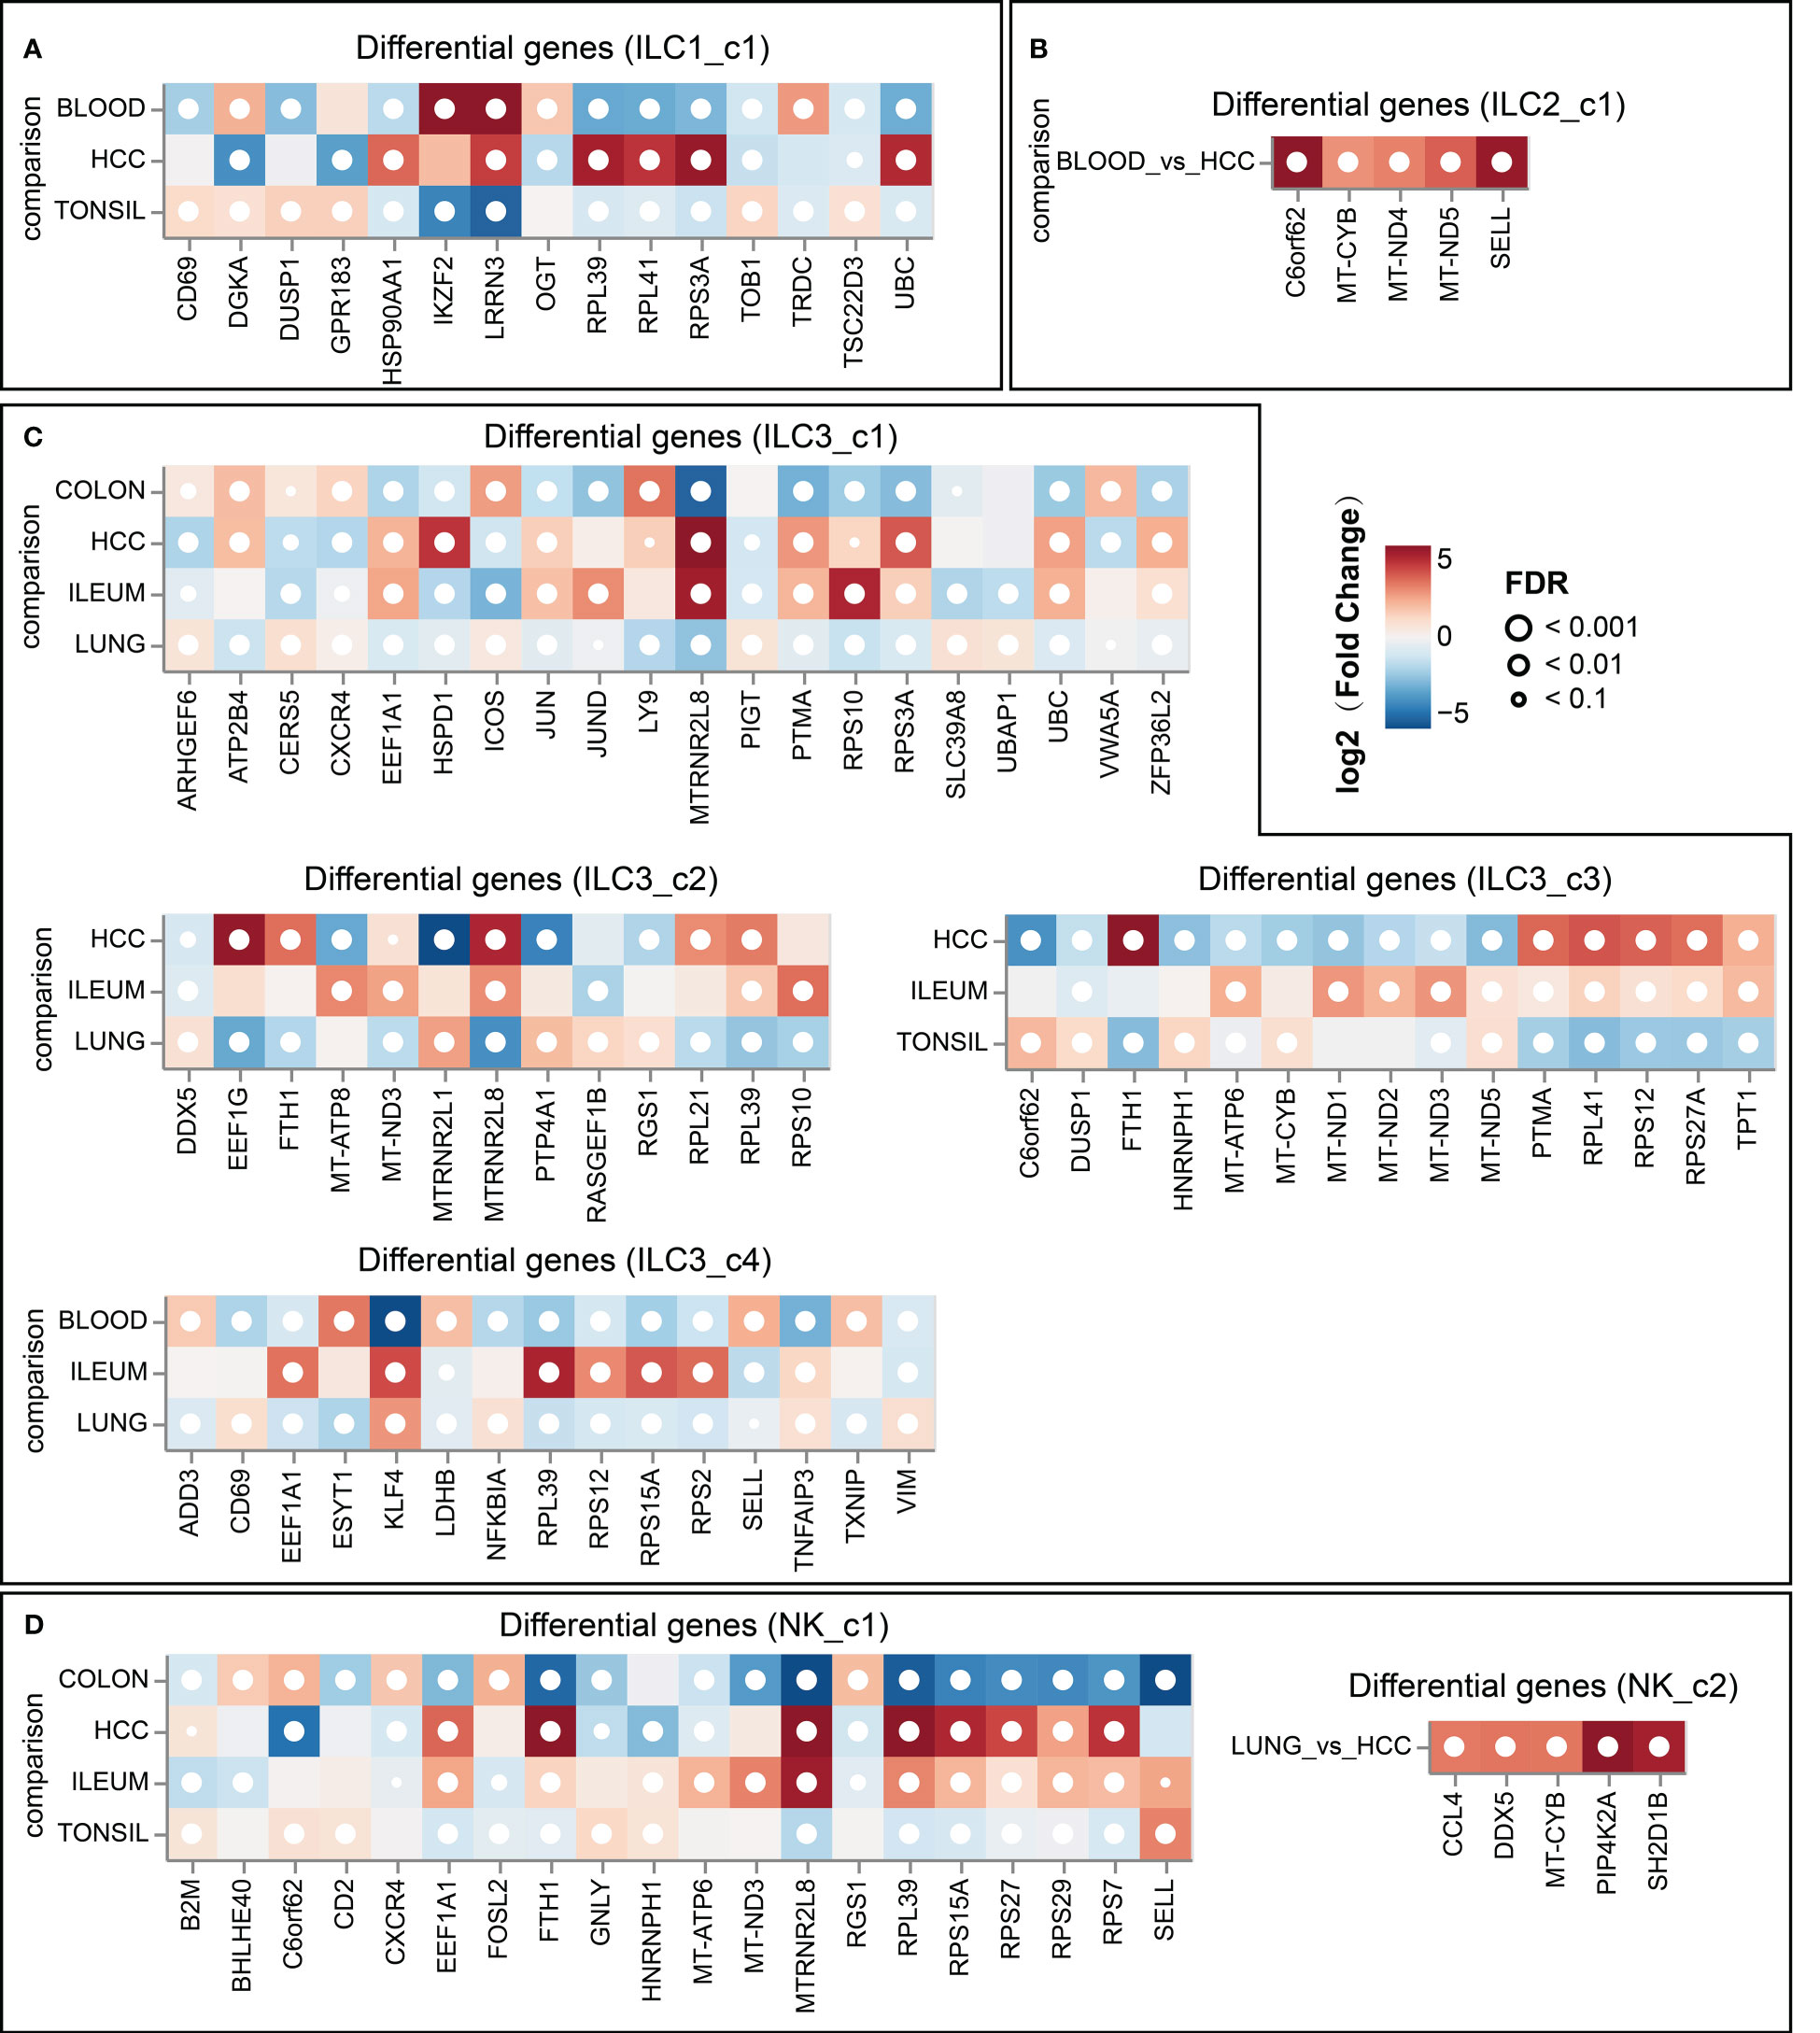
Figure 7 Top 5 differentially expressed genes in ILC subsets (A, for ILC1_c1 subset; B, for ILC2_c1 subset; C, for ILC3 subsets; D, for NK subsets) across different tissues (DESeq2 on pseudo-bulk).
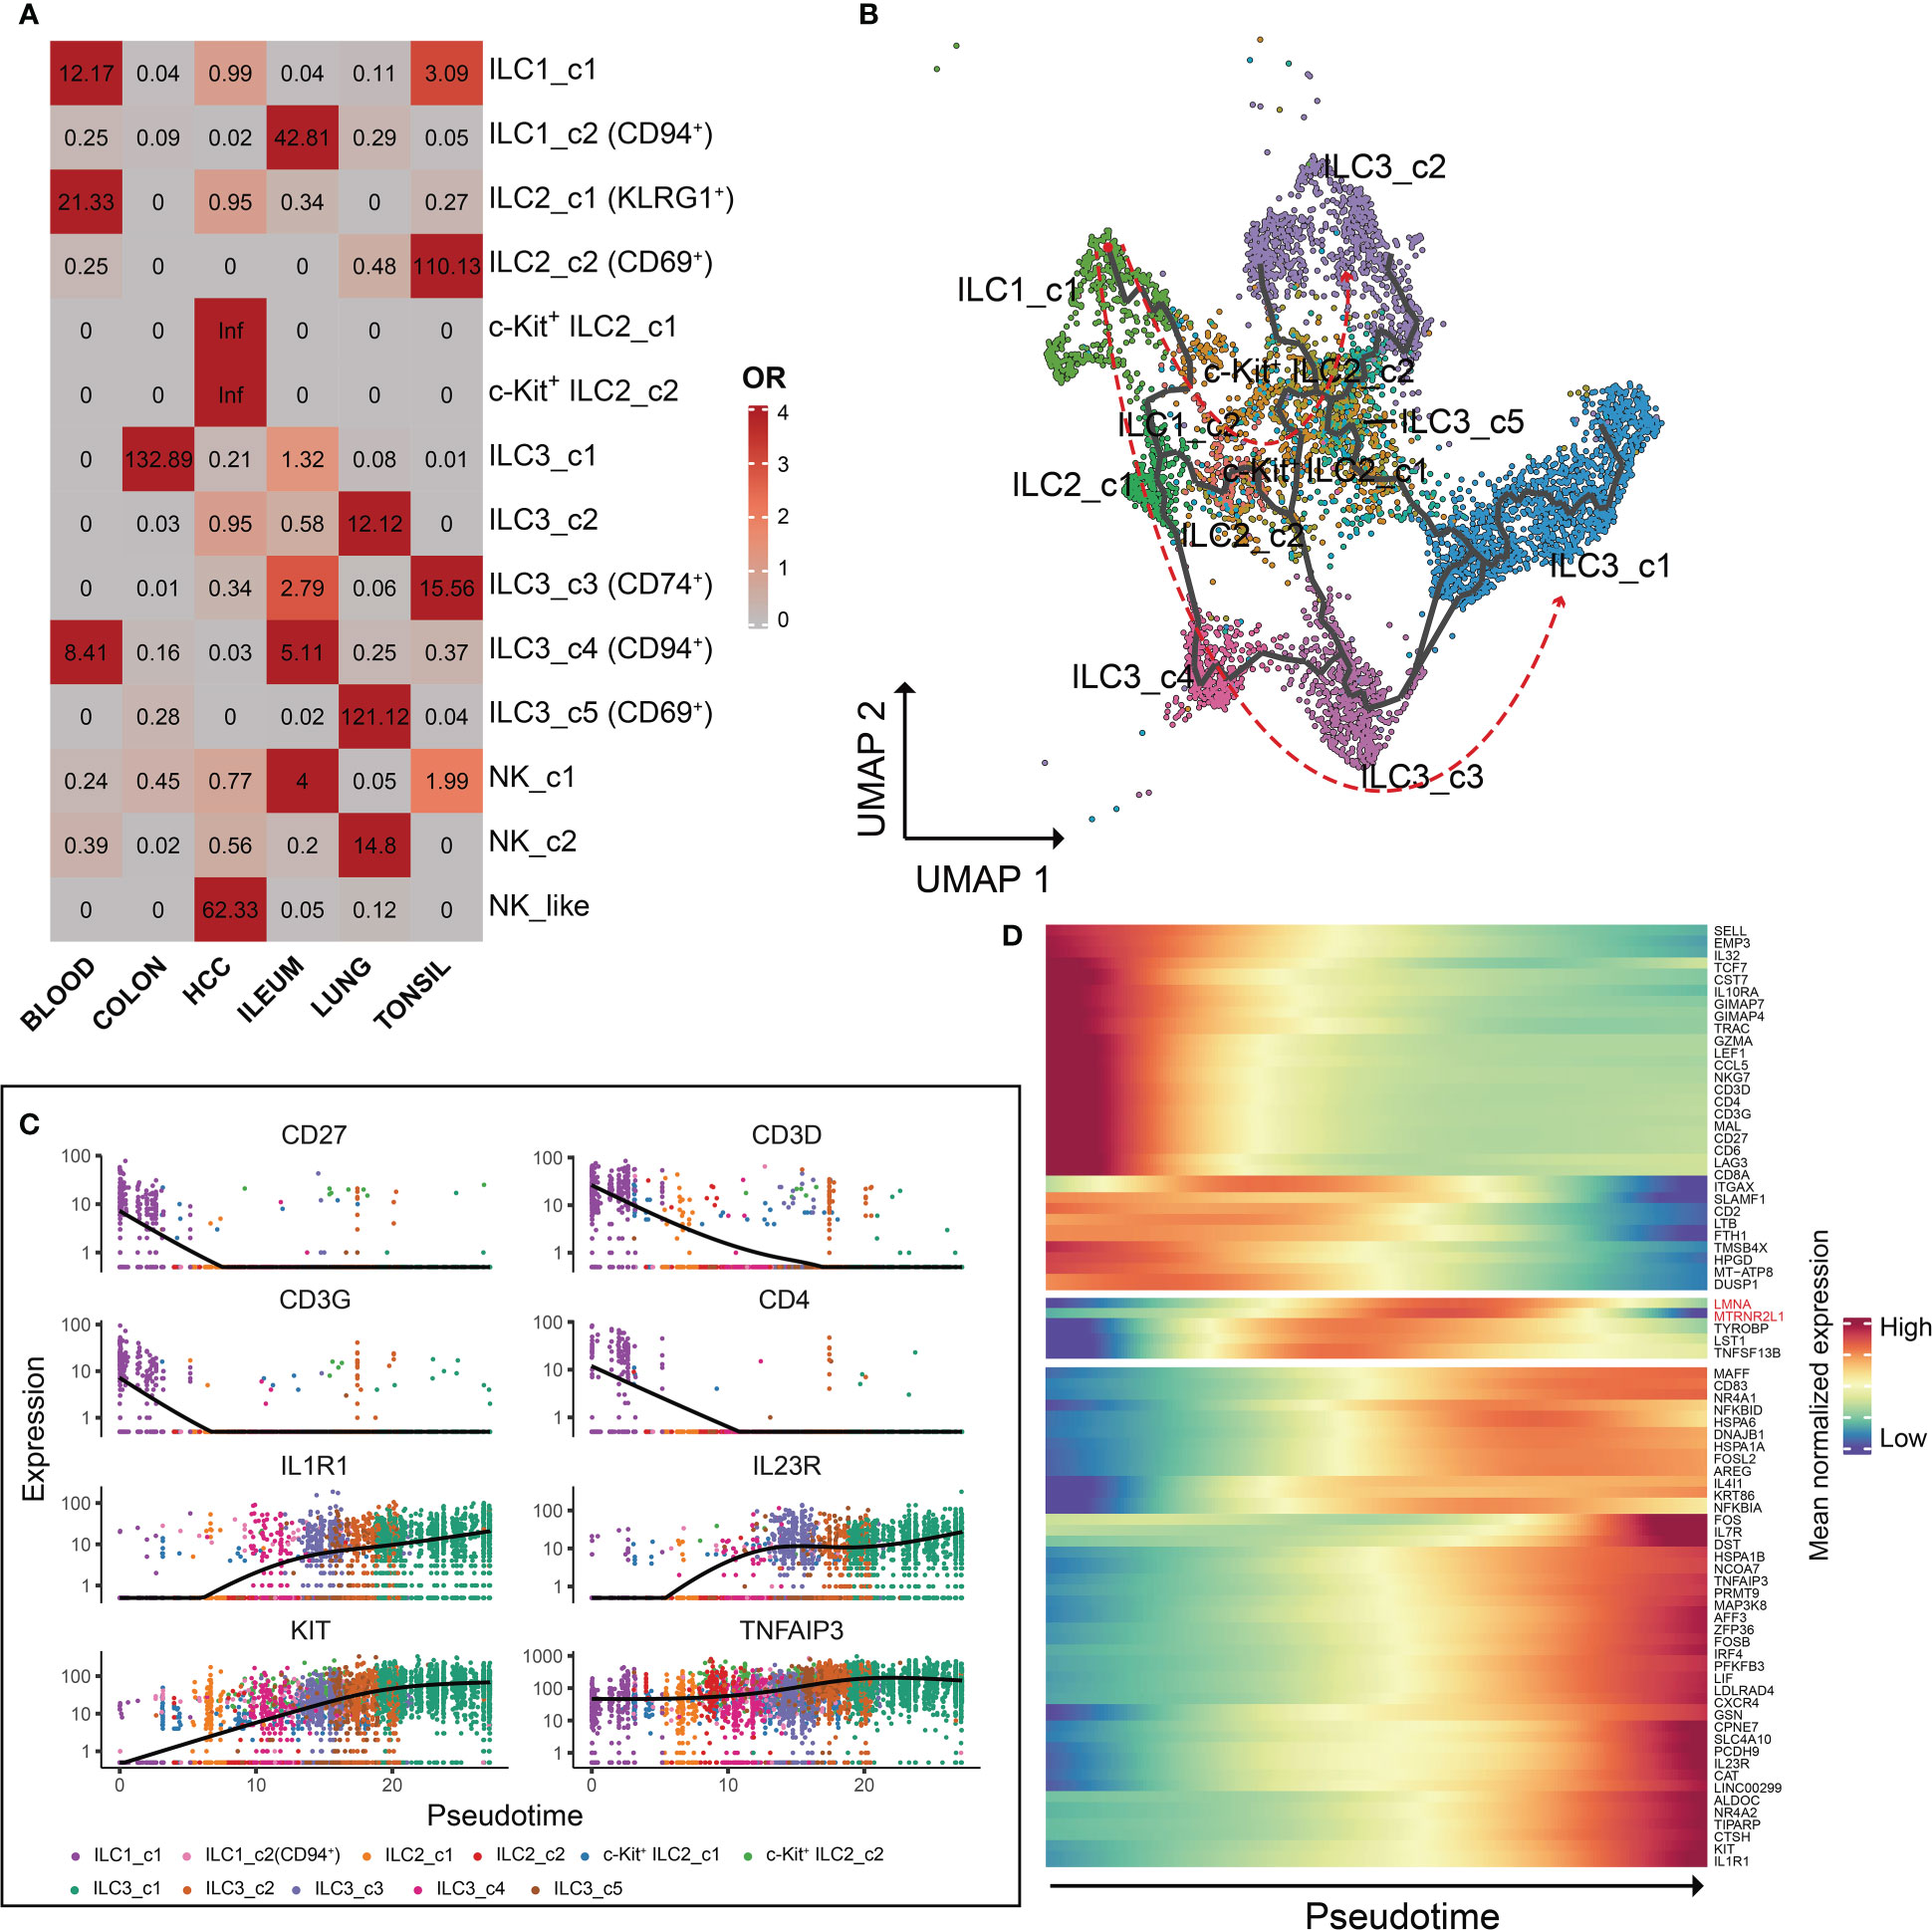
Figure 8 Characteristics and pseudotemporal gene expression analysis of the ILCs across different tissues. (A) Tissue prevalence of ILC clusters estimated by OR values. OR > 1.5 indicates that this ILC cluster is preferred to distribute in the corresponding tissue. (B) Pseudotime inference of the ILCs (excluding NK cells) trajectory with cells color-coded according to the corresponding ILC subsets identified by UMAP. (C) Monocle analysis reveals the kinetics of indicated genes (CD27, CD3D, CD3G, CD4, IL1R1, IL23R, KIT and TNFAIP3) across pseudotime. (D) Heatmap of gene expression analysis associated with ILC specification in Monocle.
Discussion
Recent studies of ILCs have focused on their subsets’ specific roles in these processes like tissue remodeling and repair, immune-mediated disease, lymphoid tissue production, intestinal and mucosal defense, and epithelial homeostasis (2, 9). We collected a large number of ILCs from human six different tissues which can represent unique immune niches (circulation, lymphoid tissue, normal and inflamed mucosa, tumor microenvironment), to systematically address the transcriptional imprinting. Through this approach, we have identified tissue-specific ILC subsets with the potential to remodel the local environment.
Two subpopulations of ILC1 cells were characterized in our study. ILC1_subset showed a strong distribution preference in blood and tonsil, and exhibited high levels of IKZF3, followed the regulation pattern of T-bet and EOMES, being predominantly expressed by ILC1 and NK cells (45). ILC1_c2 subset (CD94+) exhibited distinct phenotypic profile, tended to be enriched in inflamed ileum, and highly expressed GNLY, encoding for the cytotoxic protein granulysin that is linked to chemotaxis or fugetaxis of monocytes and bacterial lysis. While exploring the heterogeneity of NK cells, we identified two “conventional” NK subsets (CD127-CD56+CD94+), and a NK-like subset (CD127-CD56-CD94-IKZF3+) that expressed markers of cytotoxicity including IFNG and CCL5. The CD127-NK_like cell population mainly presented in the HCC microenvironment, which was in accord with the results Heinrich et al. described (12).
ILC2s concentrate at barrier surfaces, such as the skin, lung and intestine, where they are phenotypically and functionally adapted to the tissue specific environment (46). Recent discoveries have generated profound insights into ILCs biology of circulating between different organs upon activation, as they are readily detectable in healthy human peripheral blood (8, 47). Notably, the ILC2_c1 cells identified within multiple tissues were preferentially enriched in blood, resembling the reported migratory ILC2s. These ILC2s increased expression of genes involved in cell migration such as SELL, S1PR1 and CD200R1. Although distinct subsets of ILCs can be identified in blood, the precursor ILC (ILCp), which has the ability to home to peripheral tissues and differentiate into mature ILC subsets, makes up the majority of the circulating ILC population (48). For example, Winkler et al. observed that ILC2s accumulate in bronchoalveolar lavage fluid after allergen challenge in asthmatic patients, whereas circulating ILC2 numbers decrease at the same time, suggesting ILC2s are recruited from the blood into the lung during inflammation (49). Liu et al. have identified two migratory colon ILC2 subsets (IL-17A+ ILC2s and CD27+ ILC2s) with potential to migrate to the mouse lung in response to IL-25 stimulation (35). As mentioned above, SELL is also highly expressed in ILC3_c4 subset, which was preferentially enriched in blood and inflamed ileum. Krabbendam et al. revealed that co-expression of SELL and CCR7 in CD127+CD94+ granulysin-expressing ILCs are capable of traveling to the lymph node via high endothelial venules (23). Additionally, we observed two unique c-Kit+ ILC2 subsets in HCC, reflecting plasticity as induced by the tumor environment. Heinrich et al. reported that supernatant derived from HCC tissue with high IL-6 and TGF-β induced an increase in c-Kit+ ILC2s. In parallel, the frequency of NKp44- ILC3s and ILC1s was reduced (12). Bernink et al. similarly observed that TGF-β regulates the transition of c-Kit- ILC2s into IL-17 producing c-Kit+ ILC2 cells, and this switch was reliant on RORγt and the downregulation of GATA3 (50).
Analysis of human tissue samples shows that diversity spectrum of ILC3s is dependent on the local environment. ILC3s were previously further subdivided according to the expression of CD56 and especially of NKp44. Human NKp44+ ILC3s are the most prevalent cells in adult tonsil and gut, and represent an exclusive source of IL-22 (51). We also observed NCR2 (NKp44) highly expressed in ILC3_c1 and ILC3_c3 subsets that were enriched in colon and tonsil, respectively (Supplementary Figure 4). We further found these two subsets also expressed ENTPD1 (CD39), an ectoenzyme related to suppression of inflammation (Supplementary Figure 4). Strictly, CD39 was mainly restricted to NKp44+ ILC3 cells in mucosal tissues (52). ILC3_c1 subset is the predominant source of intestinal ILC-derived LIF, which belongs to IL-6 family cytokines, and restricts inflammation by blocking Th17-cell differentiation (53). ILC3s (except ILC3_c2 subset) demonstrated high levels of histocompatibility complex class II (MHCII) associated transcripts including HLA-DQB1, HLA-E, HLA-F and HLA-DRA. Goc et al. reported that a dialog between ILC3s and CD4 T cells via major MHCII is disrupted in colon cancer, resulting in destruction of immunologic homeostasis in the gut and tumor microenvironment (54). Interestingly, we also found ILC3_c4 subset abundantly expressed high levels of GNLY and KLRD1, that mediate cellular cytotoxicity. ILC3s can be harnessed for cytotoxic responses via differentiation with IL-12 and IL-15 stimulation as described previously (55, 56). In healthy gut mucosa, Qi et al. similarly found a population of ILC3/NK cells that had transcriptomic features in common with both ILC3 and NK cells (24). This population expressed NKG7, KLRD1, GNLY, XCL2 and CCL4 similar to NK cells, but differed from conventional ILC3s. However, Björklund et al. has described a subset with high SELL expressing as naive ILC3 cells in tonsil (57). CD62L+ (SELL) ILC3s didn’t respond to IL-23 plus IL-1β stimulation, and neither IL-22 nor IL-17F was detected, but produced IL-2 relatively infrequently. The biological role of this ILC3 subset remained to be addressed. Using scRNA-seq technology, clusters in the UMAP plot expressed helper ILC-related genes (IL7R and KIT), but lacked transcripts that encode for effector functions, were usually annotated as naïve ILCs (nILCs) (11, 23). In ILC-poiesis, nILCs may represent the functional equivalent of ILC precursors. In our joint analysis, we did not discover this cluster, which might be caused by the simultaneous integration across donors and technologies. Regarding the activation state, ILC3_c5 (CD69+) subset was preferentially enriched in lung and expressed high levels of CSF2 (GM-CSF), which plays an important role in antimicrobial pulmonary host defense function and is essential for surfactant homeostasis (58).
The past decade has witnessed an explosion of knowledge of innate immune cell, owing to the definition of many additional subsets. In this study, we found several ILC subsets across six tissues, that exhibited tissue-adapted phenotypes and functions. The typical ILC clusters with specific markers could be distinguished easily, whereas some cells had transcriptomic features in common, rendering their identification complicated. Therefore, we defined a population of CD127+c-Kit-/+CD94-/+ cells, and further divided it into five clusters, indicating the plasticity between ILC subsets, which can be induced by changes in the tissue microenvironment. However, we defined theses subsets based an unbiased transcriptome-wide perspective, ex vivo co-culture experiments were not performed to confirm their functions.
Overall, the main objective of this study was to characterize the heterogeneity of ILCs in human tissues under physiological and pathological conditions. Integrative inference of these single-cell transcriptomics unveiled the diversity and plasticity of ILCs, and generated a comprehensive map of human ILC composition, which provided insights into ILC-mediated tissue-specific immunity.
Data availability statement
Three single-cell RNA-seq datasets (GSE150050, GSE179795 and GSE173642) used in this study can be obtained from the GEO database (https://www.ncbi.nlm.nih.gov/geo/). The original contributions presented in the study are included in the article. Further inquiries can be directed to the corresponding authors.
Author contributions
Conception and design: PS, XS and WG. Collection and assembly of data: PS, KC, YM and XL. Data analysis and interpretation: PS, XS, KC, YM, SA, FS, QH, SL and MW. Manuscript writing: PS. Manuscript revision: KC, YM, XS and WG. All authors read and approved the final manuscript.
Funding
This work was supported by National Natural Science Foundation of China (81970500 XS, 82172645 WG, 82002082 KC), Start-up funding for the introduction of talents in Nanjing Drum Tower Hospital (RC2022-015, XS).
Conflict of interest
The authors declare that the research was conducted in the absence of any commercial or financial relationships that could be construed as a potential conflict of interest.
Publisher’s note
All claims expressed in this article are solely those of the authors and do not necessarily represent those of their affiliated organizations, or those of the publisher, the editors and the reviewers. Any product that may be evaluated in this article, or claim that may be made by its manufacturer, is not guaranteed or endorsed by the publisher.
Supplementary material
The Supplementary Material for this article can be found online at: https://www.frontiersin.org/articles/10.3389/fimmu.2023.1127413/full#supplementary-material
Supplementary Figure 1 | Single-cell RNA sequencing of HCC for GSE179795 dataset. (A) UMAP of single-cell transcriptomes color-coded by ILC clusters. (B) Dot plot displaying average and percent expression of marker genes across seven ILC clusters.
Supplementary Figure 2 | Single-cell transcriptome profiles of CD127+c-Kit-/+CD94-/+ ILC subset among different tissues. (A) Heatmap of top 3 signature genes for indicated cell types were shown. (B) Expression of KLRD1 (CD94) plotted in purple on the UMAP clustering. (C) Proportion of each indicated cell type among different tissues.
Supplementary Figure 3 | Gating strategy to identify ILCs using multi-omics single-cell sequencing data. Representative gates were generated to assign ILCs (ILC1, ILC2, ILC3 and NK+NK_like cells) based on identified specific population markers.
Supplementary Figure 4 | Single-cell transcriptome profiles of ILC3 subset among different tissues. (A): Dot plot displaying average and percent expression of representative genes across five ILC3 clusters. (B) Expression of NCR2 (NKp44) and ENTPD1 (CD39) in purple on the UMAP clustering.
References
1. Yudanin NA, Schmitz F, Flamar AL, Thome JJC, Tait Wojno E, Moeller JB, et al. Spatial and temporal mapping of human innate lymphoid cells reveals elements of tissue specificity. Immunity (2019) 50(2):505–19.e4. doi: 10.1016/j.immuni.2019.01.012
2. Jacquelot N, Seillet C, Vivier E, Belz GT. Innate lymphoid cells and cancer. Nat Immunol (2022) 23(3):371–9. doi: 10.1038/s41590-022-01127-z
3. Bando JK, Gilfillan S, Di Luccia B, Fachi JL, Sécca C, Cella M, et al. Ilc2s are the predominant source of intestinal ilc-derived il-10. J Exp Med (2020) 217(2):e20191520. doi: 10.1084/jem.20191520
4. Muraoka WT, Korchagina AA, Xia Q, Shein SA, Jing X, Lai Z, et al. Campylobacter infection promotes ifnγ-dependent intestinal pathology Via Ilc3 to Ilc1 conversion. Mucosal Immunol (2021) 14(3):703–16. doi: 10.1038/s41385-020-00353-8
5. Gao Y, Souza-Fonseca-Guimaraes F, Bald T, Ng SS, Young A, Ngiow SF, et al. Tumor immunoevasion by the conversion of effector nk cells into type 1 innate lymphoid cells. Nat Immunol (2017) 18(9):1004–15. doi: 10.1038/ni.3800
6. Gordon SM, Chaix J, Rupp LJ, Wu J, Madera S, Sun JC, et al. The transcription factors T-bet and eomes control key checkpoints of natural killer cell maturation. Immunity (2012) 36(1):55–67. doi: 10.1016/j.immuni.2011.11.016
7. Zhang J, Le Gras S, Pouxvielh K, Faure F, Fallone L, Kern N, et al. Sequential actions of eomes and T-bet promote stepwise maturation of natural killer cells. Nat Commun (2021) 12(1):5446. doi: 10.1038/s41467-021-25758-2
8. Spits H, Mjösberg J. Heterogeneity of type 2 innate lymphoid cells. Nat Rev Immunol (2022), 22(11)701–12. doi: 10.1038/s41577-022-00704-5
9. Sanos SL, Diefenbach A. Innate lymphoid cells: From border protection to the initiation of inflammatory diseases. Immunol Cell Biol (2013) 91(3):215–24. doi: 10.1038/icb.2013.3
10. Zeng B, Shi S, Ashworth G, Dong C, Liu J, Xing F. Ilc3 function as a double-edged sword in inflammatory bowel diseases. Cell Death Dis (2019) 10(4):315. doi: 10.1038/s41419-019-1540-2
11. Mazzurana L, Czarnewski P, Jonsson V, Wigge L, Ringnér M, Williams TC, et al. Tissue-specific transcriptional imprinting and heterogeneity in human innate lymphoid cells revealed by full-length single-cell rna-sequencing. Cell Res (2021) 31(5):554–68. doi: 10.1038/s41422-020-00445-x
12. Heinrich B, Gertz EM, Schäffer AA, Craig A, Ruf B, Subramanyam V, et al. The tumour microenvironment shapes innate lymphoid cells in patients with hepatocellular carcinoma. Gut (2022) 71(6):1161–75. doi: 10.1136/gutjnl-2021-325288
13. Rethacker L, Boy M, Bisio V, Roussin F, Denizeau J, Vincent-Salomon A, et al. Innate lymphoid cells: Nk and cytotoxic Ilc3 subsets infiltrate metastatic breast cancer lymph nodes. Oncoimmunology (2022) 11(1):2057396. doi: 10.1080/2162402x.2022.2057396
14. Baron CS, Barve A, Muraro MJ, van der Linden R, Dharmadhikari G, Lyubimova A, et al. Cell type purification by single-cell transcriptome-trained sorting. Cell (2019) 179(2):527–42.e19. doi: 10.1016/j.cell.2019.08.006
15. Wolock SL, Lopez R, Klein AM. Scrublet: Computational identification of cell doublets in single-cell transcriptomic data. Cell Syst (2019) 8(4):281–91.e9. doi: 10.1016/j.cels.2018.11.005
16. Yip SH, Sham PC, Wang J. Evaluation of tools for highly variable gene discovery from single-cell rna-seq data. Brief Bioinform (2019) 20(4):1583–9. doi: 10.1093/bib/bby011
17. Korsunsky I, Millard N, Fan J, Slowikowski K, Zhang F, Wei K, et al. Fast, sensitive and accurate integration of single-cell data with harmony. Nat Methods (2019) 16(12):1289–96. doi: 10.1038/s41592-019-0619-0
18. Welch JD, Kozareva V, Ferreira A, Vanderburg C, Martin C, Macosko EZ. Single-cell multi-omic integration compares and contrasts features of brain cell identity. Cell (2019) 177(7):1873–87.e17. doi: 10.1016/j.cell.2019.05.006
19. Zheng L, Qin S, Si W, Wang A, Xing B, Gao R, et al. Pan-cancer single-cell landscape of tumor-infiltrating T cells. Science (2021) 374(6574):abe6474. doi: 10.1126/science.abe6474
20. Wu T, Hu E, Xu S, Chen M, Guo P, Dai Z, et al. Clusterprofiler 4.0: A universal enrichment tool for interpreting omics data. Innovation (Camb) (2021) 2(3):100141. doi: 10.1016/j.xinn.2021.100141
21. Salcher S, Sturm G, Horvath L, Untergasser G, Kuempers C, Fotakis G, et al. High-resolution single-cell atlas reveals diversity and plasticity of tissue-resident neutrophils in non-small cell lung cancer. Cancer Cell (2022) 40(12):1503–20.e8. doi: 10.1016/j.ccell.2022.10.008
22. Squair JW, Gautier M, Kathe C, Anderson MA, James ND, Hutson TH, et al. Confronting false discoveries in single-cell differential expression. Nat Commun (2021) 12(1):5692. doi: 10.1038/s41467-021-25960-2
23. Krabbendam L, Heesters BA, Kradolfer CMA, Haverkate NJE, Becker MAJ, Buskens CJ, et al. Cd127+ Cd94+ innate lymphoid cells expressing granulysin and perforin are expanded in patients with crohn's disease. Nat Commun (2021) 12(1):5841. doi: 10.1038/s41467-021-26187-x
24. Qi J, Crinier A, Escalière B, Ye Y, Wang Z, Zhang T, et al. Single-cell transcriptomic landscape reveals tumor specific innate lymphoid cells associated with colorectal cancer progression. Cell Rep Med (2021) 2(8):100353. doi: 10.1016/j.xcrm.2021.100353
25. Agarwal SK, Novotny EA, Crabtree JS, Weitzman JB, Yaniv M, Burns AL, et al. Transcription factor jund, deprived of menin, switches from growth suppressor to growth promoter. Proc Natl Acad Sci U S A (2003) 100(19):10770–5. doi: 10.1073/pnas.1834524100
26. Höfle J, Trenkner T, Kleist N, Schwane V, Vollmers S, Barcelona B, et al. Engagement of trail triggers degranulation and ifnγ production in human natural killer cells. EMBO Rep (2022) 23(8):e54133. doi: 10.15252/embr.202154133
27. He Y, Luo J, Zhang G, Jin Y, Wang N, Lu J, et al. Single-cell profiling of human Cd127(+) innate lymphoid cells reveals diverse immune phenotypes in hepatocellular carcinoma. Hepatology (2022) 76(4):1013–29. doi: 10.1002/hep.32444
28. Golebski K, Layhadi JA, Sahiner U, Steveling-Klein EH, Lenormand MM, Li RCY, et al. Induction of il-10-Producing type 2 innate lymphoid cells by allergen immunotherapy is associated with clinical response. Immunity (2021) 54(2):291–307.e7. doi: 10.1016/j.immuni.2020.12.013
29. Shen X, Liang M, Chen X, Pasha MA, D'Souza SS, Hidde K, et al. Cutting edge: Core binding factor B is required for group 2 innate lymphoid cell activation. J Immunol (2019) 202(6):1669–73. doi: 10.4049/jimmunol.1800852
30. Mattiola I. Immune circuits to shape natural killer cells in cancer. Cancers (2021) 13(13):3225. doi: 10.3390/cancers13133225
31. Katz LH, Li Y, Chen JS, Muñoz NM, Majumdar A, Chen J, et al. Targeting tgf-B signaling in cancer. Expert Opin Ther Targets (2013) 17(7):743–60. doi: 10.1517/14728222.2013.782287
32. Nakatsuka Y, Yaku A, Handa T, Vandenbon A, Hikichi Y, Motomura Y, et al. Profibrotic function of pulmonary group 2 innate lymphoid cells is controlled by regnase-1. Eur Respir J (2021) 57(3):2000018. doi: 10.1183/13993003.00018-2020
33. Wu J, Bowe DB, Sadlonova A, Whisenhunt TR, Hu Y, Rustgi AK, et al. O-Glcnac transferase is critical for transducin-like enhancer of split (Tle)-mediated repression of canonical wnt signaling. J Biol Chem (2014) 289(17):12168–76. doi: 10.1074/jbc.M114.553859
34. Jennings E, Elliot TAE, Thawait N, Kanabar S, Yam-Puc JC, Ono M, et al. Nr4a1 and Nr4a3 reporter mice are differentially sensitive to T cell receptor signal strength and duration. Cell Rep (2020) 33(5):108328. doi: 10.1016/j.celrep.2020.108328
35. Liu H, Li L, Hao Y, Li J, Liu Z, Qi J, et al. Identification of two migratory colon Ilc2 populations differentially expressing il-17a and il-5/Il-13. Sci China Life Sci (2023) 66(1): 67–80. doi: 10.1007/s11427-022-2127-2
36. Chea S, Schmutz S, Berthault C, Perchet T, Petit M, Burlen-Defranoux O, et al. Single-cell gene expression analyses reveal heterogeneous responsiveness of fetal innate lymphoid progenitors to notch signaling. Cell Rep (2016) 14(6):1500–16. doi: 10.1016/j.celrep.2016.01.015
37. Ghaedi M, Shen ZY, Orangi M, Martinez-Gonzalez I, Wei L, Lu X, et al. Single-cell analysis of rorα tracer mouse lung reveals ilc progenitors and effector Ilc2 subsets. J Exp Med (2020) 217(3):jem.20182293. doi: 10.1084/jem.20182293
38. Rutz S, Kayagaki N, Phung QT, Eidenschenk C, Noubade R, Wang X, et al. Deubiquitinase duba is a post-translational brake on interleukin-17 production in T cells. Nature (2015) 518(7539):417–21. doi: 10.1038/nature13979
39. Nagasawa M, Heesters BA, Kradolfer CMA, Krabbendam L, Martinez-Gonzalez I, de Bruijn MJW, et al. Klrg1 and Nkp46 discriminate subpopulations of human Cd117(+)Crth2(-) ilcs biased toward Ilc2 or Ilc3. J Exp Med (2019) 216(8):1762–76. doi: 10.1084/jem.20190490
40. Mortha A, Chudnovskiy A, Hashimoto D, Bogunovic M, Spencer SP, Belkaid Y, et al. Microbiota-dependent crosstalk between macrophages and Ilc3 promotes intestinal homeostasis. Science (2014) 343(6178):1249288. doi: 10.1126/science.1249288
41. Deng T, Suo C, Chang J, Yang R, Li J, Cai T, et al. Ilc3-derived Ox40l is essential for homeostasis of intestinal tregs in immunodeficient mice. Cell Mol Immunol (2020) 17(2):163–77. doi: 10.1038/s41423-019-0200-x
42. Crinier A, Dumas PY, Escalière B, Piperoglou C, Gil L, Villacreces A, et al. Single-cell profiling reveals the trajectories of natural killer cell differentiation in bone marrow and a stress signature induced by acute myeloid leukemia. Cell Mol Immunol (2021) 18(5):1290–304. doi: 10.1038/s41423-020-00574-8
43. Smith SL, Kennedy PR, Stacey KB, Worboys JD, Yarwood A, Seo S, et al. Diversity of peripheral blood human nk cells identified by single-cell rna sequencing. Blood Adv (2020) 4(7):1388–406. doi: 10.1182/bloodadvances.2019000699
44. Lim AI, Menegatti S, Bustamante J, Le Bourhis L, Allez M, Rogge L, et al. Il-12 drives functional plasticity of human group 2 innate lymphoid cells. J Exp Med (2016) 213(4):569–83. doi: 10.1084/jem.20151750
45. Mazzurana L, Forkel M, Rao A, Van Acker A, Kokkinou E, Ichiya T, et al. Suppression of aiolos and ikaros expression by lenalidomide reduces human Ilc3-Ilc1/Nk cell transdifferentiation. Eur J Immunol (2019) 49(9):1344–55. doi: 10.1002/eji.201848075
46. Ricardo-Gonzalez RR, Van Dyken SJ, Schneider C, Lee J, Nussbaum JC, Liang HE, et al. Tissue signals imprint Ilc2 identity with anticipatory function. Nat Immunol (2018) 19(10):1093–9. doi: 10.1038/s41590-018-0201-4
47. Mathä L, Takei F, Martinez-Gonzalez I. Tissue resident and migratory group 2 innate lymphoid cells. Front Immunol (2022) 13:877005. doi: 10.3389/fimmu.2022.877005
48. Lim AI, Li Y, Lopez-Lastra S, Stadhouders R, Paul F, Casrouge A, et al. Systemic human ilc precursors provide a substrate for tissue ilc differentiation. Cell (2017) 168(6):1086–100.e10. doi: 10.1016/j.cell.2017.02.021
49. Winkler C, Hochdörfer T, Israelsson E, Hasselberg A, Cavallin A, Thörn K, et al. Activation of group 2 innate lymphoid cells after allergen challenge in asthmatic patients. J Allergy Clin Immunol (2019) 144(1):61–9.e7. doi: 10.1016/j.jaci.2019.01.027
50. Bernink JH, Ohne Y, Teunissen MBM, Wang J, Wu J, Krabbendam L, et al. C-Kit-Positive Ilc2s exhibit an Ilc3-like signature that may contribute to il-17-Mediated pathologies. Nat Immunol (2019) 20(8):992–1003. doi: 10.1038/s41590-019-0423-0
51. Montaldo E, Juelke K, Romagnani C. Group 3 innate lymphoid cells (Ilc3s): Origin, differentiation, and plasticity in humans and mice. Eur J Immunol (2015) 45(8):2171–82. doi: 10.1002/eji.201545598
52. Simoni Y, Fehlings M, Kløverpris HN, McGovern N, Koo SL, Loh CY, et al. Human innate lymphoid cell subsets possess tissue-type based heterogeneity in phenotype and frequency. Immunity (2018) 48(5):1060. doi: 10.1016/j.immuni.2018.04.028
53. Zhang YS, Xin DE, Wang Z, Song X, Sun Y, Zou QC, et al. Stat4 activation by leukemia inhibitory factor confers a therapeutic effect on intestinal inflammation. EMBO J (2019) 38(6):e99595. doi: 10.15252/embj.201899595
54. Goc J, Lv M, Bessman NJ, Flamar AL, Sahota S, Suzuki H, et al. Dysregulation of Ilc3s unleashes progression and immunotherapy resistance in colon cancer. Cell (2021) 184(19):5015–30.e16. doi: 10.1016/j.cell.2021.07.029
55. Krabbendam L, Heesters BA, Kradolfer CMA, Spits H, Bernink JH. Identification of human cytotoxic Ilc3s. Eur J Immunol (2021) 51(4):811–23. doi: 10.1002/eji.202048696
56. Raykova A, Carrega P, Lehmann FM, Ivanek R, Landtwing V, Quast I, et al. Interleukins 12 and 15 induce cytotoxicity and early nk-cell differentiation in type 3 innate lymphoid cells. Blood Adv (2017) 1(27):2679–91. doi: 10.1182/bloodadvances.2017008839
57. Björklund ÅK, Forkel M, Picelli S, Konya V, Theorell J, Friberg D, et al. The heterogeneity of human Cd127(+) innate lymphoid cells revealed by single-cell rna sequencing. Nat Immunol (2016) 17(4):451–60. doi: 10.1038/ni.3368
Keywords: innate lymphoid cells, single-cell transcriptomics, tissue imprinting, cell heterogeneity, integrative inference
Citation: Song P, Cao K, Mao Y, Ai S, Sun F, Hu Q, Liu S, Wang M, Lu X, Guan W and Shen X (2023) Tissue specific imprinting on innate lymphoid cells during homeostasis and disease process revealed by integrative inference of single-cell transcriptomics. Front. Immunol. 14:1127413. doi: 10.3389/fimmu.2023.1127413
Received: 19 December 2022; Accepted: 20 February 2023;
Published: 07 March 2023.
Edited by:
Carmelo Luci, Institut National de la Santé et de la Recherche Médicale (INSERM), FranceReviewed by:
Christoph Siegfried Niki Klose, Charité Universitätsmedizin Berlin, GermanyLisa Anna Mielke, Olivia Newton-John Cancer Research Institute, Australia
Copyright © 2023 Song, Cao, Mao, Ai, Sun, Hu, Liu, Wang, Lu, Guan and Shen. This is an open-access article distributed under the terms of the Creative Commons Attribution License (CC BY). The use, distribution or reproduction in other forums is permitted, provided the original author(s) and the copyright owner(s) are credited and that the original publication in this journal is cited, in accordance with accepted academic practice. No use, distribution or reproduction is permitted which does not comply with these terms.
*Correspondence: Xiaofei Shen, dg1535058@smail.nju.edu.cn; Wenxian Guan, wenxian_guan@126.com; Xiaofeng Lu, lxf_doctor@sina.com
†These authors have contributed equally to this work
 Peng Song