 Ting Lei
 Hu Qian2
 Yihe Hu
- 1Department of Orthopedic Surgery, Hunan Engineering Research Center of Biomedical Metal and Ceramic Implants, National Clinical Research Center of Geriatric Disorder, Xiangya Hospital, Central South University, Changsha, China
- 2Department of Orthopedic Surgery, Affiliated Hospital of Zunyi Medical University, Zunyi, China
- 3Department of Orthopedic Surgery, The First Affiliated Hospital, College of Medicine, Zhejiang University, Hangzhou, China
Introduction: Rheumatoid arthritis (RA) is an autoimmune disease and closely associated with both genetic and environmental factors. Volatile organic chemicals (VOC), a common environment pollutant, was associated with some autoimmune diseases, while whether VOC exposure or which VOC leads to RA is yet clarified.
Methods: A cross-sectional study using data from the 6 survey cycles (2005-2006, 2011-2012, 2013-2014, 2015-2016, 2017-2018, 2017-2020) of NHANES program was performed. The RA or non-arthritis status of participant was identified through a questionnaire survey. The quantile logistic regression method was used for correlation analysis between VOC metabolites (VOCs) in urine and RA. The covariates included age, gender, race, educational level, marital status, total energy intake, physical activity, smoking, hypertension, diabetes, urine creatinine, albumin and marihuana use.
Results: A total of 9536 participants (aged 20 to 85) with 15 VOCs, comprising 618 RA and 8918 non-arthritis participants, was finally included for analysis. Participants in the RA group showed higher VOCs in urine than that in the non-arthritis group. A positive association between 2 VOCs (AMCC: Q4: OR=2.173, 95%CI: 1.021, 4.627. 3HPMA: Q2: OR=2.286, 95%CI: 1.207 - 4.330; Q4: OR=2.663, 95%CI: 1.288 -5.508.) and RA was detected in the model 3, which was independent of all the covariates. The relative parent compounds of the two VOCs included N,N-Dimethylformamide and acrolein.
Discussion: These findings suggested that the VOC exposure significantly associated with RA, providing newly epidemiological evidence for the establishment that environmental pollutants associated with RA. And also, more prospective studies and related experimental studies are needed to further validate the conclusions of this study.
Introduction
Rheumatoid arthritis (RA), as one of the most prevalent chronic inflammatory diseases, is characterized with systemic autoimmune disorders and inflammatory synovitis, affecting 0.5–1.0% of the population over the world (1–3). Despite the ambiguity of the exact cause, accumulating evidence have been provided that the incidence and development of RA is a multifactorial interaction and closely associated with both genetic and environmental factors (4). According to previous studies, the genetic influences accounted for 50–60% of the risk for developing RA, while the remainder may be explained by environmental effect (4, 5). The association between environmental pollutants and RA is well established, such as smoking, while growing evidence suggests other environmental pollutants (6–8). For example, the exposure to pesticides, insecticide and traffic pollution was reported to be associated with RA (9–12). And also, the exposure to dust appeared to be a risk factor for RA (13).
The effect of environment pollutants on the risk of RA seems to have been answered in the affirmative, and even some studies have begun to explore the underlying molecular mechanism (6). Nevertheless, there were little specific pollutants strongly demonstrated to be associated with the risk of RA by epidemiological studies. For example, the exposure to polycyclic aromatic hydrocarbon (PAH) was found to be significantly associated with the occurrence of RA (14). And several Per-/polyfluoroalkyl substances (PFASs) were found to be significantly associated with the change of specific immune marker levels, suggesting that the exposure may lead to the increase of RA risk (15). These studies directly investigating the relationship between specific environmental pollutants and risk for RA provided us with more powerful evidence, which would help us implement more precise environmental protection and more effective prevention from RA. Therefore, it was imperative to identify specific pollutants leading to RA.
Volatile organic compounds (VOC) are common organic pollutants in the air, which could be produced by both human industry activity and natural sources (16). Compared with other pollutants exposed to people in specific environments, the widespread presence of VOC in the air results in easier and more common exposure to the general population, of which the exposure approach mainly comprises pulmonary inhalation, digestive absorption and cutaneous infiltration (17). The exposure to VOC has been found to be potentially associated with the risk of several autoimmune disorders through the abnormal activation or overactivation of immune cells (18, 19). These autoimmune diseases included pulmonary disease, atherosclerosis, and rheumatoid arthritis. Similarly, there were very little studies providing strong evidence that the risk of RA is actually associated with some specific pollutants, such as certain VOC.
Herein, we carried out this cross-sectional study aimed to investigate the association between RA and the exposure to specific volatile organic compounds metabolites (VOCs) in urine, which could specifically reflect the degree of exposure to a particular VOC parent. To our best knowledge, this is the first study to systematically investigate whether the exposure to specific VOC is associated with RA, which would provide new epidemiological evidence about the association of VOC exposure and RA, and help us develop more precise prevention and control measures against RA.
Data and methods
Data source
In this study, all the data was obtained from the National Health and Nutrition Examination Survey (NHANES) program (https://www.cdc.gov/nchs/nhanes). Performed very two years, the NHANES program is a series of population-based surveys designed to investigate the nutrition and health status of children, as well as adults in the USA. The participants included in this program was sampled using the multistage stratified sampling method combined with oversampling for certain subgroups, such as people older than 60 and people of other races in the USA. Various data including demographic data, examination data, laboratory data and questionnaire data were obtained from the participants. The investigation protocol of NHANES program was reviewed and approved by the National Center for Health Statistics (NCHS), a division of Centers for Disease Control and Prevention (CDC). Before inclusion, all the participants received an informed consent form setting out details of this program, and would sign their consent form. In this study, we used the data of the volatile organic compounds metabolites in urine to reflect the exposure to volatile organic compounds. A total of 6 survey cycles of the NHANES program (2005-2006, 2011-2012, 2013-2014, 2015-2016, 2017-2018, 2017-2020) was used and combined for association analysis between VOC exposure and RA.
Measure of urine VOCs
The quantitative detection of VOCs in human urine was performed using ultra performance liquid chromatography coupled with electrospray tandem mass spectrometry (UPLC-ESI/MSMS) as described in previous studies (20). The Acquity UPLC® HSS T3 (Part no. 186003540, 1.8 µm x 2.1 mm x 150 mm, Waters Inc.) column, with 15 mM ammonium acetate and acetonitrile as the mobile phases, was applied for chromatographic separation. In brief, the eluent from the column is firstly ionized using an electrospray interface to generate and transmit negative ions into the mass spectrometer. Then the comparison of relative response factors (ratio of native analyte to stable isotope labeled internal standard) with known standard concentrations yields individual analyte concentrations (https://wwwn.cdc.gov/nchs/data/nhanes/2015-2016/labmethods/UVOC_UVOCS_I_MET.pdf). More details of the laboratory method detecting urine VOCs could be found in the website (https://wwwn.cdc.gov/nchs/data/nhanes/2015-2016/labmethods/UVOC_UVOCS_I_MET.pdf).
Assessment of RA condition
The RA or non-arthritis status of participant was identified through a questionnaire survey. In brief, participants will firstly be asked ‘Did a doctor or other healthcare professional ever tell you that you have arthritis?’. If the answer was “yes,” a follow-up question “What type of arthritis was it?” would be asked. According to the answers of the 2 questions, participants were grouped into the RA or non-RA subgroups. If the participant reported “no” for the first question, the participant was grouped into the non-arthritis group. If the participant reported “yes” for the first question and “RA” for the second question, the participant was grouped into the RA group.
Assessment of covariates
The demographic data (age, gender, race, educational level, marital status), body mass index (BMI), dietary information (total energy intake), life behavior characteristics (moderate work activity, smoking status), concurrent disease (diabetes, hypertension), kidney function (urine creatinine, albumin) and marijuana use of participants were collected and set as the covariates for statistical analysis. All the participants included in this study were over 20 years old. The race information included 5 groups (Mexican American, other Hispanic, non-Hispanic White, non-Hispanic Black and other race). The education level was divided into 6 subgroups (less than 9th grade, 9-11th grade, high school graduate, some college or aa degree, college graduate or above, refused, don’t know), and the marital status was separated into 7 states (married, widowed, divorced, separated, never married, living with partner, refused). The BMI information of each participant was obtained from the examination data, which was calculated by dividing weight by the square of height (kg/m2). Then the participants could be further separated into 3 subgroups, including normal weight (BMI < 25), overweight (25≤BMI < 30), and obesity (BMI≥30) (21). The information of total energy intake could be obtained from the first 24-h recall questionnaire. The activity status of participants was identified into 2 status (yes or no) depending on whether they performed moderate activity work. The smoking status of participants were divided into non-users (smoking less than 100 cigarettes), past smoking (smoking more than 100 cigarettes, but no smoking now) and current smoking (smoking more than 100 cigarettes, now smoking) by smoking questionnaire. The relative information of smoking status could be found in the questionnaire data. The hypertension diagnosis was established when a systolic blood pressure > 140 mmHg, or a diastolic blood pressure > 90 mmHg was detected. The diabetes diagnosis was identified by the questionnaire data, or the detection of a fasting plasma glucose ≥ 7.0 mmol/L, or the use of antidiabetic drugs. The information of urine creatinine and albumin was acquired from the Laboratory test data of the NHANES program. The marijuana use information was acquired from the questionnaire data of NHANES program (22). According to the questionnaire data, the status of marijuana use was grouped into two types (ever or non-users).
Statistical analysis
The correlation analysis between exposure to VOCs in urine and RA was performed in this cross-sectional study. Firstly, all the included participants were grouped into RA or non-arthritis subgroups according to their arthritis evaluation. Then the comparation analysis of baseline data between RA and non-arthritis subgroups was carried out by using the Chi-square test for categorical data and Kruskal-Wallis test for quantitative data respectively. Meanwhile, the concentration of various urine VOCs between RA and non-arthritis subgroups was compared by the Kruskal-Wallis test. And also, the concentration of various urine VOCs in the RA population with different smoking status was compared by the Kruskal-Wallis test. Next, 3 quantile logistic regression models with different covariates were constructed to analyze the association between the urine VOCs and RA. In the quantile logistic regression analysis, the concentration of all VOCs is divided into 4 concentration intervals according to the concentration from low to high, and the number of people in each concentration interval is roughly equal. The non-adjust model was firstly constructed to directly analyze the association between urine VOCs and RA, and the other 2 model were subsequently applied for further analysis. The model 1 was adjusted by age, gender, race, educational level, marital status, urinary creatinine and albumin. The model 2 was adjusted by age, gender, race, educational level, marital status, total energy intake, physical activity, smoking, hypertension, diabetes, urinary creatinine and albumin. The model 3 was adjusted by age, gender, race, educational level, marital status, total energy intake, physical activity, smoking, hypertension, diabetes, urinary creatinine, urinary albumin and marijuana use. In addition, the non-linear relationship between RA and 15 VOCs was analyzed using the smooth curve fitting method. Subgroup analysis was performed to analyze the association between VOCs and RA in population identified with both non-users smoking and non-users marijuana status. Due to the combination of multiple survey cycles, the baseline data and VOCs comparation results between RA and non-arthritis groups were adjusted by sampling weight. The sensitivity analysis was performed through restricting the association analysis in population without smoking and marijuana use history. In addition, multiple covariates were included in this study for quantile regression analysis. A p < 0.05 was identified as statistically significant in all the statistical analysis. The R software (https://www.r-project.org/), with the help of EmpowerStats (https://www.empowerstats.com), were used together for statistical analysis.
Results
Screening of eligible participants
As shown in Figure 1, there were 21518 participants preliminarily included with 26 urine VOCs information. After removing participants without complete information of 15 eligible VOCs, 17524 participants were left. And a total of 9536 participants with complete RA evaluation and covariates information was finally included for analysis using the non-adjusted model and model 1, comprising 618 RA participants and 8918 non-arthritis participants. The model 1 was adjusted with age, gender, race, educational level and marital status. A total of 8505 participants were finally included for analysis using the model 2, which was adjusted by age, gender, race, educational level, marital status, total energy intake, physical activity, smoking, hypertension and diabetes. And 4803 participants were finally included for analysis using the model 3, which was adjusted by age, gender, race, educational level, marital status, total energy intake, physical activity, smoking, hypertension, diabetes, urine creatinine, albumin and marihuana use.
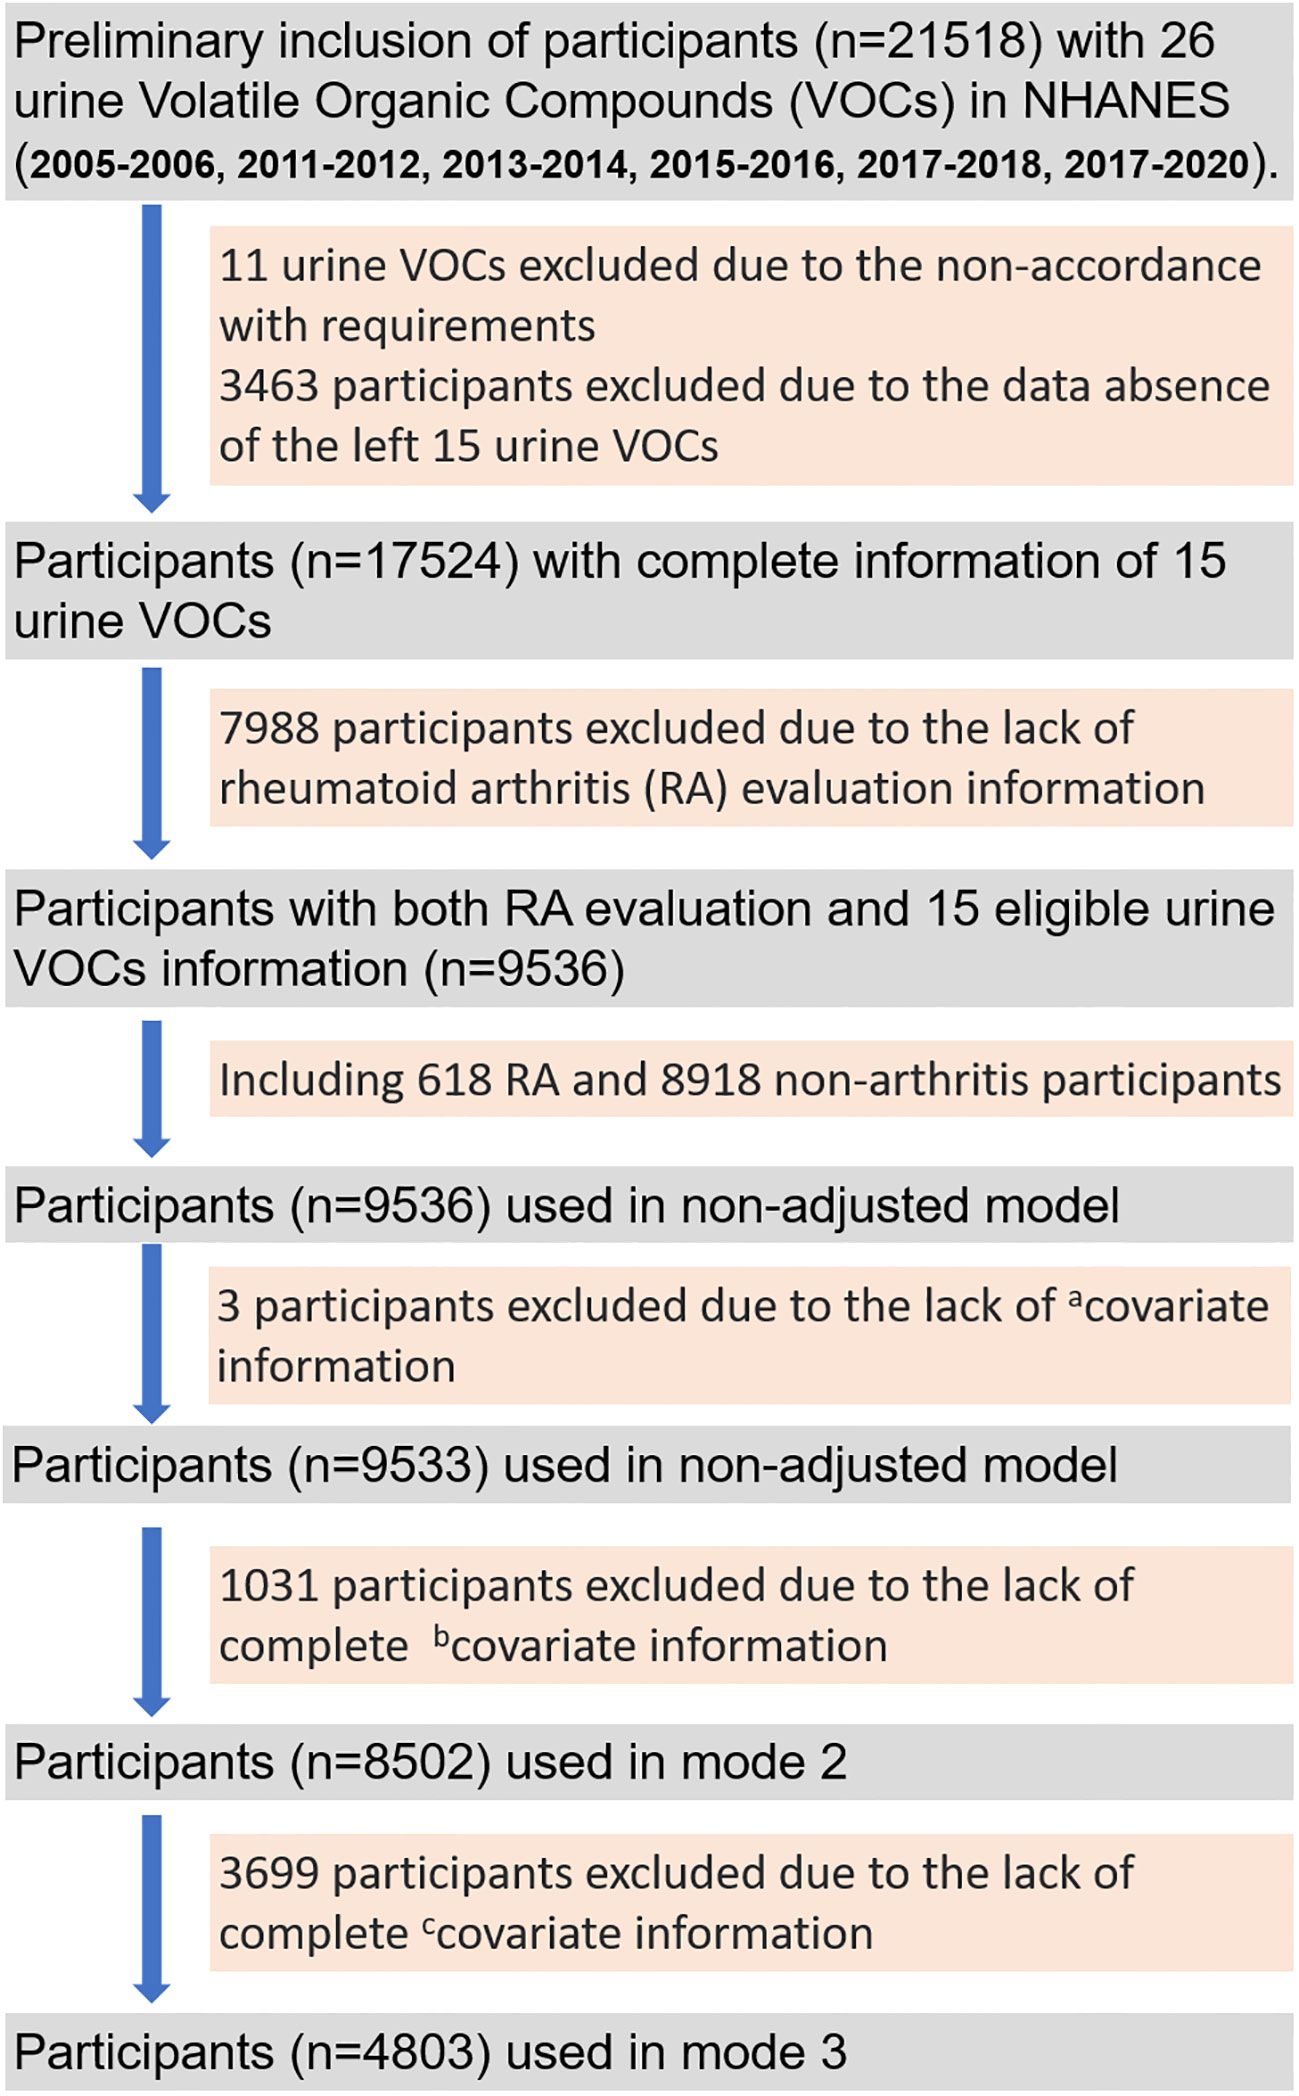
Figure 1 The flow gram of screening out eligible participants from 6 survey cycles (2005-2006, 2011-2012, 2013-2014, 2015-2016, 2017-2018, 2017-2020) of the National Health and Nutrition Examination Survey (NHANES) program. acovariate information: age, gender, race, educational level, marital status, urine creatinine and albumin; bcovariate information: total energy intake, physical activity, smoking, hypertension, diabetes; ccovariate information: marihuana use.
The baseline data comparation of included participants
The comparation results of baseline or covariates data between RA and non-arthritis subgroups were summarized in the Table 1. All the participants were grouped into RA and non-arthritis subgroups. A significant difference was detected between the 2 subgroups in terms of age, gender, race composition, education level composition, marital status, BMI, smoking, hypertension and diabetes, which was absent in terms of physical activity. Participants in the RA subgroup showed older age, higher percentage of women, higher BMI, higher percentage of overweight and obesity people than that in the non-arthritis subgroup. In addition, the percentage of smoking, hypertension and diabetes participants in the RA subgroup was significantly higher than that in the non-arthritis subgroup. In addition, the baseline data of RA and non-arthritis groups adjusted by sampling weight was summarized in Table S1, the analysis results were almost consistent with that adjusted without sampling weight.
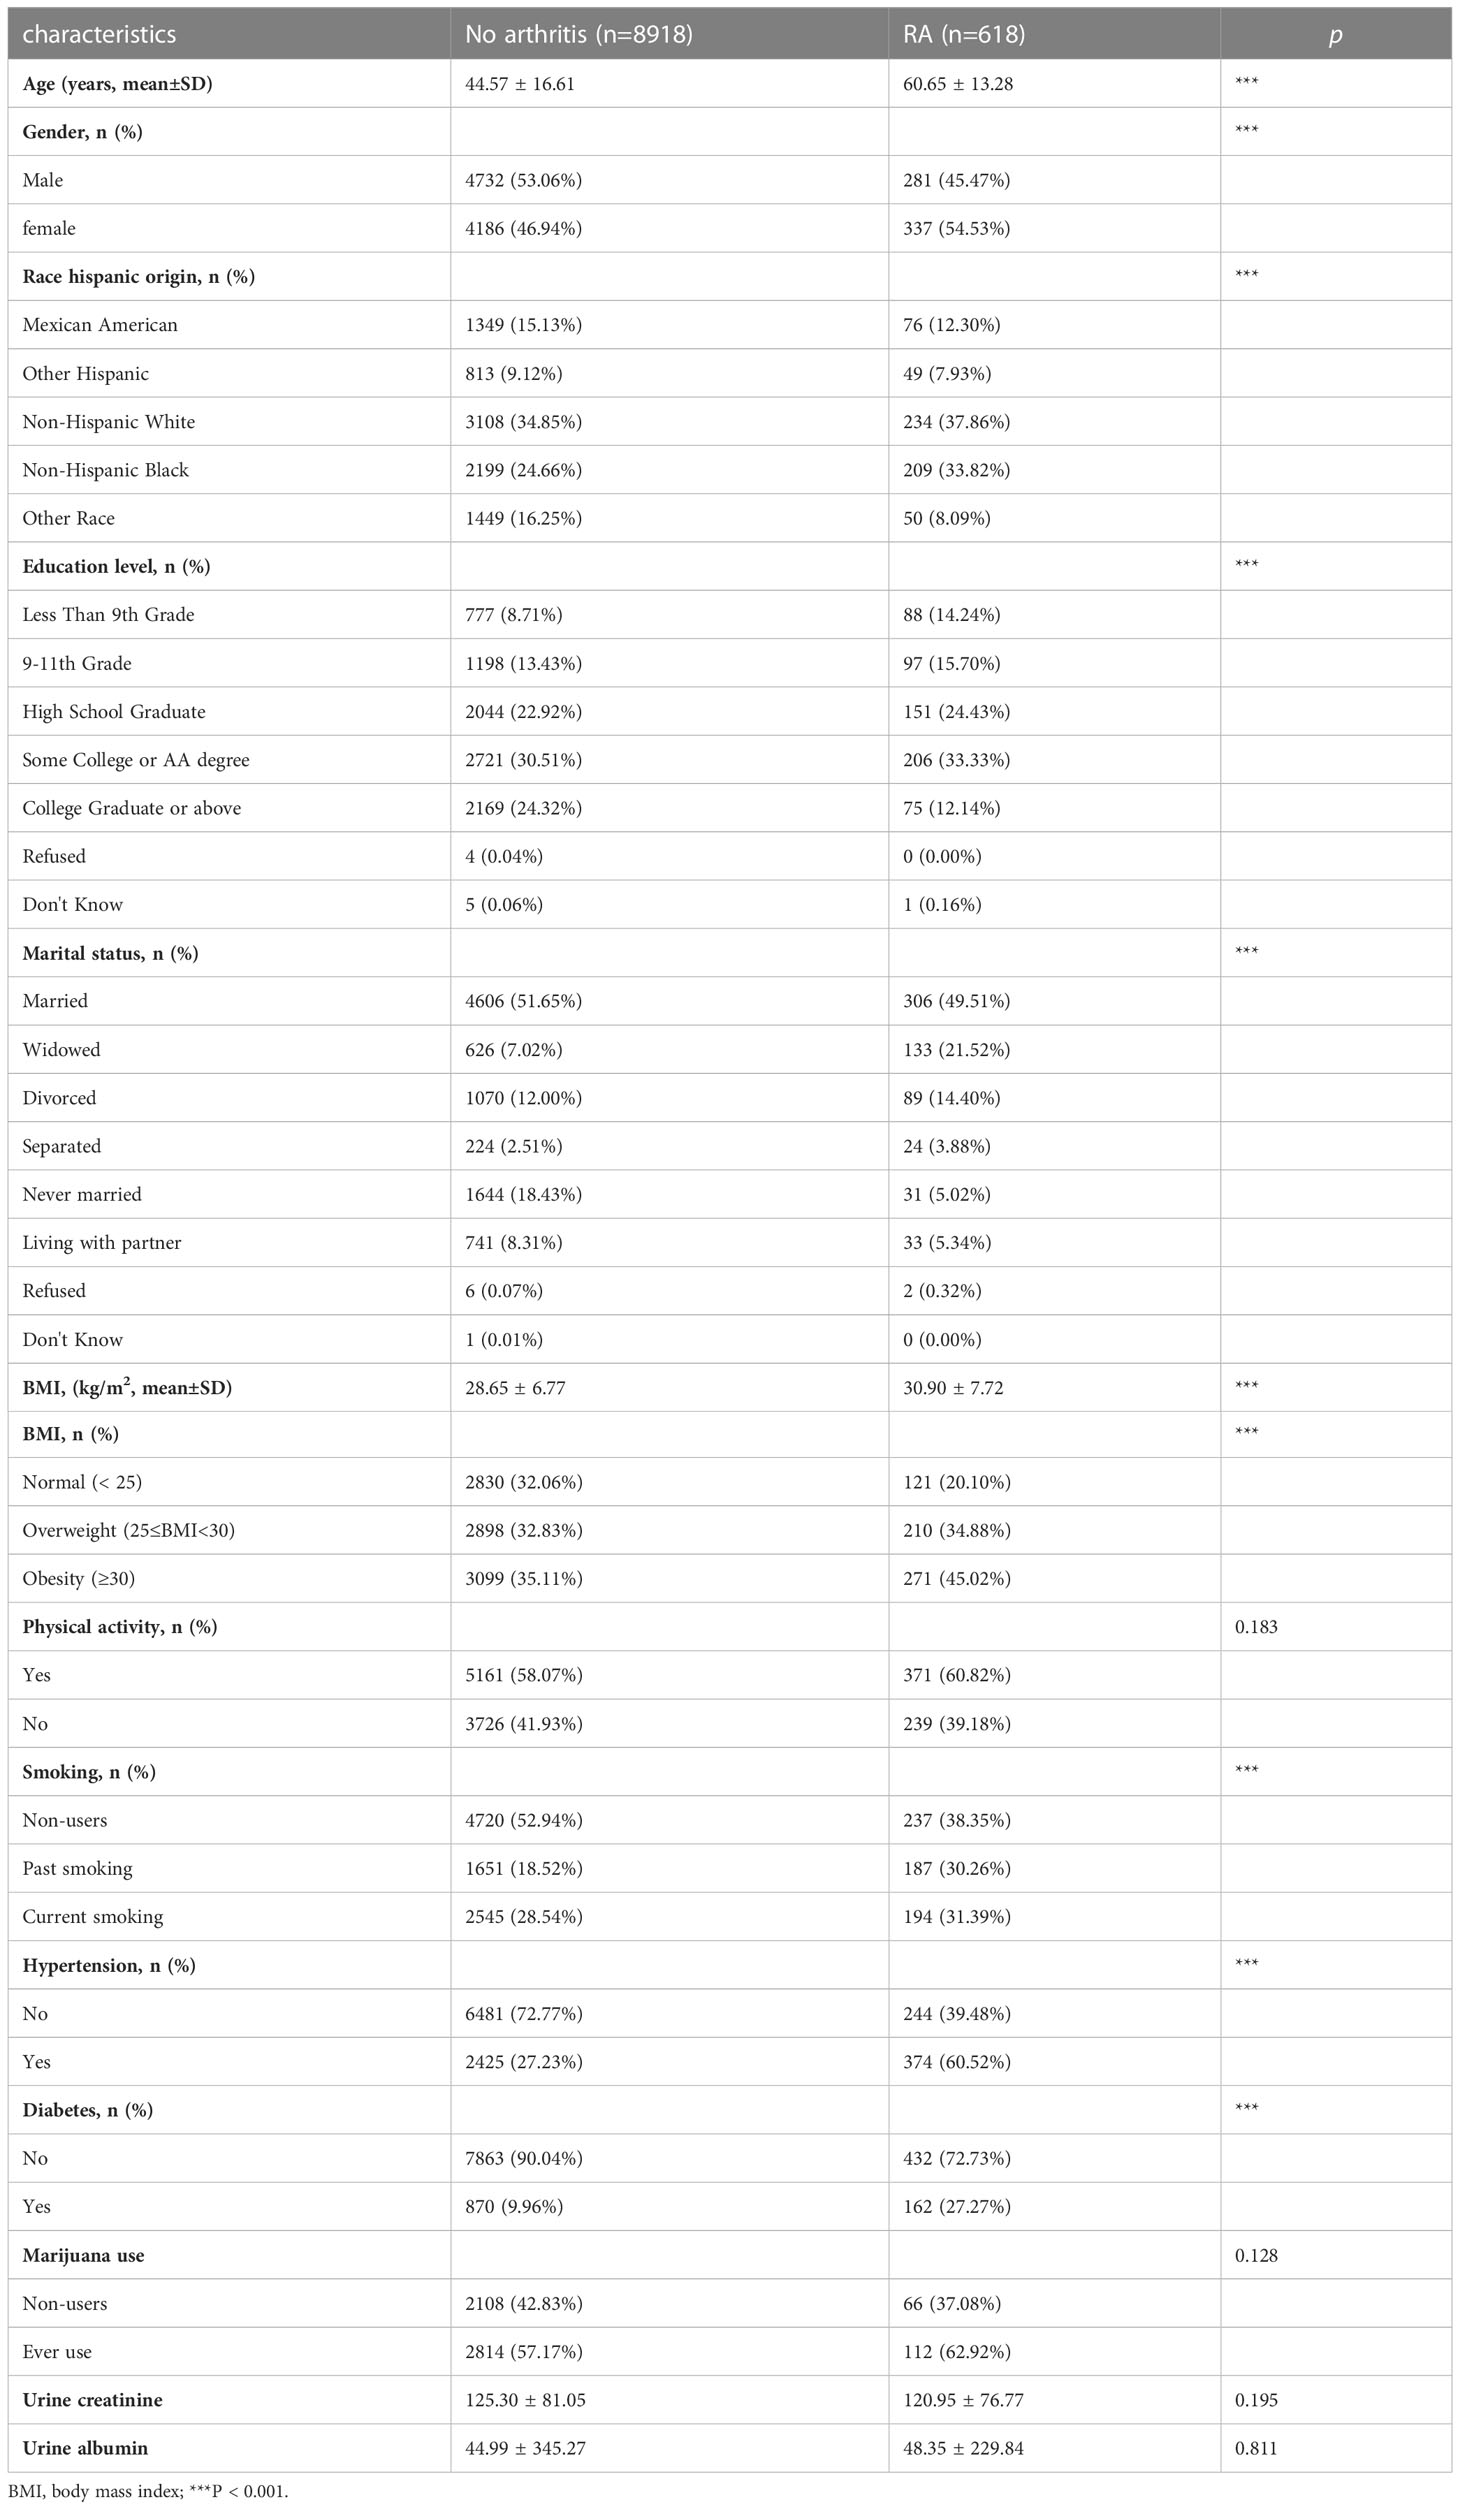
Table 1 Baseline data of included participants.
The comparation of urine VOCs between RA and non-arthritis subgroups
The comparation results of urine VOCs between the 2 subgroups was summarized in the Table 2. The parent compounds corresponding to urine VOCs was summarized in Table S2. Participants in the RA subgroup showed higher urine concentrations than the non-arthritis subgroup in terms of AMCC, CEMA, DHBMA, 3HPMA, MHBMA3, PGA and HMPMA. For the other 8 VOCs, no significant difference was detected between the 2 subgroups. In addition, the comparation of VOCs between RA and non-arthritis groups adjusted by sampling weight was summarized in Table S3, the analysis results were almost consistent with that adjusted without sampling weight.
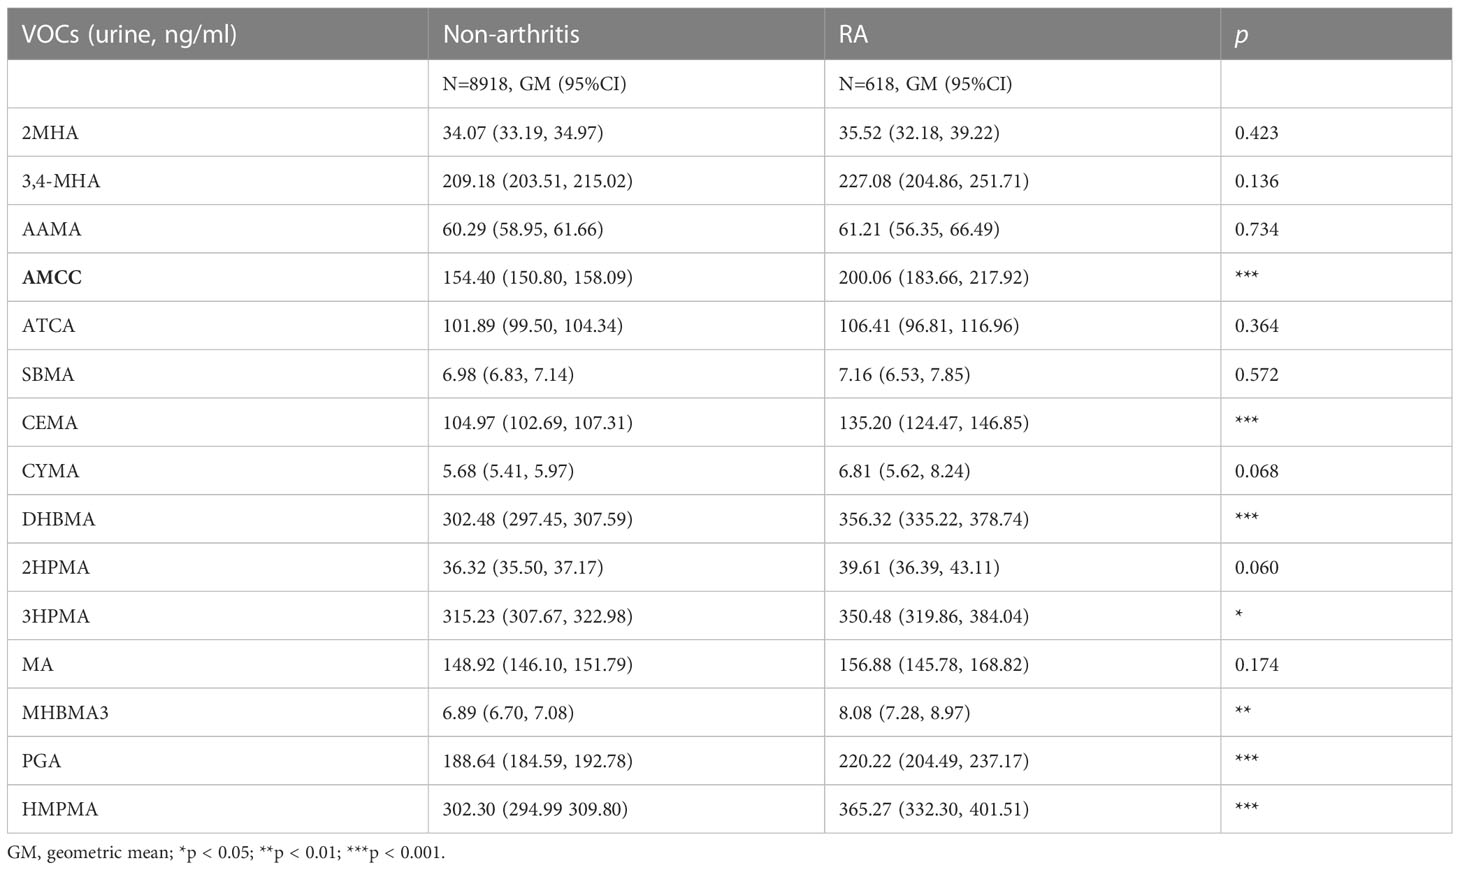
Table 2 The concentrations of volatile organic compound metabolites (VOCs) in urine of non-arthritis and RA subgroups.
The comparation of urine VOCs in the RA population with different smoking status
The comparation results of urine VOCs between the 3 subgroups in the RA population was summarized in the Table S4. Among the RA population, the current smokers showed significantly higher urine concentrations of 2MHA, 3,4-MHA, AAMA, AMCC, CEMA, CYMA, DHBMA, 3HPMA, MA, MHBMA3, PGA and HMPMA than that of the non-smokers or past smokers. While no significant difference was detected in terms of 2HPMA and SBMA.
The association between urine VOCs and RA
The quantile logistic regression method was used to analyze the association between VOCs and RA. Firstly, the concentration of each VOCs was divided into 4 quantiles from low to high with equal sample size. The incidence of RA in the quantile 1 (Q1) was set as the reference, and the corresponding odds value (OR) was obtained by comparing the incidence of the other quantiles (Q2-Q4) with that of Q1. The concentration distribution of the 15 VOCs in urine was summarized in the Table 3. Then 3 quantile logistic regression models with different covariates were constructed to analyze the association between exposure to VOCs and RA.
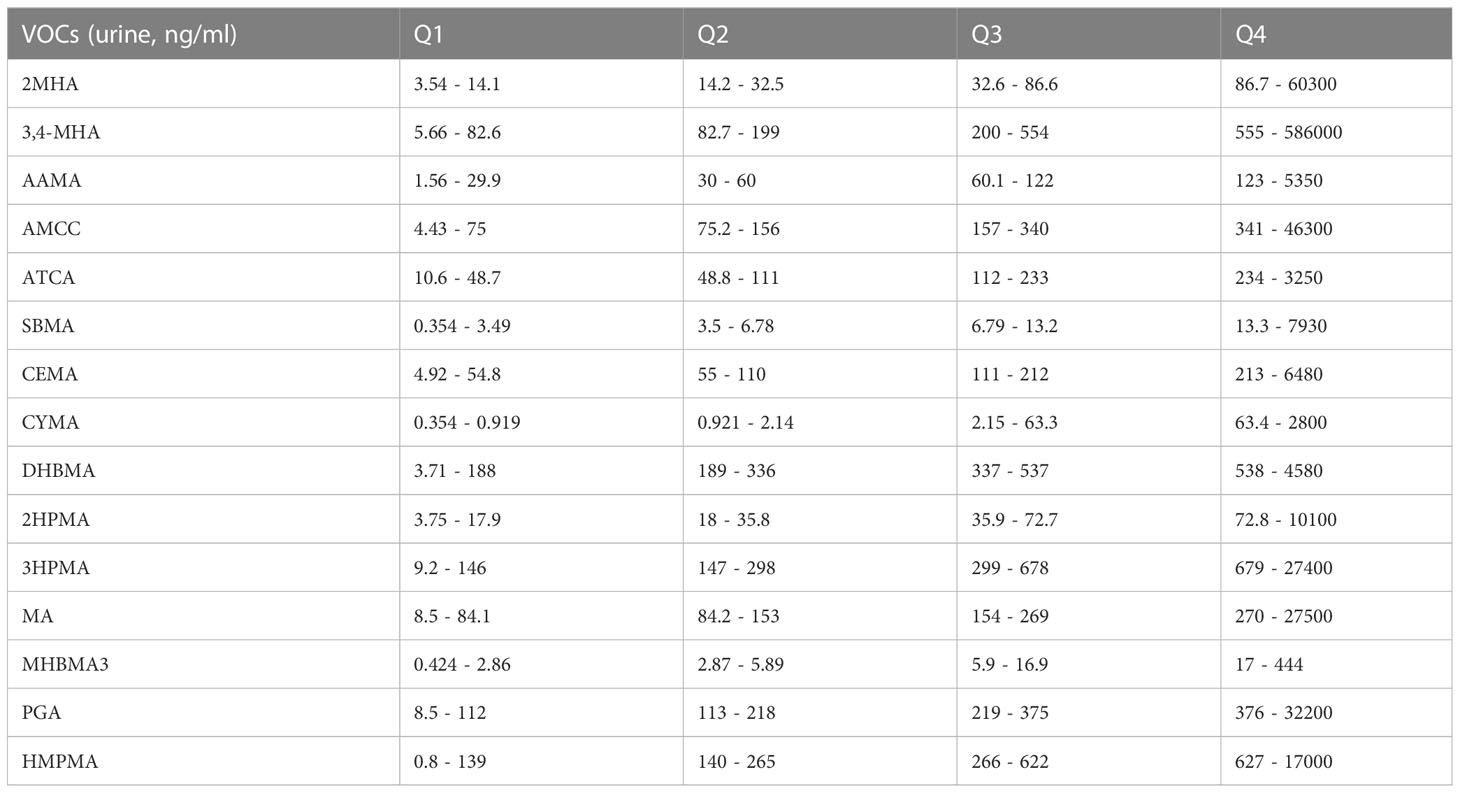
Table 3 The concentration distribution of various VOCs.
As shown in Table 4, for the analysis between 2MHA and RA, no significant OR was detected in the Q4 and total quantile of the model 1 and model 2. For AAMA, no significant OR was detected in all the quantiles of the non-adjusted model, while a significantly increased OR was found in the Q3 and Q4 of the model 1 and model 2. Meanwhile, a significantly increased OR was detected in the Q3 and Q4 of the non-adjusted and model 1 in terms of AMCC, CEMA and PGA, which was also detected in the Q3 of the model 2. A significantly positive association between RA and CYMA was detected in the model 1. As for DHBMA, a significantly increased OR was detected in the total quantiles of the non-adjusted model, Q3 and Q4 of the model 1, along with the Q4 model 2. And a significantly increased OR of 2HPMA was detected in the Q2 and Q4 of model 1. For MA, a significantly increased OR was detected in the Q4 of all the models. For MHBMA3, a significantly increased OR was detected in the Q3 and Q4 of the model 1. And a significantly positive association between RA and HMPMA was detected in the Q4 of the non-adjusted model and model 1. In addition, it was worth noting that a significant OR was detected over the whole quantiles of the model 1, in terms of 3HPMA. For 3HPMA, the relative OR in the Q2 and Q4 of the model 2 was 1.494 (95%CI: 1.124, 1.985) and 1.621 (95%CI: 1.111, 2.364) respectively. After adding marihuana use as covariates (Table S5), the positive association was only detected in the Q4 (OR=2.173, 95%CI:1.021-4.627) of AMCC, and the Q2(OR=2.286, 95%CI: 1.207-4.3307) and Q4 (OR=2.663, 95%CI: 1.288-5.508) of 3HPMA. It was worth noting that the subgroup analysis indicated no significant association between RA and VOCs (Table S6). In addition, the non-linear relationship between RA and 15 VOCs was analyzed using the smooth curve fitting method (Figures S1–15). The RA incidence increased with the increase of AAMA (Figure S3), SBMA (Figure S6), DHBMA (Figure S9) and MA (Figure S9).
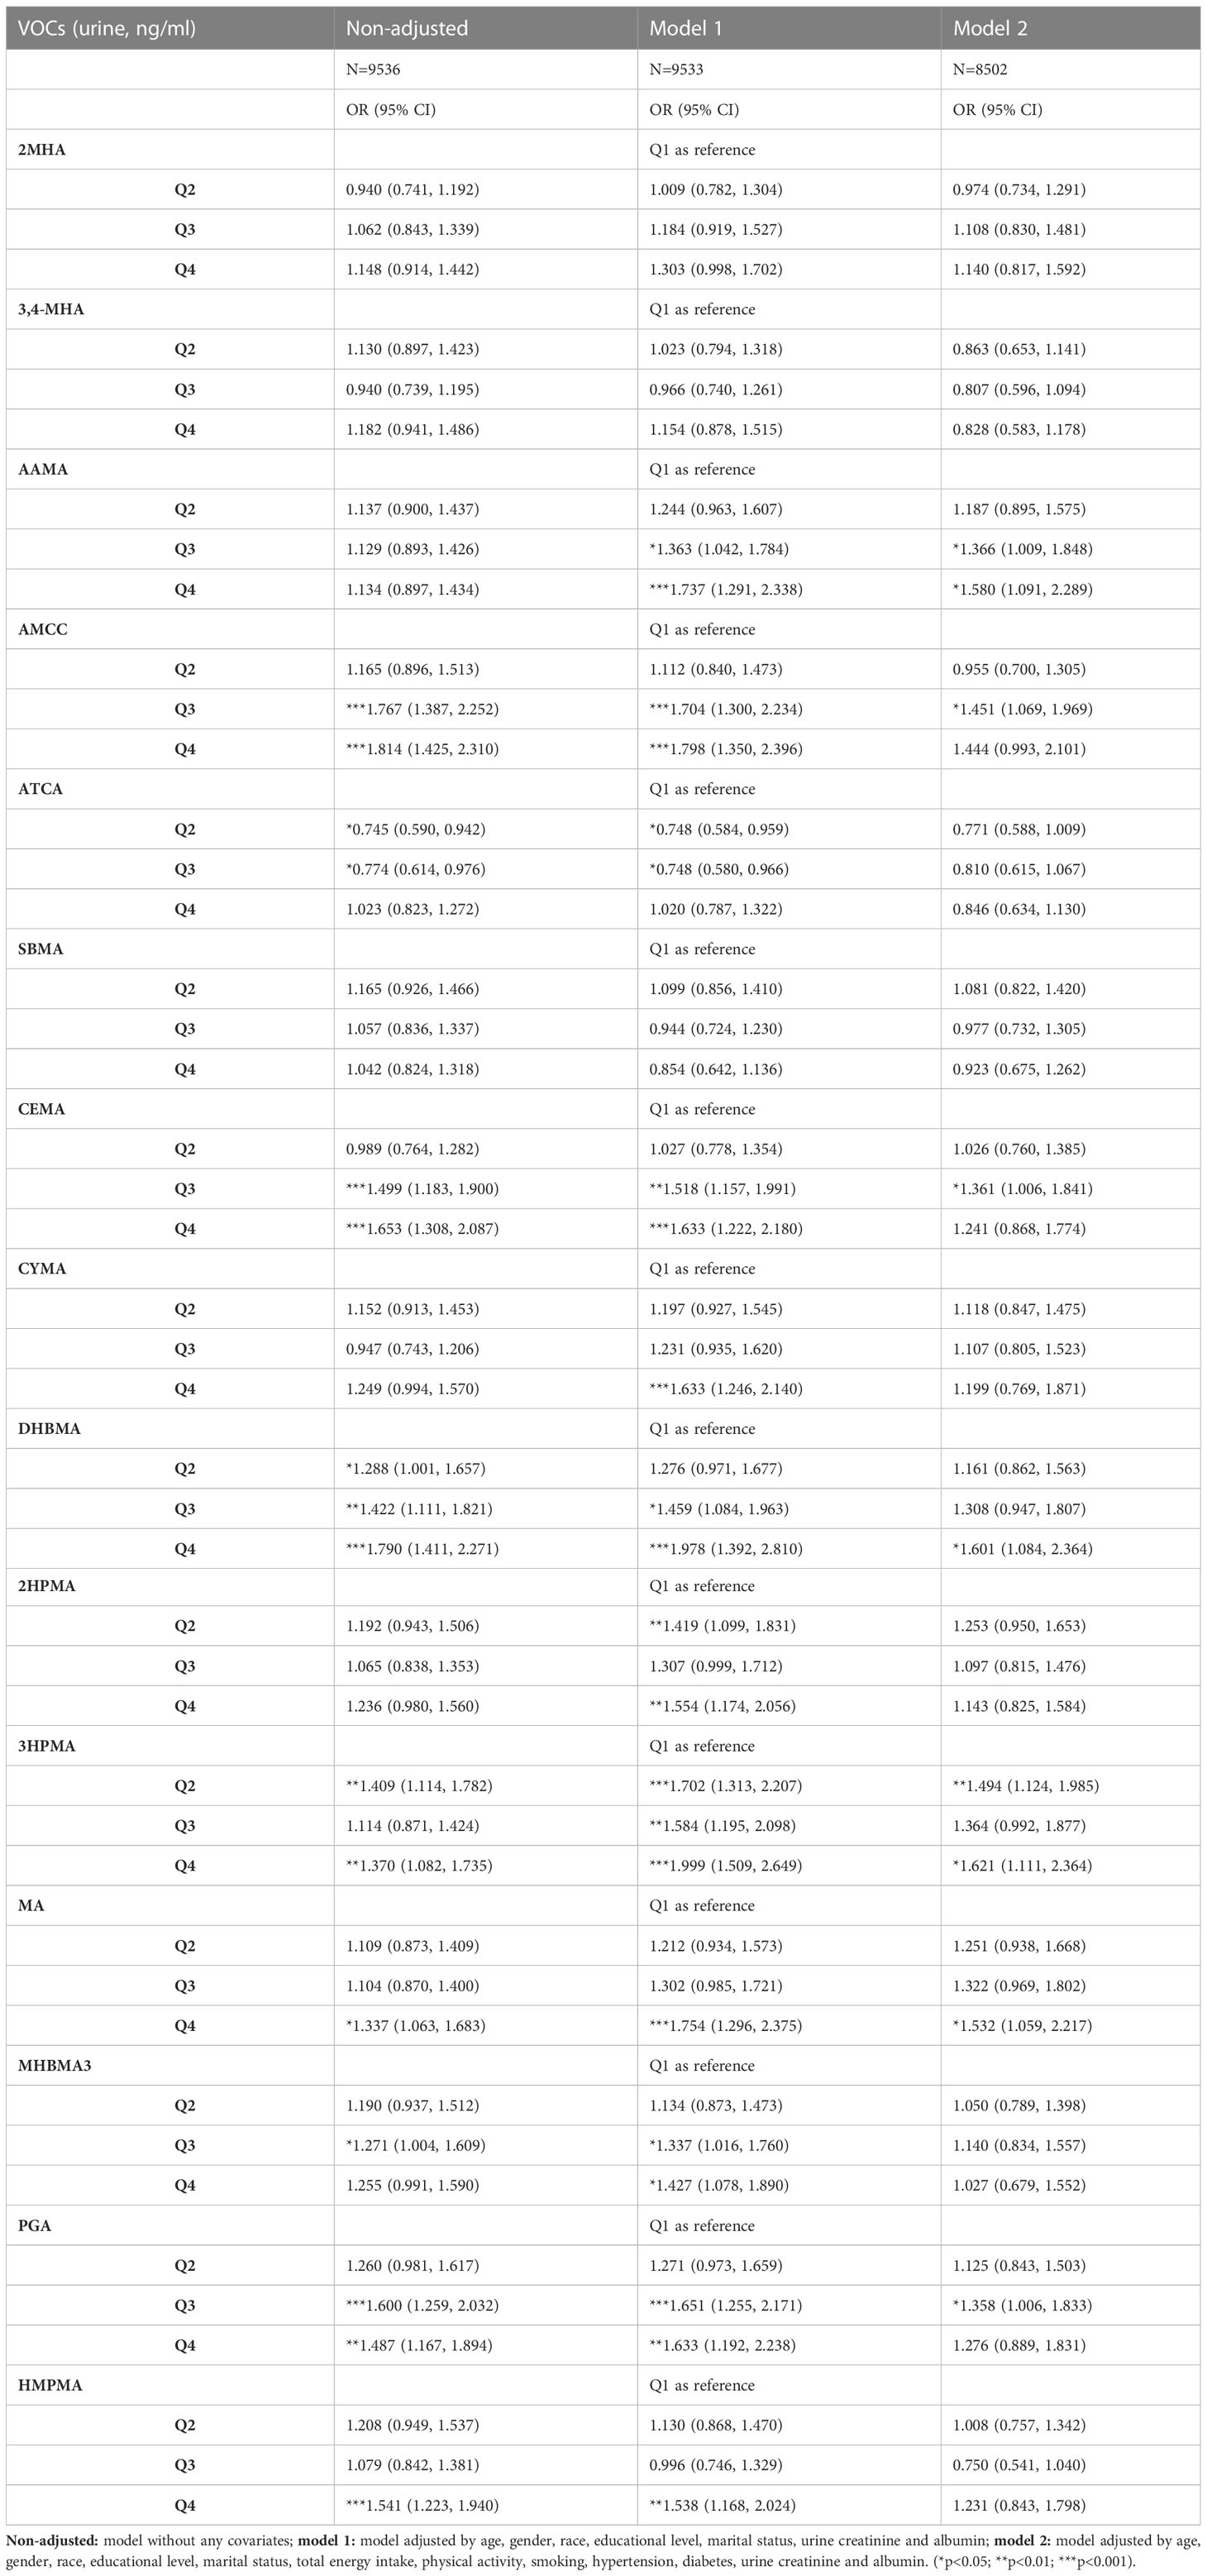
Table 4 The association between urine VOCs and RA.
Discussion
In this study, we performed a cross-sectional study to systematically investigate the association between the exposure to specific VOC and risk of RA. The VOC concentration in human could be tested in blood, urine, breath and even sweat. However, direct testing of VOC in blood, urine or breath may yield inaccurate results due to the volatilization characteristic of VOC. Although the primary route of human exposure to VOC is through lung inhalation (23), VOC in the body are mainly metabolized through the digestive system, especially the liver digestive enzymes, to form water-soluble VOC metabolites (VOCs) (24). Most VOCs are specific to relative parent compounds, and finally excreted from the body in the urine (25). Therefore, the specificity to parent compounds and stable physicochemical properties makes VOCs more suitable biomarkers of environmental VOC exposures. In this study, we collected the data of VOCs in urine to represent the exposure degree of VOC. As shown in the results part, a total of 9536 participants with 15 VOCs in urine were included from 6 survey cycles of the NHANES program. All the participants were grouped into RA or non-arthritis subgroups, and the baseline data differs significantly between the 2 subgroups. The proportion of smokers in the RA subgroups was significantly higher than that in the non-arthritis subgroups, which was consistent with previous studies demonstrating that smoking was identified as risk factor of RA. And also, we found that smokers with RA have higher VOCs than non-smokers, while whether smoking plays a role in the association between VOCs and RA remained yet clarified. Meanwhile, we also found that the incidence of hypertension and diabetes in the RA subgroups was significantly higher than that in the non-arthritis subgroups. It was found that the frequencies of hypertension, dyslipidemia, and diabetes in the RA population was significantly higher than that in the general population, which was consistent with our findings and proved from the side that RA is a systemic autoimmune disease (26). The VOCs concentration in urine between the 2 subgroups was then compared, with significantly higher concentration of 7 VOCs detected in the RA subgroups than the non-arthritis subgroup {AMCC, CEMA, DHBMA, 3HPMA, MHBMA3, PGA and HMPMA}. The difference of VOCs concentration pattern between the 2 groups suggested that the exposure to some VOC was more serious in the RA subgroup than the non-arthritis group.
In order to further analyze the association between exposure to VOC and RA, 3 quantile regression models with different covariates were constructed. After analysis, 9 VOCs were identified to be positively associated with RA at different concentration quantiles, including CEMA, 3HPMA, AAMA, CYMA, DHBMA, HMPMA, AMCC, PGA and MA. As shown in Table S2, relative parent compounds (acrolein, acrylamide, acrylonitrile, 1,3-butadiene, crotonaldehyde, N,N-Dimethylformamide, Ethylbenzene, styrene) to the 9 VOCs were summarized according to previous studies. After adjusted by all the covariates, there were 6 VOCs remained to be associated with RA at different concentration quantiles, including CEMA, 3HPMA, DHBMA, AMCC, PGA and MA. Most of these parent compounds have been identified as hazardous environmental pollutants by the United States Environmental Protection and Agency (U.S. EPA).
Among these VOCs, the 3HPMA stand out because a statistically significant OR was detected over the whole quantiles of all the 3 models. Except for 3HPMA, CEMA was another metabolite of acrolein, which was also detected positively associated with RA in this study. Acrolein is ubiquitous in nature and living environments and widely applied as an intermediate to produce acrylic acid, which possesses super-absorbent properties and used as raw materials for diapers, paints and coatings (27, 28). The toxicity of acrolein manifests as irritation of the mucocutaneous membrane, such as eyes, nose and lungs, of which the stimulus only works at the moment of contact (29). However, less evidence has been provided to demonstrate the exposure of acrolein as a cause of diseases (30). Previous studies observed increased protein-conjugated acrolein in plasm at early stage of several diseases, including renal failure (31), Alzheimer’s disease (32), brain infarction (33, 34) and primary Sjogren’s syndrome (35). These studies suggested that the increased protein-conjugated acrolein may be positively associated with the disease progression. In addition, it was worth noting that 3 studies reported the potential association between blood acrolein and RA (36–38). While two studies simply used free acrolein as an indicator of inflammation during RA progression (36, 38). And the other study also observed increased protein-conjugated acrolein in the early stage of RA (38). However, neither free nor protein-conjugated acrolein in the blood can fully represent the body’s exposure level to acrolein. Nevertheless, their observation of increased acrolein in blood sample of RA patients was consistent with our findings, synergistically providing strong evidence the exposure to acrolein may be an important risk factor for RA.
Except for acrolein, there were also some VOC found to associate positively with RA, while the statistical evidence for these is significant in Q3, Q4 or total quantiles, not in the whole quantile. These VOC, with statistically weaker significance, included acrylamide, acrylonitrile, crotonaldehyde, 1,3-Butadiene, N,N-Dimethylformamide and Ethylbenzene, styrene. And all these VOC were firstly found to be positively associated with the RA. The acrylamide has been widely used for producing polyacrylamide polymers applied as flocculants, and it was reported that the exposure to acrylamide was associated with the impairment of central and peripheral nervous system (39). In addition, the acrylamide has been early identified as a genotoxic and carcinogenic compound (40). The significant association between acrylamide exposure and RA indicated that the toxic effects of acrylamide are not only neurotoxic, but are likely to be systemic, since rheumatoid arthritis is a systemic autoimmune disease.
Acrylonitrile has been extensively applied as raw materials to manufacture acrylic fibers, plastics, synthetic rubbers, and acrylamide (41). It was pointed out that smoking were important sources of acrylonitrile exposure in the US population (42). The exposure to acrylonitrile at concentrations 20 ppm would result in headaches, nausea and dizziness (43), and acrylonitrile was identified as possibly carcinogenic to humans (Group 2B) (44). However, there were little studies reporting the association between acrylonitrile exposure and specific diseases. In this study, urinary CYMA, as the major metabolite of acrylonitrile, was firstly detected to be associated with RA. However, it was worth noting that the positive association attenuated after adjusting for smoking in Model 2. Similarly, the HMPMA, as the metabolites of crotonaldehyde, was firstly found to be positively associated with RA. The major source of crotonaldehyde is tobacco smoke (45), and it was reported that the crotonaldehyde exposure could result in vascular injury through Wnt and ErbB signaling pathways (46). While little is known about the effect of crotonaldehyde exposure on RA incidence. Considering that smoking is major risk factor for RA and the main source of acrylonitrile and crotonaldehyde exposure, our findings suggested that acrylonitrile and crotonaldehyde may be the main active ingredient in smoking induced RA.
Similarly, 1,3-butadiene, as the parent compound of DHBMA, was mainly produced from tobacco smoke and reported to cause damage on human health (47). The toxicity of 1,3-butadiene manifests during the metabolism process in vivo, including enzyme disorders, GSH depletion, and saturable metabolism (48). The 1,3-butadiene has been identified as known carcinogens, with several epidemiological studies demonstrating that the exposure to 1,3-butadiene was positively associated with increased incidence of various cancers, such as colorectal, prostate, lung cancers and hematological system neoplasms (25, 49). In addition, several studies have reported the harmful effect of 1,3-butadiene exposure on cardiovascular diseases, which is absent in terms of RA (50). This is the first to discover the positive association between DHBMA and RA, and these findings suggested that the exposure to 1,3-butadiene is significantly associated with RA.
In addition, the N,N-Dimethylformamide, as the parent compound of AMCC, was reported to specifically induce liver impairment. The potential mechanism of targeted harmful effects of N,N-Dimethylformamide on liver was mainly contributed to oxidative stress caused by reduced GSH level and increased reactive oxygen species (51). And it was also found that the harmful mechanism of N,N-Dimethylformamide involved the activation of NLRP3 inflammasome (52), suggesting the induced inflammatory reaction may also be the underlying cause. The exposure to ethylbenzene, styrene was also reported to cause harmful effect on the central nervous, immune and reproductive systems (25, 53), while its potential harmful cause of RA was firstly found in this study. These findings can help us explain why N,N-Dimethylformamide and ethylbenzene, styrene also cause RA, since excessive oxidative stress and inflammatory reaction are also the main mechanism of RA (13).
In conclusion, we identified several VOC was significantly associated with RA, through analyzing the association between the VOCs in urine and RA. These findings would provide us epidemiological evidence about the association between environment pollutants and RA.
Strength and limitation
It has been reported that VOC, a common environment pollutant, was closely associated with some autoimmune diseases, while whether VOC exposure or which VOC leads to RA is yet clarified. To our best knowledge, this is the first study to systematically investigate the association between VOC exposure and RA. Several VOCs were identified to be associated with RA, giving us novel inspiration for understanding the development of RA and preventing RA in the environmental perspective. This study was performed on the basis of the NHANES program, and the population inclusion was scientifically designed, which could authoritatively represent the health and nutrition status of the USA population. A total of 3 logistic regression models were constructed for analysis and the analysis results still remained stable after analyzing using the 3 models. Nevertheless, some limitations should not be ignored when generalizing the conclusion. Firstly, all the data used in this cross-sectional study was collected at the same time, so it was unable to the infer the casual relationship between VOC exposure and RA. More cohort or prospective studies investigating the association between RA and VOC may be an effective method to explore their causality. Secondly, the precision of the conclusions may be compromised, because some VOCs with more than a quarter of unqualified data was excluded when using quantile regression model. Thirdly, the diagnosis of RA condition was defined through questionnaire survey method, which may lead to misdiagnose or missed diagnosis of some participants and impair the evidence level of our conclusion. In addition, it was difficult to locate the pathogenic site of RA exactly due to the limitation of data availability, which should be considered carefully when generalizing our conclusions. In general, more prospective studies and related experimental studies are needed to further validate the conclusions of this study.
Conclusion
In this study, we analyzed whether VOCs in urine program associate with RA using the dataset from the NHANES. A total of 9536 participants with 15 VOCs in urine were eligible for final analysis. 3 logistic regression models were constructed for correlation analysis, identifying several VOCs to be significantly associated with RA. The relative parent compounds of these VOCs included acrolein, acrylonitrile and 1,3-butadiene, xylene, acrylamide, crotonaldehyde, N,N-Dimethylformamide, ethylbenzene and propylene oxide. These findings suggested that the VOC exposure significantly associated with RA. And also, more prospective studies and related experimental studies are needed to further validate the conclusions of this study.
Data availability statement
The raw data supporting the conclusions of this article will be made available by the authors, without undue reservation.
Ethics statement
The investigation protocol of NHANES program was reviewed and approved by the National Center for Health Statistics (NCHS), a division of Centers for Disease Control and Prevention (CDC). Before inclusion, all the participants received an informed consent form setting out details of this program, and would sign their consent form.
Author contributions
TL finished the writing of the manuscript. TL and JY complete the data analysis. HQ made the tables and figures. YH and JY reviewed and revised the manuscript. YH repeated the data analysis and supervised the whole process. All authors contributed to the article and approved the submitted version.
Funding
This study was supported by the Fundamental Research Funds for the Central Universities of Central South University (Grant No. 2021zzts0346), the Science and Technology Innovation Leading Project for High-tech Industry of Hunan Province (Grant No. 2020SK2008), and the Natural Science Foundation of China (Grant Nos. 81672656).
Acknowledgment
YH takes full responsibility for the work as a whole, including the study design, access to data, and the decision to submit and publish the manuscript.
Conflict of interest
The authors declare that the research was conducted without any commercial or financial relationships that could be construed as a potential conflict of interest.
Publisher’s note
All claims expressed in this article are solely those of the authors and do not necessarily represent those of their affiliated organizations, or those of the publisher, the editors and the reviewers. Any product that may be evaluated in this article, or claim that may be made by its manufacturer, is not guaranteed or endorsed by the publisher.
Supplementary material
The Supplementary Material for this article can be found online at: https://www.frontiersin.org/articles/10.3389/fimmu.2023.1098683/full#supplementary-material
References
1. Smolen JS, Aletaha D, McInnes IB. Rheumatoid arthritis. Lancet (2016) 388(10055):2023–38. doi: 10.1016/S0140-6736(16)30173-8
2. Silman AJ, Pearson JE. Epidemiology and genetics of rheumatoid arthritis. Arthritis Res (2002) 4 Suppl 3(Suppl 3):S265–72. doi: 10.1186/ar578
3. Alamanos Y, Voulgari PV, Drosos AA. Incidence and prevalence of rheumatoid arthritis, based on the 1987 American college of rheumatology criteria: a systematic review. Semin Arthritis Rheum (2006) 36(3):182–8. doi: 10.1016/j.semarthrit.2006.08.006
4. Tobón GJ, Youinou P, Saraux A. The environment, geo-epidemiology, and autoimmune disease: rheumatoid arthritis. J Autoimmun (2010) 35(1):10–4. doi: 10.1016/j.jaut.2009.12.009
5. Kobayashi S, Momohara S, Kamatani N, Okamoto H. Molecular aspects of rheumatoid arthritis: role of environmental factors. FEBS J (2008) 275(18):4456–62. doi: 10.1111/j.1742-4658.2008.06581.x
6. Sigaux J, Biton J, André E, Semerano L, Boissier MC. Air pollution as a determinant of rheumatoid arthritis. Joint Bone Spine (2019) 86(1):37–42. doi: 10.1016/j.jbspin.2018.03.001
7. Sundström B, Johansson I, Rantapää-Dahlqvist S. Interaction between dietary sodium and smoking increases the risk for rheumatoid arthritis: results from a nested case-control study. Rheumatol (Oxford) (2015) 54(3):487–93. doi: 10.1093/rheumatology/keu330
8. Chang K, Yang SM, Kim SH, Han KH, Park SJ, Shin JI. Smoking and rheumatoid arthritis. Int J Mol Sci (2014) 15(12):22279–95. doi: 10.3390/ijms151222279
9. Parks CG, Hoppin JA, De Roos AJ, Costenbader KH, Alavanja MC, Sandler DP. Rheumatoid arthritis in agricultural health study spouses: associations with pesticides and other farm exposures. Environ Health Perspect (2016) 124(11):1728–34. doi: 10.1289/EHP129
10. Parks CG, Walitt BT, Pettinger M, Chen JC, de Roos AJ, Hunt J, et al. Insecticide use and risk of rheumatoid arthritis and systemic lupus erythematosus in the women's health initiative observational study. Arthritis Care Res (Hoboken) (2011) 63(2):184–94. doi: 10.1002/acr.20335
11. Hart JE, Laden F, Puett RC, Costenbader KH, Karlson EW. Exposure to traffic pollution and increased risk of rheumatoid arthritis. Environ Health Perspect (2009) 117(7):1065–9. doi: 10.1289/ehp.0800503
12. De Roos AJ, Koehoorn M, Tamburic L, Davies HW, Brauer M. Proximity to traffic, ambient air pollution, and community noise in relation to incident rheumatoid arthritis. Environ Health Perspect (2014) 122(10):1075–80. doi: 10.1289/ehp.1307413
13. Boissier MC, Biton J, Semerano L, Decker P, Bessis N. Origins of rheumatoid arthritis. Joint Bone Spine (2020) 87(4):301–6. doi: 10.1016/j.jbspin.2019.11.009
14. Sun L, Ye Z, Ling Y, Cai S, Xu J, Fan C, et al. Relationship between polycyclic aromatic hydrocarbons and rheumatoid arthritis in US general population, NHANES 2003-2012. Sci Total Environ (2020) 704:135294. doi: 10.1016/j.scitotenv.2019.135294
15. Zhao Y, Liu W, Qu J, Hu S, Zhang L, Zhao M, et al. Per-/polyfluoroalkyl substance concentrations in human serum and their associations with immune markers of rheumatoid arthritis. Chemosphere (2022) 298:134338. doi: 10.1016/j.chemosphere.2022.134338
16. Cerimi K, Jäckel U, Meyer V, Daher U, Reinert J, Klar S. In vitro systems for toxicity evaluation of microbial volatile organic compounds on humans: current status and trends. J Fungi (Basel) (2022) 8(1). doi: 10.3390/jof8010075
17. Alford KL, Kumar N. Pulmonary health effects of indoor volatile organic compounds-a meta-analysis. Int J Environ Res Public Health (2021) 18(4). doi: 10.3390/ijerph18041578
18. Ogbodo JO, et al. Volatile organic compounds: a proinflammatory activator in autoimmune diseases. Front Immunol (2022) 13:928379. doi: 10.3389/fimmu.2022.928379
19. Miller FW, et al. Epidemiology of environmental exposures and human autoimmune diseases: findings from a national institute of environmental health sciences expert panel workshop. J Autoimmun (2012) 39(4):259–71. doi: 10.1016/j.jaut.2012.05.002
20. Alwis KU, et al. Simultaneous analysis of 28 urinary VOC metabolites using ultra high performance liquid chromatography coupled with electrospray ionization tandem mass spectrometry (UPLC-ESI/MSMS). Anal Chim Acta (2012) 750:152–60. doi: 10.1016/j.aca.2012.04.009
21. Pi-Sunyer FX. Obesity: criteria and classification. Proc Nutr Soc (2000) 59(4):505–9. doi: 10.1017/S0029665100000732
22. Wei B, Alwis KU, Li Z, Wang L, Valentin-Blasini L, Sosnoff CS, et al. Urinary concentrations of PAH and VOC metabolites in marijuana users. Environ Int (2016) 88:1–8. doi: 10.1016/j.envint.2015.12.003
23. He J, Sun X, Yang X. Human respiratory system as sink for volatile organic compounds: evidence from field measurements. Indoor Air (2019) 29(6):968–78. doi: 10.1111/ina.12602
24. Frigerio G, Mercadante R, Polledri E, Missineo P, Campo L, Fustinoni S. An LC-MS/MS method to profile urinary mercapturic acids, metabolites of electrophilic intermediates of occupational and environmental toxicants. J Chromatogr B Analyt Technol BioMed Life Sci (2019) 1117:66–76. doi: 10.1016/j.jchromb.2019.04.015
25. Li AJ, Pal VK, Kannan K. A review of environmental occurrence, toxicity, biotransformation and biomonitoring of volatile organic compounds. Environ Chem Ecotoxicology (2021) 3:91–116. doi: 10.1016/j.enceco.2021.01.001
26. Castro LL, Lanna CCD, Rocha MP, Ribeiro ALP, Telles RW. Recognition and control of hypertension, diabetes, and dyslipidemia in patients with rheumatoid arthritis. Rheumatol Int (2018) 38(8):1437–42. doi: 10.1007/s00296-018-4084-3
27. Liu L, Ye XP, Bozell JJ. A comparative review of petroleum-based and bio-based acrolein production. ChemSusChem (2012) 5(7):1162–80. doi: 10.1002/cssc.201100447
28. Grosjean E, Williams EL II, Grosjean D. Atmospheric chemistry of acrolein. Sci total Environ (1994) 153(3):195–202. doi: 10.1016/0048-9697(94)90198-8
29. Faroon O, Roney N, Taylor J, Ashizawa A, Lumpkin MH, Plewak DJ. Acrolein health effects. Toxicol Ind Health (2008) 24(7):447–90. doi: 10.1177/0748233708094188
30. Schieweck A, Uhde E, Salthammer T. Determination of acrolein in ambient air and in the atmosphere of environmental test chambers. Environ Sci Process Impacts (2021) 23(11):1729–46. doi: 10.1039/D1EM00221J
31. Sakata K, Kashiwagi K, Sharmin S, Ueda S, Irie Y, Murotani N, et al. Increase in putrescine, amine oxidase, and acrolein in plasma of renal failure patients. Biochem Biophys Res Commun (2003) 305(1):143–9. doi: 10.1016/S0006-291X(03)00716-2
32. Tsou H-H, Hsu W-C, Fuh J-L, Chen S-P, Liu T-Y, Wang H-T. Alterations in acrolein metabolism contribute to alzheimer’s disease. J Alzheimer's Dis (2018) 61(2):571–80. doi: 10.3233/JAD-170736
33. Yoshida M, Higashi K, Kobayashi E, Saeki N, Wakui K, Kusaka T, et al. Correlation between images of silent brain infarction, carotid atherosclerosis and white matter hyperintensity, and plasma levels of acrolein, IL-6 and CRP. Atherosclerosis (2010) 211(2):475–9. doi: 10.1016/j.atherosclerosis.2010.03.031
34. Saiki R, Nishimura K, Ishii I, Omura T, Okuyama S, Kashiwagi K, et al. Intense correlation between brain infarction and protein-conjugated acrolein. Stroke (2009) 40(10):3356–61. doi: 10.1161/STROKEAHA.109.553248
35. Hirose T, Saiki R, Uemura T, Suzuki T, Dohmae N, Ito S, et al. Increase in acrolein-conjugated immunoglobulins in saliva from patients with primary sjögren's syndrome. Clinica Chimica Acta (2015) 450:184–9. doi: 10.1016/j.cca.2015.08.018
36. Łuczaj W, Gindzienska-Sieskiewicz E, Jarocka-Karpowicz I, Andrisic L, Sierakowski S, Zarkovic N, et al. The onset of lipid peroxidation in rheumatoid arthritis: consequences and monitoring. Free Radic Res (2016) 50(3):304–13. doi: 10.3109/10715762.2015.1112901
37. El-Maghrabey MH, Kishikawa N, Ohyama K, Kuroda N. Analytical method for lipoperoxidation relevant reactive aldehydes in human sera by high-performance liquid chromatography-fluorescence detection. Anal Biochem (2014) 464:36–42. doi: 10.1016/j.ab.2014.07.002
38. Kawabata C, Nagasawa T, Ono M, Tarumoto N, Katoh N, Hotta Y, et al. Plasma acrolein level in rheumatoid arthritis increases independently of the disease characteristics. Mod Rheumatol (2021) 31(2):357–64. doi: 10.1080/14397595.2020.1775921
39. Mojska H, Gielecińska I, Zielińska A, Winiarek J, Sawicki W. Estimation of exposure to dietary acrylamide based on mercapturic acids level in urine of polish women post partum and an assessment of health risk. J Expo Sci Environ Epidemiol (2016) 26(3):288–95. doi: 10.1038/jes.2015.12
40. Michael Bolger P, Leblanc JC, Setzer RW. Application of the margin of exposure (MoE) approach to substances in food that are genotoxic and carcinogenic: EXAMPLE: acrylamide (CAS no. 79-06-1). Food Chem Toxicol (2010) 48 Suppl 1:S25–33. doi: 10.1016/j.fct.2009.11.040
41. Woutersen RA. Toxicologic profile of acrylonitrile. Scand J Work Environ Health (1998) 24 Suppl 2:5–9.
42. De Jesús VR, Zhang L, Bhandari D, Zhu W, Chang JT, Blount BC. Characterization of acrylonitrile exposure in the united states based on urinary n-acetyl-S-(2-cyanoethyl)-L-cysteine (2CYEMA): NHANES 2011-2016. J Expo Sci Environ Epidemiol (2021) 31(2):377–85. doi: 10.1038/s41370-020-00286-1
43. Cole P, Mandel JS, Collins JJ. Acrylonitrile and cancer: a review of the epidemiology. Regul Toxicol Pharmacol (2008) 52(3):342–51. doi: 10.1016/j.yrtph.2008.09.004
44. IARC monographs on the evaluation of the carcinogenic risk of chemicals to humans: some monomers, plastics and synthetic elastomers, and acrolein. IARC Monogr Eval Carcinog Risk Chem Hum (1979) 19:1–513.
45. Goniewicz ML, Gawron M, Smith DM, Peng M, Jacob P 3rd, Benowitz NL. Exposure to nicotine and selected toxicants in cigarette smokers who switched to electronic cigarettes: a longitudinal within-subjects observational study. Nicotine Tob Res (2017) 19(2):160–7. doi: 10.1093/ntr/ntw160
46. Xie MZ, Liu JL, Gao QZ, Bo DY, Wang L, Zhou XC, et al. Proteomics-based evaluation of the mechanism underlying vascular injury via DNA interstrand crosslinks, glutathione perturbation, mitogen-activated protein kinase, and wnt and ErbB signaling pathways induced by crotonaldehyde. Clin Proteomics (2022) 19(1):33. doi: 10.1186/s12014-022-09369-7
47. Boldry EJ, Patel YM, Kotapati S, Esades A, Park SL, Tiirikainen M, et al. Genetic determinants of 1,3-butadiene metabolism and detoxification in three populations of smokers with different risks of lung cancer. Cancer Epidemiol Biomarkers Prev (2017) 26(7):1034–42. doi: 10.1158/1055-9965.EPI-16-0838
48. Kirman CR, Albertini RJ, Sweeney LM, Gargas ML. 1,3-butadiene: i. review of metabolism and the implications to human health risk assessment. Crit Rev Toxicol (2010) 40 Suppl 1:1–11. doi: 10.3109/10408444.2010.507181
49. Sielken RL Jr., Valdez-Flores C. A comprehensive review of occupational and general population cancer risk: 1,3-butadiene exposure-response modeling for all leukemia, acute myelogenous leukemia, chronic lymphocytic leukemia, chronic myelogenous leukemia, myeloid neoplasm and lymphoid neoplasm. Chem Biol Interact (2015) 241:50–8. doi: 10.1016/j.cbi.2015.06.009
50. Penn A, Snyder CA. 1,3-butadiene exposure and cardiovascular disease. Mutat Res (2007) 621(1-2):42–9. doi: 10.1016/j.mrfmmm.2006.12.011
51. Li MJ, Zeng T. The deleterious effects of N,N-dimethylformamide on liver: a mini-review. Chem Biol Interact (2019) 298:129–36. doi: 10.1016/j.cbi.2018.12.011
52. Liu H, Li MJ, Zhang XN, Wang S, Li LX, Guo FF, et al. N,N-dimethylformamide-induced acute liver damage is driven by the activation of NLRP3 inflammasome in liver macrophages of mice. Ecotoxicol Environ Saf (2022) 238:113609. doi: 10.1016/j.ecoenv.2022.113609
Keywords: volatile organic chemicals, rheumatoid arthritis, public health, environment pollution, national health and nutrition examination survey
Citation: Lei T, Qian H, Yang J and Hu Y (2023) The exposure to volatile organic chemicals associates positively with rheumatoid arthritis: a cross-sectional study from the NHANES program. Front. Immunol. 14:1098683. doi: 10.3389/fimmu.2023.1098683
Received: 15 November 2022; Accepted: 05 June 2023;
Published: 19 June 2023.
Edited by:
Stefan Tukaj, University of Gdansk, PolandReviewed by:
Zheng Guo, Tangdu Hospital, ChinaChristine Gibson Parks, National Institute of Environmental Health Sciences (NIH), United States
Copyright © 2023 Lei, Qian, Yang and Hu. This is an open-access article distributed under the terms of the Creative Commons Attribution License (CC BY). The use, distribution or reproduction in other forums is permitted, provided the original author(s) and the copyright owner(s) are credited and that the original publication in this journal is cited, in accordance with accepted academic practice. No use, distribution or reproduction is permitted which does not comply with these terms.
*Correspondence: Yihe Hu, aHV5aWhlX3pqdUAxNjMuY29t; Junxiao Yang, eWFuZ2p4X3h5eXlAMTYzLmNvbQ==