
94% of researchers rate our articles as excellent or good
Learn more about the work of our research integrity team to safeguard the quality of each article we publish.
Find out more
ORIGINAL RESEARCH article
Front. Immunol., 19 January 2023
Sec. Cancer Immunity and Immunotherapy
Volume 14 - 2023 | https://doi.org/10.3389/fimmu.2023.1078118
This article is part of the Research TopicThe Immunosuppressive Tumor Microenvironment and Strategies to Revert its Immune Regulatory Milieu for Cancer ImmunotherapyView all 15 articles
 Danlin Yao1,2†
 Jing Lai3†
 Yuhong Lu3†Jun Zhong3
 Xianfeng Zha4†Xin Huang5
 Lian Liu1Xiangbo Zeng1†
 Shaohua Chen1†
 Jianyu Weng5
 Xin Du5
 Yangqiu Li1*†
 Ling Xu1*†
Background: Immunological phenotypes and differentiation statuses commonly decide the T cell function and anti-tumor ability. However, little is known about these alterations in CML patients.
Method: Here, we investigated the immunologic phenotypes (CD38/CD69/HLA-DR/CD28/CD57/BTLA/TIGIT/PD-1) of T subsets (TN, TCM, TEM, and TEMRA) in peripheral blood (PB) and bone marrow (BM) from de novo CML patients (DN-CML), patients who achieved a molecular response (MR) and those who failed to achieve an MR (TKI-F) after tyrosine kinase inhibitor (TKI) treatment using multicolor flow cytometry.
Results: CD38 or HLA-DR positive PB CD8+TN and TCM cells decreased in the DN-CML patients and this was further decreased in TKI-F patients. Meanwhile, the level of PD-1 elevated in CD8+ TEM and TEMRA cells from PB in all groups. Among BM sample, the level of HLA-DR+CD8+TCM cells significantly decreased in all groups and CD8+TEMRA cells from TKI-F patients exhibited increased level of TIGIT and CD8+ tissue-residual T cells (TRM) from DN-CML patients expressed a higher level of PD-1 and TIGIT. Lastly, we found a significantly decreased proportion of CD86+ dendritic cells (DCs) and an imbalanced CD80/CD86 in the PB and BM of DN-CML patients, which may impair the activation of T cells.
Conclusion: In summary, early differentiated TN and TCM cells from CML patients may remain in an inadequate activation state, particularly for TKI-F patients. And effector T cells (TEM, TEMRA and TRM) may be dysfunctional due to the expression of PD-1 and TIGIT in CML patients. Meanwhile, DCs cells exhibited the impairment of costimulatory molecule expression in DN-CML patients. Those factors may jointly contribute to the immune escape in CML patients.
Chronic myeloid leukemia (CML) is a hematological tumor driven by the BCR-ABL1 fusion protein, which constitutively activates tyrosine kinases. This activation leads to the accumulation of immature granulocytes and their progenitors in peripheral blood (PB) and bone marrow (BM). The advent of tyrosine kinase inhibitors (TKIs) has transformed CML into a chronic disease. Most patients achieve a life expectancy close to that of the general population (1–5). However, some patients do not have an optimal response in the initial stage of TKI treatment or lose a previously achieved hematological, cytogenetic, or molecular response during TKI treatment. These patients are identified as failing response to TKIs (TKI-F) and frequently develop into the accelerated phase (AP) or blast crisis (BC) phase, leading to poor prognosis (6–8). Additionally, due to the side effects and costs of TKIs, many CML patients who achieve major molecular remission (MMR) are eager to withdraw from the drug. Currently, studying the immune system changes in those patients before and after TKI treatment may provide more information for solving their problems.
T cells play an integral role against pathogens and clear tumor cells. During the immune process, naïve T (TN) cells recognize pathogens presented by dendritic cells (DCs) and accept activation signals by binding the costimulatory ligand CD80 or CD86 on DCs. TN cells further differentiate into effector memory T cells (TEM)/CD45RA+ effector memory T cells (TEMRA) to clear antigens. Once pathogens were cleared, most activated T cells experienced apoptosis and a minority of survival effector T cells becomes central memory T cells (TCM) cells. Afterward, TCM cells provide immediate protection when re-infected and ultimately persist for a lifetime (9–13). Thus, the different differentiated status of the T cell subsets partially indicates the function of T cells. Recently, increasing evidence has indicated that the immunological status of T cell subsets provides better prognostication than CD4+ or CD8+ T cells in cancer patients, e.g., AML patients who express a higher percentage of PD-1+Tim3+CD8+ TCM cells are prone to relapse, and the prognosis of breast cancer patient with a higher number of CD8+ tissue residual memory T (TRM) cells was better (14, 15).
Indeed, accumulating evidence has proven that CML patients undergo several phenotypic and functional aberrations in the immune system, and this phenomenon is applicable to CML patients who at diagnosis, achieve MMR on TKI therapy and even at treatment-free remission (16–20). It’s well known that the activation and proliferation of T cells are impaired due to the lower expression of CD3ζ and higher expression of immune checkpoints (ICs) (18, 21, 22). However, most studies only focused on total CD8+ or CD4+ T cells, and exploration of the immunophenotypes of T cell subsets remains limited for CML patients, particularly TKI-F patients. Additionally, BM is the origin and natural shelter for leukemia cells. Moreover, the BM accumulates immunosuppressive cells, including regulatory T (Treg) cells, myeloid-derived suppressor cells (MDSCs), and plasmacytoid DC that inhibit the anti-tumor response of T cells (23–27). These characteristics make the BM microenvironment (BMM) similar to the immunologic microenvironment of solid tumors. Hence, intensive study of the immunophenotypic characteristics of the T cell subsets driven by the leukemia BMM is critical for providing effective immunotherapy for CML patients.
Here, we used flow cytometry to assay the expression of the activation markers CD38, CD69, and human leukocyte antigen – DR isotype (HLA-DR), the IC molecules programmed death-1 (PD-1), B, and T lymphocyte attenuator (BTLA), and T cell immunoglobulin and ITIM domain (TIGIT), the co-stimulation marker CD28, and the immune senescence marker CD57 on different T cell subsets in PB and BM from CML patients. We categorized CML patients into different statuses according to the level of BCR-ABL1 and TKI-treatment response: de novo CML (DN-CML: BCR-ABL1 > 10%), molecular remission (MR: BCR-ABL1 < 10%), and TKI-F. The TKI-F patients were identified as CML patients who failed to achieve a molecular response (TKI-F, BCR-ABL1 > 10%) with regular oral administration of first or second-generation TKIs after 3 months. Finally, we describe the T cell costimulatory molecules CD80 and CD86 on DCs in the CML groups.
PB samples were obtained from DN-CML (n = 16), TKI-F (n = 9), and MR (n = 20) patients. BM aspirate samples were extracted from 23 cases, including 11 newly diagnosed patients, 6 at MR, and 6 at TKI-F. PB samples were obtained from healthy individuals (HIs; n =12), BM aspirate samples from hematopoietic stem cell transplantation (HSCT) donors (n = 6) and patients with iron-deficiency anemia (n = 3) were collected as control. All MR patients achieved complete hematologic response (CHR) with BCR/ABL < 10% after TKI treatment. In addition, previous studies have found that the immunologic characteristics of T cells in CML patients varied with different molecular remission levels (18). The MR patients were further divided into 2 groups according to the BCR/ABL1 level. MMR patients (n = 10) with a level ≤ 0.1% and pre-MMR (n = 10) representing the period before MMR was achieved with a BCR-ABL1 transcript level > 0.1% and < 10%. The TKI-F were patients with BCR/ABL1 > 10% consistently after regular 12-month TKI treatment. Sample data are shown in Tables 1, 2. Detailed sample information of TKI-F patients are shown in Table 3.
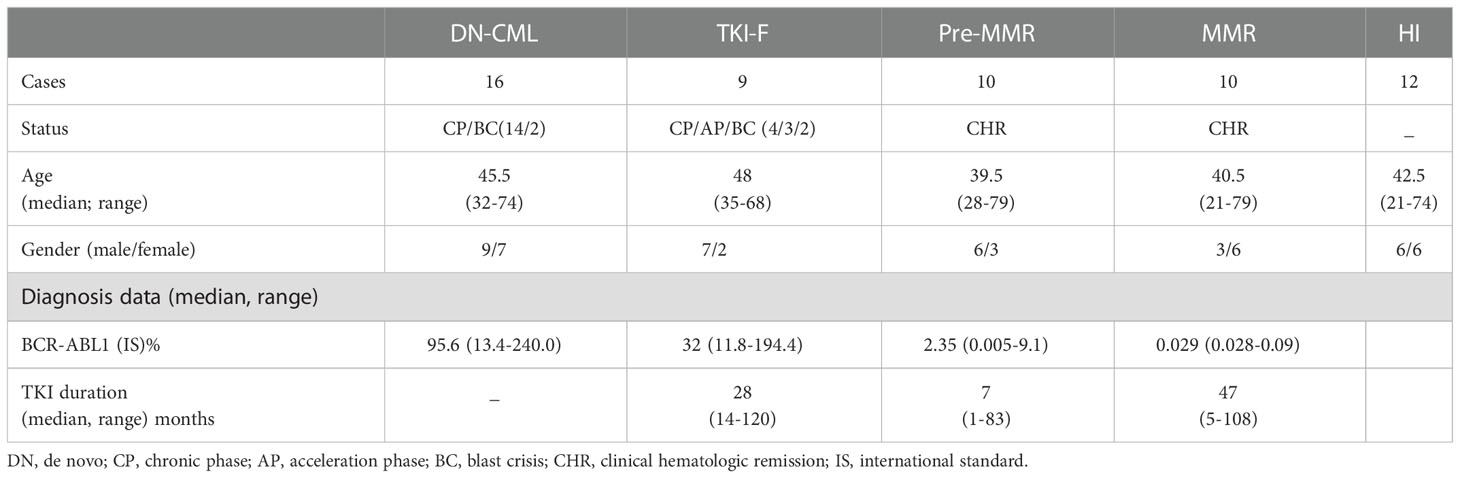
Table 1 Peripheral blood sample characteristics.
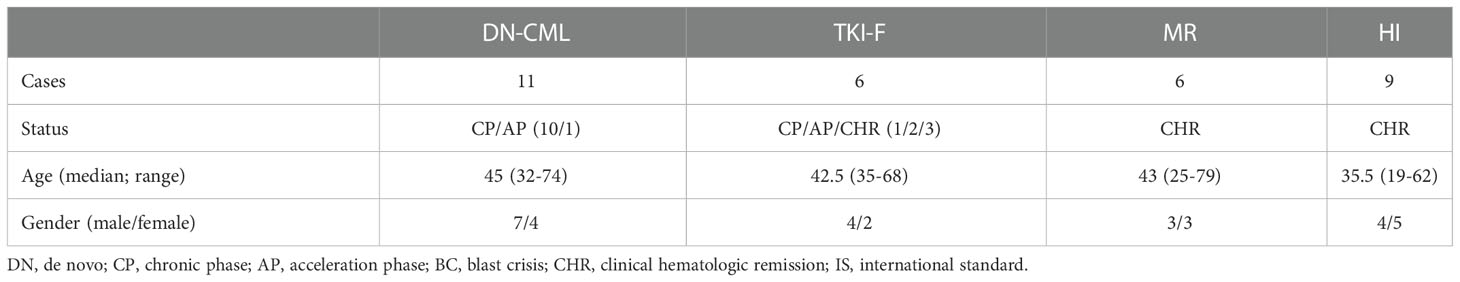
Table 2 Bone marrow sample characteristics.
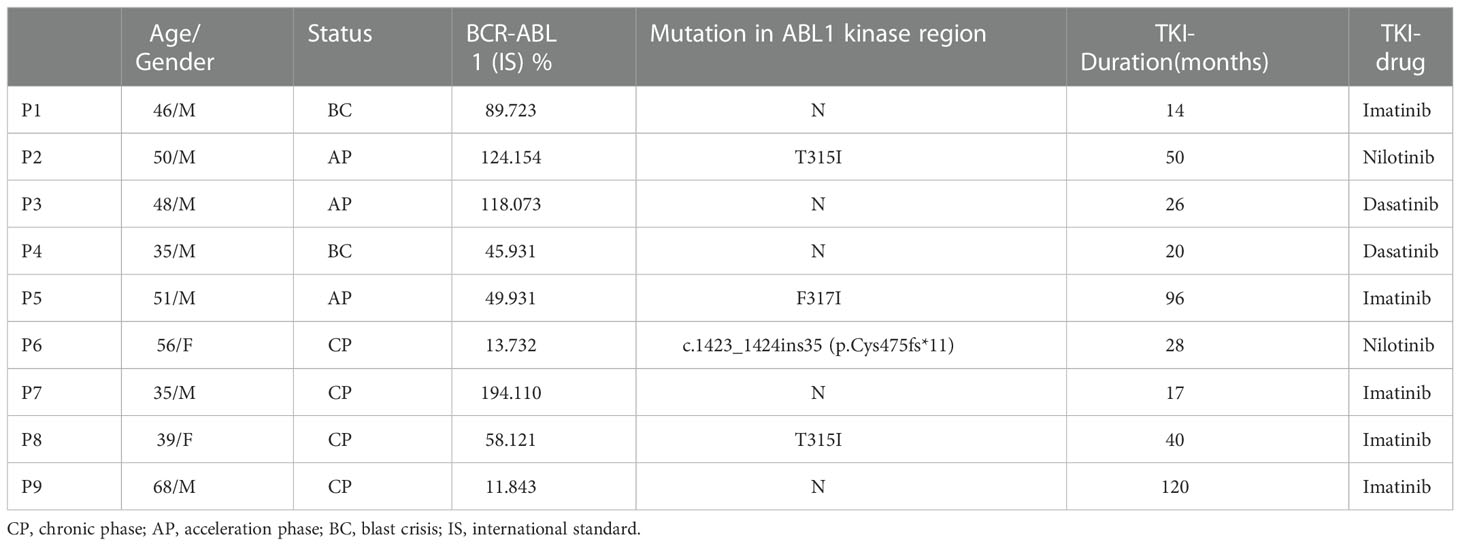
Table 3 TKI-F PB sample characteristics.
PB and BM samples were collected in EDTA tubes. First, 150 µl of PB or BM aspirate was incubated with CCR7-BV421 for 15 min in the dark at 37°C. Then, the samples were incubated with multiple premixed fluorescence antibodies for 20 min in the dark at room temperature. The final volume was 200 µl. T cells subsets and surface antibodies staining were performed in two 11-color panels including the following antibodies. CD45-BUV395 (clone HI30, BD) was used to identify CD45high cells which can rule out tumor cells. CD3-AF700 (clone UCHT1, BD), CD4-APC-H7 (clone RPA-T4, BD), CD8-APC-H7 (clone SK1, BD), CD45RA-Percp-cy5 (clone HI100, Biolegend), CCR7-BV605 (clone 3D12, BD) and CD69-PE-cy7 (clone FN50, BD) were used to identify CD4+ or CD8+ T subsets. CD38-APC (clone HIT2, BD), BTLA-PE-CF594 (clone J168-540, BD), TIGIT-BV421 (clone A15153G, Biolegend) and CD28-BB515 (clone CD28.2, BD) were used in Tube 1, CD57-APC (clone NK-1, BD), PD-1-BV421 (clone EH12.2H7, Biolegend), and HLA-DR-PE-CF594 (clone G46-6, BD) were used in Tube 2. DCs cells and surface antibodies staining were performed in 5-color panels including the following antibodies. CD45-BUV395 (clone HI30, BD), HLA-DR-PE-CF594 (clone G46-6, BD), Lin-FITC (CD3, CD14, CD16, CD20, CD56, cat:340546, BD), CD80-PE (clone L307.4, BD), CD86-PE-cy7 (clone FUN-1, BD). The samples were lysed using lysis buffer (BD; Cat: 555899) for 15-20 min and washed and suspended in phosphate buffer saline (PBS). Finally, 20 µl of absolute count microsphere (Thermos; Cat: C36950) were added to the samples to calculate the absolute number of cells. A minimum of 20,000 CD3+ T cells and 2000 DC cells were acquired by flow cytometry (FACS Fortessa, BD Bioscience) and analyzed using Flowjo 10.6. FCS.
All data were represented as medians, and differences between every two groups were analyzed by the Mann-Whitney U test. The statistical analysis and figure generation were performed using GraphPad Prism version 8.02 software. Significance is indicated as P < 0.05.
The gating strategy for identifying the CD4+ and CD8+ T cells and their phenotypic characteristics was shown in Figure 1A. We first identified the absolute number of CD3+, CD4+, and CD8+ T cells in PB and BM in each CML group and found that there was a slightly increased trend for CD3+ T cells (1,133 cells/μl vs 2,064 cells/μl, P = 0.0883) and a significant increase in CD8+ T cells in the PB of DN-CML patients compared with HIs (368 cells/μl vs 1,581 cells/μl, P = 0.0178) (Figure 1B). In the BM, CD3+ (616 cells/μl vs 1320 cells/μl P = 0.0015), CD4+ (301 cells/μl vs 671 cells/μl, P = 0.0117), and CD8+ (210 cells/μl vs 507 cells/μl, P = 0.0005) T cells were all significantly increased in DN-CML patients compared with HIs (Figure 1C). No significant differences were observed between other CML groups and HIs.
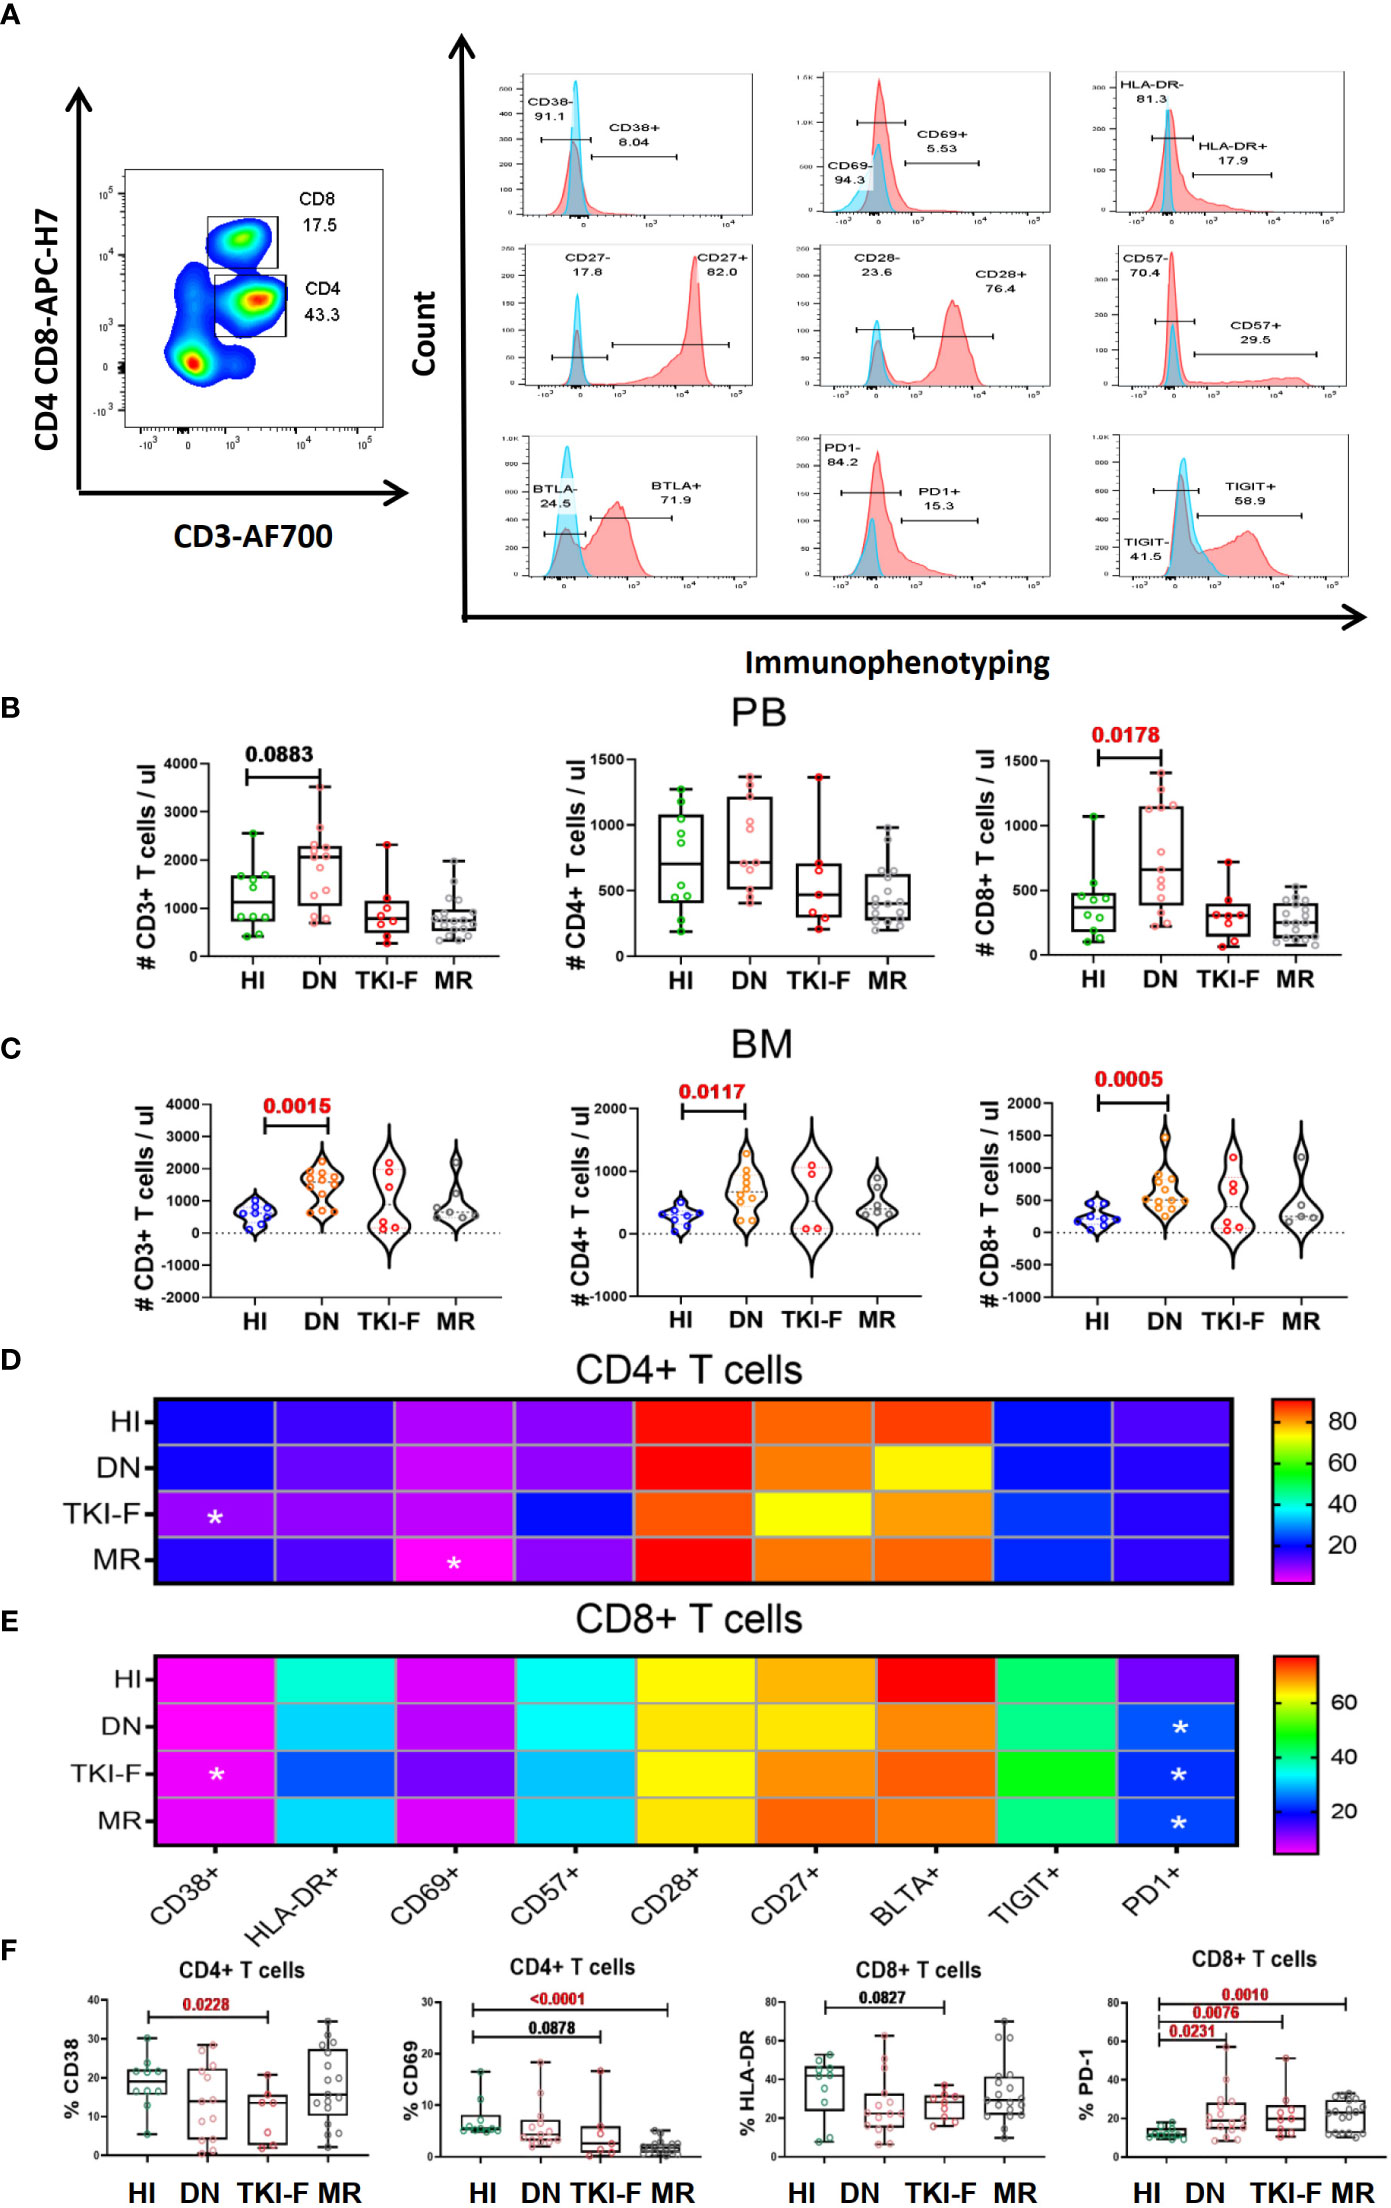
Figure 1 TKI-F patients exhibit a lower level of the activation markers CD38 and CD69 on CD4+ T cells and HLA-DR on CD8+ T cells, and the exhaustion marker PD-1 increased on PB-CD8+ T cells in all CML groups. (A) The top figure shows the gating strategy for CD38, CD69, HLA-DR, CD28, CD57 BTLA, TIGIT, and PD-1 in the CD4+ and CD8+ populations by flow cytometry. The absolute number of CD3+, CD4+, and CD8+ T cells in the PB and BM (B, C) The darkness of the color represents the mean frequency of a single immune marker on CD4+ (D) and CD8+ (E) T cells in PB from HIs and DN-CML, TKI-F, and MR patients. The asterisk (*) represents a significant alteration in CML patients compared with HIs. (F) The proportion of CD38+CD4+, CD69+CD4+, HLA-DR+CD8+, and PD-1+CD8+ in PB from HIs and DN-CML, TKI-F, and MR patients. HIs-PB (CD4, n = 12, CD8, n = 12), DN-CML-PB (CD4, n = 12, CD8, n = 16), TKI-F-PB (CD4, n = 7, CD8, n = 9), and MR-PB (CD4, n = 17, CD8, n = 20). The P values shown are from the Mann-Whitney U test between groups.
Next, we compared the expression of CD38, CD69, HLA-DR, CD28, CD57, BTLA, TIGIT, and PD-1 on the CD4+ and CD8+ T subsets in PB for each CML group. The results demonstrated that the expression of the activation marker CD38 on the CD4+ T subset was significantly decreased in TKI-F patients compared with HIs (19.6% vs 10.5%, P = 0.0020) (Figures 1D and F), while the level of CD69 and HLA-DR also showed a decreasing trend on the CD4+ and CD8+ T subset respectively (Figure 1F). These alterations suggest that the activation capacity of CD4+ and CD8+ T cells from TKI-F patients may be impaired. In addition, a lower level of CD69+CD4+ T cells (5.46% vs 1.89%, P < 0.0001) was found in MR patients compared to HIs (Figures 1D, F). For the exhausted and senescent molecular expression pattern, we found that the level of PD-1+CD8+ T cells was significantly increased in DN-CML (25.3% vs 16.5%, P = 0.0231), TKI-F (24.6% vs 16.5%, P = 0.0076), and MR (23.8% vs 16.5%, P = 0.0016) patients when compared with HIs (Figure 1F).
To further understand the immunophenotypic alterations in each T cell subset. We divided the CD4+ and CD8+ T cells into TN (CD45RA+CCR7+), TCM (CD45RA-CCR7+), TEM (CD45RA+CCR7-), and TEMRA (CD45RA-CCR7-) subsets based on CD45RA and CCR7 expression. We compared activated/inhibitory/senescent phenotypic characteristics of each subset in the PB of the patient groups and HIs. The gating strategy is shown in Figure 2A. To exhibit the differences of a single marker in the T cell subsets, the fold change (FC) of the mean value between each CML group and HIs was shown in volcano figures (Figures 2B-E). We found that the expression of the activation markers CD38, CD69, and HLA-DR decreased on TN and TCM subsets in DN-CML patients and further decreased in TKI-F patients. Moreover, these abnormalities gradually restored to normal levels at the time of remission. The detailed expression characteristics of each group were shown in Supplementary Figure 1. Unlike TN and TCM, which exhibit a lower level of activation markers, the TEM and TEMRA subsets mainly demonstrate increased expression of PD-1 in the PB of the CML patient groups. (Figures 2B-E). We further compared PD-1 expression on TEM and TEMRA cells between the CML patients and HIs. The percentage of PD-1+CD4+ TEM cells significantly increased in DN-CML (31.54%, P = 0.0032), TKI-F (35.47%, P = 0.0026), and Pre-MMR (31.7%, P = 0.0044) patients compared to HIs (21.2%). No significant difference was observed in the CD4+ TEMRA subset between CML patients and HIs. Similarly, the proportion of PD1+CD8+ TEM cells increased in DN-CML (41.90%, P = 0.0006), TKI-F (33.28%, P = 0.0101), Pre-MMR (33.75%, P = 0.0039), and even MMR (29.56%, P = 0.0101) patients compared with HIs (20.08%). In addition, the level of PD-1+CD8+ TEMRA significantly increased in DN-CML (16.57%, P = 0.0083), TKI-F (18.73%, P = 0.0019), and Pre-MMR (17.32%, P = 0.0052) patients but returned to a normal level in some MMR patients (15.27%, P = 0.3686) when compared with HIs (7.94%) (Figure 2F).
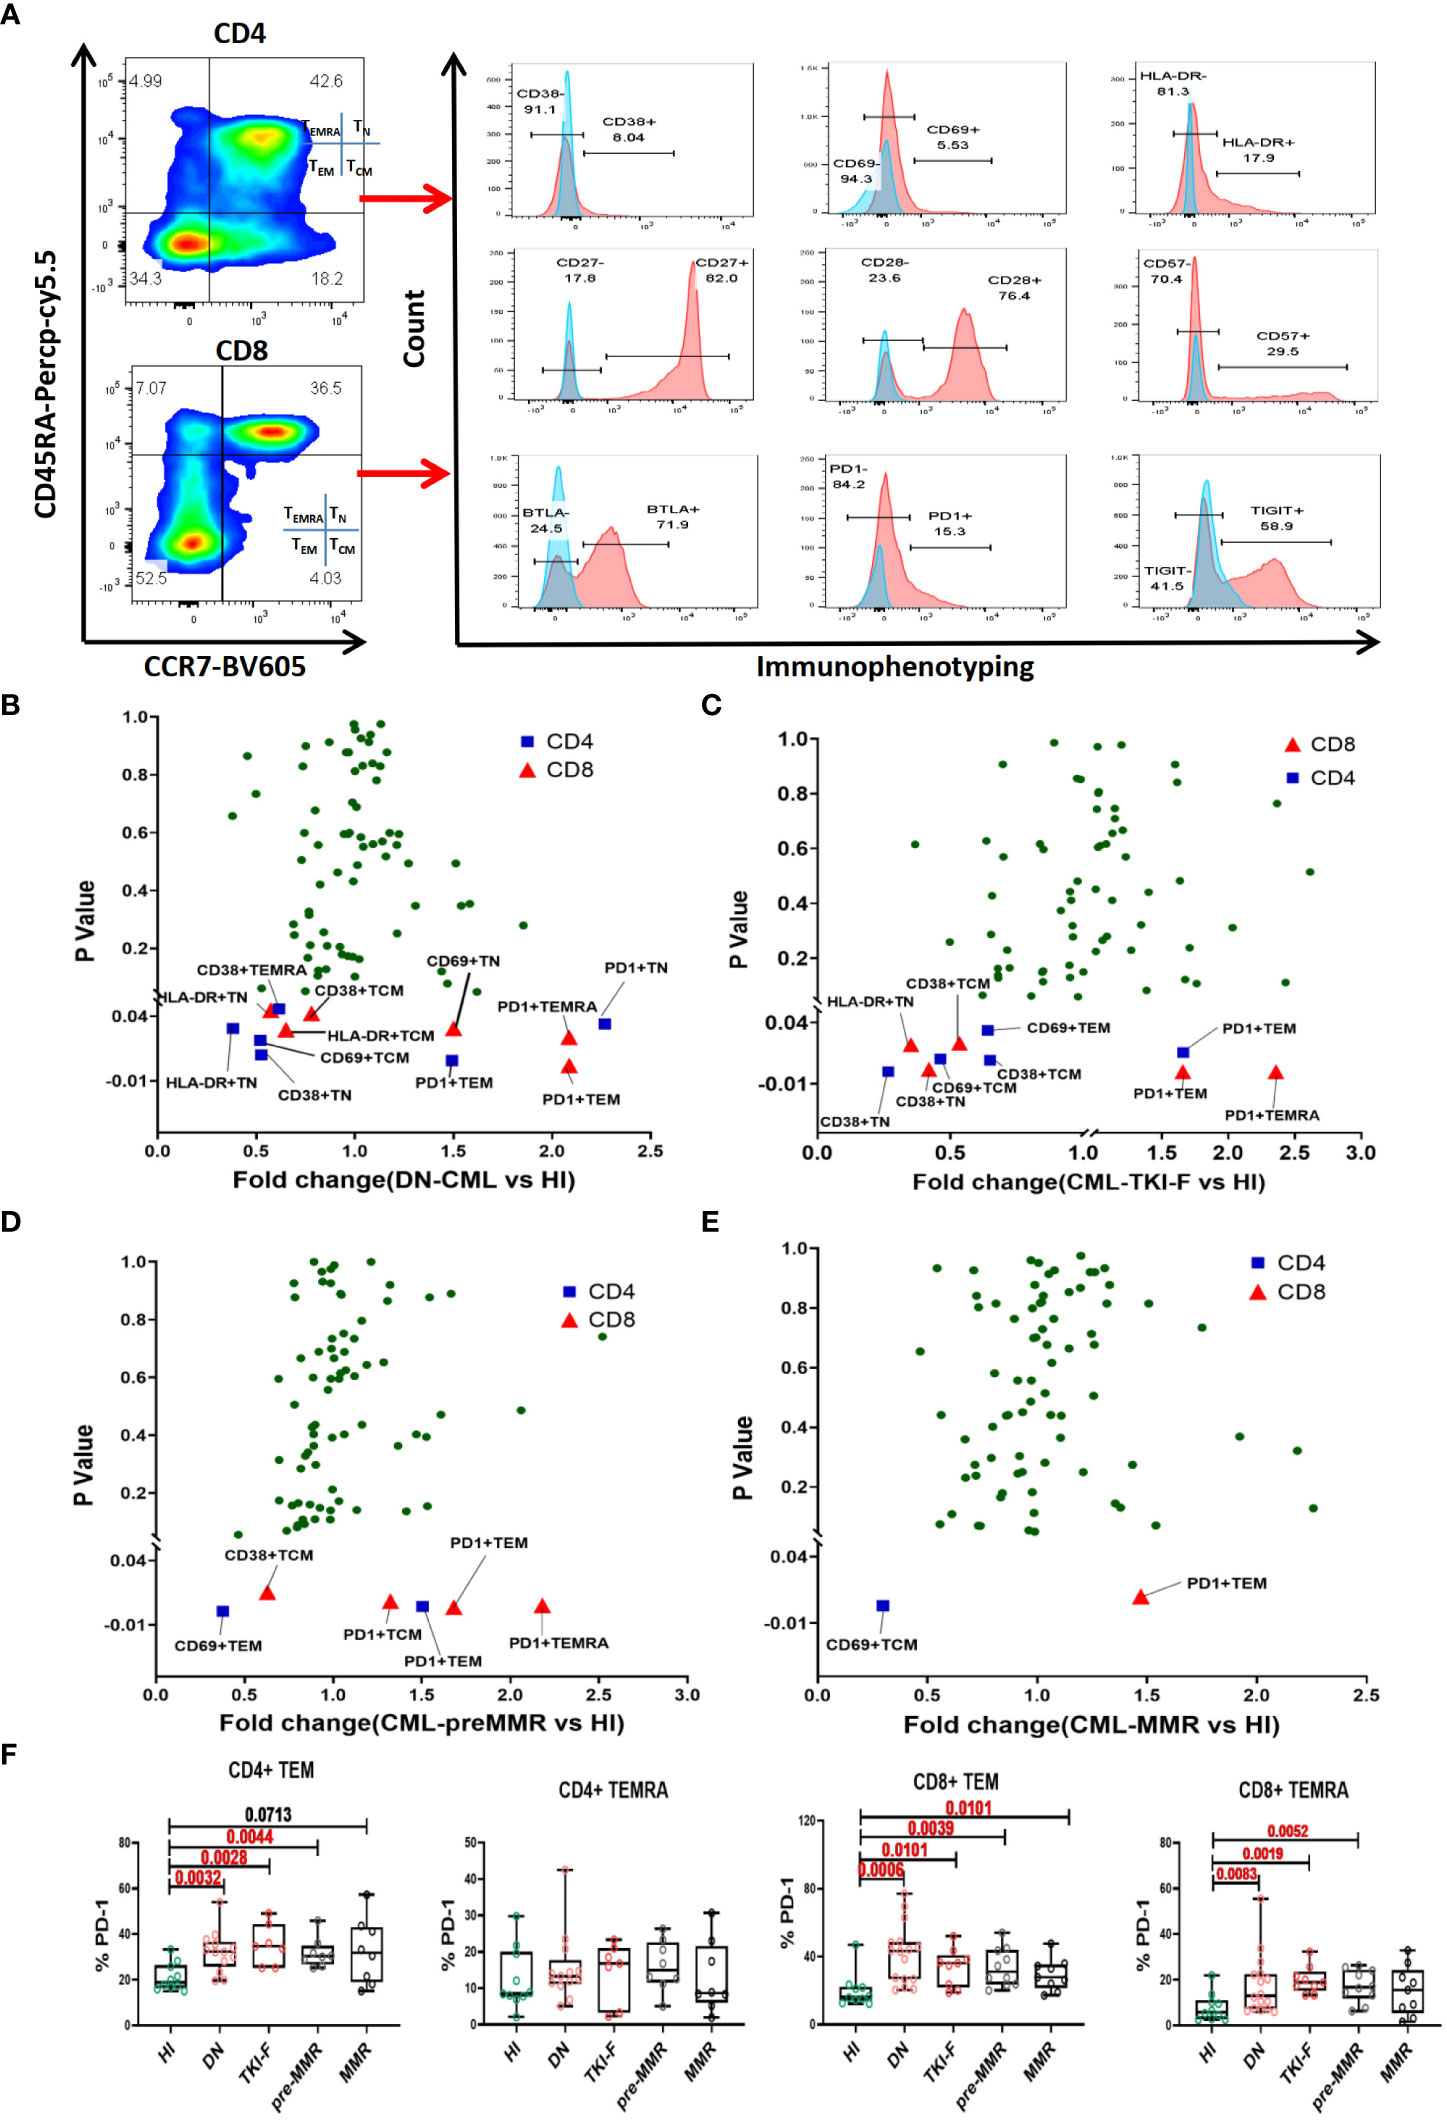
Figure 2 The abnormal immunophenotype of PB T cell subsets distributed in DN-CML and TKI-F patients gradually returning to normal in pre-MMR and MMR groups. (A) Gating strategy for the CD4+ and CD8+ T cells subsets in one HI. CD45RA and CCR7 were used to divide the T cells into TN (CD45RA+CCR7+), TCM (CD45RA-CCR7+), TEM (CD45RA-CCR7-), and TEMRA (CD45RA+CCR7-) cells. The proportion of the T cell subset single-marker immunophenotypes in HIs and DN-CML (B), TKI-F (C), pre-MMR (D), and MMR (E) patients were compared (Mann-Whitney U test). The P-value plotted on the vertical axis of volcano figure. Immunologic characteristics with the mean percentage of fold change (FC) > 1 are enriched in CML patients, and FC < 1 was more frequent in HIs. The blue and red points respectively represent CD4+ and CD8+ T cells. (F) The frequency of PD-1 on CD4+ TEM, CD4+ TEMRA, CD8+ TEM, and CD8+ TEMRA cells in PB from HIs and DN-CML, TKI-F, pre-MMR, and MMR patients. HIs-PB (CD4, n = 10, CD8, n = 10), DN-CML-PB (CD4, n = 13, CD8, n = 16), TKI-F-PB (CD4, n = 7, CD8, n = 9) and MR-PB (CD4, n = 18, CD8, n = 20). The P values shown are from the Mann-Whitney U test between groups.
The immunosuppressive BMM protects malignant hematopoietic stem cells from immunological surveillance, which may contribute to leukemia relapse (23). We examined the expression of each marker on BM CD8+ T cells and subsets. The results revealed no significant difference in the expression of each of the above markers on total CD8+ T cells between each CML group and HIs. However, when looking at the subset level, we found a significantly decreased level of HLA-DR+CD8+TCM in DN-CML (36.75% vs 12.40%, P = 0.0462) and a further decrease in TKI-F (36.75% vs 6.71%, P = 0.0087) and MR (37.75% vs 5.20%, P = 0.0082) patients compared to the control group. For other markers, only an increased percentage of TIGIT+CD8+ TEMRA (42.60% vs 75.45%, P = 0.0256) was observed in TKI-F patients (Supplementary Figure 2).
With the exception of the classic memory T cell subsets, we also examined the expression of the above markers on TRM cells, which are abundant in non-lymphoid tissues, such as skin, lung, and BM (28). TRM cells express a low level of CD45RA and lack CCR7, and CD69 is a key marker to identify TRM (CD45RA+CCR7-CD69+) from TEM cells (29). Detailed gating strategies are shown in Figure 3A and the expression of PD-1 and TIGIT in the BM of HI and CML patients were shown in Figure 3C. These results demonstrated that the number of CD8+ TRM cells increased in DN-CML patients but there was no difference in the TKI-F and MR groups compared to HIs (Figure 3B). Further, we also found a significantly increased percentage of PD-1+CD8+ TRM cells (53.50% vs 73.30%, P = 0.0409) and TIGIT+CD8+ TRM (61.40% vs 77.00%, P = 0.0465) cells in DN-CML patients compared with HIs (Figure 3D).
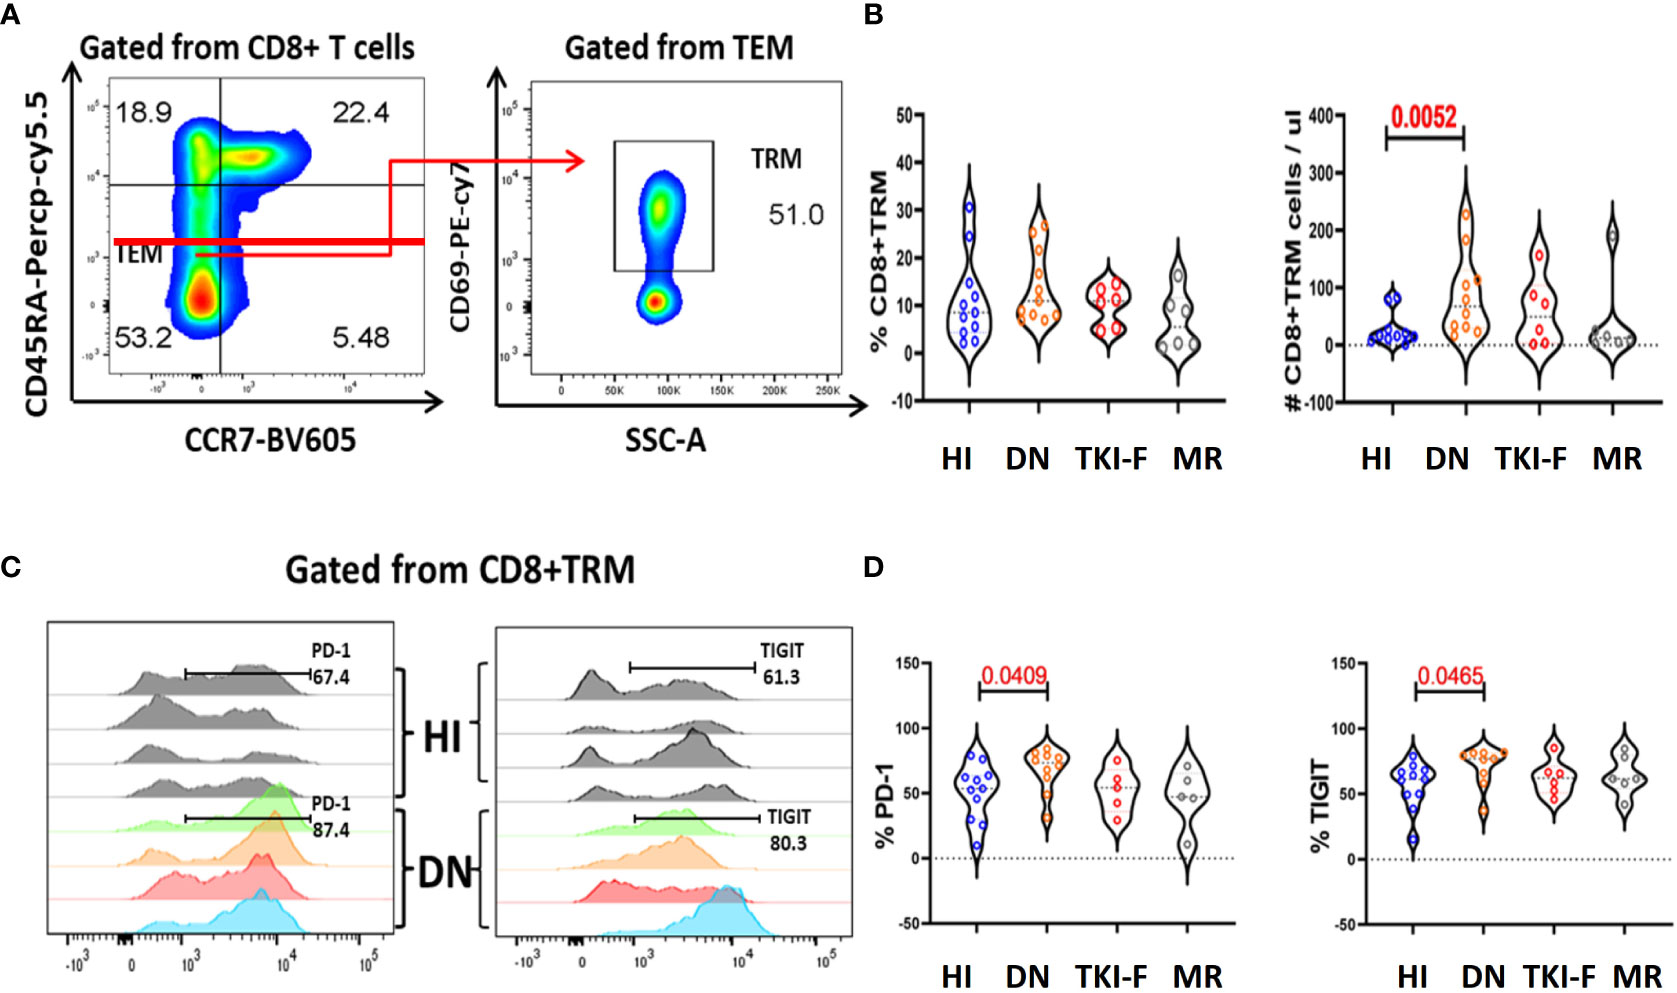
Figure 3 The absolute numbers of CD8+TRM cells increased in the BM of DN-CML patients while accompanied by an elevated expression of PD-1 and TIGIT. (A) Gating strategies to indicate the TRM cells. CD45RA- and CCR7- were used to identify the TEM subsets and then TRM cells were further gated by CD69 expression. (B) The percentage and absolute number of CD8+TRM cells in HIs, DN-CML, TKI-F, and MR patients. (C) Flow-cytometry analysis detected the frequency of PD-1+CD8+ TRM (left) and TIGIT+CD8+ TRM (right) in HIs (top: n = 4) and DN-CML (below: n = 4). (D) Increased proportion of PD-1 (left) and TIGIT (right) on CD8+ TRM cells in BM from HIs (n = 10) and DN-CML (n = 10), TKI-F (n = 6), and MR (n = 6) patients. The P values shown are from the Mann-Whitney U test between groups.
DCs can provide costimulatory signals driven by the molecules CD80 and CD86 to induce T cell activation and functional differentiation. Here, we identified DCs (HLA-DR+Lin-) from the CD45high population aiming to eliminate the interference from leukemia cells. Next, we analyzed the expression of CD80 and CD86 on DCs, and detailed gating strategies are presented in Figure 4A. The results show that the percentage of CD86+ DCs decreased in PB (41.2% vs 21.5%, P = 0.0011) and BM (30.9% vs 12.45%, P = 0.0207) of DN-CML patients compared to controls. Previous studies have reported that DCs expressing a normal level of CD80 and lower CD86 act as immature DCs. We further assayed CD80 and CD86 on T cells in the CML groups and HIs. The result demonstrated a significantly decreased ratio of CD80/CD86 both in the PB (0.42 vs 0.90, P = 0.0173) and BM (0.19 vs 0.36, P = 0.0650) of DN-CML patients, and 5 patients had an inverse ratio. Additionally, the CD86 expression and CD80/CD86 ratio could return to a normal level after TKI treatment (Figures 4B, C).
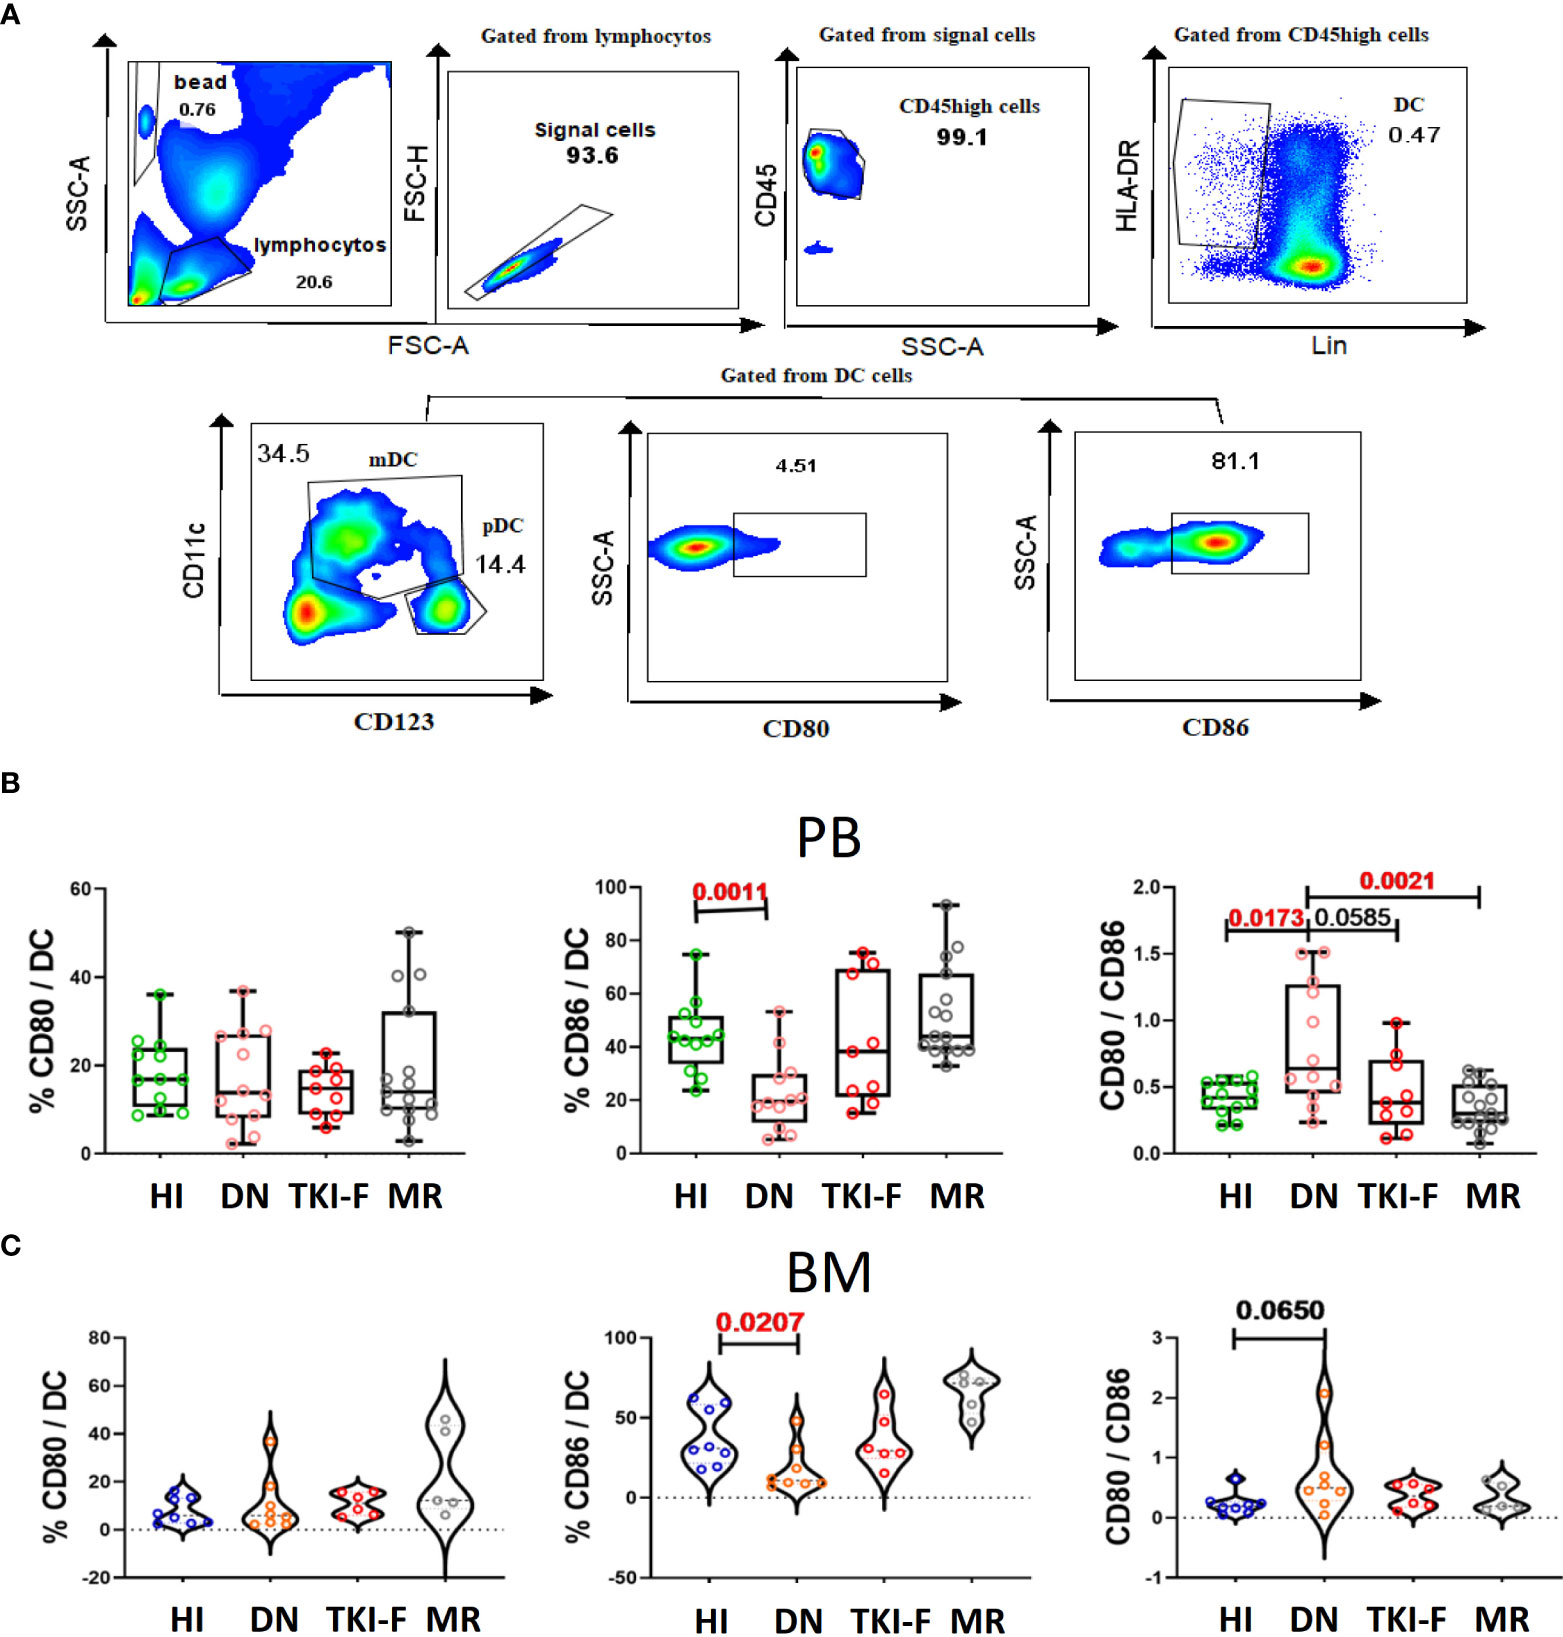
Figure 4 PB and BM DCs cells from DN-CML patients express a lower percentage of CD86 and with an unbalance CD80/CD86 ratio. (A) Gating strategy to identify DCs cells and the expression of CD80/CD86 on DCs cells. The CD45high population was used to eliminate immature cells, and then HLA-DR+ and Lin- (CD3, CD19, CD56, CD14 and CD16) was used to identify that DCs. CD80+ and CD86+ were further used to gate CD80+ DCs and CD86+ DCs cells. (B) The frequency of CD80+ DC, CD86+ DC, and CD80/CD86 ratio in PB (B) and BM (C) of HIs (PB, n = 12, BM, n = 8) and DN-CML (PB, n = 12, BM, n = 8), TKI-F (PB, n = 9, BM, n = 6), and MR (PB, n = 17, BM, n = 5) patients. The P values shown are from the Mann-Whitney U test between groups.
Our previous study found that memory T cell subset distribution skewed toward a terminally differentiated status in DN-CML patients and restore in MR-CML patients, suggesting that the T cell subset distribution might be important for inducing and maintaining remission in CML patients (30). In this study, we further found that the immunophenotype of the T cell subsets (TN, TCM, TEM, TEMRA, TRM) was associated with the disease status and location. On the level of the total CD4+ and CD8+ population, we only found a few function markers or even no markers were changed in the PB and BM of patients respectively, however, further analysis of the T cell subsets revealed that the markers representing the activation and proliferation (CD38, HLA-DR, and CD69) (31, 32) were decreased in the less differentiated TN and TCM subsets in the DN-CML and TKI-F patients, while gradually recovered in the pre-MMR and MMR patients. In addition, the higher expression of PD-1 on peripheral CD8+ T cells detected in all the patients treated with TKI, especially for TKI-F patients, this consistent with recent research that a higher percentage of PD-1 detected on CD4+, CD8+ and Treg cells in CML patients resistant to TKI (33), however, on the level of T cell subsets, we can see that the percentage of PD-1 high expression T cell subsets mainly decreased in the patients who achieved MMR but not in TKI-F and Pre-MMR patients. Those results indicated that dynamic monitoring of the changes of these immune phenotypes in the level of T cell subsets may help to predict the effects and outcomes after TKI treatment.
PD-1 and TIGIT are two classic IC receptors that negatively modulate T-cell responsiveness and limit T-cell activation during antigen exposure (34–36). Consistent with previous studies, our results also demonstrated that the level of PD-1+CD8+ T cells increased in the PB but not BM of DN-CML patients (18, 37), but taking a close look at the subsets, we found that CD8+ TEM and TEMRA subsets were mainly impaired, while the CD4+ TEM also affected. In the BM T cell subsets, the higher TIGIT expression was only found in the CD8+ TEMRA subset in the TKI-F group but not in the total CD8+ level. TEM and TEMRA are the main effector subsets contributing to quickly clearing pathogens. The increased expression of PD-1 and TIGIT on these two subsets may attenuate their anti-leukemia function. A clinical trial aiming to improve the MMR ratio for TKI-F patients by adding anti-PD-1 nivolumab/pembrolizumab to TKI inhibitors has been completed, however, approximately 40% of the patients still were TKI treatment failed (NCT#02011945). Our data may help to discover more precise anti-leukemia immune therapy by focusing on studying the pathologic mechanism of the dysfunction of TEM and TEMRA subsets in the future.
Except for the classical memory T cell subsets, TRM is a specific memory T cell located in unique tissue and organs, which provides a lifelong immune protective effect to the regional tissue (28, 38, 39). Increasingly studies have found that the quantity and quality of TRM cells are critical targets for immunotherapeutic modulation and prognostic outcomes in tumor (14). However, there are still no reports that describe CD8+ TRM alterations in the BM of CML patients. Here, we first time found that the number of CD8+ TRM cells is significantly increased in the BM of DN-CML patients accompanied by a higher expression of TIGIT and PD-1, however, patients who received TKI treatment not shown the same pattern. This result indicates that BM TRM cells from DN-CML patients may be impaired by the leukemia cell. Further study of the function of CD8+ TRM cells from the BM of DN-CML patients and looking for the BM microenvironment mechanisms which lead to this result may help to understand more immune dysfunction mechanisms during the development of CML.
For the proper functioning of T cells, the co-stimulatory signal provided by DCs is an essential determinant. Through interaction with CD80 and CD86 on the DC surface, CD28 modulates T cell proliferation, differentiation, survival, and cytokine secretion (40, 41). Indeed, previous studies have found that CD80 may prefer to combine with PD-L1 and CTLA-4 if CD80 had an advantage in expression (42). Several studies have found that CTLA4 expression regulatory T cells accumulated in the leukemia environment of DN-CML patients, while CML cells increased the expression of PD-L1 (18, 33, 43). Therefore, though the expression of CD28+ T cells remains at a normal level, the decreased level of CD86+ DCs and the unbalanced ratio of CD80/CD86 may also prevent the activation of T cells in DN-CML patients. Further explore the mechanism of the downregulation of CD86 on DCs cells using RNA sequencing and other methods is necessary for developing DCs related immune treatment strategies.
Here, we further observed that the early differentiated T cell subsets (TN, TCM) were inadequate activation and effector T cell subsets (TEM, TEMRA, TRM) exhibited diverse exhausted phenotypes in the PB and BM of CML patients with different disease statuses, which may impair T cells’ long-term immunological surveillance and simultaneously attenuate their ability to remove leukemia cells. Meanwhile, the DCs cells may be unable to valid stimulate T activation due to the decreased expression of CD86 and unbalanced CD80/CD86 ratio in DN-CML patients (Figure 5). These complex immune defects are worth further immune therapy strategy development. For example, immunotherapeutic methods not only need to inhibit PD-1 expression on effector T cells but also need to enhance the activation TN and TCM cells, as well as increase the co-stimulate function of DCs cells synergistically.

Figure 5 Model illustrating the immunophenotypic differences of the T cells subsets in PB and BM in HIs and CML groups. The left and right of the figure respectively show the alterations of PB and BM, and the center represents the common change in PB and BM. Blue, red, and black respectively represent alterations in DN-CML, TKI-F, and MR.
The original contributions presented in the study are included in the article further inquiries can be directed to the corresponding authors.
The studies involving human participants were reviewed and approved by Ethics Committee of the Medical School of Jinan University. The patients/participants provided their written informed consent to participate in this study. Written informed consent was obtained from the individual(s) for the publication of any potentially identifiable images or data included in this article.
LX and YQL contributed to the concept development and study design. DY, LX, LL, and XBZ performed the laboratory studies. YHL, JZ, XFZ, XH, JW and XD collected the clinical information of patients. DY and LX drafted the manuscript. SC managed the laboratory reagents and financial affairs. DY, LX and YQL helped modify the manuscript. All authors contributed to the article and approved the submitted version.
This work was supported by the [National Natural Science Foundation of China] under Grant [Nos. 82000108, 82070152, 91642111, 82293630, 82293632, 81890991], [China postdoctoral science foundation] under Grant [No. 2018M640884], [Guangdong Province Science and Technology Project] under Grant [2020A1515110310], [Guangzhou Science and Technology Project] under Grant [201803040017], and [Key Laboratory for Regenerative Medicine of Ministry of Education Project] under Grant[ZSYXM202001].
We thank the flow facility of the Biological Translational Research Institute of Jinan University as well as Yuanqing Tu, a research assistant from the Translational Research Institute of Jinan University. We also would like to thank the volunteers who donated blood to this project.
The authors declare that the research was conducted in the absence of any commercial or financial relationships that could be construed as a potential conflict of interest.
All claims expressed in this article are solely those of the authors and do not necessarily represent those of their affiliated organizations, or those of the publisher, the editors and the reviewers. Any product that may be evaluated in this article, or claim that may be made by its manufacturer, is not guaranteed or endorsed by the publisher.
The Supplementary Material for this article can be found online at: https://www.frontiersin.org/articles/10.3389/fimmu.2023.1078118/full#supplementary-material
Supplementary Figure 1 | CD4+ or CD8+ TN and TCM cells from the PB of DN-CML patients have a lower percentage of the activation markers CD38 and HLA-DR, and this is further decreased in TKI-F patients. The frequency of CD38, CD69, and HLA-DR on CD4+ TN (A), CD4+ TCM (B), CD8+ TN (C) and CD8+ TCM (D) in the PB of HIs (PB, n = 12, BM, n = 8) and DN-CML (PB, n = 12, BM, n = 8), TKI-F (PB, n = 9, BM, n = 6) pre-MMR (CD4, n = 9, CD8, n = 9), and MMR (CD4, n = 8, CD8, n = 8) patients. The P values shown are from the Mann-Whitney U test between groups. Significance is indicated as *, P < 0.05 in red.
Supplementary Figure 2 | A decreased level of HLA-DR+CD8+ TCM cells exists in all CML groups, and TKI-F patients have increased expression of the exhaustion marker TIGIT on BM CD8+ TEMRA cells. The frequency of CD38, CD69, HLA-DR, CD57, CD28, BTLA, TIGIT, and PD-1 in CD8+ T cells (A), CD8+TN (B), CD8+TCM (C), CD8+TEM and CD8+TEMRA among HIs (n = 8) and DN-CML (n = 11), TKI-F (n = 6) and MR (n = 6) patients. The P values shown are derived from the Mann-Whitney U test between groups.
1. Ross DM, Branford S, Seymour JF, Schwarer AP, Arthur C, Yeung DT, et al. Safety and efficacy of imatinib cessation for CML patients with stable undetectable minimal residual disease: results from the TWISTER study. Blood (2013) 122(4):515–22. doi: 10.1182/blood-2013-02-483750
2. Minciacchi VR, Kumar R, Krause DS. Chronic myeloid leukemia: A model disease of the past, present and future. Cells (2021) 10(1):117. doi: 10.3390/cells10010117
3. Ning L, Hu C, Lu P, Que Y, Zhu X, Li D. Trends in disease burden of chronic myeloid leukemia at the global, regional, and national levels: a population-based epidemiologic study. Exp Hematol Oncol (2020) 9(1):29. doi: 10.1186/s40164-020-00185-z
4. Hou JZ, Ye JC, Pu JJ, Liu H, Ding W, Zheng H, et al. Novel agents and regimens for hematological malignancies: recent updates from 2020 ASH annual meeting. J Hematol Oncol (2021) 14(1):66. doi: 10.1186/s13045-021-01077-3
5. Ciftciler R, Haznedaroglu IC. Tailored tyrosine kinase inhibitor (TKI) treatment of chronic myeloid leukemia (CML) based on current evidence. Eur Rev Med Pharmacol Sci (2021) 25(24):7787–98. doi: 10.26355/eurrev_202112_27625
6. Baccarani M, Gugliotta G, Castagnetti F, Soverini S, Rosti G. A review and an update of European LeukemiaNet recommendations for the management of chronic myeloid leukemia. Chronic Myeloid Leuk (2016), 55–69. doi: 10.1007/978-3-319-33198-0_4
7. Bachireddy P, Hainz U, Rooney M, Pozdnyakova O, Aldridge J, Zhang W, et al. : Reversal of in situ T-cell exhaustion during effective human antileukemia responses to donor lymphocyte infusion. Blood (2014) 123(9):1412–21. doi: 10.1182/blood-2013-08-523001
8. Cortes J, Lang F. Third-line therapy for chronic myeloid leukemia: current status and future directions. J Hematol Oncol (2021) 14(1):44. doi: 10.1186/s13045-021-01055-9
9. Sallusto F, Geginat J, Lanzavecchia A. Central memory and effector memory T cell subsets: function, generation, and maintenance. Annu Rev Immunol (2004) 22:745–63. doi: 10.1146/annurev.immunol.22.012703.104702
10. Cavanagh LL, Bonasio R, Mazo IB, Halin C, Cheng G, van der Velden AW, et al. Activation of bone marrow-resident memory T cells by circulating, antigen-bearing dendritic cells. Nat Immunol (2005) 6(10):1029–37. doi: 10.1038/ni1249
11. Surh CD, Sprent J. Homeostasis of naive and memory T cells. Immunity (2008) 29(6):848–62. doi: 10.1016/j.immuni.2008.11.002
12. van den Broek T, Borghans JAM, van Wijk F. The full spectrum of human naive T cells. Nat Rev Immunol (2018) 18(6):363–73. doi: 10.1038/s41577-018-0001-y
13. Zhang Y, Liu Z, Wei W, Li Y. TCR engineered T cells for solid tumor immunotherapy. Exp Hematol Oncol (2022) 11(1):38. doi: 10.1186/s40164-022-00291-0
14. Noviello M, Manfredi F, Ruggiero E, Perini T, Oliveira G, Cortesi F, et al. Bone marrow central memory and memory stem T-cell exhaustion in AML patients relapsing after HSCT. Nat Commun (2019) 10(1):1065. doi: 10.1038/s41467-019-08871-1
15. Savas P, Virassamy B, Ye C, Salim A, Mintoff CP, Caramia F, et al. Single-cell profiling of breast cancer T cells reveals a tissue-resident memory subset associated with improved prognosis. Nat Med (2018) 24(7):986–93. doi: 10.1038/s41591-018-0078-7
16. Rohon P, Porkka K, Mustjoki S. Immunoprofiling of patients with chronic myeloid leukemia at diagnosis and during tyrosine kinase inhibitor therapy. Eur J Haematol (2010) 85(5):387–98. doi: 10.1111/j.1600-0609.2010.01501.x
17. Humlova Z, Klamova H, Janatkova I, Malickova K, Kralikova P, Sterzl I, et al. Changes of immunological profiles in patients with chronic myeloid leukemia in the course of treatment. Clin Dev Immunol (2010) 2010:137320. doi: 10.1155/2010/137320
18. Hughes A, Clarson J, Tang C, Vidovic L, White DL, Hughes TP, et al. CML patients with deep molecular responses to TKI have restored immune effectors and decreased PD-1 and immune suppressors. Blood (2017) 129(9):1166–76. doi: 10.1182/blood-2016-10-745992
19. Boddu P, Kantarjian H, Garcia-Manero G, Allison J, Sharma P, Daver N. The emerging role of immune checkpoint based approaches in AML and MDS. Leuk Lymphoma (2018) 59(4):790–802. doi: 10.1080/10428194.2017.1344905
20. Bruck O, Blom S, Dufva O, Turkki R, Chheda H, Ribeiro A, et al. Immune cell contexture in the bone marrow tumor microenvironment impacts therapy response in CML. Leukemia (2018) 32(7):1643–56. doi: 10.1038/s41375-018-0175-0
21. Chen S, Yang L, Chen S, Li Y. TCR zeta chain expression in T cells from patients with CML. Hematology (2009) 14(2):95–100. doi: 10.1179/102453309X385241
22. Chen X, Woiciechowsky A, Raffegerst S, Schendel D, Kolb HJ, Roskrow M. Impaired expression of the CD3-zeta chain in peripheral blood T cells of patients with chronic myeloid leukaemia results in an increased susceptibility to apoptosis. Br J Haematol (2000) 111(3):817–25. doi: 10.1111/j.1365-2141.2000.02415.x
23. Shafat MS, Gnaneswaran B, Bowles KM, Rushworth SA. The bone marrow microenvironment - home of the leukemic blasts. Blood Rev (2017) 31(5):277–86. doi: 10.1016/j.blre.2017.03.004
24. Mendez-Ferrer S, Bonnet D, Steensma DP, Hasserjian RP, Ghobrial IM, Gribben JG, et al. Bone marrow niches in haematological malignancies. Nat Rev Cancer (2020) 20(5):285–98. doi: 10.1038/s41568-020-0245-2
25. Swatler J, Turos-Korgul L, Kozlowska E, Piwocka K. Immunosuppressive cell subsets and factors in myeloid leukemias. Cancers (Basel) (2021) 13(6):1203. doi: 10.3390/cancers13061203
26. Anderson NM, Simon MC. The tumor microenvironment. Curr Biol (2020) 30(16):R921–5. doi: 10.1016/j.cub.2020.06.081
27. Yu S, Ren X, Li L. Myeloid-derived suppressor cells in hematologic malignancies: two sides of the same coin. Exp Hematol Oncol (2022) 11(1):43. doi: 10.1186/s40164-022-00296-9
28. Mueller SN, Mackay LK. Tissue-resident memory T cells: local specialists in immune defence. Nat Rev Immunol (2016) 16(2):79–89. doi: 10.1038/nri.2015.3
29. Cibrian D, Sanchez-Madrid F. CD69: from activation marker to metabolic gatekeeper. Eur J Immunol (2017) 47(6):946–53. doi: 10.1002/eji.201646837
30. Yao D, Xu L, Tan J, Zhang Y, Lu S, Li M, et al. Re-balance of memory T cell subsets in peripheral blood from patients with CML after TKI treatment. Oncotarget (2017) 8(47):81852–9. doi: 10.18632/oncotarget.20965
31. Cesano A, Visonneau S, Deaglio S, Malavasi F, Santoli D. Role of CD38 and its ligand in the regulation of MHC-nonrestricted cytotoxic T cells. J Immunol (1998) 160(3):1106–15. doi: 10.4049/jimmunol.160.3.1106
32. Palacios R, Moller G, Claesson L, Peterson PA. HLA-DR antigens induce proliferation and cytotoxicity of T cells against haptenated (TNP and FITC) self structures. Immunogenetics (1981) 14(5):367–82. doi: 10.1007/BF00373317
33. Harrington P, Dillon R, Radia D, McLornan D, Woodley C, Asirvatham S, et al. Chronic myeloid leukaemia patients at diagnosis and resistant to tyrosine kinase inhibitor therapy display exhausted T-cell phenotype. Br J Haematol (2022) 198(6):1011–5. doi: 10.1111/bjh.18302
34. Dong H, Strome SE, Salomao DR, Tamura H, Hirano F, Flies DB, et al. Tumor-associated B7-H1 promotes T-cell apoptosis: a potential mechanism of immune evasion. Nat Med (2002) 8(8):793–800. doi: 10.1038/nm730
35. Iwai Y, Ishida M, Tanaka Y, Okazaki T, Honjo T, Minato N. Involvement of PD-L1 on tumor cells in the escape from host immune system and tumor immunotherapy by PD-L1 blockade. Proc Natl Acad Sci U.S.A. (2002) 99(19):12293–7. doi: 10.1073/pnas.192461099
36. Harjunpaa H, Guillerey C. TIGIT as an emerging immune checkpoint. Clin Exp Immunol (2020) 200(2):108–19. doi: 10.1111/cei.13407
37. Lee MY, Park CJ, Cho YU, You E, Jang S, Seol CA, et al. Differences in PD-1 expression on CD8+ T-cells in chronic myeloid leukemia patients according to disease phase and TKI medication. Cancer Immunol Immunother (2020) 69(11):2223–32. doi: 10.1007/s00262-020-02617-5
38. Di Rosa F, Pabst R. The bone marrow: a nest for migratory memory T cells. Trends Immunol (2005) 26(7):360–6. doi: 10.1016/j.it.2005.04.011
39. Amsen D, van Gisbergen K, Hombrink P, van Lier RAW. Tissue-resident memory T cells at the center of immunity to solid tumors. Nat Immunol (2018) 19(6):538–46. doi: 10.1038/s41590-018-0114-2
40. June CH, Ledbetter JA, Linsley PS, Thompson CB. Role of the CD28 receptor in T-cell activation. Immunol Today (1990) 11(6):211–6. doi: 10.1016/0167-5699(90)90085-N
41. Slavik JM, Hutchcroft JE, Bierer BE. CD28/CTLA-4 and CD80/CD86 families: signaling and function. Immunol Res (1999) 19(1):1–24. doi: 10.1007/BF02786473
42. Ke N, Su A, Huang W, Szatmary P, Zhang Z. Regulating the expression of CD80/CD86 on dendritic cells to induce immune tolerance after xeno-islet transplantation. Immunobiology (2016) 221(7):803–12. doi: 10.1016/j.imbio.2016.02.002
Keywords: T cell subsets, CML, bone marrow microenvironment, immunological phenotypes, tyrosine kinase inhibitor
Citation: Yao D, Lai J, Lu Y, Zhong J, Zha X, Huang X, Liu L, Zeng X, Chen S, Weng J, Du X, Li Y and Xu L (2023) Comprehensive analysis of the immune pattern of T cell subsets in chronic myeloid leukemia before and after TKI treatment. Front. Immunol. 14:1078118. doi: 10.3389/fimmu.2023.1078118
Received: 24 October 2022; Accepted: 03 January 2023;
Published: 19 January 2023.
Edited by:
Loredana Ruggeri, University of Perugia, ItalyReviewed by:
Minoru Kanaya, Aiiku Hospital, JapanCopyright © 2023 Yao, Lai, Lu, Zhong, Zha, Huang, Liu, Zeng, Chen, Weng, Du, Li and Xu. This is an open-access article distributed under the terms of the Creative Commons Attribution License (CC BY). The use, distribution or reproduction in other forums is permitted, provided the original author(s) and the copyright owner(s) are credited and that the original publication in this journal is cited, in accordance with accepted academic practice. No use, distribution or reproduction is permitted which does not comply with these terms.
*Correspondence: Yangqiu Li, eWFuZ3FpdWxpQGhvdG1haWwuY29t; Ling Xu, bGluZ3h1MTE0QDE2My5jb20=
†ORCID: Danlin Yao, orcid.org/0000-0002-0963-8700
Jing Lai, orcid.org/0000-0002-9581-7325
Yuhong Lu, orcid.org/0000-0002-9017-2185
Xianfeng Zha, orcid.org/0000-0002-4970-1305
Xiangbo Zeng, orcid.org/0000-0002-3176-8800
Shaohua Chen, orcid.org/0000-0003-4945-5914
Yangqiu Li, orcid.org/0000-0002-0974-4036
Ling Xu, orcid.org/0000-0002-7044-7663
Disclaimer: All claims expressed in this article are solely those of the authors and do not necessarily represent those of their affiliated organizations, or those of the publisher, the editors and the reviewers. Any product that may be evaluated in this article or claim that may be made by its manufacturer is not guaranteed or endorsed by the publisher.
Research integrity at Frontiers
Learn more about the work of our research integrity team to safeguard the quality of each article we publish.