 Meijie Ye
 Yu Wang
 Yiqiang Zhan
95% of researchers rate our articles as excellent or good
Learn more about the work of our research integrity team to safeguard the quality of each article we publish.
Find out more
BRIEF RESEARCH REPORT article
Front. Immunol. , 29 September 2022
Sec. Autoimmune and Autoinflammatory Disorders : Autoimmune Disorders
Volume 13 - 2022 | https://doi.org/10.3389/fimmu.2022.998102
Background: Telomere le fully elucidated. In the study, we exploited the two-sample Mendelian randomization (MR) design to evaluate the causal effect of ngth (TL) has been recognized to be fundamental to the risk of autoimmune disorders. However, the role of leukocyte TL in Graves’ disease has not yet beenleukocyte TL on the risk of Graves’ disease.
Methods: Genome-wide association study (GWAS) data of leukocyte TL from the Singapore Chinese Health Study (SCHS) cohort and Graves’ disease from Biobank Japan (BBJ, 2176 cases and 210,277 controls) were analyzed. Nine single nucleotide polymorphisms (SNPs) were selected as instrumental variables (IVs) for TL. We used the inverse variance weighted (IVW) approach as the main estimator and MR-Egger regression, weighted median, simple mode, and weighed mode methods as complementary estimators. Horizontal pleiotropy was assessed using the intercept from MR-Egger.
Results: The analysis demonstrated that genetically predicted longer leukocyte TL was causally associated with a lower risk of Graves’ disease using the IVW method (odds ratio [OR]: 1.64, 95% confidence interval [CI]: 1.23-2.17, P=2.27e-04, and other complementary MR approaches achieved similar results. The intercept from the MR-Egger analysis provided no noticeable evidence of horizontal pleiotropy (β=0.02, P=0.641). MR-PRESSO method reported no outliers (P=0.266).
Conclusions: Our results provided evidence to support a genetic predisposition to shorter leukocyte TL with an increased risk of Graves’ disease. Further studies are warranted to explore the mechanism underlying the association.
Graves’ disease is the most frequent cause of persistent hyperthyroidism due to the overproduction of thyroid hormones (1–3). Graves’ disease is an organ-specific autoimmune thyroid disorder that is characterized by breaking immune tolerance against thyroid antigens resulting in thyroid autoimmunity (4). The primary clinical symptoms or signs of Graves’ disease are diffuse thyroid enlargement and overaction, ophthalmopathy, pretibial myxedema, palpitations, weight loss, and others (5). The incidence of Graves’ disease is 20-40 cases per 100,000 person-years worldwide (6), and is more common in women than men, which approximately affects 0.2% of men and 2% of women (7, 8). Graves’ disease is commonly observed in women aged 20-50 years, whilst all ages could be affected (6). Although the autoimmune mechanism of Graves’ disease has been proposed for several decades, its etiology has not been well accepted and needs to be further elucidated.
Telomeres, the terminal nucleoprotein-DNA complexes of eukaryotic chromosomes, play crucial and pervasive roles in capping and protecting chromosome DNA ends (9, 10). Telomeres, to a certain extent, can maintain the integrity of the replicative capacity of the chromosomes after each cell cycle (11). Telomeres progressively shorten with each cellular division cycle until eventually reaching a critically short length or sufficiently damaged, which triggers subsequently cellular senescence or apoptosis (12). Consequently, telomere length (TL) has been proposed as an underlying biomarker for cellular aging and mortality (13–15). Furthermore, telomere attrition might give rise to potential cell changes, block cellular division, and interfere with the normal function of tissues (12). Phenome-wide analyses provided evidence for association of shorter leukocyte TL with increased risk of thyroid disorders in more than 350,000 UK participants (16). However, whether there is a potential causal effect on leukocyte TL and Graves’ disease has not yet been investigated.
Mendelian randomization (MR) study, an epidemiological method, could minimize potential bias due to confounding and reverse causation (17). MR provided a novel opportunity to explore the potential causal association between an exposure of interest and outcome in an observational study (18). It relies on three core assumptions (Figure 1): (I) the instrumental variables are associated with the exposure of interest (e.g. leukocyte TL); (II) the instrumental variables are not associated with confounders; (III) the effects of instrumental variables on the outcome (e.g. Graves’ disease) are only through the exposure of interest. To the best of our knowledge, there is no study examining leukocyte TL and Graves’ disease using the MR approach.
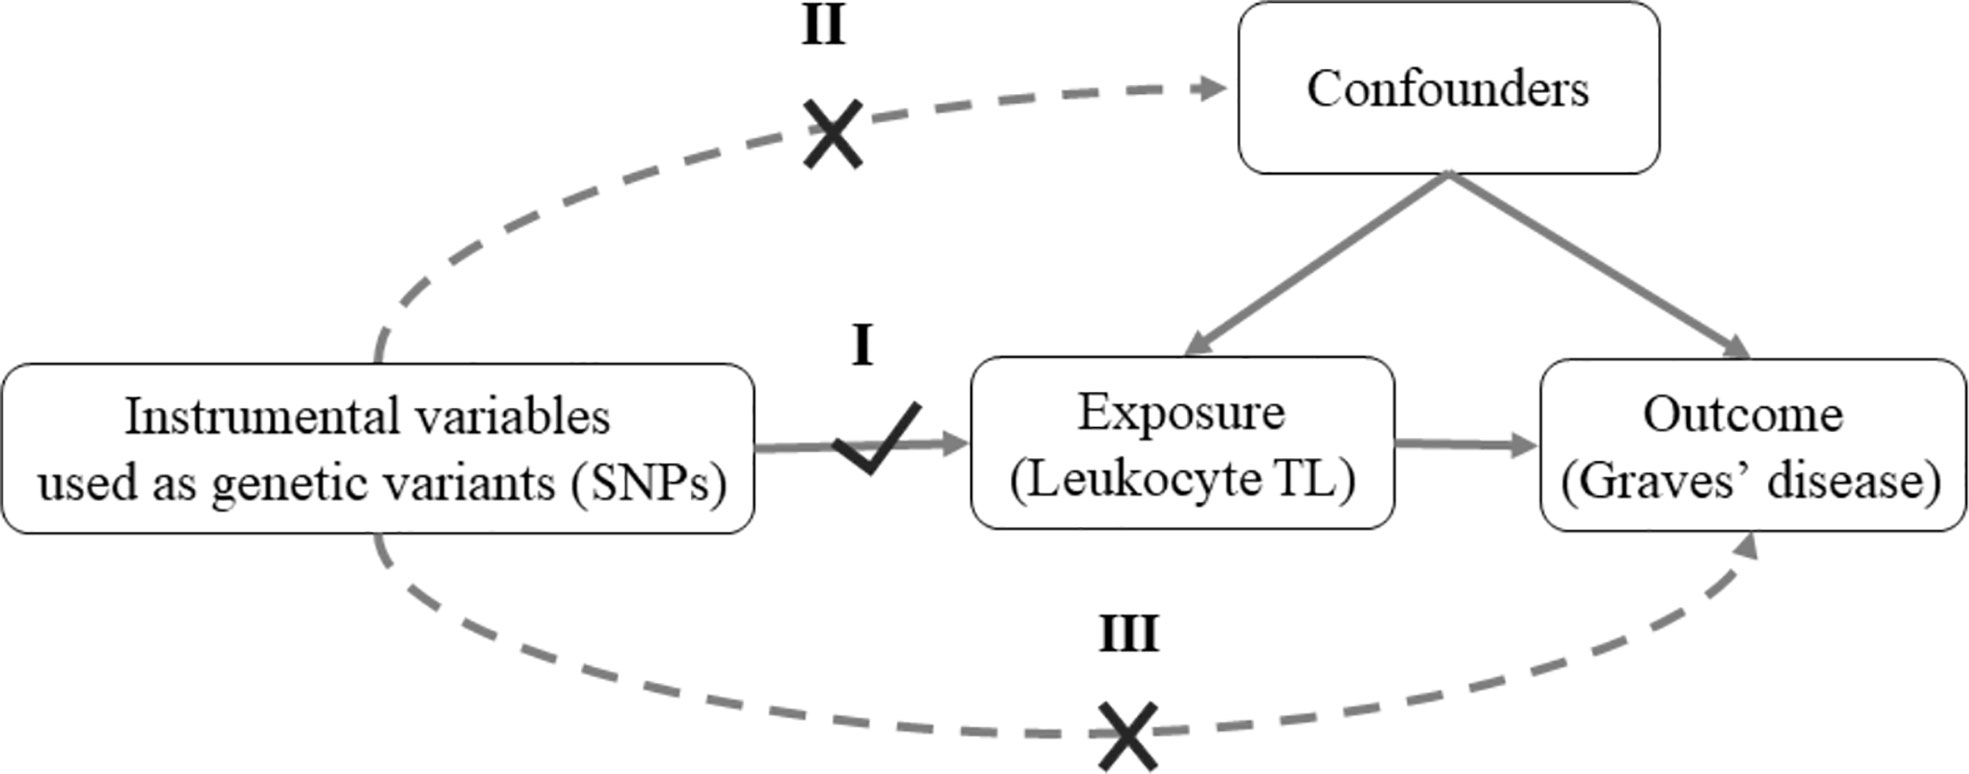
Figure 1 Mendelian randomization model of leukocyte TL and risk of Graves’ disease. MR depends on three assumptions: I. Relevance: The genetic variants are associated with the exposure of interest (Leukocyte TL); II. Independence: The genetic variants are not associated with confounders; III. Exclusion restriction: The genetic variants affect outcome of interest (Graves’ disease) except through their potential effects on the exposure (Leukocyte TL). Solid arrows represent causal effects; dashed arrows represent causal effects that are particularly violated by the IV assumptions. SNPs, single-nucleotide polymorphisms; TL, telomere length.
In the present study, we identified nine SNPs to be of genome-wide significance for leukocyte TL in a large-scale genome-wide association study (GWAS) from the Singapore Chinese Health Study (SCHS) cohort and examined its association with Graves’ disease in Biobank Japan.
The Singapore Chinese Health Study is a large prospective cohort and recruited 63,257 Singaporean Chinese men and women aged 45-75 years from April 1993 to December 1998. TL was assessed in a subset of 23,096 individuals of Chinese ancestry and a GWAS was conducted (19, 20). Multiplex quantitative PCR (qPCR) was utilized to measure relative telomere length (21). For single-nucleotide polymorphism (SNPs) quality control, sex-linked and mitochondrial SNPs were omitted, leaving autosomal SNPs in this study. In total, the genetic assessment identified ten independent SNPs (P<5e-08) to be of genome-wide significance with TL, and the annotated genes play crucial roles in the biological mechanisms of the telomere.
Genetic association data on Graves’ disease was obtained from a large-scale GWAS in a Japanese population, including 2,176 cases (in 597 male patients and 1,579 female patients) who participated in the BioBank Japan Project (BBJ) and 210,277 population-based controls of Asian ancestry (22). BBJ, one of the largest non-European biobanks, collects collaboratively DNA and serum samples from 12 Japanese medical institutions and comprises a large cohort of approximately 200,000 participants (23, 24).
For quality control of samples, samples with a call rate <0.98 were excluded. Subsequently, for quality control of genotypes, variants that were call rate <99%, with Hardy-Weinberg equilibrium (HWE) P <1.0×10⁻⁶, and less than five heterozygotes were excluded (22). Among identified nine independent SNPs with leukocyte TL in Singaporean Chinese individuals, the associations of SNPs with TL and Graves’ disease were harmonized to make sure that the direction of effects reflected the same alleles. These GWAS data for Graves’ disease were publicly available online (http://jenger.riken.jp/65/).
MR analysis uses genetic variants (SNPs) as instrumental variables to assess the causal effect of exposure of interest on the outcome. A two-sample MR design was performed in the present study. We combined the GWAS summary statistics (β coefficients and standard errors) to estimate the causal association between leukocyte TL and Graves’ disease using different MR approaches. The inverse variance weighted (IVW) analysis was selected as the primary method to evaluate the causal association. The IVW estimate for combining the ratio estimate on multiple genetic variants is the weighted average of ratio estimates of the genetically causal association of outcome with exposure for each SNP (25). Other MR approaches take into account different types of genetic pleiotropy and are based on potentially different assumptions, which were conducted to examine the robustness of the results. For example, a weighted median estimator (WME) combines multiple genetic variants into a single causal estimate. The weighted median estimator may be able to provide consistent and robust estimates, although up to 50% of the weights are from invalid instrumental variables (26).
Further, the MR-Egger regression can correct bias in the presence of directional pleiotropy and heterogeneity and provide a less biased estimate for effect estimates (27). The MR-Egger regression provides a valid test of directional pleiotropy, along with a robust analysis of invalid instruments (28). When the SNPs have noticeably non-pleiotropic associations with the outcome, the coefficient of the slope from MR-Egger regression might strengthen the confidence of the causal effect (29). However, the MR-Egger method is more sensitive to the effects of SNPs on exposure and outcome, which is of lower statistical power with a wider confidence interval compared to the IVW analysis. In addition, we applied methods of visualization to evaluate causal estimates. The scatter plot visually depicts causal effects on exposure of interest and outcome via selected MR approaches. Besides, the forest plots display the causal estimate of a single SNP, which allow for a visual inspection of heterogeneity around the overall causal estimate from all SNPs (30).
The study was performed according to the Strengthening the Reporting of Observational Studies in Epidemiology Using Mendelian Randomization (STROBE-MR) Statement (31).
Sensitivity analyses primarily are comprised of tests for heterogeneity, genetic pleiotropy, and the leave-one-out analysis. Firstly, heterogeneity in causal effects among IVs is an indicator of potential violations of MR assumptions, which can be calculated for the IVW and MR-Egger estimates to assess horizontal pleiotropy (32). The p-value of Cochran’s Q statistic was used to test for heterogeneity, whilst the I2 statistic assesses the magnitude of heterogeneity. Secondly, for the estimate of genetic pleiotropy, the intercept of MR-Egger regression was used to examine horizontal pleiotropy. Besides, the MR pleiotropy residual sum and outlier (MR-PRESSO) test is used to detect and correct for outliers of horizontal pleiotropy in MR analysis (33). Thirdly, the effect estimates on exposure and outcome for SNPs are visually plotted to test probable outlier genetic variants. The leave-one-out analysis is performed by removing each SNP and the remaining SNPs were further tested. The fluctuation of the estimates after removing each SNP implies the probability of identifying any outliers. The funnel plot is commonly used in the meta-analysis, in which an estimate for a single SNP is plotted against its precision (34). The funnel plot can be applied to conduct a visual inspection for asymmetry, which may be an indication of violations of the MR assumption via horizontal pleiotropy (27).
We conducted power calculation for MR analysis via using an online power calculator (https://shiny.cnsgenomics.com/mRnd/) and found that the statistical power for the present study was 91% by assuming the odds ratio for Graves’ disease was 1.5 per SD decrease in TL. All statistical analyses were conducted in R version 4.1.1. The use of the TwoSampleMR package tested the MR approaches. The P-value <0.05 was significantly statistical.
Our study took advantage of publicly available GWAS summary data. Informed consent was obtained from all participants, and each study was approved by their institutional ethics committees. The original data was not collected for this manuscript, and thus, no ethical approval was required.
Ten independent SNPs with leukocyte TL association were originally identified, then the associations of SNPs with exposure and outcome were harmonized to make sure whether there were the same effect or risk alleles. However, one SNP (rs28365964 and its proxy SNPs) was missing in the Graves’ disease GWAS, and it was therefore excluded. Eventually, the remaining nine SNPs were available for instrumental variables and their effects on exposure and outcome were extracted and harmonized. The summary statistics of nine genetic variants was shown in Table 1.

Table 1 SNPs used as instrument variables and its association of leukocyte TL with Grave’s disease.
Overall, in the primary analysis using IVW that combines the ratio estimate on multiple genetic variants, genetically predicted shorter leukocyte TL was causally associated with a higher risk of Graves’ disease (OR: 1.64, 95% CI: 1.23-2.17, P=2.27e-04). The odds ratio of Graves’ disease per 1-standard deviation decrease in genetically predicted leukocyte TL was 1.64 (Table 2). Results obtained using weighted median (OR:1.79, 95% CI: 1.30-2.44, P=6.16e-04), simple mode (OR:1.64, 95% CI:1.10-2.50, P=0.043), and weighted mode (OR:1.73, 95% CI: 1.23-2.38, P=0.013) approaches were in the same direction, with comparable point estimates and confidence intervals. These causal estimates were further displayed in a scatter plot (Figure 2).
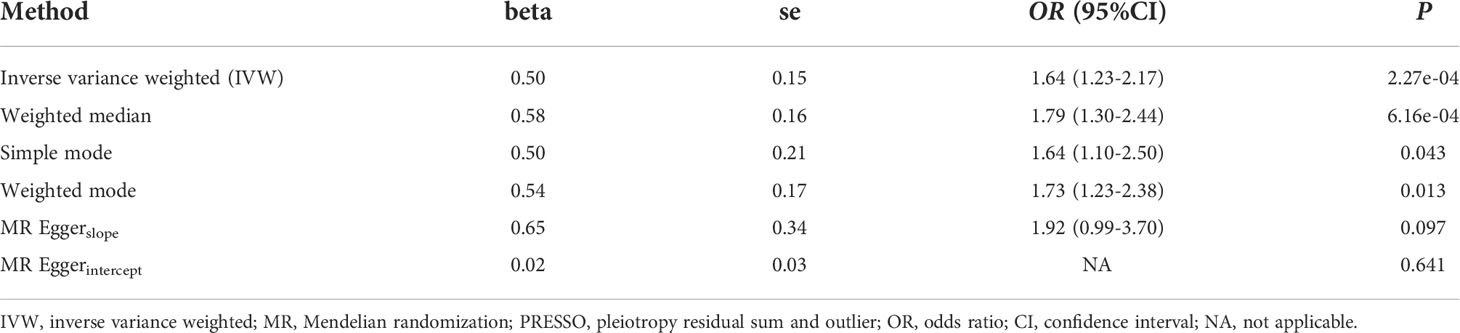
Table 2 Associations between leukocyte TL and Graves’ disease using Mendelian randomization method.
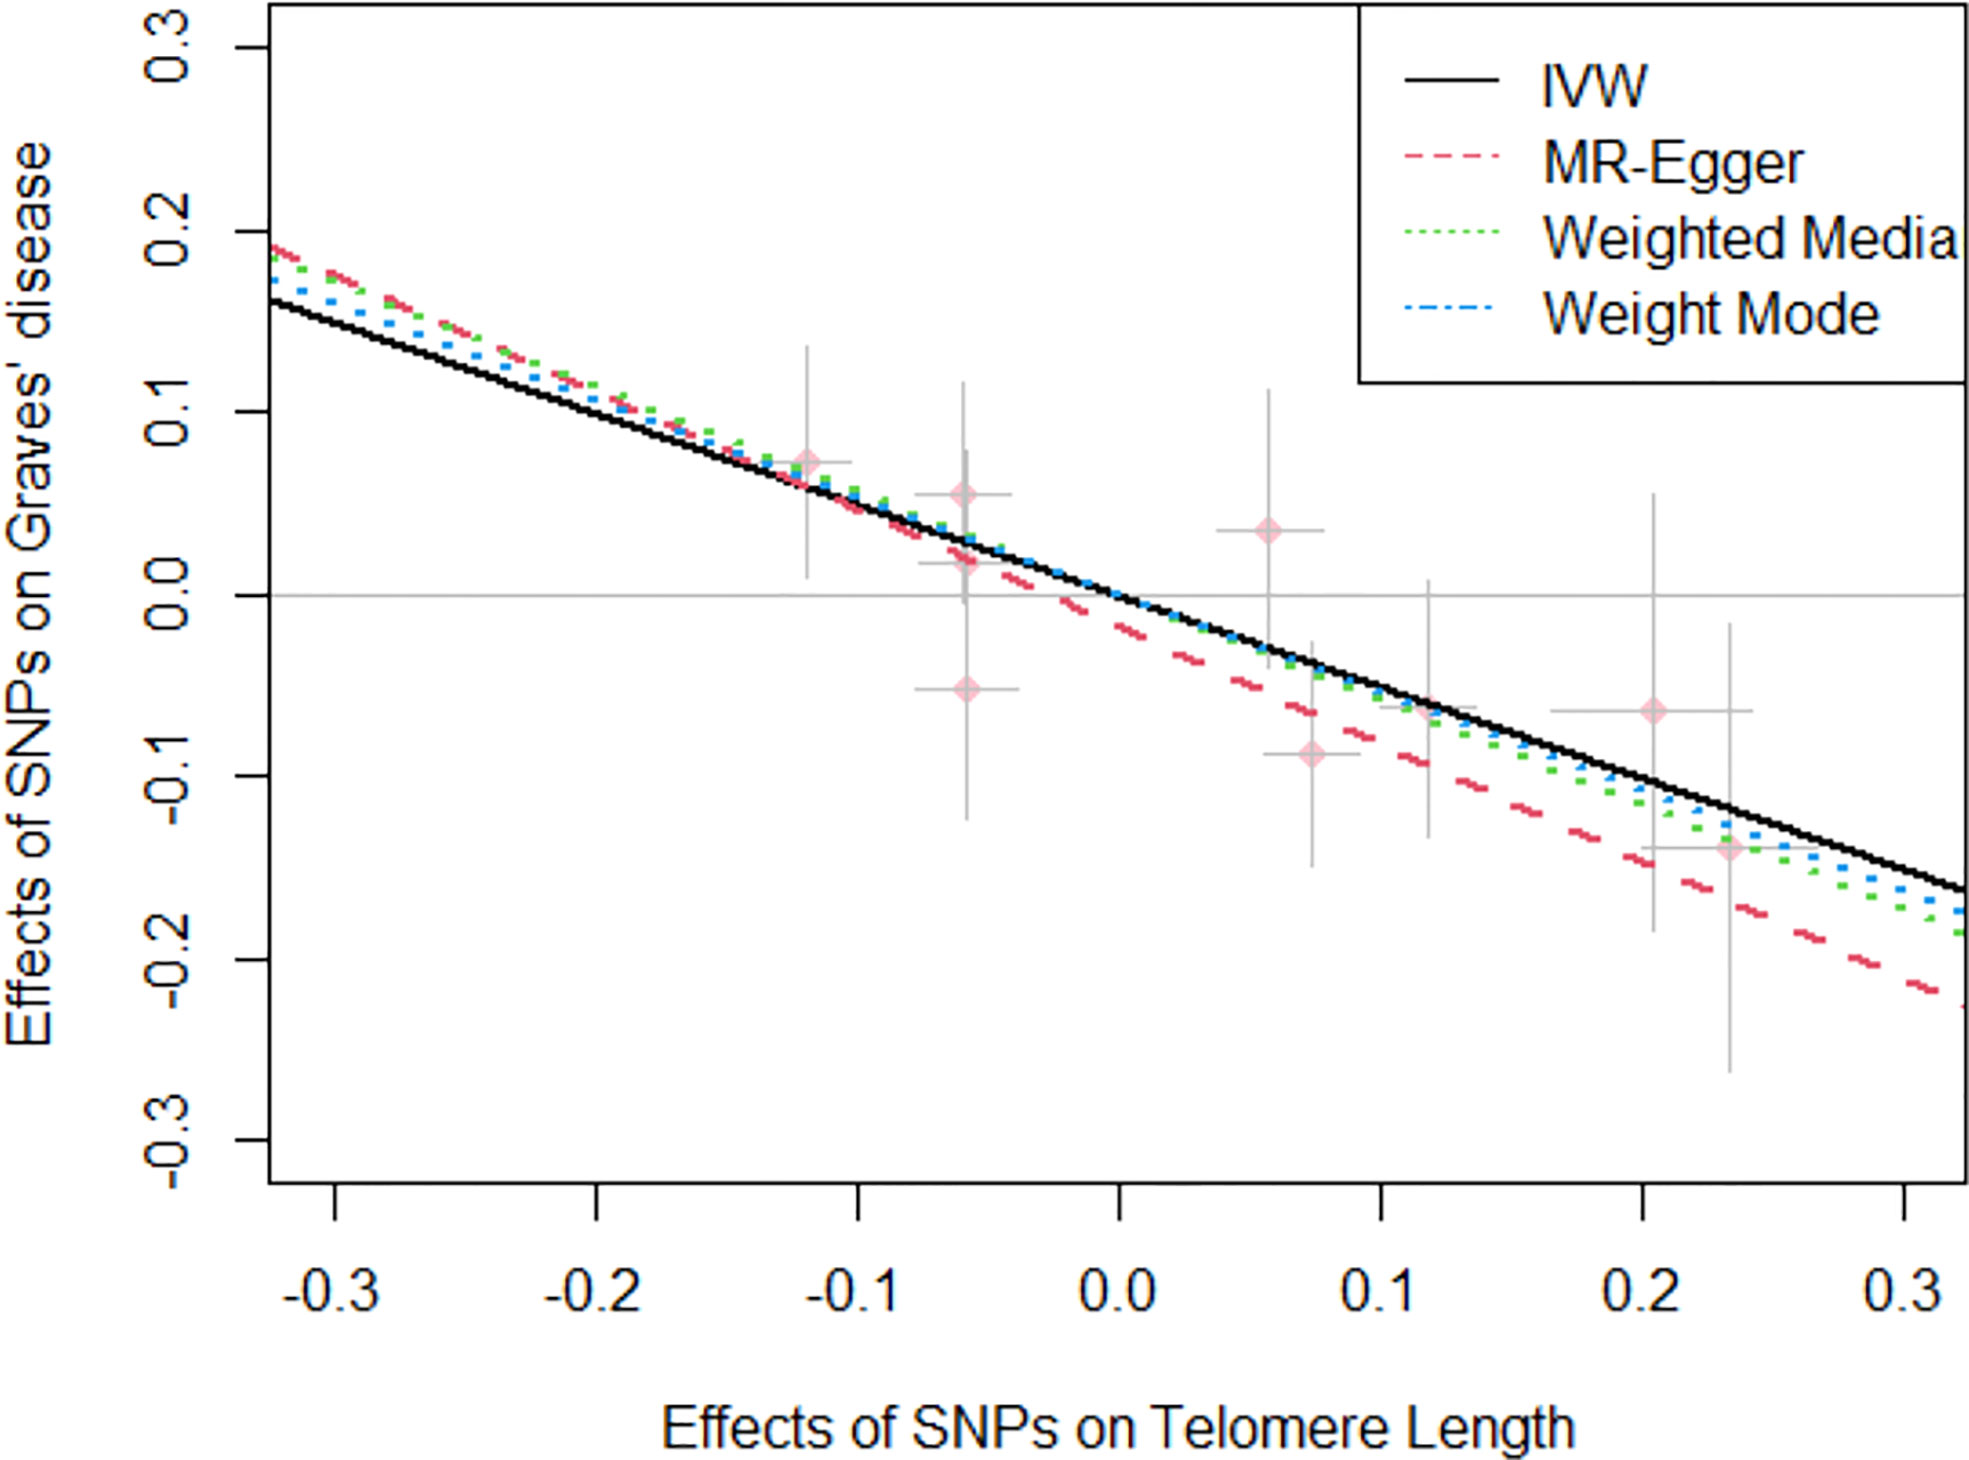
Figure 2 Scatter plot for the negative effects of SNPs on telomere length and Graves’ disease. The horizontal and vertical axes represent the effects of each genetic variant on both telomere length and Graves’ disease. The grey lines around the solid pink points denote the corresponding 95% CI for the effects. The slopes of solid lines show the effect estimates from four MR approaches. IVW, inverse variance weighted; MR, Mendelian randomization; SNPs, single nucleotide polymorphisms; CI, confidence interval.
For the heterogeneity test, little evidence of heterogeneity was found by the Cochran’s Q test for IVW and MR-Egger methods (both P>0.05). Additionally, for horizontal pleiotropy analysis, the intercept of MR-Egger regression did not provide noticeable evidence (intercept=0.02, se=0.03, P=0.641) for horizontal pleiotropy of these SNPs (Table 2). The result of MR-PRESSO analysis did not indicate any outliers for any SNPs (P-global =0.266). In addition, there was no obvious evidence to support if there was any single SNP that could dominate the results using one SNP plot and leave-one-out analysis (Figures 3, 4). The funnel plot did not provide evidence to support directional pleiotropy from SNPs neither (Figure 5).
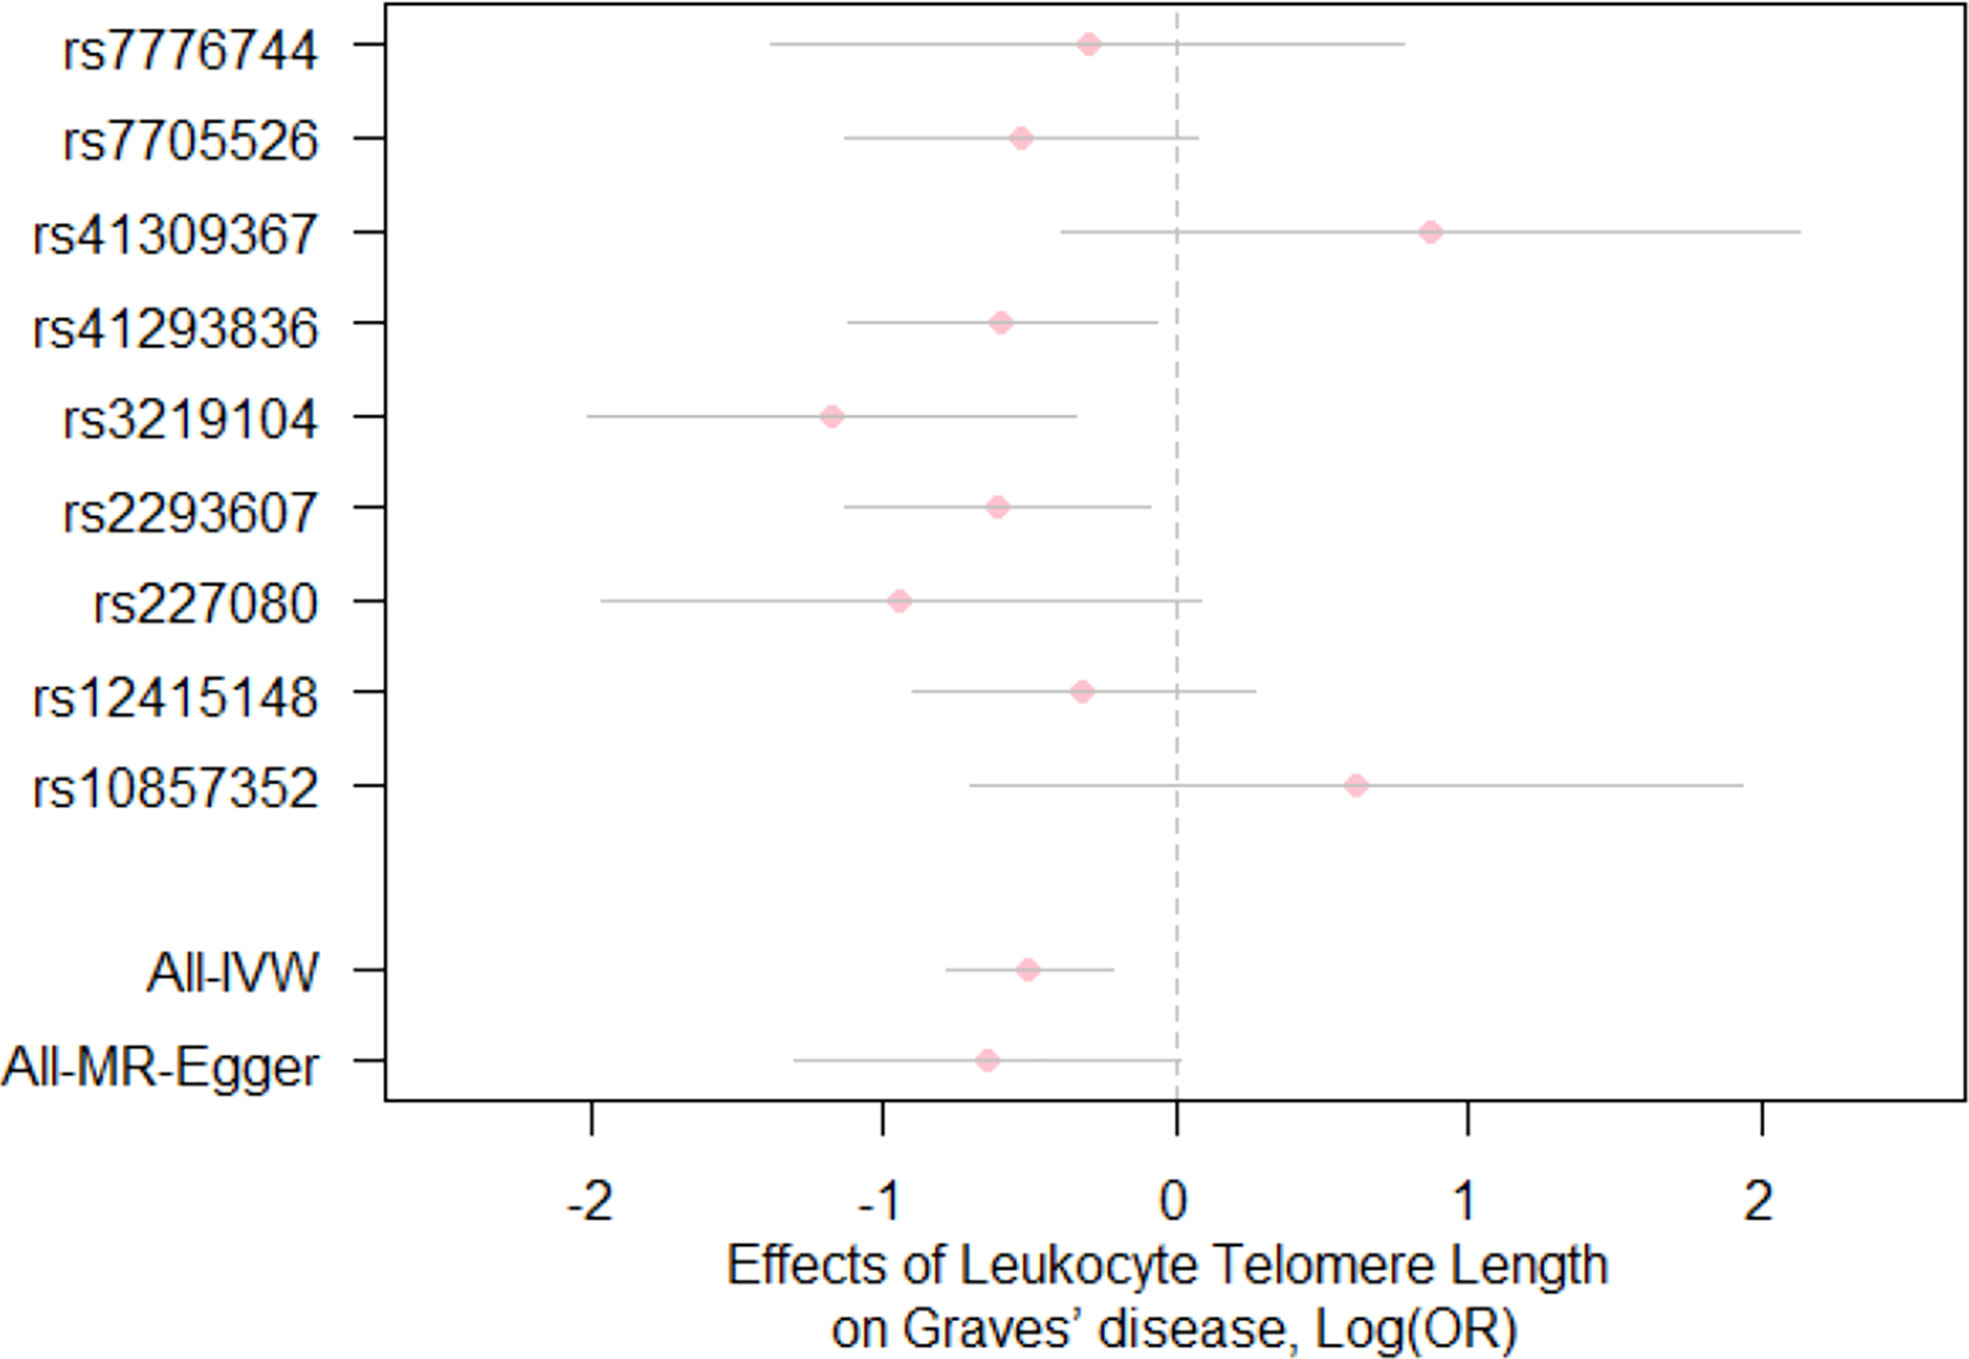
Figure 3 Forest plot for the effects of SNPs on telomere length and Graves’ disease. Each pink dot and grey bar represent the effect estimate and 95% CI for each SNP, respectively. The overall effect estimates and 95% CI are indicated by using the IVW and MR-Egger approaches. IVW, inverse variance weighted; MR, Mendelian randomization; OR, odds ratio; SNPs, single nucleotide polymorphisms; CI, confidence interval.
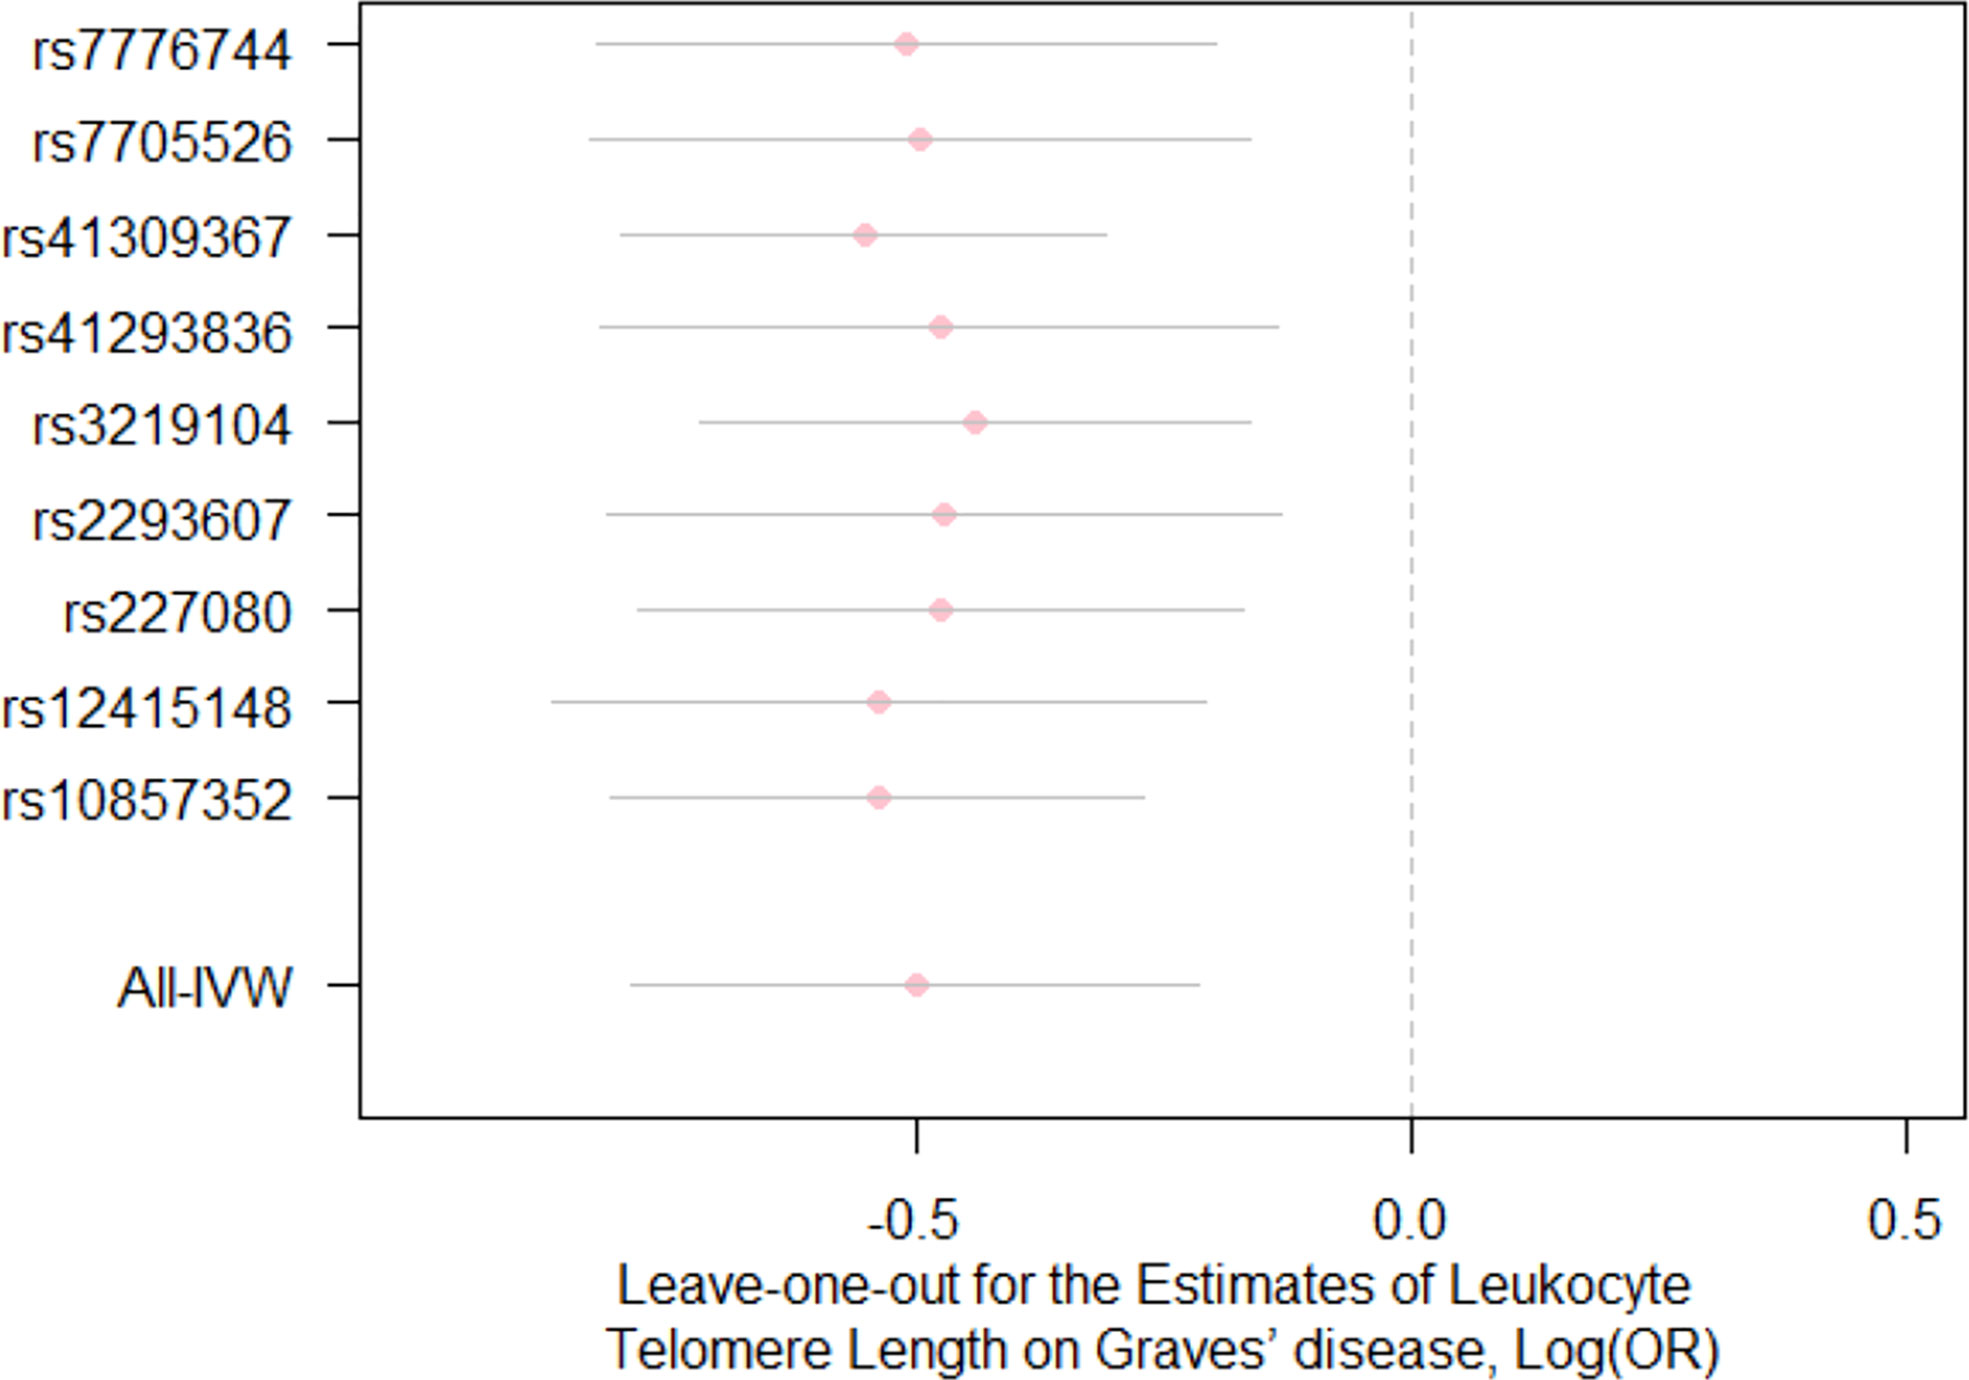
Figure 4 Leave-one-out analysis for the estimates for leukocyte telomere length on the risk of Graves’ disease Each pink dot and grey bar via using the IVW method illustrate the effect estimates and 95%CI for telomere length on the risk of Graves’ disease when the indicated SNP was removed. The overall effect estimate and 95% CI are represented by the lowest vertical lines using the IVW method. IVW, inverse variance weighted; OR, odds ratio; CI, confidence interval.
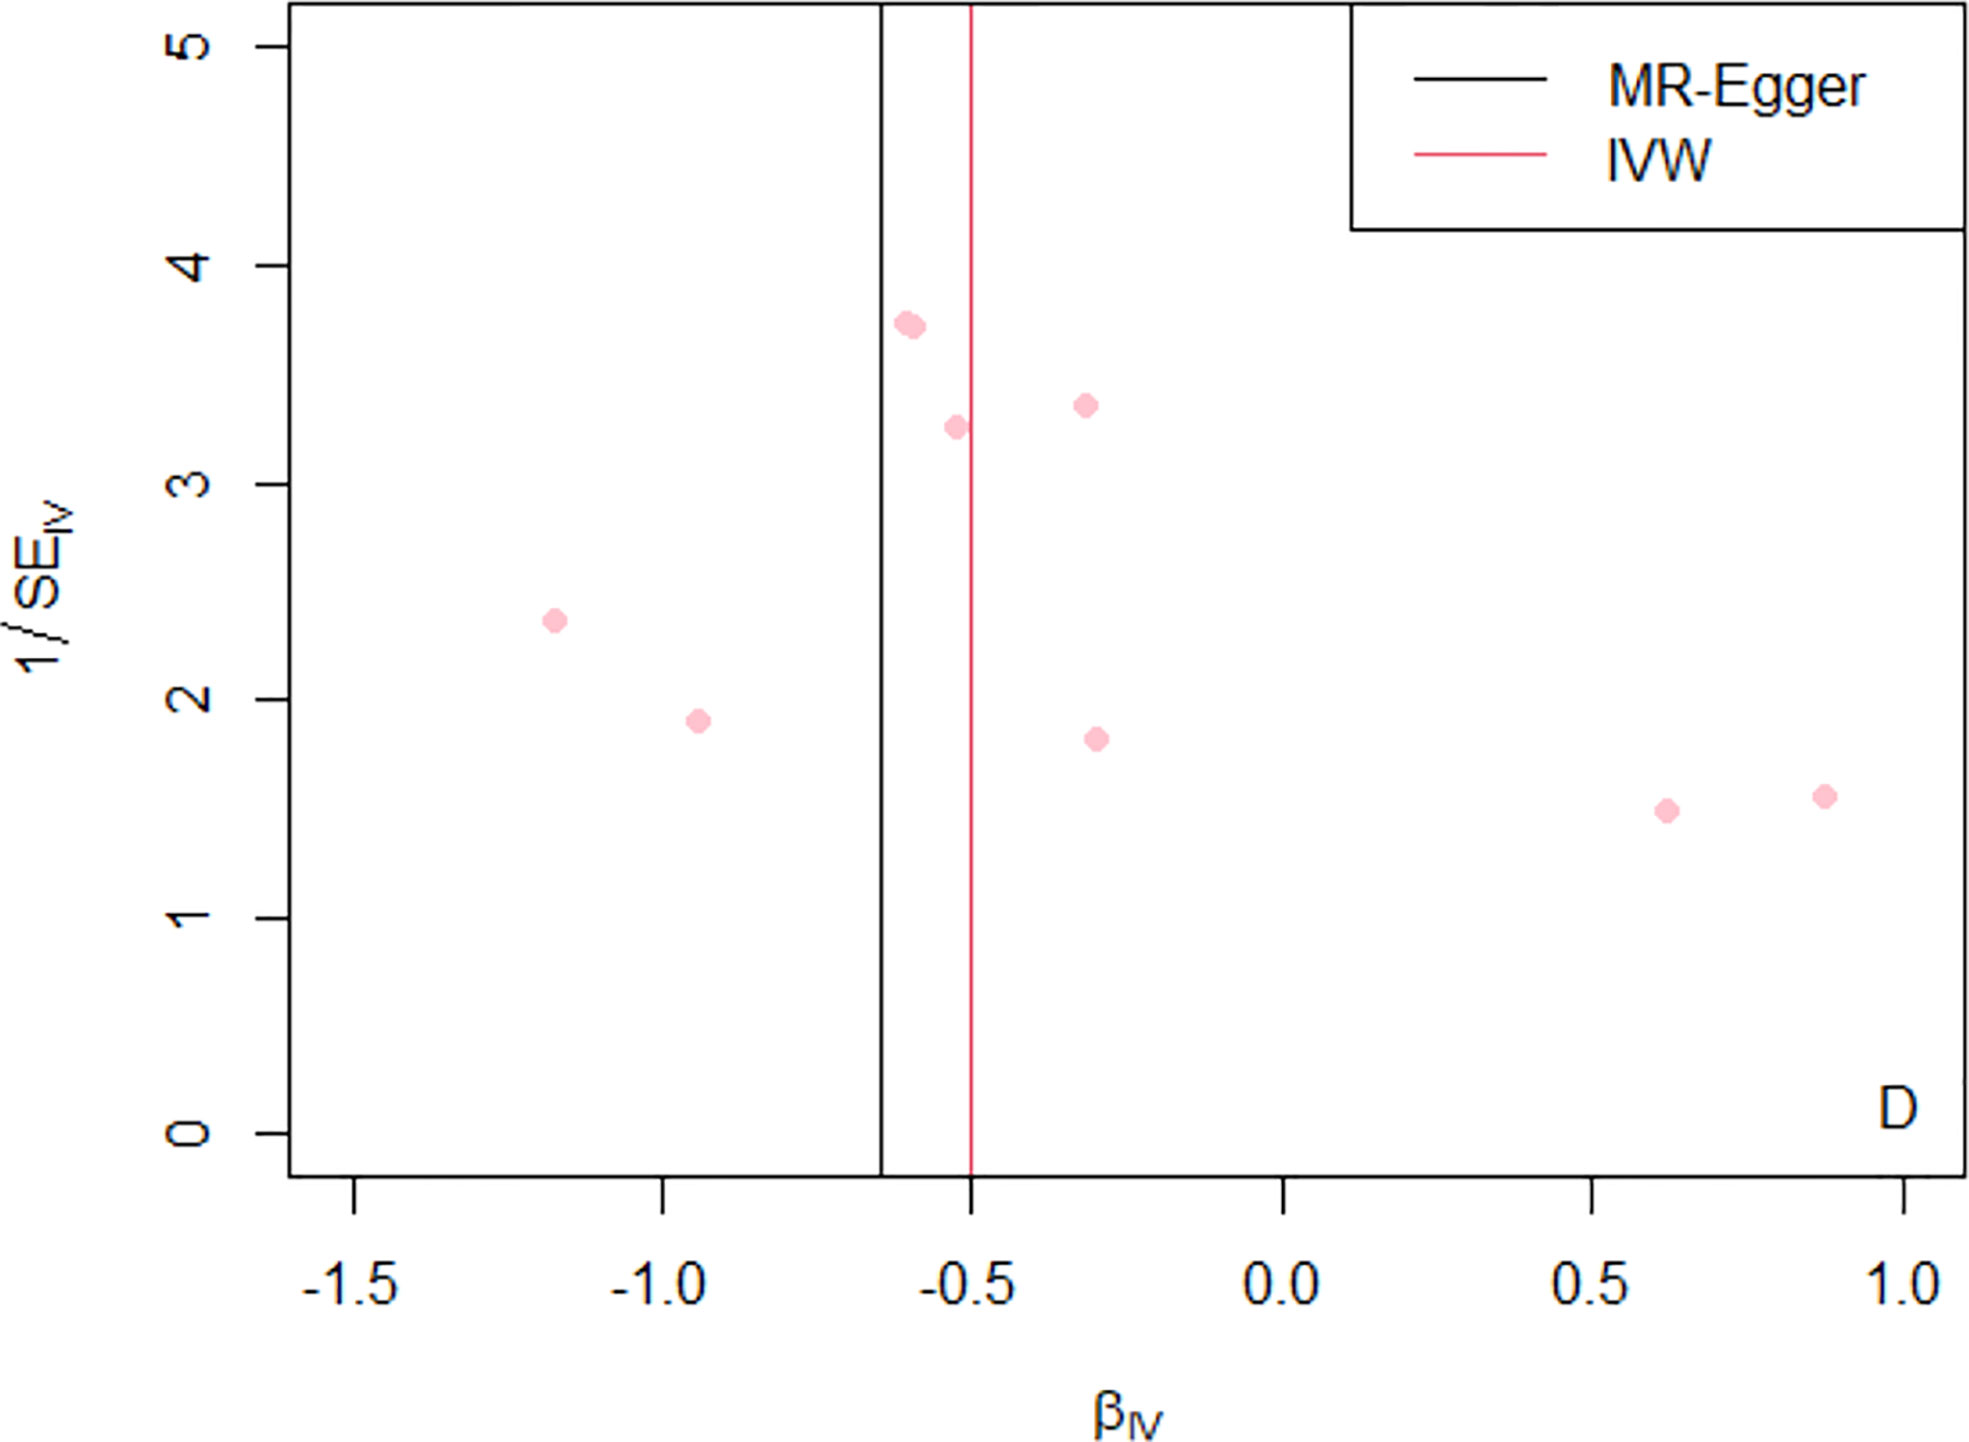
Figure 5 Funnel plot of MR analysis of telomere length on the risk of Graves’ disease by using nine SNPs. The x-axis represents causal estimates (Wald ratios=βY/βX) for each SNP. The y-axis depicts the inverse of standard errors for the effect sizes for each SNP. The overall effect estimates are revealed by vertical lines when using the MR-Egger and IVW approaches (black and pink lines, respectively). SE, standard error; IV, instrumental variable; IVW, inverse variance weighted; MR, Mendelian randomization.
The present study is the first of this kind to examine the causal association between leukocyte TL and Graves’ disease using a two-sample MR design. By leveraging several MR estimation approaches, we found that shorter TL was associated with an increased risk of Graves’ disease. Our study, in line with previous observational studies, provides evidence to support a causal role of shorter TL for Graves’ disease.
A number of studies about telomere length and lifetime disease risks have been extensively conducted, including autoimmune disorders (35, 36) and age-related diseases (37). Autoimmune diseases are characterized by spontaneous hyperactivity of the immune system comprising autoantibody production. Inflammation and oxidative stress are recognized as parts of the process for most of these diseases, but their molecular mechanisms have not fully been understood, Intriguingly, escalating telomere shorten was primarily caused by environmental factors concerning inflammation and oxidative stress, probably indicating an association between the telomere system and autoimmune or inflammatory diseases (38, 39). Particularly, for the past decade, data emerging from studies in oncology on the telomere system and its underlying therapeutic implications, stimulated studies estimating the role of the telomere system in the biological mechanisms of autoimmune diseases. Indeed, many MR studies utilized telomere length-associated genetic variants to predict the risk of disease based on the genomic architectures of the individuals (40, 41).
To date, no studies, to our knowledge, have been conducted to investigate the role of TL in Graves’ disease. A recent study showed that the relationship between Graves’ disease and rheumatoid arthritis, implying that these two autoimmune diseases were likely to share similar underlying mechanisms (42). Inflammation and oxidative stress are recognized as parts of the process for most of these diseases, but their molecular mechanisms have not fully been understood. Intriguingly, escalating telomere shortening was primarily caused by environmental factors, such as inflammation and oxidative stress, probably indicating an association between the telomeres and autoimmune or inflammatory diseases. Of note, a previous MR study indicated that genetically predicted TL was associated with a lower risk of rheumatoid arthritis, providing support for an inverse causal association (43). A possible biological explanation was that telomerase mutation carriers with short TL may develop T-cell aging phenotypes and immunodeficiency, and T cells with shorter telomeres could induce DNA damage and upregulate intrinsic apoptosis pathways (44). Another explanation was that telomere dysfunction could activate the production and secretion of inflammatory factors, such as IL-6 and TNF-α, which led to cellular senescence (45). Although these explanations are biologically plausible, further studies are required to clarify underlying mechanisms for the role of TL in the risk of Graves’ disease.
Our study has some strengths. First, the MR method tends to be less biased than conventional observational studies in the presence of unmeasured confounding and reverse causation, therefore it can offer a more robust estimate of a causal association. Indeed, this study obtained consistent estimates by using several MR approaches. Second, this study made the best use of publicly available data associated with the GWAS for leukocyte TL (23,096 individuals) and Graves’ disease (2,176 cases and 210,277 controls) with large sample sizes, which rendered us to gain more precise estimates and greater statistical power. Furthermore, the two-sample MR method was taken advantage of both GWAS summary levels with leukocyte TL and Graves’ disease that were derived from two independent populations (46).
Despite the advantages of the MR design, several limitations of the study should be acknowledged. Firstly, the instrumental variables were derived from blood TL and not TL in thyroid tissues in the present study. However, previous studies have shown that leukocyte TL was highly correlated with TL in other tissues (14, 47). Secondly, we cannot prove that the selected SNPs satisfy the assumption of exclusion restriction. However, MR-Egger regression and MR-PRESSO in this study were applied to assess the extent to which genetic pleiotropy may bias the results. The intercept of the MR-Egger regression analysis was close to zero, implying no strong evidence for supporting directional pleiotropy. Similarly, MR-PRESSO and the leave-one-out analysis did not detect significant outliers. Thirdly, it is assumed that the two samples were from the same underlying populations in a two-sample MR study. Lastly, our findings rested on data from GWAS that was only performed in individuals of Asian ancestry, whereas majority of genetic studies were dominated by European-descent samples, which made it difficult to generalize to other ethnic populations. Because of the differences in genetic population structure, the transferability of genetic results across populations is relatively limited. The validity of our analysis relies on the MR assumption that SNPs are not associated with confounders that are related to the occurrence of Graves’ disease. To minimize bias due to violations of this assumption, we reviewed previous articles regarding telomere length and Graves’ disease and screened risk factors related to both as potential confounders, which included smoking status, vitamin D deficiency, and immune status. We found that the instrumental variables were not associated with these potential confounders. Additionally, we screened these instrumental variables through GWAS catalog to try to identify potential genome-wide significant associations with other traits in Asian population, but we did not find any such traits.
In summary, in the largest study until now, we provided novel evidence to support a causal association of genetically predicted shorter leukocyte TL with an increased risk of Graves’ disease. Further studies are warranted to clarify a biological mechanism of telomeres in the disease onset and progression of Graves’ disease in both the Asian and other ethnic populations.
The original contributions presented in the study are included in the article/supplementary material. Further inquiries can be directed to the corresponding author.
YZ designed this study and collected data, and MY and YW performed the analysis and wrote the manuscript. All authors approved the final version of the manuscript.
This work was supported by Sun Yat-Sen University.
The funder had no role in study design; in the collection, analysis and interpretation of data; in the writing of the report; and in the decision to submit the article for publication.
The authors declare that the research was conducted in the absence of any commercial or financial relationships that could be construed as a potential conflict of interest.
All claims expressed in this article are solely those of the authors and do not necessarily represent those of their affiliated organizations, or those of the publisher, the editors and the reviewers. Any product that may be evaluated in this article, or claim that may be made by its manufacturer, is not guaranteed or endorsed by the publisher.
1. Antonelli A, Ferrari SM, Ragusa F, Elia G, Paparo SR, Ruffilli I, et al. Graves' disease: Epidemiology, genetic and environmental risk factors and viruses. Best Pract Res Clin Endocrinol Metab (2020) 34(1):101387. doi: 10.1016/j.beem.2020.101387
2. Bartalena L. Diagnosis and management of graves disease: a global overview. Nat Rev Endocrinol (2013) 9(12):724–34. doi: 10.1038/nrendo.2013.193
3. Franklyn JA, Boelaert K. Thyrotoxicosis. Lancet (London England) (2012) 379(9821):1155–66. doi: 10.1016/S0140-6736(11)60782-4
4. McLachlan SM, Rapoport B. Breaking tolerance to thyroid antigens: changing concepts in thyroid autoimmunity. Endocr Rev (2014) 35(1):59–105. doi: 10.1210/er.2013-1055
5. Smith TJ, Hegedüs L. Graves' disease. New Engl J Med (2016) 375(16):1552–65. doi: 10.1056/NEJMra1510030
6. Davies TF, Andersen S, Latif R, Nagayama Y, Barbesino G, Brito M, et al. Graves' disease. Nat Rev Dis Primers (2020) 6(1):52. doi: 10.1038/s41572-020-0184-y
7. Taylor PN, Albrecht D, Scholz A, Gutierrez-Buey G, Lazarus JH, Dayan CM, et al. Global epidemiology of hyperthyroidism and hypothyroidism. Nat Rev Endocrinol (2018) 14(5):301–16. doi: 10.1038/nrendo.2018.18
8. McLeod DS, Cooper DS. The incidence and prevalence of thyroid autoimmunity. Endocrine (2012) 42(2):252–65. doi: 10.1007/s12020-012-9703-2
9. Blackburn EH. Structure and function of telomeres. Nature (1991) 350(6319):569–73. doi: 10.1038/350569a0
10. Smith EM, Pendlebury DF, Nandakumar J. Structural biology of telomeres and telomerase. Cell Mol Life Sci CMLS (2020) 77(1):61–79. doi: 10.1007/s00018-019-03369-x
11. Opresko PL, Shay JW. Telomere-associated aging disorders. Ageing Res Rev (2017) 11:3352–66. doi: 10.1016/j.arr.2016.05.009
12. Blackburn EH, Epel ES, Lin J. Human telomere biology: A contributory and interactive factor in aging, disease risks, and protection. Sci (New York NY) (2015) 350(6265):1193–8. doi: 10.1126/science.aab3389
13. Jylhävä J, Pedersen NL, Hägg S. Biological age predictors. EBioMedicine (2017) 21:2129–36. doi: 10.1016/j.ebiom.2017.03.046
14. Demanelis K, Jasmine F, Chen LS, Chernoff M, Tong L, Delgado D, et al. Determinants of telomere length across human tissues. Sci (New York NY) (2020) 369(6509):eaaz6876. doi: 10.1126/science.aaz6876
15. Daniali L, Benetos A, Susser E, Kark JD, Labat C, Kimura M, et al. Telomeres shorten at equivalent rates in somatic tissues of adults. Nat Commun (2013) 4:41597. doi: 10.1038/ncomms2602
16. Li C, Stoma S, Lotta LA, Warner S, Albrecht E, Allione A, et al. Genome-wide association analysis in humans links nucleotide metabolism to leukocyte telomere length. Am J Hum Genet (2020) 106(3):389–404. doi: 10.1016/j.ajhg.2020.02.006
17. Lawlor DA, Harbord RM, Sterne JA, Timpson N, Davey Smith G. Mendelian randomization: using genes as instruments for making causal inferences in epidemiology. Stat Med (2008) 27(8):1133–63. doi: 10.1002/sim.3034
18. Smith GD, Ebrahim S. 'Mendelian randomization': can genetic epidemiology contribute to understanding environmental determinants of disease? Int J Epidemiol (2003) 32(1):1–22. doi: 10.1093/ije/dyg070
19. Hankin JH, Stram DO, Arakawa K, Park S, Low SH, Lee HP, et al. Singapore Chinese Health study: development, validation, and calibration of the quantitative food frequency questionnaire. Nutr Cancer (2001) 39(2):187–95. doi: 10.1207/S15327914nc392_5
20. Dorajoo, Chang X, Gurung RL, Li Z, Wang L, Wang R, et al. Loci for human leukocyte telomere length in the Singaporean Chinese population and trans-ethnic genetic studies. Nat Commun (2019) 10(1):2491. doi: 10.1038/s41467-019-10443-2
21. Cawthon RM. Telomere length measurement by a novel monochrome multiplex quantitative PCR method. Nucleic Acids Res (2009) 37(3):e21. doi: 10.1093/nar/gkn1027
22. Ishigaki K, Akiyama M, Kanai M, Takahashi A, Kawakami E, Sugishita H, et al. Large-Scale genome-wide association study in a Japanese population identifies novel susceptibility loci across different diseases. Nat Genet (2020) 52(7):669–79. doi: 10.1038/s41588-020-0640-3
23. Nagai A, Hirata M, Kamatani Y, Muto K, Matsuda K, Kiyohara Y, et al. Overview of the BioBank Japan project: Study design and profile. J Epidemiol (2017) 27(3s):S2–s8. doi: 10.1016/j.je.2016.12.005
24. Hirata M, Kamatani Y, Nagai A, Kiyohara Y, Ninomiya T, Tamakoshi A, et al. Cross-sectional analysis of BioBank Japan clinical data: A large cohort of 200,000 patients with 47 common diseases. J Epidemiol (2017) 27(3s):S9–s21. doi: 10.1016/j.je.2016.12.003
25. Zheng J, Baird D, Borges MC, Bowden J, Hemani G, Haycock P, et al. Recent developments in mendelian randomization studies. Curr Epidemiol Rep (2017) 4(4):330–45. doi: 10.1007/s40471-017-0128-6
26. Bowden J, Davey Smith G, Haycock PC, Haycock PC, Burgess S. Consistent estimation in mendelian randomization with some invalid instruments using a weighted median estimator. Genet Epidemiol (2016) 40(4):304–14. doi: 10.1002/gepi.21965
27. Bowden J, Davey Smith G, Burgess S. Mendelian randomization with invalid instruments: effect estimation and bias detection through egger regression. Int J Epidemiol (2015) 44(2):512–25. doi: 10.1093/ije/dyv080
28. Burgess S, Thompson SG. Interpreting findings from mendelian randomization using the MR-egger method. Eur J Epidemiol (2017) 32(5):377–89. doi: 10.1007/s10654-017-0255-x
29. Schmidt AF, Dudbridge F. Mendelian randomization with egger pleiotropy correction and weakly informative Bayesian priors. Int J Epidemiol (2018) 47(4):1217–28. doi: 10.1093/ije/dyx254
30. Hemani G, Zheng J, Elsworth B, Wade KH, Haberland V, Baird D, et al. The MR-base platform supports systematic causal inference across the human phenome. eLife (2018) 7:e34408. doi: 10.7554/eLife.34408
31. Skrivankova VW, Richmond RC, Woolf BAR, Yarmolinsky J, Davies NM, Swanson SA, et al. Strengthening the reporting of observational studies in epidemiology using mendelian randomization: The STROBE-MR statement. Jama (2021) 326(16):1614–21. doi: 10.1001/jama.2021.18236
32. Bowden J, Del Greco MF, Minelli C, Davey Smith G, Sheehan N, Thompson J, et al. A framework for the investigation of pleiotropy in two-sample summary data mendelian randomization. Stat Med (2017) 36(11):1783–802. doi: 10.1002/sim.7221
33. Verbanck M, Chen CY, Neale B, Do R. Detection of widespread horizontal pleiotropy in causal relationships inferred from mendelian randomization between complex traits and diseases. Nat Genet (2018) 50(5):693–98. doi: 10.1038/s41588-018-0099-7
34. Sterne JA, Sutton AJ, Ioannidis JP, Terrin N, Jones DR, Lau J, et al. Recommendations for examining and interpreting funnel plot asymmetry in meta-analyses of randomised controlled trials. BMJ (Clinical Res ed) (2011) 343:343d4002. doi: 10.1136/bmj.d4002
35. Georgin-Lavialle S, Aouba A, Mouthon L, Londono-Vallejo JA, Lepelletier Y, Gabet AS, et al. The telomere/telomerase system in autoimmune and systemic immune-mediated diseases. Autoimmun Rev (2010) 9(10):646–51. doi: 10.1016/j.autrev.2010.04.004
36. Andrews NP, Fujii H, Goronzy JJ, Weyand C. Telomeres and immunological diseases of aging. Gerontology (2010) 56(4):390–403. doi: 10.1159/000268620
37. Rossiello F, Jurk D, Passos JF, d'Adda di Fagagna F. Telomere dysfunction in ageing and age-related diseases. Nat Cell Biol (2022) 24(2):135–47. doi: 10.1038/s41556-022-00842-x
38. Barnes RP, Fouquerel E, Opresko PL. The impact of oxidative DNA damage and stress on telomere homeostasis. Mech Ageing Dev (2019) 177:17737–45. doi: 10.1016/j.mad.2018.03.013
39. von Zglinicki T. Oxidative stress shortens telomeres. Trends Biochem Sci (2002) 27(7):339–44. doi: 10.1016/S0968-0004(02)02110-2
40. Scheller Madrid A, Rasmussen KL, Rode L, Frikke-Schmidt R, Nordestgaard BG, Bojesen SE, et al. Observational and genetic studies of short telomeres and alzheimer's disease in 67,000 and 152,000 individuals: a mendelian randomization study. Eur J Epidemiol (2020) 35(2):147–56. doi: 10.1007/s10654-019-00563-w
41. Gurung RL, Dorajoo R MY, M Y, Wang L, Liu S, Liu JJ, et al. Association of leukocyte telomere length with chronic kidney disease in East asians with type 2 diabetes: a mendelian randomization study. Clin Kidney J (2021) 14(11):2371–76. doi: 10.1093/ckj/sfab067
42. Wu D, Xian W, Hong S, Liu B, Xiao H, Li Y, et al. Graves' disease and rheumatoid arthritis: A bidirectional mendelian randomization study. Front Endocrinol (2021) 12:12702482. doi: 10.3389/fendo.2021.702482
43. Zeng Z, Zhang W, Qian Y, Huang H, Wu DJH, He Z, et al. Association of telomere length with risk of rheumatoid arthritis: a meta-analysis and mendelian randomization. Rheumatol (Oxf Engl) (2020) 59(5):940–47. doi: 10.1093/rheumatology/kez524
44. Wagner CL, Hanumanthu VS, Talbot CC Jr., Abraham RS, Hamm D, Gable DL, et al. Short telomere syndromes cause a primary T cell immunodeficiency. J Clin Invest (2018) 128(12):5222–34. doi: 10.1172/JCI120216
45. Coppé JP, Desprez PY, Krtolica A, Campisi J. The senescence-associated secretory phenotype: the dark side of tumor suppression. Annu Rev Pathol (2010) 5:99–118. doi: 10.1146/annurev-pathol-121808-102144
46. Lawlor DA. Commentary: Two-sample mendelian randomization: opportunities and challenges. Int J Epidemiol (2016) 45(3):908–15. doi: 10.1093/ije/dyw127
47. Ziegler A, Pahlke F, König IR. Comments on 'Mendelian randomization: using genes as instruments for making causal inferences in epidemiology' by Debbie a. lawlor, r. m. harbord, j. a. sterne, n. timpson and g. davey smith, statistics in medicine. Stat Med (2008) 27(15):2974–6; author reply 76-8. doi: 10.1002/sim.3034
Keywords: Graves’ disease, leukocyte telomere length, Mendelian randomization analysis, single nucleotide polymorphism, risk factor
Citation: Ye M, Wang Y and Zhan Y (2022) Genetic association of leukocyte telomere length with Graves’ disease in Biobank Japan: A two-sample Mendelian randomization study. Front. Immunol. 13:998102. doi: 10.3389/fimmu.2022.998102
Received: 19 July 2022; Accepted: 15 September 2022;
Published: 29 September 2022.
Edited by:
Makoto Kammori, Niizashiki Central General Hospital, JapanReviewed by:
Sheila Lopez Acevedo, CytoImmune Therapeutics Puerto Rico, LLC, Puerto RicoCopyright © 2022 Ye, Wang and Zhan. This is an open-access article distributed under the terms of the Creative Commons Attribution License (CC BY). The use, distribution or reproduction in other forums is permitted, provided the original author(s) and the copyright owner(s) are credited and that the original publication in this journal is cited, in accordance with accepted academic practice. No use, distribution or reproduction is permitted which does not comply with these terms.
*Correspondence: Yiqiang Zhan, emhhbnlxOEBtYWlsLnN5c3UuZWR1LmNu
†These authors have contributed equally to this work
Disclaimer: All claims expressed in this article are solely those of the authors and do not necessarily represent those of their affiliated organizations, or those of the publisher, the editors and the reviewers. Any product that may be evaluated in this article or claim that may be made by its manufacturer is not guaranteed or endorsed by the publisher.
Research integrity at Frontiers
Learn more about the work of our research integrity team to safeguard the quality of each article we publish.