 Bian Hu
 Muhammad Sajid
 Rong Lv3*
 Cheng Sun
- 1Department of Hepatobiliary Surgery, Anhui Provincial Clinical Research Center for Hepatobiliary Diseases, Anhui Province Key Laboratory of Hepatopancreatobiliary Surgery, The First Affiliated Hospital of University of Science and Technology of China (USTC), Division of Life Sciences and Medicine, University of Science and Technology of China, Hefei, China
- 2Transplant and Immunology Laboratory, The First Affiliated Hospital of University of Science and Technology of China (USTC), Division of Life Sciences and Medicine, University of Science and Technology of China, Hefei, China
- 3Blood Transfusion Laboratory, Anhui Blood Center, Hefei, China
- 4Chinese Academy of Sciences (CAS) Key Laboratory of Innate Immunity and Chronic Disease, School of Basic Medical Sciences, Division of Life Sciences and Medicine, University of Science and Technology of China, Hefei, China
- 5Institute of Immunology, University of Science and Technology of China, Hefei, China
Interpreting the mechanisms and principles that govern gene activity and how these genes work according to -their cellular distribution in organisms has profound implications for cancer research. The latest technological advancements, such as imaging-based approaches and next-generation single-cell sequencing technologies, have established a platform for spatial transcriptomics to systematically quantify the expression of all or most genes in the entire tumor microenvironment and explore an array of disease milieus, particularly in tumors. Spatial profiling technologies permit the study of transcriptional activity at the spatial or single-cell level. This multidimensional classification of the transcriptomic and proteomic signatures of tumors, especially the associated immune and stromal cells, facilitates evaluation of tumor heterogeneity, details of the evolutionary trajectory of each tumor, and multifaceted interactions between each tumor cell and its microenvironment. Therefore, spatial profiling technologies may provide abundant and high-resolution information required for the description of clinical-related features in immuno-oncology. From this perspective, the present review will highlight the importance of spatial transcriptomic and spatial proteomics analysis along with the joint use of other sequencing technologies and their implications in cancers and immune-oncology. In the near future, advances in spatial profiling technologies will undoubtedly expand our understanding of tumor biology and highlight possible precision therapeutic targets for cancer patients.
1 Introduction
Over the past few centuries, the basic concept of tumors has evolved from a cluster of abnormally proliferating cells to a highly organized “organ” (1, 2). Tumors are intricate combinations of malignant cells, stromal cells, and immune cells. These cells, often with considerable heterogeneity, form the so-called microenvironment (TME), which contains a mixture of antitumor and tumor-promoting signals capable of regulating tumor growth and influencing tumor evolution. Although the particular composition of the TME varies by types of tumors, common features, including various immune cells and stromal cells, as well as the surrounding blood vessels, extracellular matrix (ECM) and soluble factors, have been shown by previous studies (3–6). These immune components that constitute the tumor immune microenvironment (TIME) have been brought to the forefront due to their significant roles in tumor biology, which include innate immune cells such as NK cells and innate lymphoid cells (ILCs), adaptive immune cells such as T cells and B cells, and signaling molecules or factors such as checkpoint receptors and their corresponding ligands on the cell surface or in extracellular regions (7, 8). To discover distinctive information about the TIME, early research extends from the molecular characteristics and compositions to the spatial association and architecture of these factors. The spatial profiling of the TIME is mainly summarized as the following four characteristics: spatial distribution and proportion of diversified immune cells in the tumor compartment (Figure 1A); distances between immune cells and their nearest functional-related neighbors (Figure 1B) (9); spatial patterns of direct cell-cell interactions at the level of antigen recognition, as well as autocrine and paracrine signaling (Figure 1C) (10, 11); and the activated or suppressed state of immune cells with molecular and morphological characterization (Figure 1D) (12). While some earlier studies have provided original views on the component and spatial structure of TIME by traditional approaches, advanced techniques have delineated TIME at a considerably elevated degree of throughput, dimensionality and resolution. Evolutionary knowledge and views of the TIME encourage improvements in clinical prognosis and immunotherapy benefits (13–15).
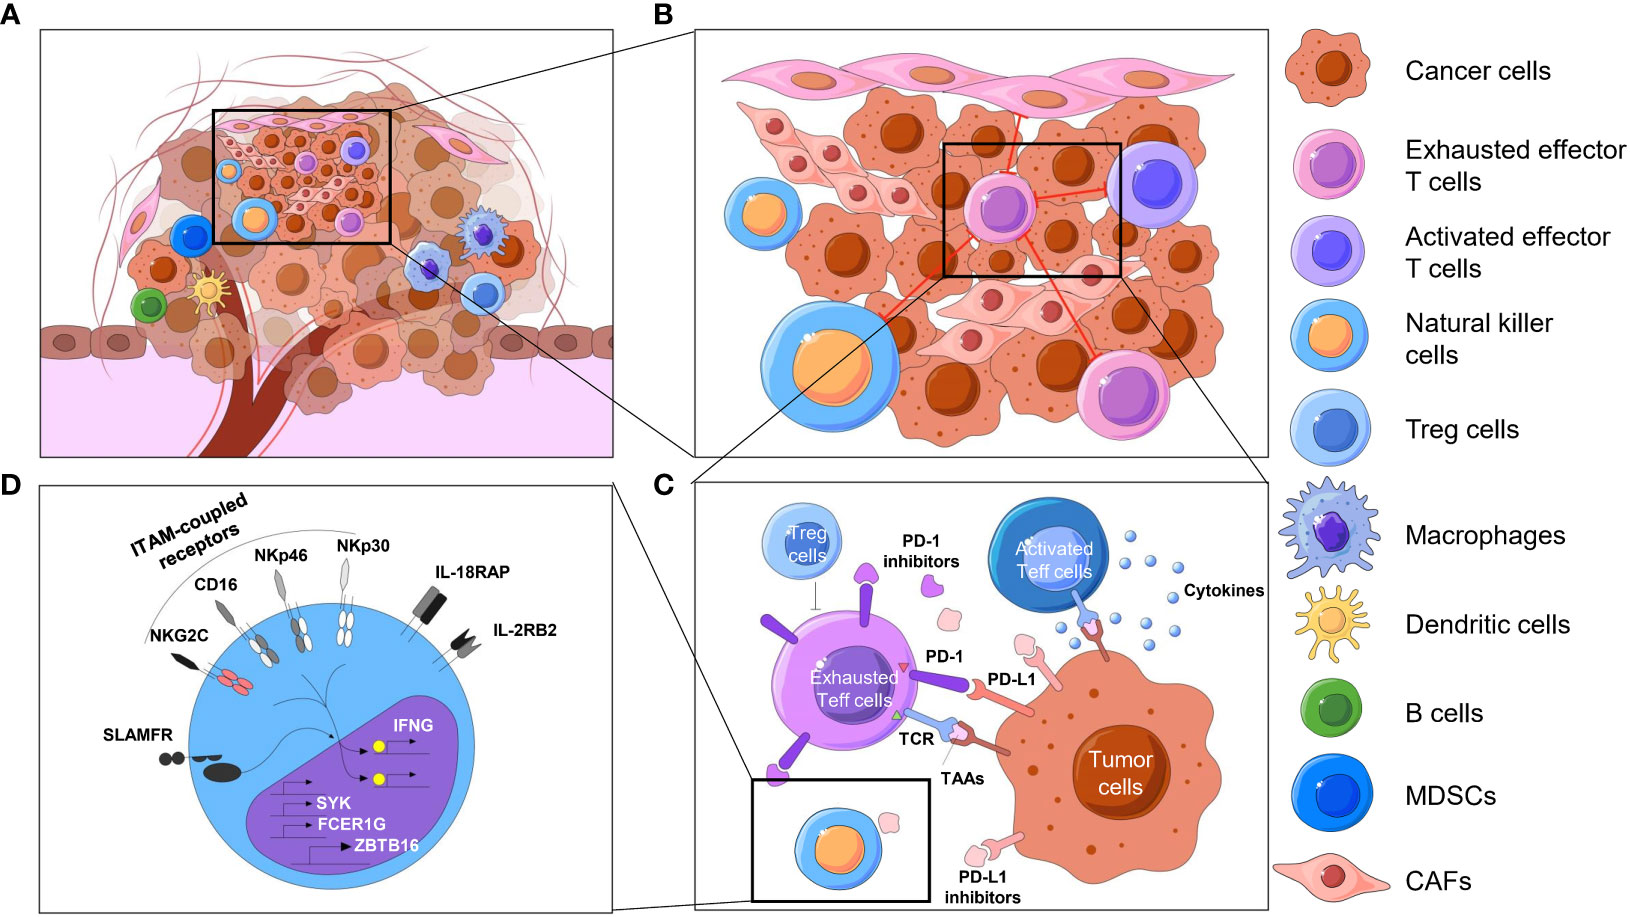
Figure 1 Spatial context of TIME. Overview of the spatial context of the TME and multiomics profiling of the TIME. (A) The cellular compositions of the tumor immune microenvironment, including different kinds of immune cells, including T cells, natural killer cells, dendritic cells, macrophages and so on. (B) The spatial organization of cells, such as cell neighbors (e.g., proximity of tumor and immune cells) in the TIME, reflects biological processes at the tissue level. (C) T cells, for instance, constantly exchange signals with surrounding cells by secreting molecules (e.g., cytokines, chemokines, growth factors) or by direct ligand−receptor binding on the cell surfaces (e.g., immune checkpoints). The activated or exhausted state of these immune cells is an important aspect of the TIME, which may direct different results of immunotherapy. (D) When ligands bind to cell receptors, immune cells respond by processing this signal through complex signal transduction networks and transmit information to the nucleus, where the transcription state is changed in an epigenetic manner. MDSCs, myeloid-derived suppressor cells. CAF, cancer-associated fibroblast.
In this review, we retrospectively review some of the current established spatial profiling technologies of the tumor immune microenvironment in the context of tumor immune oncology. Recent advanced profiling technologies, such as transcriptomic and proteomic analyses, along with joint sequencing technologies, will be outlined (Table 1). Spatial technology applications in different cancer diagnoses and in immune heterogeneity descriptions will also be comprehensively covered. Finally, a discussion, as well as suggestions for ways to overcome current difficulties and for further improvement, will be given.
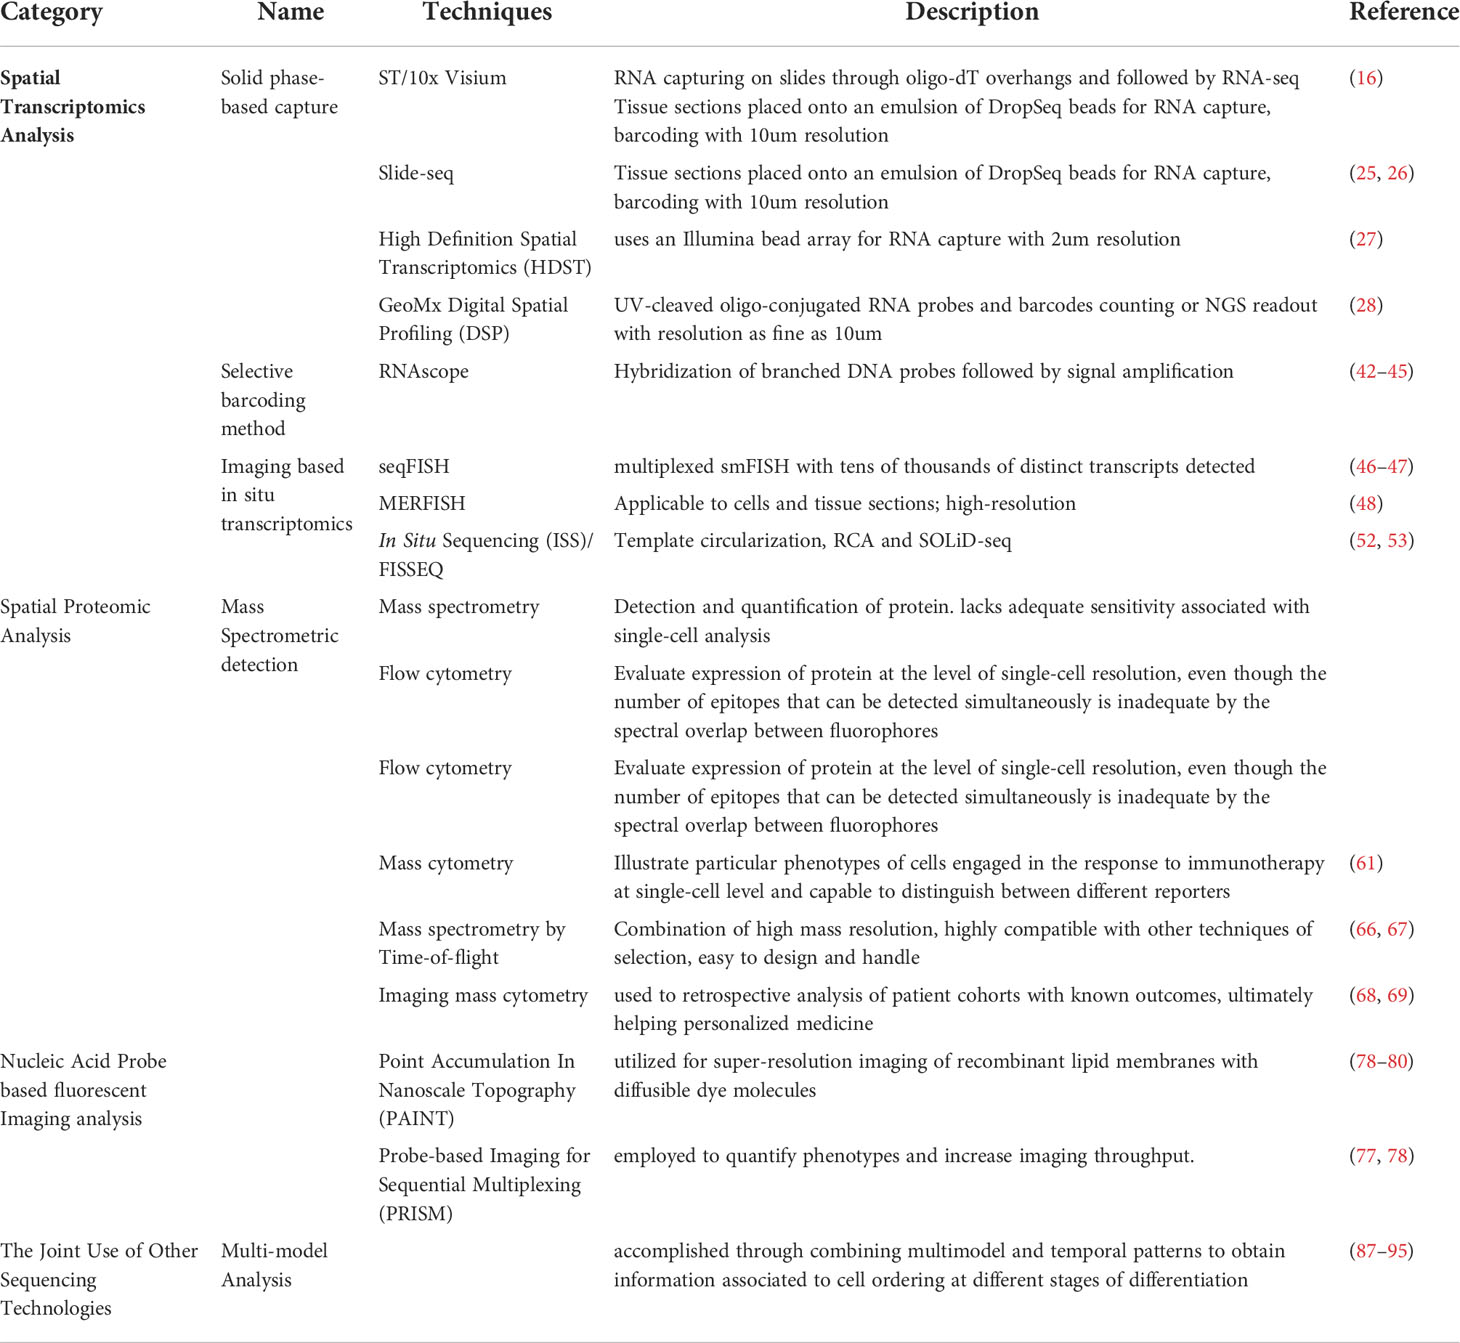
Table 1 Comparison of spatial sequencing technologies.
2 Spatial transcriptomic analysis
2.1 Solid phase-based capture methods
The concept “spatial transcriptomics (ST)” comes from the cross-section of imaging and sequencing brought forward by the groups of Jonas Frisén from the Karolinska Institute and Joakim Lundeberg from National Genomics Infrastructure in Sweden. They were the first to insert the positional barcodes with oligo(dT) primers in the complementary DNA (cDNA) synthesis reaction on glass slides (16), on which they deposited ~200 million oligonucleotides over a 6.2 mm by 6.6 mm square. Tissue sections of the mouse olfactory bulb were immobilized on this area and stained with hematoxylin and eosin for imaging. After that, the tissues were permeabilized and removed. The released RNA was captured, reverse-transcribed in situ and subsequently sent for RNA-seq analysis, and aligned with the tissue image according to the positional barcode array features. The cDNA library generated on slides and the preserved spatial information jointly demonstrated spatial transcriptomic heterogeneity while retaining histological context (48). By applying the method to breast cancer biopsies, they found unexpected heterogeneity which was undetected by traditional transcriptomics approaches (49). In addition to their work, data analysis of prostate cancer (49) and melanoma (50) biopsies by ST have also revealed the differences between the tumor area and peripheral region, as well as the intra- and intertumoral heterogeneity. Nevertheless, the resolution of the ST technique cannot reach the single-cell level and is only suitable for fresh frozen samples because of comparatively low readouts (51).
Based on the primary concept of ST, Visium Spatial Gene Expression Solution, which was developed and popularized by 10× Genomics, has become a kit-based assay requiring much less complicated processes. According to the manuscript provided by 10× Genomics, sectioned samples were placed on commercially processed slides in two or four capture squares. These capture squares contain over 5000 spots with millions of oligonucleotides. Each spot is 55 μm in diameter and 100 μm apart from the center to another. The mRNA released from fresh frozen tissues is captured by those oligonucleotides in the spots and a reverse transcription reaction is performed, thus millions of copies of cDNA are generated for next-generation sequencing (NGS). Considering the size and the arrangement of spots, Visium can reach a resolution of 1 to 10 cells per spot. With a higher resolution and enhanced sensitivity, it is now a well-established commercial platform and service for phenotype investigation. Benefiting from its ability to identify aberrant or novel gene expression in the regions of interest, more genes will undoubtedly be found and lead the direction for immunotherapy (52). The Visium software programs for data analysis provided by 10× Genomics make the whole process readily integrated into existing lab infrastructure and require standard equipment, including cryosection stations, standard fluorescence microscopes, and PCR machines. Additionally, by releasing mRNA in formalin and utilizing whole transcriptome probe panels to hybridize to their target genes, formalin-fixed paraffin-embedded (FFPE) samples are also suitable for library construction (52).
The Visium ST technique has been applied to large areas of research and tissues. By applying Visium to human neurological disorder studies, Maynard et al. defined the spatial profiling gene expression in the dorsolateral prefrontal cortex and identified several layer-enriched genes in distinct cortical layers (53). Recently, Maxime et al. used Visium to investigate the response of B cells in tertiary lymphoid structures (TLSs) and found that renal cell carcinoma patients with more intratumoral TLSs had a high response rate to immune checkpoint blockade and prolonged progression-free survival (PFS) (54).
However, the following limitations should be noted. First, the matrix designed on a 6.5 × 6.5 mm square for mRNA capture limits the comprehensive study of the TIME on a large scale and makes the region of interest (ROI) selection subjective based on the users’ experience. Second, because tissue cryosection and permeabilization conditions vary between tissues, species and laboratories, experienced technicians and proper optimization are still needed. Users are recommended to run an optimization experiment for every new tissue type. Third, although FFPE tissues are currently compatible, the quality of the sections still needs to be verified according to our experience. Because of crosslinking and RNA fragmentation, FFPE treatment reduces the detection efficiency as well as the number of genes to approximately 5 to 10 times lower than their frozen counterparts (55). Finally, despite improved resolution compared to ST, 10× Visium still cannot reach single-cell spatial resolution in most samples. Two recently developed techniques named Slide-seq and high-definition spatial transcriptomics (HDST) have improved the spatial resolution of solid phase-based capture to 10 μm and even 2 μm, respectively, by employing beads harboring barcoded DNA probes (17–19). However, the limitation still exists. Slide-seq is currently incompatible with histological imaging, while HDST has limited numbers of unique molecular identifiers (UMIs) and consequently moderate throughput capacity.
2.2 Selective barcoding methods
Another commercial ST technique, digital spatial profiling (DSP), is a highly complex approach for obtaining spatiotemporal information. Released by NanoString, GeoMX DSP uses oligonucleotide detection to quantitatively analyze gene expression in frozen or FFPE samples. Instead of crosslinking barcoded oligonucleotides and slides as solid phase-based capture strategies, DNA oligos with barcodes are conjugated to primary antibodies or RNA probes by a special linker. This linker is responsive and cleavable to UV light (20). After proteinase K digestion, the tissue sections are incubated with a customized RNA probe cocktail for RNA profiling. After that, fluorophore-tagged antibodies recognizing different cellular compartments or cell markers (up to four markers) are used to obtain morphological images of tissues. Users can thus select the ROI for further analysis with any determined contours. Once the ROI is selected, the oligos in this region are cleaved by UV light and released and further automatically gathered in tubes, which are transferred to a microtiter plate for further readout by nCounter or NGS. Then the sequencing data will be matched with previous morphological images, providing a comprehensive understanding of the spatial information.
Since this technique does not require scanning a whole slide but just collecting the samples from the ROI, DSP offers a more efficient strategy to generate results from more than 10 tissue sections and up to 384 ROIs in 2 days (20). Researchers have used DSP to quantify PD-L1 expression in a standardized cell line index tissue microarray (TMA) and found high concordance with other routinely used techniques, with high reproducibility and appropriateness for long-term stored slides (56). In addition, as GeoMX uses predefined panels instead of oligo(T) capture, NanoString provides different gene panels with over 1,800 genes or 18,000 genes (20, 57) and can detect up to 96 proteins compared to RNA-profiling-only technologies such as Visium. This advantage expands the contents that we can obtain from one valuable tissue and is notably relevant for evaluating posttranscriptional regulation and posttranslational modifications when mRNA and protein expression patterns are not matched (52, 56). DSP is also particularly attractive for researchers, as it preserves the integrity of tissue samples for further application.
Some limitations of DSP are also evident. First, the selection of the ROI is subjective and may lead to biased hypothesis-driven sample analysis (58, 59). Second, the spatial resolution of GeoMX cannot reach the single-cell level but is several hundred micrometers across (60). Third, the kit provided by DSP can only support 4 colors simultaneously, which restricts the throughput of studies on more details of morphology, such as the spatial organization of different kinds of immune cells in the TME concurrently (58). However, it can be foreseen that with the development of imaging approaches, more channels of fluorescence can be expanded for ongoing use.
2.3 Image-Based in Situ Transcriptomics methods
In situ hybridization (ISH) is a classic technique to visualize target DNA or RNA molecules in cells or tissues, including Xenopus laevis oocytes and Drosophila, for developmental studies (61–64). Since radioactive-, fluorescent- or colorimetric-labelled nucleic acid probes and their hybridized onto targets were all developed in the context of ISH (64–66), it can be seen as a precursor of current “spatial transcriptomics” techniques. With fluorescently labelled probes widely used for detecting microorganisms and diagnosing solid or hematological cancers, fluorescence in situ hybridization (FISH) has become a routine clinical test (67, 68). The relatively low throughput, however, has limited conventional FISH to describe the heterogeneity of the TME and TIME.
Since 2013, several improved techniques have been developed based on ISH, such as RNAscope, high-throughput ISS (in situ sequencing), seqFISH and multiplexed error-robust FISH (MERFISH) and those methods based on them. Representative of single-molecule FISH (smFISH), RNAscope (Advanced Cell Diagnostics, USA) is a commercialized ISH-based technology that can distinguish up to 12 different RNA targets each time and achieve better sensitivity and specificity than conventional FISH, even when the target is low in abundance (21–24). Subsequently, multiplexed smFISH was developed to increase the resolution of mRNA detection on ROIs, such as sequential FISH (seqFISH), which could enlarge the volume of target genes from 12 in fixed cells to over 10,000 in sections (25, 26), or MERFISH (27), which applied 4 sets of overhanging probes for fluorescence labelling and acquired images with decoded color-dependent readout patterns. Multiple rounds of hybridization were performed to increase the brightness of the fluorescence signal as well as the numbers of mRNAs to be detected (69, 70). This system was recently released by Vizgen as a commercial MERSCOPE platform.
ISS is another image-based method using barcoded padlock probes to align with the cDNA reverse transcribed in situ, followed by circularization and target-primed rolling circle amplification (RCA) (71). Several detection and sequencing methods relying on ISS have been successfully established, such as FISSEQ (fluorescence in situ sequencing) (28, 29) and STARmap (spatially-resolved transcript amplicon readout mapping) (72). Nonetheless, these methods are limited by the length of cDNA synthesized in situ, and the difficulty of spatially mapping regulatory elements in a systematic as well as unbiased manner. Two recent methods, in situ transcriptome accessibility sequencing (INSTA-Seq) and Expansion sequencing (ExSeq), were reported to resolve the problem by combining ISS with ex situ sequencing (73, 74), indicating a new strategy for depth expansion in spatial information acquisition.
3 Spatial proteomic analysis
3.1 Mass spectrometric-based detection
At present, spatial transcriptomics and spatial proteomics are the two most frequently applied spatial omics techniques for de novo studies or revealing the landscape of the TIME. Proteins signify the primary operational mechanisms of cells, and thus decoding of the proteome expressed at the single-cell stage is of great importance (2). Mass spectrometry is essential for the detection and quantification of proteins. Nevertheless, it is only available for abundant proteins. Investigators have strengthened methods for the formulation and sequestration of proteins, diminishing the loss of proteins and facilitating deeper quantitative proteomic sequencing at single-cell resolution (75). Single-cell proteomic analyses mainly rely on the recognition of targets by employing antibodies or analogous affinity elements, including aptamers or affibodies (76–78). The initiation of mass cytometry requires the application of labelling antibodies with metal isotopes, which considerably increases the quantity of markers that can be examined concurrently on single cells (30). For instance, Wagner et al. generated a comprehensive single-cell atlas of breast cancer using a 35-marker immune cell-centric panel and a 38-marker tumor cell-centric panel (79).
Mass cytometry is a specifically effective method to illustrate particular cell phenotypes engaged in the response to immunotherapy at the single-cell level, as shown in the findings of two studies of melanoma patients’ response to immune checkpoint inhibitors (ICIs) (80). In one study, the researchers utilized mass cytometry to explain that an elevated occurrence of classical monocytes circulating prior to cure is a robust forecaster of anti-PD-1 antibody response, as demonstrated by the analysis of data from a validation cohort of thirty-one patients employing flow cytometry (81). In another investigation, Gide et al. analyzed melanoma biopsies acquired from a subgroup of patients who received anti-PD-1 antibodies as monotherapy or in a mixture with anti-CTLA-4 antibodies. Dimensional decline assessment of a 43-marker large-scale flow cytometry panel recognized fourteen immune cell groups consisting of 3 distinctive T-cell groups. The important markers of differentiation, activation and exhaustion were observed co-expressed on CD45RO+EOMES+ T-cell population, together with the markers of activation and tissue resident (CD69), tissue resident memory (CD103) and effector memory (HLA-DR, T-BET and low CCR7). This subpopulation expresses the inhibitory receptors PD-1 and TIGIT, but low levels of CD57, suggesting that they are not terminally exhausted (82).
Mass cytometry by time-of-flight (CyTOF) depends on the immunolabelling of isotope-labelled antibodies that bind to certain signaling molecules on the cell surface or within the cell, allowing the analysis of 100 different proteins in a single cell (31, 32). Imaging mass cytometry (IMC) was established based on immunohistochemistry with metal-labelled antibodies and CyTOF. IMC can concurrently investigate up to 40 markers of proteins, as well as their spatial structure and connections, which is impossible when using conventional lysis of tissue into single cells. Crucially, IMC can also be applied to paraffin-embedded tissue sections, so it can be used for retrospective analysis of patient groups with known results, ultimately helping with personalized medicine (33, 34). Recently, SCoPE-MS (single-cell proteomics mass spectrometry) based on tandem mass spectrometry (MS/MS) has been established to compute multiplexed single-cell proteomes (83, 84). Single-cell proteomic sequencing technology will change the context of exploring single cell, especially once incorporated into multi-omics technologies.
3.2 Nucleic acid probe-based fluorescence imaging analysis
Multiplexed protein imaging approaches for overcoming the spectral limitations of traditional fluorescence microscopy normally require several cycles of antibody staining and imaging, attained by either elution of antibodies or inactivation of fluorophores utilizing photo- or chemical bleaching (85, 86). In contrast, using diffusive fluorescent imaging probes targeting particular markers of protein or in situ antibodies incapacitates the above boundaries by providing (1) fast probe exchange by employing minor buffering, (2) instantaneous antibody loading prior to imaging, and (3) super-resolution imaging by employing point accumulation in nanoscale topography (PAINT) (87). PAINT was initially proposed by Hochstrasser and Sharonov (88) and was initially utilized for super-resolution imaging of recombinant membranes of lipids with diffusible dye elements. Later, numerous applications and variants of this method were established to produce multichannel data (38, 89), which includes uPAINT (35) using DNA-PAINT and diffusible fluorescent antibodies (86, 87) that make use of df-ssDNA (diffusible fluorescent single-stranded DNA) molecules (imaging probes) that rapidly combine with corresponding ssDNA oligos (docking strands) affixed to target DNA antibodies (89) or nanostructures (38).
Protein-based fragment probes can also be employed to generate multiplexed cytoskeleton and central adhesion super-resolution images with higher labelling intensities than antibody-based methods (85). However, this approach involves the detection of extremely specialized, transiently bound peptides for every single target molecule, which can be difficult to simplify to additional proteins, especially those expressed at reduced amounts compared to proteins of the cytoskeleton. Remarkably, each of the above super-resolution methods depends on time utilization and possesses short-throughput time delay imaging resulting from fluorophore reconstruction and localization used in the traditional single-molecule localization microscopy methods STORM (36) and PALM (37). In addition, diffusible fluorescent probes often generate high background fluorescence, preventing them from quantitative phenotyping of neuron cells employing high-throughput confocal imaging of drug and genomic agitations (90). Probe-based Imaging for Sequential Multiplexing (PRISM) has been employed to quantify phenotypes and increase imaging throughput. Fluorescently labelled single-stranded locked nucleic acid ssLNA (for LNAPRISM) and traditional ssDNA (for DNA-PRISM) oligonucleotides can be used alternately as low- and high-affinity imaging probes for diffraction-restricted confocal or PAINT-based super-resolution imaging. Longer, higher-affinity ssDNA imaging probes could in principle be used for confocal imaging, as previously described (86, 87). A previous study applied LNA-PRISM to thirteen-channel confocal imaging of 7 synaptic proteins simultaneously imaged in cultures of neuron cells, of which five cytoskeletal proteins have been demonstrated to cooperate with each other in vivo (91). These multiplexed imaging data facilitate measurable analysis of sixty-six protein co-expression profiles obtained from thousands of distinct synapses inside the identical intact neuron, showing intense associations between subsets of synaptic proteins, as well as discrepancies in synapse subtypes. Furthermore, a previous study utilized LNA-PRISM to measure fluctuations in the levels of synaptic proteins and the composition of synaptic subtypes in excitative synapses following obstruction of voltage-gated sodium channels with tetrodotoxin (TTX) treatment, as previously described, to observe the mechanisms of homeostatic plasticity (92–95).
Probe-based in situ techniques are considered for large-scale purposes through their comprehensive maintenance of spatial evidence and comparatively minimal expense. However, probe-based techniques only use existing probes to detect known targets. Therefore, they are not suitable for identifying new biological effects, such as indeterminate molecules.
4 The joint use of other sequencing technologies
There is increasing interest in integrating different single-cell analysis modalities into comprehensive techniques. Single-cell multimodal analysis can also be used to describe how cellular states evolve along different stages of cellular differentiation. This can be achieved by combination of multimodal and temporal patterns to capture information related to cell ordering at different stages of differentiation (92). Four different strategies can be employed to achieve multimodal data. First, using a non-destructive assay such as multiparameter fluorescence-activated cell sorting (FACS) prior to sequencing, which can allow the measurements of protein levels linked to the transcriptomes in the same cell; second, the separation of different cellular fractions or components for parallel experiment in lyse-and-split way. For example, the nucleus can be physically isolated for bisulfite sequencing while the rest cytosolic mRNAs can be used for scRNA-seq, which will gather data on the methylomes and transcriptomes respectively; third, converting multimodal data into a common molecular format, like cDNA, for simultaneous analysis by common methods such as DNA sequencing. For example, cell surface protein can be captured by antibodies conjugated with polyadenylated barcodes. Combined with standard scRNA-seq, the polyadenylated barcodes can be captured for an estimate of protein levels for each cell; fourth, additional information extraction from analysis of scRNA-seq data, such as using unspliced intron detection for RNA velocity estimation (93). Technologies that incorporate single-cell recognition of proteins into scRNA-seq procedures, such as REAP-seq and CITE-seq, employ antibodies conjugated to barcoded oligonucleotides via a cDNA sequencing step for scRNA-seq, enabling protein detection and thereby not limited by spectral overlap or the amount of solvable metal ions (94, 95). For instance, juxtaposition expansion detection using barcoded antibodies facilitated the improvement of a commercial 96-plex panel for protein detection in plasma and serum samples (39). The expansion of the throughput of protein detection will surely benefit for our knowledge of the TIME from limited samples. The use of oligonucleotide-labelled antibodies is integrated into the Tapestri workflow for the sequencing of single-cell DNA, presenting an uncomplicated procedure of combining phenotype and genotype (40).
The scATAC-seq (single-cell Assay for Transposase-Accessible Chromatin with high-throughput sequencing) data encompass sequencing reads from the mitochondrial genome. Even though these signals were initially seen as an experimental nuisance, this property can detect mutations in mitochondria DNA, which may be employed to achieve clone tracing (41, 42). Consequently, scATAC sequencing allows instantaneous quantification of cell fate (through the nuclear epigenome) and cell lineage (through the mitochondrial genome). Mutations in mitochondria DNA may be identified in scRNA-seq data, albeit less than in scATAC sequencing data owing to less and lower consistent coverage of the mitochondrial genome (43). The tracing assessment of such lineages might be utilized in the future to better identify which clones of tumor cells develop, and such clones may be associated with resistance to treatment.
5 Spatial profiling technologies applications
The rapid development of current spatially resolved transcriptomics technologies has extended our view of subjects, from human, mouse, and nonhuman primate brains (27, 44–47), to various cancers (49, 50, 96–99). The growing interest in analyzing the molecular constitution of the TME or TIME and the demand to study cell-cell interactions call for wide use of these technologies in clinical and biological research. Basically, the applications of spatial profiling technologies lie in three aspects: 1) Discovering the heterogeneity of cells in cancers or other diseases, especially on immune cells; 2) Establishing spatial transcriptome atlases for human, mouse or even plant tissues; and 3) Delineating an embryonic developmental and spatial blueprint on human or model animals.
5.1 Applications in cancers
To study cancer as a complicated biological system with extensive heterogeneity intratumorally and across patients, single-cell technologies such as flow cytometry or single-cell RNA sequencing have been widely applied and have expanded the depth of research, such as, showing more details of the TIME. However, to investigate the spatial contexts of the microenvironment, image-based techniques such as FISH, Visium and multiparameter immunofluorescence should be combined.
FISH has been widely used to detect oncogenes in surgical pathology, especially on the alterations of chromosomes, including deletions, gains, translocations, amplifications and polysomy. Many mutations, such as the BCR-ABL1 t (9; 22) translocation, EML4-ALK fusion gene and TMPRSS2-ERG fusion gene, have been identified by FISH in chronic myeloid leukemia, non-small cell lung cancer and prostate cancer, respectively (67, 100, 101). Researchers have also used FISH to predict and judge the clinical response to PD-1 blockade therapy in advanced melanomas and renal cell carcinomas (102, 103). By overcoming the limitation of conventional FISH at the DNA level, RNAscope was developed to detect low-content mRNA, avoiding high background, and applied in evaluating the expression of immune checkpoints in cancers for diagnosis, including lung adenosquamous cell carcinomas, advanced gastric cancer, triple-negative breast cancer and bladder carcinomas (104–107). It can also be used in studying the mechanisms of immune escape, new prognostic cancer biomarkers (108–113) or even in tracing genetically modified cells, including CAR-T cells, in human bodies after infusion to provide long-lasting validation (114). Similarly, multiplexed smFISH was also used to study tumor heterogeneity in breast cancer, combined with microfluidics technology (115).
Visium has also been reported to reveal the heterogeneity of cancers. Willis et al. utilized this technique to identify the induction of IL-6 signaling in vivo and suggested its therapeutic value (116). For another interesting example, tumor-specific keratinocyte (TSK) clusters were identified with MMP10 as a marker by the first generation of ST at the tumor leading edges in patients with squamous cell carcinoma. With the help of enhanced Visium, enrichment of transcripts related to endothelial and cancer-associated fibroblasts in the stroma was found, revealing a fibrovascular niche surrounding TSK clusters in the TME (98). DSP has also been widely applied in predicting and evaluating the response to immunotherapy, especially immune checkpoint blockade, such as anti-PD-1/PD-L1 therapies (117), which provides standardized, objective and accurate data on the expression of checkpoints of interest within defined locations. Compared to other routinely used techniques, such as quantitative immunofluorescence, high consistency and reproducibility can be seen by DSP (56).
5.2 Applications in immunology
The contents of the TIME have been proven to play a crucial role in the progression of tumorigenesis, including metastasis and recurrence. The attempt to transform the tumor-promoting TIME into a tumor-inhibiting environment has encouraged us to focus on exploring the mechanism of the tumor-immune interplay involved in the TIME. A thorough examination has already been carried out, and the details below the phenotypes are to be discovered by relying on new technologies.
On the other hand, it is well known that immune cells and their secreted factors are the main components of the TIME. The former, which involves T cells, B cells, natural killer (NK) cells, macrophages, dendritic cells (DCs), myeloid-derived suppressor cells (MDSCs) and so on (Figure 2A), have complex, disabling or even opposite functions compared to their normal state. The latter, including cytokines, chemokines and growth factors (Figure 2B), also show benefits in clinical application (refusion or blockade), while the toxicity and which to choose for use still need to be addressed. Analyzing immune elements in a reductionistic way may lead to confusion and misunderstanding. A comprehensive understanding of these elements through the application of high-throughput technologies such as single-cell transcriptomics, proteomics, epigenomics, and bioinformatics can provide novel insights and better strategies for cancer immunotherapy.
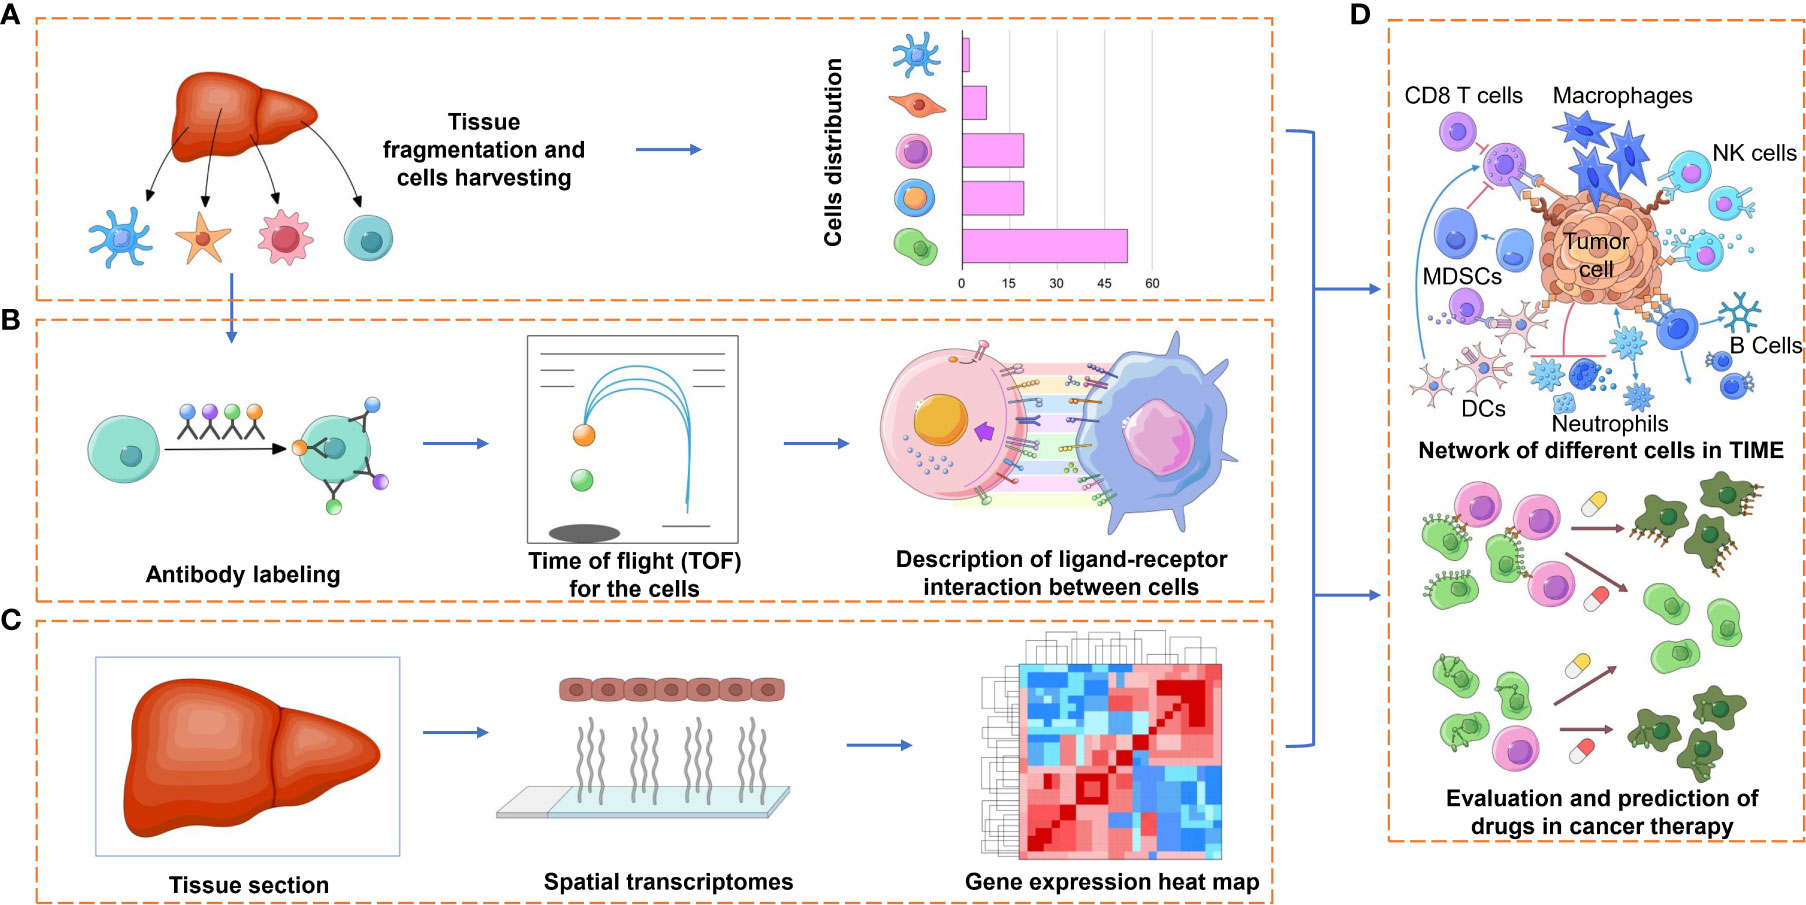
Figure 2 Applications of spatial profiling technologies to the TIME. Representation of some of the application facets of the TIME research by spatial profiling technologies. (A) The detection and quantification of the different immune cell types of the TIME, which may have pro- or antitumorigenic roles, can provide prognostic and predictive markers for immunotherapy. (B) Characterizing various cell subtypes (e.g., CD4+ and CD8+ T cells, NK cells, macrophages) by different functional orientations (e.g., naïve, effector, memory) and states (e.g., activated, anergic, exhausted) by technologies such as cyTOF, which may lend to a comprehensive understanding of the immense diversity of ligand receptors between tumor cells and immune cells or to finding more inhibitory receptors on immune cells. (C) The spatial and transcriptional information provided by ST or Visium with further bioinformatic analysis will be used for the description of TIME in a high-throughput way. (D) Evaluation and prediction of the curative effect of cancer therapies, such as immunotherapy with immune checkpoint blockade or targeted therapy, based on the combined information provided above.
5.2.1 Characterization of immune cell heterogeneity in the TIME
Traditional bulk gene profiling cannot distinguish RNA profiling from tumor cells or immune cells. Classic single-cell RNA-seq could solve the problem but could not reveal the localization of these immune cells. Spatial technology approaches are valued for the following reasons: first, cell populations characterized by several typical biomarkers can be qualitatively analyzed across the spatial dimension or in subcellular resolution; second, visualization in the ROI field after image processing and analysis could characterize the state of immune cells across the whole biopsy sample and is of diagnostic benefit to clinical research; third, tracking the distribution of cells of interest, for example CAR-T, in some specific regions or tissues (Figure 2C).
Jeyasekharan et al. used a customized panel of 36 antibodies for DSP from samples of diffuse large B-cell lymphoma (DLBCL) patients pretreated with chemoimmunotherapy (118) and revealed that CD68+CD163+ M2 macrophages showed dramatic negative impacts on prognosis. This finding provides the basis for further treatments targeting tumor-infiltrating macrophages. Helmink et al. used a multiplex immunofluorescence assay and scRNA-seq to analyze the responses of intratumorally B cells in metastatic melanoma and renal cell carcinoma (RCC) after immune checkpoint blockade. They have shown the supporting role of B cells in T-cell function within tertiary lymphoid structures (TLSs), and differential B-cell phenotypes, including memory B cells, double-negative (CD27-IgD-) subtypes, and plasma (-like) cells, were found by mass cytometry (119). Cabrita et al. also used metastatic melanoma samples and GeoMx DSP with proteomic analysis to reveal that different mature stages of TLSs existed in tumors, and mature TLSs were associated with high expression of Ki67 and CD40 on B cells, as well as a high proportion of CD4+ T cells and increased memory T cells. This signature could be used for predicting the response to ICBs (120).
In short, spatially resolved high-plex profiling technologies have enhanced our ability to study the interactions and relationships of the contents in the TIME to a much deeper and finer degree than ever and will benefit immunotherapy for various tumors (Figure 2D up).
5.2.2 Identifying biomarkers or neoantigens for immunotherapy
It is becoming common practice that expanded autologous or allogeneic immune cells, genetically engineered or not, are infused into patients with tumors for so-called adoptive cell therapy (ACT) (121). The infused cells include engineered TCR-T cells and chimeric antigen receptor T cells (CAR-T cells) or CAR-NK cells in which T or NK cells are armored by artificial TCRs or CARs to recognize tumour-associated antigens (TAAs). Given that T effector cells and NK cells may be lost of function or inhibited in the TIME, engineered TCRs or CARs provide a specific activator for these immune cells. Researchers and pharmaceutical enterprises have long been searching for appropriate and effective TAAs, which are consistently expressed on tumor cells but are not or less expressed on healthy tissues. Therefore, the identification of neoantigens or biomarkers will benefit ACT directly (Figure 2D below).
It has been shown that TAAs searched from colorectal cancer, breast cancer, and cholangiocarcinoma could be beneficial for T-cell recognition and killing of tumor cells in vitro (122–124). Tran et al. identified 26 somatic mutations from a metastatic cholangiocarcinoma patient and transferred these mutant genes into APCs for further antigen presentation. After coculturing these APCs with patient-derived TILs, antigen-specific CD4+Vb22+ T-cell clones were identified, isolated and proven to be effective in epithelial cancer (122). There is no doubt that once combined with spatial transcriptomics technologies, more neoantigens will be found or confirmed in biopsy samples.
6 Conclusion and future perspectives
Spatial profiling techniques have led to a whole range of discoveries about the mechanisms underlying the immune system. We highlighted some of these findings, which provide awareness of the spatial characteristics of different technologies and their applications in the field of immunology. These technologies are becoming more accessible and applicable in the diagnosis of different cancers and will be employed to meet increasingly complex and multidimensional requirements, such as computing relationships between proteins and their corresponding transcripts or analyzing the landscape of posttranslational modifications. New multimodal single-cell spatial profiling techniques are proposed every year, some of which have not yet been applied to immune cells. For instance, a significant but unanswered problem is the identification of target genes associated with transcription factors, as this leads to a better interpretation of the molecular network modules that operate immune cell pedigrees and their differentiation. Techniques for assessing spatial profiling are advancing rapidly, so there is no single spatial profiling technique that is considered best for all purposes. Based on the biological problem posed, experimental approaches can be developed to combine any spatial profiling methodology with single-cell RNA-seq. In summary, the integration of sequencing technologies can yield more complicated, high-throughput data, including genomic, transcriptomic, epigenomic, proteomic, spatial and temporal information, which requires the expansion of robust and accurate algorithms or models that stipulate novel approaches for classification, diagnosis, prognosis prediction, and targeted therapy. Conspicuously, the sensitivity and precision of emerging technologies and computational analysis must be improved, so that costs will become more reasonable in the near future.
Author contributions
CS conceived and directed the project. BH and MS contributed equally. BH, MS, and CS drafted the manuscript. All authors contributed to the article and approved the submitted version
Funding
This work was supported by the National Key Research and Development Program of China (# 2021YFC2300600), National Natural Science Foundation of China (#82022056, #92169118, #91942310) and Natural Science Foundation of Anhui Provincial (# 2008085J35).
Conflict of interest
The authors declare that the research was conducted in the absence of any commercial or financial relationships that could be construed as a potential conflict of interest.
Publisher’s note
All claims expressed in this article are solely those of the authors and do not necessarily represent those of their affiliated organizations, or those of the publisher, the editors and the reviewers. Any product that may be evaluated in this article, or claim that may be made by its manufacturer, is not guaranteed or endorsed by the publisher.
References
1. Hainaut P, Plymoth A. Targeting the hallmarks of cancer: towards a rational approach to next-generation cancer therapy. Curr Opin Oncol (2013) 25:50–1. doi: 10.1097/CCO.0b013e32835b651e
2. Fu T, Dai L-J, Wu S-Y, Xiao Y, Ma D, Jiang Y-Z, et al. Spatial architecture of the immune microenvironment orchestrates tumor immunity and therapeutic response. J Hematol Oncol (2021) 14:1–25. doi: 10.1186/s13045-021-01103-4
4. Balkwill FR, Capasso M, Hagemann T. The tumor microenvironment at a glance. J Cell Sci (2012) 125:5591–6. doi: 10.1242/jcs.116392
5. Bader JE, Voss K, Rathmell JC. Targeting metabolism to improve the tumor microenvironment for cancer immunotherapy. Mol Cell (2020) 78:1019–33. doi: 10.1016/j.molcel.2020.05.034
6. Riera-Domingo C, Audigé A, Granja S, Cheng W-C, Ho P-C, Baltazar F, et al. Immunity, hypoxia, and metabolism–the ménage à trois of cancer: implications for immunotherapy. Physiol Rev (2020) 100:1–102. doi: 10.1152/physrev.00018.2019
7. Binnewies M, Roberts EW, Kersten K, Chan V, Fearon DF, Merad M, et al. Understanding the tumor immune microenvironment (TIME) for effective therapy. Nat Med (2018) 24:541–50. doi: 10.1038/s41591-018-0014-x
8. Gajewski TF, Schreiber H, Fu Y-X. Innate and adaptive immune cells in the tumor microenvironment. Nat Immunol (2013) 14:1014–22. doi: 10.1038/ni.2703
9. Schürch CM, Bhate SS, Barlow GL, Phillips DJ, Noti L, Zlobec I, et al. Coordinated cellular neighborhoods orchestrate antitumoral immunity at the colorectal cancer invasive front. Cell (2020) 182:1341–59. doi: 10.1016/j.cell.2020.07.005
10. Fridman WH, Galon J, Pagès F, Tartour E, Sautès-Fridman C, Kroemer G. Prognostic and predictive impact of intra-and peritumoral immune infiltrates. Cancer Res (2011) 71:5601–5. doi: 10.1158/0008-5472.CAN-11-1316
11. Zhang L, Conejo-Garcia JR, Katsaros D, Gimotty PA, Massobrio M, Regnani G, et al. Intratumoral T cells, recurrence, and survival in epithelial ovarian cancer. New Engl J Med (2003) 348:203–13. doi: 10.1056/NEJMoa020177
12. Gide TN, Silva IP, Quek C, Ahmed T, Menzies AM, Carlino MS, et al. Close proximity of immune and tumor cells underlies response to anti-PD-1 based therapies in metastatic melanoma patients. Oncoimmunology (2020) 9:1659093. doi: 10.1080/2162402X.2019.1659093
13. Jackson HW, Fischer JR, Zanotelli VRT, Ali HR, Mechera R, Soysal SD, et al. The single-cell pathology landscape of breast cancer. Nature (2020) 578:615–20. doi: 10.1038/s41586-019-1876-x
14. Stoltzfus CR, Filipek J, Gern BH, Olin BE, Leal JM, Wu Y, et al. CytoMAP: A spatial analysis toolbox reveals features of myeloid cell organization in lymphoid tissues. Cell Rep (2020) 31:107523. doi: 10.1016/j.celrep.2020.107523
15. Keren L, Bosse M, Marquez D, Angoshtari R, Jain S, Varma S, et al. A structured tumor-immune microenvironment in triple negative breast cancer revealed by multiplexed ion beam imaging. Cell (2018) 174:1373–87. doi: 10.1016/j.cell.2018.08.039
16. Ståhl PL, Salmén F, Vickovic S, Lundmark A, Navarro JF, Magnusson J, et al. Visualization and analysis of gene expression in tissue sections by spatial transcriptomics. Sci (1979) (2016) 353:78–82. doi: 10.1126/science.aaf2403
17. Rodriques SG, Stickels RR, Goeva A, Martin CA, Murray E, Vanderburg CR, et al. Slide-seq: A scalable technology for measuring genome-wide expression at high spatial resolution. Sci (1979) (2019) 363:1463–7. doi: 10.1126/science.aaw1219
18. Stickels RR, Murray E, Kumar P, Li J, Marshall JL, di Bella DJ, et al. Highly sensitive spatial transcriptomics at near-cellular resolution with slide-seqV2. Nat Biotechnol (2021) 39:313–9. doi: 10.1038/s41587-020-0739-1
19. Vickovic S, Eraslan G, Salmén F, Klughammer J, Stenbeck L, Schapiro D, et al. High-definition spatial transcriptomics for in situ tissue profiling. Nat Methods (2019) 16:987–90. doi: 10.1038/s41592-019-0548-y
20. Merritt CR, Ong GT, Church SE, Barker K, Danaher P, Geiss G, et al. Multiplex digital spatial profiling of proteins and RNA in fixed tissue. Nat Biotechnol (2020) 38:586–99. doi: 10.1038/s41587-020-0472-9
21. Wang F, Flanagan J, Su N, Wang L-C, Bui S, Nielson A, et al. RNAscope. J Mol Diagnostics (2012) 14:22–9. doi: 10.1016/j.jmoldx.2011.08.002
22. Anderson CM, Zhang B, Miller M, Butko E, Wu X, Laver T, et al. Fully automated RNAscope In situ hybridization assays for formalin-fixed paraffin-embedded cells and tissues. J Cell Biochem (2016) 117:2201–8. doi: 10.1002/jcb.25606
23. Erben L, Buonanno A. Detection and quantification of multiple RNA sequences using emerging ultrasensitive fluorescent In situ hybridization techniques. Curr Protoc Neurosci (2019) 87:e63. doi: 10.1002/cpns.63
24. Roberts K, Bayraktar OA. Automation of multiplexed RNAscope single-molecule fluorescent In situ hybridization and immunohistochemistry for spatial tissue mapping. Methods Mol Biol (2020) 2148: 229–44. doi: 10.1007/978-1-0716-0623-0_15
25. Lubeck E, Coskun AF, Zhiyentayev T, Ahmad M, Cai L. Single-cell in situ RNA profiling by sequential hybridization. Nat Methods (2014) 11:360–1. doi: 10.1038/nmeth.2892
26. Eng C-HL, Lawson M, Zhu Q, Dries R, Koulena N, Takei Y, et al. Transcriptome-scale super-resolved imaging in tissues by RNA seqFISH+. Nature (2019) 568:235–9. doi: 10.1038/s41586-019-1049-y
27. Chen KH, Boettiger AN, Moffitt JR, Wang S, Zhuang X. Spatially resolved, highly multiplexed RNA profiling in single cells. Sci (1979) (2015) 348(6233):aaa6090. doi: 10.1126/science.aaa6090
28. Lee JH, Daugharthy ER, Scheiman J, Kalhor R, Yang JL, Ferrante TC, et al. Highly multiplexed subcellular RNA sequencing in situ. Sci (1979) (2014) 343:1360–3. doi: 10.1126/science.1250212
29. Lee JH, Daugharthy ER, Scheiman J, Kalhor R, Ferrante TC, Terry R, et al. Fluorescent in situ sequencing (FISSEQ) of RNA for gene expression profiling in intact cells and tissues. Nat Protoc (2015) 10:442–58. doi: 10.1038/nprot.2014.191
30. Spitzer MH, Nolan GP. Mass cytometry: single cells, many features. Cell (2016) 165:780–91. doi: 10.1016/j.cell.2016.04.019
31. Leipold MD, Maecker HT. Mass cytometry: protocol for daily tuning and running cell samples on a CyTOF mass cytometer. JoVE (Journal Visualized Experiments) (2012) 69:e4398. doi: 10.3791/4398
32. Zhu YP, Eggert T, Araujo DJ, Vijayanand P, Ottensmeier CH, Hedrick CC. CyTOF mass cytometry reveals phenotypically distinct human blood neutrophil populations differentially correlated with melanoma stage. J Immunother Cancer (2020) 8(2):e000473. doi: 10.1136/jitc-2019-000473
33. Chang Q, Ornatsky OI, Siddiqui I, Loboda A, Baranov VI, Hedley DW. Imaging mass cytometry. Cytometry Part A (2017) 91:160–9. doi: 10.1002/cyto.a.23053
34. Veenstra J, Dimitrion P, Yao Y, Zhou L, Ozog D, Mi Q-S. Research techniques made simple: use of imaging mass cytometry for dermatological research and clinical applications. J Invest Dermatol (2021) 141:705–12. doi: 10.1016/j.jid.2020.12.008
35. Giannone G, Hosy E, Levet F, Constals A, Schulze K, Sobolevsky AI, et al. Dynamic superresolution imaging of endogenous proteins on living cells at ultra-high density. Biophys J (2010) 99:1303–10. doi: 10.1016/j.bpj.2010.06.005
36. Rust MJ, Bates M, Zhuang X. Sub-Diffraction-limit imaging by stochastic optical reconstruction microscopy (STORM). Nat Methods (2006) 3:793–6. doi: 10.1038/nmeth929
37. Betzig E, Patterson GH, Sougrat R, Lindwasser OW, Olenych S, Bonifacino JS, et al. Imaging intracellular fluorescent proteins at nanometer resolution. Sci (1979) (2006) 313:1642–5. doi: 10.1126/science.1127344
38. Jungmann R, Steinhauer C, Scheible M, Kuzyk A, Tinnefeld P, Simmel FC. Single-molecule kinetics and super-resolution microscopy by fluorescence imaging of transient binding on DNA origami. Nano Lett (2010) 10:4756–61. doi: 10.1021/nl103427w
39. Assarsson E, Lundberg M, Holmquist G, Björkesten J, Bucht Thorsen S, Ekman D, et al. Homogenous 96-plex PEA immunoassay exhibiting high sensitivity, specificity, and excellent scalability. PloS One (2014) 9:e95192. doi: 10.1371/journal.pone.0095192
40. Miles LA, Bowman RL, Merlinsky TR, Csete IS, Ooi AT, Durruthy-Durruthy R, et al. Single-cell mutation analysis of clonal evolution in myeloid malignancies. Nature (2020) 587:477–82. doi: 10.1038/s41586-020-2864-x
41. Xu J, Nuno K, Litzenburger UM, Qi Y, Corces MR, Majeti R, et al. Single-cell lineage tracing by endogenous mutations enriched in transposase accessible mitochondrial DNA. Elife (2019) 8:e45105. doi: 10.7554/eLife.45105.033
42. Ludwig LS, Lareau CA, Ulirsch JC, Christian E, Muus C, Li LH, et al. Lineage tracing in humans enabled by mitochondrial mutations and single-cell genomics. Cell (2019) 176:1325–39. doi: 10.1016/j.cell.2019.01.022
43. Peng A, Mao X, Zhong J, Fan S, Hu Y. Single-cell multi-omics and its prospective application in cancer biology. Proteomics (2020) 20:1900271. doi: 10.1002/pmic.201900271
44. la Manno G, Gyllborg D, Codeluppi S, Nishimura K, Salto C, Zeisel A, et al. Molecular diversity of midbrain development in mouse, human, and stem cells. Cell (2016) 167:566–580.e19. doi: 10.1016/j.cell.2016.09.027
45. Shah S, Lubeck E, Zhou W, Cai L. In situ transcription profiling of single cells reveals spatial organization of cells in the mouse hippocampus. Neuron (2016) 92:342–57. doi: 10.1016/j.neuron.2016.10.001
46. Bakken TE, Miller JA, Luo R, Bernard A, Bennett JL, Lee C-K, et al. Spatiotemporal dynamics of the postnatal developing primate brain transcriptome. Hum Mol Genet (2015) 24:4327–39. doi: 10.1093/hmg/ddv166
47. Wong-Rolle A, Dong Q, Zhu Y, Divakar P, Hor JL, Kedei N, et al. Spatial meta-transcriptomics reveal associations of intratumor bacteria burden with lung cancer cells showing a distinct oncogenic signature. J Immunother Cancer (2022) 10:e004698. doi: 10.1136/jitc-2022-004698
48. Jemt A, Salmén F, Lundmark A, Mollbrink A, Fernández Navarro J, Ståhl PL, et al. An automated approach to prepare tissue-derived spatially barcoded RNA-sequencing libraries. Sci Rep (2016) 6:37137. doi: 10.1038/srep37137
49. Berglund E, Maaskola J, Schultz N, Friedrich S, Marklund M, Bergenstråhle J, et al. Spatial maps of prostate cancer transcriptomes reveal an unexplored landscape of heterogeneity. Nat Commun (2018) 9:2419. doi: 10.1038/s41467-018-04724-5
50. Thrane K, Eriksson H, Maaskola J, Hansson J, Lundeberg J. Spatially resolved transcriptomics enables dissection of genetic heterogeneity in stage III cutaneous malignant melanoma. Cancer Res (2018), 78(20):5970–79. doi: 10.1158/0008-5472.CAN-18-0747
51. Salmén F, Ståhl PL, Mollbrink A, Navarro JF, Vickovic S, Frisén J, et al. Barcoded solid-phase RNA capture for spatial transcriptomics profiling in mammalian tissue sections. Nat Protoc (2018) 13:2501–34. doi: 10.1038/s41596-018-0045-2
52. Nerurkar SN, Goh D, Cheung CCL, Nga PQY, Lim JCT, Yeong JPS. Transcriptional spatial profiling of cancer tissues in the era of immunotherapy: The potential and promise. Cancers (Basel) (2020) 12:2572. doi: 10.3390/cancers12092572
53. Maynard KR, Collado-Torres L, Weber LM, Uytingco C, Barry BK, Williams SR, et al. Transcriptome-scale spatial gene expression in the human dorsolateral prefrontal cortex. Nat Neurosci (2021) 24:425–36. doi: 10.1038/s41593-020-00787-0
54. Meylan M, Petitprez F, Becht E, Bougoüin A, Pupier G, Calvez A, et al. Tertiary lymphoid structures generate and propagate anti-tumor antibody-producing plasma cells in renal cell cancer. Immunity (2022) 55:527–541.e5. doi: 10.1016/j.immuni.2022.02.001
55. Moses L, Pachter L. Museum of spatial transcriptomics. Nat Methods (2022) 19:534–46. doi: 10.1038/s41592-022-01409-2
56. Gupta S, Zugazagoitia J, Martinez-Morilla S, Fuhrman K, Rimm DL. Digital quantitative assessment of PD-L1 using digital spatial profiling. Lab Invest (2020) 100:1311–7. doi: 10.1038/s41374-020-0424-5
57. Roberts K, Aivazidis A, Kleshchevnikov V, Li T, Fropf R, Rhodes M, et al. Transcriptome-wide spatial RNA profiling maps the cellular architecture of the developing human neocortex. bioRxiv (2021) 2021:3. doi: 10.1101/2021.03.20.436265
58. Decalf J, Albert ML, Ziai J. New tools for pathology: a user’s review of A highly multiplexed method for in situ analysis of protein and RNA expression in tissue. J Pathol (2019) 247:650–61. doi: 10.1002/path.5223
59. Asp M, Bergenstråhle J, Lundeberg J. Spatially resolved transcriptomes–next generation tools for tissue exploration. BioEssays (2020) 42:1900221. doi: 10.1002/bies.201900221
60. Wilbrey-Clark A, Roberts K, Teichmann SA. Cell atlas technologies and insights into tissue architecture. Biochem J (2020) 477:1427–42. doi: 10.1042/BCJ20190341
61. Gall JG, Lou PM. Formation and detection of rna-dna hybrid molecules in cytological preparations. Proc Of Natl Acad Of Sci (1969) 63:378–83. doi: 10.1073/pnas.63.2.378
62. HA JOHN, ML BIRNSTIEL, JONES KW. RNA-DNA Hybrids at the cytological level. Nature (1969) 223:582–7. doi: 10.1038/223582a0
63. Harrison PR, Conkie D, Paul J, Jones K. Localisation of cellular globin messenger RNA by in situ hybridisation to complementary DNA. FEBS Lett (1973) 32:109–12. doi: 10.1016/0014-5793(73)80749-5
64. Langer-Safer PR, Levine M, Ward DC. Immunological method for mapping genes on drosophila polytene chromosomes. Proc Natl Acad Sci (1982) 79:4381–5. doi: 10.1073/pnas.79.14.4381
65. GT RUDKIN, BD STOLLAR. High resolution detection of DNA–RNA hybrids in situ by indirect immunofluorescence. Nature (1977) 265:472–3. doi: 10.1038/265472a0
66. Tautz D, Pfeifle C. A non-radioactive in situ hybridization method for the localization of specific RNAs in drosophila embryos reveals translational control of the segmentation gene hunchback. Chromosoma (1989) 98:81–5. doi: 10.1007/BF00291041
67. Dewald GW, Schad CR, Christensen ER, Tiede AL, Zinsmeister AR, Spurbeck JL, et al. The application of fluorescent in situ hybridization to detect mbcr/abl fusion in variant ph chromosomes in CML and ALL. Cancer Genet Cytogenet (1993) 71:7–14. doi: 10.1016/0165-4608(93)90196-S
68. Cheng L, Zhang S, Wang L, MacLennan GT, Davidson DD. Fluorescence in situ hybridization in surgical pathology: principles and applications. J Pathol Clin Res (2017) 3:73–99. doi: 10.1002/cjp2.64
69. Moffitt JR, Hao J, Wang G, Chen KH, Babcock HP, Zhuang X. High-throughput single-cell gene-expression profiling with multiplexed error-robust fluorescence in situ hybridization. Proc Natl Acad Sci (2016) 113:11046–51. doi: 10.1073/pnas.1612826113
70. Xia C, Babcock HP, Moffitt JR, Zhuang X. Multiplexed detection of RNA using MERFISH and branched DNA amplification. Sci Rep (2019) 9:7721. doi: 10.1038/s41598-019-43943-8
71. Ke R, Mignardi M, Pacureanu A, Svedlund J, Botling J, Wählby C, et al. In situ sequencing for RNA analysis in preserved tissue and cells. Nat Methods (2013) 10:857–60. doi: 10.1038/nmeth.2563
72. Wang X, Allen WE, Wright MA, Sylwestrak EL, Samusik N, Vesuna S, et al. Three-dimensional intact-tissue sequencing of single-cell transcriptional states. Sci (1979) (2018) 361(6400):eaat5691. doi: 10.1126/science.aat5691
73. Fürth D, Hatini V, Lee JH. In situ transcriptome accessibility sequencing (INSTA-seq). bioRxiv (2019) 722819. doi: 10.1101/722819
74. Alon S, Goodwin DR, Sinha A, Wassie AT, Chen F, Daugharthy ER, et al. Expansion sequencing: Spatially precise in situ transcriptomics in intact biological systems. Sci (1979) (2021) 371(6528):eaax2656. doi: 10.1126/science.aax2656
75. Lei Y, Tang R, Xu J, Wang W, Zhang B, Liu J, et al. Applications of single-cell sequencing in cancer research: Progress and perspectives. J Hematol Oncol (2021) 14:1–26. doi: 10.1186/s13045-021-01105-2
76. Zhou Z, Liu M, Jiang J. The potential of aptamers for cancer research. Anal Biochem (2018) 549:91–5. doi: 10.1016/j.ab.2018.03.008
77. Reverdatto S, Burz DS, Shekhtman A. Peptide aptamers: development and applications. Curr Top Med Chem (2015) 15:1082. doi: 10.2174/1568026615666150413153143
78. Banta S, Dooley K, Shur O. Replacing antibodies: engineering new binding proteins. Annu Rev BioMed Eng (2013) 15:93–113. doi: 10.1146/annurev-bioeng-071812-152412
79. Wagner J, Rapsomaniki MA, Chevrier S, Anzeneder T, Langwieder C, Dykgers A, et al. A single-cell atlas of the tumor and immune ecosystem of human breast cancer. Cell (2019) 177:1330–45. doi: 10.1016/j.cell.2019.03.005
80. Danova M, Torchio M, Comolli G, Sbrana A, Antonuzzo A, Mazzini G. The role of automated cytometry in the new era of cancer immunotherapy. Mol Clin Oncol (2018) 9:355–61. doi: 10.3892/mco.2018.1701
81. Krieg C, Nowicka M, Guglietta S, Schindler S, Hartmann FJ, Weber LM, et al. High-dimensional single-cell analysis predicts response to anti-PD-1 immunotherapy. Nat Med (2018) 24:144–53. doi: 10.1038/nm.4466
82. Gide TN, Quek C, Menzies AM, Tasker AT, Shang P, Holst J, et al. Distinct immune cell populations define response to anti-PD-1 monotherapy and anti-PD-1/anti-CTLA-4 combined therapy. Cancer Cell (2019) 35:238–55. doi: 10.1016/j.ccell.2019.01.003
83. Budnik B, Levy E, Harmange G, Slavov N. SCoPE-MS: mass spectrometry of single mammalian cells quantifies proteome heterogeneity during cell differentiation. Genome Biol (2018) 19:1–12. doi: 10.1186/s13059-018-1547-5
84. Cheung TK, Lee C-Y, Bayer FP, McCoy A, Kuster B, Rose CM. Defining the carrier proteome limit for single-cell proteomics. Nat Methods (2021) 18:76–83. doi: 10.1038/s41592-020-01002-5
85. Kiuchi T, Higuchi M, Takamura A, Maruoka M, Watanabe N. Multitarget super-resolution microscopy with high-density labeling by exchangeable probes. Nat Methods (2015) 12:743–6. doi: 10.1038/nmeth.3466
86. Agasti SS, Wang Y, Schueder F, Sukumar A, Jungmann R, Yin P. DNA-Barcoded labeling probes for highly multiplexed exchange-PAINT imaging. Chem Sci (2017) 8:3080–91. doi: 10.1039/C6SC05420J
87. Wang Y, Woehrstein JB, Donoghue N, Dai M, Avendaño MS, Schackmann RCJ, et al. Rapid sequential in situ multiplexing with DNA exchange imaging in neuronal cells and tissues. Nano Lett (2017) 17:6131–9. doi: 10.1021/acs.nanolett.7b02716
88. Sharonov A, Hochstrasser RM. Wide-field subdiffraction imaging by accumulated binding of diffusing probes. Proc Natl Acad Sci (2006) 103:18911–6. doi: 10.1073/pnas.0609643104
89. Jungmann R, Avendaño MS, Woehrstein JB, Dai M, Shih WM, Yin P. Multiplexed 3D cellular super-resolution imaging with DNA-PAINT and exchange-PAINT. Nat Methods (2014) 11:313–8. doi: 10.1038/nmeth.2835
90. Guo S-M, Veneziano R, Gordonov S, Li L, Danielson E, Perez de Arce K, et al. Multiplexed and high-throughput neuronal fluorescence imaging with diffusible probes. Nat Commun (2019) 10:1–14. doi: 10.1038/s41467-019-12372-6
91. Han K, Holder JL Jr., Schaaf CP, Lu H, Chen H, Kang H, et al. SHANK3 overexpression causes manic-like behaviour with unique pharmacogenetic properties. Nature (2013) 503:72–7. doi: 10.1038/nature12630
92. Louie RHY, Luciani F. Recent advances in single-cell multimodal analysis to study immune cells. Immunol Cell Biol (2021) 99:157–67. doi: 10.1111/imcb.12432
93. Stuart T, Satija R. Integrative single-cell analysis. Nat Rev Genet (2019) 20:257–72. doi: 10.1038/s41576-019-0093-7
94. Peterson VM, Zhang KX, Kumar N, Wong J, Li L, Wilson DC, et al. Multiplexed quantification of proteins and transcripts in single cells. Nat Biotechnol (2017) 35:936–9. doi: 10.1038/nbt.3973
95. Stoeckius M, Hafemeister C, Stephenson W, Houck-Loomis B, Chattopadhyay PK, Swerdlow H, et al. Simultaneous epitope and transcriptome measurement in single cells. Nat Methods (2017) 14:865–8. doi: 10.1038/nmeth.4380
96. Jehan Z, Uddin S S, Al-Kuraya K. In-situ hybridization as a molecular tool in cancer diagnosis and treatment. Curr Med Chem (2012) 19:3730–8. doi: 10.2174/092986712801661031
97. Gupta S, Neumeister V, McGuire J, Song YS, Acs B, Ho K, et al. Quantitative assessments and clinical outcomes in HER2 equivocal 2018 ASCO/CAP ISH group 4 breast cancer. NPJ Breast Cancer (2019) 5:28. doi: 10.1038/s41523-019-0122-x
98. Ji AL, Rubin AJ, Thrane K, Jiang S, Reynolds DL, Meyers RM, et al. Multimodal analysis of composition and spatial architecture in human squamous cell carcinoma. Cell (2020) 182:497–514.e22. doi: 10.1016/j.cell.2020.05.039
99. Moncada R, Barkley D, Wagner F, Chiodin M, Devlin JC, Baron M, et al. Integrating microarray-based spatial transcriptomics and single-cell RNA-seq reveals tissue architecture in pancreatic ductal adenocarcinomas. Nat Biotechnol (2020) 38:333–42. doi: 10.1038/s41587-019-0392-8
100. Kazandjian D, Blumenthal GM, Chen H-Y, He K, Patel M, Justice R, et al. FDA Approval summary: Crizotinib for the treatment of metastatic non-small cell lung cancer with anaplastic lymphoma kinase rearrangements. Oncologist (2014) 19:e5–e11. doi: 10.1634/theoncologist.2014-0241
101. Perner S, Demichelis F, Beroukhim R, Schmidt FH, Mosquera J-M, Setlur S, et al. TMPRSS2:ERG fusion-associated deletions provide insight into the heterogeneity of prostate cancer. Cancer Res (2006) 66:8337–41. doi: 10.1158/0008-5472.CAN-06-1482
102. Pérottet J, le Goff E, Legoupil D, Quéré G, Schick U, Marcorelles P, et al. PD-L1 copy number variation does not correlate with PD-L1 expression or response to anti-PD-1 immunotherapy in patients with advanced melanomas. Appl Immunohistochemistry Mol Morphology (2020) 28:161–5. doi: 10.1097/PAI.0000000000000712
103. Gupta S, Cheville JC, Jungbluth AA, Zhang Y, Zhang L, Chen Y-B, et al. JAK2/PD-L1/PD-L2 (9p24.1) amplifications in renal cell carcinomas with sarcomatoid transformation: implications for clinical management. Modern Pathol (2019) 32:1344–58. doi: 10.1038/s41379-019-0269-x
104. Shi X, Wu S, Sun J, Liu Y, Zeng X, Liang Z. PD-L1 expression in lung adenosquamous carcinomas compared with the more common variants of non-small cell lung cancer. Sci Rep (2017) 7:46209. doi: 10.1038/srep46209
105. Yuan J, Zhang J, Zhu Y, Li N, Tian T, Li Y, et al. in situ hybridization and its clinical significance. Oncotarget (2016) 7:39671–9. doi: 10.18632/oncotarget.9381
106. Guo L, Li W, Zhu X, Ling Y, Qiu T, Dong L, et al. PD-L1 expression and CD274 gene alteration in triple-negative breast cancer: implication for prognostic biomarker. Springerplus (2016) 5:805. doi: 10.1186/s40064-016-2513-x
107. Tretiakova M, Fulton R, Kocherginsky M, Long T, Ussakli C, Antic T, et al. Concordance study of PD-L1 expression in primary and metastatic bladder carcinomas: comparison of four commonly used antibodies and RNA expression. Modern Pathol (2018) 31:623–32. doi: 10.1038/modpathol.2017.188
108. Franchini D-M, Lanvin O, Tosolini M, Patras de Campaigno E, Cammas A, Péricart S, et al. Microtubule-driven stress granule dynamics regulate inhibitory immune checkpoint expression in T cells. Cell Rep (2019) 26:94–107.e7. doi: 10.1016/j.celrep.2018.12.014
109. Johnson DB, Nixon MJ, Wang Y, Wang DY, Castellanos E, v. EM, et al. Tumor-specific MHC-II expression drives a unique pattern of resistance to immunotherapy via LAG-3/FCRL6 engagement. JCI Insight (2018) 3(24):e120360. doi: 10.1172/jci.insight.120360
110. Gauthier L, Morel A, Anceriz N, Rossi B, Blanchard-Alvarez A, Grondin G, et al. Multifunctional natural killer cell engagers targeting NKp46 trigger protective tumor immunity. Cell (2019) 177:1701–1713.e16. doi: 10.1016/j.cell.2019.04.041
111. Xiao Q, Wu J, Wang W-J, Chen S, Zheng Y, Yu X, et al. DKK2 imparts tumor immunity evasion through β-catenin-independent suppression of cytotoxic immune-cell activation. Nat Med (2018) 24:262–70. doi: 10.1038/nm.4496
112. Sanmamed MF, Perez-Gracia JL, Schalper KA, Fusco JP, Gonzalez A, Rodriguez-Ruiz ME, et al. Changes in serum interleukin-8 (IL-8) levels reflect and predict response to anti-PD-1 treatment in melanoma and non-small-cell lung cancer patients. Ann Oncol (2017) 28:1988–95. doi: 10.1093/annonc/mdx190
113. Yearley JH, Gibson C, Yu N, Moon C, Murphy E, Juco J, et al. PD-L2 expression in human tumors: Relevance to anti-PD-1 therapy in cancer. Clin Cancer Res (2017) 23:3158–67. doi: 10.1158/1078-0432.CCR-16-1761
114. O’Rourke DM, Nasrallah MP, Desai A, Melenhorst JJ, Mansfield K, Morrissette JJD, et al. A single dose of peripherally infused EGFRvIII-directed CAR T cells mediates antigen loss and induces adaptive resistance in patients with recurrent glioblastoma. Sci Transl Med (2017) 9(399):eaaa0984. doi: 10.1126/scitranslmed.aaa0984
115. Voith von Voithenberg L, Fomitcheva Khartchenko A, Huber D, Schraml P, Kaigala GV. Spatially multiplexed RNA in situ hybridization to reveal tumor heterogeneity. Nucleic Acids Res (2020) 48:e17–7. doi: 10.1093/nar/gkz1151
116. Willis EF, MacDonald KPA, Nguyen QH, Garrido AL, Gillespie ER, Harley SBR, et al. Repopulating microglia promote brain repair in an IL-6-Dependent manner. Cell (2020) 180:833–846.e16. doi: 10.1016/j.cell.2020.02.013
117. McCart Reed AE, Bennett J, Kutasovic JR, Kalaw E, Ferguson K, Yeong J, et al. Digital spatial profiling application in breast cancer: A user’s perspective. Virchows Archiv (2020) 477:885–90. doi: 10.1007/s00428-020-02821-9
118. Jeyasekharan AD, Hoppe MM, Fan S, VanSchoiack A, Xin L, de Mel S, et al. Digital spatial profiling of immune markers in r-chop treated diffuse Large b-cell lymphoma reveals a dominant prognostic significance of M2 macrophage infiltration. Hematol Oncol (2019) 37:356–7. doi: 10.1002/hon.18_2631
119. Helmink BA, Reddy SM, Gao J, Zhang S, Basar R, Thakur R, et al. B cells and tertiary lymphoid structures promote immunotherapy response. Nature (2020) 577:549–55. doi: 10.1038/s41586-019-1922-8
120. Cabrita R, Lauss M, Sanna A, Donia M, Skaarup Larsen M, Mitra S, et al. Tertiary lymphoid structures improve immunotherapy and survival in melanoma. Nature (2020) 577:561–5. doi: 10.1038/s41586-019-1914-8
121. Rosenberg SA, Restifo NP. Adoptive cell transfer as personalized immunotherapy for human cancer. Sci (1979) (2015) 348:62–8. doi: 10.1126/science.aaa4967
122. Tran E, Turcotte S, Gros A, Robbins PF, Lu Y-C, Dudley ME, et al. Cancer immunotherapy based on mutation-specific CD4+ T cells in a patient with epithelial cancer. Sci (1979) (2014) 344:641–5. doi: 10.1126/science.1251102
123. Tran E, Robbins PF, Lu Y-C, Prickett TD, Gartner JJ, Jia L, et al. T-Cell transfer therapy targeting mutant KRAS in cancer. New Engl J Med (2016) 375:2255–62. doi: 10.1056/NEJMoa1609279
Keywords: spatial profiling technologies, transcriptome, proteome, tumor heterogeneity, immuno-oncology
Citation: Hu B, Sajid M, Lv R, Liu L and Sun C (2022) A review of spatial profiling technologies for characterizing the tumor microenvironment in immuno-oncology. Front. Immunol. 13:996721. doi: 10.3389/fimmu.2022.996721
Received: 18 July 2022; Accepted: 17 October 2022;
Published: 31 October 2022.
Edited by:
Perry D. Moerland, Amsterdam University Medical Center, NetherlandsReviewed by:
Aleksandra Nita-Lazar, National Institute of Allergy and Infectious Diseases (NIH), United StatesRadhika Vaishnav, Ivy Tech Community College of Indiana, United States
Copyright © 2022 Hu, Sajid, Lv, Liu and Sun. This is an open-access article distributed under the terms of the Creative Commons Attribution License (CC BY). The use, distribution or reproduction in other forums is permitted, provided the original author(s) and the copyright owner(s) are credited and that the original publication in this journal is cited, in accordance with accepted academic practice. No use, distribution or reproduction is permitted which does not comply with these terms.
*Correspondence: Rong Lv, bHZyb25nNjEyQDEyNi5jb20=; Lianxin Liu, bGl1bHhAdXN0Yy5lZHUuY24=; Cheng Sun, Y2hhcmxlc3NAdXN0Yy5lZHUuY24=
†These authors have contributed equally to this work