 Mengru Liu1
 Feng Ma
 Li Qian
94% of researchers rate our articles as excellent or good
Learn more about the work of our research integrity team to safeguard the quality of each article we publish.
Find out more
ORIGINAL RESEARCH article
Front. Immunol., 02 August 2022
Sec. Molecular Innate Immunity
Volume 13 - 2022 | https://doi.org/10.3389/fimmu.2022.975551
Regulatory B cells have important roles in inflammation and autoimmune diseases. A newly discovered subpopulation of B cells with a CD19hiFcγRIIbhi phenotype inhibits the proliferation of CD4+ T cells by secreting interleukin (IL)-10. The expansion of CD19hiFcγRIIbhi B cells in mouse spleen can be induced by lipopolysaccharide (LPS) or CpG oligodeoxynucleotide stimulation. However, the mechanism of CD19hiFcγRIIbhi B cell expansion and its role in inflammatory diseases are unclear. Here, we report that, under inflammatory conditions, the proliferation and immunosuppressive function of CD19hiFcγRIIbhi B cells were decreased in high mobility group box1 (HMGB1) C106A mutant mice, compared with wild-type mice. The HMGB1 (C106A) mutation in B cells reduced STAT3 phosphorylation, restricting the expansion and suppressive function of CD19hiFcγRIIbhi B cells. Compared with CD19hiFcγRIIbhi B cells from wild-type mice, CD19hiFcγRIIbhi B cells from Hmgb1(C106A) mice significantly reduced the survival of mice with sepsis. Recombinant HMGB1 promoted the expansion of IL-10-producing CD19hiFcγRIIbhi B cells among LPS-activated B cells in vitro. Furthermore, the percentage of CD19hiFcγRIIbhi regulatory B cells in the peripheral blood was increased in patients with sepsis, compared with healthy controls. These findings implicate the role of HMGB1 in the expansion and immunosuppressive function of CD19hiFcγRIIbhi B cells.
Regulatory B cells (Bregs) constitute a unique type of B cells with immunomodulatory functions that maintain immune tolerance and suppress harmful immune responses (1). Bregs suppress immune responses by inhibiting the activation and differentiation of dendritic cells; CD4+, CD8+, and NK T cells; and effector T (Th1 or Th17) cells. Their suppression mechanism also includes inducing the generation of regulatory T cells (CD4+CD25+Foxp3+ Tregs) (2). Bregs maintain tolerance and inhibit inflammation and autoimmunity by producing interleukin (IL)-10, transforming growth factor-β (TGF-β), or IL-35; thus, they have important roles in inflammation-related diseases (3).
IL-10-producing Bregs have an immunosuppressive role in the pathogenesis of several diseases (4). In mice, IL-10-producing Bregs have several phenotypes, including CD19+CD5+CD1dhi (5) and CD19+Tim-1+ (6). In humans, several subsets of Bregs inhibit effector T cells by producing IL-10; these subsets include transitional CD19+CD24hiCD38hi B cells, CD19+CD24hiCD27+ B cells (7), and Tim-1+ B cells (8). Whereas regulatory T cells are known to express the transcription factor foxp3, there are no known transcription factors responsible for Bregs differentiation or development (9). A subset of Bregs, CD19hiFcγRIIbhi B cells, inhibits CD4+ T cell proliferation by secreting IL-10 (10). CD19hiFcγRIIbhi B cells are expanded in mouse spleen after stimulation with lipopolysaccharide (LPS) or CpG oligodeoxynucleotides (ODN). However, the mechanism of CD19hiFcγRIIbhi B cell expansion and its role in inflammatory diseases are unclear.
High mobility group box1 (HMGB1) is a nuclear protein named for its rapid migration during electrophoresis (11). It is expressed in all eukaryotic cells and is highly evolutionarily conserved. HMGB1 has three conserved cysteine residues at positions 23, 45, and 106 (12). HMGB1 is a damage-associated molecular pattern protein involved in several disease states, including cancer (13), arthritis (14), and sepsis (15); it also acts as a late mediator in endotoxemia. HMGB1 is actively secreted by monocytes and macrophages after stimulation with microbes or proinflammatory cytokines (11). HMGB1 affects multiple immune cells; it inhibits the proliferation and differentiation of T cells (16), enhances the function of regulatory T cells (17), induces the production of myeloid-derived suppressor cells (18), and activates NK cells (19). Here, we hypothesized that HMGB1 has a regulatory role in CD19hiFcγRIIbhi B cells.
We constructed Hmgb1(C106A) mice in a C57BL/6 background, such that the cysteine at nucleotide 106 in Hmgb1 was replaced by alanine; this led to suppression of Hmgb1 function (20, 21). We used Hmgb1(C106A) mice to investigate the role of HMGB1 in CD19hiFcγRIIbhi B cells during an inflammatory response and explore the underlying molecular mechanisms.
C57BL/6 mice (female, 6–8 weeks) were obtained from the Experimental Animal Center of Yangzhou University (Yangzhou, China). Hmgb1 mutant mice (Hmgb1(C106A)) on a C57BL/6 background were obtained from Biocytogen (Beijing, China). A pair of sgRNAs (5’-GTGATCTCAAGagtagGcacAGG-3’ and 5’-GGTAACTGTCattagaATGGAGG-3’) was designed to produce a 6.4-kb deletion in the EGE-ZJH-024 gene (GENE ID: 15289). Next, cas9/sgRNA mRNA was co-microinjected into the zygote using a targeted vector with one C106A mutation site, two homologous sequences, and two LoxP sites. The sequences of the mouse genotyping primers were 5’-TTAGGTGCACGAGGGGCACTTATTG-3’ and 5’-AGCTAGGCAGAACACTGCAAACCAT-3’. The polymerase chain reaction products from wild-type (WT) and Hmgb1(C106A) mutant mice were 394 bp and 479 bp, respectively. The experimental animal procedures were approved by the Animal Care and Use Committee of Yangzhou University (Yangzhou, China).
The Ethics Committee of the Medical College of Yangzhou University approved this study protocol. Peripheral blood samples from healthy donors and patients with sepsis were obtained from Subei People’s Hospital, which is affiliated with Yangzhou University (Table S1). Patients with concurrent human immunodeficiency virus infection, cancer, or autoimmune disease were excluded. Peripheral blood mononuclear cells (PBMCs) were isolated from blood samples by Ficoll centrifugation. CD19hiFcγRIIbhi B, CD19lowFcγRIIblow B, or CD4+ T cells from PBMCs were sorted using a FACS Aria SORP (BD Biosciences) with anti-human CD19, FcγRIIb, or CD4 antibodies. Peripheral blood (2 mL) from 40 healthy donors and 44 patients with sepsis was used to isolate PBMCs for flow cytometry. Peripheral blood (20 mL) from three healthy donors and three patients with sepsis was used to isolate CD19hiFcγRIIbhi and CD19lowFcγRIIblow B cells for enzyme-linked immunosorbent assays (ELISAs). Peripheral blood (20 mL) from three healthy donors and three patients with sepsis was used to isolate CD19hiFcγRIIbhi and CD19lowFcγRIIblow B cells for coculture.
To establish a model of inflammation, mice were intraperitoneally injected with LPS (Escherichia coli 055:B5; Sigma-Aldrich, 10 mg/kg) or pre-inoculated with D-GalN (600 mg/kg bodyweight) for 1 h, then injected with CpG ODN (10 nmol/mouse) (22). Seven days after injection, mice were euthanized.
Mouse spleens were collected aseptically, then incubated in red blood cell lysis buffer for 5 min. Next, single-cell suspensions of mouse splenocytes were stained using anti-mouse CD19 beads. CD19+B cells were isolated from erythrocyte-depleted splenocytes using anti-mouse CD19 beads (Miltenyi Biotech), in accordance with the manufacturer’s instructions. In some experiments, CD19hiFcγRIIbhi B cells and CD19lowFcγRIIblow B cells were sorted using a FACS Aria SORP (BD Biosciences). B cell purity was typically > 90%. Splenic CD4+ T cells were enriched using anti-CD4 beads (Miltenyi Biotech). CD4+ T cell purity was typically > 95%.
The fluorochrome-conjugated antibodies used in this study are shown in Table S2. Cells were collected, stained with antibodies, and subjected to flow cytometry (FACS Calibur or FACS Verse, BD Biosciences) for surface markers. The results were analyzed using FlowJo 10.0 software. Absolute cell counts were determined using CountBright™ Absolute Counting Beads (Invitrogen Inc). The cell concentration (cells/μL) was calculated using the equation: cells/μL = number of cell events ÷ number of bead events × assigned bead count of the lot/volume of sample (μL). For intracellular staining, cells were first stained with surface markers for 20 min, then fixed and permeabilized using the Foxp3/Transcription Factor Staining Buffer Kit (Cat No. 00-5523-00, eBioscience) for 40 min; finally, they were stained with an anti-Ki67 antibody for 20 min. Samples were resuspended in 400 μL of Permeabilization Buffer (1×) and analyzed by flow cytometry.
Mouse IL-10 levels were measured using Mouse IL-10 ELISA kit (Cat No. M1000B, R&D Systems) or Mouse IL-10 ELISA kit (Cat No. 1211002, DRKEWE), in accordance with the manufacturer’s protocol. Human IL-10 levels in plasma were measured using Human IL-10 ELISA kit (Cat No. EK100HS-96, MULTI SCIENCES), in accordance with the manufacturer’s protocol. Human HMGB1 levels in plasma were measured using Human HMGB1 ELISA kit (Cat No. SEKH-0409, Solarbio), in accordance with the manufacturer’s protocol.
CD19+ B cells (2 × 10⁵/well) isolated from mouse spleens were treated or not with LPS (Sigma-Aldrich, 10 μg/mL) for 2 days. The cells were harvested and analyzed by flow cytometry. In some experiments, CD19+ B cells were pretreated with a specific inhibitor of STAT3 (cucurbitacin I, 500 nM), then exposed to the indicated stimuli. In some experiments, CD19+ B cells (2 × 10⁵/well) isolated from mouse spleens were treated or not with recombinant human HMGB1 (R&D Systems, 10 μg/mL), LPS (Sigma-Aldrich, 500 ng/mL), or CpG ODN (0.02 μM) for 2 days.
CD4+ T cells were seeded into 96-well round-bottom plates precoated with 5 μg/mL anti-CD3 (BioLegend) in the presence of 5 μg/mL soluble anti-CD28 (BioLegend) antibody. CD19hiFcγRIIbhi B cells were cocultured with CD4+ T cells at a 1:1 ratio. In some experiments, 10 μg/mL neutralizing anti-IL-10 antibody (eBioscience) or 5 μg/mL recombinant IL-10 (rIL-10) protein (PeproTech) was added to the culture medium. After 48 h, cells were stained for CD4 and Ki67, then analyzed by flow cytometry (23).
Total protein extracts were prepared using a Whole Cell Lysis Assay kit (KeyGen, China), resolved via sodium dodecyl sulfate–polyacrylamide gel electrophoresis, and transferred onto polyvinylidene fluoride membranes. The membranes were blocked with bovine serum albumin. After they had been stained with primary and secondary antibodies, the membranes were imaged and analyzed using Compass software.
Data are shown as means ± standard errors of the mean (SEM). For comparisons between two groups, data were analyzed by Student’s t-test or the Mann–Whitney test. Survival curves were generated with GraphPad Prism 8 software, and survival analysis was performed using the log-rank (Mantel–Cox) test. Significant differences are expressed as follows: *, P < 0.05; **, P < 0.01; and ***, P < 0.001.
WT and Hmgb1(C106A) mice were injected with phosphate-buffered saline (PBS) or LPS (10 mg/kg), and the percentages of splenic immune cells were determined 7 days later. The percentages of splenic immune cells—including CD3+ T cells, CD19+ B cells, NK cells, CD4+CD25+Foxp3+ Tregs, and macrophages—did not differ between WT and Hmgb1(C106A) mice, irrespective of LPS-induced inflammation (Figure S1A). Although the percentages of CD19hiFcγRIIbhi B cells in WT and Hmgb1(C106A) mice did not differ after PBS injection, the percentage of CD19hiFcγRIIbhi B cells was lower in the spleen of Hmgb1(C106A) mice with LPS-induced inflammation, compared with the percentage in WT mice (Figure 1A). In addition, the percentage of CD19hiFcγRIIbhi B cells in lymph nodes did not differ between WT and Hmgb1(C106A) mice with LPS-induced inflammation (Figure S2). Next, WT and Hmgb1(C106A) mice were pre-inoculated with D-GalN (600 mg/kg) for 1 h and injected with PBS or CpG ODN (10 nmol/mouse); the percentages of splenic immune cells were determined 7 days later. The percentage of CD19hiFcγRIIbhi B cells was decreased in the spleen of Hmgb1(C106A) mice with CpG ODN-induced inflammation, compared with the percentage in WT mice (Figure S3). Moreover, flow cytometry showed that the number of CD19hiFcγRIIbhi B cells in the spleen of Hmgb1(C106A) mice with LPS-induced inflammation was decreased, compared with the number in WT mice (Figure 1B). Because inflammatory Hmgb1(C106A) mice exhibited a decreased number of splenic CD19hiFcγRIIbhi B cells, we evaluated the role of Hmgb1 in proliferation or apoptosis of CD19hiFcγRIIbhi B cells. WT and Hmgb1(C106A) mice injected with LPS were euthanized 7 days after injection. The percentages of proliferating (Ki67+) and apoptotic (AnnexinV+7AAD+) CD19hiFcγRIIbhi B cells in WT and Hmgb1(C106A) mouse spleens were analyzed by flow cytometry. The proliferation of CD19hiFcγRIIbhi B cells from LPS-induced inflammatory Hmgb1(C106A) mice was decreased, compared with proliferation in WT mice (Figure 1C). However, there was no significant difference in the apoptosis of CD19hiFcγRIIbhi B cells between WT and Hmgb1(C106A) mice (Figure 1D). Taken together, these results demonstrate that the HMGB1 (C106A) mutation inhibited CD19hiFcγRIIbhi B cell expansion in mice with LPS-induced inflammation.
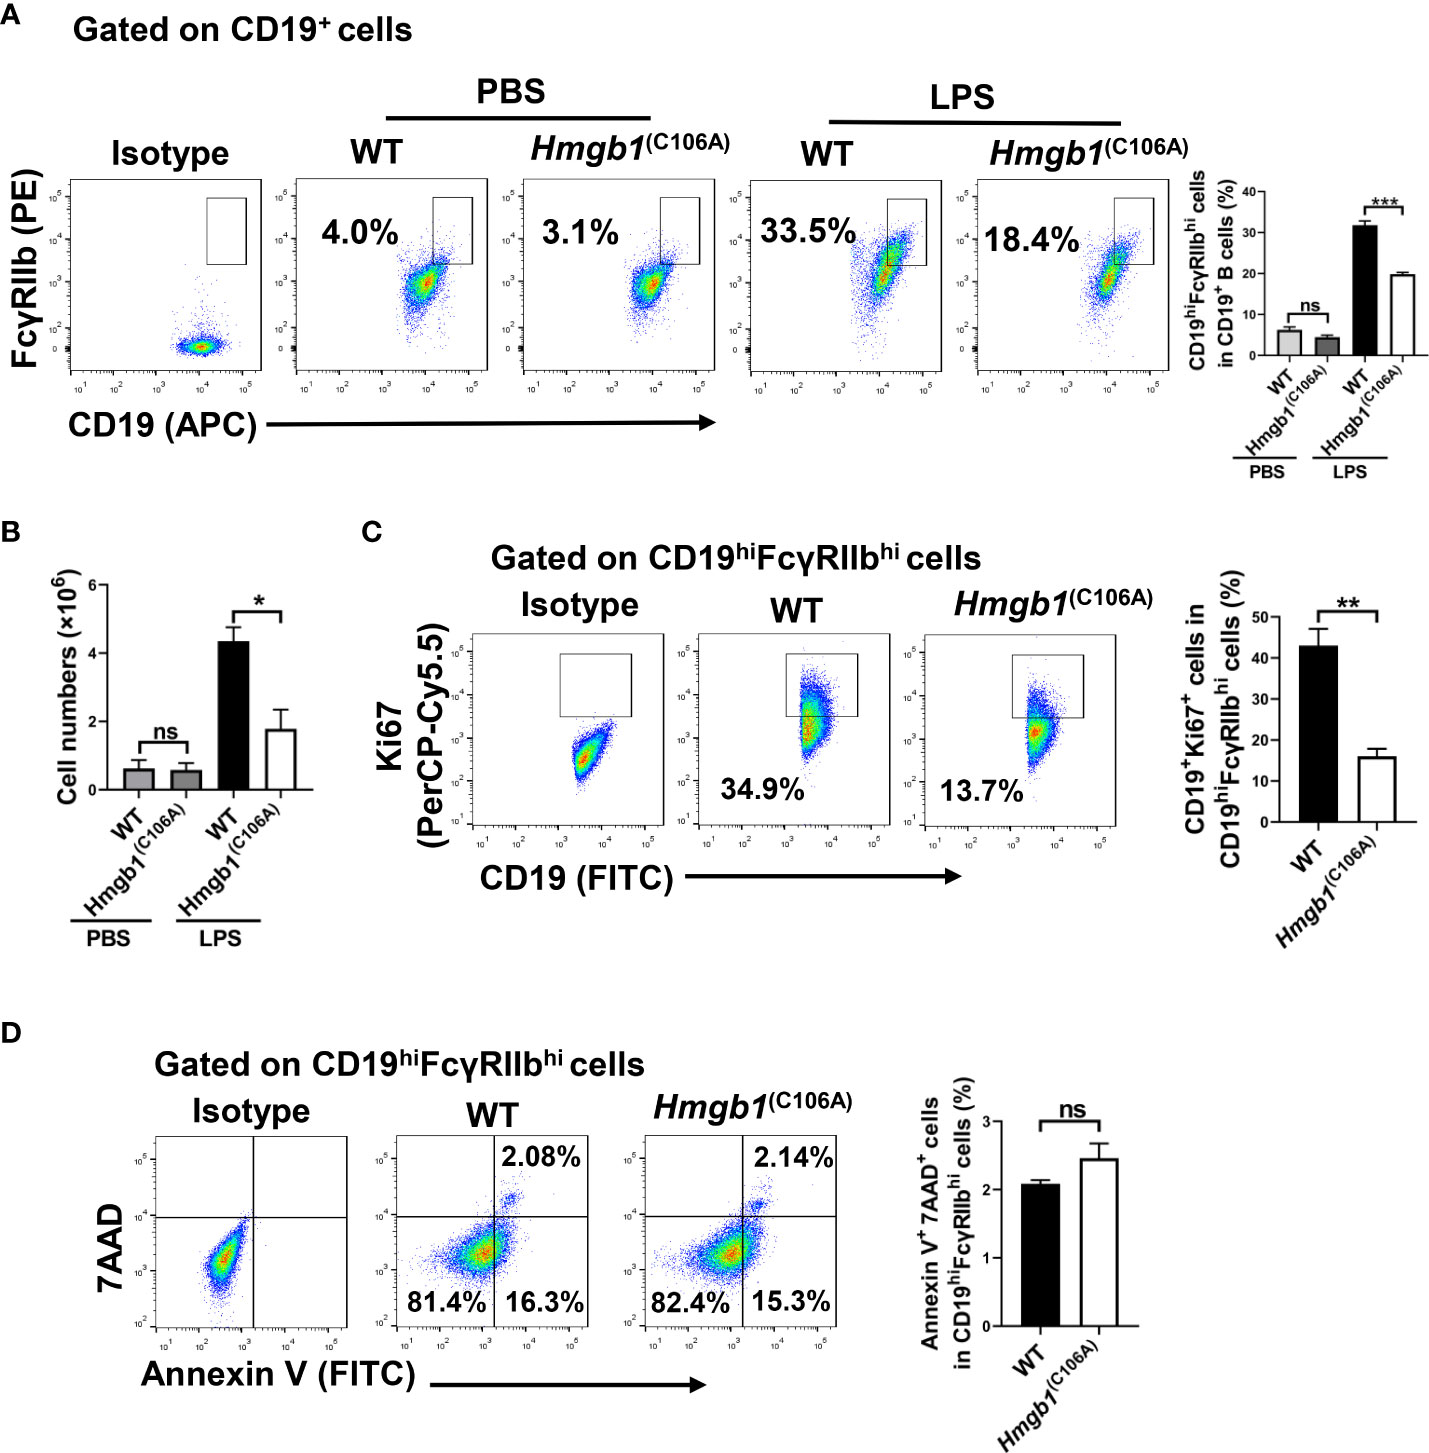
Figure 1 Decreased CD19hiFcγRIIbhi B cell percentage and number in Hmgb1(C106A) mice. PBS or LPS was injected into WT and Hmgb1(C106A) mice, and the mice were euthanized 7 days later. (A) Percentage and (B) number of CD19hiFcγRIIbhi B cells in the spleen, analyzed by flow cytometry. Data are shown as means ± SEMs of three independent experiments. (C) Percentage of proliferating (Ki67+) CD19hiFcγRIIbhi B cells in WT and Hmgb1(C106A) mouse spleens, analyzed by flow cytometry with Ki67 staining. Data are shown as means ± SEMs of three independent experiments. (D) Representative staining and percentage of AnnexinV+7AAD+ cells among CD19hiFcγRIIbhi B cells from WT and Hmgb1(C106A) mouse spleens, analyzed by flow cytometry. Data are shown as means ± SEMs of three independent experiments. NS, not significant; *P < 0.05; **P < 0.01; ***P < 0.001.
We investigated whether the HMGB1 (C106A) mutation affected IL-10 and TGF-β production by CD19hiFcγRIIbhi B cells. WT and Hmgb1(C106A) mice were injected with LPS; splenic CD19hiFcγRIIbhi B cells and CD19lowFcγRIIblow B cells were sorted by flow cytometry on day 7. CD19hiFcγRIIbhi B cells or CD19lowFcγRIIblow B cells (2 × 10⁵) were plated in 96-well plates for 24 h; then, the IL-10 and TGF-β levels in culture supernatant were assayed. There was no significant difference in the secretion of TGF-β by CD19hiFcγRIIbhi B cells between WT and Hmgb1(C106A) mice with LPS-induced inflammation (Figure S4). However, Hmgb1(C106A) splenic CD19hiFcγRIIbhi B cells from mice with LPS-induced inflammation exhibited lower IL-10 secretion, compared with those cells from WT mice (Figure 2A).
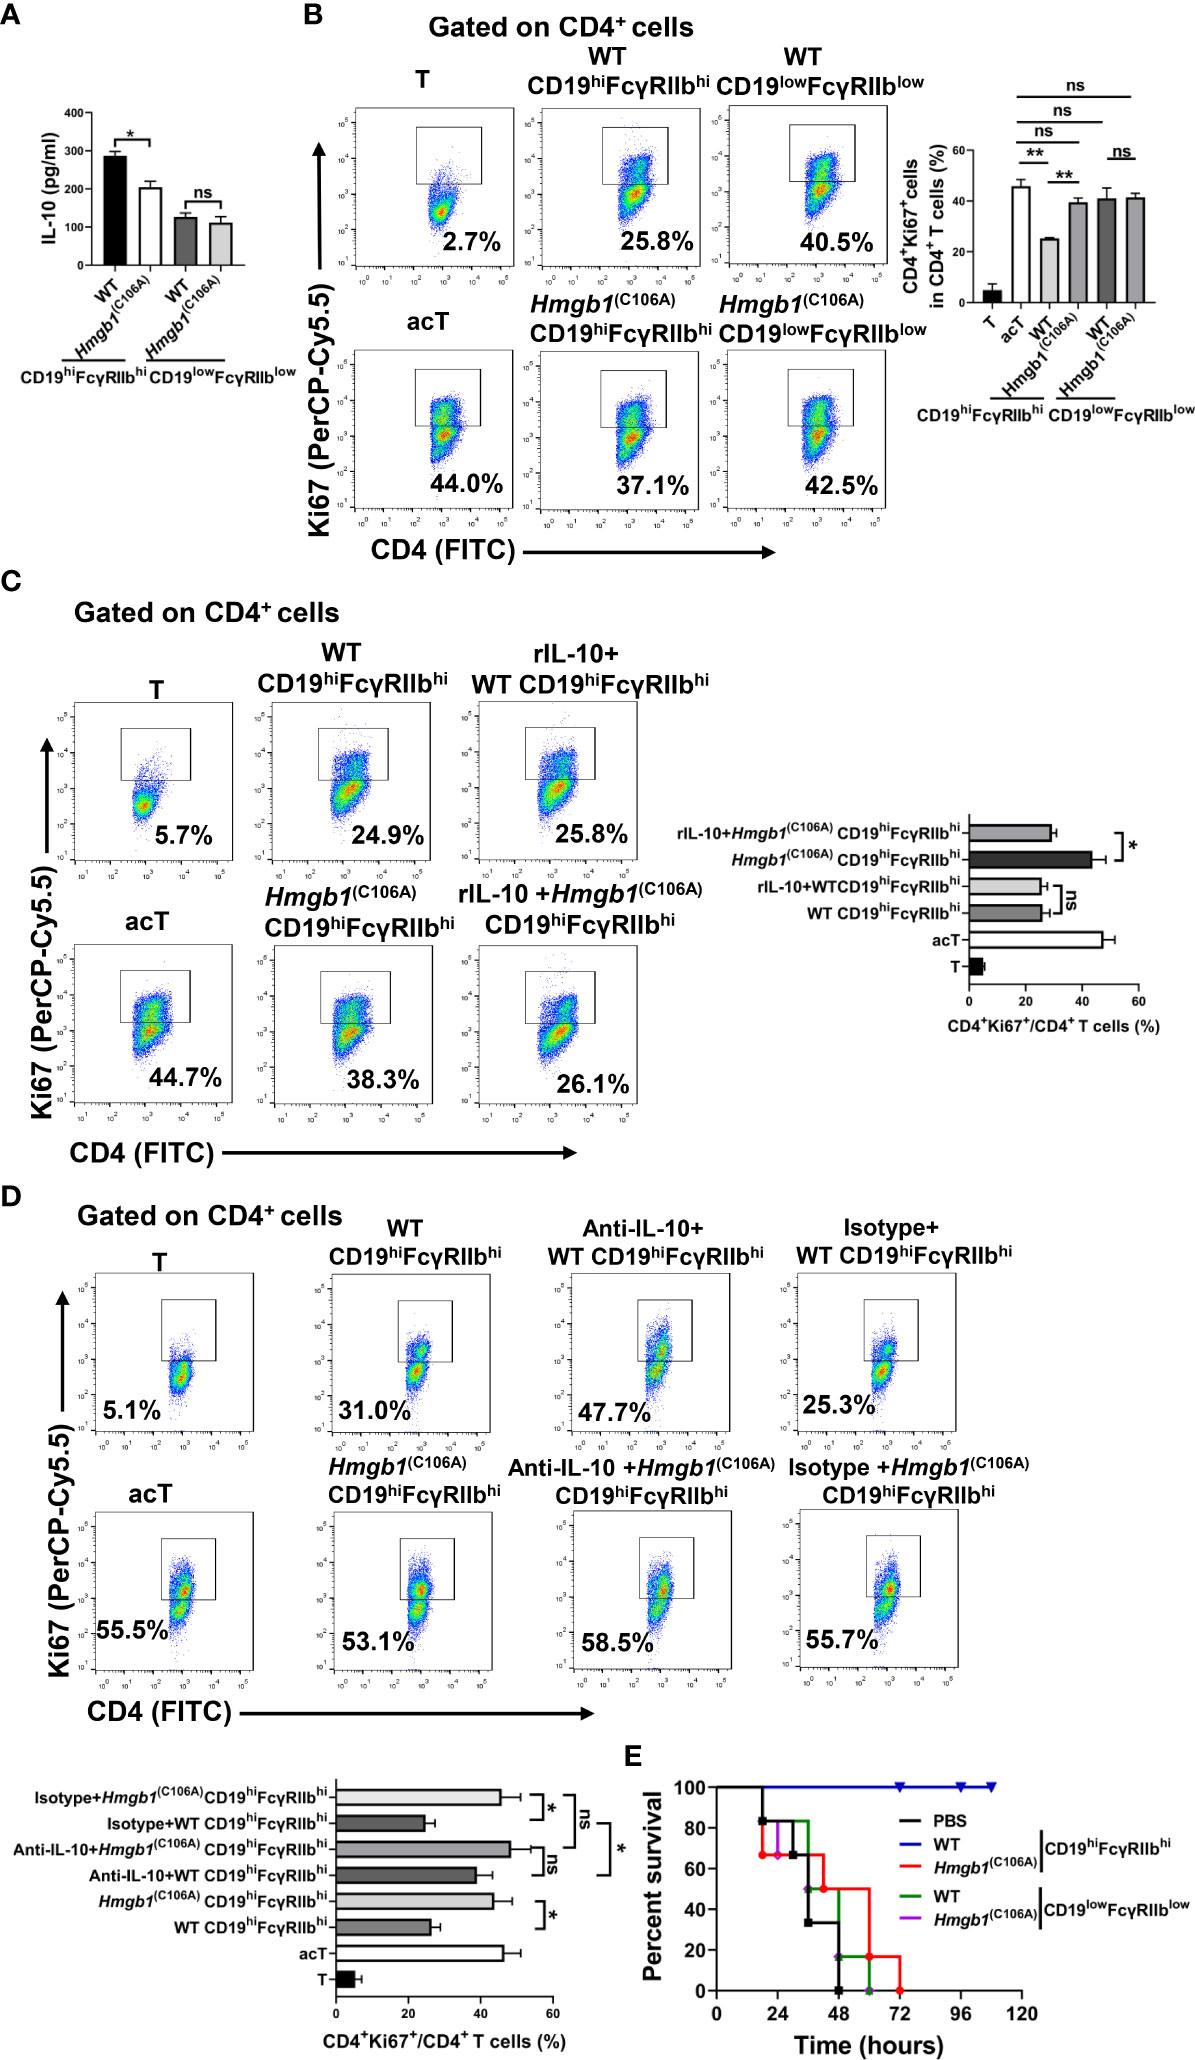
Figure 2 Hmgb1(C106A) inhibited the suppressive function of CD19hiFcγRIIbhi B cells in mice. WT and Hmgb1(C106A) mice were injected with LPS on day 0. On day 7, splenic CD19hiFcγRIIbhi B cells and CD19lowFcγRIIblow B cells were sorted by flow cytometry. (A) CD19hiFcγRIIbhi B cells or CD19lowFcγRIIblow B cells (2 × 10⁵) were plated on 96-well plates. After 24 h, supernatants were collected for measurement of IL-10 levels by ELISA. Data are shown as means ± SEMs of three independent experiments. (B–D) Purified CD19hiFcγRIIbhi B cells (2 × 10⁵) from LPS-treated mice were cocultured with anti-CD3/CD28-activated CD4+ T cells (2 × 10⁵) (B) in the presence or absence of rIL-10 (C) or anti-IL-10 (D). After 48 h, CD4+ T cell proliferation was determined by Ki67 staining and flow cytometry. Representative histograms show Ki67 expression by CD4+ T cells and the proliferation of CD4+ T cells. Data are shown as means ± SEMs of three independent experiments. (E) C57BL/6 mice were injected with purified CD19hiFcγRIIbhi B cells or CD19lowFcγRIIblow B cells from LPS-treated WT and Hmgb1(C106A) mice; PBS served as the control condition. After 1.5 h, LPS (15 mg/kg) was injected into the mice to induce sepsis, and mortality was monitored. Survival analysis was performed by log-rank (Mantel–Cox) tests; n = 6 mice per group. *P < 0.05; **P < 0.01; NS, not significant.
WT and Hmgb1(C106A) mice were injected with LPS; splenic CD19hiFcγRIIbhi B cells and CD19lowFcγRIIblow B cells were sorted by flow cytometry on day 7. Purified CD19hiFcγRIIbhi B cells or CD19lowFcγRIIblow B cells (2 × 10⁵) were cocultured with anti-CD3/CD28-activated CD4+ T cells (2 × 10⁵). The proliferation of CD4+ T cells was evaluated by flow cytometry after 2 days. The ability of CD19hiFcγRIIbhi B cells from Hmgb1(C106A) mice with LPS-induced inflammation to inhibit the proliferation of activated CD4+ T cells was significantly decreased, compared with that ability in cells from WT mice (Figure 2B). To determine whether the effect of the HMGB1 (C106A) mutation on the CD19hiFcγRIIbhi B cell-mediated inhibition of CD4+ T cells was caused by reduced secretion of IL-10, we added rIL-10 or anti-IL-10 antibody to cocultures of activated CD4+ T cells and CD19hiFcγRIIbhi B cells. rIL-10 enhanced the Hmgb1(C106A) CD19hiFcγRIIbhi B cell-mediated inhibition of T cell proliferation (Figure 2C). The anti-IL-10 antibody reduced the ability of WT CD19hiFcγRIIbhi B cells to inhibit T cell proliferation (Figure 2D). Therefore, the HMGB1 (C106A) mutation reduced the CD19hiFcγRIIbhi B cell-mediated inhibition of CD4+ T cells by reducing IL-10 secretion in mice with LPS-induced inflammation.
We investigated the role of CD19hiFcγRIIbhi B cells from Hmgb1(C106A) mice in LPS-induced inflammation. WT and Hmgb1(C106A) mice were injected with LPS; splenic CD19hiFcγRIIbhi B cells and CD19lowFcγRIIblow B cells were sorted by flow cytometry on day 7. C57BL/6 mice were injected with purified CD19hiFcγRIIbhi B cells or CD19lowFcγRIIblow B cells; PBS served as the control condition. After 1.5 h, LPS (15 mg/kg) was injected into the mice to induce acute sepsis, and mortality was monitored. Compared with WT mice, CD19hiFcγRIIbhi B cells from Hmgb1(C106A) mice significantly reduced the survival of mice with sepsis (Figure 2E). Therefore, the HMGB1 (C106A) mutation inhibited the suppressive function of CD19hiFcγRIIbhi B cells in mice with LPS-induced inflammation.
Because HMGB1 is expressed in B cells (24), we examined whether the HMGB1 (C106A) mutation decreased the number and suppressive function of CD19hiFcγRIIbhi B cells. Highly purified CD19+ B cells from Hmgb1(C106A) or WT mice were cocultured with LPS (10 μg/mL) for 48 h in vitro; the number and percentage of CD19hiFcγRIIbhi B cells were then determined by flow cytometry. The percentage and number of CD19hiFcγRIIbhi B cells among were significantly lower LPS-treated Hmgb1(C106A) B cells than among corresponding WT controls (Figures 3A, B). Next, highly purified CD19+ B cells from Hmgb1(C106A) or WT mice were cocultured with LPS for 48 h in vitro; the percentages of proliferating (Ki67+) and apoptotic (AnnexinV+7AAD+) CD19hiFcγRIIbhi B cells in WT and Hmgb1(C106A) spleens were analyzed by flow cytometry. The proliferation of CD19hiFcγRIIbhi B cells from LPS-treated Hmgb1(C106A) B cells was decreased, compared with those cells from WT mice (Figure 3C). However, the rate of apoptosis among CD19hiFcγRIIbhi B cells did not significantly differ between LPS-treated WT and Hmgb1(C106A) B cells (Figure S5).
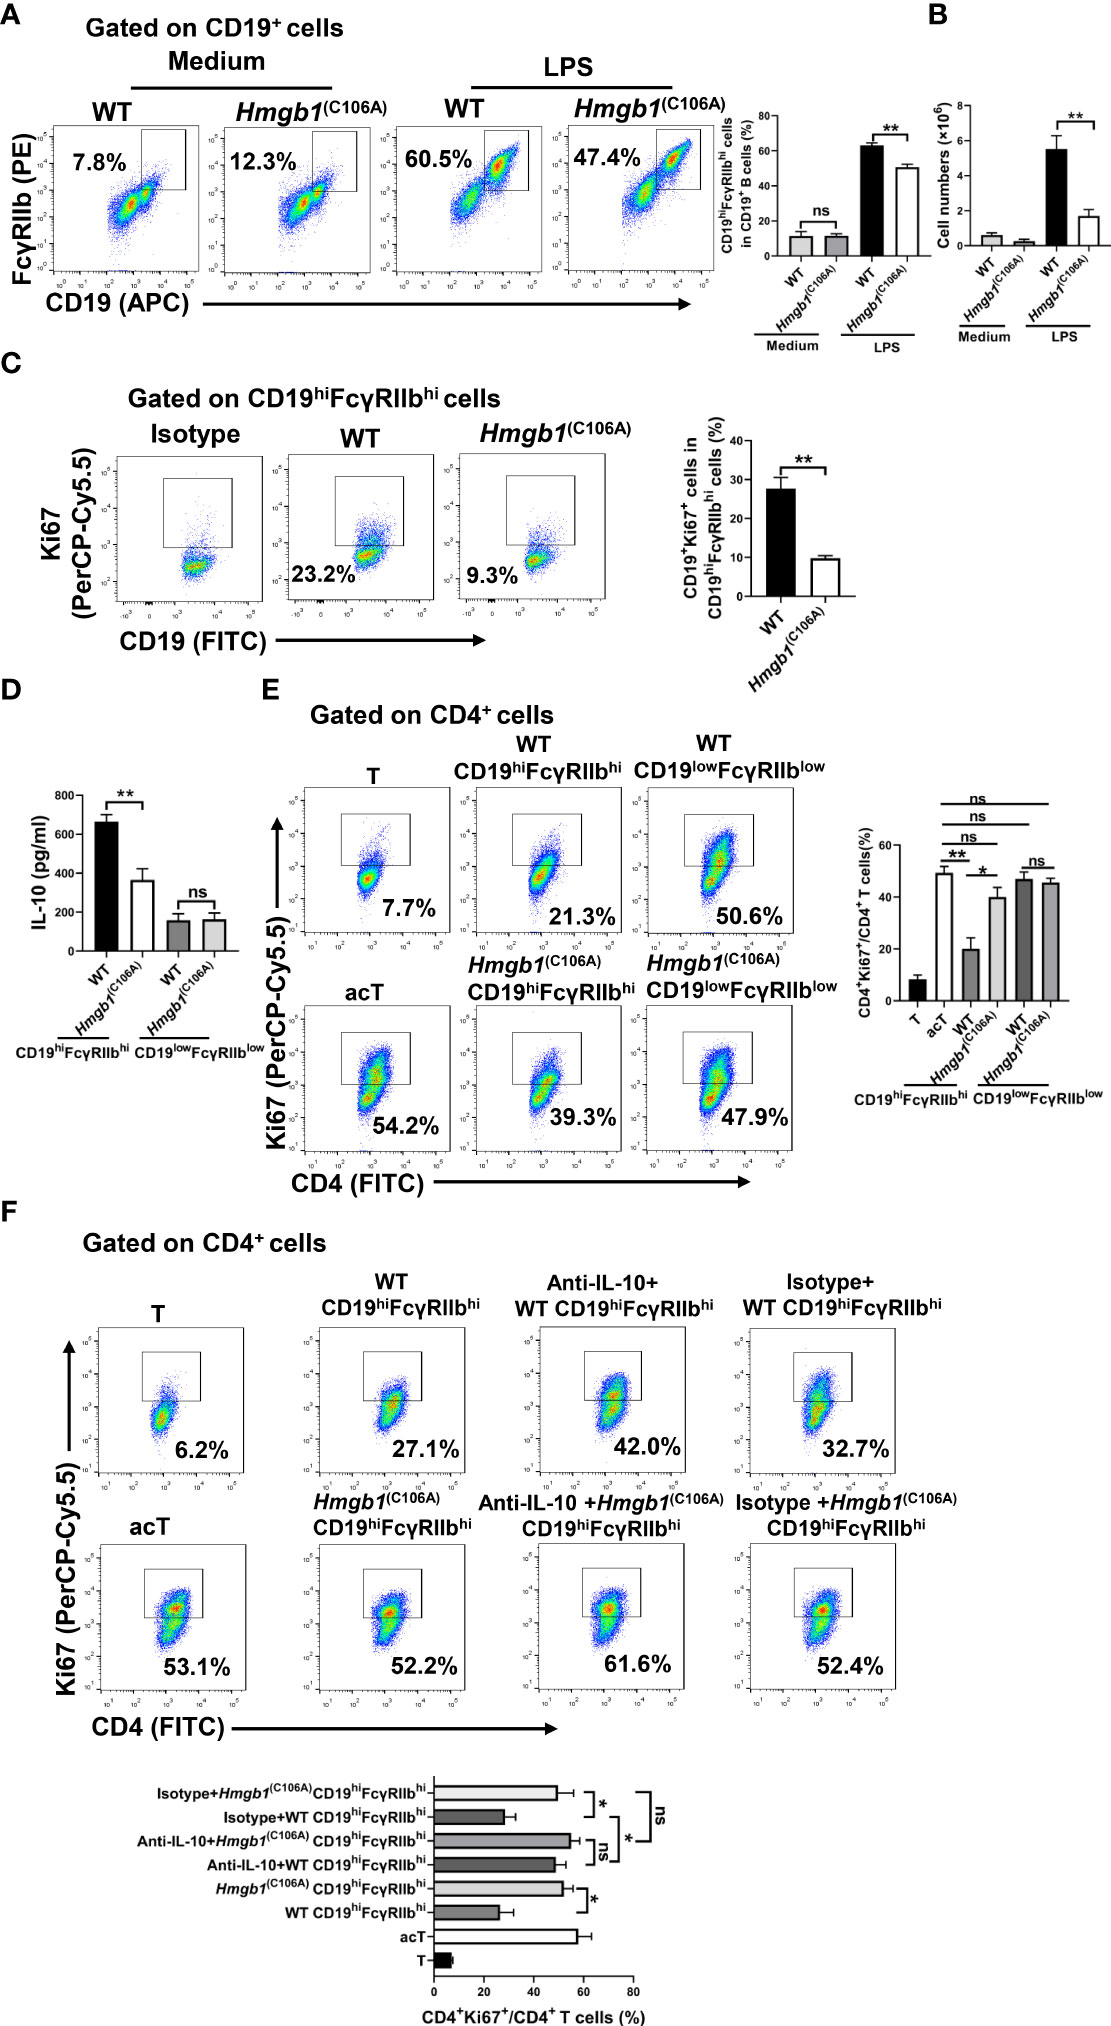
Figure 3 Decreased expansion and suppressive function of CD19hiFcγRIIbhi B cells among Hmgb1(C106A) B cells. (A, B) Splenic CD19+ B cells from Hmgb1(C106A) or WT mice were treated with or without LPS for 2 days. Flow cytometry was performed to assess the percentage (A) and number (B) of CD19hiFcγRIIbhi B cells. Data are shown as means ± SEMs of three independent experiments. (C) Highly purified splenic CD19+ B cells from Hmgb1(C106A) or WT mice were cocultured with LPS for 48 h in vitro, and the percentage of proliferating (Ki67+) CD19hiFcγRIIbhi B cells among WT and Hmgb1(C106A) B cells was analyzed by flow cytometry with Ki67 staining. Data are shown as means ± SEMs of three independent experiments. (D) Splenic CD19+ B cells from Hmgb1(C106A) or WT mice were treated with LPS for 2 days; CD19hiFcγRIIbhi B cells and CD19lowFcγRIIblow B cells were sorted from WT and Hmgb1(C106A) B cells by flow cytometry. CD19hiFcγRIIbhi B cells and CD19lowFcγRIIblow B cells (2 × 10⁵) sorted from Hmgb1(C106A) or WT B cells were plated in 96-well plates. After 24 h, supernatants were collected for measurement of IL-10 levels by ELISA. Data are shown as means ± SEMs of three independent experiments. (E, F) Splenic CD19+ B cells from Hmgb1(C106A) or WT mice were treated with LPS for 2 days; CD19hiFcγRIIbhi B cells and CD19lowFcγRIIblow B cells were sorted from WT and Hmgb1(C106A) B cells by flow cytometry. CD19hiFcγRIIbhi B cells (2 × 10⁵) sorted from Hmgb1(C106A) or WT B cells were cocultured with anti-CD3/CD28-activated CD4+ T cells (2 × 10⁵) (E) in the presence or absence of anti-IL-10 (F). After 3 days, CD4+ T cell proliferation was analyzed by flow cytometry. Data are shown as means ± SEMs of three independent experiments. *P < 0.05; **P < 0.01; NS, not significant.
We next investigated whether the HMGB1 (C106A) mutation in B cells affected IL-10 secretion and the immunosuppressive function of CD19hiFcγRIIbhi B cells. Highly purified CD19+ B cells from Hmgb1(C106A) or WT mice were cocultured with LPS for 48 h in vitro; CD19hiFcγRIIbhi B cells and CD19lowFcγRIIblow B cells from WT and Hmgb1(C106A) B cells were then sorted by flow cytometry. CD19hiFcγRIIbhi B cells or CD19lowFcγRIIblow B cells (2 × 10⁵) were plated onto 96-well plates. After 24 h, the supernatants were collected for measurement of IL-10 levels by ELISA. Purified CD19hiFcγRIIbhi B cells or CD19lowFcγRIIblow B cells (2 × 10⁵) were cocultured with anti-CD3/CD28-activated CD4+ T cells (2 × 10⁵) in the presence or absence of anti-IL-10. CD19hiFcγRIIbhi B cells sorted from LPS-treated Hmgb1(C106A) B cells secreted less IL-10, compared with WT B cells (Figure 3D). CD19hiFcγRIIbhi B cells sorted from LPS-treated Hmgb1(C106A) B cells showed a significantly decreased ability to inhibit CD4+ T cell proliferation because of their reduced IL-10 secretion (Figures 3E, F). Therefore, the HMGB1 (C106A) mutation in B cells reduced the expansion and suppressive function of CD19hiFcγRIIbhi B cells.
LPS or CpG ODN promotes the expansion of CD19hiFcγRIIbhi B cells in vitro. To determine whether HMGB1 promotes the expansion of CD19hiFcγRIIbhi B cells in vitro, we treated purified splenic CD19+ B cells with HMGB1(10 μg/mL), LPS (500 ng/mL), or HMGB1 plus LPS. After 48 h, the percentage and number of CD19hiFcγRIIbhi B cells were determined by flow cytometry. HMGB1 did not promote the proliferation of CD19hiFcγRIIbhi B cells, although it increased CD19hiFcγRIIbhi B cell expansion among LPS-activated B cells (Figures 4A, B). Moreover, HMGB1 enhanced CD19hiFcγRIIbhi B cell expansion among CpG ODN-activated B cells (Figures S6A, B).
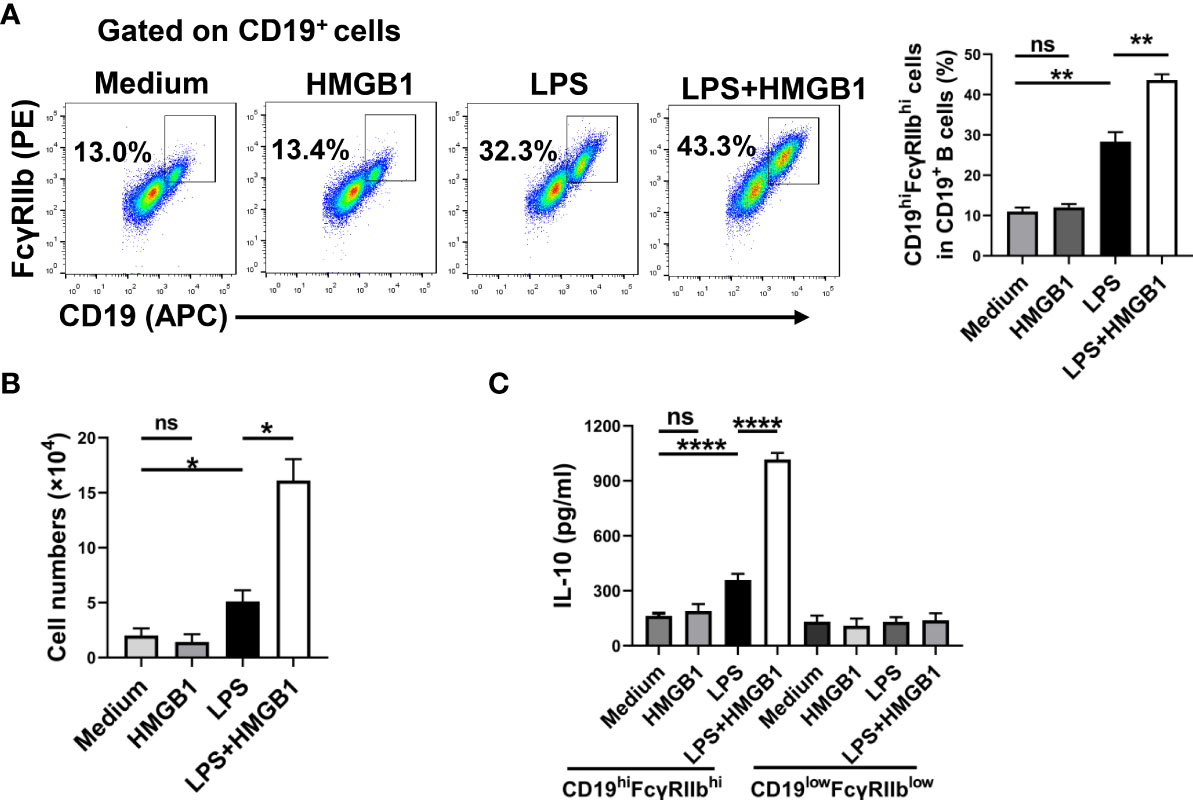
Figure 4 HMGB1 promotes the expansion and IL-10 secretion of CD19hiFcγRIIbhi B cells in vitro. Sorted CD19+B cells (2 × 10⁵/well) from C57BL/6 mice were cultured with HMGB1 (10 μg/mL) and LPS (500 ng/mL) for 2 days. (A, B) Flow cytometry was performed to assess the percentage (A) and number (B) of CD19hiFcγRIIbhi B cells. Data are shown as means ± SEMs of three independent experiments. (C) CD19hiFcγRIIbhi B cells and CD19lowFcγRIIblow B cells were sorted by flow cytometry. CD19hiFcγRIIbhi B cells or CD19lowFcγRIIblow B cells (2 × 10⁵) were plated on 96-well plates for 24 h. IL-10 secretion by CD19hiFcγRIIbhi B cells was analyzed by ELISA. Data are shown as means ± SEMs of four independent experiments. *P < 0.05; **P < 0.01; ****P <0.0001; NS, not significant.
Next, we determined whether HMGB1 promotes IL-10 secretion by CD19hiFcγRIIbhi B cells. Purified splenic CD19+ B cells were treated with HMGB1 (10 μg/mL), LPS (500 ng/mL), or HMGB1 plus LPS. After 48 h, CD19hiFcγRIIbhi B cells and CD19lowFcγRIIblow B cells were sorted by flow cytometry. CD19hiFcγRIIbhi B cells or CD19lowFcγRIIblow B cells (2 × 10⁵) were plated in 96-well plates for 24 h. Supernatants were collected and IL-10 levels were evaluated by ELISA. HMGB1 promoted IL-10 secretion by LPS-activated CD19hiFcγRIIbhi B cells (Figure 4C). Moreover, HMGB1 promoted IL-10 secretion by CpG ODN-activated CD19hiFcγRIIbhi B cells (Figure S6C). Therefore, HMGB1 promotes the expansion and IL-10 secretion of CD19hiFcγRIIbhi B cells in vitro.
HMGB1 mediates JAK2/STAT3 signaling way (25), and STAT3 is implicated in Breg differentiation and function (26). We evaluated the effect of the HMGB1 (C106A) mutation in B cells on STAT3 phosphorylation. CD19+ B cells from WT and Hmgb1(C106A) mice were stimulated with or without LPS. After 48 h, proteins were extracted from LPS-activated WT and Hmgb1(C106A) B cells; STAT3 phosphorylation was evaluated by Western blotting. Although the levels of phosphorylated STAT3 (S727) were similar in WT and Hmgb1(C106A) B cells without LPS stimulation, they were significantly lower in LPS-treated Hmgb1(C106A) B cells than in the corresponding WT B cells (Figure 5A).
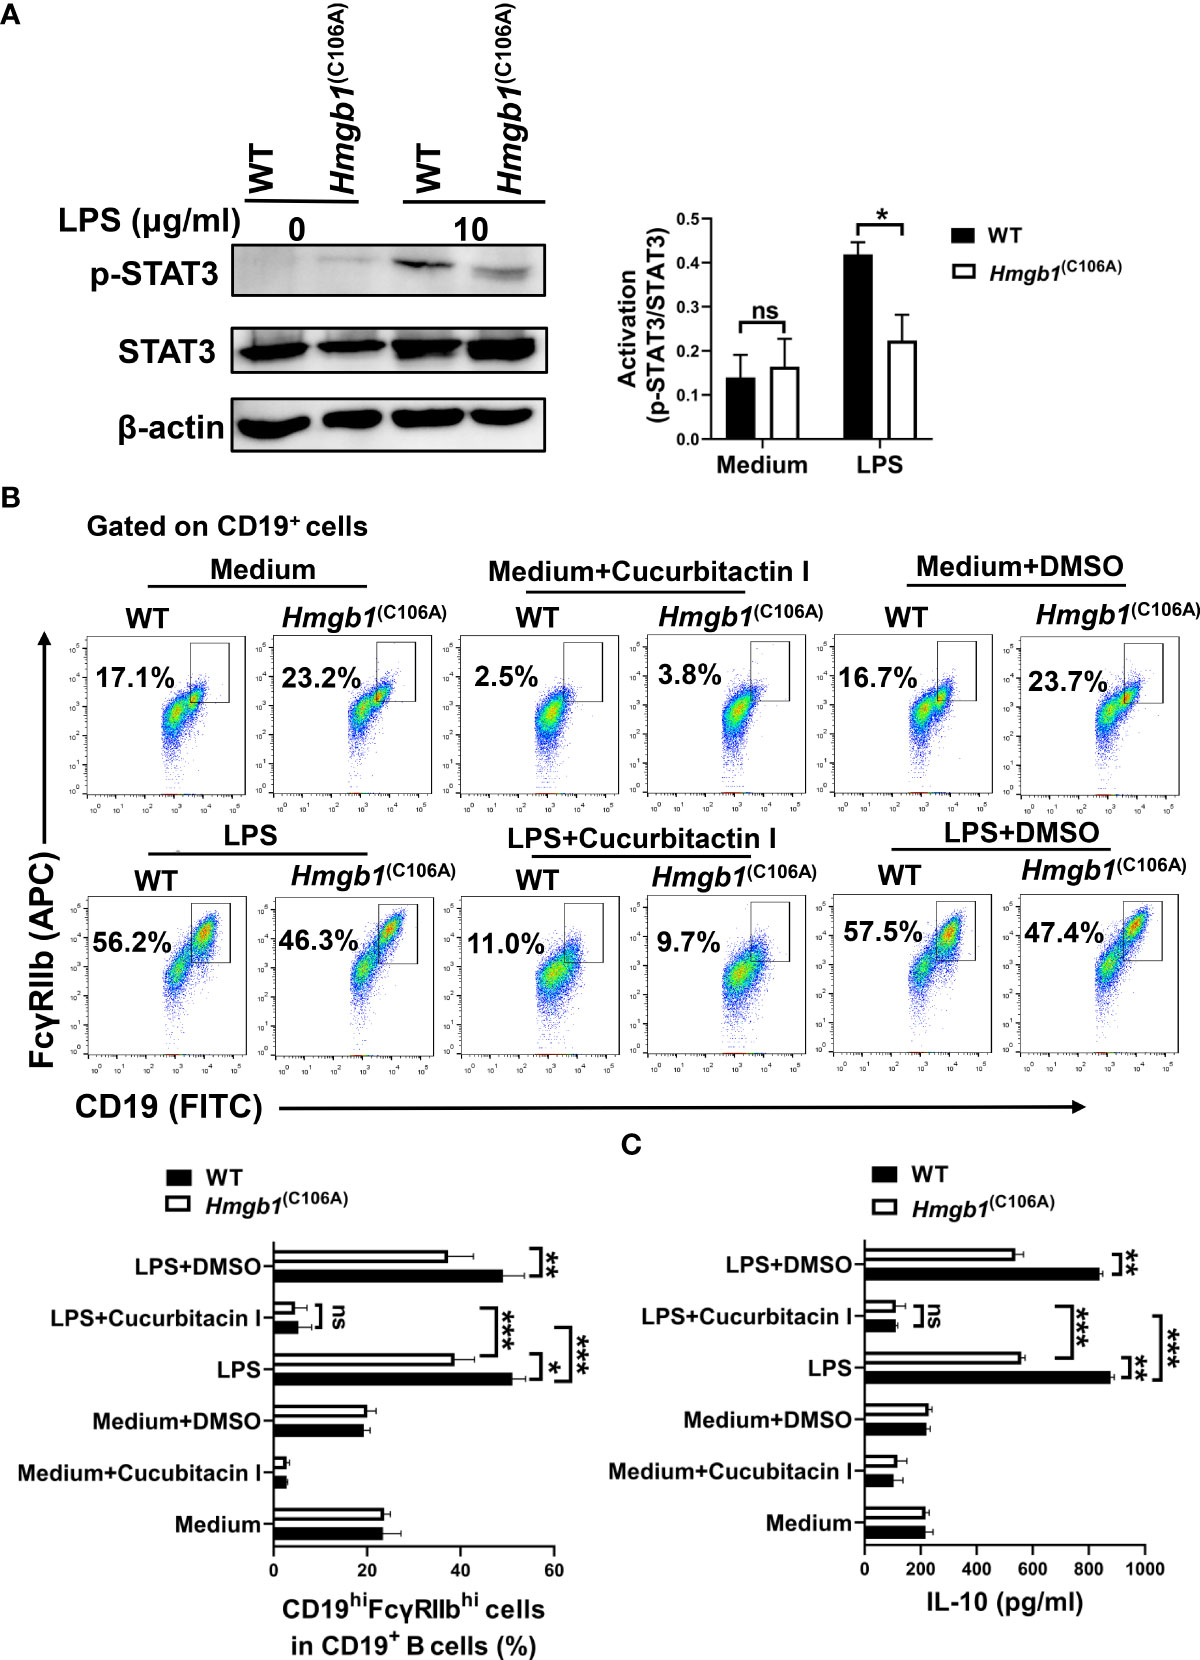
Figure 5 Hmgb1(C106A) inhibits STAT3-mediated expansion and function of CD19hiFcγRIIbhi B cells. (A) Splenic CD19+B cells sorted from Hmgb1(C106A) or WT mice were cultured with or without LPS. After 2 days, total proteins were extracted from B cells, and STAT3 phosphorylation was determined by Western blotting. Data are shown as means ± SEMs of three independent experiments. (B) CD19+B cells (2 × 10⁵/well) sorted from Hmgb1(C106A) or WT mice were treated with LPS in the presence or absence of cucurbitacin I or dimethyl sulfoxide in 96-well plates. After 2 days, B cells were collected and subjected to flow cytometry to assess the percentage of CD19hiFcγRIIbhi B cells. Data are shown as means ± SEMs of three independent experiments. (C) CD19+B cells (2 × 10⁵/well) sorted from Hmgb1(C106A) or WT mice were treated with LPS in the presence or absence of cucurbitacin I or dimethyl sulfoxide in 96-well plates. After 2 days, supernatants were collected for measurement of IL-10 levels by ELISA. Data are shown as means ± SEMs of three independent experiments. *P < 0.05; **P < 0.01; ***P < 0.001; NS, not significant.
Splenic CD19+ B cells sorted from Hmgb1(C106A) or WT mice were pretreated with cucurbitacin I (an inhibitor of STAT3) for 1 h, followed by LPS for 48 h. Cells were collected and the percentage of CD19hiFcγRIIbhi B cells was determined by flow cytometry. When STAT3 activity was inhibited, the percentage of CD19hiFcγRIIbhi B cells was decreased in both LPS-activated WT and Hmgb1(C106A) B cells; however, the percentage of CD19hiFcγRIIbhi B cells did not significantly differ between LPS-activated WT and Hmgb1(C106A) B cells (Figure 5B). Furthermore, when STAT3 activity was inhibited, IL-10 secretion by LPS-activated WT and Hmgb1(C106A) B cells was decreased; there was no significant difference in IL-10 secretion between LPS-activated WT and Hmgb1(C106A) B cells (Figure 5C). Therefore, the HMGB1 (C106A) mutation in B cells suppressed STAT3 activation, thus inhibiting the expansion and IL-10 secretion of CD19hiFcγRIIbhi B cells.
CD19hiFcγRIIbhi B cells are present in human peripheral blood, where they may inhibit autologous CD4+ T cell proliferation. We used flow cytometry to examine whether CD19hiFcγRIIbhi B cells were increased in patients with sepsis. The percentage of B cells among PBMCs did not differ between patients with sepsis and healthy donors, while the percentages of CD19hiFcγRIIbhi B cells were significantly greater in patients with sepsis than in healthy donors (Figure 6A). Moreover, the number of B cells was smaller in patients with sepsis than in healthy donors, but the numbers of CD19hiFcγRIIbhi B cells did not differ between groups (Figure 6B).
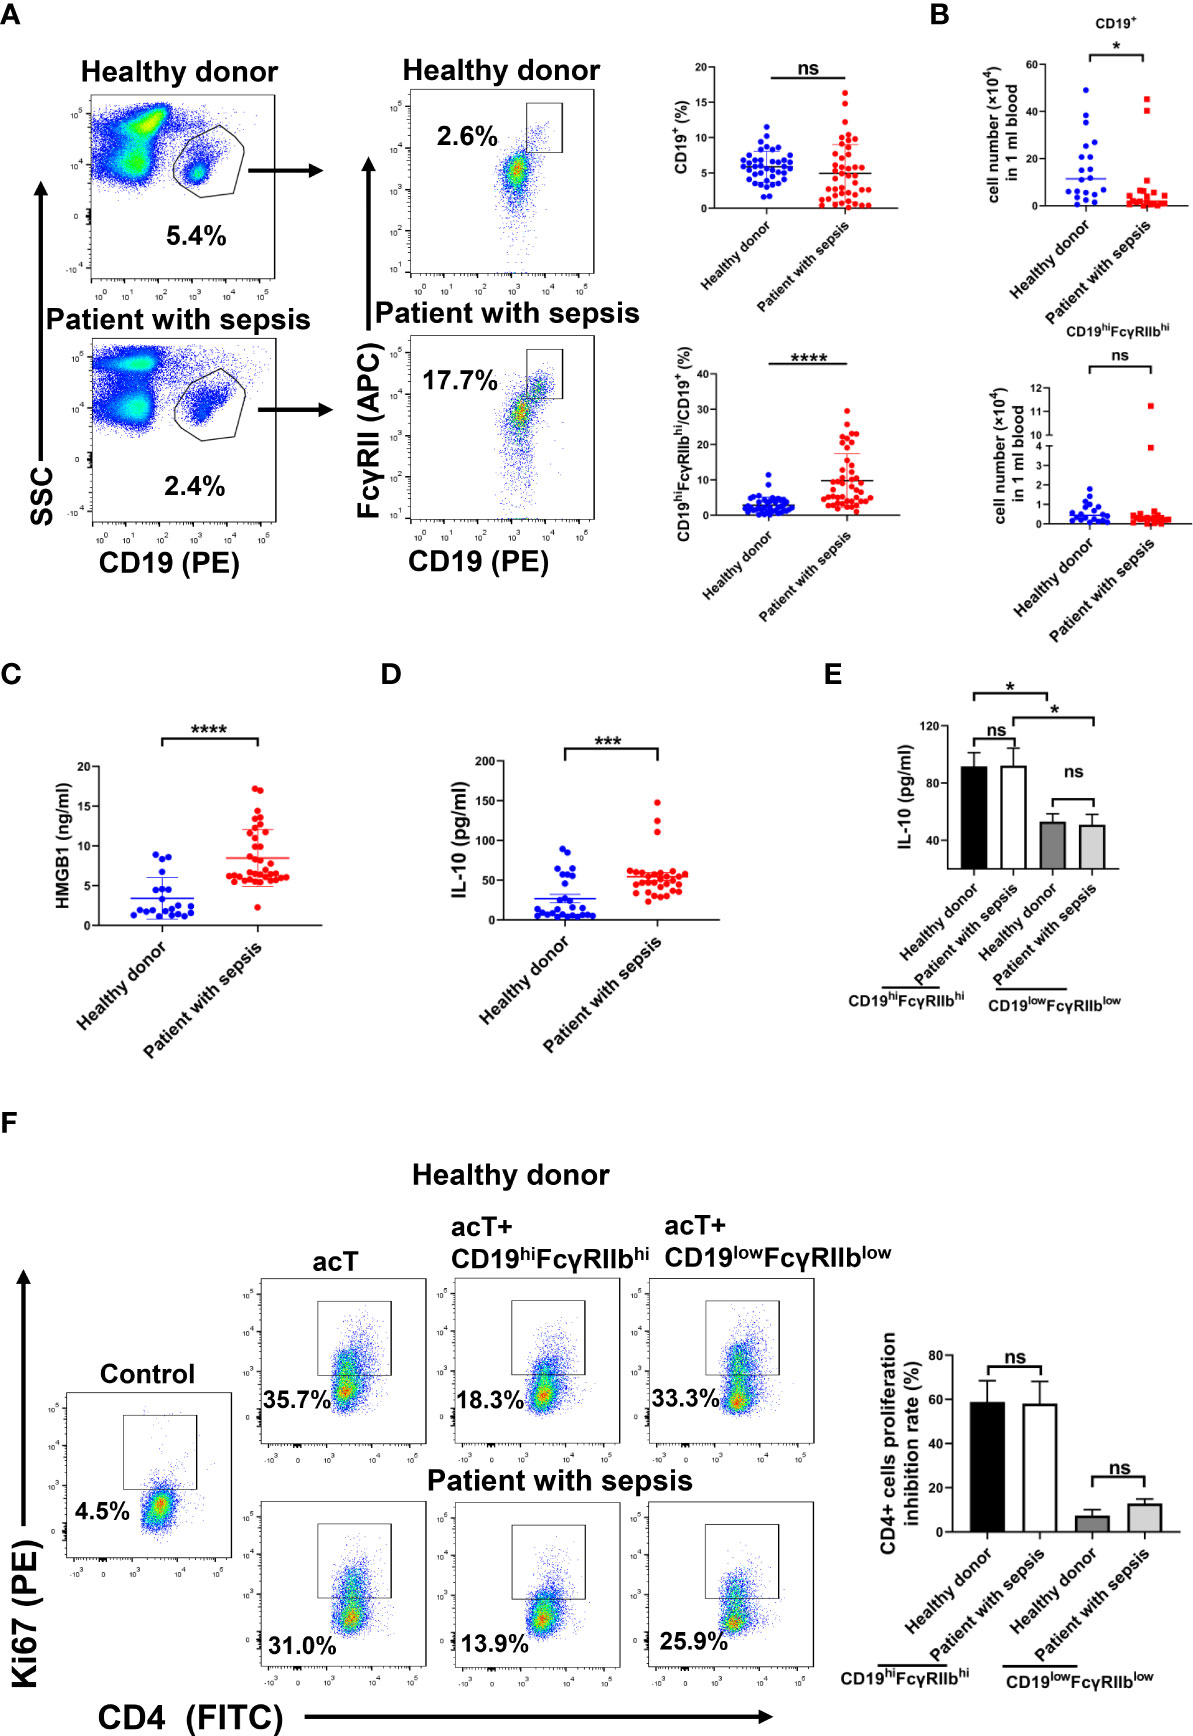
Figure 6 Increased percentage of CD19hiFcγRIIbhi B cells in peripheral blood from patients with sepsis. (A) Percentages of B cells and CD19hiFcγRIIbhi B cells among PBMCs of patients with sepsis and healthy donors were analyzed by flow cytometry. Data are shown as means ± SEMs; n = 40 samples for healthy donors, n = 44 samples for patients with sepsis. (B) Numbers of CD19+ B cells and CD19hiFcγRIIbhi B cells among PBMCs analyzed by flow cytometry. Data are shown as means ± SEMs; n = 20 samples per group. (C) HMGB1 levels in plasma analyzed by ELISA. Data are shown as means ± SEMs; n = 21 samples for healthy donors, n = 36 samples for patients with sepsis. (D) IL-10 levels in plasma analyzed by ELISA. Data are shown as means ± SEMs; n = 27 samples for healthy donors, n = 33 samples for patients with sepsis. (E) CD19hiFcγRIIbhi B cells and CD19lowFcγRIIblow B cells were sorted from PBMCs of patients with sepsis and healthy donors by flow cytometry. CD19hiFcγRIIbhi B cells or CD19lowFcγRIIblow B cells (2 × 10⁵) were plated in 96-well plates. After 24 h, supernatants were collected for measurement of IL-10 levels by ELISA. Data are shown as means ± SEMs of three representative experiments; n = 3 samples per group. (F) CD19hiFcγRIIbhi B cells (1 × 10⁵/well) were cocultured with autologous anti-CD3/CD28 activated CD4+ T cells (1 × 10⁵/well) for 2 days, and Ki67 expression in CD4+ T cells was analyzed by flow cytometry. Results are representative of three independent experiments. Data are shown as means ± SEMs of three representative experiments; n = 3 samples per group. *P < 0.05; ***P < 0.001; ****P < 0.0001; NS, not significant.
ELISA showed that the HMGB1 and IL-10 levels were higher in patients with sepsis than in healthy donors (Figures 6C, D). We next investigated whether CD19hiFcγRIIbhi B cells have greater suppressive activity in patients with sepsis than in healthy donors. CD19hiFcγRIIbhi B cells and CD19lowFcγRIIblow B cells were sorted from PBMCs of patients with sepsis and healthy donors. CD19hiFcγRIIbhi B cells or CD19lowFcγRIIblow B cells (2 × 10⁵) were plated in 96-well plates for 24 h; IL-10 levels in supernatant were then evaluated. CD19hiFcγRIIbhi B cells secreted more IL-10, compared with CD19lowFcγRIIblow B cells, from both patients with sepsis and healthy donors. However, there was no difference in IL-10 secretion by CD19hiFcγRIIbhi B cells between patients with sepsis and healthy donors (Figure 6E). CD19hiFcγRIIbhi B cells, CD19lowFcγRIIblow B cells, and CD4+ T cells were sorted from PBMCs of patients with sepsis and healthy donors. Purified CD19hiFcγRIIbhi B cells or CD19lowFcγRIIblow B cells (1 × 10⁵) were cocultured with anti-CD3/CD28-activated CD4+ T cells (1 × 10⁵) for 2 days. CD19hiFcγRIIbhi B cells suppressed autologous CD4+ T cell proliferation. However, there was no difference in the suppressive activity of CD19hiFcγRIIbhi B cells between patients with sepsis and healthy donors (Figure 6F). Therefore, compared with healthy donors, the percentages of CD19hiFcγRIIbhi B cells in patients with sepsis were increased, but the suppressive function of CD19hiFcγRIIbhi B cells did not significantly differ.
Bregs lack a specific transcription factor and secrete high levels of both IL-10 and TGF-β (27). Our previous studies have showed that there is a new subset of IL-10-producing regulatory B cells with high CD19 and FcγRIIb expression in mice (10). The percentages of CD19hiFcγRIIbhi B cells are increased in the spleens of mice with LPS-induced inflammation, but the expansion and function of CD19hiFcγRIIbhi B cells during inflammation are unclear. HMGB1 is a damage-associated molecular pattern protein that is released from the nucleus to the extracellular space during inflammation and infection (11, 28). HMGB1 regulates various immunosuppressive cell types; for example, it enhances the immunosuppressive activity of Tregs (17)and induces the differentiation of bone marrow cells to myeloid-derived suppressor cells (18). However, it has been unclear whether HMGB1 regulates CD19hiFcγRIIbhi B cell expansion and function. Therefore, we investigated the potential regulation of mouse spleen CD19hiFcγRIIbhi B cells by HMGB1 during inflammation.
The percentage of CD19hiFcγRIIbhi B cells from mice with LPS-induced inflammation was significantly increased, compared with the percentage of such cells from WT mice; the expansion of CD19hiFcγRIIbhi B cells in the spleen of Hmgb1(C106A) mice with LPS-induced inflammation was significantly decreased. CD19hiFcγRIIbhi B cells from the spleen of Hmgb1(C106A) mice with LPS-induced inflammation secreted less IL-10. The ability of CD19hiFcγRIIbhi B cells from Hmgb1(C106A) mice with LPS-induced inflammation to inhibit the proliferation of activated CD4+ T cells was significantly decreased, compared with that ability in cells from WT mice. In addition, we examined the effect of CD19hiFcγRIIbhi B cells with the HMGB1 (C106A) mutation on the progression of sepsis. Hmgb1(C106A) significantly reduced the anti-inflammatory effect of CD19hiFcγRIIbhi B cells. HMGB1 is expressed in B cells; thus, we explored whether Hmgb1(C106A) in B cells would decrease the percentage, number, and suppressive function of CD19hiFcγRIIbhi B cells. Hmgb1(C106A) in B cells reduced the expansion and suppressive function of CD19hiFcγRIIbhi B cells.
LPS and CpG ODN induce IL-10 production by CD19hiFcγRIIbhi B cells in vitro. The B-cell receptor, CD40L, and Toll-like receptor (TLR) pathways are required for the induction and development of IL-10-producing Bregs (29). The main receptors of HMGB1 are TLRs such as TLR2, TLR4, and TLR9 (30). Therefore, we explored whether recombinant HMGB1 could promote the expansion of CD19hiFcγRIIbhi B cells in vitro. HMGB1 alone did not induce CD19hiFcγRIIbhi B cells, while it enhanced the expansion of CD19hiFcγRIIbhi B cells among LPS- or CpG ODN-activated B cells. Therefore, in contrast to LPS and CpG ODN, HMGB1 does not induce CD19hiFcγRIIbhi B cells, possibly because of the activation of different signaling pathways. The underlying mechanism warrants further investigation.
The mechanisms underlying Bregs differentiation are unclear but involve transcription factors such as IRF4 (31), STAT3 (26), and c-MAF (32). Moreover, extracellular HMGB1 activates the STAT3 signaling pathway (33) and intracellular HMGB1 binds to STAT3 (34). Therefore, we tested whether Hmgb1(C106A) affects the expansion of CD19hiFcγRIIbhi B cells via the STAT3 signaling pathway. p-STAT3 expression was significantly reduced in LPS-activated Hmgb1(C106A) B cells, compared with LPS-activated WT B cells. The inhibition of STAT3 activity decreased the percentages and IL-10 secretion of CD19hiFcγRIIbhi B cells in both LPS-activated WT and Hmgb1(C106A) B cells. The percentage and IL-10 secretion of CD19hiFcγRIIbhi B cells did not significantly differ between LPS-activated WT and Hmgb1(C106A) B cells. Therefore, Hmgb1(C106A) inhibits the expansion and function of CD19hiFcγRIIbhi B cells in a STAT3-dependent manner.
Sepsis is an overreaction to a pathogen and affects most types of immune cells (35, 36). In an immunosuppressed state, the numbers of lymphocytes are greatly reduced and the numbers of negative regulatory cells are increased (37, 38). Patients who survive sepsis are typically in a state of prolonged immunosuppression and likely to experience nosocomial infection (39). Here, we found that the percentage of CD19hiFcγRIIbhi B cells was significantly increased in patients who survived sepsis. The HMGB1 content in plasma was higher in patients with sepsis than in healthy donors. It has been reported that some inflammatory cytokines, such as IL-6 and IL-1β, can induce IL-10-producing regulatory B cells generation. However, whether these cytokines, together with HMGB1, also affect the frequency of CD19hiFcγRIIbhi B cells in peripheral blood of patients with sepsis needs to be investigated further. There was no significant difference in the function of CD19hiFcγRIIbhi B cells between healthy donors and patients with sepsis. Mouse B cells express TLR2 and TLR4. Human B cells have been shown to express TLR1, TLR6 and TLR7, but exhibit minimal or no TLR2, TLR3, TLR4 and TLR5 expression (40). TLRs activation plays an important role in the development and function of regulatory B cells expressing IL-10 (41). The difference of TLRs expression on human B cells and mouse B cells may explain why exogenous HMGB1 enhanced the suppressive function of mouse CD19hiFcγRIIbhi B cells but not human CD19hiFcγRIIbhi B cells. Future studies should investigate whether the frequency of CD19hiFcγRIIbhi B cells is related to disease stage and prognosis in patients with sepsis.
In conclusion, the HMGB1 (C106A) mutation in B cells reduced the expansion and suppressive function of CD19hiFcγRIIbhi B cells by blocking STAT3 phosphorylation. HMGB1 promoted the expansion of CD19hiFcγRIIbhi B cells among LPS or CpG ODN-activated B cells. Moreover, the percentage of CD19hiFcγRIIbhi B cells was significantly increased in patients with sepsis.
The raw data supporting the conclusions of this article will be made available by the authors, without undue reservation.
The studies involving human participants were reviewed and approved by The Ethics Committee of the Medical College of Yangzhou University. The patients/participants provided their written informed consent to participate in this study. The animal study was reviewed and approved by The Ethics Committee of the Medical College of Yangzhou University.
ML, JZ, RY, HY and YD performed the experiments in this study. LQ and FM designed the experiments, analyzed data, and wrote the paper. All authors contributed to the article and approved the submitted version.
This work was supported by the National Natural Science Foundation of China (81771689, 81373130 and 81001308), the Six Talent Peak Projects in Jiangsu Province (YY-050), Natural Science Foundation of Jiangsu Province for Distinguished Young Scholars (BK20200004) and the Young Academic Leaders Project of Yangzhou University (201714).
The authors declare that the research was conducted in the absence of any commercial or financial relationships that could be construed as a potential conflict of interest.
All claims expressed in this article are solely those of the authors and do not necessarily represent those of their affiliated organizations, or those of the publisher, the editors and the reviewers. Any product that may be evaluated in this article, or claim that may be made by its manufacturer, is not guaranteed or endorsed by the publisher.
The Supplementary Material for this article can be found online at: https://www.frontiersin.org/articles/10.3389/fimmu.2022.975551/full#supplementary-material
1. Bouaziz J, Yanaba K, Tedder TF. Regulatory b cells as inhibitors of immune responses and inflammation. Immunological reviews (2008) 224:201–14. doi: 10.1111/j.1600-065X.2008.00661.x
2. Mauri C, Ehrenstein MR. The ‘short’ history of regulatory b cells. Trends Immunol (2008) 29(1):34–40. doi: 10.1016/j.it.2007.10.004
3. Dasgupta S, Dasgupta S, Bandyopadhyay M. Regulatory b cells in infection, inflammation, and autoimmunity. Cell Immunol (2020) 352:104076. doi: 10.1016/j.cellimm.2020.104076
4. DiLillo D, Matsushita T, Tedder TF. B10 cells and regulatory b cells balance immune responses during inflammation, autoimmunity, and cancer. Ann N Y Acad Sci (2010) 1183:38–57. doi: 10.1111/j.1749-6632.2009.05137.x
5. Sheng J, Quan S, Soliven B. CD1d(hi)CD5+ b cells expanded by GM-CSF in vivo suppress experimental autoimmune myasthenia gravis. J Immunol (2014) 193(6):2669–77. doi: 10.4049/jimmunol.1303397
6. Gu X, He H, Lin L, Luo G, Wen Y, Xiang D, et al. Tim-1 b cells suppress T cell interferon-gamma production and promote Foxp3 expression, but have impaired regulatory function in coronary artery disease. APMIS (2017) 125(10):872–9. doi: 10.1111/apm.12729
7. Zhang Y, Wei S, Wu Q, Shen X, Dai W, Zhang Z, et al. Interleukin-35 promotes breg expansion and interleukin-10 production in CD19 b cells in patients with ankylosing spondylitis. Clin Rheumatol (2022) 41(8):2403–16. doi: 10.1007/s10067-022-06137-8
8. Shankar S, Stolp J, Juvet S, Beckett J, Macklin P, Issa F, et al. Ex vivo-expanded human CD19TIM-1 regulatory b cells suppress immune responses in vivo and are dependent upon the TIM-1/STAT3 axis. Nat Commun (2022) 13(1):3121. doi: 10.1038/s41467-022-30613-z
9. Neu S, Dittel B. Characterization of definitive regulatory b cell subsets by cell surface phenotype, function and context. Front Immunol (2021) 12:787464. doi: 10.3389/fimmu.2021.787464
10. Qian L, Qian C, Chen Y, Bai Y, Bao Y, Lu L, et al. Regulatory dendritic cells program b cells to differentiate into CD19hiFcγIIbhi regulatory b cells through IFN-β and CD40L. Blood (2012) 120(3):581–91. doi: 10.1182/blood-2011-08-377242
11. Dumitriu IE, Baruah P, Manfredi AA, Bianchi ME, Rovere-Querini P. HMGB1: guiding immunity from within. Trends Immunol (2005) 26(7):381–7. doi: 10.1016/j.it.2005.04.009
12. Hoppe G, Talcott KE, Bhattacharya SK, Crabb JW, Sears JE. Molecular basis for the redox control of nuclear transport of the structural chromatin protein Hmgb1. Exp Cell Res (2006) 312(18):3526–38. doi: 10.1016/j.yexcr.2006.07.020
13. Dong H, Zhang L, Liu S. Targeting HMGB1: An available therapeutic strategy for breast cancer therapy. Int J Biol Sci (2022) 18(8):3421–34. doi: 10.7150/ijbs.73504
14. Kaur I, Behl T, Bungau S, Kumar A, Mehta V, Setia D, et al. Exploring the therapeutic promise of targeting HMGB1 in rheumatoid arthritis. Life Sci (2020) 258:118164. doi: 10.1016/j.lfs.2020.118164
15. Zhu C, Wang W, Qiang X, Chen W, Lan X, Li J, et al. Endogenous regulation and pharmacological modulation of sepsis-induced HMGB1 release and action: An updated review. Cells (2021) 10(9):2220. doi: 10.3390/cells10092220
16. Dumitriu IE, Baruah P, Valentinis B, Voll RE, Herrmann M, Nawroth PP, et al. Release of high mobility group box 1 by dendritic cells controls T cell activation via the receptor for advanced glycation end products. J Immunol (Baltimore Md: 1950) (2005) 174(12):7506–15. doi: 10.4049/jimmunol.174.12.7506
17. Luo C, Liu H, Wang H, Wang J. Toll-like receptor 4 signaling in high mobility group box-1 protein 1 mediated the suppression of regulatory T-cells. Med Sci monitor: Int Med J Exp Clin Res (2017) 23:300–8. doi: 10.12659/MSM.902081
18. Li J, Sun J, Rong R, Li L, Shang W, Song D, et al. HMGB1 promotes myeloid-derived suppressor cells and renal cell carcinoma immune escape. Oncotarget (2017) 8(38):63290–8. doi: 10.18632/oncotarget.18796
19. Semino C, Ceccarelli J, Lotti LV, Torrisi MR, Angelini G, Rubartelli A. The maturation potential of NK cell clones toward autologous dendritic cells correlates with HMGB1 secretion. J leukocyte Biol (2007) 81(1):92–9. doi: 10.1189/jlb.0306172
20. Kazama H, Ricci JE, Herndon JM, Hoppe G, Green DR, Ferguson TA. Induction of immunological tolerance by apoptotic cells requires caspase-dependent oxidation of high-mobility group box-1 protein. Immunity (2008) 29(1):21–32. doi: 10.1016/j.immuni.2008.05.013
21. Yang H, Hreggvidsdottir HS, Palmblad K, Wang H, Ochani M, Li J, et al. A critical cysteine is required for HMGB1 binding to toll-like receptor 4 and activation of macrophage cytokine release. Proc Natl Acad Sci United States America (2010) 107(26):11942–7. doi: 10.1073/pnas.1003893107
22. Hong Z, Jiang Z, Liangxi W, Guofu D, Ping L, Yongling L, et al. Chloroquine protects mice from challenge with CpG ODN and LPS by decreasing proinflammatory cytokine release. Int Immunopharmacol (2004) 4(2):223–34. doi: 10.1016/j.intimp.2003.12.006
23. He W, Xu J, Mu R, Li Q, Lv DL, Huang Z, et al. High-salt diet inhibits tumour growth in mice via regulating myeloid-derived suppressor cell differentiation. Nat Commun (2020) 11(1):1732. doi: 10.1038/s41467-020-15524-1
24. Vettermann C, Castor D, Mekker A, Gerrits B, Karas M, Jäck HM. Proteome profiling suggests a pro-inflammatory role for plasma cells through release of high-mobility group box 1 protein. Proteomics (2011) 11(7):1228–37. doi: 10.1002/pmic.201000491
25. Chen X, Liu X, He B, Pan Y, Sun H, Xu T, et al. MiR-216b functions as a tumor suppressor by targeting HMGB1-mediated JAK2/STAT3 signaling way in colorectal cancer. Am J Cancer Res (2017) 7(10):2051–69.
26. Xu Y, Wu K, Han S, Ding S, Lu G, Lin Z, et al. Astilbin combined with lipopolysaccharide induces IL-10-producing regulatory b cells via the STAT3 signalling pathway. Biomed Pharmacother (2020) 129:110450. doi: 10.1016/j.biopha.2020.110450
27. Catalán D, Mansilla M, Ferrier A, Soto L, Oleinika K, Aguillón J, et al. Immunosuppressive mechanisms of regulatory b cells. Front Immunol (2021) 12:611795. doi: 10.3389/fimmu.2021.611795
28. Yang H, Wang H, Andersson U. Targeting inflammation driven by HMGB1. Front Immunol (2020) 11:484. doi: 10.3389/fimmu.2020.00484
29. Mauri C, Menon M. Human regulatory b cells in health and disease: therapeutic potential. J Clin Invest (2017) 127(3):772–9. doi: 10.1172/JCI85113
30. Nogueira-Machado J, Volpe C, Veloso C, Chaves M. HMGB1, TLR and RAGE: a functional tripod that leads to diabetic inflammation. Expert Opin Ther Targets (2011) 15(8):1023–35. doi: 10.1517/14728222.2011.575360
31. Rangaswamy U, Speck S. Murine gammaherpesvirus M2 protein induction of IRF4 via the NFAT pathway leads to IL-10 expression in b cells. PLoS Pathog (2014) 10(1):. doi: 10.1371/journal.ppat.1003858
32. Michée-Cospolite M, Boudigou M, Grasseau A, Simon Q, Mignen O, Pers J, et al. Molecular mechanisms driving IL-10- producing b cells functions: STAT3 and c-MAF as underestimated central key regulators? Front Immunol (2022) 13:818814. doi: 10.3389/fimmu.2022.818814
33. Zhang Y, Ren H, Li J, Xue R, Liu H, Zhu Z, et al. Elevated HMGB1 expression induced by hepatitis b virus X protein promotes epithelial-mesenchymal transition and angiogenesis through STAT3/miR-34a/NF-κB in primary liver cancer. Front Immunol (2021) 11(2):479–94. doi: Front Immunol
34. Yu Y, Ou-Yang W, Zhang H, Jiang T, Tang L, Tan Y, et al. MiR-125b enhances autophagic flux to improve septic cardiomyopathy via targeting STAT3/HMGB1. Exp Cell Res (2021) 409(2):112842. doi: 10.1016/j.yexcr.2021.112842
35. Hotchkiss RS, Karl IE. The pathophysiology and treatment of sepsis. New Engl J Med (2003) 348(2):138–50. doi: 10.1056/NEJMra021333
36. Hotchkiss RS, Monneret G, Payen D. Immunosuppression in sepsis: a novel understanding of the disorder and a new therapeutic approach. Lancet Infect Dis (2013) 13(3):260–8. doi: 10.1016/S1473-3099(13)70001-X
37. Felmet KA, Hall MW, Clark RS, Jaffe R, Carcillo JA. Prolonged lymphopenia, lymphoid depletion, and hypoprolactinemia in children with nosocomial sepsis and multiple organ failure. J Immunol (Baltimore Md: 1950) (2005) 174(6):3765–72. doi: 10.4049/jimmunol.174.6.3765
38. Boomer JS, To K, Chang KC, Takasu O, Osborne DF, Walton AH, et al. Immunosuppression in patients who die of sepsis and multiple organ failure. JAMA (2011) 306(23):2594–605. doi: 10.1001/jama.2011.1829
39. Torgersen C, Moser P, Luckner G, Mayr V, Jochberger S, Hasibeder WR, et al. Macroscopic postmortem findings in 235 surgical intensive care patients with sepsis. Anesth analgesia (2009) 108(6):1841–7. doi: 10.1213/ane.0b013e318195e11d
40. Ganley-Leal LM, Liu X, Wetzler LM. Toll-like receptor 2-mediated human b cell differentiation. Clin Immunol (Orlando Fla) (2006) 120(3):272–84. doi: 10.1016/j.clim.2006.04.571
Keywords: HMGB1, CD19hiFcγRIIbhi B cells, STAT3, sepsis, IL-10
Citation: Liu M, Zhou J, Yin R, Yin H, Ding Y, Ma F and Qian L (2022) The HMGB1 (C106A) mutation inhibits IL-10-producing CD19hiFcγRIIbhi B cell expansion by suppressing STAT3 activation in mice. Front. Immunol. 13:975551. doi: 10.3389/fimmu.2022.975551
Received: 22 June 2022; Accepted: 11 July 2022;
Published: 02 August 2022.
Edited by:
Chaofeng Han, Second Military Medical University, ChinaReviewed by:
Hua Tang, Shandong First Medical University, ChinaCopyright © 2022 Liu, Zhou, Yin, Yin, Ding, Ma and Qian. This is an open-access article distributed under the terms of the Creative Commons Attribution License (CC BY). The use, distribution or reproduction in other forums is permitted, provided the original author(s) and the copyright owner(s) are credited and that the original publication in this journal is cited, in accordance with accepted academic practice. No use, distribution or reproduction is permitted which does not comply with these terms.
*Correspondence: Li Qian, cWlhbmxAeXp1LmVkdS5jbg==; Feng Ma, bWFmQGlzbS5wdW1jLmVkdS5jbg==
Disclaimer: All claims expressed in this article are solely those of the authors and do not necessarily represent those of their affiliated organizations, or those of the publisher, the editors and the reviewers. Any product that may be evaluated in this article or claim that may be made by its manufacturer is not guaranteed or endorsed by the publisher.
Research integrity at Frontiers
Learn more about the work of our research integrity team to safeguard the quality of each article we publish.