 Zhanqing Zhang1*†
 Wei Lu1†Dan Huang1†Xinlan Zhou1
 Rongrong Ding1Xiufen Li1Yanbing Wang1
 Weijia Lin1Dong Zeng2Yanling Feng2
- 1Department of Hepatobiliary Medicine, Shanghai Public Health Clinical Center, Fudan University, Shanghai, China
- 2Department of Clinical Pathology, Shanghai Public Health Clinical Center, Fudan University, Shanghai, China
Objective: Quantitative hepatitis B surface antigen (HBsAg) and hepatitis B virus (HBV) DNA in the natural history of chronic HBV infection have not been rationally evaluated. This study aimed to re-characterize quantitative HBsAg and HBV DNA in the natural history phases.
Methods: A total of 595 and 651 hepatitis B e antigen (HBeAg)-positive patients and 485 and 705 HBeAg-negative patients were assigned to the early and late cohorts, respectively. Based on the ‘S-shape’ receiver operating characteristic (ROC) curves, the HBeAg-positive sub-cohorts with possibly high HBV replication (PHVR) and possibly low HBV replication (PLVR) and the HBeAg-negative sub-cohorts with possibly high HBsAg expression (PHSE) and possibly low HBsAg expression (PLSE) were designated.
Results: The areas under the ROC curve (AUCs) of HBsAg and HBV DNA in predicting HBeAg-positive significant hepatitis activity (SHA) in the early cohort, sub-cohort with PHVR, and sub-cohort with PLVR were 0.655 and 0.541, 0.720 and 0.606, and 0.553 and 0.725, respectively; those in the late cohort, sub-cohort with PHVR, and sub-cohort with PLVR were 0.646 and 0.501, 0.798 and 0.622, and 0.603 and 0.674, respectively. The AUCs of HBsAg and HBV DNA in predicting HBeAg-negative SHA in the early cohort, sub-cohort with PHSE, and sub-cohort with PLSE were 0.508 and 0.745, 0.573 and 0.780, and 0.577 and 0.729, respectively; those in the late cohort, sub-cohort with PHSE, and sub-cohort with PLSE were 0.503 and 0.761, 0.560 and 0.814, and 0.544 and 0.722, respectively. The sensitivity and specificity of HBsAg ≤4.602 log10 IU/ml in predicting HBeAg-positive SHA in the early cohort were 82.6% and 45.8%, respectively; those in the late cohort were 87.0% and 44.1%, respectively. The sensitivity and specificity of HBV DNA >3.301 log10 IU/ml in predicting HBeAg-negative SHA in the early cohort were 73.4% and 60.8%, respectively; those in the late cohort were 73.6% and 64.1%, respectively.
Conclusion: Quantitative HBsAg and HBV DNA are valuable, but their capabilities are divergent in delimiting the natural history phases.
Introduction
The accurate delimitation of the natural history phases and the assessment of the disease conditions of chronic hepatitis B virus (HBV) infection have important clinical implications for the valid management of patients and the rational use of antiviral drugs (1, 2).
Normatively, the natural history can be divided into four consecutive phases under the conventional criteria of serum hepatitis B e antigen (HBeAg) status, HBV DNA, and alanine transferase (ALT) levels, which are HBeAg-positive non-significant hepatitis activity (NSHA), HBeAg-positive significant hepatitis activity (SHA), HBeAg-negative NSHA, and HBeAg-negative SHA (3–6). However, according to the well-known evolution of HBV DNA levels in the natural history, the natural history can also be subdivided into six consecutive phases, which are established HBeAg-positive NSHA and SHA, re-established HBeAg-positive NSHA and SHA, and re-established HBeAg-negative NSHA and SHA. The established NSHA involves high levels of HBV DNA with normal ALT, and the established SHA relates to lowering high levels of HBV DNA with elevated ALT; the re-established NSHA involves low levels of HBV DNA with normal ALT, and the re-established SHA relates to elevating low levels of HBV DNA with elevated ALT. The subdivision of the natural history phases means that HBeAg-positive SHA involves two types of SHA that imply inversely evolving HBV replication levels. However, it should be noted that the re-established SHA is subordinate to the established SHA.
Commercialized quantitative HBV markers include hepatitis B surface antigen (HBsAg), HBeAg, hepatitis B core-related antigen (HBcrAg), antibodies against hepatitis B e antigen (anti-HBe), antibodies against hepatitis B core antigen (anti-HBc), HBV DNA, and HBV RNA (7). Among them, HBV DNA has been routinely used, and HBsAg has been widely promoted (3–6). However, although HBV DNA has been a key parameter for delimiting the natural history phases, its valid cutoffs, especially the one for delimiting HBeAg-positive NSHA and SHA, remain controversial (3–6); although HBsAg has been recommended as a parameter for delimiting the natural history phases, its quantitative criteria have not yet been established (3–6). Although HBsAg has an intrinsic association with HBV DNA, it does not necessarily correlate with HBV DNA, especially in HBeAg-negative NSHA and SHA (8–15). Sources of HBsAg involved HBV covalently closed circular DNA and HBV DNA integrated into the host genome (16–18). High levels of HBsAg and HBeAg may directly contuse the host’s immune response against HBV, which may relate to the maintenance of established HBeAg-positive NSHA (19–21).
The performance of HBsAg in delimiting HBeAg-positive NSHA and SHA has been evaluated. However, previous studies (8–15) have two limitations: first, they referred to the conventional criteria for delimiting the natural history phases covering HBV DNA, which means that they presumed the performance of HBV DNA is ‘optimal’; second, they only involved the un-stratified HBeAg-positive cohorts, which means that they ignored the potential interference of the re-established SHA. In addition, the capability of HBV DNA in delimiting HBeAg-negative NSHA and SHA has been recognized. However, previous studies (22–25) have also a limitation: they did not consider the latent impact of high levels of HBsAg on contusing the immune response. Those limitations suggest that previous studies may have misestimated the capabilities of HBsAg and HBV DNA in delimiting the natural history phases. Given the intrinsic association between HBsAg and HBV DNA, a rational evaluation of HBsAg in delimiting the natural history phases should only refer to serum biochemical and liver pathological criteria. Given the contusion of the immune response by high levels of HBsAg (19–21), a rational evaluation of HBsAg and HBV DNA in delimiting the natural history phases should involve the HBeAg-positive sub-cohorts with possibly high HBV replication (PHVR) and possibly low HBV replication (PLVR) and the HBeAg-negative sub-cohorts with possibly high HBsAg expression (PHSE) and possibly low HBsAg expression (PLSE).
The purpose of this study was based on early and late HBeAg-positive cohorts and their sub-cohorts with PHVR and PLVR, and early and late HBeAg-negative cohorts and their sub-cohorts with PHSE and PLSE, with reference only to the ‘biochemical and pathological criteria, to re-evaluate the performance of HBsAg and HBV DNA, which are the currently clinically accessible HBV markers, in delimiting the natural history phases.
Materials and methods
Study subjects
A total of 2,436 patients with full medical records, detailed liver pathology descriptions, and supporting laboratory data, who were hospitalized and underwent liver biopsy in Shanghai Public Health Clinical Center between January 2011 and August 2021, were involved in this retrospectively cross-sectional real-world study. Indications for liver biopsy involved in this study included the voluntary assessment of liver pathological conditions before the decision to accept or not to receive antiviral therapy under patients’ intention, and voluntary follow-up of liver pathological alterations after the decision not to receive antiviral therapy under patients’ preference. Written informed consent was obtained from all patients before liver biopsy. Patients with the following conditions were excluded (26): comorbid infection with other hepatotropic viruses (hepatitis A, C, D, and E virus), Epstein–Barr virus, cytomegalovirus; Schistosomiasis japonica disease, non-alcoholic fatty liver disease (steatosis >5%), excessive drinking (equivalent to ethanol, men >30 g/day, women >20 g/day), drug-induced liver injury, hyperthyroidism or hypothyroidism, gallstones or bile duct stones; antiviral therapy (nucleosides/nucleotides and interferon-α/peg-interferon-α), or hepato-protective therapy (glycyrrhizates, bicyclol/bifendate, matrine/oxymatrine, Chinese patent medicines, and Chinese medicine prescriptions) within 6 months prior to liver biopsy. Patients with fragmented biopsies or biopsy lengths less than 1.0 cm were also excluded.
Under the update of HBV DNA assays, which are described in section ‘Laboratory assays’, the patients involved were divided into four cohorts. A total of 595 and 485 patients hospitalized between January 2011 and August 2015 were involved in the early HBeAg-positive and HBeAg-negative cohort, respectively; 651 and 705 patients hospitalized between September 2015 and August 2021 were involved in the late HBeAg-positive and HBeAg-negative cohort, respectively.
This study was approved by the independent ethics committee of the Shanghai Public Health Clinical Center (ethical official number: 2013-K-008, 2018-S003-002) and conducted according to the guidelines of the 2013 Declaration of Helsinki.
Laboratory assays
Fasting venous blood was collected in the morning within 1 week before and after liver biopsy and sent for laboratory tests within 30 to 60 min. Serum separation is performed by professionals in a clinical laboratory. HBsAg and HBeAg were measured by chemiluminescent microparticle immunoassay using an Abbott Architect i2000 automatic immunoassay system (Abbott Laboratories, Chicago, IL, USA) with corollary reagents (15, 26–28), the dynamic range of HBsAg is 0.05 to 250 IU/ml, and serum was diluted by 500-fold and re-measured if HBsAg exceeded the upper limit of detection; the lower limit of detection of HBeAg is 1.0 SCO. ALT in patients in the early cohorts was measured using a Hitachi 7600 automated biochemist analyzer (Hitachi, Tokyo, Japan) with corollary reagents; in patients in the late cohorts, ALT was measured using an Architect c16000 automatic biochemical analyzer (Abbott Laboratories, Chicago, IL, USA) with corollary reagents (15, 26–28).
HBV DNA in patients in the early cohorts was measured by dye-based qPCR assay using a Bio-Rad Icycler PCR System (Bio-Rad Laboratories, Inc., California, USA), the reagents were purchased from Qiagen Shenzhen Co. Ltd. (Shenzhen, China), and detection range is 500 to 5 × 10⁷ IU/ml (15, 27); in patients in the late cohorts, HBV DNA was measured by probe-based qPCR assay using a Roche LightCycler 480 qPCR system (Roche, Basel, Switzerland), the reagents were purchased from Sansure Biotech Inc. (Changsha, China), and detection range is 100 to 2 × 10⁹ IU/ml (26, 28).
Pathological diagnoses
Ultrasound-guided percutaneous aspiration liver biopsy was performed, and the biopsy was placed directly into a pre-prepared plastic tube, snap-frozen, and transported for pathological diagnosis. The biopsies were processed within 36 h (26–28). Quality assessments and pathological diagnoses of the biopsies were conducted independently by a senior pathologist who was blinded to laboratory information. The liver pathological diagnosis referred to the Scheuer scoring system (29), in which pathological grade (Grade) is a description of the degree of necro-inflammation, with five grades from G0 to G4; pathological stage (Stage) is a description of the degree of fibrosis and alterations in architecture, with five stages from S0 to S4.
Terminology designations
In this study, biochemically SHA was defined as ALT ≥40 IU/L (3, 4). Established and re-established pathologically SHA were defined as ‘Grade >G1 or Stage >S1’ and Grade >G1 (3–6), respectively.
Established HBeAg-positive NSHA was defined as ‘ALT <40 IU/L and Grade ≤G1 and Stage ≤S1’; established HBeAg-positive SHA was defined as ‘ALT ≥40 IU/L or Grade >G1 or Stage >S1’. Re-established HBeAg-positive and HBeAg-negative NSHA defined as ‘ALT <40 IU/L and Grade ≤G1’; re-established HBeAg-positive and HBeAg-negative SHA was defined as ‘ALT ≥40 IU/L or Grade >G1’.
HBeAg-positive SHA in the HBeAg-positive cohorts was specified as established or re-established HBeAg-positive SHA, which was the same definition as established HBeAg-positive SHA instead of re-established HBeAg-positive SHA; HBeAg-positive SHA in the sub-cohorts with PHVR was specified as established HBeAg-positive SHA; HBeAg-positive SHA in the sub-cohorts with PLVR was specified as re-established HBeAg-positive SHA. The SHA without limitation of HBeAg status in all the cohorts and sub-cohorts was specified as any type of SHA.
HBeAg-positive NSHA and SHA in unspecified cohorts or sub-cohorts have the same definition as established HBeAg-positive NSHA and SHA, respectively.
Statistical analyses
MedCalc version 15.8 (MedCalc Software, Mariakerke, Belgium) was used for statistical analyses and graph creations. Locally estimated scatter plot smoothing (LOESS) regression was used to explore the evolution trends between ALT and HBsAg, HBeAg, and HBV DNA in the HBeAg-positive and HBeAg-negative cohorts (26). The receiver operating characteristic (ROC) curve was used to explore the latent ‘biphasic nature’ of HBV DNA and HBeAg in predicting SHA in the HBeAg-positive cohorts and of HBsAg in predicting SHA in the HBeAg-negative cohorts. The HBeAg-positive sub-cohorts with PHVR and PLVR and the HBeAg-negative sub-cohorts with PHSE and PLSE were designated, respectively, based on the ‘biphasic shape’ of the ROC curves of HBV DNA or HBV DNA and HBeAg in predicting SHA in the HBeAg-positive cohorts and of HBsAg in predicting SHA in the HBeAg-negative cohorts, respectively. ROC curve was used to evaluate the performance of HBsAg, HBeAg, and HBV DNA in predicting SHA in the HBeAg-positive cohorts and their sub-cohorts and of HBsAg and HBV DNA in predicting SHA in the HBeAg-negative cohorts and their sub-cohorts. Dependent-sample Hanley and McNeil non-parametric test was used to compare the differences in areas under the ROC curve (AUCs) between HBsAg, HBeAg, and HBV DNA in predicting SHA. p < 0.05 was considered statistically significant.
Results
Demographic, laboratory, and pathological characteristics of study subjects
The demographic, laboratory, and pathological data in the HBeAg-positive cohorts and their sub-cohorts, and the HBeAg-negative cohorts and their sub-cohorts, are summarized in Table 1. The bases and criteria for dividing the HBeAg-positive sub-cohorts and the HBeAg-negative sub-cohorts are described in section ‘Designation of hepatitis B e antigen-positive and hepatitis B e antigen-negative sub-cohorts’.
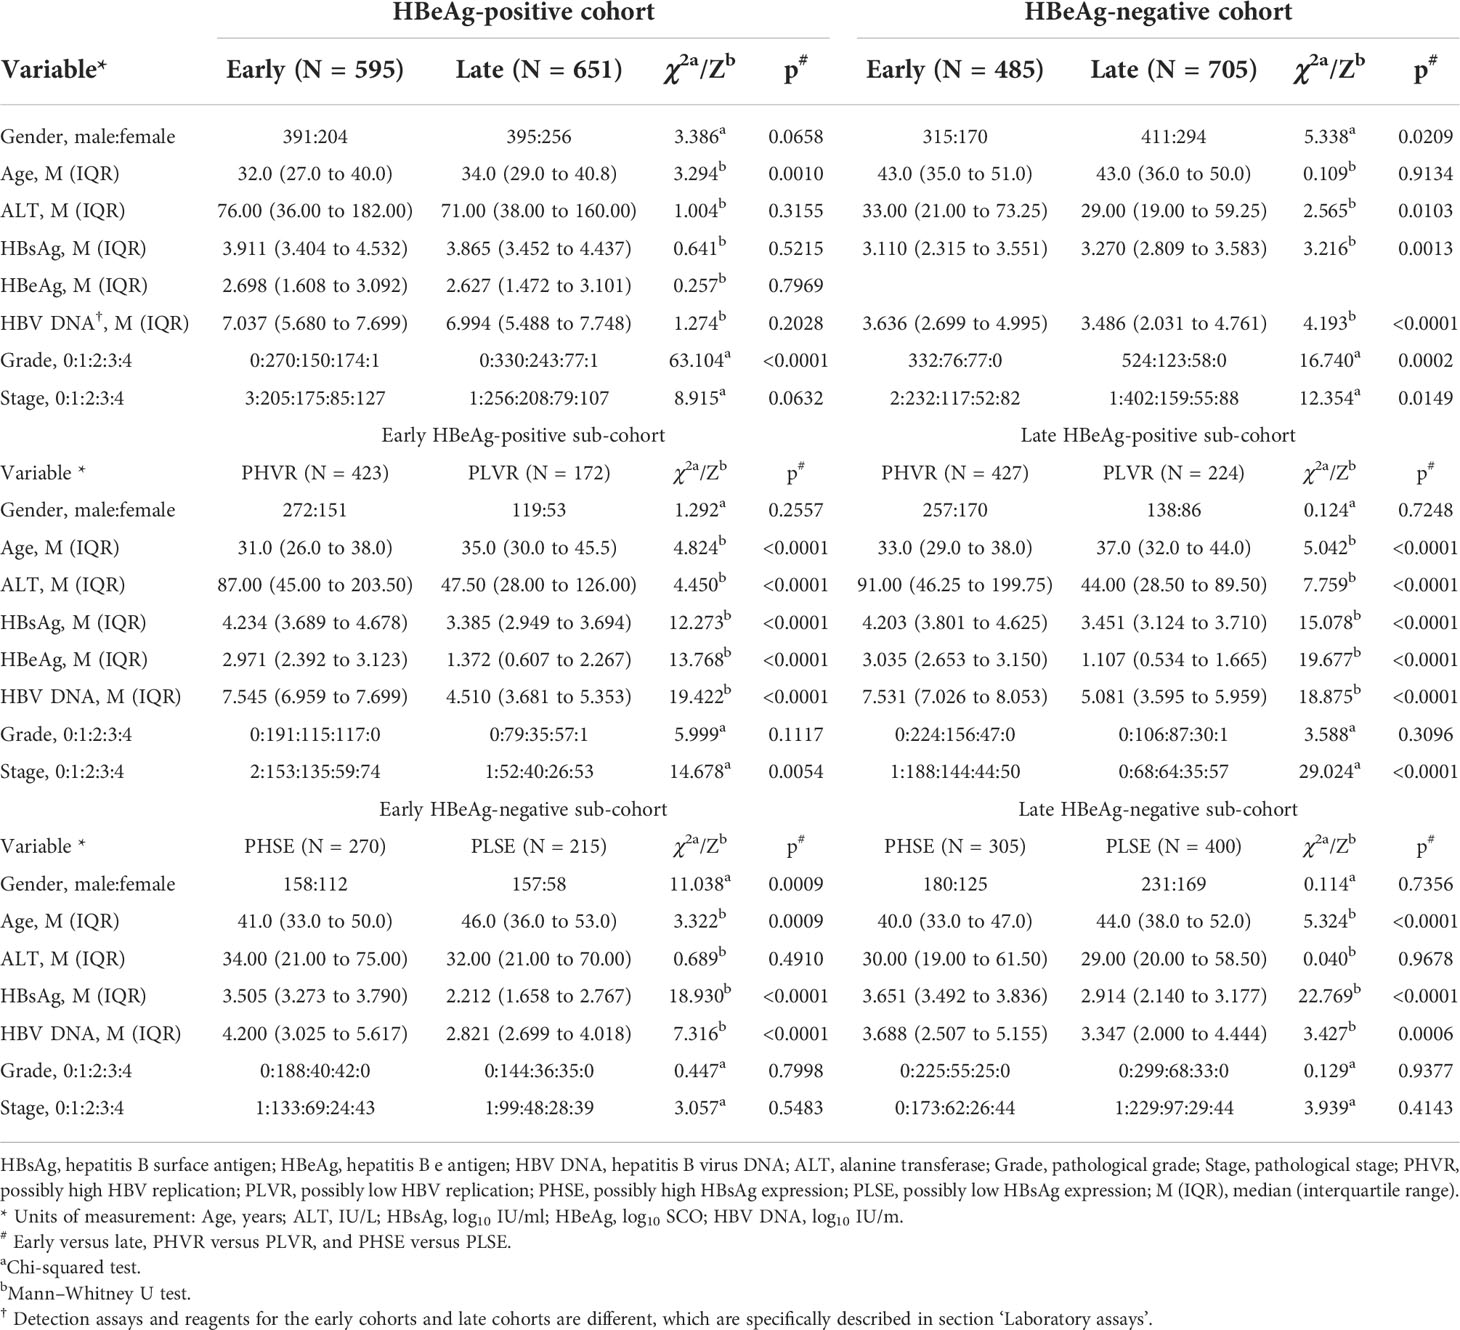
Table 1 Demographic, laboratory, and pathological characteristics of study subjects.
Correlation between hepatitis B surface antigen, hepatitis B e antigen, and hepatitis B virus DNA and alanine transferase, Grade, and Stage
The scatter plots and LOESS regression curves between ALT and HBsAg, HBeAg, and HBV DNA in the HBeAg-positive cohorts, and between ALT and HBsAg, and HBV DNA in the HBeAg-negative cohorts are displayed in Figure 1.
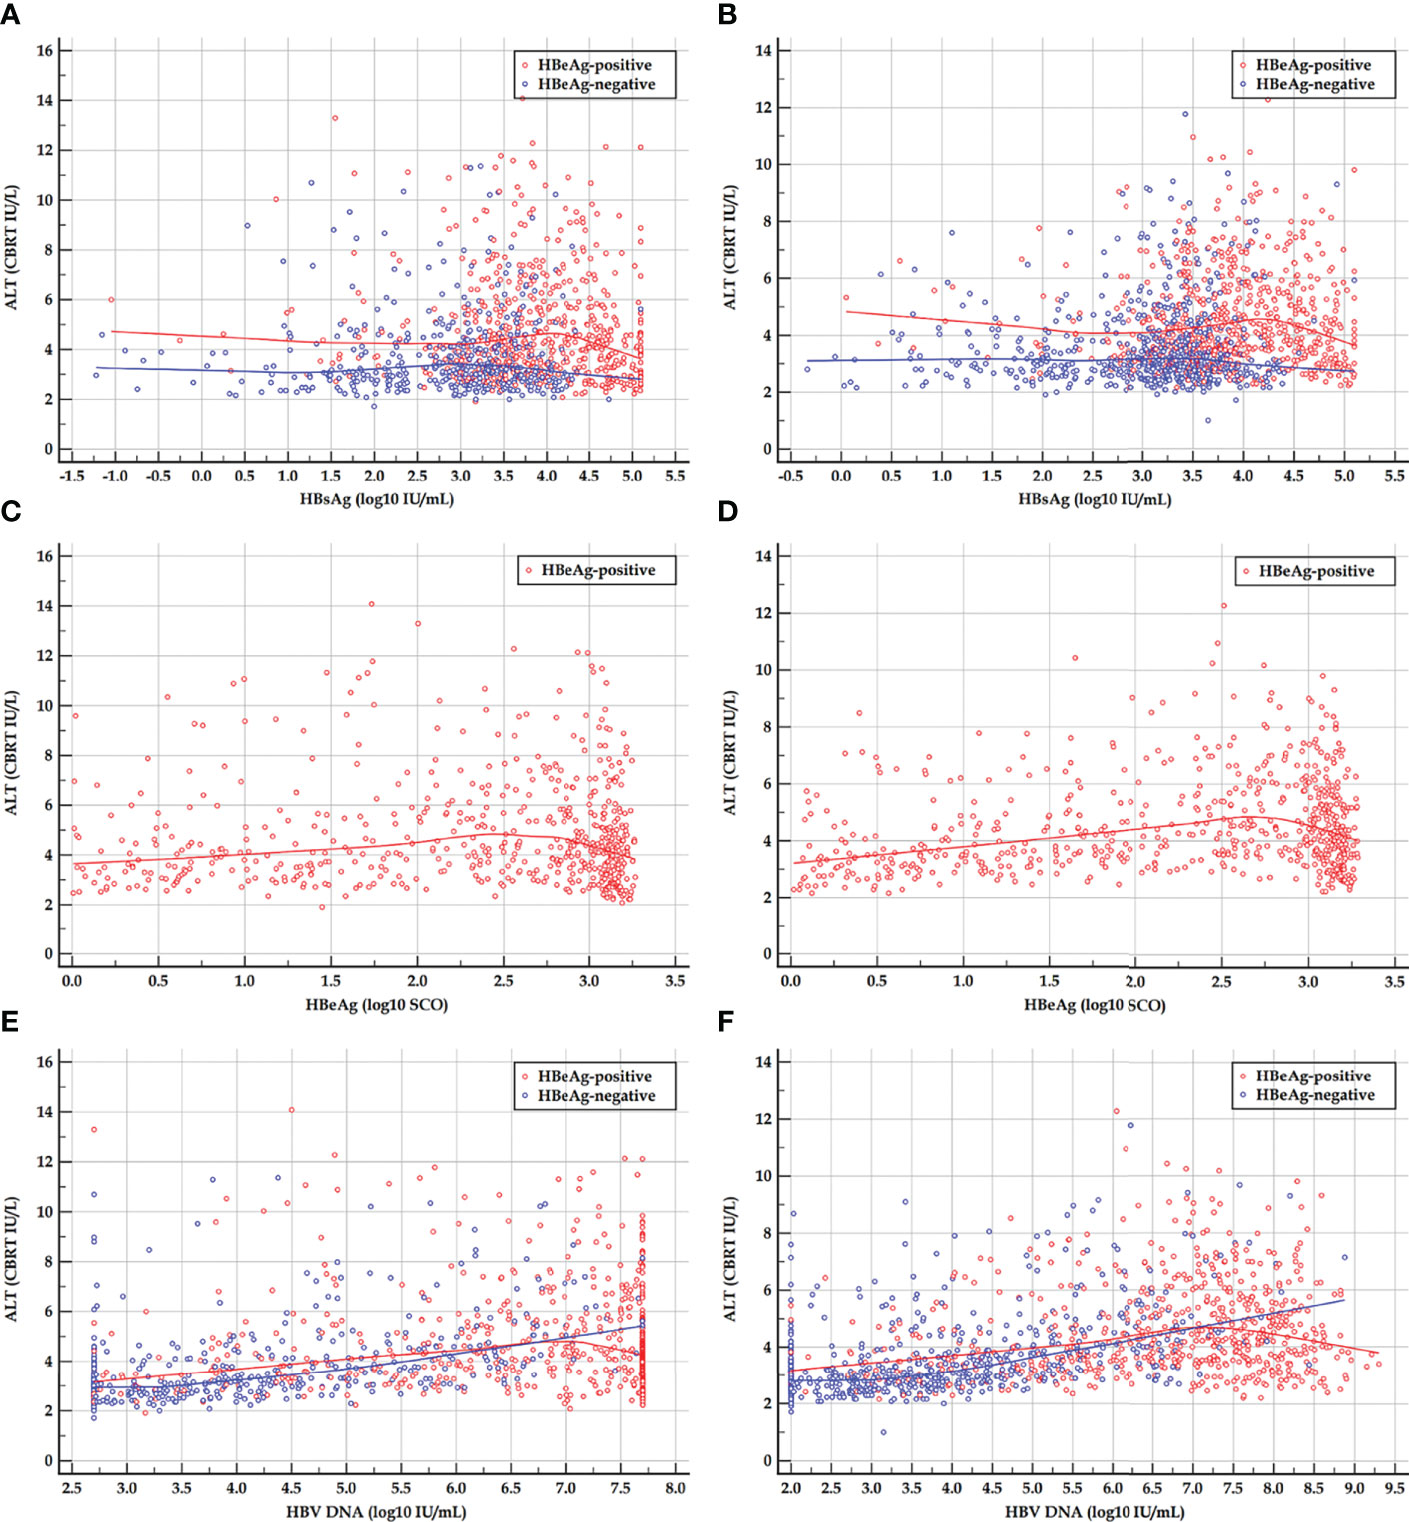
Figure 1 Scatter plots and LOESS regression curves between ALT and HBsAg, HBeAg, and HBV DNA in HBeAg-positive and HBeAg-negative cohorts. (A, C, E) Early HBeAg-positive and HBeAg-negative cohorts. (B, D, F) Late HBeAg-positive and HBeAg-negative cohorts. LOESS, locally estimated scatter plot smoothing; ALT, alanine transferase; HBsAg, hepatitis B surface antigen; HBeAg, hepatitis B e antigen; HBV DNA, hepatitis B virus DNA; CBRT, cubic root; log10, logarithm with base 10. The red and blue curves are LOESS regression trend lines in HBeAg-positive and HBeAg-negative cohorts. The degree of smoothing is controlled by a span of 60%.
Spearman’s correlation coefficients between HBsAg, HBeAg, and HBV DNA and ALT, Grade, and Stage in the HBeAg-positive cohorts and their sub-cohorts, and between HBsAg, and HBV DNA and ALT, Grade, and Stage in the HBeAg-negative cohorts and their sub-cohorts are summarized in Table 2. The bases and criteria for dividing the HBeAg-positive sub-cohorts and the HBeAg-negative sub-cohorts are described in section ‘Designation of hepatitis B e antigen-positive and hepatitis B e antigen-negative sub-cohorts’.
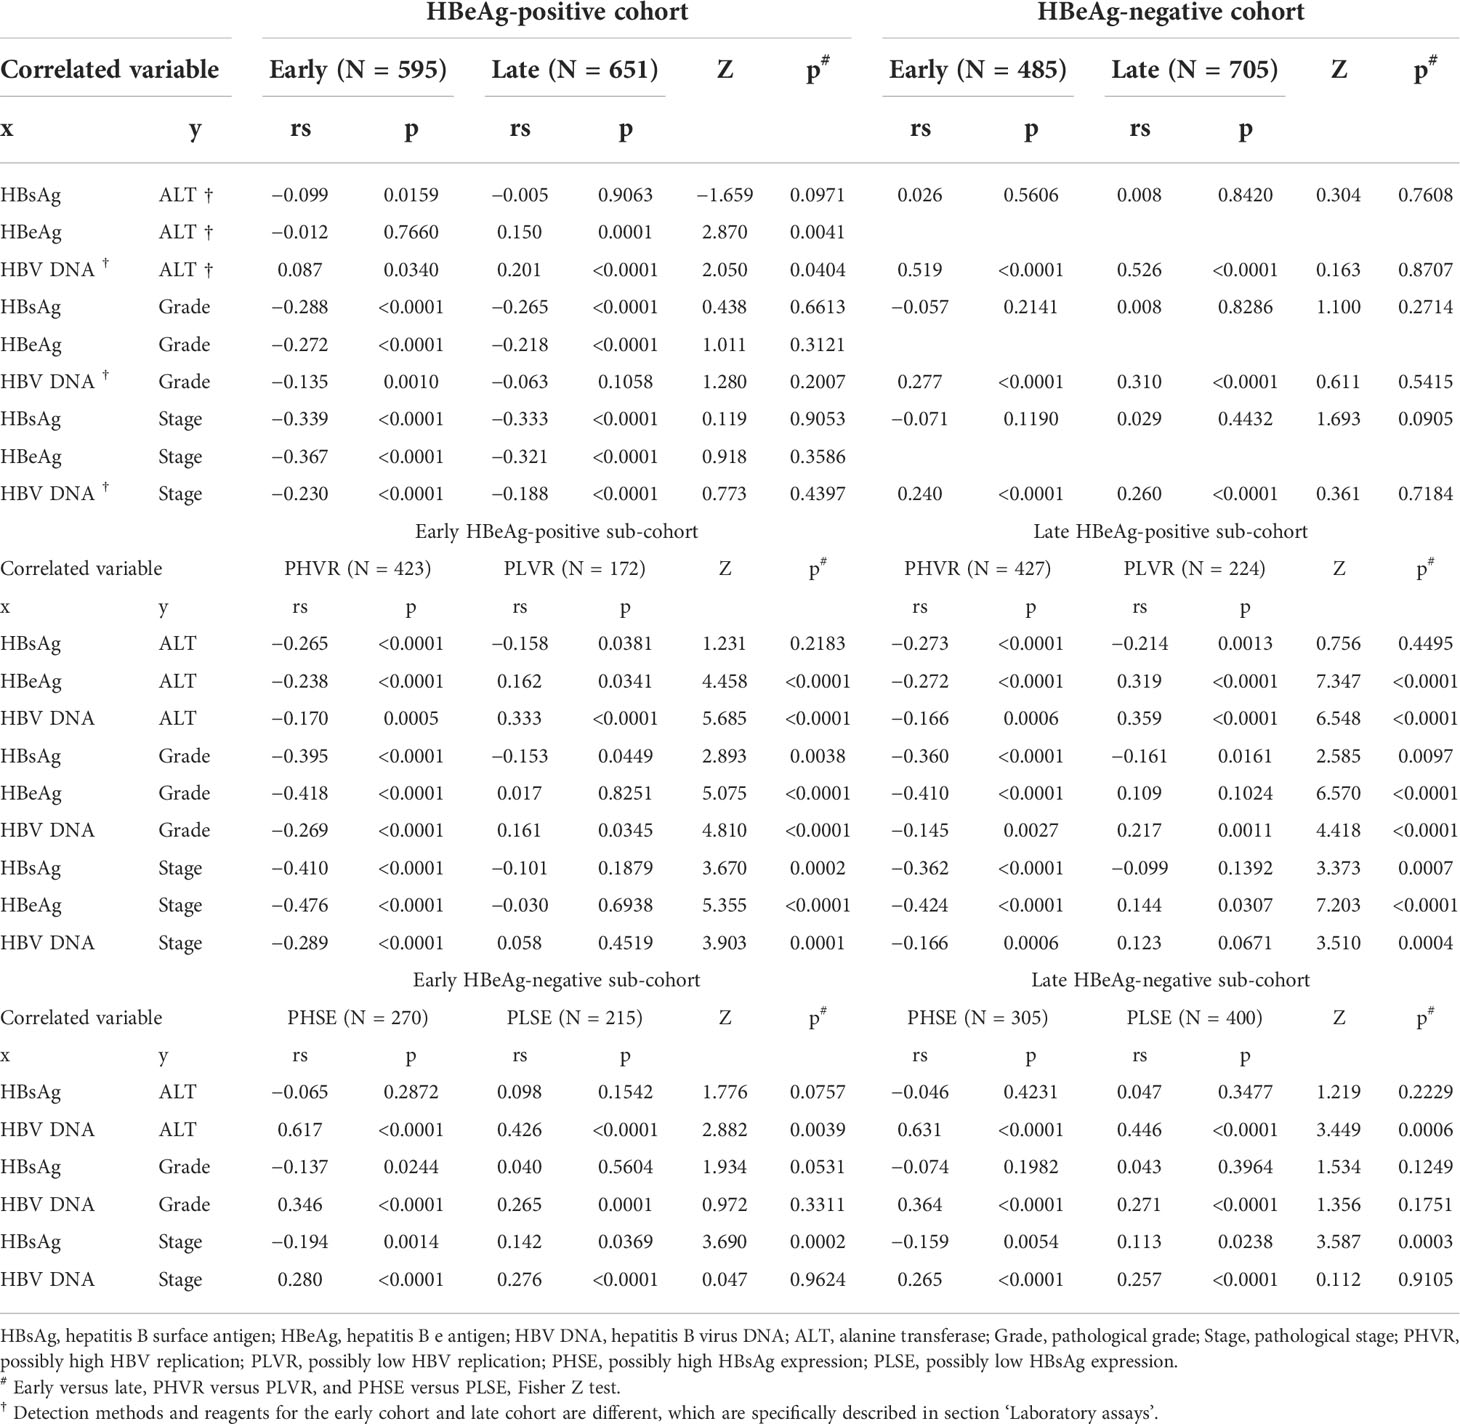
Table 2 Spearman’s correlation coefficients between HBsAg, HBeAg, and HBV DNA and ALT, Grade, and Stage.
Designation of hepatitis B e antigen-positive and hepatitis B e antigen-negative sub-cohorts
The ROC curves of HBsAg, HBeAg, and HBV DNA in predicting SHA in the HBeAg-positive cohorts are displayed in Figures 2A, D, and HBsAg and HBV DNA in predicting SHA in the HBeAg-negative cohorts are displayed in Figures 2G, J.
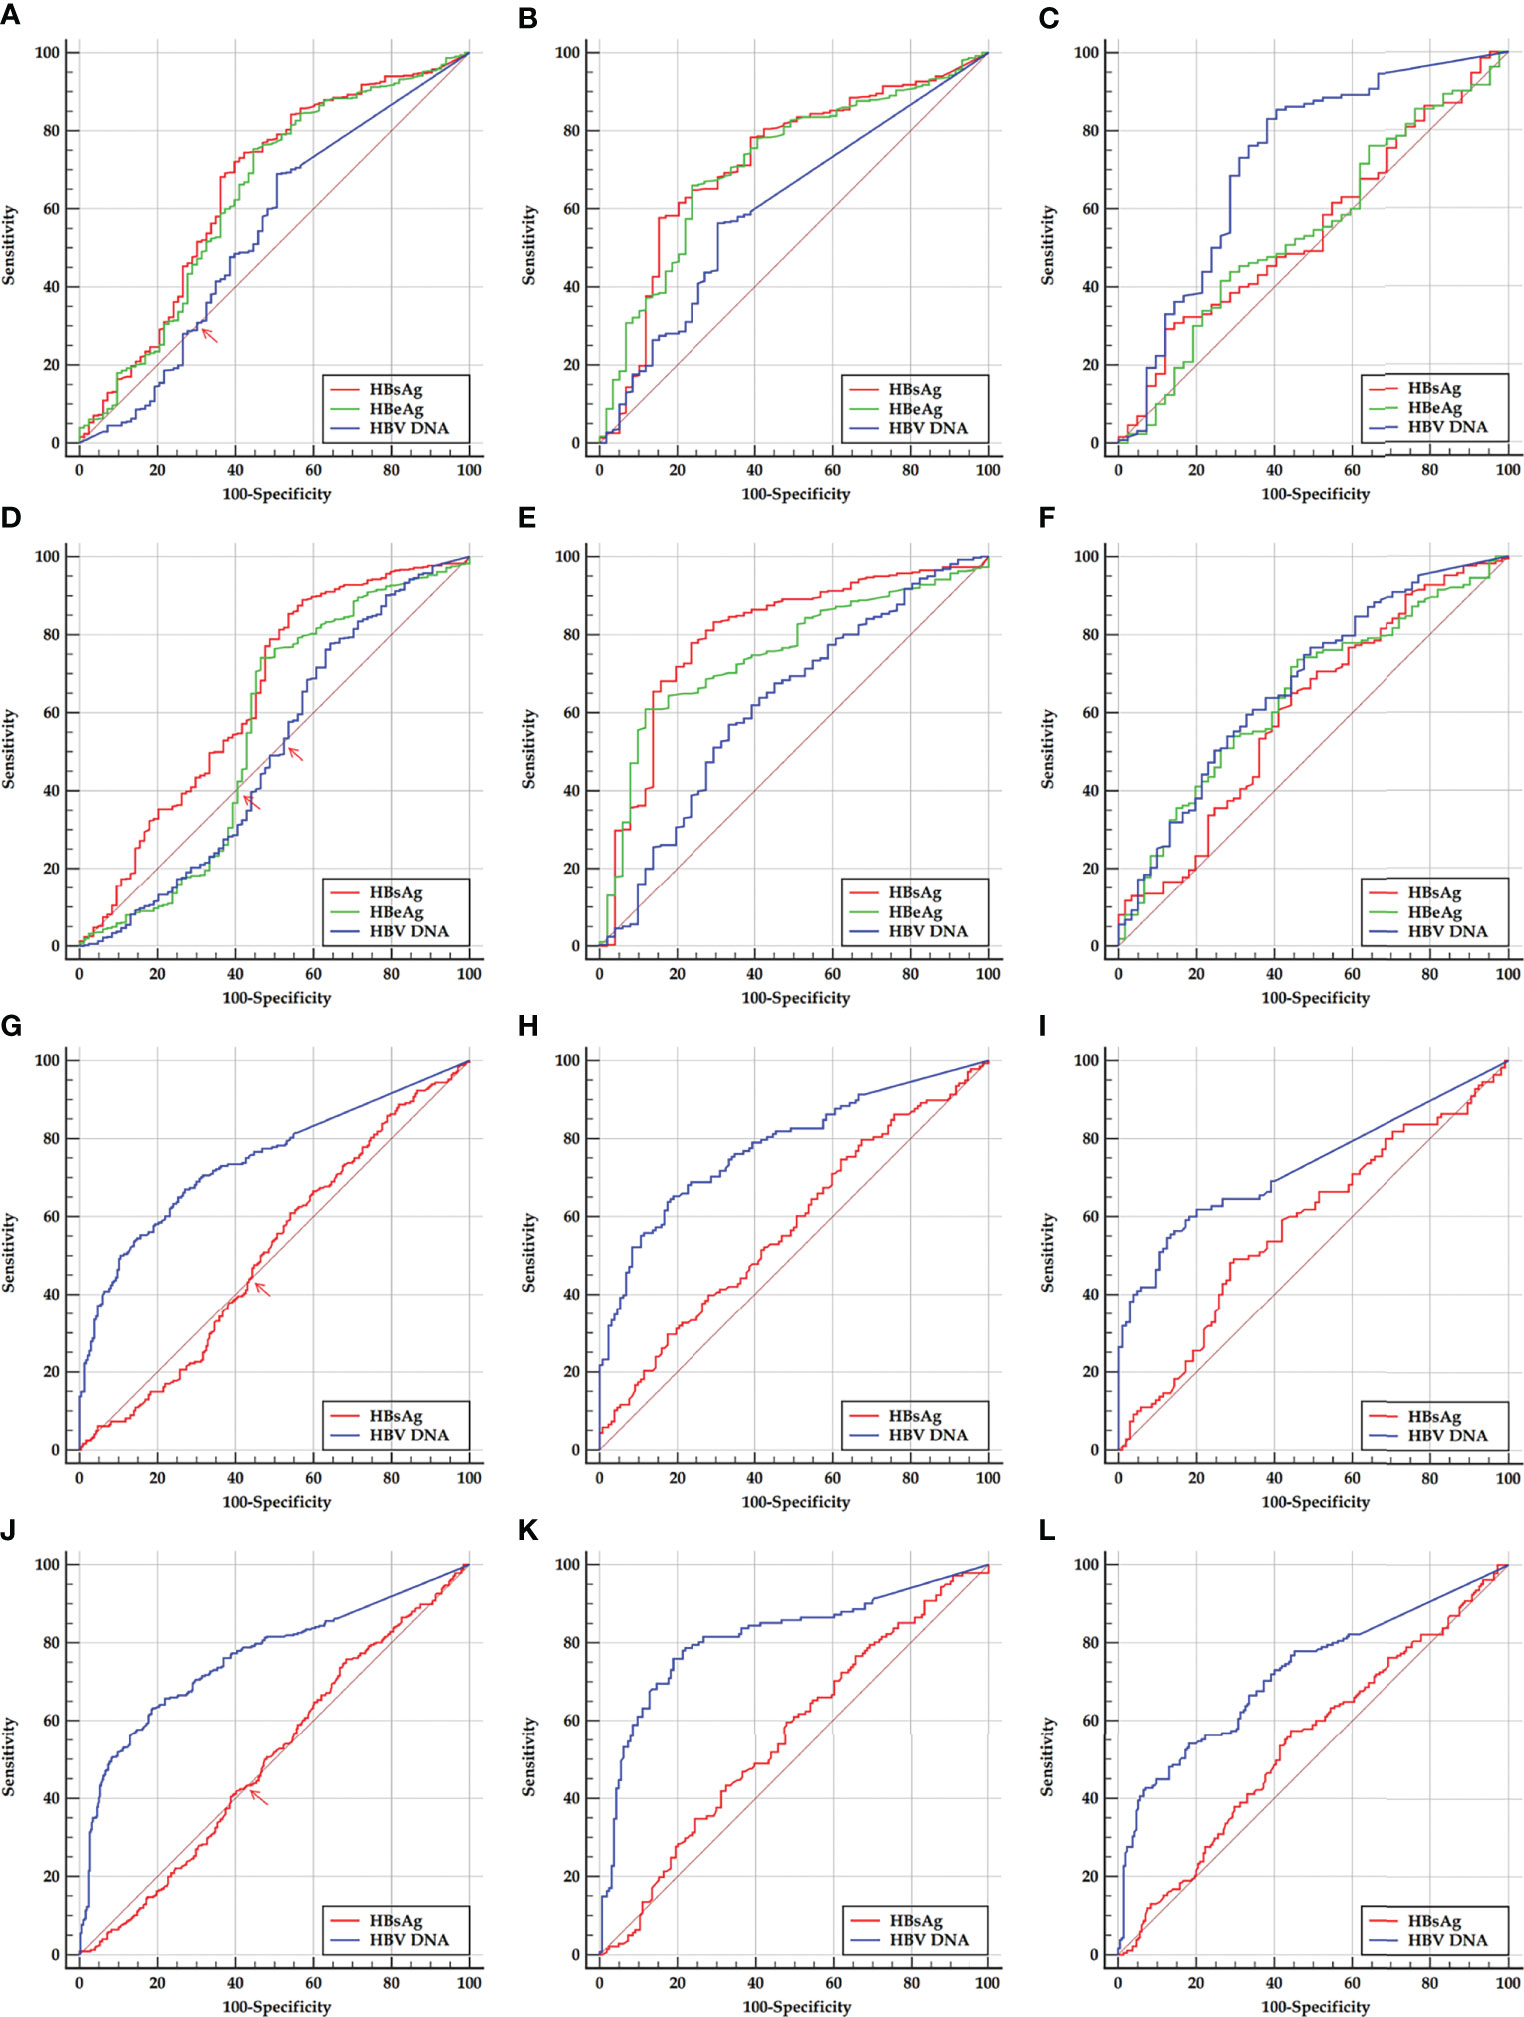
Figure 2 ROC curves of HBsAg, HBeAg, and HBV DNA in predicting SHA in HBeAg-positive and HBeAg-negative cohorts and their sub-cohorts. (A, D) Early and late HBeAg-positive cohorts. (B, E) Early and late HBeAg-positive sub-cohorts with PHVR. (C, F) Early and late HBeAg-positive sub-cohorts with PLVR. (G, J) Early and late HBeAg-negative cohort. (H, K) Early and late HBeAg-negative sub-cohorts with PHSE. (I, L) Early and late HBeAg-negative sub-cohorts with PLSE. ROC, receiver operating characteristic; HBsAg, hepatitis B surface antigen; HBeAg, hepatitis B e antigen; HBV DNA, hepatitis B virus DNA; PHVR, possibly high HBV replication; PLVR, possibly low HBV replication; PHSE, possibly high HBsAg expression; PLSE, possibly low HBsAg expression.
Among ROC curves of HBsAg, HBeAg, and HBV DNA in predicting SHA in the early HBeAg-positive cohort, the ROC curve of only HBV DNA displayed a ‘biphasic shape’; in the late HBeAg-positive cohort, the ROC curves of both HBeAg and HBV DNA displayed a ‘biphasic shape’. Among ROC curves of HBsAg and HBV DNA in predicting SHA in both the early and late HBeAg-negative cohorts, the ROC curves of HBsAg displayed a ‘biphasic shape’. A ‘biphasic shape’ ROC curve behaves as an ‘S-shape’ rather than a ‘C-shape’ curve (blue curve in Figure 2A, green and blue curves in Figure 2D, and red curves in Figures 2G, J).
Based on a criterion value for HBV DNA and HBeAg, and HBsAg, which depends on the sensitivity and specificity corresponding to an inflection point where the ‘S-shaped’ ROC curve intersects the diagonal reference line (red arrows in Figures 2A, D, G, J), a division point of HBV DNA and HBeAg, and HBsAg was determined, respectively, for dividing the possibly high and possibly low levels of HBV DNA and a division point of HBeAg in an HBeAg-positive cohort and the possibly high and possibly low levels of HBsAg in an HBeAg-negative cohort. The possibly high and possibly low levels of HBV DNA and HBeAg in the HBeAg-positive cohorts were used to designate PHVR and PLVR, respectively; the possibly high and possibly low levels of HBsAg in the HBeAg-negative cohorts were used to designate PHSE and PLSE, respectively.
In this study, HBV DNA >5.859 log10 IU/ml and HBV DNA ≤5.859 log10 IU/ml in the early HBeAg-positive cohort were designated as PHVR and PLVR, respectively; ‘HBV DNA >6.846 log10 IU/ml or HBeAg >2.333 log10 SCO’ and ‘HBV DNA ≤6.846 log10 IU/ml and HBeAg ≤2.333 log10 SCO’ in the late HBeAg-positive cohort were designated as PHVR and PLVR, respectively; HBsAg >3.033 log10 IU/ml and HBsAg ≤3.033 log10 IU/ml in the early HBeAg-negative cohort were designated as PHSE and PLSE, respectively; HBsAg >3.361 log10 IU/ml and HBsAg ≤3.361 log10 IU/ml in the late HBeAg-negative cohort were designated as PHSE and PLSE, respectively.
Accuracy of hepatitis B surface antigen, hepatitis B e antigen, and hepatitis B virus DNA in predicting significant hepatitis activity
The ROC curves of HBsAg, HBeAg, and HBV DNA in predicting SHA in the HBeAg-positive cohorts and their sub-cohorts, and of HBsAg and HBV DNA in predicting SHA in the HBeAg-negative cohorts and their sub-cohorts are displayed in Figure 2; the corresponding AUCs are summarized in Table 3.
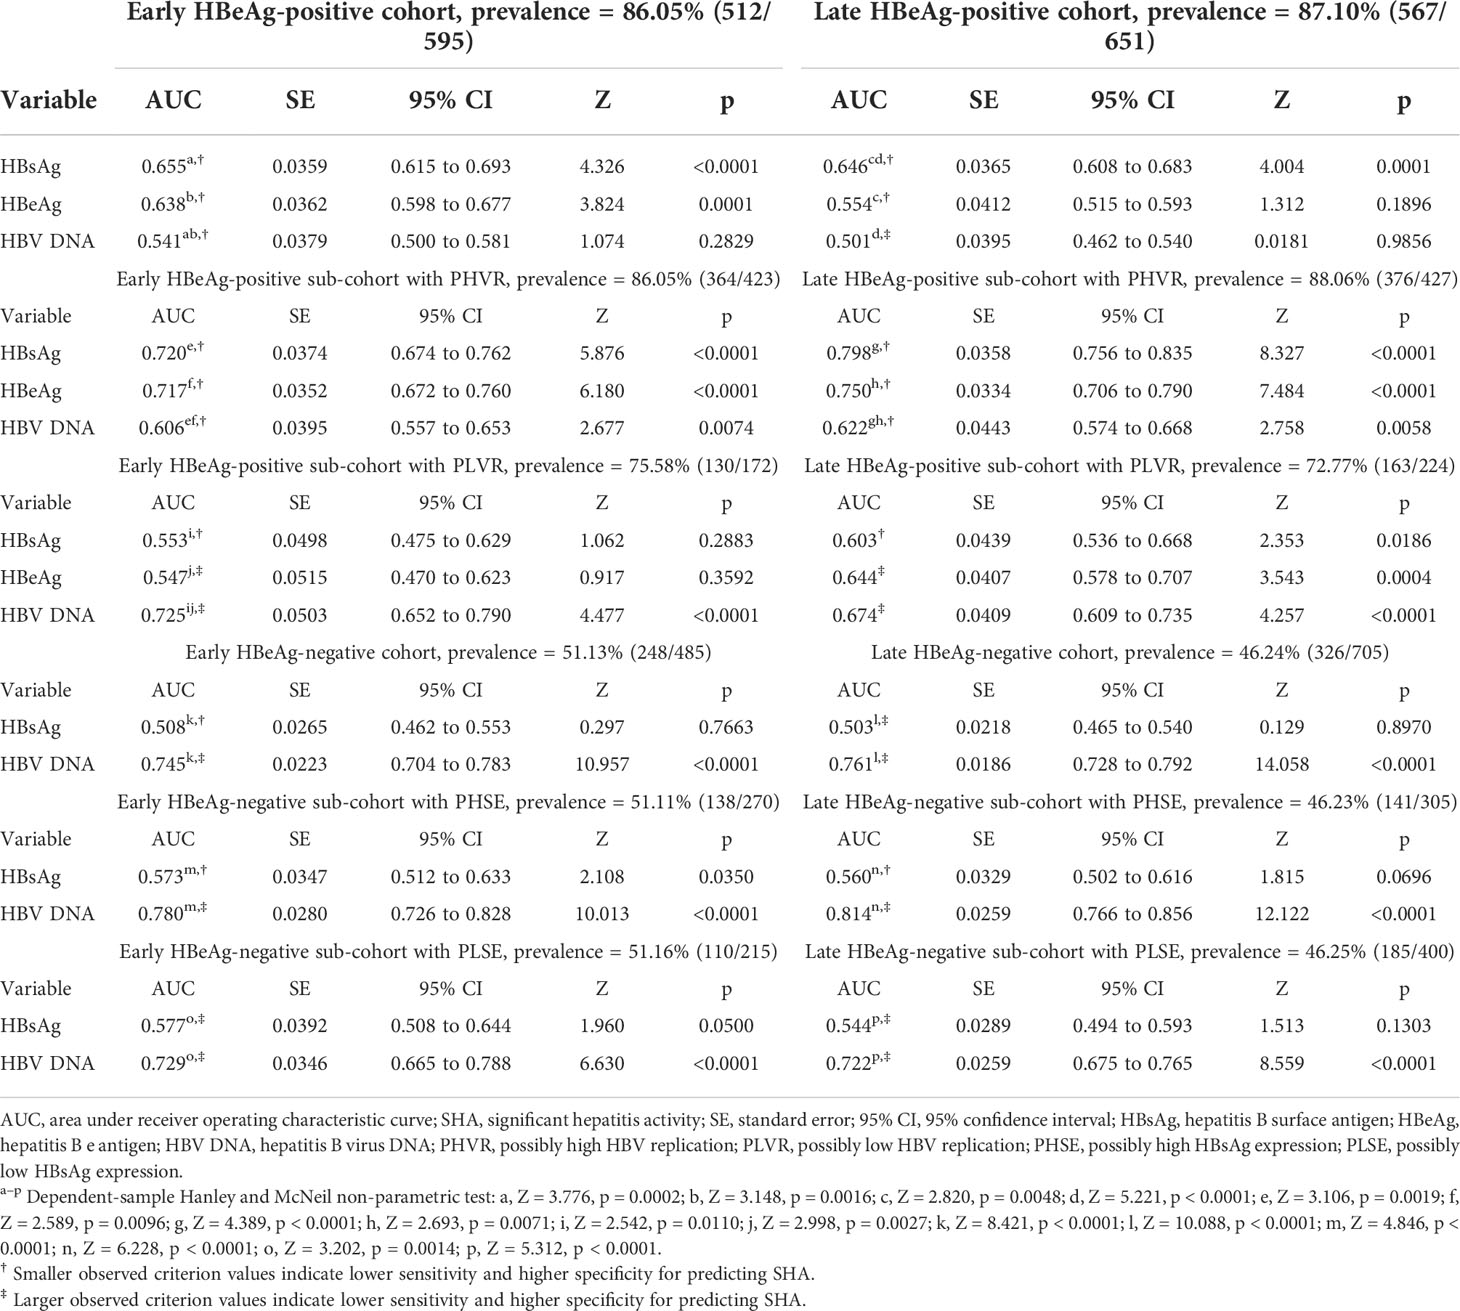
Table 3 AUCs of HBsAg, HBeAg, and HBV DNA in predicting SHA.
An optimal cutoff and a tradeoff cutoff were determined, respectively, based on the maximum sum (or Youden’s index) and minimum difference between specificity and sensitivity. With reference to one with the highest sensitivity in the optimal cutoff and tradeoff cutoff, a practical cutoff was chosen, which is easy to remember and the sensitivity of which is close to and higher than the highest sensitivity of the optimal cutoff and tradeoff cutoff. The optimal cutoffs, tradeoff cutoffs, practical cutoffs, and corresponding diagnostic parameters are summarized in Table 4.
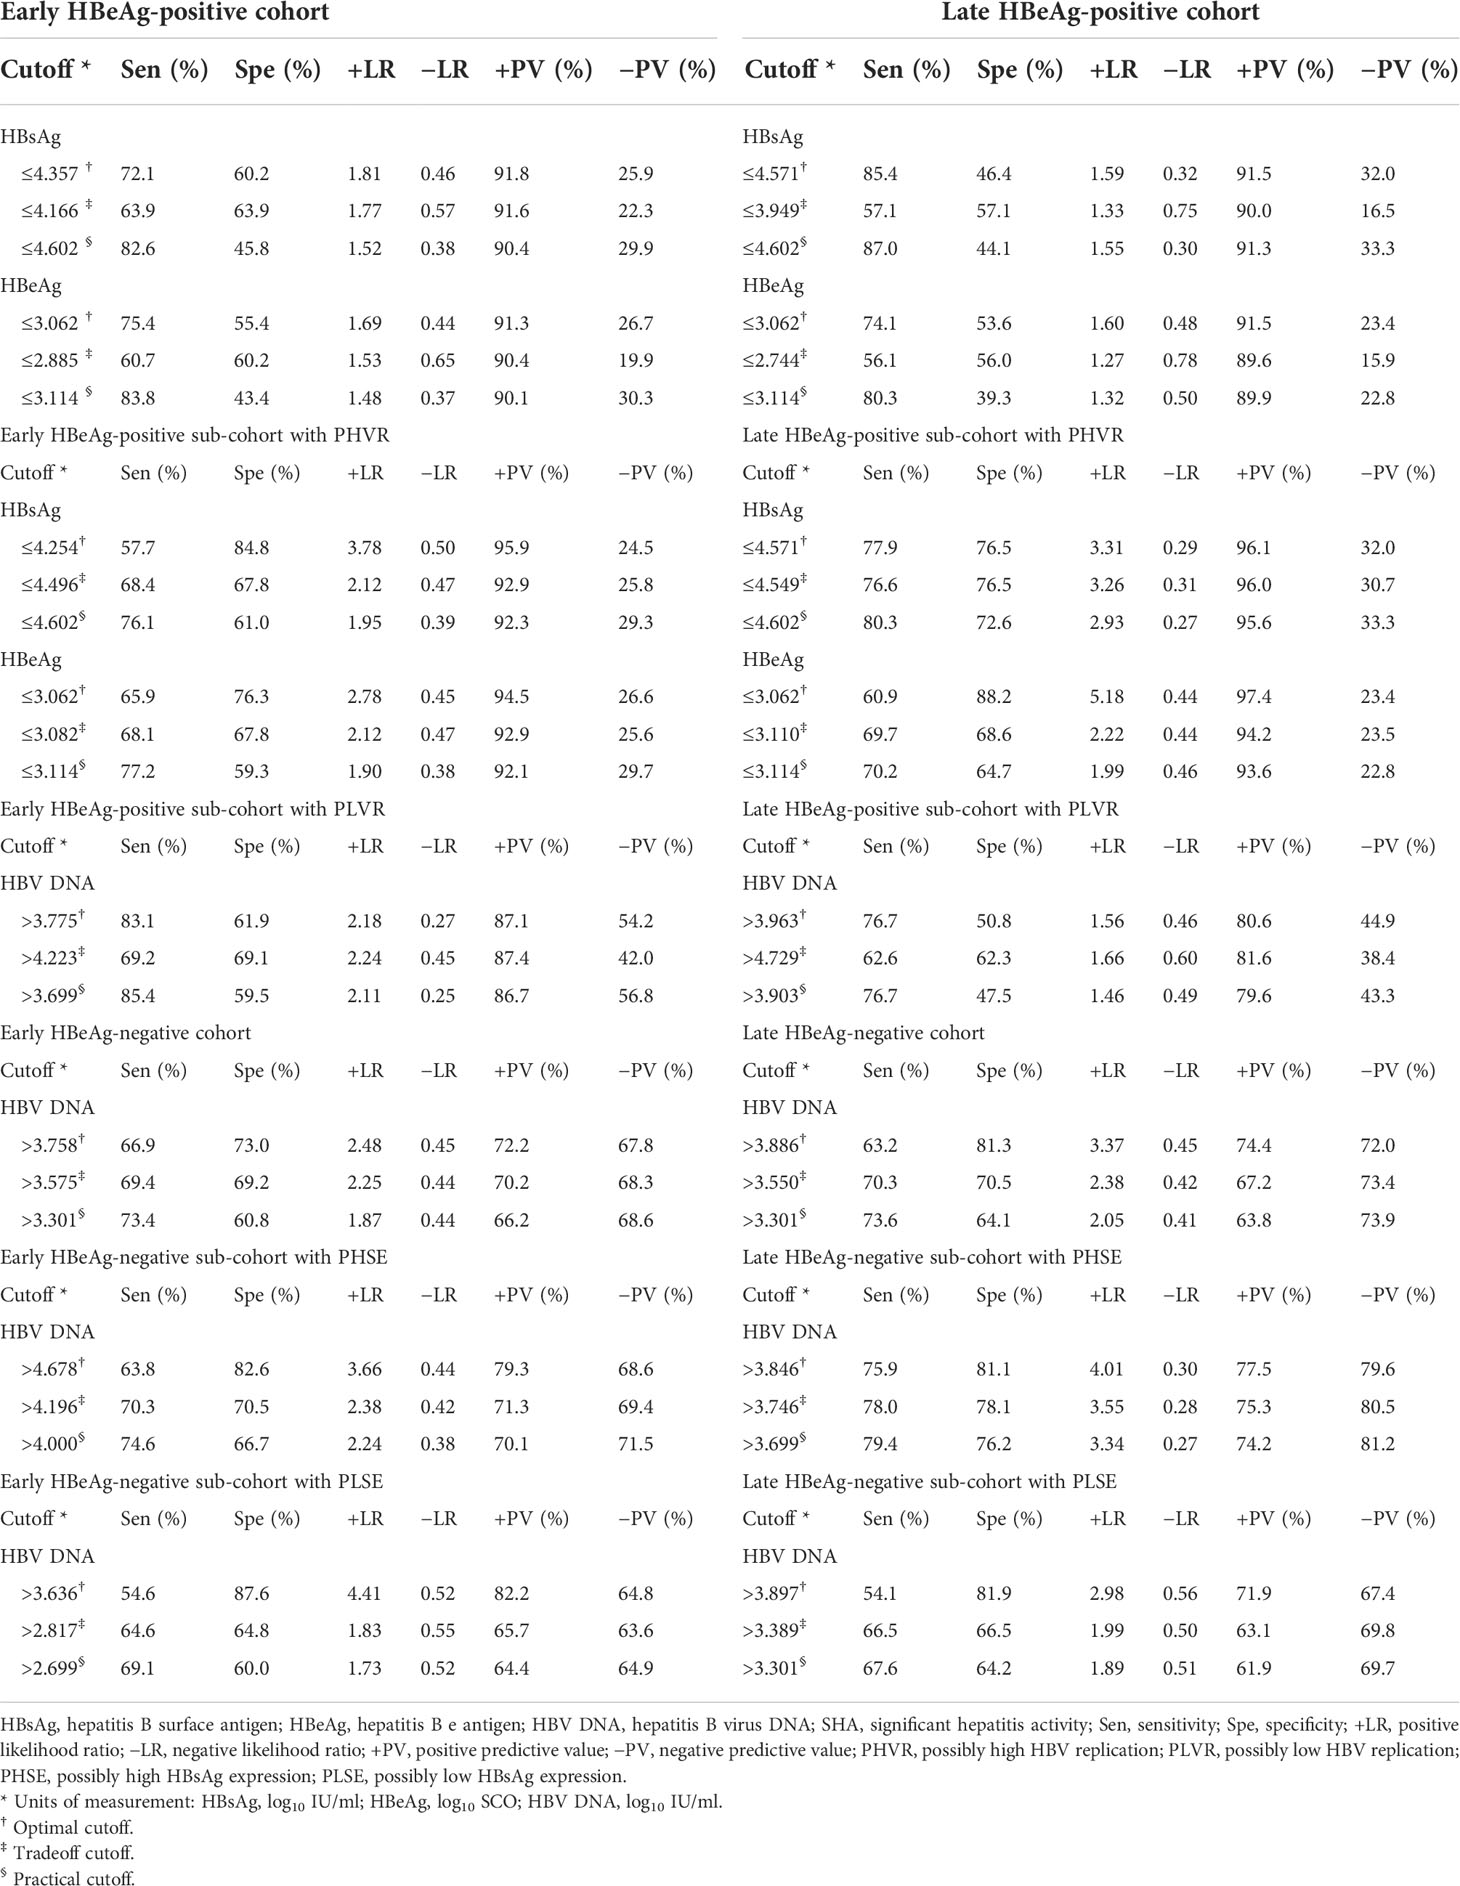
Table 4 Cutoffs and corresponding diagnostic parameters of HBsAg, HBeAg, and HBV DNA in predicting SHA.
Precision of hepatitis B surface antigen, hepatitis B e antigen, and hepatitis B virus DNA in predicting liver pathological conditions
With criteria of the practical cutoffs, the proportion of HBsAg, HBeAg, and HBV DNA alone and in tandem with ALT <40 IU/L in predicting liver pathological conditions in the HBeAg-positive and HBeAg-negative cohorts is summarized in Table 5.
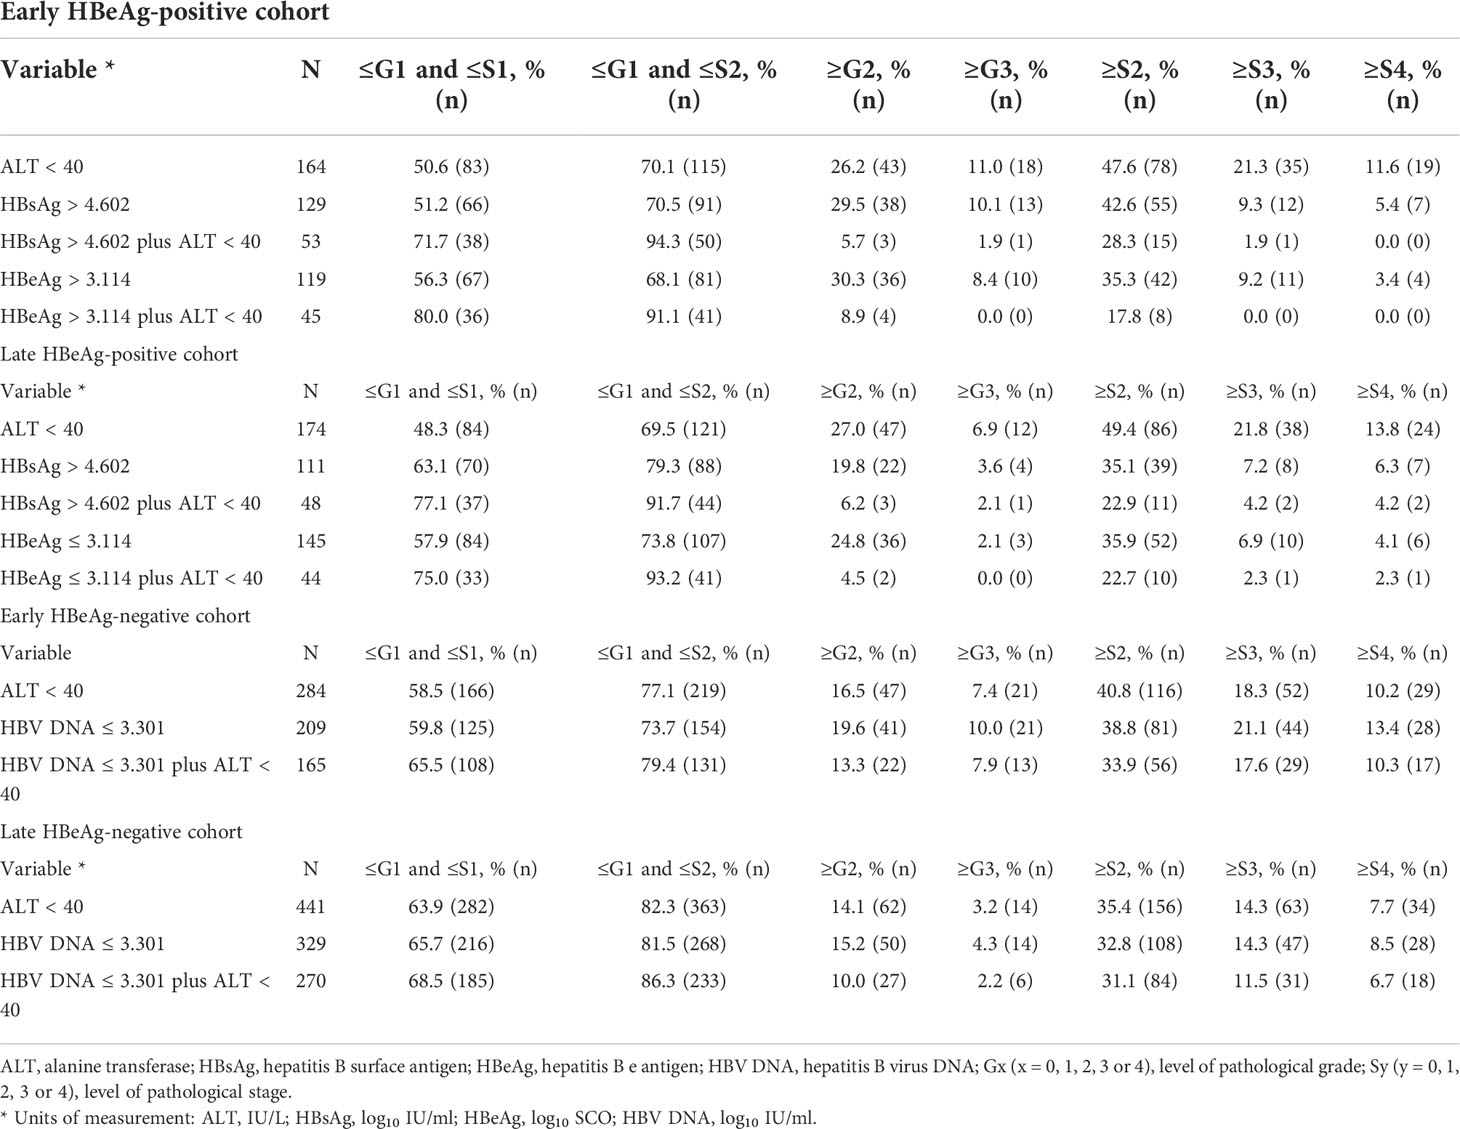
Table 5 Proportion of HBsAg, HBeAg, and HBV DNA alone and in tandem with ALT in predicting pathological conditions.
Discussion
Each phase of the natural history does not yet have a rational denomination (30). The first phase of the natural history has always been considered an immune tolerance, but this designation has been challenged in recent years (21–33). Patients in the ‘immune tolerance’ phase are rarely free of liver necro-inflammation (26, 31). Therefore, this study refers to the four natural history phases from a clinical perspective as HBeAg-positive NSHA and SHA and HBeAg-negative NSHA and SHA.
Accurate delimitation of the natural history phases remains a clinical challenge (3–6, 26, 34). As a sensitive indicator, ALT does not necessarily reflect liver injury that has occurred; conversely, as specific indicators, Grade and Stage do not necessarily reflect liver injury that is occurring. In the absence of evidence of liver pathology, relying only on high levels of HBV DNA and normal levels of ALT, even with a fixed period of regular follow-up, cannot rule out the possibility of NSHA in HBeAg-positive patients. In fact, the oscillations between adjacent phases are often missed during regular follow-up, especially between HBeAg-positive NSHA and SHA. In addition, the division point between high and non-high levels of HBV DNA in delimiting HBeAg-positive NSHA and SHA remains controversial (3–6); the upper limit of normal reference for ALT is also continuously debated and updated (35), although ALT <40 IU/L is generally considered normal. Therefore, the accurate delimitation of the natural history phases requires the development and evaluation of new laboratory indicators.
The LOESS regression analyses in the HBeAg-positive and HBeAg-negative cohorts showed evolving correlations between ALT and HBsAg, HBeAg, and HBV DNA. In the HBeAg-positive cohorts, ALT displayed clearly negative correlations with high levels of HBsAg, HBeAg, and HBV DNA but illustrated possibly divergent correlations with moderate-to-low levels of HBsAg, HBeAg, and HBV DNA. In the HBeAg-negative cohorts, ALT illustrated clearly divergent correlations with HBsAg and HBV DNA. Spearman’s correlation analyses in the HBeAg-positive and HBeAg-negative sub-cohorts showed similar findings to the LOESS regressions. In addition, in the HBeAg-positive sub-cohorts with PHVR, HBsAg, HBeAg, and HBV DNA produced significantly negative correlations with Grade and Stage; however, in sub-cohorts with PLVR, ALT produced divergent correlations with Grade and Stage. In the HBeAg-negative sub-cohorts with PHSE, HBsAg and HBV DNA indicated significantly negative and positive correlations with Grade and Stage, respectively; however, in sub-cohorts with PLSE, they indicated significant positive correlations with Stage.
The findings from the LOESS regression and Spearman’s correlation analyses suggested that HBsAg, HBeAg, and HBV DNA have divergent signatures in the evolution of the natural history, which indirectly supported some inferences proposed by some experimental studies (19–21). HBsAg may dampen the host’s immune activation in a concentration–response relationship; high levels of HBeAg may synergize with HBsAg to dampen the immune activation, and medium-to-low levels of HBeAg may sharpen the immune activation; HBV replication not only dampens the immune activation by increasing HBsAg and HBeAg production but also sharpens the immune activation by increasing HBcrAg production including HBeAg. These findings also suggested that the evolution of the natural history results primarily from the age-related progressive decline in HBV replication levels and the progressive decline in HBsAg and HBeAg production (31). In this study, the patients in the HBeAg-positive sub-cohorts with PHVR were significantly younger and had significantly higher HBsAg and HBeAg levels than those with PLVR, and in the HBeAg-negative sub-cohorts with PHSE, the patients were also significantly younger and had significantly higher HBV DNA levels than those with PLSE.
The ROC curve analyses of this study showed that, in predicting SHA in the HBeAg-positive sub-cohorts with PHVR and PLVR, HBsAg was moderately accurate and ‘less accurate or uninformative’ in the same test directions, respectively; HBeAg was moderately accurate and ‘less accurate or uninformative’ in the opposite test directions, respectively; HBV DNA was less accurate and ‘moderately or less accurate’ in the opposite test directions, respectively. In predicting SHA in the HBeAg-negative sub-cohorts with PHSE and PLSE, HBsAg was ‘less accurate or uninformative’ and uninformative in the opposite test directions, respectively; HBV DNA was moderately accurate and moderately accurate in the same test directions, respectively. In predicting SHA in the early and late HBeAg-positive cohorts, their HBsAg was less accurate in the same test directions; in the early and late HBeAg-negative cohorts, their HBV DNA was moderately accurate in the same test directions.
The findings from the ROC curve analyses suggested that the ability of HBsAg to dampen immune activation remains dominant and gradually weakens from HBeAg-positive PHVR and PLVR to HBeAg-negative PHSE and may be lost in HBeAg-negative PLSE; the ability of HBeAg to dampen immune activation remains dominant only in patients with HBeAg-positive PHVR and reverses in PLVR. These findings also suggested that HBsAg instead of HBV DNA in predicting HBeAg-positive SHA and HBV DNA instead of HBsAg in predicting HBeAg-negative SHA are valuable. However, the power of HBsAg in predicting HBeAg-positive and HBV DNA in predicting HBeAg-negative SHA is not strong enough, which needs to be made up in tandem with other non-invasive laboratory parameters. Therefore, this study proposed practical cutoffs for HBsAg, HBeAg, and HBV DNA that gave priority to sensitivity.
With criteria of the practical cutoffs, this study further evaluated the precision of HBsAg, HBeAg, and HBV DNA alone and in tandem with ALT in predicting liver pathological conditions. The results showed that in the HBeAg-positive cohorts, HBsAg or HBeAg in tandem with ALT was excellent in both defining HBeAg-positive ‘minimal necro-inflammation and non-extensive fibrosis (Grade ≤G1 and Stage ≤S2) and excluding HBeAg-positive extensive fibrosis (Stage ≥S3) and cirrhosis (Stage ≥S4); however, in the HBeAg-negative cohorts, HBV DNA in tandem with ALT was good in both defining HBeAg-negative ‘minimal necro-inflammation and non-extensive fibrosis’ and excluding HBeAg-negative extensive fibrosis and cirrhosis. These findings suggested that HBsAg or HBeAg in tandem with ALT is very useful and has a very low clinical risk in defining HBeAg-positive NSHA and SHA; however, HBV DNA in tandem with ALT is merely usable and has a very high clinical risk in defining HBeAg-negative NSHA and SHA (26, 34).
This study has some limitations. First, it used a cross-sectional design; however, it is impractical and unethical to regularly follow up patients with liver pathology data for a fixed short period of time. Second, it did not address other novel HBV markers; however, it is a real-world study with large-scale samples and evaluated in detail the usability of HBsAg and HBV DNA, which are currently accessible HBV markers. Third, it involved only adult patients; its conclusions may not necessarily apply to pediatric patients.
In summary, this study discovered for the first time that the ROC curves of HBV DNA or HBV DNA and HBeAg in predicting SHA in the entire HBeAg-positive cohorts and those of HBsAg in predicting SHA in the entire HBeAg-negative cohorts behave as a ‘biphasic shape’. On this basis, this study designated the HBeAg-positive sub-cohorts with PHVR and PLVR, and HBeAg-negative sub-cohorts with PHSE and PLSE; it proved for the first time the usability of HBsAg instead of HBV DNA in delimiting HBeAg-positive NSHA and SHA and of HBV DNA instead of HBsAg in delimiting HBeAg-negative NSHA and SHA.
Data availability statement
The original contributions presented in the study are included in the article/supplementary material. Further inquiries can be directed to the corresponding author.
Ethics statement
The studies involving human participants were reviewed and approved by ethics committee of Shanghai Public Health Clinical Center. Written informed consent to participate in this study was provided by the participants’ legal guardian/next of kin.
Author contributions
ZZ was a involved in study concept and design, securing research funding, acquisition of data, analysis and interpretation of data, and drafting of the manuscript. WL and DH were involved in the collation of clinical, laboratory, and pathological data. WL, DH, XZ, RD, XL, YW, and WJL were involved in the acquisition of clinical and laboratory data. DZ and YF were involved in the acquisition of pathological data. WL and DH were involved in the critical revision of the manuscript. All authors have read and agreed to the published version of the manuscript.
Funding
This work was partly funded by the ‘12th Five-year’ and the ‘13th Five-year’ National Science and Technology Major Project of China (2013ZX10002005, 2017ZX10203202).
Conflict of interest
The authors declare that the research was conducted in the absence of any commercial or financial relationships that could be construed as a potential conflict of interest.
The reviewer JG declared a shared parent affiliation with authors to the handling editor at the time of review.
Publisher’s note
All claims expressed in this article are solely those of the authors and do not necessarily represent those of their affiliated organizations, or those of the publisher, the editors and the reviewers. Any product that may be evaluated in this article, or claim that may be made by its manufacturer, is not guaranteed or endorsed by the publisher.
References
1. Likhitsup A, Lok AS. Understanding the natural history of hepatitis b virus infection and the new definitions of cure and the endpoints of clinical trials. Clin Liver Dis (2019) 23(3):401–16. doi: 10.1016/j.cld.2019.04.002
2. Ghany MG, Feld JJ, Chang KM, Chan HLY, Lok ASF, Visvanathan K, et al. Serum alanine aminotransferase flares in chronic hepatitis b infection: the good and the bad. Lancet Gastroenterol Hepatol (2020) 5(4):406–17. doi: 10.1016/S2468-1253(19)30344-9
3. Sarin SK, Kumar M, Lau GK, Abbas Z, Chan HLY, Chen CJ, et al. Asian-Pacific clinical practice guidelines on the management of hepatitis b: A 2015 update. Hepatol Int (2016) 10(1):1–98. doi: 10.1007/s12072-015-9675-4
4. Lampertico P, Agarwal K, Berg T, Buti M, Janssen HLA, Papatheodoridis G, et al. EASL 2017 clinical practice guidelines on the management of hepatitis b virus infection. J Hepatol (2017) 67(2):370–98. doi: 10.1016/j.jhep.2017.03.021
5. Terrault NA, Lok ASF, McMahon BJ, Chang KM, Hwang JP, Jonas MM, et al. Update on prevention, diagnosis and treatment of chronic hepatitis b: AASLD 2018 hepatitis b guidance. Hepatology (2018) 67(4):1560–99. doi: 10.1002/hep.29800
6. Wang G, Duan Z. Guidelines for prevention and treatment of chronic hepatitis b. J Clin Transl Hepatol (2021) 9(5):769–91. doi: 10.14218/JCTH.2021.00209
7. Vachon A, Osiowy C. Novel biomarkers of hepatitis b virus and their use in chronic hepatitis b patient management. Viruses (2021) 13(6):951. doi: 10.3390/v13060951
8. Nguyen T, Thompson AJ, Bowden S, Croagh C, Bell S, Desmond PV, et al. Hepatitis b surface antigen levels during the natural history of chronic hepatitis b: A perspective on Asia. J Hepatol (2010) 52(4):508–13. doi: 10.1016/j.jhep.2010.01.007
9. Jaroszewicz J, Calle Serrano B, Wursthorn K, Deterding K, Schlue J, Raupach R, et al. Hepatitis b surface antigen (HBsAg) levels in the natural history of hepatitis b virus (HBV)-infection: A European perspective. J Hepatol (2010) 52(4):514–22. doi: 10.1016/j.jhep.2010.01.014
10. Jang JW, Yoo SH, Kwon JH, You CR, Lee S, Lee JH, et al. Serum hepatitis b surface antigen levels in the natural history of chronic hepatitis b infection. Aliment Pharmacol Ther (2011) 34(11-12):1337–46. doi: 10.1111/j.1365-2036.2011.04888.x
11. Tan Z, Li M, Kuang X, Tang Y, Fan Y, Deng G, et al. Clinical implications of hepatitis b surface antigen quantitation in the natural history of chronic hepatitis b virus infection. J Clin Virol (2014) 59(4):228–34. doi: 10.1016/j.jcv.2014.01.013
12. Zeng LY, Lian JS, Chen JY, Jia HY, Zhang YM, Xiang DR, et al. Hepatitis b surface antigen levels during natural history of chronic hepatitis b: a Chinese perspective study. World J Gastroenterol (2014) 20(27):9178–84. doi: 10.3748/wjg.v20.i27.9178
13. Suh SJ, Bae SI, Kim JH, Kang K, Yeon JE, Byun KS. Clinical implications of the titer of serum hepatitis b surface antigen during the natural history of hepatitis b virus infection. J Med Virol (2014) 86(1):117–23. doi: 10.1002/jmv.23767
14. Seto WK, Wong DK, Fung J, Huang FY, Liu KS, Lai CL, et al. Linearized hepatitis b surface antigen and hepatitis b core-related antigen in the natural history of chronic hepatitis b. Clin Microbiol Infect (2014) 20(11):1173–80. doi: 10.1111/1469-0691.12739
15. Zhang ZQ, Wang YB, Lu W, Liu DP, Shi BS, Zhang XN, et al. Performance of hepatitis b core-related antigen versus hepatitis b surface antigen and hepatitis b virus DNA in predicting HBeAg-positive and HBeAg-negative chronic hepatitis. Ann Lab Med (2019) 39(1):67–75. doi: 10.3343/alm.2019.39.1.67
16. Erken R, Loukachov V, van Dort K, van den Hurk A, Takkenberg RB, de Niet A, et al. Quantified integrated hepatitis b virus is related to viral activity in patients with chronic hepatitis b. Hepatology (2022) 76(1):196–206. doi: 10.1002/hep.32352
17. Meier MA, Calabrese D, Suslov A, Terracciano LM, Heim MH, Wieland S. Ubiquitous expression of HBsAg from integrated HBV DNA in patients with low viral load. J Hepatol (2021) 75(4):840–7. doi: 10.1016/j.jhep.2021.04.051
18. Pollicino T, Caminiti G. HBV-integration studies in the clinic: role in the natural history of infection. Viruses (2021) 13(3):368. doi: 10.3390/v13030368
19. Van Damme E, Vanhove J, Severyn B, Verschueren L, Pauwels F. The hepatitis b virus interactome: A comprehensive overview. Front Microbiol (2021) 12:724877. doi: 10.3389/fmicb.2021.724877
20. Khanam A, Chua JV, Kottilil S. Immunopathology of chronic hepatitis b infection: role of innate and adaptive immune response in disease progression. Int J Mol Sci (2021) 22(11):5497. doi: 10.3390/ijms22115497
21. Iannacone M, Guidotti LG. Immunobiology and pathogenesis of hepatitis b virus infection. Nat Rev Immunol (2022) 22(1):19–32. doi: 10.1038/s41577-021-00549-4
22. Lok AS, Heathcote EJ, Hoofnagle JH. Management of hepatitis b: 2000–summary of a workshop. Gastroenterology (2001) 120(7):1828–53. doi: 10.1053/gast.2001.24839
23. Hadziyannis SJ, Vassilopoulos D. Hepatitis b e antigen-negative chronic hepatitis b. Hepatology (2001) 34(4Pt1):617–24. doi: 10.1053/jhep.2001.27834
24. Hadziyannis SJ, Papatheodoridis GV. Hepatitis b e antigen-negative chronic hepatitis b: natural history and treatment. Semin Liver Dis (2006) 26(2):130–41. doi: 10.1055/s-2006-939751
25. Hoofnagle JH, Doo E, Liang TJ, Fleischer R, Lok AS. Management of hepatitis b: summary of a clinical research workshop. Hepatology (2007) 45(4):1056–75. doi: 10.1002/hep.21627
26. Zhang Z, Lu W, Zeng D, Huang D, Lin W, Yan L, et al. Quantitative HBsAg versus HBV DNA in predicting significant hepatitis activity of HBeAg-positive chronic HBV infection. J Clin Med (2021) 10(23):5617. doi: 10.3390/jcm10235617
27. Zhang ZQ, Lu W, Wang YB, Weng QC, Zhang ZY, Yang ZQ, et al. Quantitative serum HBV markers in predicting phases of natural history of chronic HBV infection. J Virol Methods (2021) 296:114226. doi: 10.1016/j.jviromet.2021.114226
28. Zhang ZQ, Shi BS, Lu W, Liu DP, Huang D, Feng YL. Quantitative HBcrAg and HBcAb versus HBsAg and HBV DNA in predicting liver fibrosis levels of chronic hepatitis b patients. Gastroenterol Hepatol (2020) 43(9):526–36. doi: 10.1016/j.gastrohep.2020.03.017
29. Goodman ZD. Grading and staging systems for inflammation and fibrosis in chronic liver diseases. J Hepatol (2007) 47(4):598–607. doi: 10.1016/j.jhep.2007.07.006
30. Indolfi G, Easterbrook P, Dusheiko G, Siberry G, Chang MH, Thorne C, et al. Hepatitis b virus infection in children and adolescents. Lancet Gastroenterol Hepatol (2019) 4(6):466–76. doi: 10.1016/S2468-1253(19)30042-1
31. Mason WS, Gill US, Litwin S, Zhou Y, Peri S, Pop O, et al. HBV DNA integration and clonal hepatocyte expansion in chronic hepatitis b patients considered immune tolerant. Gastroenterology (2016) 151(5):986–998e4. doi: 10.1053/j.gastro.2016.07.012
32. Seto WK, Yuen MF. Viral hepatitis: ‘Immune tolerance’ in HBV infection: Danger lurks. Nat Rev Gastroenterol Hepatol (2016) 13(11):627–8. doi: 10.1038/nrgastro.2016.145
33. Kennedy PTF, Litwin S, Dolman GE, Bertoletti A, Mason WS. Immune tolerant chronic hepatitis b: The unrecognized risks. Viruses (2017) 9(5):96. doi: 10.3390/v9050096
34. Koffas A, Kumar M, Gill US, Jindal A, Kennedy PTF, Sarin SK. Chronic hepatitis b: the demise of the 'inactive carrier' phase. Hepatol Int (2021) 15(2):290–300. doi: 10.1007/s12072-021-10137-2
Keywords: hepatitis B surface antigen, chronic HBV infection, natural history, immune tolerance, locally estimated scatter plot smoothing regression, stratified analysis
Citation: Zhang Z, Lu W, Huang D, Zhou X, Ding R, Li X, Wang Y, Lin W, Zeng D and Feng Y (2022) Capabilities of hepatitis B surface antigen are divergent from hepatitis B virus DNA in delimiting natural history phases of chronic hepatitis B virus infection. Front. Immunol. 13:944097. doi: 10.3389/fimmu.2022.944097
Received: 17 May 2022; Accepted: 29 June 2022;
Published: 25 July 2022.
Edited by:
Yong Liu, Nanjing Drum Tower Hospital, ChinaReviewed by:
Jie Wang, Health Science Centre, Peking University, ChinaJunling Gao, Fudan University, China
Copyright © 2022 Zhang, Lu, Huang, Zhou, Ding, Li, Wang, Lin, Zeng and Feng. This is an open-access article distributed under the terms of the Creative Commons Attribution License (CC BY). The use, distribution or reproduction in other forums is permitted, provided the original author(s) and the copyright owner(s) are credited and that the original publication in this journal is cited, in accordance with accepted academic practice. No use, distribution or reproduction is permitted which does not comply with these terms.
*Correspondence: Zhanqing Zhang, doctorzzqsphc@163.com
†These authors have contributed equally to this work