
95% of researchers rate our articles as excellent or good
Learn more about the work of our research integrity team to safeguard the quality of each article we publish.
Find out more
ORIGINAL RESEARCH article
Front. Immunol. , 20 September 2022
Sec. Systems Immunology
Volume 13 - 2022 | https://doi.org/10.3389/fimmu.2022.940779
This article is part of the Research Topic Role of Hypoxia-Inducible Factors in Metabolic Immune Cell Adaptation during Sepsis View all 6 articles
 Wen Lei1,2,3†
 Zhiyao Ren3,4,5,6†
 Jun Su3,7†Xinglong Zheng3,8†Lijuan Gao1,2,3Yudai Xu1,2,3
 Jieping Deng1,2,3
 Chanchan Xiao1,2,3Shuai Sheng3Yu Cheng1,2Tianshun Ma1,2Yu Liu3
 Pengcheng Wang1,2,3
 Oscar Junhong Luo3,4*
 Guobing Chen1,2,3,7*
 Zhigang Wang3,8*
Background: A major challenge in intervention of critical patients, especially sepsis-associated delirium (SAD) intervention, is the lack of predictive risk factors. As sepsis and SAD are heavily entangled with inflammatory and immunological processes, to identify the risk factors of SAD and mortality in the intensive care unit (ICU) and determine the underlying molecular mechanisms, the peripheral immune profiles of patients in the ICU were characterized.
Methods: This study contains a cohort of 52 critical patients who were admitted to the ICU of the First Affiliated Hospital of Jinan University. Comorbidity, including sepsis and SAD, of this cohort was diagnosed and recorded. Furthermore, peripheral blood samples were collected on days 1, 3, and 5 of admission for peripheral immune profiling with blood routine examination, flow cytometry, ELISA, RNA-seq, and qPCR.
Results: The patients with SAD had higher mortality during ICU admission and within 28 days of discharge. Compared with survivors, nonsurvivors had higher neutrophilic granulocyte percentage, higher CRP concentration, lower monocyte count, lower monocyte percentage, lower C3 complement level, higher CD14loCD16+ monocytes percentage, and higher levels of IL-6 and TNFα. The CD14hiCD16- monocyte percentage manifested favorable prediction values for the occurrence of SAD. Differentially expressed genes between the nonsurvival and survival groups were mainly associated with immune response and metabolism process. The longitudinal expression pattern of SLC2A1 and STIMATE were different between nonsurvivors and survivors, which were validated by qPCR.
Conclusions: Nonsurvival critical patients have a distinct immune profile when compared with survival patients. CD14hiCD16- monocyte prevalence and expression levels of SLC2A1 and STIMATE may be predictors of SAD and 28-day mortality in ICU patients.
The intensive care unit (ICU) admits heterogeneous patients with life-threatening conditions, leading to high mortality. To reduce the mortality rate in the ICU, it is important to identify and predict the course of death, which may also be critical for the diagnosis, intervention, and prognosis of patients. Risk stratification predictive factors can provide useful information for physicians and help improve clinical decision making. Existing risk stratification methods based on commonly measured clinical and physiologic parameters have played important roles in risk prediction and prognostication of patients in the ICU (1).
Sepsis, one of the leading causes of death in the ICU, is a complex clinical syndrome resulting from a systemic, dysregulated inflammatory response to uncontrolled infections (2). Many ICU patients with sepsis also develop neurological defects, known as sepsis-associated encephalopathy (SAE), including delirium, as part of multiple organ failure. Delirium is the main early symptom of SAE, which is also known as acute encephalopathy syndrome (3). It is difficult to control sepsis-associated delirium (SAD) once it emerges; therefore, it is important to make an early diagnosis and start treatment. Effective auxiliary indicators or predictive factors are needed to aid the early diagnosis of SAD and to ultimately prevent death in the ICU.
Clinically, a multitude of measures have been designed to assess and screen delirium. Currently used delirium severity measures, such as the Delirium Rating Scale-Revised-98 (DRS-R-98) (4) or the Memorial Delirium Assessment Scale (MDAS) (5), provide mixed coverage of delirium signs and symptoms to psychiatrists. Moreover, multiple tools have been developed and validated to help nonpsychiatrists screen possible delirium. The Confusion Assessment Method–Intensive Care Unit (CAM-ICU) and the Intensive Care Delirium Screening Checklist (ICDSC) are the two tools that are recommended for diagnosing delirium in the ICU by the Pain, Agitation/Sedation, Delirium, Immobility, and Sleep Disruption in Adult Patients in the ICU (PADIS) guidelines (6, 7). In addition, electroencephalogram (EEG) is an adjunctive biomarker to assess for delirium, and it needs to combine with a clinical assessment for the presence of delirium symptoms (8). Thus, mastering delirium pathophysiology, understanding the association of delirium with outcomes, and further understanding delirium biomarkers and their practical use in predictive models are needed for improved delirium diagnosis and prognosis (9).
For critical patients, dysregulated immune response is one of the key factors for determining the severity of disease progression and prognosis (10–12). For instance, sepsis occurs when the body’s immune system overreacts to infection and causes damage to its own tissues and organs (13). Therefore, monitoring the state of the immune system can help clinicians to early assess the risk of death for critical patients. In addition, understanding the immunological characteristics and the underlying molecular mechanism not only aids the diagnosis but also can help in developing novel treatment methods for critical patients.
To this end, we recruited a cohort of ICU patients and used laboratory methods to characterize their peripheral immune features longitudinally in an effort to identify potential immunological factors for the early diagnosis of SAD and patient outcome prediction. We utilized immune and genetic laboratory assays from three time points after ICU admission to evaluate immunological risk factors as related to the presence of delirium and mortality in sepsis patients.
This single-center prospective and longitudinal study was conducted in a 12-bed ICU ward of the First Affiliated Hospital of Jinan University. This study was approved by the Ethics Committee at the First Affiliated Hospital of Jinan University (Guangzhou, China) (KY-2020-004). Each patient or the patient’s family member signed the informed consent form before participation. All procedures performed in studies involving human participants were in accordance with the ethical standards of the ethics committee and with the 1964 Declaration of Helsinki and its later amendments or comparable ethical standards.
Adult patients who were consecutively admitted to the ICU between July and November 2019 were enrolled. Patients meeting the following criteria were excluded: age <18 years or >85 years, stayed in ICU fewer than 3 days, traumatic brain injury, intracerebral hemorrhage, cerebral infarction, immunological diseases, malignant hematologic diseases, drug abuse, severe circulatory instability, allergic constitution, terminal state, or pregnancy. After removing the excluded patients, a total of 52 patients were retained.
The following demographic and clinical data were collected:
1. Demographic characteristics: age, gender.
2. Clinical scores: Acute Physiology and Chronic Health Evaluation (APACHE) II scores.
3. Comorbidity: coronary heart disease (CHD), chronic obstructive pulmonary disease (COPD), chronic renal failure (CRF), liver cirrhosis, hypertension, diabetes, sepsis, delirium. Sepsis was clinically diagnosed according to the Third International Consensus Definitions for Sepsis and Septic Shock (Sepsis-3) (13). Delirium was clinically diagnosed by CAM-ICU (7). All assessments were performed by the ICU physicians of the First Affiliated Hospital of Jinan University.
4. Follow-up data: death occurring within ICU was recorded, and a follow-up was conducted for all patients until 28 days after ICU discharge.
5. Clinical information was also collected: length of stay in ICU, use of mechanical ventilation, ventilation time.
On days 1, 3, and 5 after ICU admission, peripheral blood samples were collected from patients for further laboratory assessments. Blood routine examination and flow cytometry were tested for whole blood. Serum was isolated for enzyme-linked immunosorbent assay (ELISA) analysis, and PBMC cells were isolated for RNA sequencing and quantitative real-time polymerase chain reaction (qPCR) detection.
Blood routine examination (white blood cell count, neutrophil percent, lymphocyte percent, monocyte percent, eosinophil percent, neutrophil count, lymphocyte count, monocyte count, platelet count, CRP concentration, C3 concentration, C4 concentration, IgA concentration, IgG concentration, IgM concentration, κ concentration, λ concentration, and κ/λ) was performed by an automatic blood cell analyzer.
Antibodies of flow cytometry detection were from Biolegend, and NovoCyte 2060R (Agilent) was used for analysis. Identification of immune cell subsets as T lymphocytes (CD3+CD19-), B lymphocytes (CD3-CD19-), classical monocyte cell (CD3-CD19-CD14hiCD16-), intermediate monocytes (CD3-CD19-CD14hiCD16+), nonclassical monocytes (CD3-CD19-CD14loCD16+), and natural killer cell (CD3-CD19-CD14-CD16+CD56+) staining was performed with the following antibodies: CD3-FITC (UCHT1), CD19-PerCP/Cy5.5 (HIB19), CD14-PE/Cy7 (63D3), CD16-APC (3G8), and CD56-PE (MEM-188).
The serum of all blood samples was isolated and stored at -80°C. IL6, IL10, and TNF-α were determined with ELISA kits (ABclonal) following the manufacturer’s manual.
PBMCs were isolated from the blood of healthy donors using Ficoll (GE Healthcare Life Sciences) following the manufacturer’s protocol. Total RNA was isolated by a TRIzol Reagent (Invitrogen). The library preparations were sequenced on an Illumina Novaseq platform, and 150-bp paired-end reads were generated.
Differential expression analysis of the survival and nonsurvival groups was performed using the DESeq2 R package (1.30.1). Gene Ontology (GO) and Kyoto Encyclopedia of Genes and Genomes (KEGG) enrichment analysis was performed with the topGO R package (2.42.0). The DE genes clustered with k-means clustering using the z-score transformed expression levels. Gene set enrichment analysis (GSEA) was performed with the clusterProfiler R package (3.18.1). The KEGG data set (v 7.4) was used for the enrichment input of GSEA independently (http://www.gsea-msigdb.org/gsea/).
Total RNA from PBMCs was extracted with TRIzol (Life Technologies), and the first-strand cDNA was synthesized by an ABscript II cDNA First Strand Synthesis Kit (ABclonal) according to the manufacturer’s protocol. qPCR was performed using 2X Universal SYBR Green Fast qPCR Mix (ABclonal) in the CFX Connect Real-Time System (BIO-RAD).
Normally distributed continuous variables are reported using mean and SD, whereas abnormally distributed continuous variables are reported as median and interquartile range (IQR). Categorical variables use the number of observations and percentages. Factors associated with mortality were explored in univariate analysis using Student’s t-test or the Mann–Whitney U test for continuous variables and Pearson’s chi-square or Fisher’s exact test for categorical variables as appropriate. Factors associated with mortality in univariate analysis (p <.1) were entered in a multivariate regression. Five clinical indexes (age, APACH II, diabetes, sepsis, and delirium) and 11 lab analysis indexes (neutrophil percent, monocyte percent, monocyte count, CRP concentration, C3 concentration, CD14hiCD16- monocyte percent, CD14loCD16+ monocyte percent, IL6 concentration, TNFα concentration, SLC2A1, and STIMATE) were entered. These indices are summarized in Table S9. Before multivariate regression analysis, missing values were completed by the mice R package (3.13.0). Then, multiple linear regression was analyzed by the leaps R package (3.1). This is a single linear model regression analysis for multiple variates, i.e., the clinical and lab test variables together fitting toward the patient outcome (dead or alive) rather than multiple regression tests; therefore, Bonferroni correction for multiple comparisons was not used. A two-sided p-value of.05 was considered statistically significant. All analysis and data plotting were performed by SPSS 22.0 statistical software, R Statistical Software, or GraphPad Prism 7.00. Fluorescence-activated cell sorting (FACS) of the data was performed by FLOWJO 10 software.
In this study, we recruited a cohort of patients admitted to the ICU to explore the immunological risk factors of SAD and mortality. In total, 63 patients were recruited during July to December 2019, and 11 patients were excluded. Consequently, 52 patients were enrolled in the study (the Examinational cohort). In the Examinational cohort (Table 1), the mean age of the enrolled patients was 64.48 (SD = 14.47), and 63.46% of the patients were men. The median APACHE II score was 19.5 (IQR 15.25–26), and 48.1% of the patients were treated by mechanical ventilation (MV). The mean ICU admission time was 8.38 days (SD = 9.40). For comorbidity, 53.9%, 17.31%, 5.77%, 23.08%, 1.92%, 34.6%, and 32.7% of the patients suffered from sepsis, CHD, COPD, CRF, liver cirrhosis, hypertension, and diabetes, respectively. For all the enrolled patients, the overall survival after treatment was examined for 28 days. The results show that 10 (19.23%) patients died. Between the survival and nonsurvival groups, there was significant difference in age (p = .015), sepsis (p = .028), and delirium (p = .006).
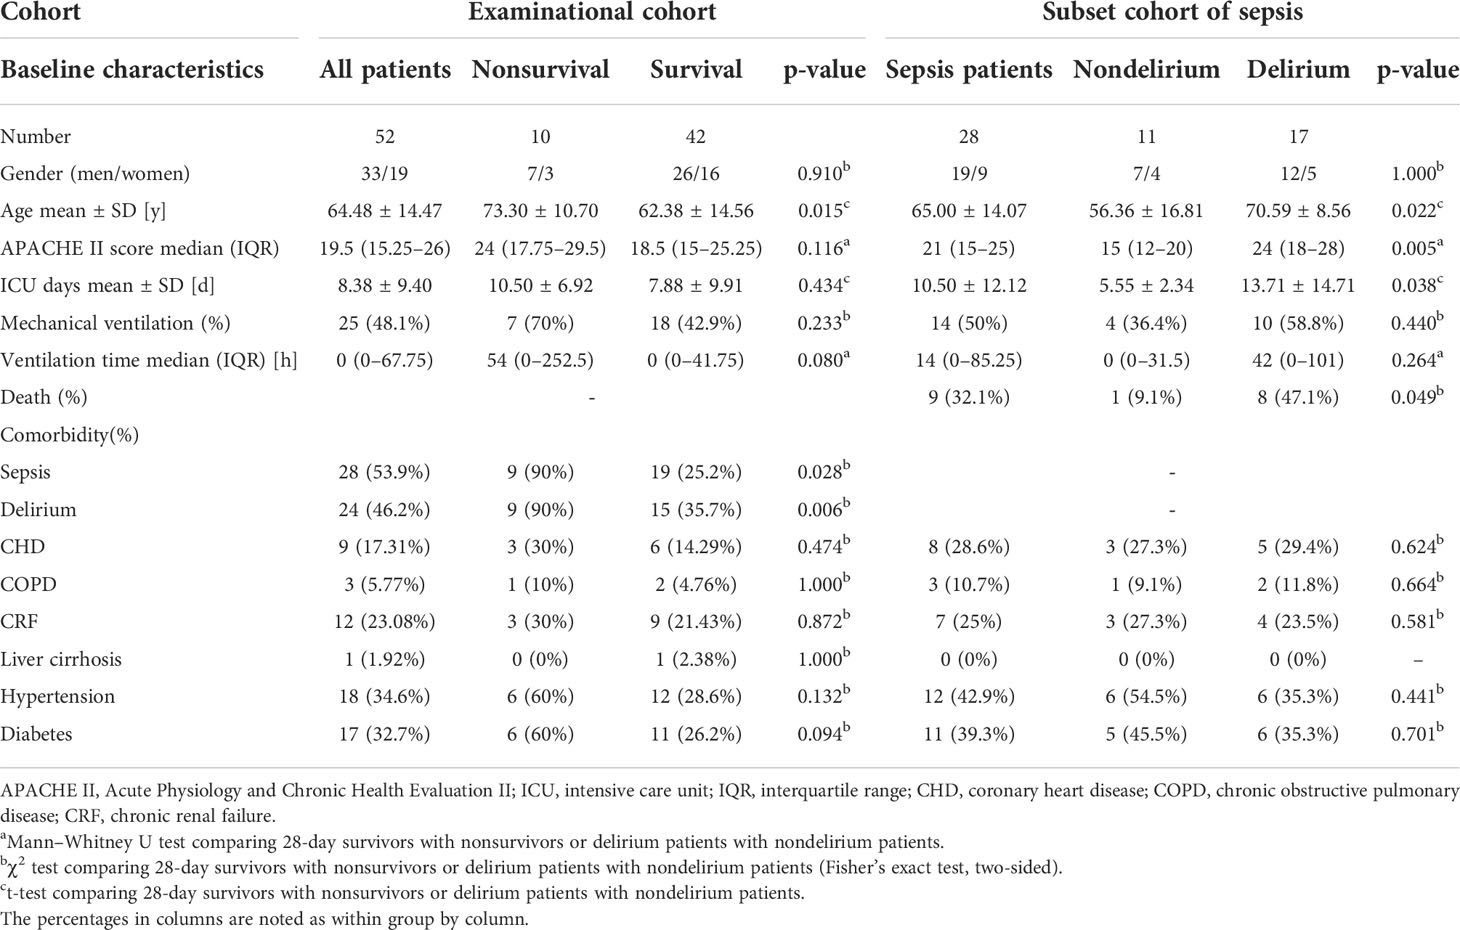
Table 1 Baseline characteristics of examinational cohort and subset cohort of sepsis.
In order to identify potential clinical and molecular predictors of SAD and its mortality in patients admitted to the ICU, the blood samples of the Examinational cohort were collected sequentially on days 1, 3, and 5 for a series of tests.
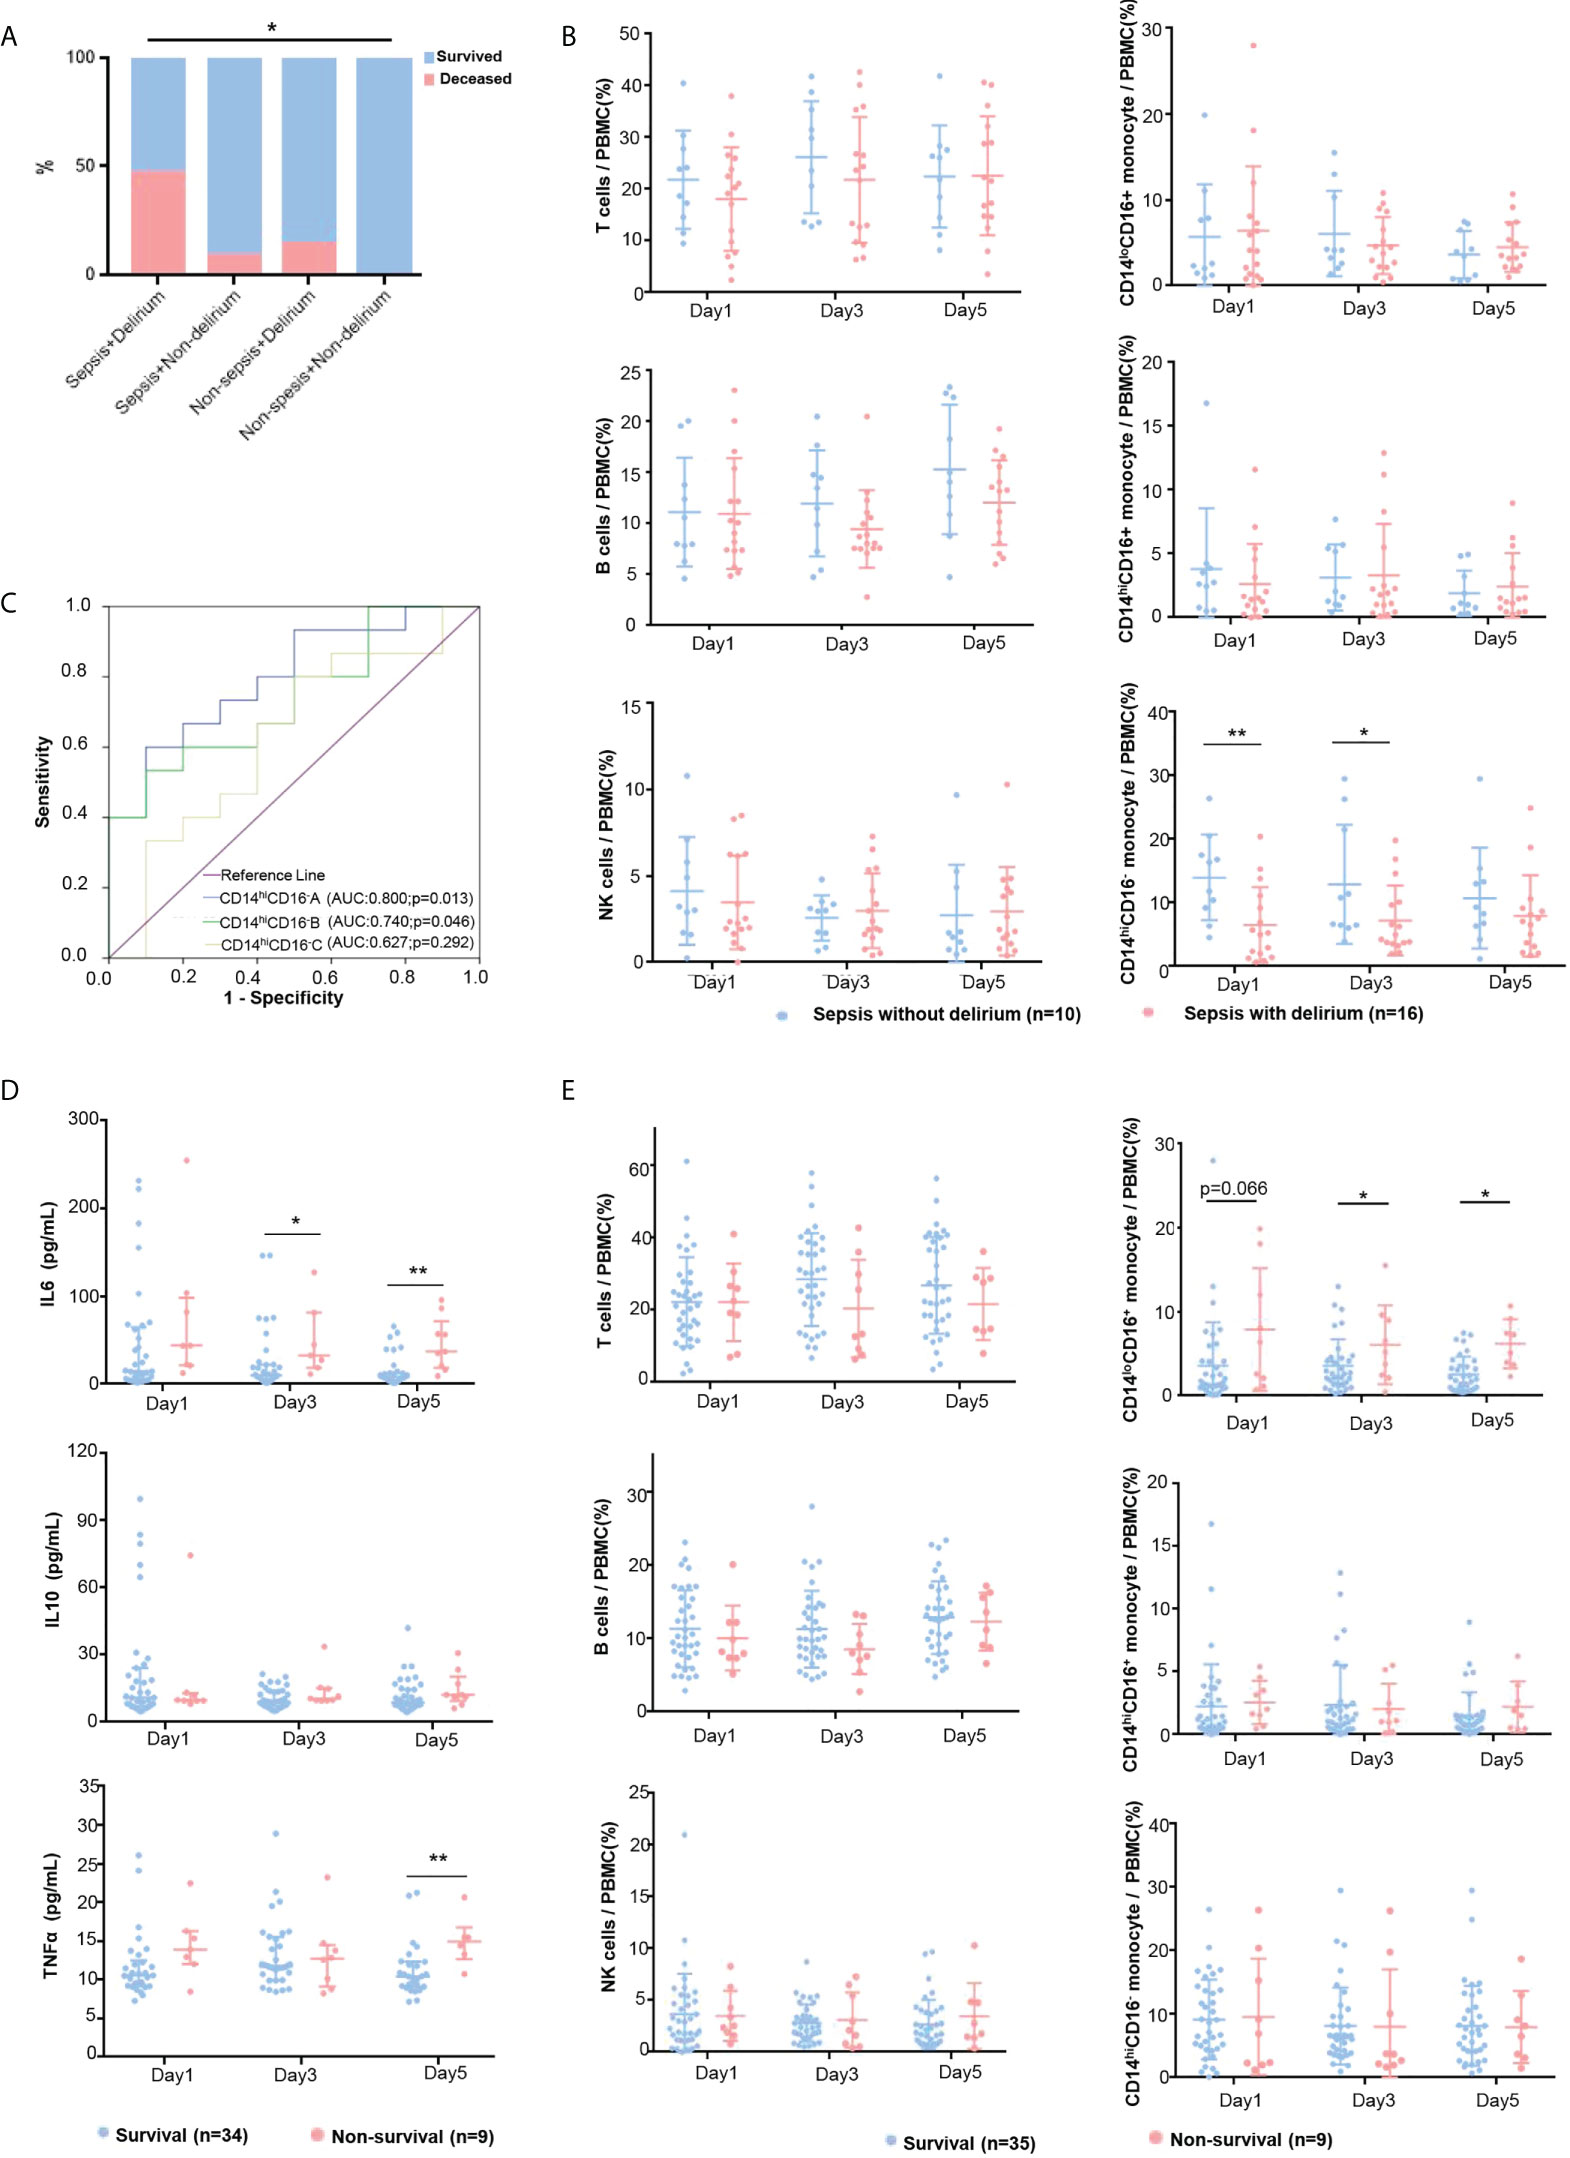
Figure 1 Peripheral immune profiling of critical patients. (A) Survival rate of eligible ICU patients of examinational cohort. The mortality rates of four groups were compared using Pearson’s chi-square test. (B) The immune cell proportions in patients with SAD and patients with sepsis were compared at days 1, 3, and 5. The patients with SAD (red dots) and sepsis patients without delirium (blue dots) were compared by t-test. Plots show mean and SD. (C) ROC curves for CD14hiCD16- monocytes at days 1, 3, and 5 for predicting the incidence of delirium in sepsis patients. (D) The levels of plasma cytokines were tested in nonsurvival and survival groups with ELISA at days 1, 3, and 5. The 28-day survivors (blue dots) and nonsurvivors (red dot) were compared by the nonparametric Mann–Whitney U test. Plots show median and IQR. (E) Immune cell proportions in 28-day nonsurvivors and survivors were compared on admission days 1, 3, and 5. The 28-day survivors (blue dots) and nonsurvivors (red dots) were compared by t-test. Plots show mean and SD. * refers to p <.05, and ** refers to p <.01.
Sepsis and delirium were the risk factors critically affecting the mortality of ICU patients, especially when sepsis is complicated with delirium. More than half of the 52 patients within the Examinational cohort had sepsis (n = 28, 53.9%), and 17 (60.7%) of these 28 sepsis patients had delirium (Table 1). Eight (47.1%) of these 17 patients with sepsis and delirium died during ICU admission or within 28 days of discharge, which was a significantly higher mortality rate than the rest (Figure 1A). Among the sepsis patients, the association between delirium and the risk for mortality was weakly significant (nondelirium vs. delirium: 9.1% vs. 47.1%, p = .049) (Table 1). In other words, ICU patients with both sepsis and delirium are much more likely to develop an unfavorable outcome (death).
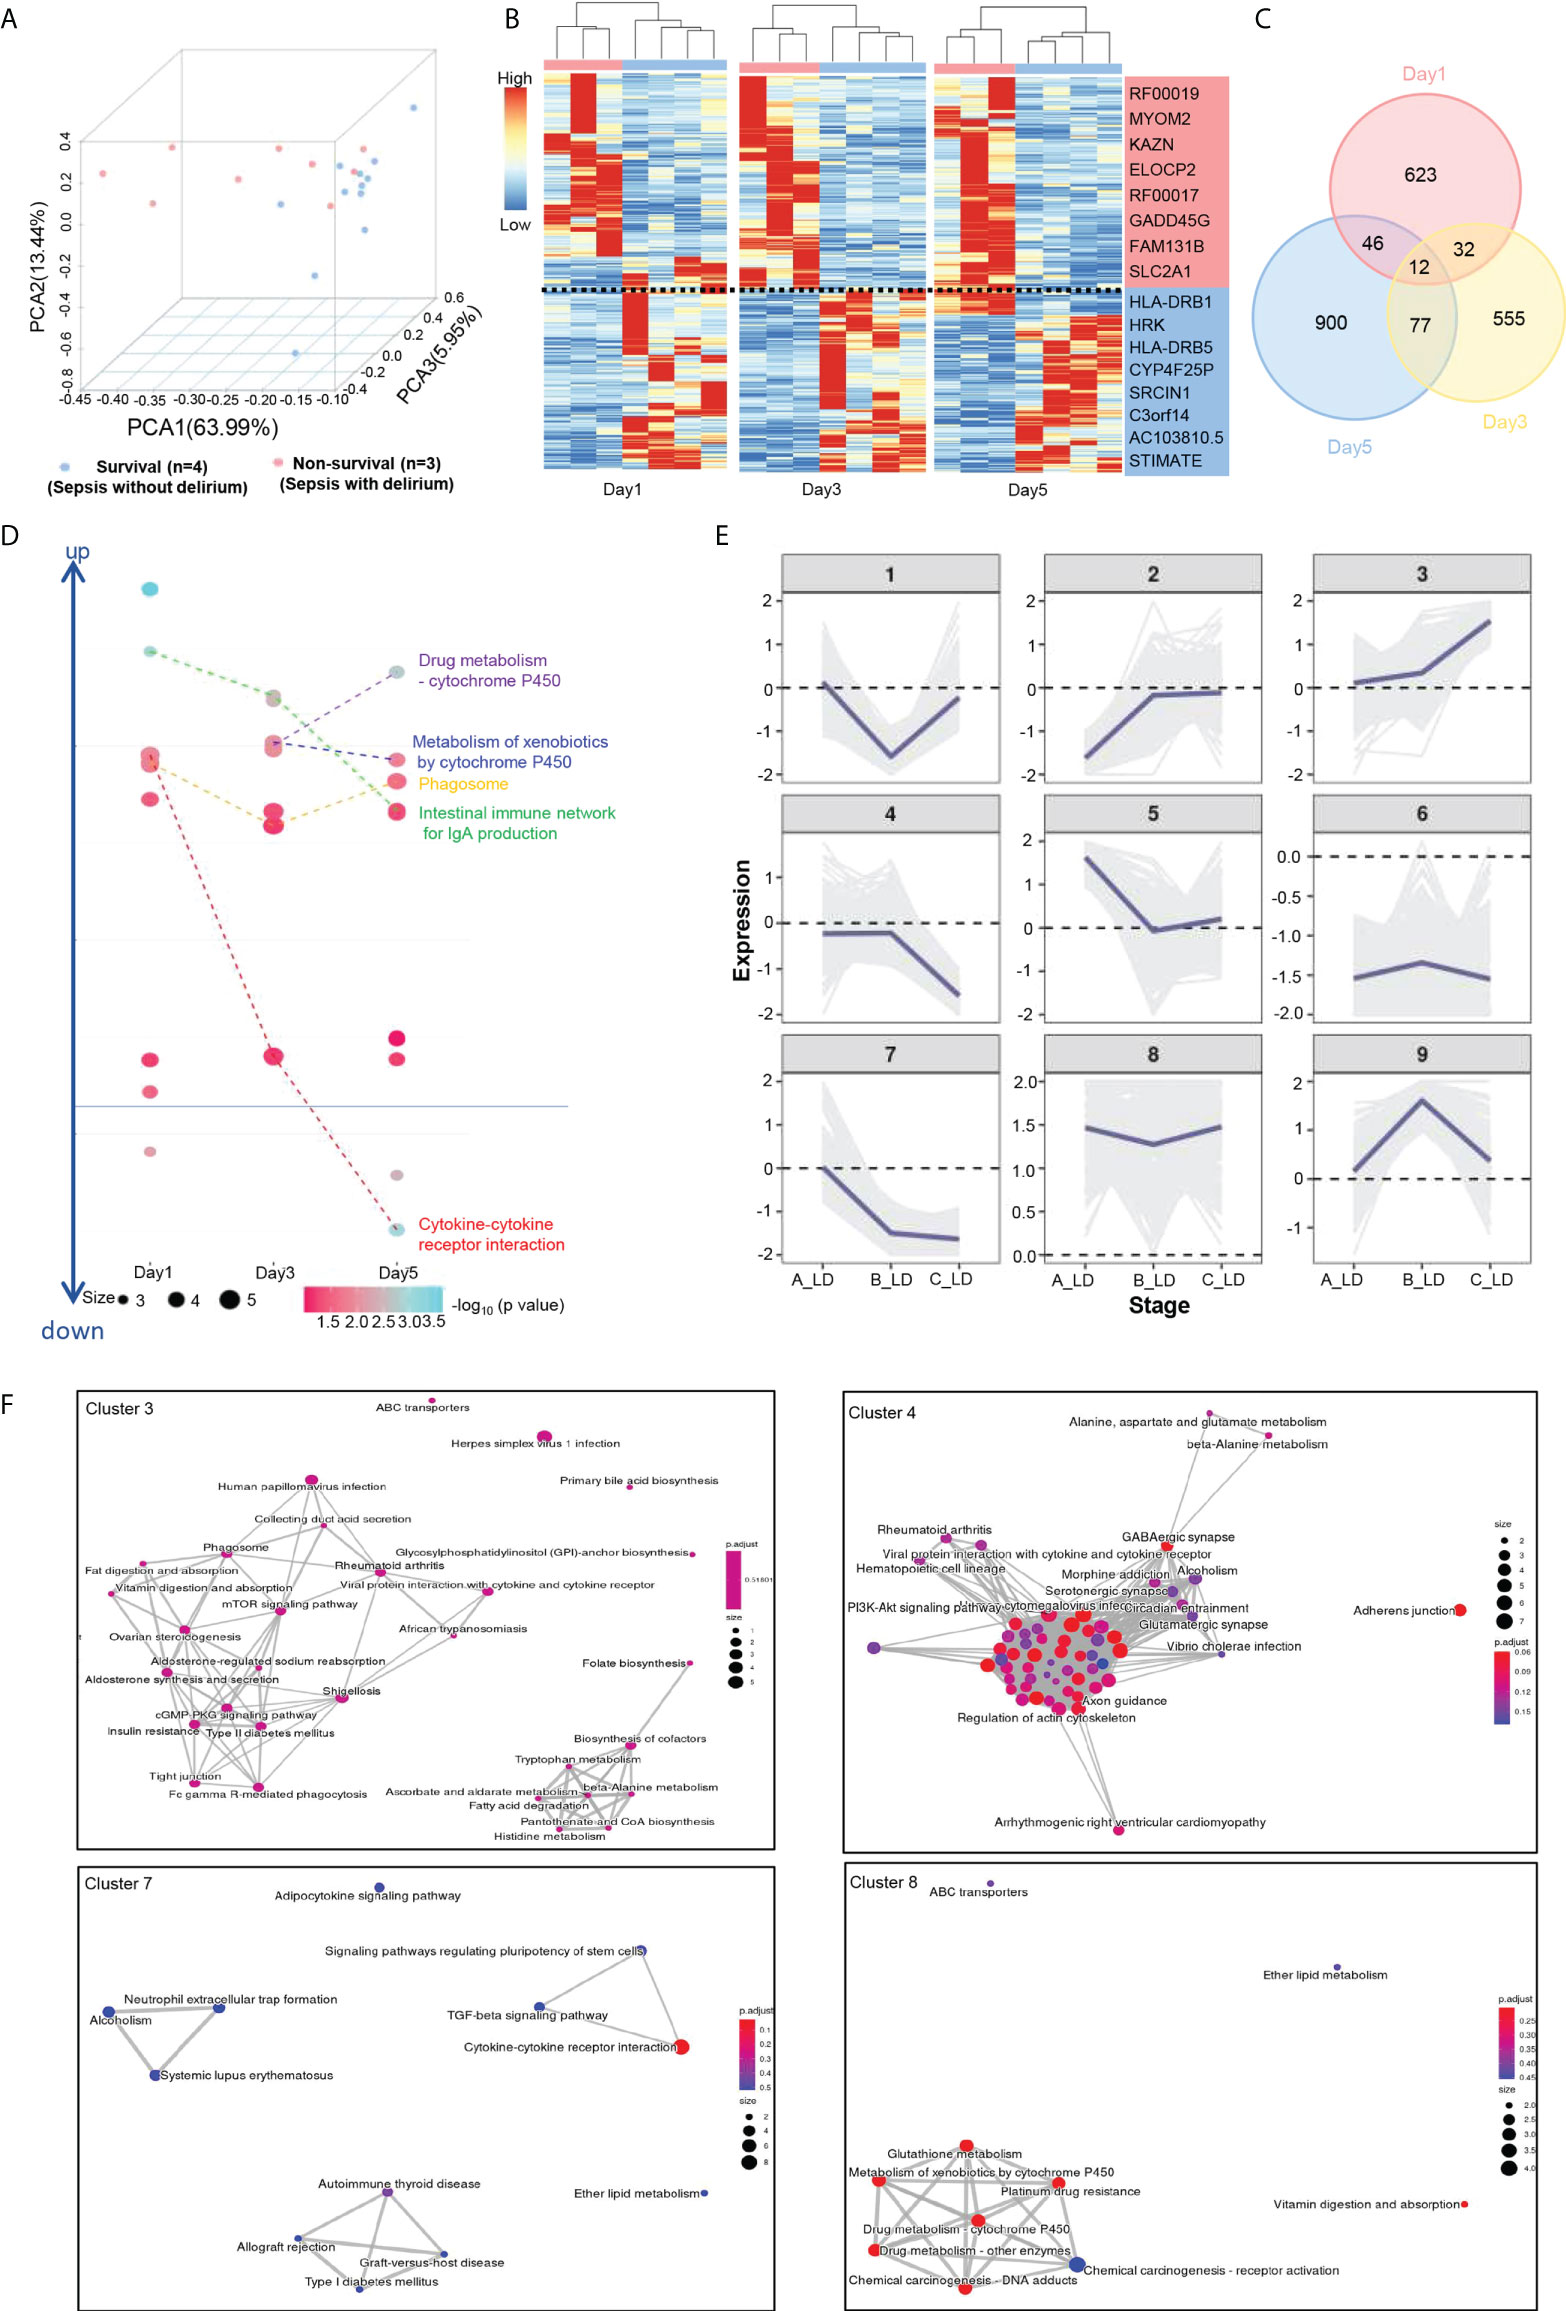
Figure 2 Transcriptional signatures of SAD and K-means analysis of DE genes. (A) PCA plot for RNA-seq data. All survival samples (blue dots) and nonsurvival samples (red dots) are shown. (B) Heat map visualization of DE genes (p value <.05 and fold change ≥ 2) between survival (blue) and nonsurvival (red) patients. (C) Venn diagram of DE genes between survival and nonsurvival groups. (D) The significantly enriched KEGG pathway for each group submitted DE genes are shown at days 1, 3, and 5. (E) Expression trends of DE genes from days 1–5. Genes were grouped as nine clusters with k-means clustering according to their expression patterns. The expression of each gene was calculated by normalized counts with the formula as follows. Exp (per gene) = log2 (AVG- livability/AVG- mortality). Exp(per gene): the expression value of each gene; AVG-mortality: average gene expression of nonsurvival; AVG-livability: average gene expression of survival. (F) The significantly enriched KEGG pathway for clusters 3, 4, 7, and 8.
The occurrence of delirium in sepsis patients was associated with age (p = .022) and APACHE II score (p = .005) (Table 1), and ICU stay in days of patients with SAD was significantly longer than that of septic patients without delirium (p = .038) (Table 1). There was no significant difference in gender, MV, and comorbidity (Table 1). FACS results revealed that patients who had sepsis complicated with delirium had lower CD14hiCD16— monocyte prevalence (Figure 1B and Table S1). To test this further, we constructed ROC curves to determine the sensitivity and specificity of the CD14hiCD16— monocyte percentage to predict the occurrence of delirium in sepsis patients. The areas under the curve (AUCs) for days 1, 3, and 5 were 0.800, 0.740, and 0.627, respectively (Figure 1C). The optimal cutoff for the CD14hiCD16- monocyte percentage predictive value was 6.03% (day 1) and 5.52% (day 3), which yielded a sensitivity and specificity of 60.0% and 90.0% (day 1) and 53.3% and 90.0% (day 3), respectively, for predicting the occurrence of delirium in sepsis patients. These results suggest that ICU patients with sepsis have a higher likelihood of developing delirium if their blood CD14hiCD16— monocyte prevalence is low.
Furthermore, we analyzed the differences of the peripheral immune profiling between survivors (n = 42) and nonsurvivors (n = 10) within the Examinational cohort. Blood routine examination (Table 2) showed that nonsurvivors had higher neutrophilic granulocyte percentage, higher CRP concentration, lower monocyte count, and lower monocyte percentage. There were no significant differences in the levels of complement and immunoglobulin except for the C3 complement. FACS results showed that a higher CD14loCD16+ monocyte percentage was significantly associated with mortality at multiple time points (Figure 1D, Table S2). The patients who died within 28 days had higher levels of IL-6 and TNF-α compared with survivors, which is possibly related to dysregulated immune responses, whereas no clear difference in IL-10 was observed (Figure 1E, Table S2).
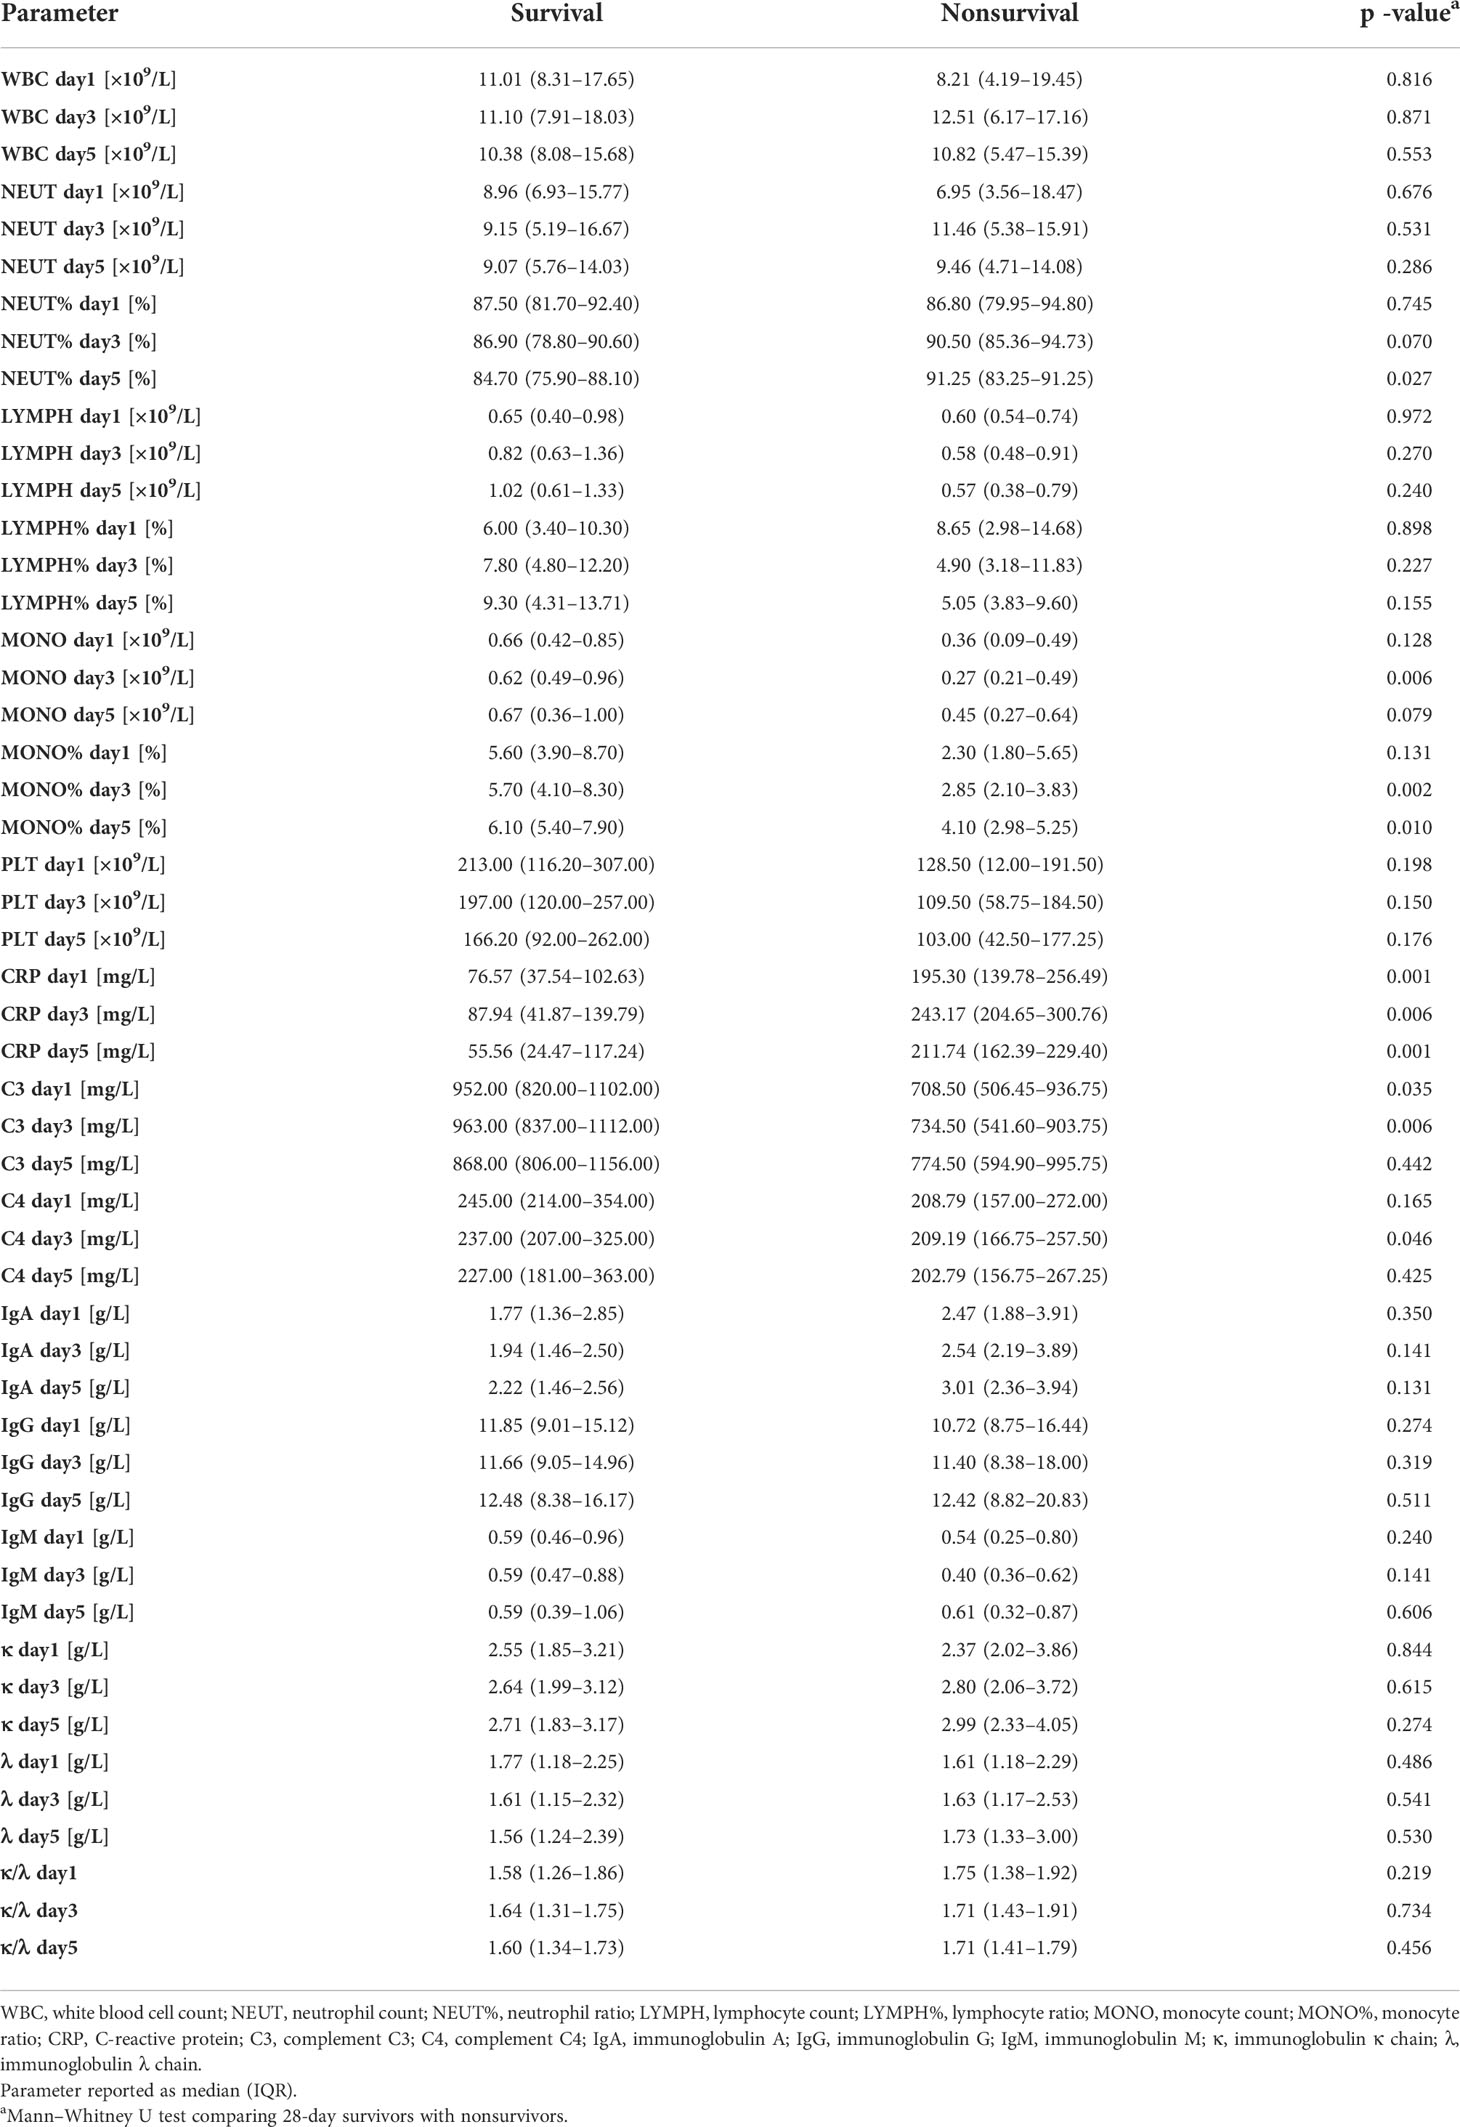
Table 2 Clinical and immune related biochemical data of nonsurvivors and survivors in examinational cohort.
To further explore the potential factors that were associated with SAD and 28-day mortality, we profiled the transcriptome of PBMCs isolated from four surviving patients (i.e., the survival group) with sepsis but not delirium and three nonsurviving patients (i.e., the nonsurvival group) with both sepsis and delirium on days 1, 3, and 5. Principal component analysis showed that the nonsurvival group was clustered and separated from the survival group (Figure 2A). There were a total of 2,245 DE genes between the two groups (Figures 2A–C, Table S3). GO and KEGG enrichment analysis showed that these DE genes were mainly associated with immune and metabolism pathways (Figure 2D; Tables S5, 6). Furthermore, we grouped these DE genes into nine clusters with k-means clustering (Figure 2E). Genes in the same cluster behaved in similar expression patterns as time went by. Genes in cluster 7 had higher expression in the nonsurvival patients, whereas genes in cluster 3 were highly expressed in the survival patients, especially on day 5. KEGG analysis revealed that the DE genes in cluster 3 were associated with Fc gamma R-mediated phagocytosis and metabolism, those in cluster 7 were mainly involved in cytokine–cytokine receptor interaction, and genes of cluster 8 were enriched in several metabolic pathways (Figure 2F; Tables S6, 7).
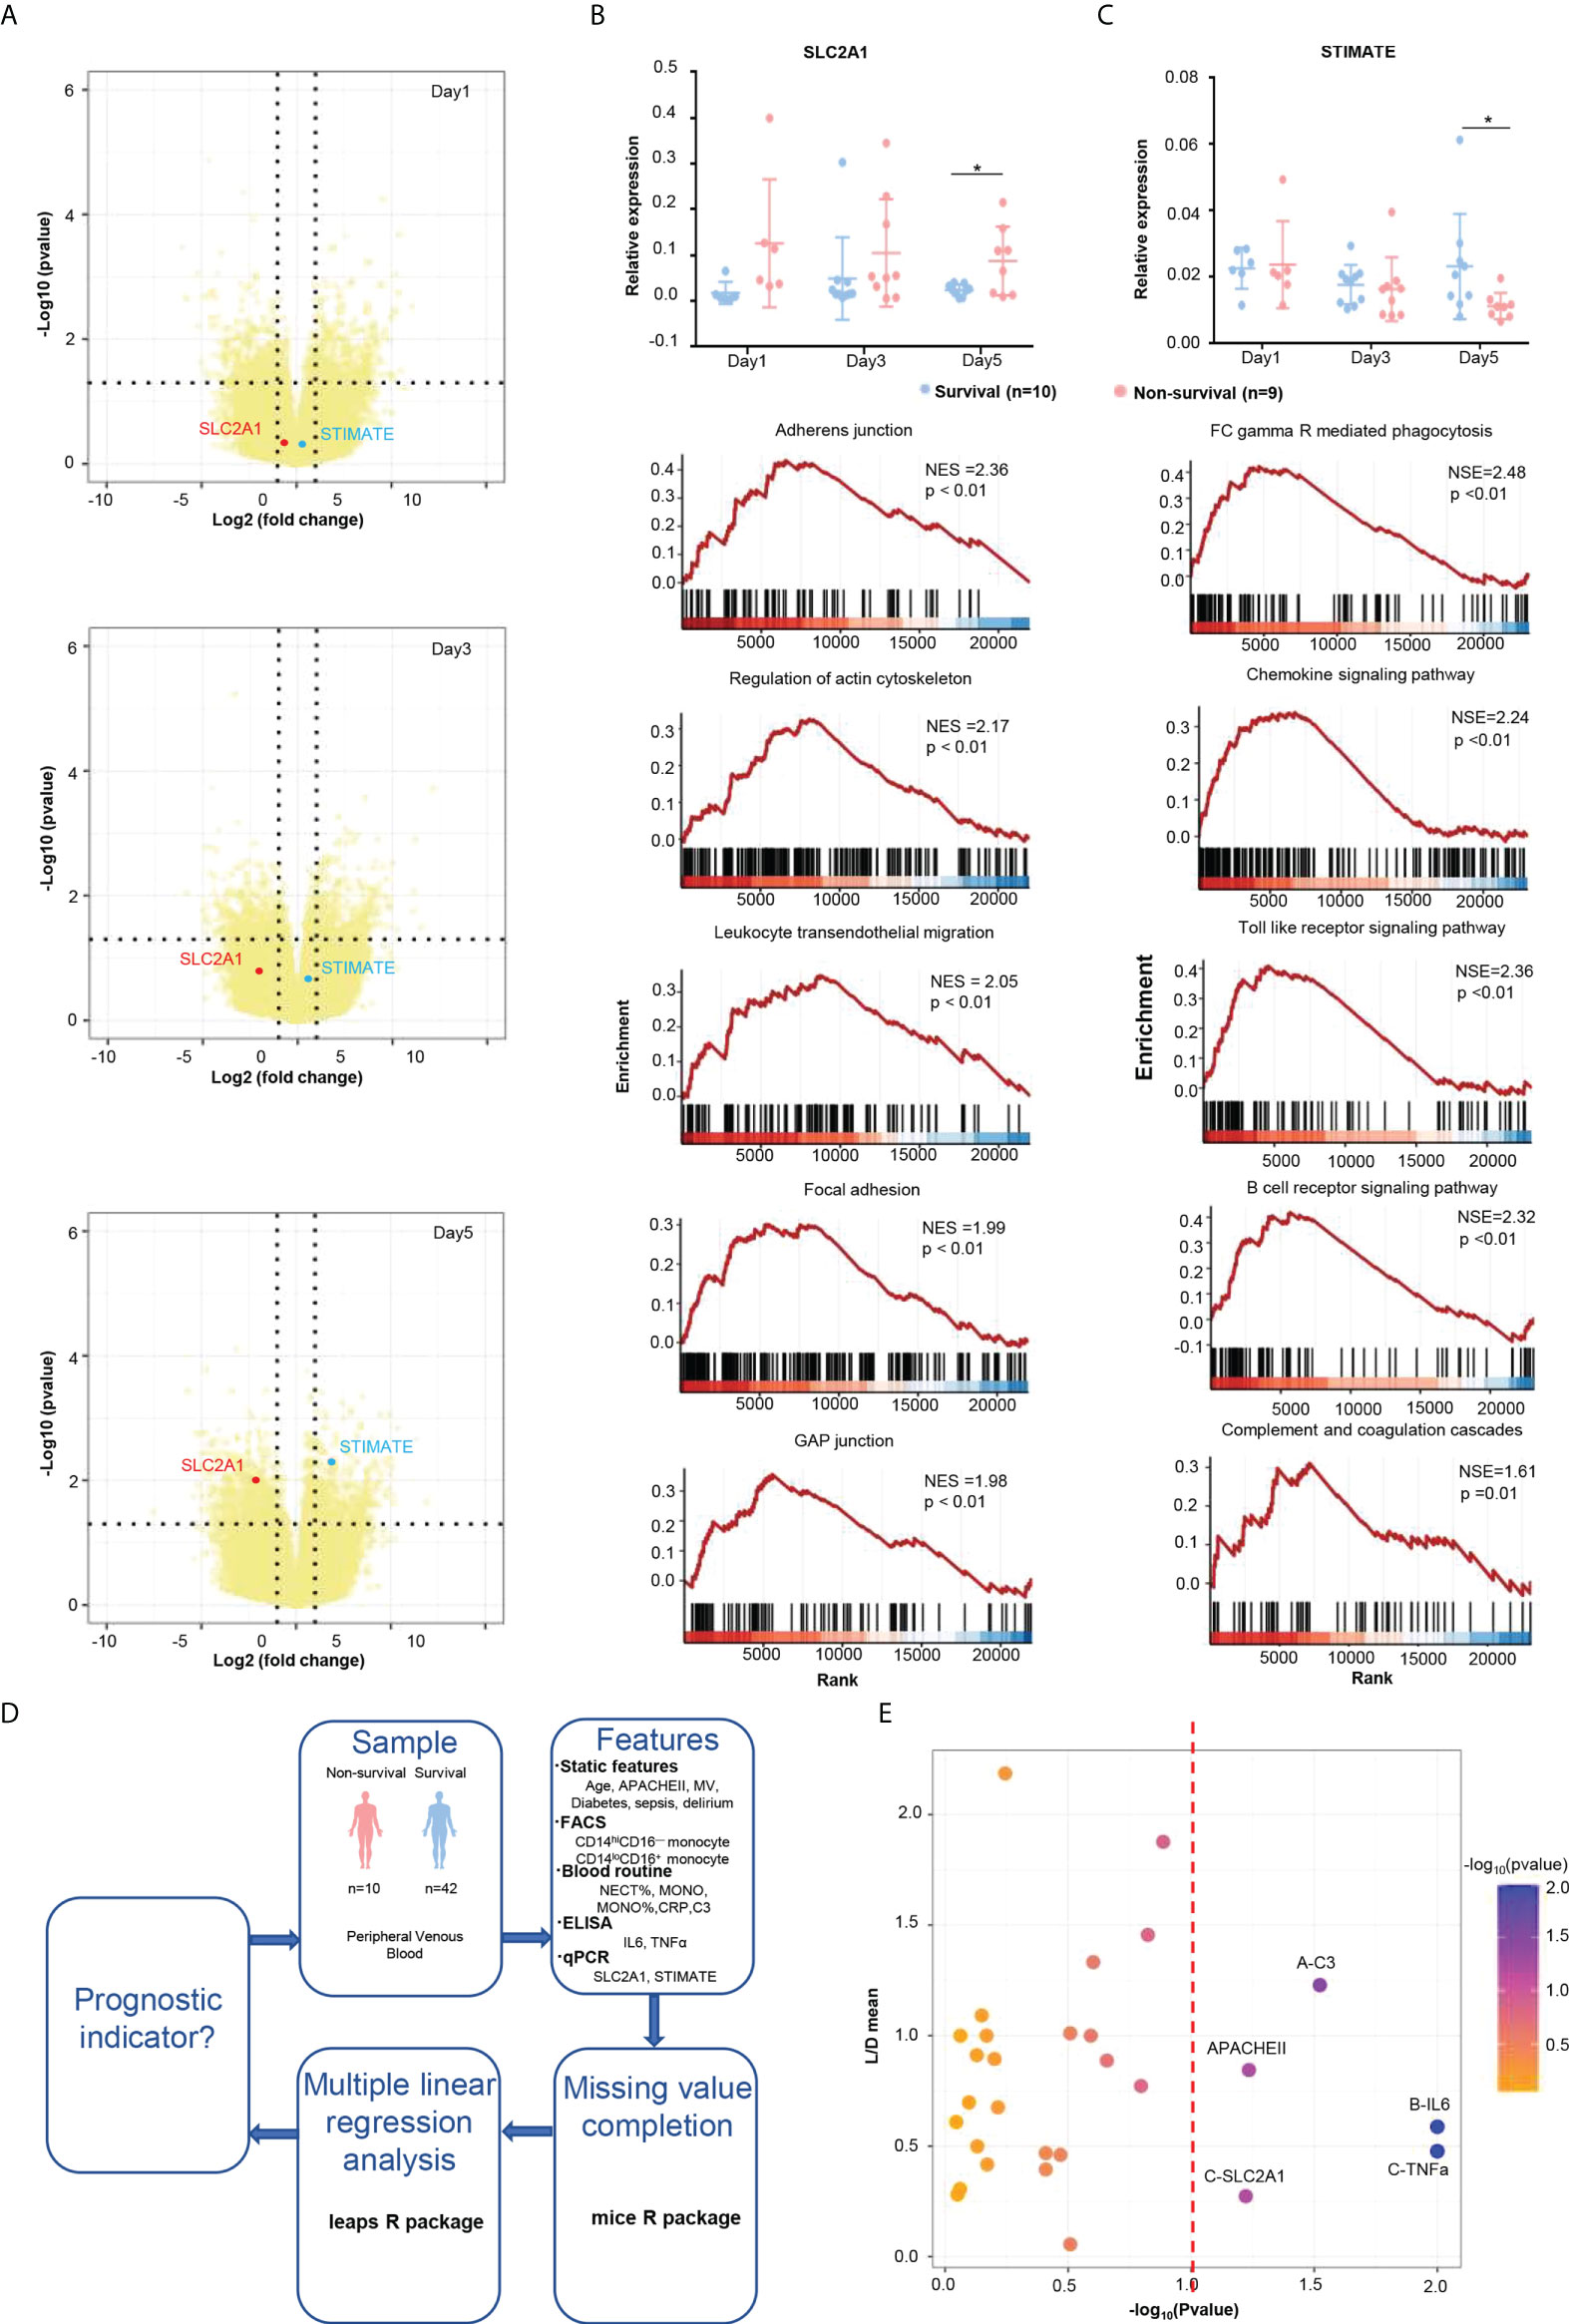
Figure 3 Poor prognostic indicators of ICU patients. (A) Volcano plot of the DE genes at days 1, 3, and 5. SLC2A1 is labeled as the red plot, and TIMATE is labeled as the blue plot. (B) qPCR validation and GSEA enrichment plots of SLC2A1. The 28-day survivors (blue dots) and nonsurvivors (red dots) were compared by t-test. Plots show mean and SD. (C) qPCR validation and GSEA enrichment plots of STIMATE. (D) Flowchart of prognostic feature analysis. The 28-day survivors (blue dots) and nonsurvivors (red dots) were compared by t-test. Plots show mean and SD. (E) Linear regression analysis of features that were potentially associated with poor prognosis. * refers to p<0.05.
To discover potential biomarker genes to predict the deterioration of the condition, all DE genes were analyzed with the expression patterns obtained by k-means analysis. We focus on clusters that increased (cluster 3) or decreased (cluster 7) over time in the k-means analysis. On the conditions of baseMean > 50, p-value <.01, and |log2FoldChange|> 1.5, several potential genes were screened and then validated by qPCR. Finally, transcriptome analyses identified two potential genes that could predict the deterioration of the condition (Figure 3A) that were experimentally validated by qPCR (Figures 3B, C). SLC2A1, a gene from cluster 7, was highly expressed in the nonsurvival group at day 5 (Figures 2E, Figure 3A). SLC2A1 encodes an important glucose transporter in the mammalian brain blood barrier (BBB), which ensures the energy-independent facilitative transport of glucose into the brain, and its impairment can cause neurological syndrome (14, 15). The metabolism and nerve disease–related KEGG pathways were enriched by GSEA analysis of SLC2A1 (Figure 3B, Table S8), suggesting its role in the metabolic disturbance of the brain and the neurological disorder in the nonsurvival patients. Conversely, STIMATE, a gene from cluster 3, was highly expressed in the survival group at day 5 (Figures 2E, Figure 3A). STIMATE acts as a regulator of the store-operated Ca2+ entry at junctional sites that connect the endoplasmic reticulum and the plasma membrane (16). STIMATE was related to a series of immune-related pathways, suggesting that a good immune status may help to improve the survival quality of ICU patients (Figure 3C, Table S8).
Last, to identify key prognostic factors for death in patients admitted to the ICU, we further analyzed the static and dynamic features from patients (Figure 3D). Multiple linear regression analysis showed that the high expression of IL-6 and TNF-α and low levels of C3 significantly increased the likelihood of mortality in the ICU, whereas other variables failed to achieve significance in multivariate testing (Figure 3E, Table S9). Among the variables that were not significant, higher APACHEII scores (p = .058) and higher expression of SLC2A1 (p = .068) were also worthy of attention (Figure 3E, Table S9).
In this study, we enrolled a cohort that included 52 patients to identify the risk factors of SAD and mortality in the ICU and determine the underlying molecular mechanisms. The result showed that several immunological features, including CD14hiCD16- monocyte prevalence, cytokine concentration, and longitudinal expression of SLC2A1 and STIMATE in peripheral blood, can be potentially used as predictive factors for SAD and patient death in the ICU.
Early and rapid identification of ICU patients with poor prognosis is a great challenge. The effective prognostic indicators are conducive to identifying critically ill patients for intensive care physicians. To identify the risk factors of mortality in the ICU, we recruited a cohort of patients in the ICU to explore the potential prognostic factors. In our cohort of ICU patients, we observed that 19.23% of the admissions died during hospitalization or the follow-up investigation. A high frequency of delirium was observed in nonsurviving patients, especially in sepsis patients, suggesting that SAD is an important risk factor for death in the ICU. The APACHE II scores, age, and ICU stay in days of patients with SAD were significantly higher than those of septic patients without delirium, which is consistent with previous studies (17–19). The 28-day mortality rate in patients who had SAD was 47.1%. It is also consistent with other studies that delirium and SAD are associated with increased mortality in the ICU (20, 21).
There is still much to learn about the pathophysiology of SAD. Microglial and astrocytic activation occur, resulting in neuroinflammation and an increase in the central nervous system (CNS) cytokine levels, thus causing delirium and sickness behaviors (22, 23), and this is one of the major components of the neuroinflammation mechanism in SAD. It is shown that, when microglia are inhibited in rats, their cognitive function is preserved following a septic episode, suggesting that microglial overactivation may play a crucial role in the development of SAD (24). A recent study reported that microglial activation and inflammation in the hippocampal region were consistent in both nonsepsis and septic delirium mice, followed by impaired hippocampal long-term potentiation (25). There is an absence of a direct infection in CNS during SAD (26), so it is still unclear how microglial cells are activated. Systemic inflammation induced by sepsis is accompanied by an increase in pro-inflammatory cytokines as well as oxidative damage to the BBB. With the subsequent influx of pro-inflammatory cytokines into the CNS, microglial cells are activated (24, 27). In addition, BBB leakage results in the infiltration of peripheral monocytes in the brain that participate in the pathogenesis of CNS diseases (28, 29). A study examined the association between peripheral inflammatory cells and sepsis-associated encephalopathy in a mouse model of delirium and revealed that neutrophils and CCR2+ inflammatory monocytes were recruited into the brains, and the prevention of CCR2+ inflammatory monocyte recruitment could reduce microglial activation and other neuroinflammation (30). In our study, we found that peripheral CD14hiCD16— monocytes were significantly lower in patients with SAD. Whether the peripheral CD14hiCD16— monocytes can infiltrate and be activated in CNS still needs to be studied further. The detailed mechanism of how peripheral inflammation affects the CNS also remains to be explored.
High mortality in the ICU and the lack of efficient therapies for SAD provide a strong incentive to identify new disease pathways and more reliable biomarkers, notably those that can be used for diagnosis in early stages. Biomarkers for early detection and patient stratification will be even more important in the future when additional therapies for sepsis patients become available. For many years, several potential biomarkers of SAD in different levels have been found (31–33). The role of the proportion and number of peripheral immune cells in the prediction of SAD is one of the research directions. Dongkai Li et al. reported that lymphocyte and NK cell counts were significantly higher in senior patients with SAD, and NK cell count may be valuable for the prediction of SAD within elderly patient cohorts (34). In our study, we demonstrated that CD14hiCD16— monocytes were significantly downregulated in patients with SAD. Thus, the proportion of CD14hiCD16— monocytes in peripheral blood may be a predictor of SAD. However, the predictive effect of a single biomarker is not accurate due to the complexity of the disease.
Gene expression profiles from ICU patients can provide comprehensive data that can elucidate pathogenesis and host immune responses. It has been applied in the research of sepsis to help people better understand the pathogenesis of sepsis. Zhenhua Li et al. used the least absolute shrink and selection operator (LASSO) regression and found that SLC2A6, C1ORF55, DUSP5, and RHOB might have important implications for the early diagnosis of sepsis patients (35). Kyung Soo Kim et al. used network and gene set enrichment analysis to elucidate sepsis pathogenesis (36). Currently, total transcriptome data of SAD are lacking. In our study, we profiled the transcriptome of PBMCs isolated from four surviving patients (sepsis, nondelirium) and three nonsurviving patients (sepsis, delirium). We found that mortality and SAD-related DE genes were mainly associated with DNA replication, mitochondrial translation, and metabolic processes. We then tested samples from critical patients stratified according to the expression levels of SLC2A1 and STIMATE because their expression patterns were linked to poor outcomes, which could be potential biomarkers to assess the survival status of patients in the ICU. With the development of PCR technology, a transcriptomic molecular tool will be more often applied in the clinic, which can be helpful to evaluate the immune state from peripheral blood, make diagnoses, and stratify patients. Using gene expression profiling to stratify patients is a rapid diagnostic tool, but the available platforms of immune profiling are still immature due to its complexity (37, 38). Beforehand, the panel of transcriptomic markers that can indicate the state of diseases and immune functions still needs to be selected with more validation.
The immune phenotype in critical patients is complex and heterogeneous, so it is better to use multiple biomarkers to evaluate the risk factors of the immune system, which can stratify patients and guide treatment (38). The features with moderate influence (P <.1) on mortality were included in the analysis as determined by univariate analysis. Finally, we used multiple linear regression analysis to identify the key prognostic factors for death in patients admitted to the ICU. Our data show that the higher the APACHEII scores, the higher the expressed levels of IL6, TNF-α, and SLC2A1. Additionally, the lower level of C3 significantly increased the likelihood of mortality in the ICU.
Our study proposes multiple markers for stratifying the risk of critical patients and to guide the treatment. There are some limitations to our study. First, this is a pilot study in a single facility with a relatively small group of patients. Second, our results are limited to critically ill ICU patients. Third, the fact that delirium was diagnosed by using CAM-ICU limits the generalizability. Finally, in our patients, delirium was diagnosed without the participation of consulting psychiatrists, which may affect the accuracy of the diagnostic results. Our observations need follow-up studies with larger patient groups for validation and further efforts to reveal the significance of these predictors in future studies.
In this cohort study, nonsurviving critical patients have a different immune profile. The CD14hiCD16- monocyte percentage may be predictors of SAD in ICU patients, and APACHEII scores, IL6, TNFα, SLC2A1, and C3 associated with the likelihood of mortality 28 days after ICU admission. Our study proposes multiple markers for stratifying the risk of critical patients and to guide the treatment.
The data presented in the study are deposited in the GEO data repository, accession number PRJNA767452.
The studies involving human participants were reviewed and approved by the Ethics Committee at the First Affiliated Hospital of Jinan University. The patients/participants provided their written informed consent to participate in this study.
ZW and GC conceived of and designed this study. ZW, XZ, and JS provided clinical samples and helped clinical information collection and analysis. WL was responsible for major experiments. YX, JD, and CX helped in cell sorting and FACS experiments. SS, LG, YC, TM, and YL helped in the experiments. PW helped in data analysis and interpretation. OL, ZR, and GC performed data analysis. WL, GC, and ZW wrote the manuscript. All authors contributed to the article and approved the submitted version.
This work was supported by grants from the National Key Research and Development Program of China (2018YFC2002003 to GC), the Natural Science Foundation of China (U1801285 to GC, 81971301 and 32050410285 to OL), Guangzhou Planned Project of Science and Technology (201904010111 to GC, 202002020039 to OL), Initial Supporting Foundation of Jinan University (GC and OL), and Guangdong Basic and Applied Basic Research Foundation (2020A1515010538 to ZW).
The authors declare that the research was conducted in the absence of any commercial or financial relationships that could be construed as a potential conflict of interest.
All claims expressed in this article are solely those of the authors and do not necessarily represent those of their affiliated organizations, or those of the publisher, the editors and the reviewers. Any product that may be evaluated in this article, or claim that may be made by its manufacturer, is not guaranteed or endorsed by the publisher.
The Supplementary Material for this article can be found online at: https://www.frontiersin.org/articles/10.3389/fimmu.2022.940779/full#supplementary-material
1. Garland A, Olafson K, Ramsey CD, Yogendran M, F R. Distinct determinants of long-term and short-term survival in critical illness. Intensive Care Med (2014) 40(8):1097–105. doi: 10.1007/s00134-014-3348-y
2. Angus DC, van der Poll T. Severe sepsis and septic shock. N Engl J Med (2013) 369(9):840–51. doi: 10.1056/NEJMra1208623
3. American Psychiatric Association. (2013). Diagnostic and statistical manual of mental disorders.5th edition. New York: Columbia Broadcasting System.
4. Trzepacz PT, Mittal D, Torres R, Kanary K, Norton J, Jimerson N. Validation of the delirium rating scale-revised-98_ comparison with the delirium rating scale and the cognitive test for delirium. J Neuropsychiatry Clin Neurosci (2001) 13(2):229–42. doi: 10.1176/jnp.13.2.229
5. Breitbart W, Rosenfeld B, Roth A, Smith MJ, Cohen K, Passik S. The memorial delirium assessment scale. J Pain Symptom Manage (1997) 13(3):128–37. doi: 10.1016/s0885-3924(96)00316-8
6. Devlin JW, Skrobik Y, Gelinas C, Needham DM, Slooter AJC, Pandharipande PP, et al. Clinical practice guidelines for the prevention and management of pain, Agitation/Sedation, delirium, immobility, and sleep disruption in adult patients in the ICU. Crit Care Med (2018) 46(9):e825–e73. doi: 10.1097/CCM.0000000000003299
7. Barr J, Fraser GL, Puntillo K, Ely EW, Gelinas C, Dasta JF, et al. Clinical practice guidelines for the management of pain, agitation, and delirium in adult patients in the intensive care unit. Crit Care Med (2013) 41(1):263–306. doi: 10.1097/CCM.0b013e3182783b72
8. van der Kooi AW, Zaal IJ, Klijn FA, Koek HL, Meijer RC, Leijten FS, et al. Delirium detection using EEG: What and how to measure. Chest (2015) 147(1):94–101. doi: 10.1378/chest.13-3050
9. Stollings JL, Kotfis K, Chanques G, Pun BT, Pandharipande PP, Ely EW. Delirium in critical illness: Clinical manifestations, outcomes, and management. Intensive Care Med (2021) 47(10):1089–103. doi: 10.1007/s00134-021-06503-1
10. Chen H, Wang J, Su N, Bao X, Li Y, Jin J. Simplified immune-dysregulation index: a novel marker predicts 28-day mortality of intensive care patients with COVID-19. Intensive Care Med (2020) 46(8):1645–7. doi: 10.1007/s00134-020-06114-2
11. Roderburg C, Benz F, Schuller F, Pombeiro I, Hippe HJ, Frey N, et al. Serum levels of TNF receptor ligands are dysregulated in sepsis and predict mortality in critically ill patients. PloS One (2016) 11(4):e0153765. doi: 10.1371/journal.pone.0153765
12. Yin ZX, Xing CY, Li GH, Pang LB, Wang J, Pan J, et al. A combined risk model for the multi-encompassing identification of heterogeneities of prognoses, biological pathway variations and immune states for sepsis patients. BMC Anesthesiol (2022) 22(1):16. doi: 10.1186/s12871-021-01552-x
13. Singer M, Deutschman CS, Seymour CW, Shankar-Hari M, Annane D, Bauer M, et al. The third international consensus definitions for sepsis and septic shock (Sepsis-3). JAMA (2016) 315(8):801–10. doi: 10.1001/jama.2016.0287
14. Klepper DW J, Fischbarg J, Vera JC, Jarjour IT, O’Driscoll KR, De Vivo DC. Defective glucose transport across brain tissue barriers_ a newly recognized neurological syndrome. Neurochem Res (1999) 24(4):587–94. doi: 10.1023/a:1022544131826
15. Olson JEP AL. Structure, function, and regulation of the mammalian facilitative glucose transporter gene family. Annu Rev Nutr (1996) 16:235–56. doi: 10.1146/annurev.nu.16.070196.001315
16. Jing J, He L, Sun A, Quintana A, Ding Y, Ma G, et al. Proteomic mapping of ER-PM junctions identifies STIMATE as a regulator of Ca(2)(+) influx. Nat Cell Biol (2015) 17(10):1339–47. doi: 10.1038/ncb3234
17. Yamamoto T, Mizobata Y, Kawazoe Y, Miyamoto K, Ohta Y, Morimoto T, et al. Incidence, risk factors, and outcomes for sepsis-associated delirium in patients with mechanical ventilation: A sub-analysis of a multicenter randomized controlled trial. J Crit Care (2020) 56:140–4. doi: 10.1016/j.jcrc.2019.12.018
18. Kim Y, Jin Y, Jin T, Lee SM. Risk factors and outcomes of sepsis-associated delirium in intensive care unit patients: A secondary data analysis. Intensive Crit Care Nurs (2020) 59:102844. doi: 10.1016/j.iccn.2020.102844
19. Chen J, Shi X, Diao M, Jin G, Zhu Y, Hu W, et al. A retrospective study of sepsis-associated encephalopathy: epidemiology, clinical features and adverse outcomes. BMC Emerg Med (2020) 20(1):77. doi: 10.1186/s12873-020-00374-3
20. Ely EW, Shintani A, Truman B, Speroff T, Gordon SM, Harrell FE Jr, et al. Delirium as a predictor of mortality in mechanically ventilated patients in the intensive care unit. JAMA (2004) 291(14):1753–62. doi: 10.1001/jama.291.14.1753
21. Dittrich T, Tschudin-Sutter S, Widmer AF, Ruegg S, Marsch S, Sutter R. Risk factors for new-onset delirium in patients with bloodstream infections: independent and quantitative effect of catheters and drainages-a four-year cohort study. Ann Intensive Care (2016) 6(1):104. doi: 10.1186/s13613-016-0205-x
22. Nwafor DC, Brichacek AL, Mohammad AS, Griffith J, Lucke-Wold BP, Benkovic SA, et al. Targeting the blood-brain barrier to prevent sepsis-associated cognitive impairment. J Cent Nerv Syst Dis (2019) 11:1179573519840652. doi: 10.1177/1179573519840652
23. Semmler A, Hermann S, Mormann F, Weberpals M, Paxian SA, Okulla T, et al. Sepsis causes neuroinflammation and concomitant decrease of cerebral metabolism. J Neuroinflamm (2008) 5:38. doi: 10.1186/1742-2094-5-38
24. Michels M, Vieira AS, Vuolo F, Zapelini HG, Mendonca B, Mina F, et al. The role of microglia activation in the development of sepsis-induced long-term cognitive impairment. Brain Behav Immun (2015) 43:54–9. doi: 10.1016/j.bbi.2014.07.002
25. Chen M, Zhang Li, Shao M, Du J, Xiao Y, Zhang F, et al. E4BP4 coordinates circadian control of cognition in delirium. Adv Sci (Weinh) (2022) 17:e2200559. doi: 10.1002/advs.202200559
26. Gofton TE, Young GB. Sepsis-associated encephalopathy. Nat Rev Neurol (2012) 8(10):557–66. doi: 10.1038/nrneurol.2012.183
27. van Gool WA, van de Beek D, Eikelenboom P. Systemic infection and delirium: when cytokines and acetylcholine collide. Lancet (2010) 375(9716):773–5. doi: 10.1016/s0140-6736(09)61158-2
28. Haage V, Semtner M, Vidal RO, Hernandez DP, Pong WW, Chen Z, et al. Comprehensive gene expression meta-analysis identifies signature genes that distinguish microglia from peripheral monocytes/macrophages in health and glioma. Acta Neuropathol Commun (2019) 7(1):20. doi: 10.1186/s40478-019-0665-y
29. Xu Z, Shi WH, Xu LB, Shao MF, Chen ZP, Zhu GC, et al. Resident microglia activate before peripheral monocyte infiltration and p75NTR blockade reduces microglial activation and early brain injury after subarachnoid hemorrhage. ACS chem. Neurosci (2019) 10(1):412–23. doi: 10.1021/acschemneuro.8b00298
30. Andonegui G, Zelinski EL, Schubert CL, Knight D, Craig LA, Winston BW, et al. Targeting inflammatory monocytes in sepsis-associated encephalopathy and long-term cognitive impairment. JCI Insight (2018) 3(9):e99364. doi: 10.1172/jci.insight.99364
31. Orhun G, Esen F, Yilmaz V, Ulusoy C, Sanli E, Yildirim E, et al. Elevated sTREM2 and NFL levels in patients with sepsis associated encephalopathy. Int J Neurosci (2021), 1–7. doi: 10.1080/00207454.2021.1916489
32. Zhu J, Zhang M, Han T, Wu H, Xiao Z, Lin S, et al. Exploring the biomarkers of sepsis-associated encephalopathy (SAE): Metabolomics evidence from gas chromatography-mass spectrometry. BioMed Res Int (2019) 2019:2612849. doi: 10.1155/2019/2612849
33. Visitchanakun P, Tangtanatakul P, Trithiphen O, Soonthornchai W, Wongphoom J, Tachaboon S, et al. Plasma miR-370-3P as a biomarker of sepsis-associated encephalopathy, the transcriptomic profiling analysis of microrna-arrays from mouse brains. Shock (2020) 54(3):347–57. doi: 10.1097/SHK.0000000000001473
34. Li D, Zhang J, Bai G, Chen J, Cheng W, Cui N. Lymphocyte and NK cell counts can predict sepsis-associated delirium in elderly patients. Front Aging Neurosci (2021) 12:621298. doi: 10.3389/fnagi.2020.621298
35. Li Z, Huang B, Yi W, Wang F, Wei S, Yan H, et al. Identification of potential early diagnostic biomarkers of sepsis. J Inflammation Res (2021) 14:621–31. doi: 10.2147/JIR.S298604
36. Kim KS, Jekarl DW, Yoo J, Lee S, Kim M, Kim Y. Immune gene expression networks in sepsis: A network biology approach. PloS One (2021) 16(3):e0247669. doi: 10.1371/journal.pone.0247669
37. Rello J, van Engelen TSR, Alp E, Calandra T, Cattoir V, Kern WV, et al. Towards precision medicine in sepsis: A position paper from the European society of clinical microbiology and infectious diseases. Clin Microbiol Infect (2018) 24(12):1264–72. doi: 10.1016/j.cmi.2018.03.011
Keywords: ICU, sepsis-associated delirium, immune profile, mortality, gene expression, monocyte
Citation: Lei W, Ren Z, Su J, Zheng X, Gao L, Xu Y, Deng J, Xiao C, Sheng S, Cheng Y, Ma T, Liu Y, Wang P, Luo OJ, Chen G and Wang Z (2022) Immunological risk factors for sepsis-associated delirium and mortality in ICU patients. Front. Immunol. 13:940779. doi: 10.3389/fimmu.2022.940779
Received: 10 May 2022; Accepted: 22 August 2022;
Published: 20 September 2022.
Edited by:
Steven O'Reilly, STipe Therapeutics, DenmarkReviewed by:
Roshni Roy, National Institute on Aging (NIH), United StatesCopyright © 2022 Lei, Ren, Su, Zheng, Gao, Xu, Deng, Xiao, Sheng, Cheng, Ma, Liu, Wang, Luo, Chen and Wang. This is an open-access article distributed under the terms of the Creative Commons Attribution License (CC BY). The use, distribution or reproduction in other forums is permitted, provided the original author(s) and the copyright owner(s) are credited and that the original publication in this journal is cited, in accordance with accepted academic practice. No use, distribution or reproduction is permitted which does not comply with these terms.
*Correspondence: Zhigang Wang, ZHJ3YW5nemdAc2luYS5jb20=; Guobing Chen, Z3VvYmluZ2NoZW5Aam51LmVkdS5jbg==; Oscar Junhong Luo, bHVvamhAam51LmVkdS5jbg==
†These authors have contributed equally to this work and share first authorship
Disclaimer: All claims expressed in this article are solely those of the authors and do not necessarily represent those of their affiliated organizations, or those of the publisher, the editors and the reviewers. Any product that may be evaluated in this article or claim that may be made by its manufacturer is not guaranteed or endorsed by the publisher.
Research integrity at Frontiers
Learn more about the work of our research integrity team to safeguard the quality of each article we publish.