Erratum: Single-cell gene expression analysis of cryopreserved equine bronchoalveolar cells
 Sophie E. Sage1*
 Pamela Nicholson2
 Laureen M. Peters3
 Tosso Leeb2,4
 Vidhya Jagannathan4†
 Vinzenz Gerber1†
- 1Swiss Institute of Equine Medicine, Department of Clinical Veterinary Medicine, Vetsuisse Faculty, University of Bern, Bern, Switzerland
- 2Next Generation Sequencing Platform, University of Bern, Bern, Switzerland
- 3Clinical Diagnostic Laboratory, Department of Clinical Veterinary Medicine, Vetsuisse Faculty, University of Bern, Bern, Switzerland
- 4Institute of Genetics, Vetsuisse Faculty, University of Bern, Bern, Switzerland
The transcriptomic profile of a cell population can now be studied at the cellular level using single-cell mRNA sequencing (scRNA-seq). This novel technique provides the unprecedented opportunity to explore the cellular composition of the bronchoalveolar lavage fluid (BALF) of the horse, a species for which cell type markers are poorly described. Here, scRNA-seq technology was applied to cryopreserved equine BALF cells. Analysis of 4,631 cells isolated from three asthmatic horses in remission identified 16 cell clusters belonging to six major cell types: monocytes/macrophages, T cells, B/plasma cells, dendritic cells, neutrophils and mast cells. Higher resolution analysis of the constituents of the major immune cell populations allowed deep annotation of monocytes/macrophages, T cells and B/plasma cells. A significantly higher lymphocyte/macrophage ratio was detected with scRNA-seq compared to conventional cytological differential cell count. For the first time in horses, we detected a transcriptomic signature consistent with monocyte-lymphocyte complexes. Our findings indicate that scRNA-seq technology is applicable to cryopreserved equine BALF cells, allowing the identification of its major (cytologically differentiated) populations as well as previously unexplored T cell and macrophage subpopulations. Single-cell gene expression analysis has the potential to facilitate understanding of the immunological mechanisms at play in respiratory disorders of the horse, such as equine asthma.
1 Introduction
Single-cell sequencing technologies have brought a fresh impetus to biological research. With single-cell mRNA sequencing (scRNA-seq), it is now possible to study global gene expression at the single cell level in many complex tissues and heterogeneous cell populations. ScRNA-seq is a powerful tool for the generation of novel hypotheses. The applications of single-cell transcriptomics across the biomedical fields range from the identification of new cell types to the exploration of disease-specific pathological processes, unveiling novel biomarkers and potential therapeutic targets (1). Recently, scRNA-seq gave invaluable insights into the pathological mechanisms leading to respiratory decompensation in SARS-CoV-2 patients (2–4).
Lower airway diseases are common in horses and have a major impact on the equine industry and animal welfare. The processes at play in their pathogenesis are still ill defined due to their complexity, but also due to technical limitations. For the characterization of equine asthma, the most prevalent of these disorders, cytological examination of bronchoalveolar lavage fluid (BALF) is the most widely used technique in both clinical and experimental settings. It is, however, inherently subjective and only allows for the differentiation of five distinct leukocyte populations: macrophages, lymphocytes, neutrophils, mast cells and eosinophils (5). Antibody-based techniques such as immunohistochemistry and flow cytometry permit differentiation of further subpopulations (e.g. within lymphocytes), but in the horse they are restricted to a few cell types due to the limited pool of validated antibodies (6, 7). Individual mRNA transcripts can be measured in BALF mainly by RT-PCR to investigate the influence of various factors on the regulation of specific genes (8–11). This hypothesis-driven approach suffers from a low throughput and a significant investigator bias. In contrast, global transcriptomics is an unbiased, high throughput technique. However, critical differences between individual cells are obscured when performing bulk RNA sequencing of mixed cell populations. This is an important limitation knowing that the cellular composition of the lower respiratory tract, particularly when assessed by BALF sampling, is substantially affected by health status (12). ScRNA-seq enables the description of the different cell populations present in a sample concurrently with their individual transcriptome. Moreover, cell types can be identified without a priori knowledge of marker genes.
Single-cell gene expression analysis of bronchoalveolar cells has been successfully performed in humans (2–4), mice (13), ferrets (14) and dogs (15), but not in horses. Before scRNA-seq can be applied to the study of equine respiratory diseases, it is crucial to demonstrate its feasibility on BALF and to build an equine lung-specific reference database. Published scRNA-seq experiments on BALF use fresh samples to optimize cell viability and to avoid the transcriptional changes that could be associated with storage and processing. Being able to store equine BALF cells before scRNA-seq would have several advantages including reducing potential batch effects and facilitating large-scale longitudinal studies.
Here, we applied scRNA-seq to cryopreserved equine BALF cells as a proof of concept, with the aim to differentiate and characterize cell populations based on their transcriptional signatures. It should be noted that the potential effect of cryopreservation on gene expression was not assessed in this study.
2 Material and methods
2.1 Ethics statement
All animal experiments were performed according to the local regulations. This study was approved by the Animal Experimentation Committee of the Canton of Bern, Switzerland (BE07/19).
2.2 Study population
The study was carried out in February 2020. Three horses belonging to the university teaching herd were included. Characteristics of the study population are listed in Table 1. A standard physical examination was performed to assess systemic health. These horses suffered from mild-to-moderate equine asthma, but were in clinical remission at the time of the study. No medication other than alpha-2 agonists (sedation for teaching purposes) were administered for at least a month before the experiment. Lower airway inflammation status was assessed via clinical scoring (16), bronchoscopy and BALF cytology. The experimental workflow is summarized in Figure 1.
TABLE 1
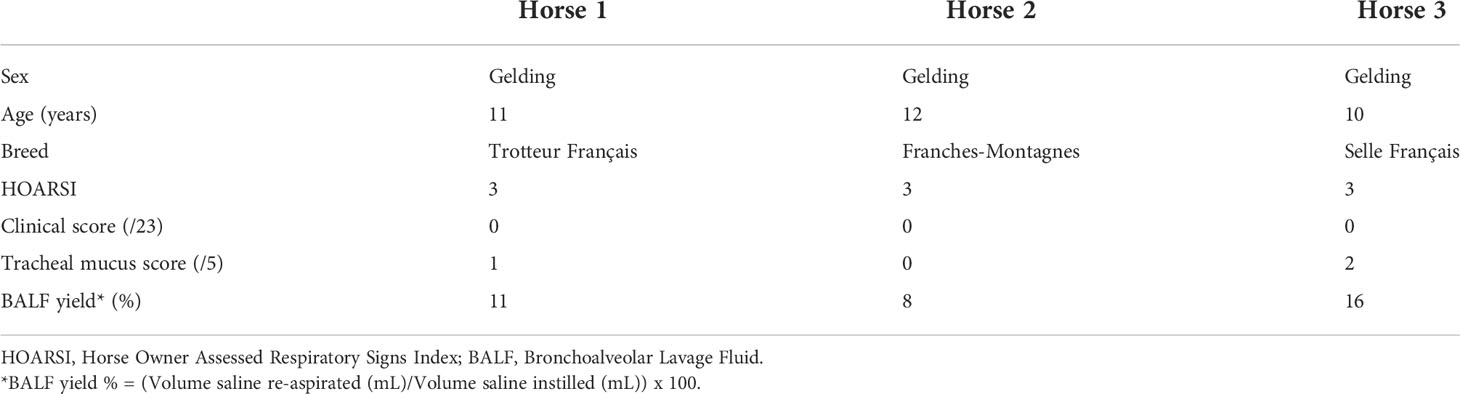
Table 1 Characteristics of the study population.
FIGURE 1
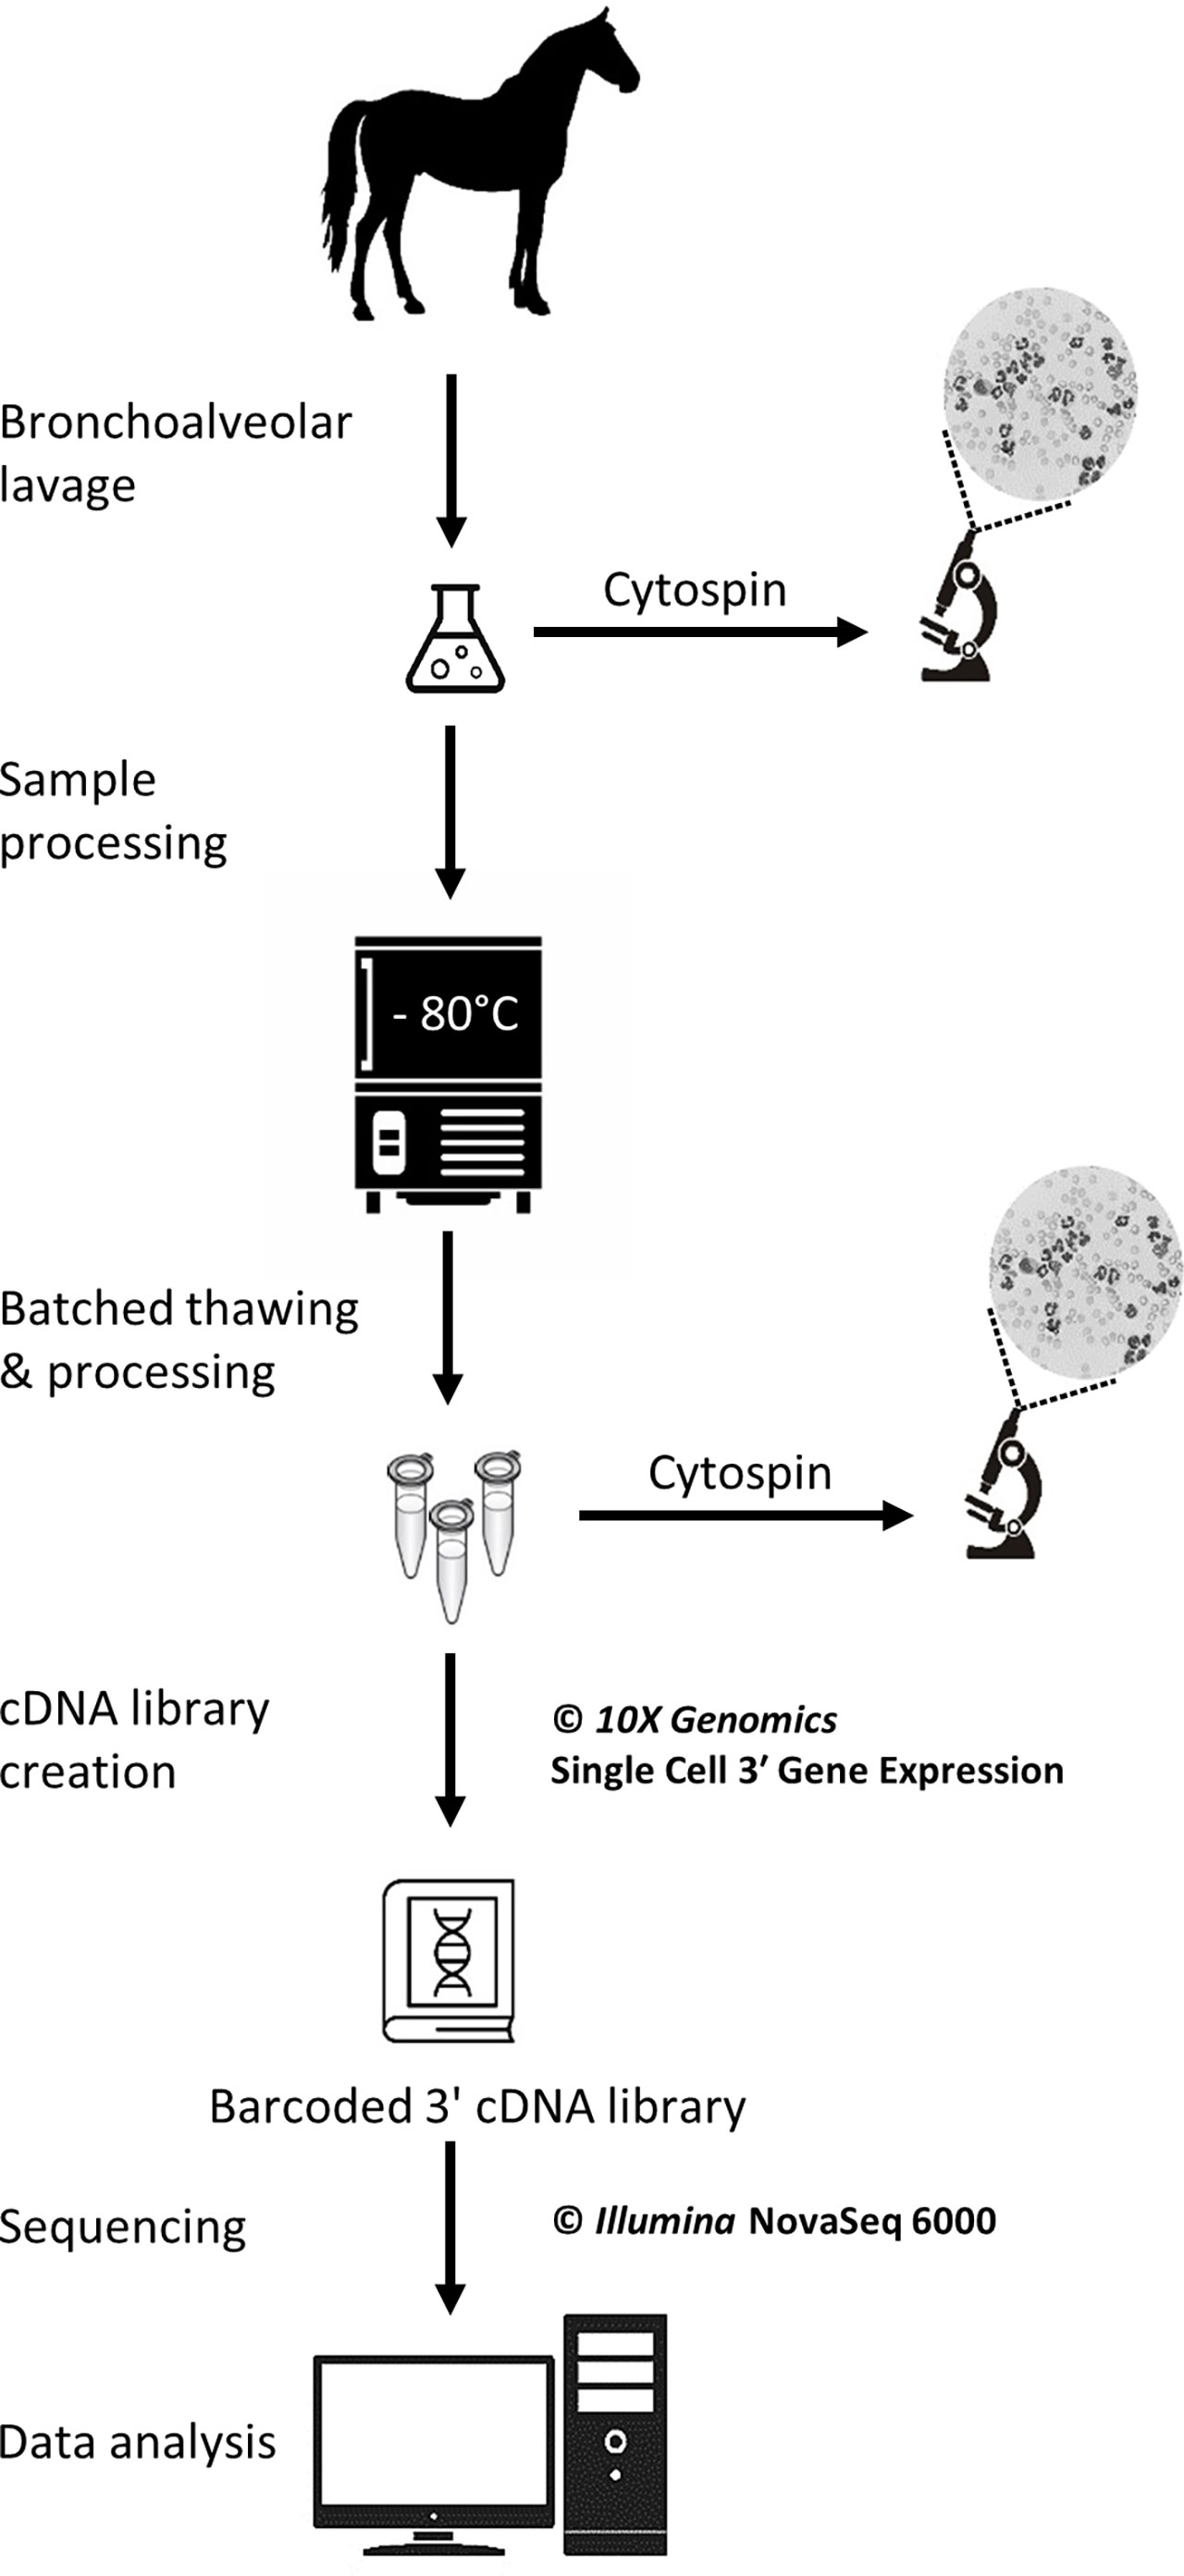
Figure 1 Experimental workflow for the single-cell mRNA sequencing of cryopreserved equine bronchoalveolar cells.
2.3 Sample collection
A bronchoalveolar lavage was performed with endoscopic guidance under light sedation. Briefly, a flexible endoscope (VET-OR1200HD, Medical Solution GMBH, Wil, SG, Switzerland) was inserted into the pharynx via the nasal passages and passed down into the trachea. The endoscope was then advanced into the lower airways via the right mainstem bronchus until it wedged against a distal bronchus. Sterile 0.9% NaCl (250 mL) was instilled through the endoscope channel using 60-mL syringes. The fluid was then re-aspirated and the endoscope pulled out. The syringes’ content was pooled in a cooled silicone-coated glass bottle. The BALF was then filtered through a 40-µm cell strainer (BD Falcon™, Biosciences, USA, cat.352340) and kept on ice until processing.
2.4 Cytology
Cytocentrifuge preparations of the BALF were prepared within 30 minutes following collection. Briefly, BALF was centrifuged at 600 rpm for 8 minutes in a cytocentrifuge (Tharmac Cellspin® I), and slides were subsequently stained with Wright-Giemsa stain (Hematek Stain Pak, Siemens Healthineers, Erlangen, Germany) on an automated slide stainer (Hematek 3000, Siemens Healthineers, Erlangen, Germany). The cell suspensions later obtained after sample thawing (sample used for scRNA-seq) were similarly processed. A manual differential cell count (macrophages, lymphocytes, neutrophils, eosinophils and mast cells) was performed on the cytocentrifuge preparations of the stained BALF and cell suspension using a minimum of 400 cells and 4 different microscopic fields at 1000x magnification with oil immersion.
2.5 ScRNA-seq
2.5.1 Cryopreservation
The protocol used to freeze and subsequently thaw the BALF cells was adapted from a 10X Genomics protocol (CG00039 Rev D) intended for human peripheral blood mononuclear cells (PBMCs). The detailed laboratory protocol can be found in the Supplementary material. Samples were kept on ice throughout the freezing protocol. Cell count and viability were determined with a Moxi GO II™ cell counter (Witec AG, Sursee, LU, Switzerland) using propidium iodide 5:1000. The BALF was initially centrifuged at 300 rcf for 5 minutes at 4°C and the supernatant was removed. Cells were resuspended in RPMI (Gibco™ RPMI 1640 cat. 11875093) containing 40% fetal bovine serum (Gibco™ FBS cat.16000044) and 1 U/µL RNAse inhibitor (Roche® Protector RNase Inhibitor) to achieve a concentration of 20x106 cells/mL. An equivalent volume of freezing medium was added to achieve a concentration of 10x106 cells/mL. The freezing medium consisted of RPMI (Gibco™ RPMI 1640 cat.11875093) with 30% dimethylsulfoxid (MP Biomedicals DMSO ≥99% cat.0219141880) and 40% fetal bovine serum (Gibco™ FBS cat.16000044) added. Cell suspension aliquots were dispensed into cryovials. The cryovials were placed into a pre-cooled cell freezing container (Corning™ CoolCell™ cat. 432005) at -80°C for 4 hours, before being transferred into a cryobox for storage at -80°C. The timespan between BALF collection and freezing was less than 2 hours for all samples.
2.5.2 Thawing and resuspension
Samples were stored at -80°C for 5 to 6 days before thawing and further processing for scRNA-seq. Cryovials (one 1-mL aliquot per horse) were rapidly thawed in a water bath at 37°C. Cells were resuspended 5 times by incremental 1:1 volume addition of complete growth medium, which consisted of RPMI (Gibco™ RPMI 1640 cat.11875093) with 10% fetal bovine serum (Gibco™ FBS cat.16000044). Cells were centrifuged at 300 rcf for 5 min at room temperature. The supernatant was removed except for 1 mL, in which the cells were resuspended. Complete growth medium was added to achieve a total volume of approximately 10 mL. The cell concentration and viability were determined as previously described. A volume of suspension containing 6x10⁵ cells was transferred into a new tube and centrifuged 5 min at 300 rcf at room temperature. The supernatant was removed and the cells were resuspended into 400 µL resuspension solution, which consisted of phosphate-buffered saline (Gibco™ DPBS cat.14190094) containing 0.04% bovine serum albumin (Invitrogen™ UltraPure™ BSA cat.AM2616) and 0.8 U/µL RNAse inhibitor (Roche® Protector RNase Inhibitor). The centrifugation step was repeated and the supernatant discarded. Resuspension solution was added with the goal of achieving a cell concentration between 700 and 1,200 cells/µL. Final cell concentration and viability were measured as described above. Cells were kept on ice until loading into the Chromium™ Controller (10X Genomics, Pleasanton, CA, USA). About 200 µL of the final cell suspension were used to prepare the cytospin slides (see section 2.4).
2.5.3 Single-cell cDNA library preparation and scRNA-seq
GEM generation & barcoding, reverse transcription, cDNA amplification and 3’ gene expression library generation steps were all performed according to the Chromium Next GEM Single Cell 3’ Reagent Kits v3 User Guide (10x Genomics CG000383 Rev C) with all stipulated 10x Genomics reagents. Nuclease-free water was added to the cell suspensions to reach a total volume of 46.6 µL each, for a targeted cell recovery of 5,000 cells (see details in Supplementary Table 1). GEM generation was followed by a GEM-reverse transcription incubation, a clean-up step and 12 cycles of cDNA amplification. The resulting cDNA was evaluated for quantity and quality using a Thermo Fisher Scientific Qubit 4.0 fluorometer with the Qubit dsDNA HS Assay Kit (Thermo Fisher Scientific, Q32851) and an Advanced Analytical Fragment Analyzer System using a Fragment Analyzer NGS Fragment Kit (Agilent, DNF-473), respectively. Thereafter, 3ʹ gene expression libraries were constructed using a sample index PCR step of 15 cycles. Later, using the same double stranded cDNA, dual indexed libraries were also constructed using a library preparation kit and dual Index kit TT Set (10x Genomics part numbers 1000190 and 300041, respectively). These new libraries were constructed due to the dual indexing upgrade and the upgrade in NovaSeq 6000 reagent kits from v1 to v1.5 and they were generated following the relevant parts of 10 x Genomics User Guide CG000315. The aim of this upgrade in library type was to ensure that this pilot study is more compatible with future data. Any generated cDNA libraries were tested for quantity and size using fluorometry and capillary electrophoresis as described above. The cDNA libraries were pooled and sequenced with a loading concentration of 300 pM, paired end and either single or dual indexed, on an Illumina NovaSeq 6000 sequencer using a shared NovaSeq 6000 S1 Reagent Kit v1.0 (100 cycles; Illumina, 20012865) or a S4 Reagent Kit v1.5 (200 cycles; Illumina, 20028313). The quality of the sequencing runs were assessed using Illumina Sequencing Analysis Viewer (Illumina version 2.4.7) and all base call files were demultiplexed and converted into FASTQ files using Illumina bcl2fastq conversion software v2.20. At least 50,000 reads/cell were generated for each sample. All steps were performed at the Next Generation Sequencing Platform, University of Bern.
2.6 Computational analysis
The workflow followed for the computational analysis is illustrated in Figure 2.
FIGURE 2
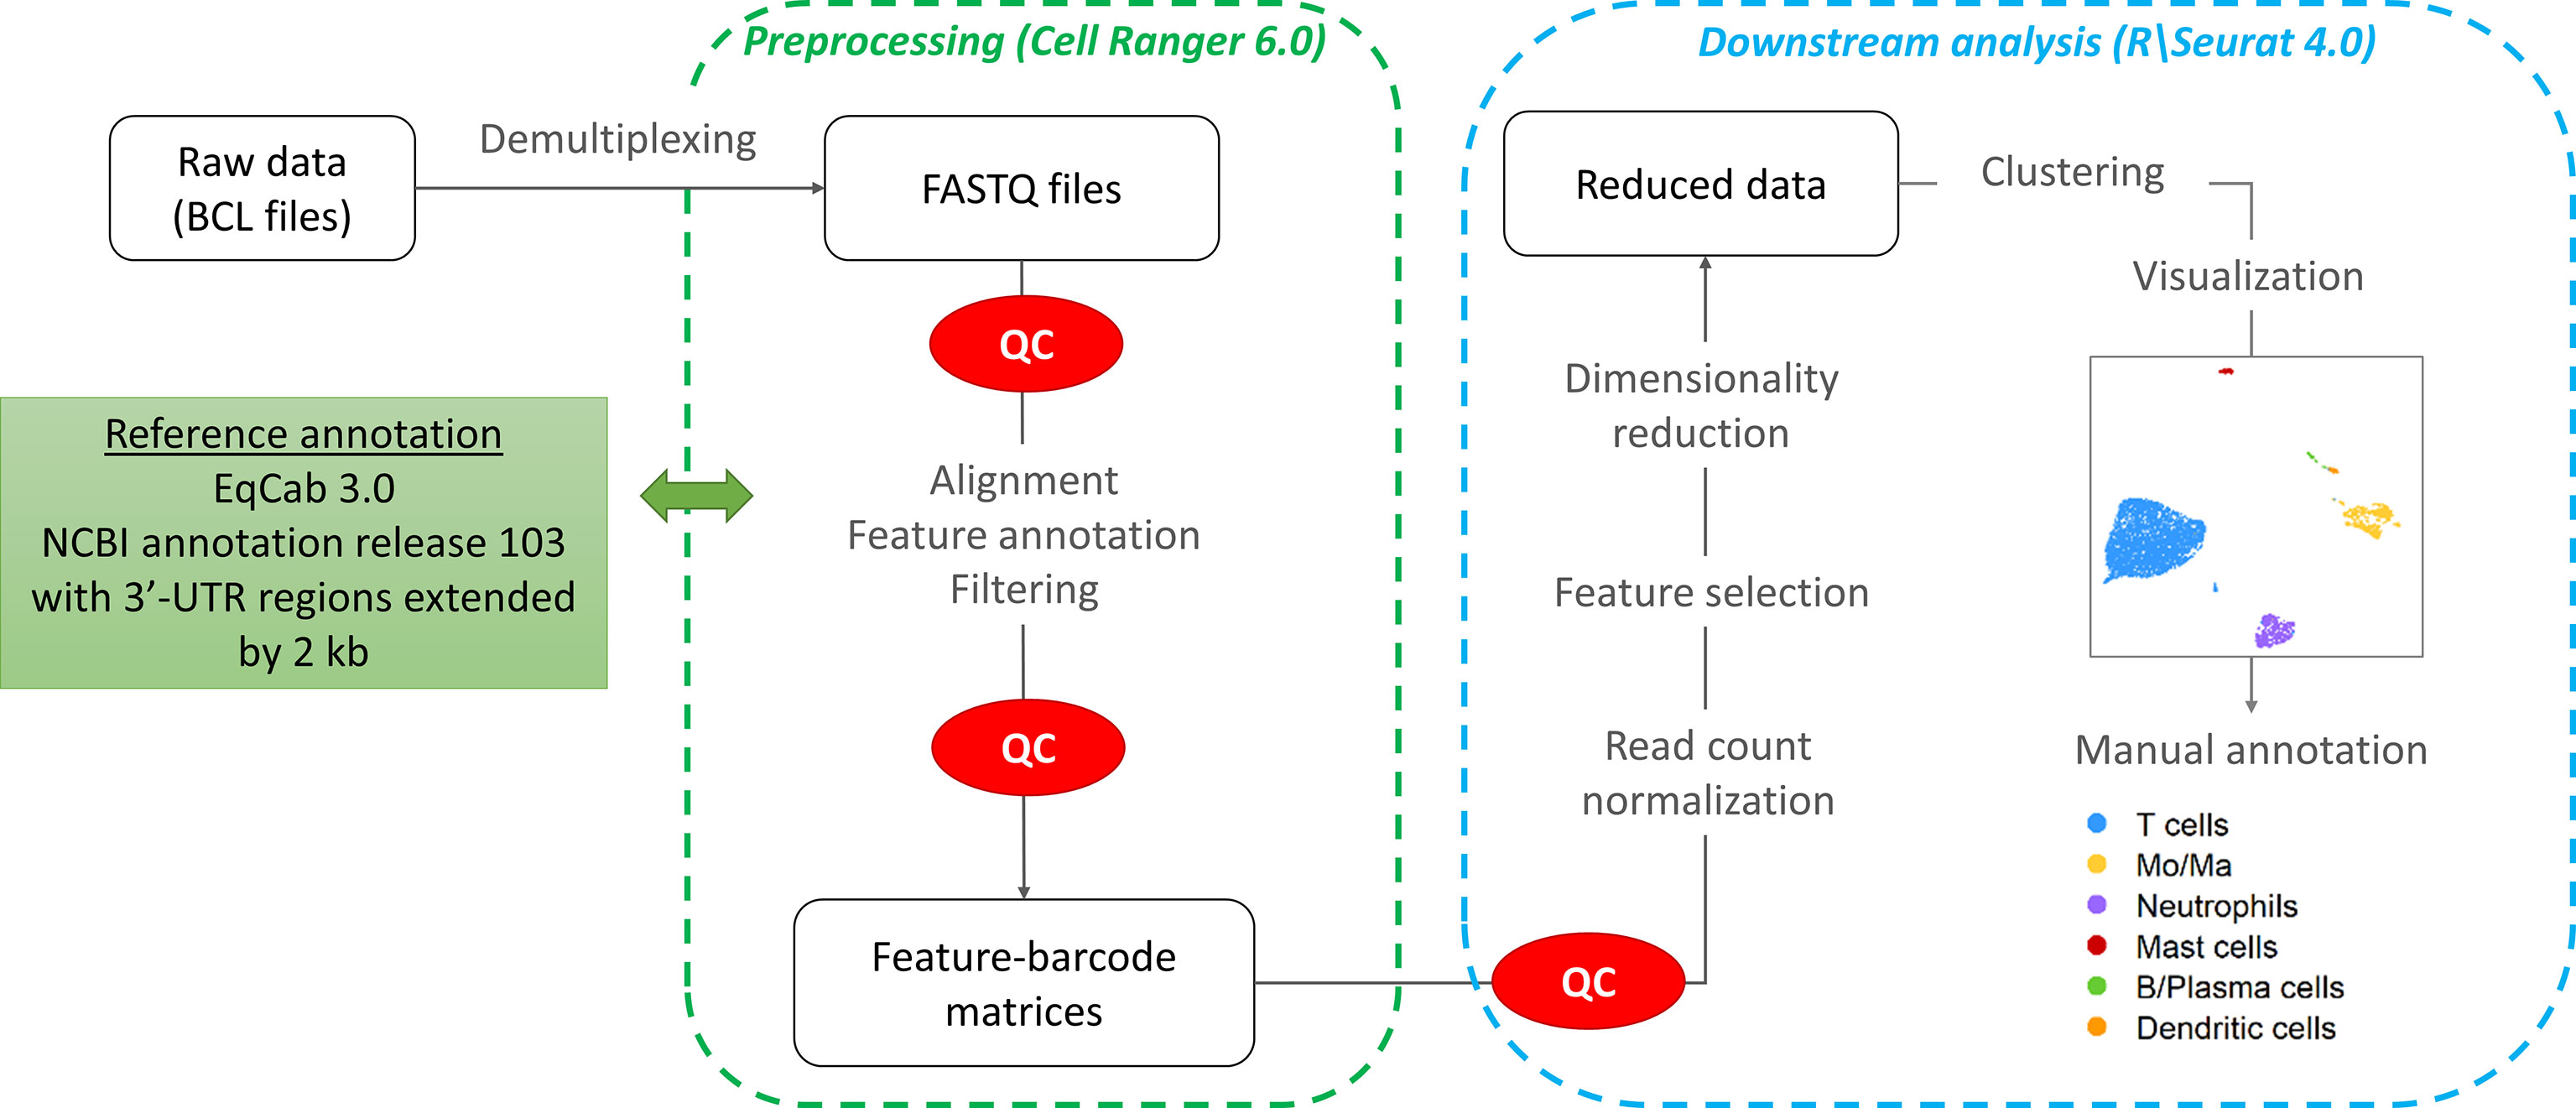
Figure 2 scRNA-seq data analysis workflow.
2.6.1 Pre-processing
Raw sequencing data (fastq files) were converted to a count matrix of gene expression values using the Cell Ranger (v6.0) standard workflow. The annotations for 3’-untranslated regions of the genes in the reference genome (Equus caballus NCBI annotation release 103) were extended by 2 kb using a custom Python script and manual curation. All transcripts were extended except when the extension overlapped a neighboring gene. The summary metrics of the detected cells are provided in Table 2.
TABLE 2
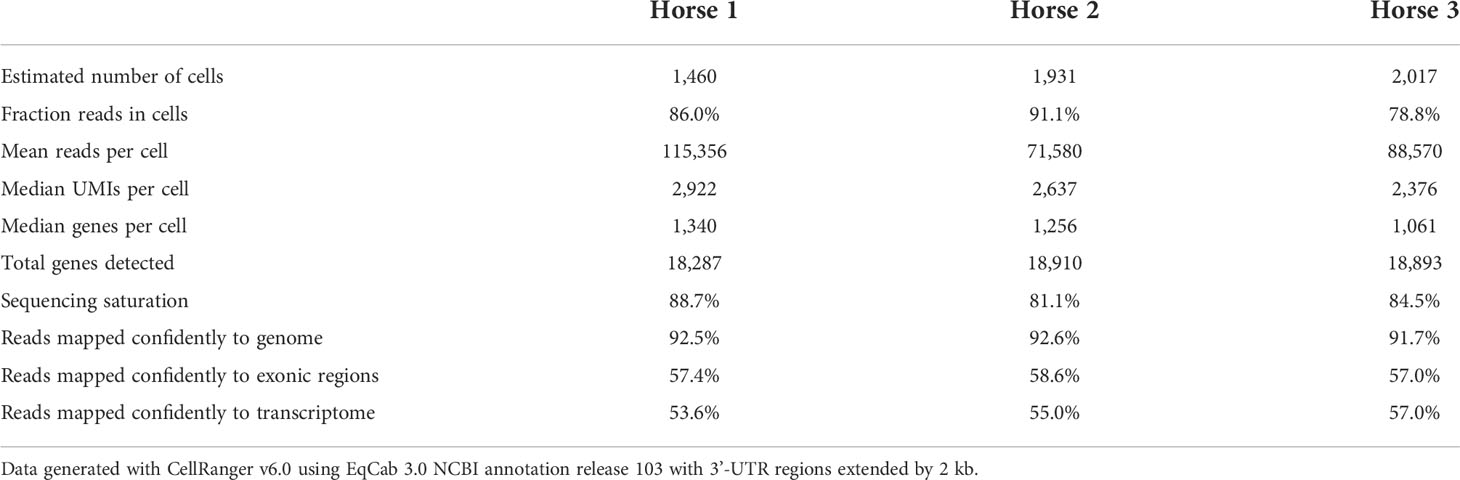
Table 2 Summary metrics of the detected cells for each sample.
2.6.2 Quality control and data normalization
Quality control and downstream analysis were carried out using the R software package Seurat (v4.0) (17). Based on visual data inspection, cells that contained less than 200 genes or more than 6,500 gene features and/or greater than 15% mitochondrial genes were filtered (Supplementary Figure 1). The raw data were normalized using global scale normalization.
2.6.3 Principal component analysis (PCA) and cell clustering
After variance stabilizing transformation, the 2,000 most variable features were selected for dimension reduction and clustering. Dimensionality reduction was conducted using Principal Component Analysis (PCA). The number of principal components (PCs) was chosen based on an elbow plot. Clustering was performed on the first 16 PCs using the default Louvain algorithm (“FindNeighbors” function in Seurat). The optimal clustering resolution was chosen by visualizing the granularity with the “clustree” R package. The “FindClusters” function (Seurat) was used with a clustering resolution of 1.0. The clusters were visualized with the Uniform Manifold Approximation and Projection method (UMAP). After data integration, cluster visualization was only marginally improved. Cluster membership remained the same, except for a very small proportion of cells (0.5%) which were assigned to Mo/Ma instead of DC. Hence we elected to perform the downstream analysis without integration to avoid introduction of bias due to non-linear data integration approaches (18).
In order to better distinguish cell subpopulations, we independently reanalyzed three of the major cell populations using the “subset” function in Seurat. All previous steps were repeated. We selected 13 PCs with a 1.2 clustering resolution for monocyte/macrophages, 11 PCs with a 0.5 clustering resolution for T cells, and 8 PCs with a 0.7 clustering resolution for B/plasma cells.
2.6.4 Cell cycle analysis
To investigate whether the cell cycle stage affected clustering, we used the “CellCycleScoring” function (Seurat package). Briefly, the lists of human markers for the G2M phase and the S phase (“cc.genes.updated.2019” from Seurat) were converted to their equine orthologs using the Biomart R package. Cells were divided into cycling (G2M phase) or resting (S phase) based on the score obtained.
2.6.5 Cell cluster annotation
The cell clusters were annotated based on the expression of canonical markers and subsequently merged into major cell types. Cell cluster annotation was confirmed by subjective analysis of the list of markers identified with the “FindAllMarkers” Seurat function, using an adjusted P-value <0.05 and an average log2 fold change > 0.25. Expression of specific cell type markers was visualized using the “DotPlot”, “VlnPlot” and “FeaturePlot” functions. Cell type specificity of the markers was evaluated based on the information provided on the Human Protein Atlas version 21.0 database1. To facilitate cell cluster annotation, expression scores for cell-specific group of genes were calculated using the Seurat function “AddModuleScore”. Gene expression scores of Mo/Ma 2, Mo/Ma 4 and T cells were compared using a Kruskall-Wallis test, with P-value < 0.05 considered statistically significant. The differentially expressed genes (DEGs) for each of the 16 clusters can be found in Supplementary Table 2.
3 Results
Three university-owned horses known to be affected by mild-to-moderate equine asthma were included. They were considered systemically healthy based on a complete physical examination. The diagnosis of mild-to-moderate equine asthma was confirmed based on the following three criteria: a Horse Owner Assessed Respiratory Signs Index (HOARSI) score of 3 (19, 20); BALF cytology values of >10% and <25% neutrophils, >5% mast cells or >5% eosinophils; absence of increased breathing effort at rest (12). The low clinical score and tracheal mucus score indicated that the horses were in clinical remission at the time of inclusion (16, 21). Key characteristics of the study population can be found in Tables 1, 3.
TABLE 3
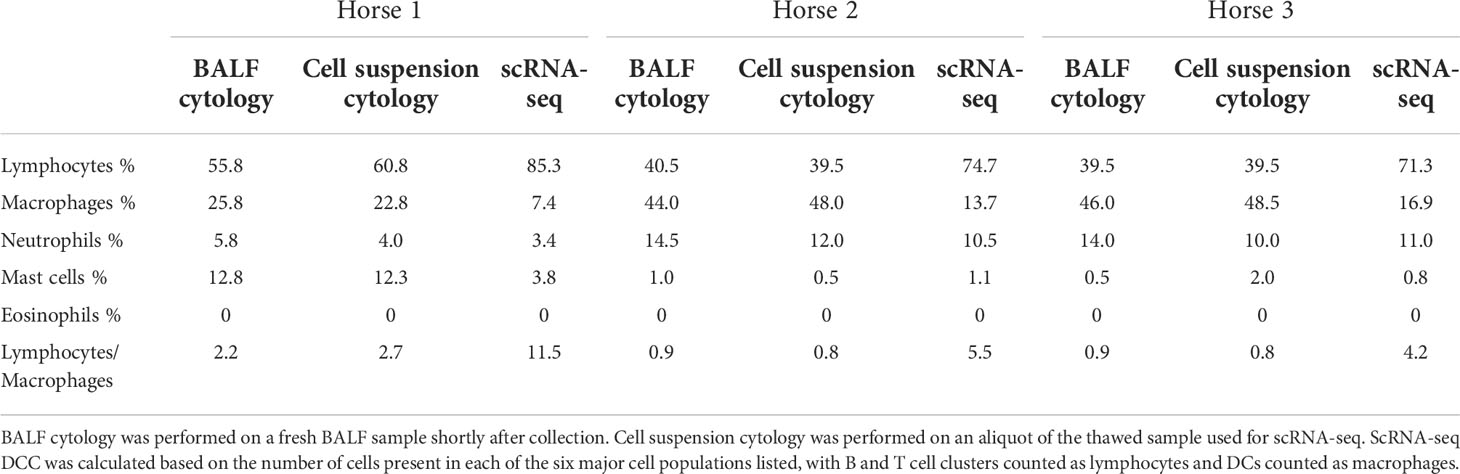
Table 3 Differential cell counts (DCC) obtained with conventional cytology and single-cell RNA sequencing (scRNA-seq).
A total of 5,408 cells were sequenced, of which 777 were filtered after quality control. Downstream analysis was thus performed on 4,631 cells. Unsupervised graph-based clustering produced 16 clusters, which were grouped into six major cell populations based on the expression of canonical markers (Figure 3). The differentially expressed genes (DEGs) for each of the 16 clusters can be found in (Supplementary Figure 2), Cells did not cluster based on the individual sample, therefore data integration was not performed. Clusters 7, 8, 9 and 15 expressing CD163 and CD68 were identified as monocytes/macrophages (Mo/Ma). Cluster 13 was annotated as dendritic cells (DCs) based on CD83 and CCR7 expression (22). These were most likely myeloid DCs, based on the upregulation of FSCN1, a gene not expressed in plasmacytoid DCs (23). Clusters 0, 1, 2, 3, 4, 5, 12 and 14 were annotated as T cells based on CD2, CD3D, CD3E and CD3G expression. Cluster 11 was annotated as B/Plasma cells based on MS4A1, CD79A and CD79B expression. Cluster 6 was annotated as neutrophils based on TG, RGS2, LILRA5 and CSF3R expression. Lastly, cluster 10 was identified as mast cells based on LTC4S, HPGDS, GCSAML and MS4A2 expression. Ribosomal protein (RP) genes were highly expressed in T cells and B/plasma cells (Supplementary Figure 2). After merging the clusters into these six major cell populations, the (DEGs) for each population were extracted (Supplementary Table 3). Analysis of these markers supported our annotations.
FIGURE 3
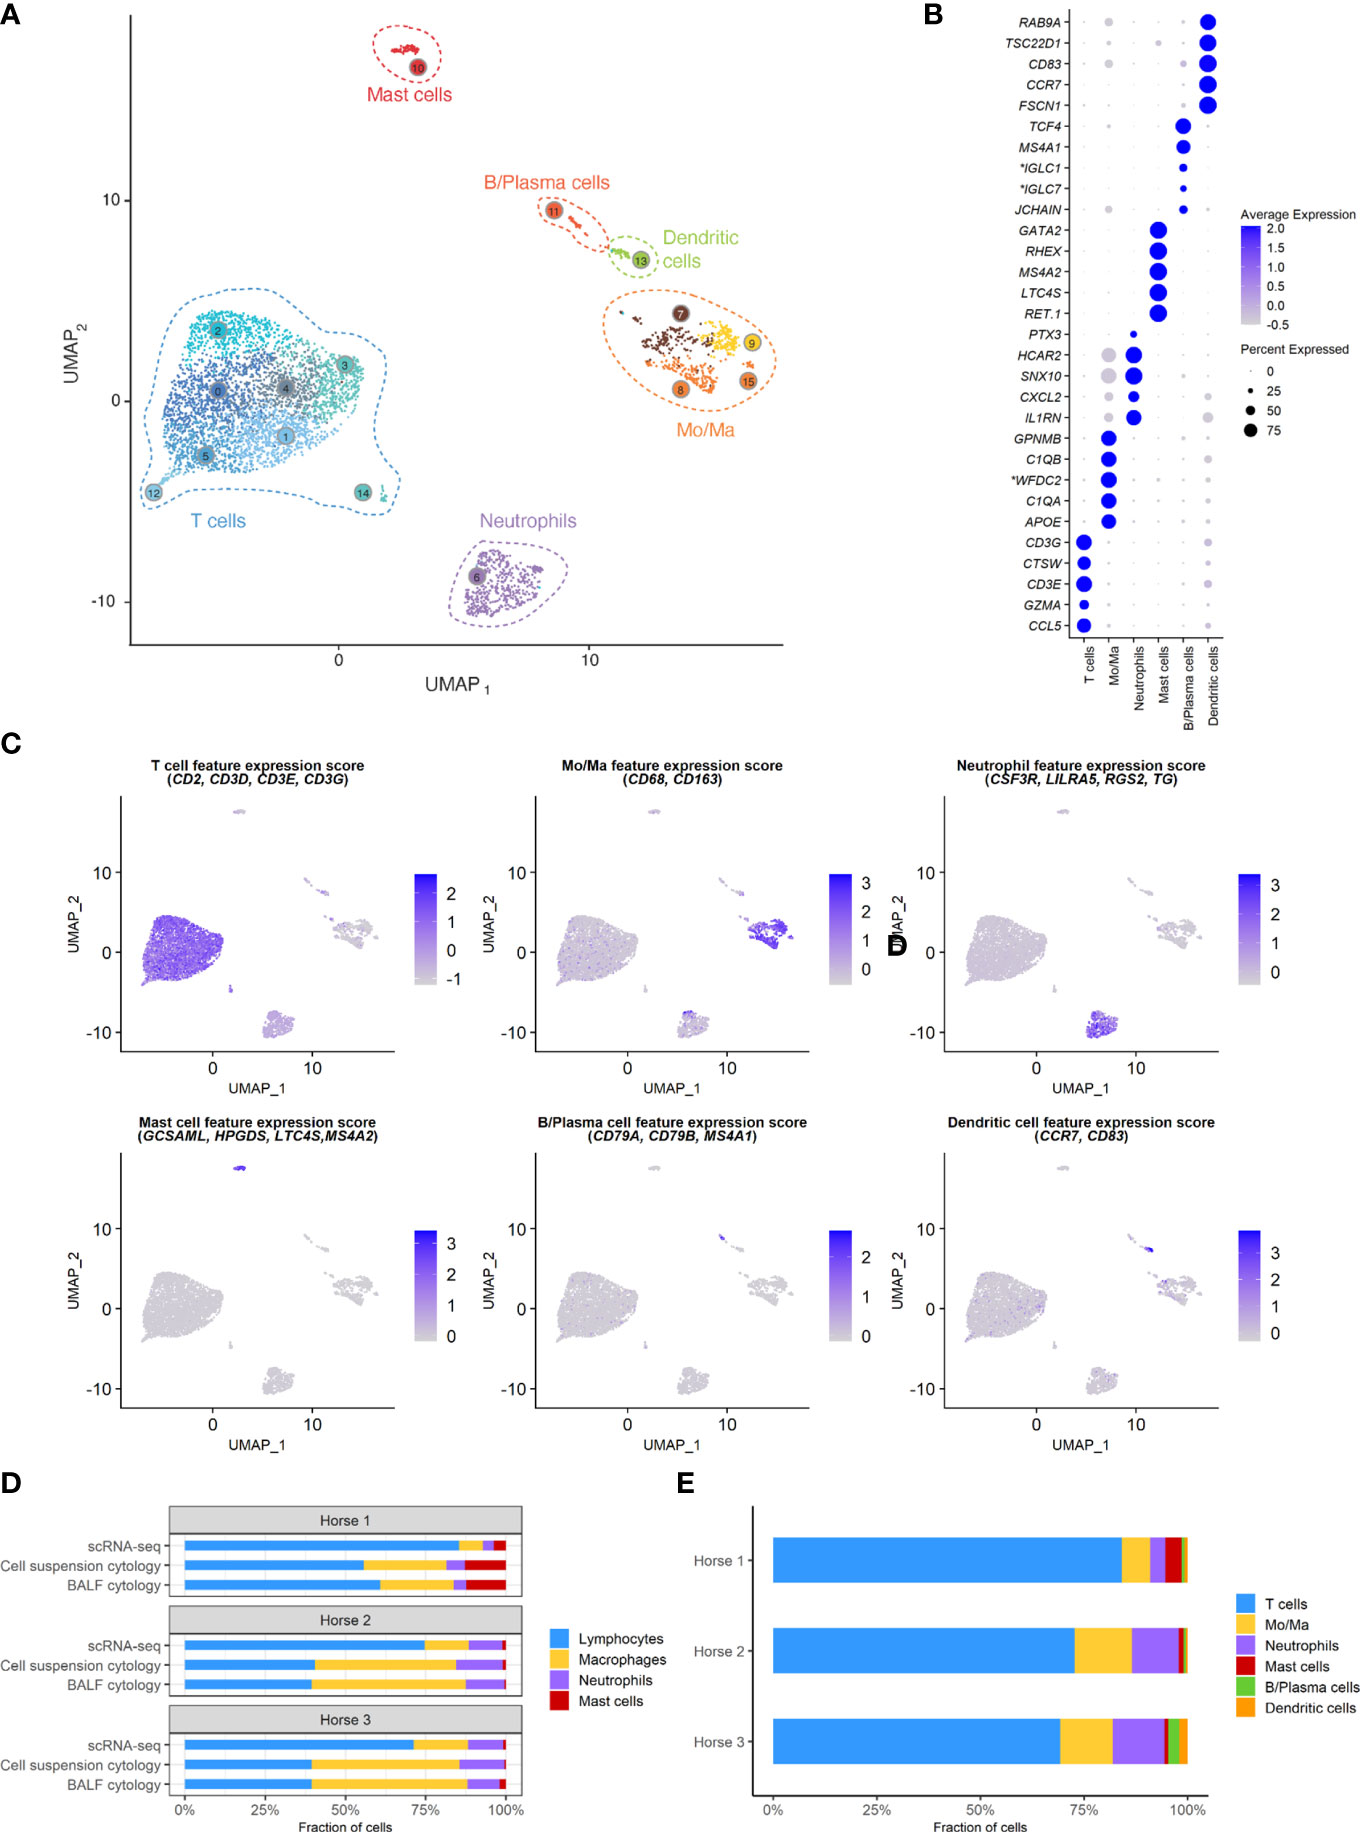
Figure 3 scRNA-seq analysis of 4,631 cryopreserved equine bronchoalveolar cells isolated from 3 horses. Mo/Ma, monocytes/macrophages. (A) The 16 clusters identified (indicated by numbers) are grouped into 6 major cell populations (UMAP visualization). (B) Dot plot of the 5 most upregulated genes in each major cell population. Dot size is proportional to the percentage of cells expressing the gene. Dot color intensity represents average gene expression. *Gene ID LOC102147726 annotated as Immunoglobulin Lambda-1 Light Chain (IGLC1), LOC100060608 as Immunoglobulin Lambda Constant 7 (IGLC7) and LOC102148710 as WAP four-disulfide core domain protein 2 (WFDC2) (NCBI EqCab3.0 v103). (C) Gene expression patterns used for cell type assignment. (D) Distributions of the major bronchoalveolar cell populations obtained with cytology on BALF, with cytology on the cell suspension (post cryopreservation) and with scRNA-seq on the cell suspension. T cells and B/plasma cells are counted as lymphocytes, while Mo/Ma and DCs are counted as macrophages. (E) Distribution of the major bronchoalveolar cell populations for each horse, based on scRNA-seq analysis.
3.1 Cell distribution
The distribution of the six major cell populations identified with scRNA-seq was similar for the three horses, except for an increased mast cell proportion in horse 1 (Figure 3E). Next, we inspected the distribution of the five cytologically distinguishable leukocyte types (macrophages, lymphocytes, neutrophils, eosinophils and mast cells). We considered that under light microscopy, T cells and B/plasma cells are counted as lymphocytes, while Mo/Ma and DCs are counted as macrophages. To assess the effect of sample processing and cryopreservation on differential cell counts (DCC), we first compared the cytological DCC performed on fresh BALF to the cytological DCC performed on the final cell suspension. The cell distribution was mostly unchanged, suggesting cryopreservation did not significantly affect DCC. Next, we compared the cytological DCC of the cell suspension to the DCC calculated with scRNA-seq. The lymphocyte/macrophage ratio was found to be markedly higher with scRNA-seq compared to cytology. The proportions of the other cell populations were similar (Figure 3D and Table 3).
3.2 Composition of the monocytes-macrophages population
The Mo/Ma subset was reanalyzed independently to better resolve putative cell subtypes. Unsupervised graph-based clustering identified seven distinct Mo/Ma clusters (Figure 4A). Some of the gene expression patterns used for cell subtype assignment are displayed in (Figure 4C). The five most upregulated genes in each cluster are shown in (Figure 4D). The DEGs list for each cluster can be found in (Supplementary Table 4). Mo/Ma 6 represented dead or dying cells, based on a low RNA and feature count (Supplementary Figure 3).
FIGURE 4
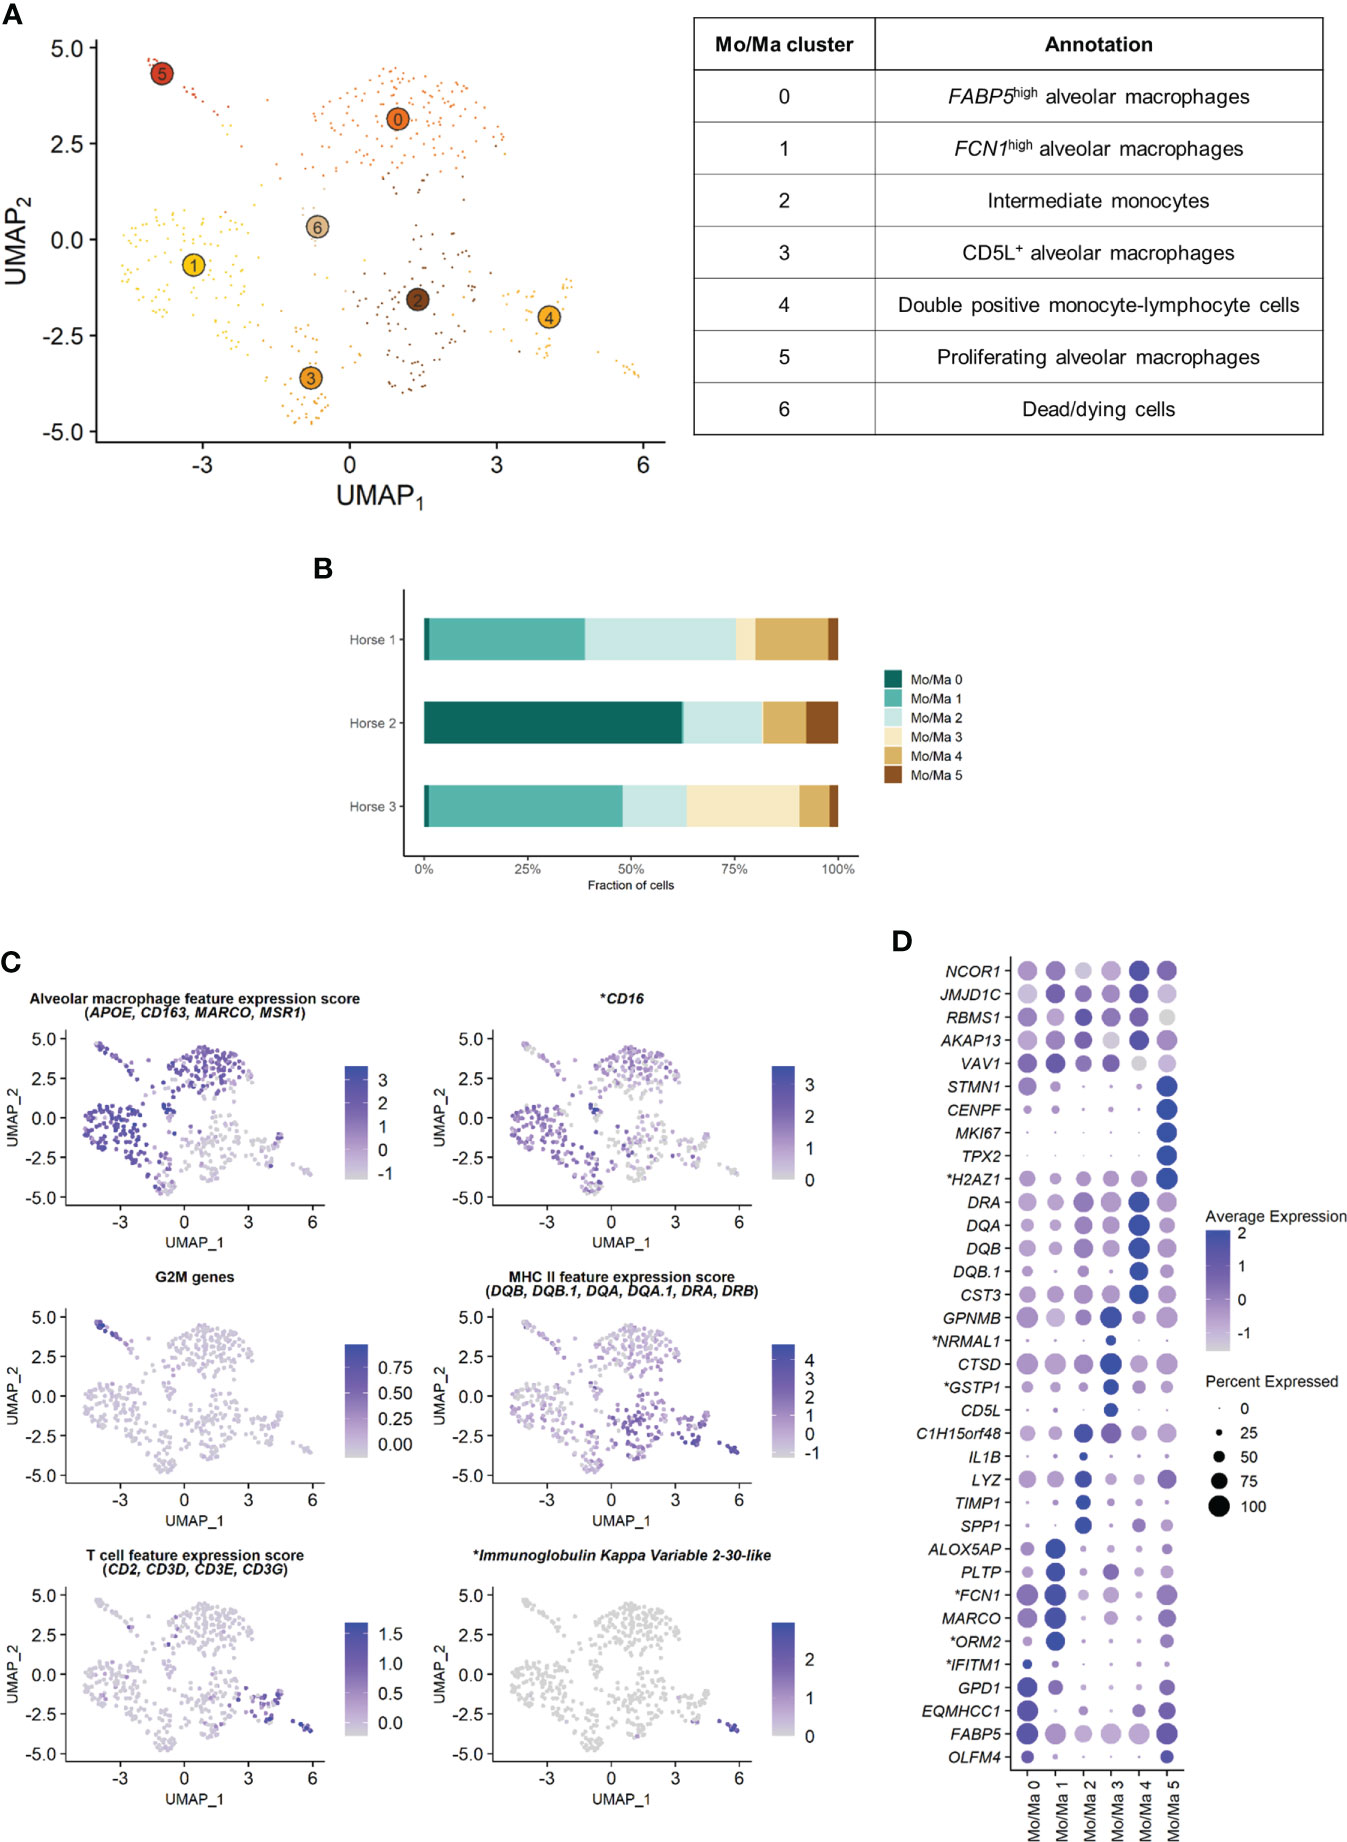
Figure 4 Independent analysis of the monocytes-macrophages (Mo/Ma) population (n=529 cells) (A) UMAP visualization of the 7 Mo/Ma clusters identified, with suggested cluster annotation. (B) Distribution of the Mo/Ma clusters for each horse, based on scRNA-seq analysis. (C) Gene expression patterns used for cell subtype assignment. *LOC100051526 annotated as CD16 (NCBI EqCab3.0 v103). (D) Dot plot of the 5 most upregulated genes in each cluster. Dot size is proportional to the percentage of cells expressing the gene. Dot color intensity represents average gene expression. Mo/Ma 6 (dead cells) is excluded. *LOC100146489 annotated as H2A.Z variant histone 1 (H2AZ1), LOC100067916 as NmrA like redox sensor 1 (NRMAL1), LOC100059533 as glutathione S-transferase pi 1 (GSTP1), LOC100069029 as ficolin 1 (FCN1), LOC100050560 as interferon induced transmembrane protein 1 (IFITM1) and LOC100050100 as orosomucoid 2 (ORM2) (NCBI EqCab3.0 v103).
3.2.1 Alveolar macrophages
Clusters Mo/Ma 0, Mo/Ma 1, Mo/Ma 3 and Mo/Ma 5 overexpressed the macrophage-specific markers MARCO, APOE, MSR1 and CD163, indicating that these cells were mature alveolar macrophages (AM). Mo/Ma 0 and Mo/Ma 1 had the highest expression levels for MARCO and APOE. These cells also overexpressed complement genes (e.g. C1QB, C4BPA, C1QC and C1QA), suggesting these were activated AMs (24).
Mo/Ma 0 overexpressed OLFM4, FAPB5 and ANXA2. This cell cluster was annotated as FABP5high AMs, in reference to the previously described FABP4high (25) or FABP4+ (4) AM populations.
Mo/Ma 1 expressed high levels of FCN1 and ORM2 (LOC100050100). Transcripts coding for lipid mediators (ALOX5AP, PLTP, LTA4H and APOE) were overrepresented. This cell cluster was annotated as FCN1high AMs in line with a previously published classification (4, 25).
Mo/Ma 3 had somewhat lower levels of AM specific markers compared to Mo/Ma 0 and Mo/Ma 1, perhaps indicating that this cell cluster was at an earlier differentiation stage. This cell cluster was characterized by upregulation of CD5L. Numerous anti-oxidant genes were also upregulated (e.g. FTH1/LOC111767398, GSTP1/LOC100059533, TXN, SOD2 and SRXN1). We detected upregulation of MARCKSL1, involved in macrophage migration (26). This cell cluster was annotated as CD5L+ AMs.
The expression profile of Mo/Ma 5 was dominated by mitosis-associated genes (e.g. CENPF, MKI67, TOP2A and TPX2). This cluster was therefore annotated as proliferating AMs (Figure 4C).
3.2.2 Monocytes
Mo/Ma 2 and Mo/Ma 4 showed an overall low expression of AM markers. In particular, APOE, MARCO, CD163 and complement genes were downregulated compared to the other Mo/Ma clusters. These cells were thus labeled as monocytes. Both Mo/Ma 2 and Mo/Ma 4 expressed high levels of MHCII-associated genes and downregulated CD16 (Figure 4C).
Mo/Ma 2 overexpressed genes associated with macrophage chemotaxis (SPP1 and CCL15) and cell migration (CD44, MMP9) (27–29). We hypothesized that these cells were blood-derived intermediate monocytes, analogous to the extravascular CD14+CD16- HLA-DRhigh monocytes described by Evren and colleagues (30). The human classical monocyte marker CD14 was not upregulated in Mo/Ma 2, but it was overall sparsely expressed in our dataset. We annotated Mo/Ma 2 as intermediate monocytes.
The monocytes Mo/Ma 4 upregulated PLAC8, considered a signature gene for patrolling monocytes (31). Most importantly, we detected a clear T cell signature in this cluster (CD2, CD3D, CD3E, CD3G, CD5 and CD7 expression) (Figure 4C). Mo/Ma 4 presented an expression profile “halfway” between Mo/Ma2 (intermediate monocytes) and T cells (Supplementary Figure 5). Several genes responsible for lymphocyte activation (e.g. CTSW, PTPRCAP and LTB) were also overexpressed. A subpopulation of Mo/Ma 4 overexpressed LOC100630729. This gene codes for the immunoglobulin kappa variable 2-30-like protein (Figure 4C) expressed in plasma cells. Mo/Ma 4 was annotated as double positive monocyte-lymphocyte cells.
After exclusion of the dead cells (Mo/Ma 6), monocytes (Mo/Ma 2 and Mo/Ma 4), AMs (Mo/Ma 0, Mo/Ma 1, Mo/Ma 3) and proliferating AMs (Mo/Ma 5) represented 30.9%, 64.4% and 4.7% of the Mo/Ma population. While the proportion of monocytes and proliferating AMs was fairly similar among the horses, the distribution of the three distinct AM populations showed a high interindividual variability (Figure 4B).
3.3 Composition of the T cell population
Independent reanalysis of the T cell population identified nine clusters (Figure 5A). Some of the gene expression patterns used for cell subtype assignment are displayed in (Figure 5C). The five most upregulated genes in each cluster are shown in (Figure 5D). The DEGs list for each cluster can be found in (Supplementary Table 5). T7 constituted dead or dying cells, based on a low RNA count and upregulation of mitochondrial genes (Supplementary Figure 3).
Clusters T1, T2 and T6 were CD4+ T cells (T helpers), as shown by upregulation of the CD4 gene and downregulation of the CD8a and CD8b genes. The remaining clusters T0, T3, T4 and T5 were CD8+ T cells (cytotoxic T cells) based on the upregulation of the CD8a and/or CD8b genes and the downregulation of the CD4 gene (Supplementary Figure 4). The tissue resident marker ITGAE was upregulated in the T cell clusters 0, 2, 3 and 6.
T1 represented naïve CD4+ T cells, based on the overexpression of TCF7 (32, 33). Transcripts coding for ribosomal proteins (RP) were overrepresented. Expression of RP genes was not correlated with the cell cycle state. Increased ribosome biogenesis could instead be explained by the high requirement for protein synthesis during cell differentiation in a naïve cell population as previously observed in stem cells (34).
T2 showed high levels of the tissue resident marker ITGAE (33) and the T helper marker CD40LG. Upregulation of DUSP1 and ANXA1 were consistent with antigen-experienced, activated T cells (35, 36). T2 was thus annotated as CD4+ tissue-resident memory (TRM) cells. Interestingly, the top differentially expressed gene was KLRF1, a cytotoxicity regulator whose expression is associated with exhaustion of human memory CD4+ T cells (37). RGS1, a marker of exhaustion in CD8+ T cells (38), was also upregulated in this cluster.
Cluster T6 overexpressed Treg cells canonical markers FOXP3, CTLA4 and IL2RA (33, 39) and key transcription factors FOXO1 (40), MAF (41, 42) and FOXP1 (43), as well as the Treg differentiation regulator CD27 (44). These cells were annotated as Treg cells.
The expression profiles of the CD8+ clusters T0 and T3 were very alike. Both overexpressed the tissue-resident marker ITGAE (33), the cytotoxicity effectors PRF1 and CTSW, the granzyme genes GZMA, GZMK and GZMH, and EOMES (45), suggesting they were TRM CD8+ T cells. One substantial difference between the two clusters was the upregulation of the IFN-stimulated genes IFI6 and IRF7 and other genes involved in antiviral response (PLAC8 and LY6E) in T0 (46, 47). These genes code for proteins involved in response to viral infection and are upregulated in activated T cells. The chemokines CCL4 and CCL5, secreted by pathogen-specific effector T cells (48), were also upregulated. We consequently annotated T0 as activated CD8+ TRM. On the other hand, T3 was characterized by overexpression of tissue-intrinsic genes participating in cytoskeletal structure (VIM, TUBA1A) and modulation (S100A4, ANXA2, EZR), cell-cell or cell-matrix interactions (LGALS1, LGALS3), and membrane scaffolding (ITM2B) (33). Additionally, RP genes were downregulated in this cluster, suggesting it was composed of fully differentiated, tissue-adapted cells (49). The DEGs for T3 included PRF1, NKG7, HOPX, LAG3 and CCL4 (33), as well as MHCII-associated genes, consistent with activated T cells. We suspected that T3 represented CD8+ terminally differentiated effector cells (TEMRA) based on the upregulation of PTPRC (CD45). However, PTPRC average expression was overall low in the cluster and, in absence of PTRPC isoform data in horses, this annotation could not be ascertained. T3 was therefore annotated as MHCIIhigh CD8+ TRM cells.
The ubiquitous expression of the T cell markers CD2, CD3 and NCAM1 indicated that our dataset did not contain true NK cells. However, T4 still demonstrated NK-specific features. Top upregulated genes included genes from the NKG2 family (KLRC1, KLRK1) and the related KLRD1, CD160 and NKG7 genes, all associated with NK function (Figures 5C, D). TYROBP was also overexpressed, in accordance with previous description of human peripheral NKT cells (50). We thus annotated T4 as NKT cells (CD1d-restricted invariant natural killer T cells).
FIGURE 5
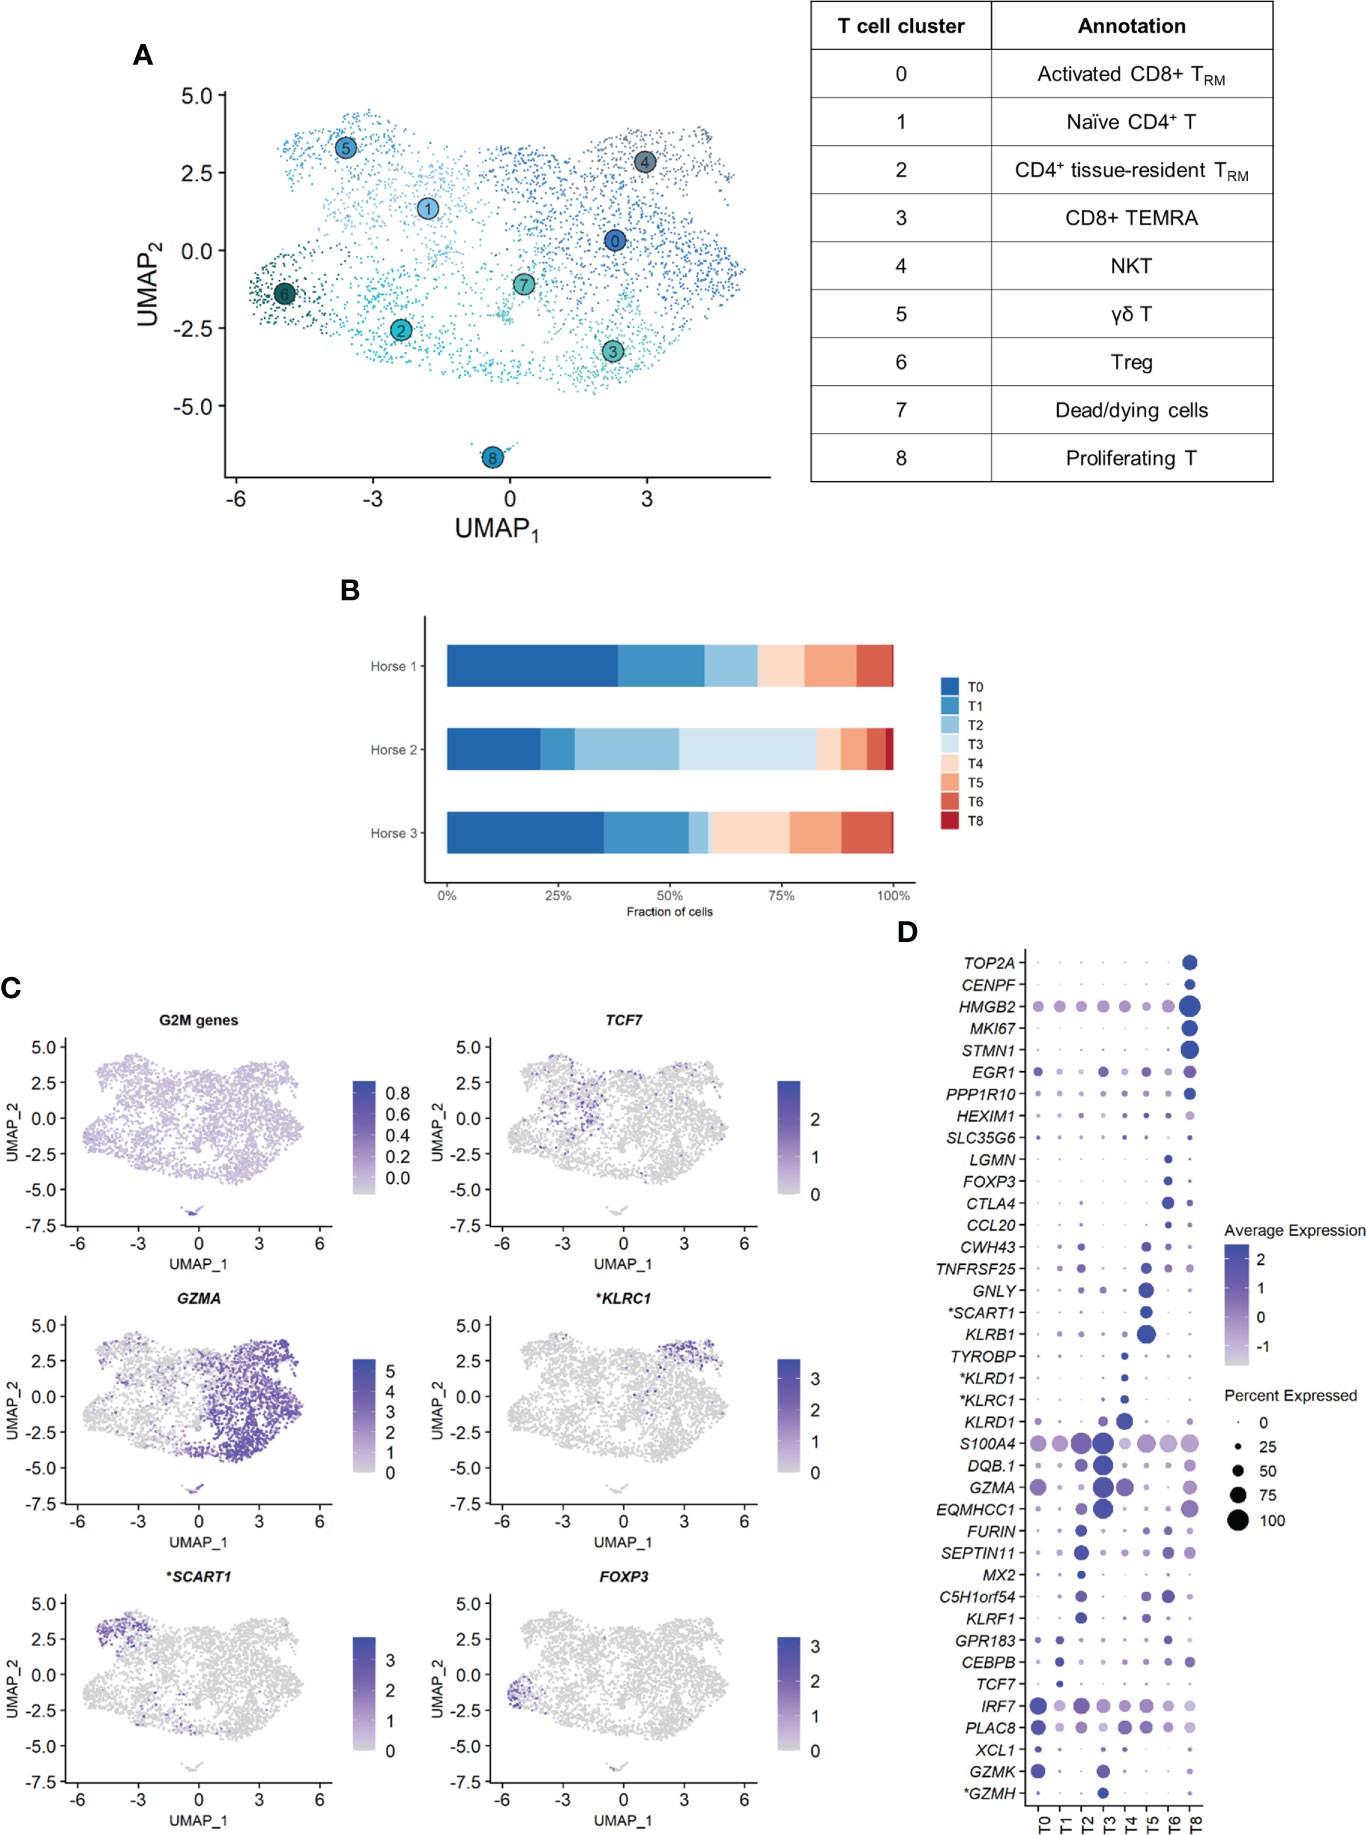
Figure 5 Independent analysis of the T cell population (n=3,465 cells) (A) UMAP visualization of the 9 T cell clusters identified, with suggested cluster annotation. TRM, tissue-resident memory. (B) Distribution of the T cell clusters for each horse, based on scRNA-seq analysis. (C) Gene expression patterns used for cell subtype assignment. *LOC100062846 annotated as killer cell lectin like receptor C1 (KLRC1), LOC100066851 as scavenger receptor family member expressed on T cells 1 (SCART1) (NCBI EqCab3.0 v103). (D) Dot plot of the 5 most upregulated genes in each cluster (one ribosomal RNA gene and two ribosomal protein genes removed). Dot size is proportional to the percentage of cells expressing the gene. Dot color intensity represents average gene expression. T7 (dead cells) is excluded. *LOC100066851 annotated as SCART1, LOC101910264 as killer cell lectin like receptor D1 (KLRD1), both LOC100062823 and LOC100062846 as KLRC1, both LOC100051986 and LOC100147522 as granzyme H (GZMH) (NCBI EqCab3.0 v103).
Cluster T5 was annotated as γδ T cells. The second most strongly upregulated gene in this cluster was LOC100066851, coding for a SCART1-like protein (Figures 5C, D). SCARTs are surface receptors found primarily on γδ T cells (51, 52). This cluster shared many DEGs with the equine PBMC cluster annotated as γδ T cells by Patel and colleagues (53). Of note, our BALF γδ T cells also overexpressed genes associated with cytotoxicity such as KLRB1, GNLY or KLRF1.
Cluster T8 was annotated as proliferating T cells based on the high levels of mitosis marker (e.g. CENP, HMGB2, TOP2A) and other markers of cell proliferation such as MKI67 (Figures 5C, D). This cluster comprised both CD4+CD8- and CD4-CD8+ T cells.
The distribution of the nine T cell clusters was comparable in horses 1 and 3. Horse 2 presented a higher proportion of CD4+ TRM (T2), MHCIIhigh CD8+ TRM (T3, most markedly), and proliferating T cells (T8) (Figure 5B).
3.4 Composition of the B/plasma cell population
Independent analysis of the B/plasma cell population revealed two distinct cell clusters: B/plasma cell 0 and B/plasma cell 1 and B/plasma cell 1 (Figure 6A). Some of the gene expression patterns used for cell subtype assignment are displayed in (Figure 6C). The DEGs list for each cluster can be found in (Supplementary Table 6). B/plasma 1 overexpressed several genes associated with humoral response, some of which being upregulated in equine blood antibody-secreting B cells (DERL3, HSP90B1, PPIB and SSR3) (53). JCHAIN, coding for the joining chain of multimeric IgA and IgM, was also overexpressed. B/plasma 1 was thus annotated as plasma cells. On the other hand, B/plasma 0 was characterized by high expression of the canonical B lymphocyte markers CCR1, CD74, BANK1, MS4A1 and CD79B. This cluster was annotated as B cells. The two top upregulated genes for B cells were the MHC class II components DRB (ortholog of human HLA-DRB1) and CD74. MHCII expression is lost during differentiation to plasma cells, further supporting our annotation (54). The relative distribution of B and plasma cells differed between horses, with no plasma cells detected in horse 2 (Figure 6B).
FIGURE 6
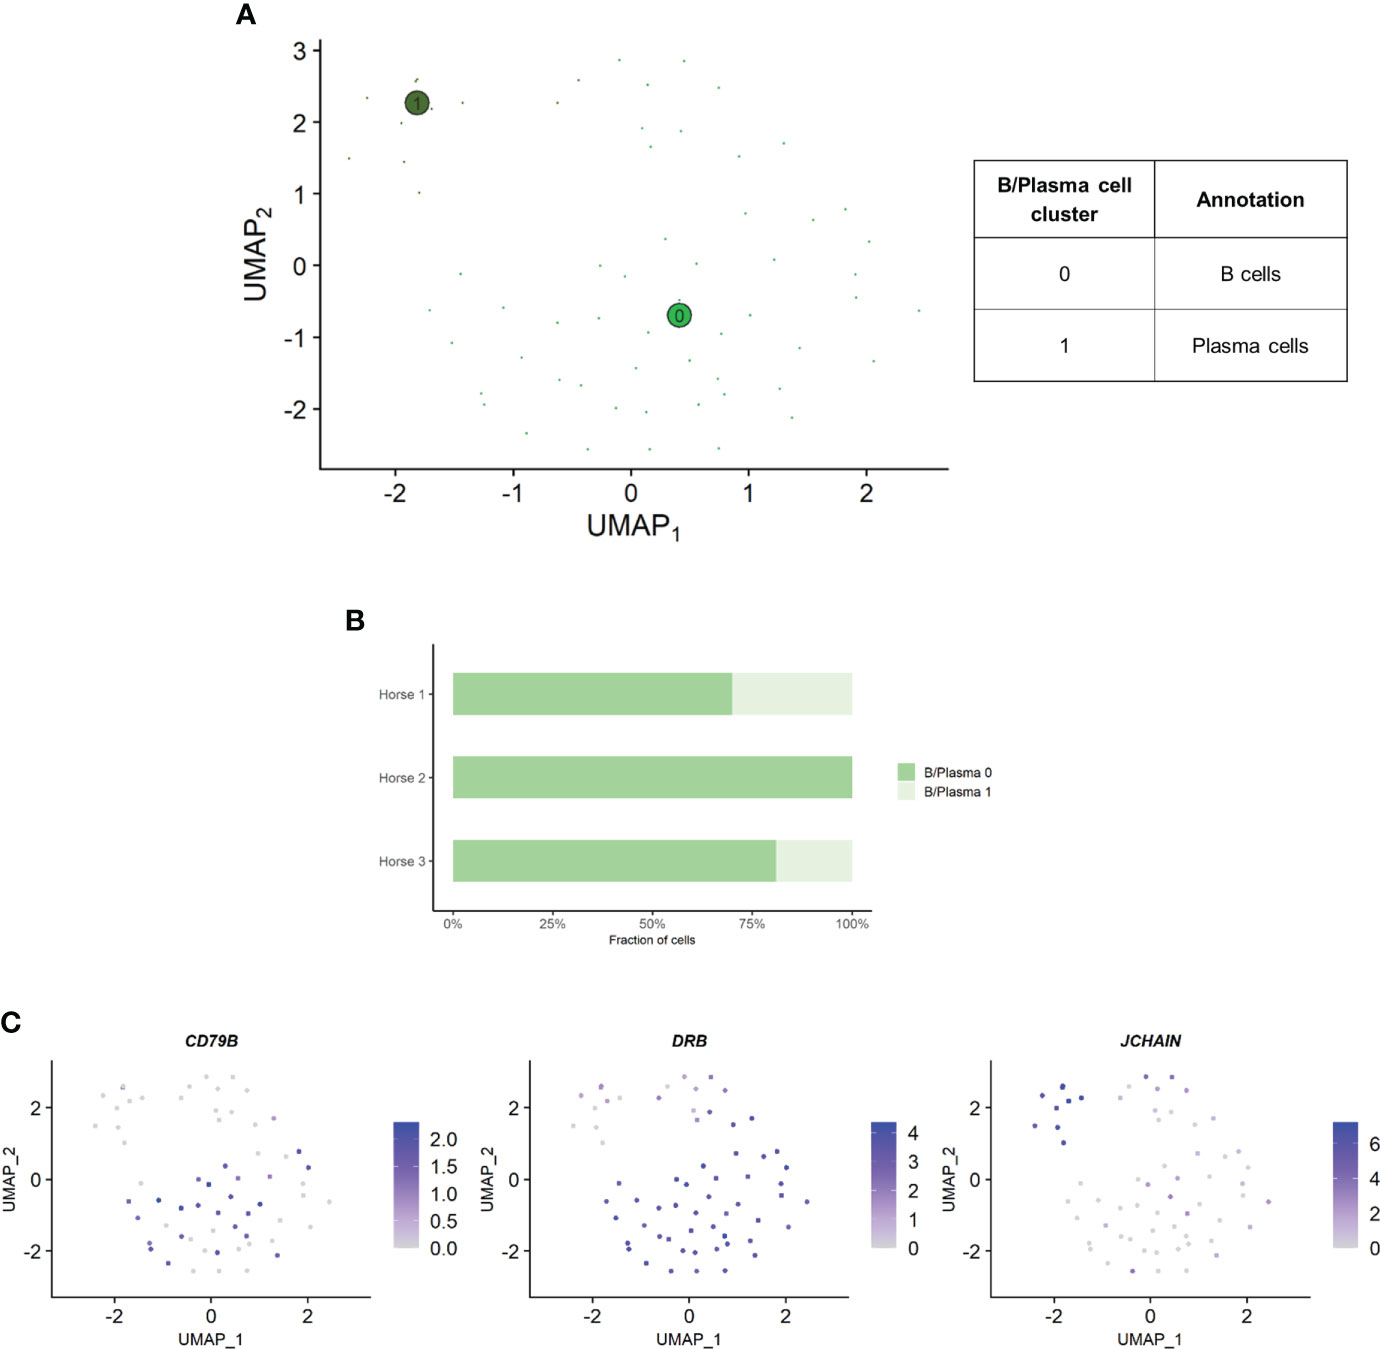
Figure 6 Independent analysis of the B/plasma cell population (n=62 cells) (A) UMAP visualization of the two B/plasma cell clusters identified, with suggested cluster annotation. (B) Distribution of the B/plasma cell clusters for each horse, based on scRNA-seq analysis. (C) Gene expression patterns used for cell subtype assignment. *LOC100147624 annotated as derlin 3 (DERL3) (NCBI EqCab3.0 v103).
4 Discussion
Our proof of concept single-cell analysis of equine bronchoalveolar cells allowed the identification of the major immune cell populations present in the BALF of adult horses without the need for conventional microscopic cytology or labeled antibodies. We were able to distinguish transcriptionally distinct Mo/Ma and T cell subpopulations relevant for the characterization of different types of immune responses. An unexpected but important finding was the presence of cells or cell pairs expressing both lymphocyte and monocyte markers.
To the best of our knowledge, this is the first scRNA-seq experiment on cryopreserved BALF cells, not only in horses but in any species. We successfully demonstrated that equine bronchoalveolar cells can undergo cryopreservation at -80°C before scRNA-seq. We were able to detect most of the major immune cell types present in equine BALF, with the exception of eosinophils. This was most likely due to their absence or sparsity in the samples, since they were not found on the cytological preparations either. Of note, we found a significant proportion of neutrophils, cells that are notoriously difficult to detect with scRNA-seq due to their high RNAse content. The addition of RNAse inhibitor during sample processing may have prevented RNA degradation. Detection and correct identification of granulocyte types is important for the characterization of equine asthma phenotypes, highlighting the potential of scRNA-seq to investigate this disease.
The major cell populations were identified with a high level of confidence through the analysis of canonical markers and inspection of the top DEGs for each cluster. The analysis of the cell subtypes was more difficult, with their annotation being subject to interpretation. Automated annotation using SingleR with three different reference datasets [the Human Primary Cell Atlas, a human lung cell scRNA-seq dataset (55) and a ferret BALF cell dataset (14)] did not improve the annotation of cell subtypes (data not shown). ScRNA-seq experiments have introduced unprecedented levels of complexity to the classification of cells, challenging the traditional definition of a cell type. Cell types can be defined with various criteria, including their phenotypes, lineages and states (56). Microscopy can only identify a few cell populations based on their morphologic features. On the other hand, use of labeled antibody techniques allow the exploration of cell types at a much higher resolution. These methods, however, rely on the presence or absence of a cell surface marker, shaping our definition of what is a cell type. Additionally, the range of cell types that can be identified in horses is hampered by the limited pool of available equine-specific antibodies. With scRNA-seq, we can appreciate various degrees of expression of a plethora of marker genes, blurring the lines between transcriptionally similar cell populations. The different layers formed by the lineage origin, the differentiation stage, or the activation state can be difficult to untangle. The interesting concept of a cell periodic table was recently proposed (57). Such a table could reconciliate the various strati detected with single-cell analysis to redefine cell types and states. Our dataset could contribute to the assembly of such a periodic cell type table for horses. It will also aid in the construction of an equine lung atlas, similar to the human lung atlas initiative2.
We observed a marked discrepancy of the lymphocyte/macrophage ratio between cytology and scRNA-seq. This resulted from differences between the techniques used for counting, since the cytological DCCs before and after sample cryopreservation were comparable. We analyzed the data provided by Fastrès et al. and noticed that the scRNA-seq analysis of healthy dogs’ BALF cells was similarly biased toward a higher lymphocyte count compared to cytology (15). The lymphocyte/macrophage ratio was five times higher with scRNA-seq, akin to our findings. The droplet-based sequencing method could theoretically bias the observed cell distribution through preferential selection of smaller cells. To our knowledge, this has never been reported in immune cells. Another potential explanation for the lower macrophage proportion is the high production of RNAses by granulocytes, leading to greater mRNA degradation and thus lower transcript recovery (58). In such cases however, we would have expected no or low detection of neutrophils and mast cells with scRNA-seq. An alternative and more plausible hypothesis is that conventional cytological DCC diverges stronger from the biological reality than the scRNA-seq based classification. Studies comparing flow cytometry with manual counting have revealed that conventional cytology led to lymphocyte count underestimation (59) or macrophage count overestimation (60). Explanations put forward were the limited number of cells counted under light microscopy, inaccurate classification due to apoptotic changes and uneven cellular distribution on cytological preparations. Indeed, cytocentrifugation tends to propel the lymphocytes to the margins of cytological slides, leading to their underestimation during manual counting (61). Furthermore, in our experience, single epithelial cells can be mistaken for macrophages in light microscopy, potentially leading to an overestimation of the latter in the DCC. In summary, the lymphocyte/macrophage ratio in our cell population was markedly higher with scRNA-seq compared to cytology. Whether scRNA-seq or cytological cell distribution best reflects the biological reality remains to be determined. Since current guidelines to characterize lower airway inflammation in horses are based on cytological DCC (12), we recommend that cell distribution is concomitantly assessed via conventional cytology when performing scRNA-seq on equine BALF cells.
Independent analysis of the Mo/Ma cluster enabled a clear distinction between monocytes and AMs based on the expression of a selection of macrophage-specific genes. Previous scRNA-seq studies on BALF from other species (14, 55) and on equine peripheral blood (53) used CD14 to identify monocytes. The expression of this canonical marker was barely detectable in our dataset, similar to previous observations in dog BALF (62). Yet, equine BALF monocytes have been described as CD14+ cells based on flow cytometric data (63). We suspect that CD14 expression was blunted by the higher expression of other genes in our cell population. The major DEGs for the three distinct quiescent AM clusters (Mo/Ma 0, 1 and 3) were mostly associated with regulation of inflammation.Cluster Mo/Ma 0 (FABP5high AMs) overexpressed OLFM4, FAPB5 and ANXA2. OLFM4, a marker of severe lung disease, may be involved in the inflammatory response regulation (64, 65). FABP5 has anti-inflammatory properties in allergic lung inflammation (66). ANXA2 negatively regulates TLR4-triggered inflammatory responses, thus preventing excessive inflammation (67). Moreover, the myeloid cell-derived proteins S100A8 and S100A9, involved in lung protective mechanisms (68), were also upregulated in this cluster. The concurrent downregulation of MHCII-related genes in Mo/Ma 0 further supports an anti-inflammatory phenotype (69). Cluster Mo/Ma 1 (FCN1high AMs) was characterized by upregulation of the FCN1 gene coding for ficolin 1, a pattern-recognition receptor involved in innate immunity. This cluster also expressed high levels of ORM2 (LOC100050100), an acute-phase protein preventing inflammation in adipose and neural tissue (70, 71). Mo/Ma 3 (CD5L+ AMs) had somewhat lower levels of AM specific markers compared to Mo/Ma 0 and Mo/Ma 1, perhaps indicating that this cell cluster was at an earlier differentiation stage. We detected upregulation of MARCKSL1, which plays a crucial role in macrophage migration (26). Mo/Ma 3 could thus represent recently migrated AMs. This cell cluster also overexpressed CD5L, which promotes M2 macrophage polarization (72, 73). However, none of the clusters displayed a clear M1 or M2 phenotype. AM phenotypes deviating from the classic M1 or M2 phenotypes have already been identified with flow cytometry (74) and RNA-sequencing (75). It has been suggested that M1 and M2 actually represent extremes of a polarization state continuum, rather than stable phenotypes (76, 77). Similar to our findings, previous BALF scRNA-seq studies on ferrets (14) and dogs (15, 62) detected transcriptionally distinct AM clusters. These may represent discrete cell subtypes or different activation states of the same cell type.
We annotated Mo/Ma 2 as intermediate monocytes in reference to a recently published developmental map of human lung macrophages (30). In this study, HLA-DRhigh CD14+CD16- monocytes egressing from peripheral blood were shown to be AM precursors. Until recently, it was assumed that the pool of AMs was mostly maintained through local self-renewal, with minimal contribution of blood-derived monocytes [reviewed in (78)]. While initial studies were performed in mice, latter work in healthy humans suggests that human AMs are mostly derived from circulating monocytes (78). This discrepancy could stem from the constant exposure of humans to inhaled antigens, in contrast to the germ-free environment of laboratory mice (78). Our findings support the idea that equine AMs mostly arise from the differentiation of peripherally-derived monocytes, similar to what is described in humans. This may reflect a constant renewal of AMs to adapt the lung immune response to the dynamic antigenic load and to the non-specific irritants horses are exposed to via the inhalation route in their typical stable environments (12). Single-cell analysis of lung cells collected at sequential developmental stages in the horse may definitely elucidate the origin of equine AMs.
Cluster Mo/Ma 4 stood out by the co-expression of lymphocyte and monocyte markers. Similar double positive cells were detected in three other BALF scRNA-seq studies (4, 30, 62). This was attributed to either ambient RNA contamination (30, 62) or to doublet formation (4). We considered several different hypotheses to explain this unusual expression pattern, including engulfing macrophages, a novel dual lineage cell population, technical multiplets (capture of several cells in a single droplet) and immune cell complexes. The engulfing macrophages hypothesis was not convincing. First, we assume these cells are monocytes based on downregulated macrophage-specific genes, including those required for phagocytosis (e.g. CD163) (79). Second, we did not detect markers specific for neutrophils, the cells that are most likely to be phagocytosed by macrophages (80). While the presence of a novel dual lineage cell population expressing both lymphocyte and monocyte markers cannot be definitely dismissed, it seems unlikely that several flow cytometry-based studies on equine BALF (59, 63, 81, 82) would have failed to detect them. Lymphocytes and monocytes originate from separate cell lineages, namely lymphoid and myeloid. A new dual lineage cell type would thus call into question our current understanding of cell ontology. Mo/Ma 4 could represent technical doublets and/or multiplets. However, this does not explain why only lymphocytes and monocytes signatures are combined, and not signatures for other cell types. Indeed, encapsulation of two or more cells within a droplet during libraries generation should be random. Therefore we propose that the Mo/Ma 4 cluster represents mostly monocyte-T cell complexes, as recently described in human peripheral blood (83, 84). We hypothesize that the Mo/Ma 4 subset overexpressing the Igκ-like protein gene corresponds to monocyte-B cell complexes. Immunological stimuli such as immunization or disease affect the frequency and the phenotype of immune cell complexes (83). Studying their formation and specificity may help unveil the underlying mechanisms of specific equine respiratory conditions such as equine asthma. To determine whether monocyte-lymphocyte complexes are truly present in equine BALF, we suggest combining scRNA-seq with imaging flow cytometry.
We found the annotation of T cell subsets challenging. Similarly to Patel and colleagues working with equine PBMCs (53), we could not identify the Th1, Th2 and Th17 phenotypes, as their specific chemokines were only sparsely expressed in our dataset. Assigning a cell identity to CD8+ clusters was also difficult, probably because gene expression changes in a linear fashion throughout differentiation (45, 85). Further single-cell studies and replication experiments should help to better delineate the transcriptional signatures of the different T cell populations. We annotated one of the T cell cluster as NKT cells. The existence of NKT cells in horses was already reported (86, 87). While NKT cells are well characterized in humans and mice, their transcriptional signature and pattern of surface receptors remain to be defined in horses. A cell cluster with an expression profile similar to our NKT cell population was detected using scRNA-seq on equine PBMCs, but was annotated as NK cells despite being CD3+ (53).Genes coding for RP were overexpressed in the two lymphocyte cell populations (T and B/plasma cells), a common observation in scRNA-seq of lymphocytes. This is likely a consequence of minimal transcriptional activity of most other genes, resulting in an apparent relative increase of abundantly expressed transcripts, such as those encoding RP. This could also reflect the high translational activity required for the cell types respective function, such as cytokine or antibody production (88–90). Even though the DEG list of some T cell clusters were dominated by RP genes, filtering them did not significantly affect cell clustering (data not shown). Moreover, we found that the differential expression of RP genes between T cell clusters corroborated our cluster annotation, with upregulation at the early differentiation stage (CD4+ naïve T cells) and downregulation at the terminal differentiation stage (MHCIIhigh CD8+ TRM) (34, 49).
Three horses from our teaching herd were included in this pilot study out of convenience. These horses were affected with mild-to-moderate equine asthma, but sampled in a phase of clinical remission. Interestingly, horse 2 presented higher proportions of FABP5high AMs, CD4+ TRM, MHCIIhigh CD8+ TRM and proliferating T cells, and no plasma cells. This may reflect intrinsic individual differences of the immune response and/or in the environmental exposures encountered throughout lifetime.
A first pre-processing analysis found a low percentage of reads mapping to transcriptome (mean 33.5%, data not shown). We suspected that this resulted from the poor quality of the horse genome annotation, especially at the untranslated 3’-ends of genes. Therefore, we manually extended the annotations of the 3’-untranslated regions for all transcripts listed in the reference genome by 2 kb, as described elsewhere (91). The mapping to transcriptome substantially improved (mean 53.4%), reaching levels comparable with humane or murine studies. This highlights the need for an improved annotation of the equine reference genome.
While a large amount of new information was gained from this study, we acknowledge some limitations. Our study population was small, due to the high cost of scRNA-seq. The number of cells sequenced was, however, sufficient to gather meaningful initial data. While our ability to detect rare cells (e.g. eosinophils) may have been hindered, we could still demonstrate that equine BALF cells can be successfully used for scRNA-seq after cryopreservation. For the present proof-of-concept study, we sampled BALF from asthmatic horses in remission available on site. The gene expression profiles obtained may thus differ from those of horses free of respiratory diseases. A larger-scale study using healthy horses is required to define a single-cell atlas of equine BALF cells. Most single-cell studies are conducted on fresh samples in order to optimize cell viability and prevent transcriptional modifications associated with sample handling. We wanted to demonstrate the feasibility of cryopreservation before sequencing to facilitate the design of larger, potentially multi-centric single-cell studies. Cryopreservation will allow collection of BALF from different horses on separate days for later batched library preparation and sequencing. Analyzing several samples in one single run minimizes batch effect and significantly reduces sequencing cost. Cryopreservation of cells and tissues have a minimal effect on transcriptional profiles obtained with scRNA-seq (92, 93). However, T cells may be more affected by cold preservation, with populations declining over time and an expression profile biased toward cytotoxicity genes (92, 93). Potential confounding effects of cryopreservation on the expression profiles of specific clusters may have been missed in our dataset due to the currently limited knowledge of cell type-specific transcriptional signatures. The present study was not designed to assess the effect of cryopreservation on gene expression. This should be investigated in future experiments comparing directly fresh and cryopreserved equine BALF samples at the single-cell level. A major limitation of scRNA-seq studies is the difficulty to validate the annotation of cell clusters. Considerable efforts are put into the construction of extensive standardized single-cell atlases (94). Unfortunately, complementary methods that could corroborate the assigned cell clusters (e.g. flow cytometry) fall short in resolution compared to scRNA-seq. The development of new single-cell platforms combining different experimental approaches, such as concurrent gene expression and surface protein labeling, will help to fill this gap.
5 Conclusion
Our findings indicate that scRNA-seq technology is applicable to cryopreserved equine BALF cells, enabling the identification of its major immune cell populations. The sample processing protocol developed for this study may be applied to equine BALF cells and thus allow large-scale single-cell sequencing experiments in horses. Here we provide the single-cell gene expression profiles of the bronchoalveolar cells collected from asthmatic horses in remission. Our collection of signature genes will facilitate cell clustering in forthcoming equine scRNA-seq investigations. We anticipate that single-cell transcriptomic studies will generate novel paradigms in equine respiratory research. Importantly, scRNA-seq will be a powerful tool for the identification of equine asthma endotypes.
Data availability statement
The datasets presented in this study can be found in online repositories. The names of the repository/repositories and accession number(s) can be found below: https://www.ebi.ac.uk/ena, PRJEB51962. The R code used for data analysis is available at https://github.com/vetsuisse-unibe/ScRNAseq-BALF-paper.
Ethics statement
The animal study was reviewed and approved by Animal Experimentation Committee of the Canton of Bern, Switzerland.
Author contributions
VJ and VG supervised the study. SS, TL, and VG contributed to the study conception and design. VG acquired funding. SS examined the horses, collected and processed the samples. LP processed and read the cytological preparations. PN coordinated the library preparations and acquired the scRNA-seq data, which was then analyzed by SS and VJ. SS interpreted the data and prepared the original manuscript draft. All authors contributed to manuscript revision, read and approved the submitted version.
Funding
Swiss National Science Foundation (Grant No. 31003A-162548/1); Internal Research Fund of the Swiss Institute of Equine Medicine, Bern, Switzerland (ISMEquine Research No. 33-890). Open access funding was provided by the University of Bern.
Acknowledgments
The authors would like to thank med. vet. Michelle Wyler and med. vet. Nicole Altermatt for their assistance in sample collection. We thank the Next Generation Sequencing Platform of the University of Bern for performing the sequencing experiments and the Interfaculty Bioinformatics Unit of the University of Bern for providing the high performance computing infrastructure. The authors furthermore acknowledge the laboratory technicians of the Central Diagnostic Laboratory of the Vetsuisse Faculty for their assistance in sample processing.
Conflict of interest
The authors declare that the research was conducted in the absence of any commercial or financial relationships that could be construed as a potential conflict of interest.
Publisher’s note
All claims expressed in this article are solely those of the authors and do not necessarily represent those of their affiliated organizations, or those of the publisher, the editors and the reviewers. Any product that may be evaluated in this article, or claim that may be made by its manufacturer, is not guaranteed or endorsed by the publisher.
Supplementary material
The Supplementary Material for this article can be found online at: https://www.frontiersin.org/articles/10.3389/fimmu.2022.929922/full#supplementary-material
Footnotes
- ^ The Human Protein Atlas. https://www.proteinatlas.org/ [Accessed May 23, 2022]
- ^ The Human Cell Atlas. https://www.humancellatlas.org/ [Accessed May 23, 2022]
References
1. Nayak R, Hasija Y. A hitchhiker’s guide to single-cell transcriptomics and data analysis pipelines. Genomics (2021) 113:606–19. doi: 10.1016/j.ygeno.2021.01.007
2. Chua RL, Lukassen S, Trump S, Hennig BP, Wendisch D, Pott F, et al. COVID-19 severity correlates with airway epithelium–immune cell interactions identified by single-cell analysis. Nat Biotechnol (2020) 38:970–9. doi: 10.1038/s41587-020-0602-4
3. He J, Cai S, Feng H, Cai B, Lin L, Mai Y, et al. Single-cell analysis reveals bronchoalveolar epithelial dysfunction in COVID-19 patients. Protein Cell (2020) 20:680–87. doi: 10.1007/s13238-020-00752-4
4. Liao M, Liu Y, Yuan J, Wen Y, Xu G, Zhao J, et al. Single-cell landscape of bronchoalveolar immune cells in patients with COVID-19. Nat Med (2020) 26:842–4. doi: 10.1038/s41591-020-0901-9
5. Couetil LL, Thompson CA. Airway diagnostics: Bronchoalveolar lavage, tracheal wash, and pleural fluid. Vet Clin North Am - Equine Pract (2020) 36:87–103. doi: 10.1016/j.cveq.2019.12.006
6. Tomlinson JE, Wagner B, Felippe MJB, Van de Walle GR. Multispectral fluorescence-activated cell sorting of b and T cell subpopulations from equine peripheral blood. Vet Immunol Immunopathol (2018) 199:22–31. doi: 10.1016/j.vetimm.2018.03.010
7. Davis EG, Wilkerson MJ, Rush BR. Flow cytometry: Clinical applications in equine medicine. J Vet Intern Med (2002) 16:404–10. doi: 10.1111/j.1939-1676.2002.tb01257.x
8. Vargas A, Boivin R, Cano P, Murcia Y, Bazin I, Lavoie JP. Neutrophil extracellular traps are downregulated by glucocorticosteroids in lungs in an equine model of asthma. Respir Res (2017) 18:1–11. doi: 10.1186/s12931-017-0689-4
9. Lavoie JP, Cesarini C, Lavoie-Lamoureux A, Moran K, Lutz S, Picandet V, et al. Bronchoalveolar lavage fluid cytology and cytokine messenger ribonucleic acid expression of racehorses with exercise intolerance and lower airway inflammation. J Vet Intern Med (2011) 25:322–9. doi: 10.1111/j.1939-1676.2010.0664.x
10. Hughes KJ, Nicolson L, Da Costa N, Franklin SH, Allen KJ, Dunham SP. Evaluation of cytokine mRNA expression in bronchoalveolar lavage cells from horses with inflammatory airway disease. Vet Immunol Immunopathol (2011) 140:82–9. doi: 10.1016/j.vetimm.2010.11.018
11. Beekman L, Tohver T, Léguillette R. Comparison of cytokine mRNA expression in the bronchoalveolar lavage fluid of horses with inflammatory airway disease and bronchoalveolar lavage mastocytosis or neutrophilia using REST software analysis. J Vet Intern Med (2012) 26:153–61. doi: 10.1111/j.1939-1676.2011.00847.x
12. Couëtil LL, Cardwell JM, Gerber V, Lavoie J -P., Léguillette R, Richard EA. Inflammatory airway disease of horses–revised consensus statement. J Vet Intern Med (2016) 30:503–15. doi: 10.1111/jvim.13824
13. Mould KJ, Jackson ND, Henson PM, Seibold M, Janssen WJ. Single cell RNA sequencing identifies unique inflammatory airspace macrophage subsets. JCI Insight (2019) 4:1–17. doi: 10.1172/jci.insight.126556
14. Lee JS, Koh JY, Yi K, Kim YIL, Park SJ, Kim EH, et al. Single-cell transcriptome of bronchoalveolar lavage fluid reveals sequential change of macrophages during SARS-CoV-2 infection in ferrets. Nat Commun (2021) 12:1–13. doi: 10.1038/s41467-021-24807-0
15. Fastrès A, Pirottin D, Fievez L, Marichal T, Desmet CJ, Bureau F, et al. Characterization of the bronchoalveolar lavage fluid by single cell gene expression analysis in healthy dogs: A promising technique. Front Immunol (2020) 11:1707. doi: 10.3389/fimmu.2020.01707
16. Lavoie JP, Bullone M, Rodrigues N, Germim P, Albrecht B, von Salis-Soglio M. Effect of different doses of inhaled ciclesonide on lung function, clinical signs related to airflow limitation and serum cortisol levels in horses with experimentally induced mild to severe airway obstruction. Equine Vet J (2019) 51:779–86. doi: 10.1111/evj.13093
17. Stuart T, Butler A, Hoffman P, Hafemeister C, Papalexi E, Mauck WM, et al. Comprehensive integration of single-cell data. Cell (2019) 177:1888–902.e21. doi: 10.1016/j.cell.2019.05.031
18. Luecken MD, Theis FJ. Current best practices in single-cell RNA-seq analysis: a tutorial. Mol Syst Biol (2019) 15:e8746. doi: 10.15252/msb.20188746
19. Ramseyer A, Gaillard C, Burger D, Straub R, Jost U, Boog C, et al. Effects of genetic and environmental factors on chronic lower airway disease in horses. J Vet Intern Med (2007) 21:149–56. doi: 10.1111/j.1939-1676.2007.tb02941.x
20. Laumen E, Doherr MG, Gerber V. Relationship of horse owner assessed respiratory signs index to characteristics of recurrent airway obstruction in two warmblood families. Equine Vet J (2010) 42:142–8. doi: 10.2746/042516409X479586
21. Couetil L, Cardwell JM, Leguillette R, Mazan M, Richard E, Bienzle D, et al. Equine asthma: Current understanding and future directions. Front Vet Sci (2020) 7:450. doi: 10.3389/fvets.2020.00450
22. Moyo NA, Marchi E, Steinbach F. Differentiation and activation of equine monocyte-derived dendritic cells are not correlated with CD206 or CD83 expression. Immunology (2013) 139:472–83. doi: 10.1111/imm.12094
23. Worah K, Mathan TSM, Vu Manh TP, Keerthikumar S, Schreibelt G, Tel J, et al. Proteomics of human dendritic cell subsets reveals subset-specific surface markers and differential inflammasome function. Cell Rep (2016) 16:2953–66. doi: 10.1016/j.celrep.2016.08.023
24. Ogawa T, Shichino S, Ueha S, Ogawa S, Matsushima K. Complement protein C1q activates lung fibroblasts and exacerbates silica-induced pulmonary fibrosis in mice. Biochem Biophys Res Commun (2022) 603:88–93. doi: 10.1016/j.bbrc.2022.02.090
25. Morse C, Tabib T, Sembrat J, Buschur KL, Bittar HT, Valenzi E, et al. Proliferating SPP1/MERTK-expressing macrophages in idiopathic pulmonary fibrosis. Eur Respir J (2019) 54:1802441. doi: 10.1183/13993003.02441-2018
26. Chun K-R, Bae EM, Kim J-K, Suk K, Lee W-H. Suppression of the lipopolysaccharide-induced expression of MARCKS-related protein (MRP) affects transmigration in activated RAW264. 7 Cells Cell Immunol (2009) 256:92–8. doi: 10.1016/j.cellimm.2009.01.011
27. Shimizu Y, Dobashi K. CC-chemokine CCL15 expression and possible implications for the pathogenesis of IgE-related severe asthma. Mediators Inflammation (2012) 2012:1–7. doi: 10.1155/2012/475253
28. Hollingsworth JW, Li Z, Brass DM, Garantziotis S, Timberlake SH, Kim A, et al. CD44 regulates macrophage recruitment to the lung in lipopolysaccharide-induced airway disease. Am J Respir Cell Mol Biol (2007) 37:248–53. doi: 10.1165/rcmb.2006-0363OC
29. Wei J, Marisetty A, Schrand B, Gabrusiewicz K, Hashimoto Y, Ott M, et al. Osteopontin mediates glioblastoma-associated macrophage infiltration and is a potential therapeutic target. J Clin Invest (2018) 129:137–49. doi: 10.1172/JCI121266
30. Evren E, Ringqvist E, Tripathi KP, Sleiers N, Rives IC, Alisjahbana A, et al. Distinct developmental pathways from blood monocytes generate human lung macrophage diversity. Immunity (2021) 54:259–75.e7. doi: 10.1016/j.immuni.2020.12.003
31. Schyns J, Bai Q, Ruscitti C, Radermecker C, De Schepper S, Chakarov S, et al. Non-classical tissue monocytes and two functionally distinct populations of interstitial macrophages populate the mouse lung. Nat Commun (2019) 10:3964. doi: 10.1038/s41467-019-11843-0
32. Kim C, Jin J, Weyand CM, Goronzy JJ. The transcription factor TCF1 in T cell differentiation and aging. Int J Mol Sci (2020) 21:6497. doi: 10.3390/ijms21186497
33. Szabo PA, Levitin HM, Miron M, Snyder ME, Senda T, Yuan J, et al. Single-cell transcriptomics of human T cells reveals tissue and activation signatures in health and disease. Nat Commun (2019) 10:4706. doi: 10.1038/s41467-019-12464-3
34. Sanchez CG, Teixeira FK, Czech B, Preall JB, Zamparini AL, Seifert JRK, et al. Regulation of ribosome biogenesis and protein synthesis controls germline stem cell differentiation. Cell Stem Cell (2016) 18:276–90. doi: 10.1016/j.stem.2015.11.004
35. Zhang Y, Reynolds JM, Chang SH, Martin-Orozco N, Chung Y, Nurieva RI, et al. MKP-1 is necessary for T cell activation and function. J Biol Chem (2009) 284:30815–24. doi: 10.1074/jbc.M109.052472
36. Gavins FNE, Hickey MJ. Annexin A1 and the regulation of innate and adaptive immunity. Front Immunol (2012) 3:354. doi: 10.3389/fimmu.2012.00354
37. Truong K-L, Schlickeiser S, Vogt K, Boës D, Stanko K, Appelt C, et al. Killer-like receptors and GPR56 progressive expression defines cytokine production of human CD4+ memory T cells. Nat Commun (2019) 10:2263. doi: 10.1038/s41467-019-10018-1
38. Bai Y, Hu M, Chen Z, Wei J, Du H. Single-cell transcriptome analysis reveals RGS1 as a new marker and promoting factor for T-cell exhaustion in multiple cancers. Front Immunol (2021) 12:767070. doi: 10.3389/fimmu.2021.767070
39. Ohkura N, Sakaguchi S. Transcriptional and epigenetic basis of treg cell development and function: its genetic anomalies or variations in autoimmune diseases. Cell Res (2020) 30:465–74. doi: 10.1038/s41422-020-0324-7
40. Schumann K, Raju SS, Lauber M, Kolb S, Shifrut E, Cortez JT, et al. Functional CRISPR dissection of gene networks controlling human regulatory T cell identity. Nat Immunol (2020) 21:1456–66. doi: 10.1038/s41590-020-0784-4
41. Zhang H, Madi A, Yosef N, Chihara N, Awasthi A, Pot C, et al. An IL-27-Driven transcriptional network identifies regulators of IL-10 expression across T helper cell subsets. Cell Rep (2020) 33:108433. doi: 10.1016/j.celrep.2020.108433
42. Wheaton JD, Yeh C-H, Ciofani M. Cutting edge: c-maf is required for regulatory T cells to adopt RORγt + and follicular phenotypes. J Immunol (2017) 199:3931–6. doi: 10.4049/jimmunol.1701134
43. Ren J, Han L, Tang J, Liu Y, Deng X, Liu Q, et al. Foxp1 is critical for the maintenance of regulatory T-cell homeostasis and suppressive function. PloS Biol (2019) 17:e3000270. doi: 10.1371/journal.pbio.3000270
44. Remedios KA, Zirak B, Sandoval PM, Lowe MM, Boda D, Henley E, et al. The TNFRSF members CD27 and OX40 coordinately limit T h 17 differentiation in regulatory T cells. Sci Immunol (2018) 3:1–14. doi: 10.1126/sciimmunol.aau2042
45. van Aalderen MC, van den Biggelaar M, Remmerswaal EBM, van Alphen FPJ, Meijer AB, ten Berge IJM, et al. Label-free analysis of CD8+ T cell subset proteomes supports a progressive differentiation model of human-Virus-Specific T cells. Cell Rep (2017) 19:1068–79. doi: 10.1016/j.celrep.2017.04.014
46. Slade CD, Reagin KL, Lakshmanan HG, Klonowski KD, Watford WT. Placenta-specific 8 limits IFNγ production by CD4 T cells in vitro and promotes establishment of influenza-specific CD8 T cells in vivo. PloS One (2020) 15:e0235706. doi: 10.1371/journal.pone.0235706
47. Pfaender S, Mar KB, Michailidis E, Kratzel A, Boys IN, V’kovski P, et al. LY6E impairs coronavirus fusion and confers immune control of viral disease. Nat Microbiol (2020) 5:1330–9. doi: 10.1038/s41564-020-0769-y
48. Eberlein J, Davenport B, Nguyen TT, Victorino F, Jhun K, van der Heide V, et al. Chemokine signatures of pathogen-specific T cells I: Effector T cells. J Immunol (2020) 205:2169–87. doi: 10.4049/jimmunol.2000253
49. Athanasiadis EI, Botthof JG, Andres H, Ferreira L, Lio P, Cvejic A. Single-cell RNA-sequencing uncovers transcriptional states and fate decisions in haematopoiesis. Nat Commun (2017) 8:2045. doi: 10.1038/s41467-017-02305-6
50. Zhang J-Y, Wang X-M, Xing X, Xu Z, Zhang C, Song J-W, et al. Single-cell landscape of immunological responses in patients with COVID-19. Nat Immunol (2020) 21:1107–18. doi: 10.1038/s41590-020-0762-x
51. Holm D, Fink DR, Steffensen MA, Schlosser A, Nielsen O, Moeller JB, et al. Characterization of a novel human scavenger receptor cysteine-rich molecule SCART1 expressed by lymphocytes. Immunobiology (2013) 218:408–17. doi: 10.1016/j.imbio.2012.05.025
52. Kisielow J, Kopf M, Karjalainen K. SCART scavenger receptors identify a novel subset of adult γδ T cells. J Immunol (2008) 181:1710–6. doi: 10.4049/jimmunol.181.3.1710
53. Patel RS, Tomlinson JE, Divers TJ, Van de Walle GR, Rosenberg BR. Single-cell resolution landscape of equine peripheral blood mononuclear cells reveals diverse cell types including T-bet+ b cells. BMC Biol (2021) 19:1–18. doi: 10.1186/s12915-020-00947-5
54. Yoon HS, Scharer CD, Majumder P, Davis CW, Butler R, Zinzow-Kramer W, et al. ZBTB32 is an early repressor of the CIITA and MHC class II gene expression during b cell differentiation to plasma cells. J Immunol (2012) 189:2393–403. doi: 10.4049/jimmunol.1103371
55. Travaglini KJ, Nabhan AN, Penland L, Sinha R, Gillich A, Sit RV, et al. A molecular cell atlas of the human lung from single-cell RNA sequencing. Nature (2020) 587:619–25. doi: 10.1038/s41586-020-2922-4
56. Morris SA, Klein A, Treutlein B. The evolving concept of cell identity in the single cell era. Development (2019) 146(12):dev169748. doi: 10.1242/dev.169748
57. Xia B, Yanai I. A periodic table of cell types. Development (2019) 146:1–9. doi: 10.1242/dev.169854
58. Koczera P, Martin L, Marx G, Schuerholz T. The ribonuclease a superfamily in humans: Canonical RNases as the buttress of innate immunity. Int J Mol Sci (2016) 17:1278. doi: 10.3390/ijms17081278
59. Kang H, Bienzle D, Lee GKC, Piché É, Viel L, Odemuyiwa SO, et al. Flow cytometric analysis of equine bronchoalveolar lavage fluid cells in horses with and without severe equine asthma. Vet Pathol (2022) 59:91–9. doi: 10.1177/03009858211042588
60. Hodge SJ, Hodge GL, Holmes M, Reynolds PN. Flow cytometric characterization of cell populations in bronchoalveolar lavage and bronchial brushings from patients with chronic obstructive pulmonary disease. Cytom Part B - Clin Cytom (2004) 61:27–34. doi: 10.1002/cyto.b.20020
61. Pickles K, Pirie RS, Rhind S, Dixon PM, McGorum BC. Cytological analysis of equine bronchoalveolar lavage fluid. part 2: comparison of smear and cytocentrifuged preparations. Equine Vet J (2010) 34:292–6. doi: 10.2746/042516402776186155
62. Fastrès A, Pirottin D, Fievez L, Tutunaru AC, Bolen G, Merveille AC, et al. Identification of pro-fibrotic macrophage populations by single-cell transcriptomic analysis in West highland white terriers affected with canine idiopathic pulmonary fibrosis. Front Immunol (2020) 11:611749. doi: 10.3389/fimmu.2020.611749
63. Karagianni AE, Kapetanovic R, Summers KM, McGorum BC, Hume DA, Pirie RS. Comparative transcriptome analysis of equine alveolar macrophages. Equine Vet J (2017) 49:375–82. doi: 10.1111/evj.12584
64. Brand HK, Ahout IML, de Ridder D, van Diepen A, Li Y, Zaalberg M, et al. Olfactomedin 4 serves as a marker for disease severity in pediatric respiratory syncytial virus (RSV) infection. PloS One (2015) 10:e0131927. doi: 10.1371/journal.pone.0131927
65. Gong F, Li R, Zheng X, Chen W, Zheng Y, Yang Z, et al. OLFM4 regulates lung epithelial cell function in sepsis-associated ARDS/ALI via LDHA-mediated NF-κB signaling. J Inflammation Res (2021) 14:7035–51. doi: 10.2147/JIR.S335915
66. Kobayashi S, Tayama S, Phung HT, Kagawa Y, Miyazaki H, Takahashi Y, et al. Fatty acid-binding protein 5 limits ILC2-mediated allergic lung inflammation in a murine asthma model. Sci Rep (2020) 10:16617. doi: 10.1038/s41598-020-73935-y
67. Zhang S, Yu M, Guo Q, Li R, Li G, Tan S, et al. Annexin A2 binds to endosomes and negatively regulates TLR4-triggered inflammatory responses via the TRAM-TRIF pathway. Sci Rep (2015) 5:15859. doi: 10.1038/srep15859
68. Hiroshima Y, Hsu K, Tedla N, Wong SW, Chow S, Kawaguchi N, et al. S100A8/A9 and S100A9 reduce acute lung injury. Immunol Cell Biol (2017) 95:461–72. doi: 10.1038/icb.2017.2
69. Viola A, Munari F, Sánchez-Rodríguez R, Scolaro T, Castegna A. The metabolic signature of macrophage responses. Front Immunol (2019) 10:1462. doi: 10.3389/fimmu.2019.01462
70. Jo M, Kim JH, Song GJ, Seo M, Hwang EM, Suk K. Astrocytic orosomucoid-2 modulates microglial activation and neuroinflammation. J Neurosci (2017) 37:2878–94. doi: 10.1523/JNEUROSCI.2534-16.2017
71. Lee YS, Choi JW, Hwang I, Lee JW, Lee JH, Kim AY, et al. Adipocytokine orosomucoid integrates inflammatory and metabolic signals to preserve energy homeostasis by resolving immoderate inflammation. J Biol Chem (2010) 285:22174–85. doi: 10.1074/jbc.M109.085464
72. Sanjurjo L, Amézaga N, Aran G, Naranjo-Gómez M, Arias L, Armengol C, et al. The human CD5L/AIM-CD36 axis: A novel autophagy inducer in macrophages that modulates inflammatory responses. Autophagy (2015) 11:487–502. doi: 10.1080/15548627.2015.1017183
73. Sanjurjo L, Aran G, Téllez É, Amézaga N, Armengol C, López D, et al. CD5L promotes M2 macrophage polarization through autophagy-mediated upregulation of ID3. Front Immunol (2018) 9:480. doi: 10.3389/fimmu.2018.00480
74. Mitsi E, Kamng’ona R, Rylance J, Solórzano C, Jesus Reiné J, Mwandumba HC, et al. Human alveolar macrophages predominately express combined classical M1 and M2 surface markers in steady state. Respir Res (2018) 19:1–4. doi: 10.1186/s12931-018-0777-0
75. Takiguchi H, Yang CX, Yang CWT, Sahin B, Whalen BA, Milne S, et al. Macrophages with reduced expressions of classical M1 and M2 surface markers in human bronchoalveolar lavage fluid exhibit pro-inflammatory gene signatures. Sci Rep (2021) 11:1–11. doi: 10.1038/s41598-021-87720-y
76. Karagianni AE, Lisowski ZM, Hume DA, Scott Pirie R. The equine mononuclear phagocyte system: The relevance of the horse as a model for understanding human innate immunity. Equine Vet J (2021) 53:231–49. doi: 10.1111/evj.13341
77. Ross EA, Devitt A, Johnson JR. Macrophages: The good, the bad, and the gluttony. Front Immunol (2021) 12:708186. doi: 10.3389/fimmu.2021.708186
78. Byrne AJ, Powell JE, O’Sullivan BJ, Ogger PP, Hoffland A, Cook J, et al. Dynamics of human monocytes and airway macrophages during healthy aging and after transplant. J Exp Med (2020) 217:1–11. doi: 10.1084/jem.20191236
79. Schulz D, Severin Y, Zanotelli VRT, Bodenmiller B. In-depth characterization of monocyte-derived macrophages using a mass cytometry-based phagocytosis assay. Sci Rep (2019) 9:1925. doi: 10.1038/s41598-018-38127-9
80. Silva MT. Macrophage phagocytosis of neutrophils at inflammatory/infectious foci: A cooperative mechanism in the control of infection and infectious inflammation. J Leukoc Biol (2011) 89:675–83. doi: 10.1189/jlb.0910536
81. Niedzwiedz A, Jaworski Z, Tykalowski B, Smialek M. Neutrophil and macrophage apoptosis in bronchoalveolar lavage fluid from healthy horses and horses with recurrent airway obstruction (RAO). BMC Vet Res (2014) 10:29. doi: 10.1186/1746-6148-10-29
82. Lee Y, Kiupel M, Soboll Hussey G. Characterization of respiratory dendritic cells from equine lung tissues. BMC Vet Res (2017) 13:313. doi: 10.1186/s12917-017-1240-z
83. Burel JG, Pomaznoy M, Lindestam Arlehamn CS, Weiskopf D, da Silva Antunes R, Jung Y, et al. Circulating T cell-monocyte complexes are markers of immune perturbations. Elife (2019) 8:1–21. doi: 10.7554/eLife.46045
84. Burel JG, Pomaznoy M, Lindestam Arlehamn CS, Seumois G, Vijayanand P, Sette A, et al. The challenge of distinguishing cell–cell complexes from singlet cells in non-imaging flow cytometry and single-cell sorting. Cytom Part A (2020) 97:1127–35. doi: 10.1002/cyto.a.24027
85. Restifo NP, Gattinoni L. Lineage relationship of effector and memory T cells. Curr Opin Immunol (2013) 25:556–63. doi: 10.1016/j.coi.2013.09.003
86. Looringh van Beeck FA, Reinink P, Hermsen R, Zajonc DM, Laven MJ, Fun A, et al. Functional CD1d and/or NKT cell invariant chain transcript in horse, pig, African elephant and guinea pig, but not in ruminants. Mol Immunol (2009) 46:1424–31. doi: 10.1016/j.molimm.2008.12.009
87. Dossa RG, Alperin DC, Garzon D, Mealey RH, Brown WC, Jervis PJ, et al. In contrast to other species, α-galactosylceramide (α-GalCer) is not an immunostimulatory NKT cell agonist in horses. Dev Comp Immunol (2015) 49:49–58. doi: 10.1016/j.dci.2014.11.005
88. Tan TCJ, Knight J, Sbarrato T, Dudek K, Willis AE, Zamoyska R. Suboptimal T-cell receptor signaling compromises protein translation, ribosome biogenesis, and proliferation of mouse CD8 T cells. Proc Natl Acad Sci (2017) 114:E6117–26. doi: 10.1073/pnas.1700939114
89. Tang R, Liu X, Liang C, Hua J, Xu J, Wang W, et al. Deciphering the prognostic implications of the components and signatures in the immune microenvironment of pancreatic ductal adenocarcinoma. Front Immunol (2021) 12:648917. doi: 10.3389/fimmu.2021.648917
90. Yang B, Fan J, Huang J, Guo E, Fu Y, Liu S, et al. Clinical and molecular characteristics of COVID-19 patients with persistent SARS-CoV-2 infection. Nat Commun (2021) 12:3501. doi: 10.1038/s41467-021-23621-y
91. Kaelin CB, McGowan KA, Barsh GS. Developmental genetics of color pattern establishment in cats. Nat Commun (2021) 12:5127. doi: 10.1038/s41467-021-25348-2
92. Madissoon E, Wilbrey-Clark A, Miragaia RJ, Saeb-Parsy K, Mahbubani KT, Georgakopoulos N, et al. scRNA-seq assessment of the human lung, spleen, and esophagus tissue stability after cold preservation. Genome Biol (2020) 21:1. doi: 10.1186/s13059-019-1906-x
93. Guillaumet-Adkins A, Rodríguez-Esteban G, Mereu E, Mendez-Lago M, Jaitin DA, Villanueva A, et al. Single-cell transcriptome conservation in cryopreserved cells and tissues. Genome Biol (2017) 18:1–15. doi: 10.1186/s13059-017-1171-9
Keywords: single-cell mRNA sequencing, cell cryopreservation, equine respiratory system, equine immunology, cell annotation
Citation: Sage SE, Nicholson P, Peters LM, Leeb T, Jagannathan V and Gerber V (2022) Single-cell gene expression analysis of cryopreserved equine bronchoalveolar cells. Front. Immunol. 13:929922. doi: 10.3389/fimmu.2022.929922
Received: 27 April 2022; Accepted: 08 August 2022;
Published: 23 August 2022.
Edited by:
Falko Steinbach, University of Surrey, United KingdomReviewed by:
Brad Rosenberg, Icahn School of Medicine at Mount Sinai, United StatesCarrie Finno, University of California, Davis, United States
Copyright © 2022 Sage, Nicholson, Peters, Leeb, Jagannathan and Gerber. This is an open-access article distributed under the terms of the Creative Commons Attribution License (CC BY). The use, distribution or reproduction in other forums is permitted, provided the original author(s) and the copyright owner(s) are credited and that the original publication in this journal is cited, in accordance with accepted academic practice. No use, distribution or reproduction is permitted which does not comply with these terms.
*Correspondence: Sophie E. Sage, sophie.sage@vetsuisse.unibe.ch
†These authors have contributed equally to this work