 Reut Levi
 Yoram Louzoun
94% of researchers rate our articles as excellent or good
Learn more about the work of our research integrity team to safeguard the quality of each article we publish.
Find out more
ORIGINAL RESEARCH article
Front. Immunol., 14 July 2022
Sec. Systems Immunology
Volume 13 - 2022 | https://doi.org/10.3389/fimmu.2022.906217
This article is part of the Research TopicThe Algorithmic Immune SystemView all 7 articles
The β chain rearrangement in T cells is a two-step process where first Dβ and Jβ bind, and only then Vβ is joined to the complex. We here show that the frequency of human and mouse Vβ Jβ combinations deviates from the one expected based on each gene usage frequency. This bias is observed mainly in functional (F) rearrangements, but also slightly in non-functional (NF) rearrangements. Preferred Vβ Jβ combinations in F clones are shared between donors and samples, suggesting a common structural mechanism for these biases in addition to any host-specific antigen-induced peripheral selection. The sharing holds even in clones with Jβ1 that share the same Dβ1 gene. Vβ Jβ usage is correlated with the Molecular Weight and Isoelectric Point in F clones. The pairing is also observed in the Double Positive cells in mice thymocytes, suggesting that the selection leading to such a pairing occurs before thymic selection. These results suggest an additional structural checkpoint in the beta chain development prior to thymic selection during the T cell receptor expression. Understanding this structural selection is important for the distinction between normal and aberrant T cell development, and crucial for the design of engineered TCRs.
T cells recognize self and foreign peptides through the interaction of their T-cell receptors (TCRs) with MHC bound peptides (1, 2). The TCR is located on the cell’s surface. Each host can have millions ofT cell clones with different TCRs (3). TCRs differ by their complementary determining region 3 (CDR3) sequence and the V, (D) and J alleles of their α and β chains. The TCR repertoire diversity is generated by two main mechanisms: the rearrangement of V (D) and J gene segments and by the nucleotide addition and removal at the junction between those segments (4, 5).
The TCR repertoire is then shaped through the T cell development. T cells arise from hematopoietic stem cells that migrate to the thymus where they require signals from nonhematopoietic stromal cells, such as thymic epithelial cells (TECs) and mesenchymal fibroblasts for survival, leading to positive selection based on ligand specificity (6, 7). A thymocyte whose TCR engages intra-thymic ligands and transduces intracellular signals can survive and undergo differentiation, while a thymocyte that is not signaled by its TCR undergoes death by neglect (8). This selection leads to two major lineages of T cells: CD4 T cells that recognize peptide antigens complexed to class II major histocompatibility complex (MHC) and possess helper functions, and CD8 T cells that recognize peptides complexed to class I MHC molecules and possess cytotoxic functions (9). In parallel, T cells are tested for reactivity with self-antigens to ensure that only those cells expressing acceptable antigen receptors (T cell receptors) mature.
The TCR α chain is composed of two segments (Vα (variable) and Jα (joining)). The β chain contains a third intermediate gene - Dβ (diversity). During the β chain rearrangement, there is first a recombination of one Dβ and one Jβ, followed by a recombination of Dβ Jβ with Vβ, to form a rearranged Vβ Dβ Jβ gene segment.
In the α chain rearrangement, all the genes between the rearranged Vα and Jα are removed. However, Vα genes that are 5’ and Jα genes that are 3’ to the rearranged Vα - Jα are still present allowing for multiple rounds of rearrangement (a process called editing). This process and the parallel process in the B cell Light Chain (LC) have been shown to induce a correlation between Vα and Jα gene usage (10, 11).
In the β chain, there are two Dβ genes, Dβ 1 and Dβ 2 with very similar nucleotide sequences. Dβ regions can only recombine with downstream Jβ region elements. Thus, while Dβ 1 can recombine with elements from both the Jβ 1 and the Jβ 2 cassettes, Dβ 2 can only recombine with Jβ 2 genes (12) (see Figure 1 for illustration). Thus, in TCRs that express Jβ 1 genes no editing could have happened. In principle, editing could happen once in a Jβ 2 gene, if the previous rearrangement was with a Jβ 1 gene.
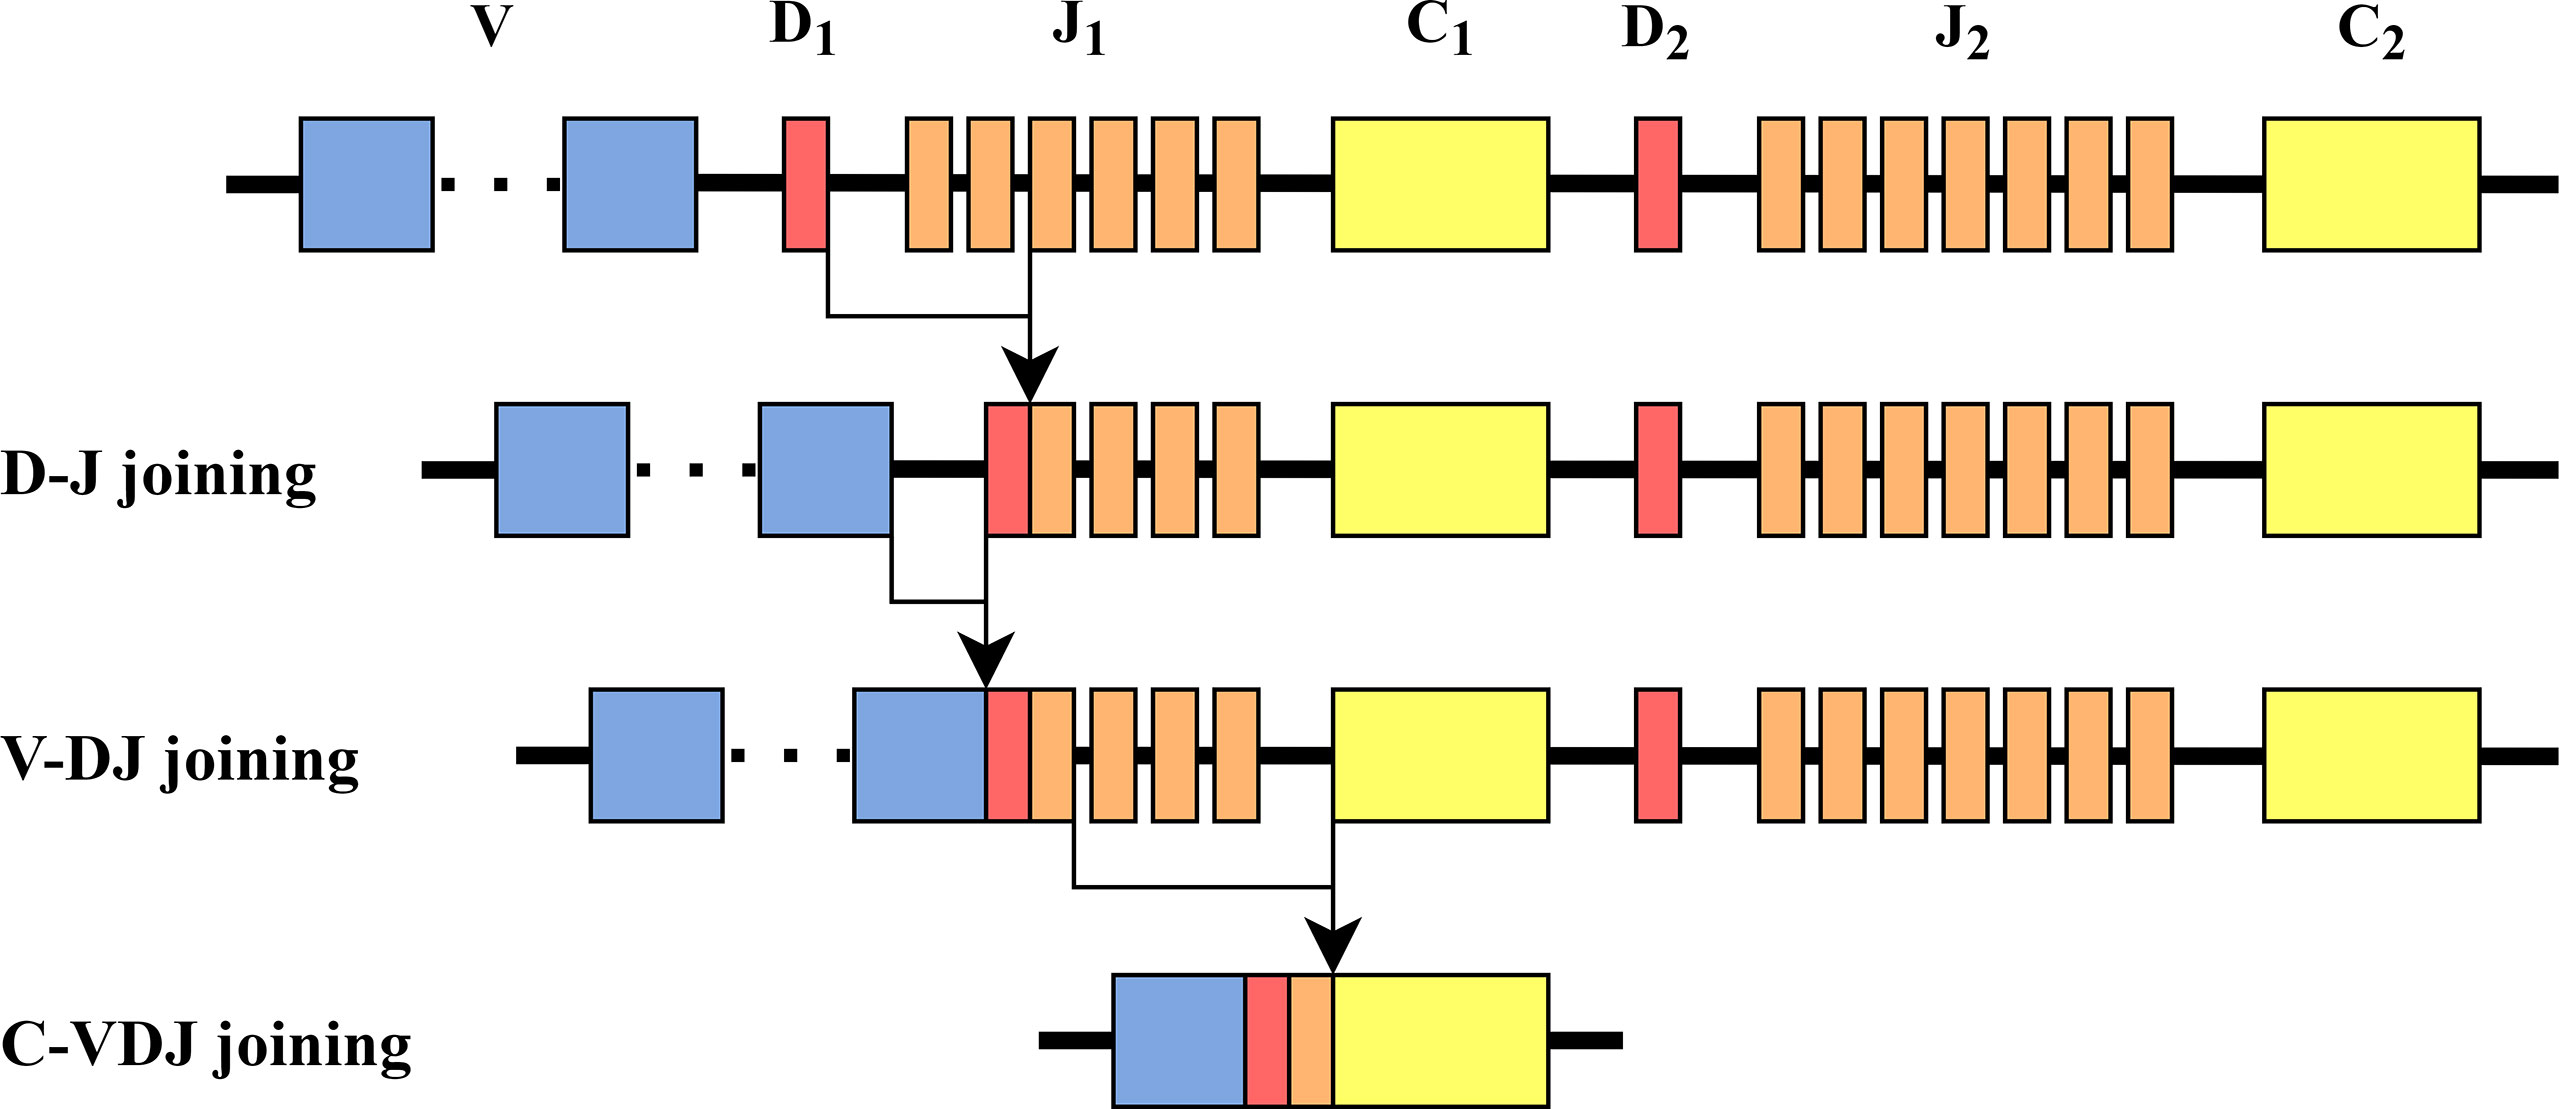
Figure 1 TCR β chain rearrangement. First, Dβ and Jβ are bound, then Vβ is bound to Dβ Jβ, and then Vβ Dβ Jβ is bound to Cβ. The structure of the β chain in mice is similar to the one in humans.
The Dβ - Jβ rearrangement was reported to be biased, since Dβ and Jβ cassettes are joined (13, 14). However, at least in the jβ 1 cassette, we expect Vβ - Jβ usage to be precisely the one expected from their individual frequencies. We here show that this is not the case. We show in human donors and mice a clear bias towards specific Vβ Jβ combinations that are more frequent than expected from the Vβ and Jβ probabilities in both CD4 and CD8 T cells.
Specific V and J (in either α or β chains) were shown to differ between diseases (15, 16). A study from 2017 provides evidence for TCR expansion of clonotypes in autoreactive CD8+ T cells associated with type 1 diabetes. The authors found for example that the TRAJ53 (T cell Receptor Alpha) and TRAV29 pair were expressed in 31% of the clonotypes (17). Another example is the genetic predisposition to carbamazepine-induced Stevens-Johnson syndrome (SJS), a severe cutaneous hypersensitivity with high mortality (18). Another study found that the usage of V20 - 01 and J02 - 02 was increased in the Vβ - Jβ repertoire (p < 0.001) of the healthy volunteers compared to patients (19). Within a given host, the prevalence of specific gene segments and combinations of gene segments differ drastically. The variability in V and J gene usage is introduced before thymic selection (20), and are further shaped by epitope specificity in the periphery (21).
Multiple models were developed for the generation probability of TCRs and BCRs (22). Those include for example IGoR (23), which used out-of-frame receptor sequences to estimate rearrangement probability. To the best of our knowledge, all such models e.g (22, 24) treat Vβ and Jβ as independent, and approximate P(Vβ, Jβ) = P(Vβ) P(Jβ).
To summarise, specific V and J genes as well as V-J combinations have been shown to be more frequent than others in many contexts. We here show that the Vβ - Jβ usage is not only highly variable, but also differs from what is expected from their separate frequencies. We propose multiple measure that suggest that this pairing is the result of a structural selection step preceding thymic selection.
We used the notation presented in Table 1 throughout the analysis.
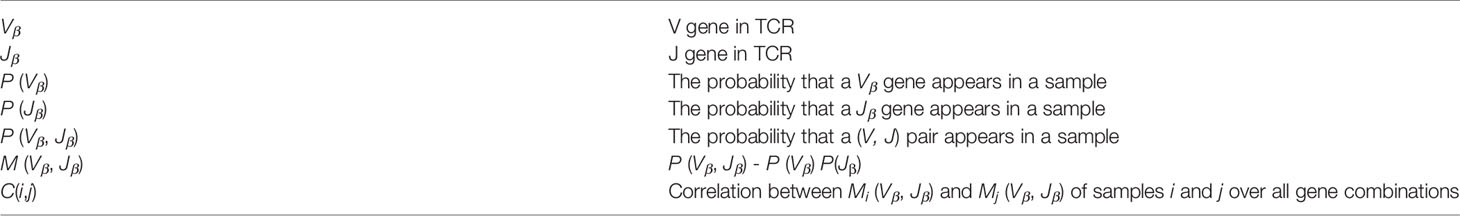
Table 1 Notation.
We used four datasets in this analysis:
● The RH dataset. T cell receptor sequence data of alopecia patients before and during sensitisation with diphenylcyclopropenone and healthy volunteers at equivalent time points. The data contains 98 samples of β chains from 34 different patients. Participants were recruited from patients who had been diagnosed with alopecia, were aged between 18 and 70, identified as suitable for DPC treatment by a consultant dermatologist, and were now attending their first visit to the Alopecia Clinic at Salford Royal Hospital for DPC therapy. Twenty-nine of the individuals who participated in the study provided blood samples for TCR sequencing (TCRseq), for between one and four of the study time points (pre-sensitization, and at 2, 6, and 24 weeks of DPC treatment). Flow cytometry data was obtained for peripheral blood mononuclear cells (PBMCs) from 10 treated patients, and patch test data for 24 patients (25).
● The MM dataset. This dataset contains DNA sequences of T cells that were gathered and isolated from human tissues following organ donation, including blood, multiple lymphoid sites (bone marrow (BM), lymph nodes (LN), spleen (Spl)), and lungs. Donors were free of cancer and negative for hepatitis B, C, and HIV. The dataset contains four CD4+ and CD8+ T cell types: TCM (CD45RA- CCR7+), TEM (CD45RA- CCR7-CD69-), TRM (CD45RA- CCR7- CD69+), and TEMRA (CD45RA+ CCR7-) cells. (See Miron et al (26) for details.)
● The Emerson dataset. The Emerson dataset contains 786 immune repertoires (27). Each repertoire contains between 4,371 and 973,081 (avg. 299,319) distinct TCR sequences with a CDR3 length of 1 to 27 (avg. 14.5) amino acids. Each TCR is associated in each host with Vβ and Jβ genes and with a frequency. 340 repertoires are labeled CMV+, 421 are labeled CMV-, and 25 are of unknown status.
● The LV dataset. This dataset includes TCR sequences which were extracted from different T cell populations in mice, and then sorted for γδ TCR-/TCRβ+, and CD44-/CD62L+. The data contains details of both TCRα and TCRβ chains that were sequenced from more than 30 mice of different genetic backgrounds using adjusted sequencers. Pre-selection unsignaled Double Positive (DP) thymocytes were sorted based on CD4+, CD8α+, and CD69- gates from B6 or MHC-Knock Out animals (8).
For more details on each of the datasets see Table 2.
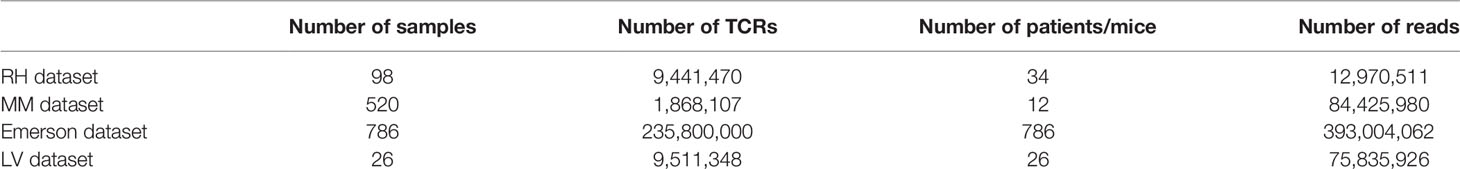
Table 2 Details for each of the datasets.
We compared for each sample the observed relative frequency of all (Vβ Jβ) pairs P(Vβ Jβ) and the expected frequency, defined as the product of the relative frequencies of Vβ and Jβ, P (Vβ) P(Jβ), and computed:
The probabilities are defined per sample (i.e. using only clones in this sample), and each clone was counted once, irrespective of the clone size. When we analyzed the M (Vβ Jβ) distribution, we multiplied all the values by 100 to obtain values in percentages. Only Vβ and Jβ in the sample were considered.
To quantify the similarity of deviation from a random pairing between samples, we computed the Spearman correlation between the M (Vβ Jβ) values for all sample pairs.
Given a pair of samples i and j. Each sample contains only a subset of the Vβ and Jβ genes Vβ ik, Jβ ik, Vβ jk, Jβ jk. For each pair of samples, the common (Vβ, Jβ) pairs were taken s.t.
We computed Mi(Vβ, Jβ) and Mj(Vβ, Jβ) for each pair in S, and computed the Spearman correlation for these pairs.
To detect specific (Vβ, Jβ) pairs that deviate from the null model of random pairing, we computed for each pair in our dataset over all samples P (Vβ, Jβ) and P(Vβ) P(Jβ). Then, we performed a paired T-test on P(Vβ, Jβ) and P(Vβ) P(Jβ) for each pair separately. We applied a Benjamini-Hochberg correction (28) to the resulting probabilities. Significant pairs were defined as a corrected p-value less than 0.01.
We used two null models to compare our results. The first null model was generated by scrambling the Vβ and Jβ segments of the Vβ Jβ pairs. Specifically, we used the clones in the sample and randomly reassigned the Vβ genes of the different clones, in each sample separately. When scrambling we scrambled at the clone level, and not at the read level (i.e. we did not scramble reads within a clone). The clone size or frequency was not used in the analysis. In addition, for the functional F clones, we also used the non-functional data (NF) clones as a comparison.
For each dataset, we used only the F clones. We took all possible pairs of a given file, and for each pair, the total lengths of Vβ and Jβ was calculated. In addition, for each file and pair, we took its CDR3 and computed the sum of the Kyte Doolittle (KD), the Molecular Weight (MW) and the Isoelectric Point (IP) for all of its amino acids and averaged the values for each pair. Then, we calculated the M (Vβ, Jβ) values for each Vβ, Jβ pair in a given file, and averaged over all the pairs in the same dataset. We then computed the Spearman correlation between the sum of the gene lengths, the KD, the MW or the IP and the mean M (Vβ, Jβ) values.
● To test the correlation between different samples, only the common pairs of the two samples were taken. We calculated for each pair (Vβ, Jβ) the M (Vβ, Jβ) and M1 (Vβ, Jβ), where M1 is the measure for the mixed data both for the real data and for the first null model. Next, we calculated the Spearman correlation coefficient on these two samples.
● In order to test whether the distribution of M (Vβ, Jβ) on the real data is different from the distribution of M (Vβ, Jβ) on the null model, we performed the two-sided Kolmogorov-Smirnov statistic on two samples (29).
● To test whether the standard deviation of M (Vβ, Jβ) on the real data is different from the standard deviation of M (Vβ, Jβ) on the null model, we used a two-sided T-test on two related samples of scores. We also used this test to identify which pairs have a signal. For each pair (Vβ, Jβ), we calculated over all samples P (Vβ, Jβ) and P (Vβ) P (Jβ), and performed the above test for P (Vβ, Jβ) and P (Vβ) P (Jβ) for each pair separately. We applied the Benjamini-Hochberg correction (28).
● To test whether the correlation vector is significantly different, we calculated the two-sided T-test for the mean of one group of scores, where the expected value is 0. Moreover, in order to test whether the correlations within a patient are different from the correlations between different patients, we used a two-sided T-test for the means of two independent samples of scores.
● In order to determine how two factors impact a response variable, and to determine whether or not there is an interaction between the two factors on the response variable, we used a two-way ANOVA test.
● For analyzing the division between samples from different patients we used a one-way chi-square test. We defined neighbors as consecutive samples with the same compartment/sample. Note that this only shows the deviation from a random order.
We used 4 datasets for the analysis, RH, MM, Emerson and the LV datasets (see Methods). Each dataset contains several patients (see Methods). Some contain samples from different compartments (CD4 vs CD8), as well as different conditions (healthy vs sick in different conditions). We analyzed only DNA sequencing based repertoire, and each sample contains both functional and non-functional clones. We removed all samples with less than 1000 clones. In the Emerson dataset, we used a random sample of 100 patients. We ignored the frequency of each clone in each donor to avoid biases induced by differential amplification. We grouped Vβ gene and Jβ gene representations into 2 fields gene notation (e.g., V01-02 and J01-02), and ignored allelic differences (V01-02:01 → V01-02).
To test whether Vβ and Jβ usage frequencies are paired, we compared the Vβ, Jβ frequency distribution of functional (F) clones in each sample with the one expected under the null hypothesis of independent pairing. To compute that, the marginal probability of each Jβ (i.e., the probability that a randomly chosen clone would have a given Jβ - x-axis in Figure 2A, and the same for Vβ - y-axis in Figure 2A) must be computed. Their product is the expected P (Vβ) P (Jβ) value (rectangle area in Figure 2A). As a schematic example, for the pair (V4, J2) in Figure 2A, P (V4, J2) is larger (i.e., has more clones) than expected by P (V4) P (J2) (i.e., it is above the diagonal in the observed vs expected plot).
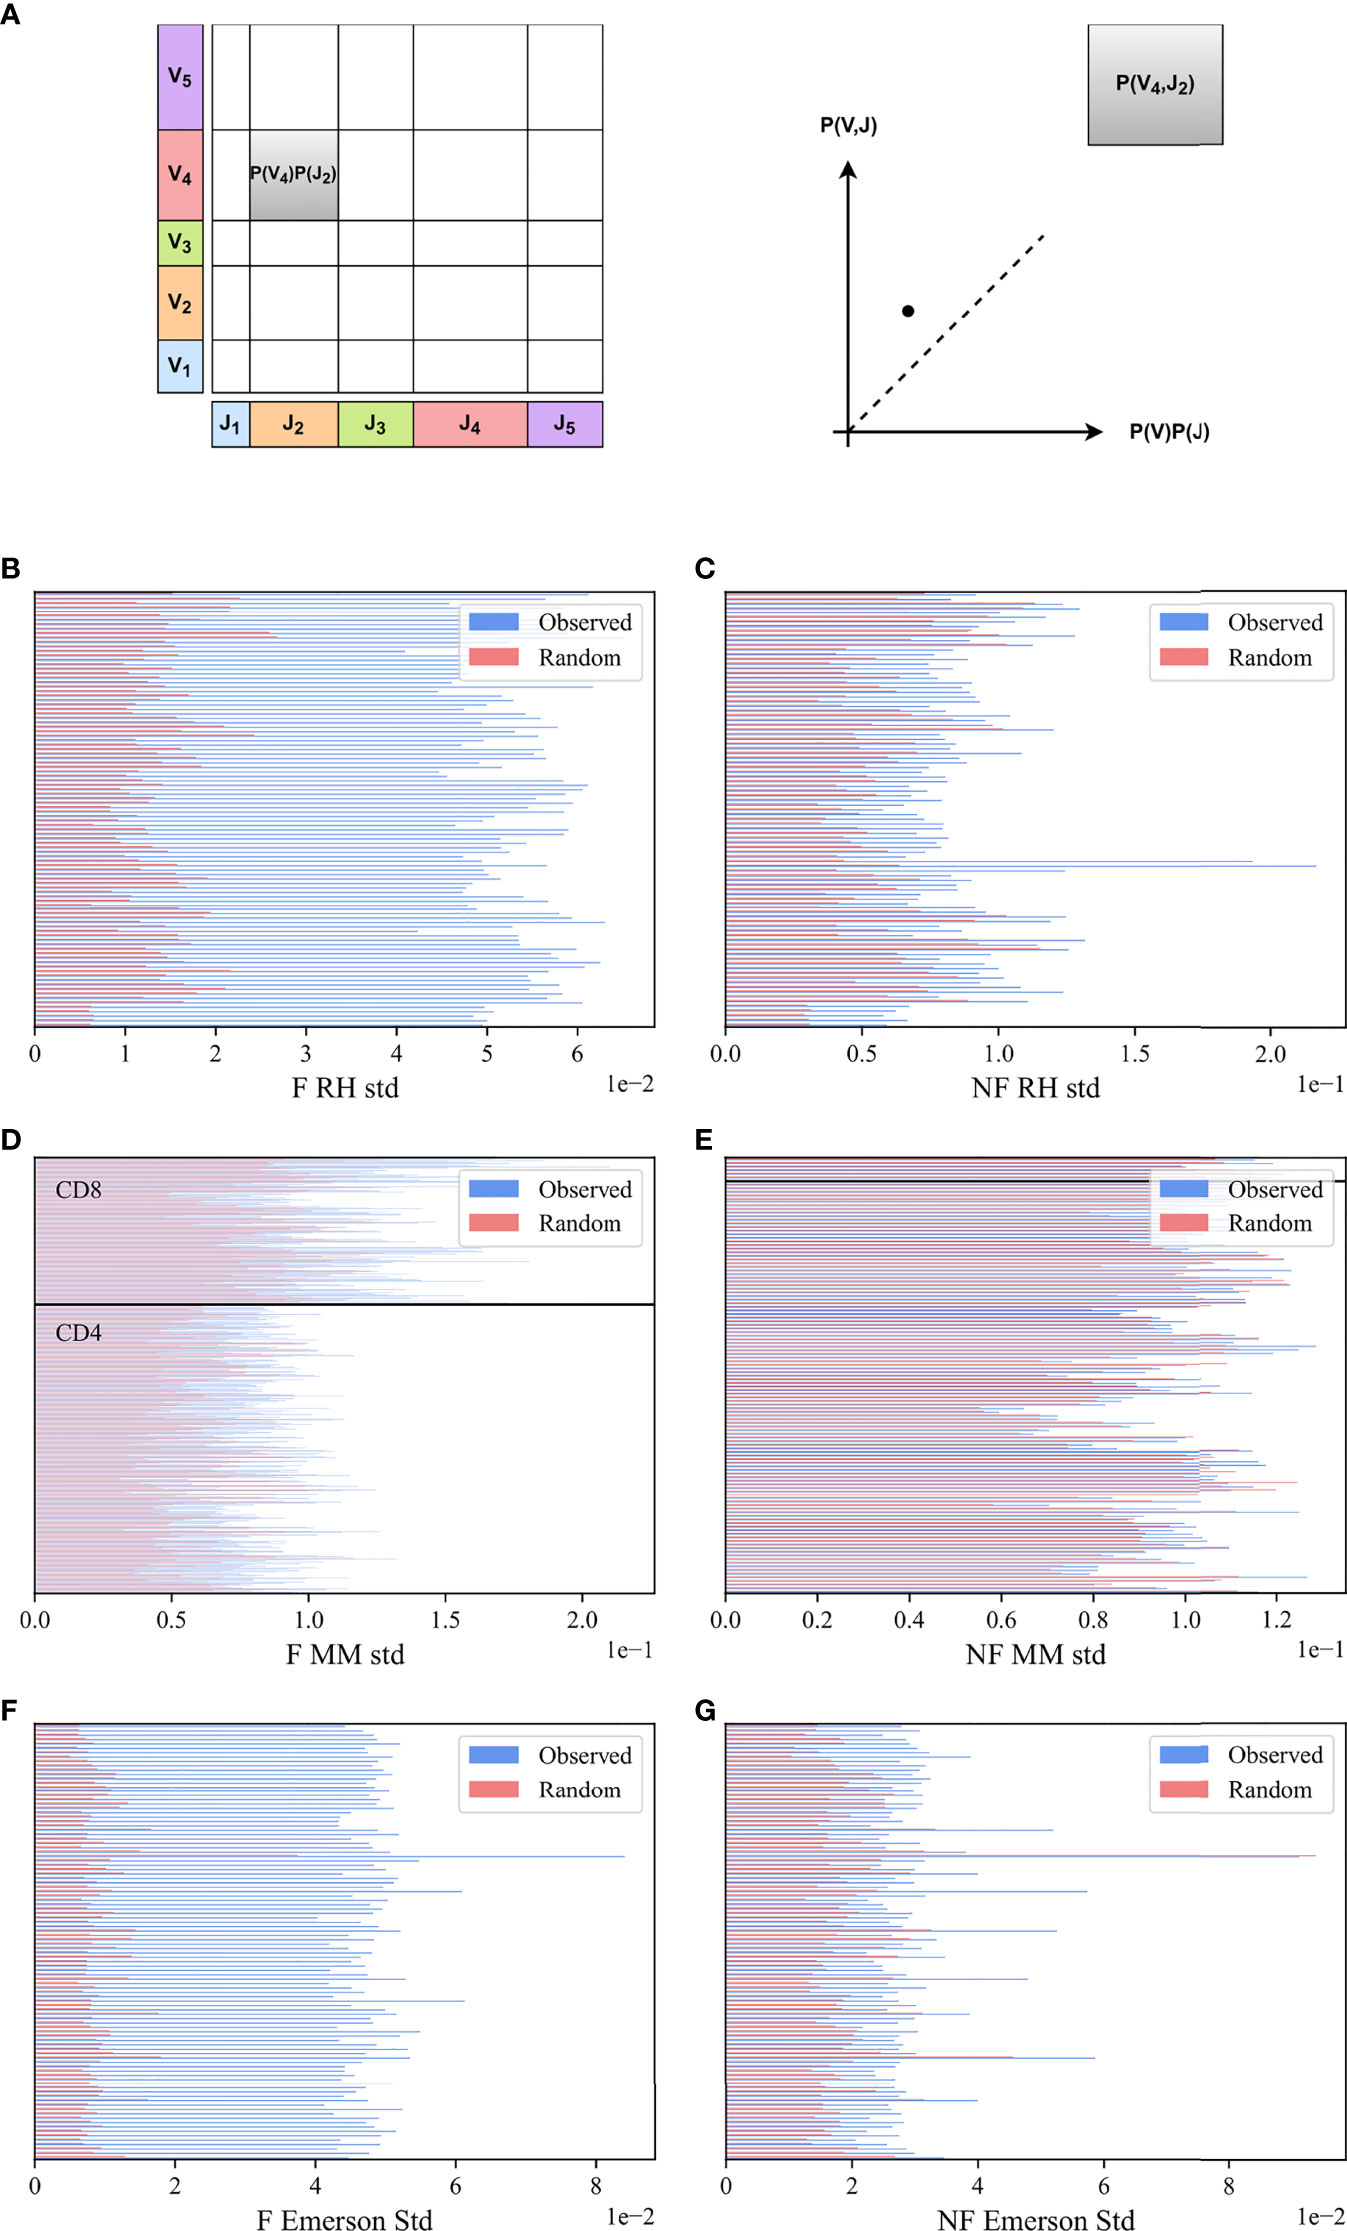
Figure 2 M (Vβ, Jβ) bias. (A) Schematic explanation M (Vβ, Jβ) measure. We computed the marginal frequency in a sample of Jβ and Vβ (X and Y axes), defined to be the fraction of clones using each. We then computed their product (size of rectangles), and compared this product with the actual number of clones that use a given Vβ, Jβ pair. (B, C) The standard deviation of M (Vβ, Jβ) values for the RH dataset. The blue bars describe the real F clones values (B) and the real NF clones values (C) while the pink bars represent the null model. (D, E) The standard deviation of M (Vβ, Jβ) values for the MM dataset, with the same colors. All samples above the black line are CD8 T-cells, and below are CD4 T-cells. (F, G) Same results for the Emerson dataset.
To systematically quantify this deviation, we computed for each (Vβ, Jβ) pair in a given sample:
While, in principle, the value of M (Vβ, Jβ) is expected to be zero for random pairing, finite size effect can induce deviations from zero. We thus compared the distribution of M (Vβ, Jβ) to the null model results, where the Vβ and Jβ of the clones were scrambled. Specifically, we used the clones in the sample and randomly reassigned the Vβ genes of the different clones (see Methods). The distribution of M (Vβ, Jβ) for the F clone is wider than for the null model, as further shown.
To quantify the difference, we computed the standard deviation in the real and null model of M (Vβ, Jβ) distributions and performed a paired T-test on the standard deviations in the real and null models over all samples for each dataset. The standard deviation of the real clones is larger than the null model for all files (Figures 2B, D, F) for RH, MM and Emerson datasets, p-value 8.3e-89, 2.04e-129 and 2.23e-99, respectively). We further performed a Kolmogorov-Smirnov test (29) on the distributions in the real data and the null model for all samples together, with a very significant difference (p – value < 1e – 100, 7.24e – 89,1e – 100 for the respective datasets).
In order to check whether the bias of Vβ Jβ usage also exists in the NF clones, we computed M (Vβ, Jβ) in the non-functional data (for all the datasets), and found a deviation from the Vβ and Jβ null model also in NF rearrangements. The standard deviation of the NF clones is slightly larger than the standard deviation of the null model (p-value 1.79e-24, 5.26e-16 and 3.15e-9, respectively) (Figures 2C, E, G). The deviation from the null model in NF clones is much smaller than in F clones. A Kolmogorov-Smirnov test for all samples together shows a significant deviation from the null model for the NF clones for two out of the three datasets studied (p-value 1.45e-27, 0.14, 3.61e-50). To summarise, a very strong deviation from the null model is observed in F clones, and a weak yet significant deviation exists in NF clones.
We further checked if there is a difference between the CD4 and the CD8 T-cells (Figure 2D, all the samples above the black line are CD8 T-cells, and below are CD4 T-cells) in the F clones. The standard deviations in the CD8 cells are larger than in the CD4 cells (CD8 mean std 0.12 vs CD4 mean std 0.08, p-value 6.89e-53 for the F clones). We tested whether there is a difference between the groups using a two-way ANOVA test (p-value of 4.89e-91 for CD4 vs CD8, 1.5e-71 of observed vs the null model, and a limited yet significant interaction effect). When combining F and NF, the two-way ANOVA test yields a p-value of 0.005 for CD4 vs CD8, 0.002 for Real NF vs Random, but as expected no interaction effect (p=0.98)
The difference between CD4 and CD8 T cells occurs during or after thymic selection and is antigen induced, suggesting at least a partial effect of antigen induced selection on pairing. However, the difference is small, suggesting that other more generic mechanism may drive this pairing.
We further tested in the RH dataset whether there is a difference between HV (healthy volunteers) samples and samples of patients who had been diagnosed with alopecia by using a two-way ANOVA test. We obtained a p-value of 3.74e-4 for healthy vs unhealthy, 1.62e-125 for observed vs random and 0.244 for the interaction effect, suggesting that the difference between the real data and the null model is not induced by the condition of the host (at least for alopecia).
To summarize, a bias Vβ Jβ usage was found in both F and NF clones, with more significant differences for the F clones, and limited differences between CD4 and CD8 T cells. Antigen-driven selection may be a simple explanation for the differences we found between F and NF clones. An alternative model may be preferential pairing of Vβ and Jβ during rearrangement, or a structural selection preceding selection in the thymus. We here provide multiple lines of evidence for the last possibility, with a major contribution of structural selection.
Beyond the models above, a simple explanation for the preferential pairing could be that some Vβ prefer some Dβ 1 or Dβ 2, which in turn prefer some Jβ, leading to indirect pairing, between Vβ and Jβ. T-cells have only two Dβ genes and two cassettes of Jβ, where jβ genes in the Jβ 1 cassette bind to Dβ 1 and jβ genes in the Jβ 2 cassette can bind both Db D_\β genes. Thus, if the preferential Vβ Jβ binding would be induced by the choice of a specific Dβ gene, it should disappear, when only clones with Jβ genes in the Jβ 1 cassette are analyzed. We thus separated all clones according to their Jβ gene groups, and analyzed the pairing in each group separately (Jβ 1 and Jβ 2). Formally, we separated each repertoire into two sub-repertoires according to the family of the Jβ gene. Then, we calculated M (Vβ, Jβ) for each sub-repertoire, and repeated the tests above (Figure 3).
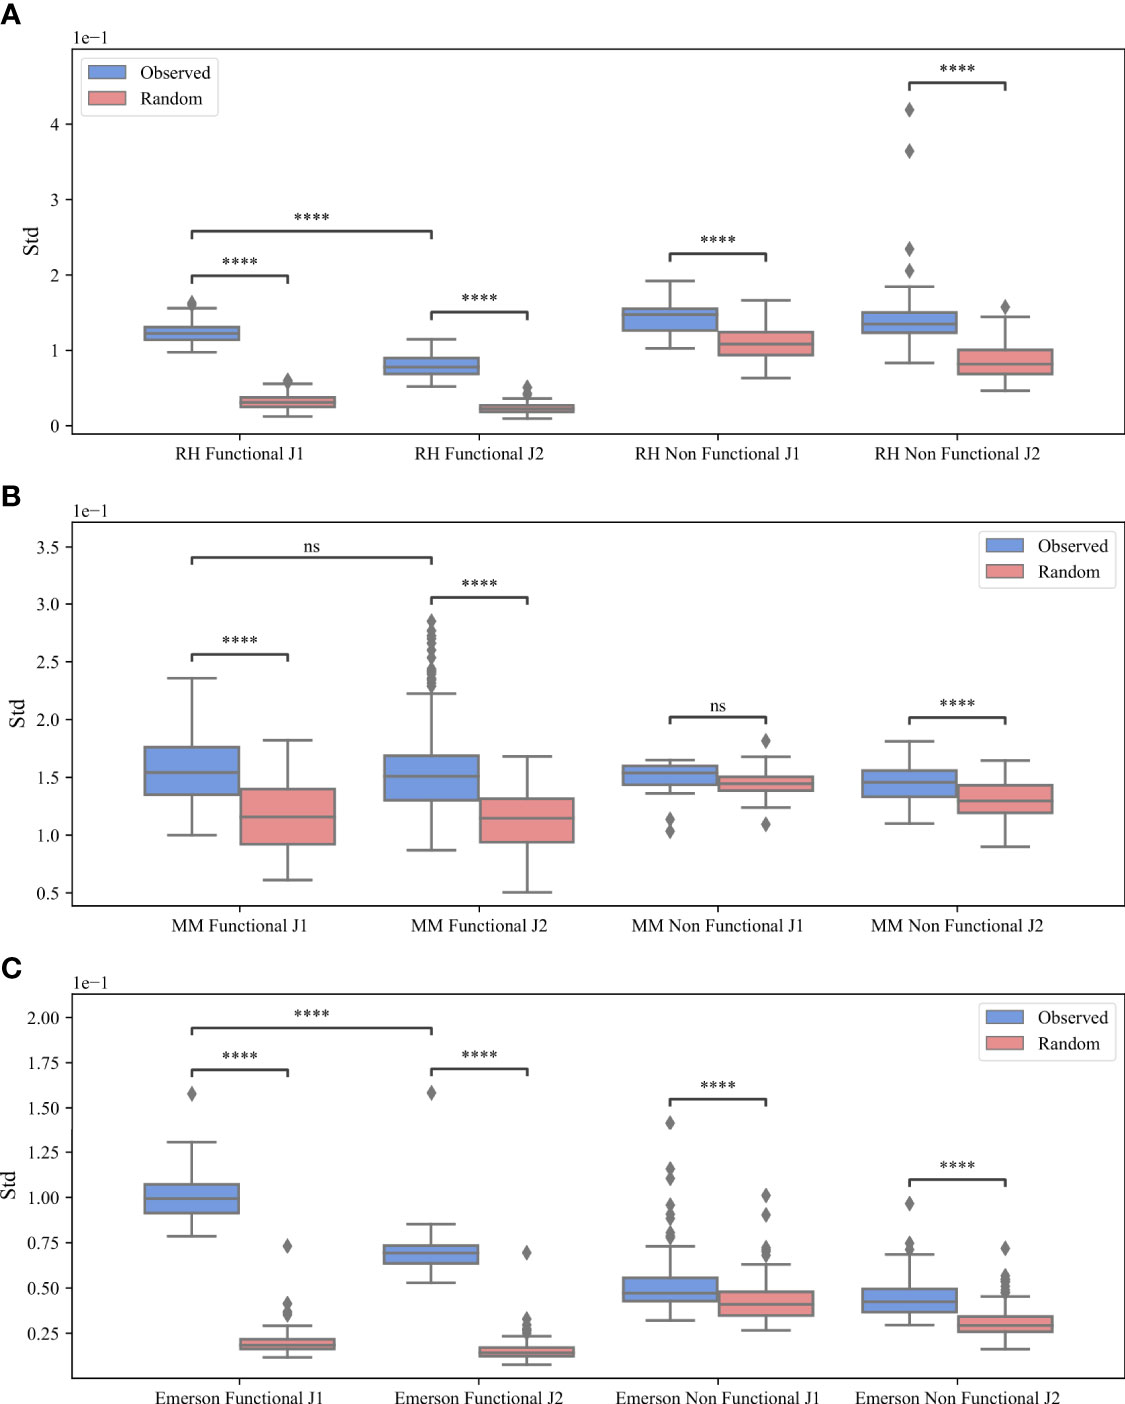
Figure 3 M (Vβ, Jβ) bias. The standard deviation of M (Vβ, Jβ) values for the RH dataset (A), the MM dataset (B) and the Emerson dataset (C). The x-axis represents whether the clones are functional or non-functional and the different Jβ gene families, while the y-axis represents the standard deviation. The blue boxes describe the real clones values and the pink boxes represent the randomly generated clones. The boxes extend from the Q1 to Q3 quartile values of the data, with a line at the median (Q2). The whiskers extend from the edges of the box to show the range of the data, they extend to 1.5 * IQR (IQR = Q3 - Q1) from the edges of the box, ending at the farthest data point within that interval. Outliers are plotted as separate dots. A T-test was performed to test how significant the differences between the observed and random standard deviation of the M (Vβ, Jβ) values are, where ****p-value < 0.0001, ***p-value < 0.001, **p-value < 0.01, *p-value < 0.05 and ns p-value > = 0.05.
For all datasets, the standard deviation of the real data is larger than the standard deviation of the null model (blue vs pink boxes in Figure 3). The difference between the real data and the null model is larger for the Jβ 1 gene than in the Jβ 2 (Figures 3A vs 3B, but there is still a difference in the Jβ 2 as well. The mean standard deviation for the F clones is 0.12 (Jβ 1) vs 0.07 (Jβ 2) for RH, 0.156 (Jβ 1) vs 0.153 (Jβ 2) for MM and 0.099 (Jβ 1) vs 0.069 (Jβ 2) for the Emerson data. We performed a T-test for the F clones between Jβ 1 and Jβ 2 and found that for the RH and Emerson datasets there are significant differences between Jβ 1 and Jβ 2 (p < 7.04e - 57 and p < 1.92e - 44) compared to MM where we found no significant difference (0.25). In addition, for all datasets, the difference between the real data and the null model is significant for both Jβ 1 and Jβ 2 genes (p < 0.0001 forall comparisons), except for the NF clones in the Jβ 2 MM dataset (p > 0.05). Thus, selection for Dβ cannot explain the observed bias.
If pairing is induced by structural selection, it should be similar between hosts and samples. Alternatively, if the pairing is antigen-driven, we would expect it to differ between hosts and especially between CD4 and CD8 T cells. To test for that, we computed the Spearman correlation between the M (Vβ, Jβ) values for all sample pairs from different hosts in the RH dataset, and computed the distribution of the correlation (Figures 4A, B) for the F clones (blue bars), the NF clones (brown bars) and the null model (beige bars). For each pair of samples, only the common (Vβ, Jβ) pairs of these two samples were taken. One can clearly see that the correlation of the null model is centered around zero, while the correlation of the real data is centered around 0.6 for the F clones and 0.2 for the NF clones. The same holds for the other datasets (data not shown). The similarity between samples is consistent in the different Jβ gene families (Jβ 1 - Figure 4A and Jβ 2 - Figure 4B). Interestingly, even for the NF clones, the correlation is centered around positive values, albeit lower than the F clones, suggesting a genetic mechanism in addition to the structural one (ANOVA test, p < 1e - 100 for both Jβ 1 and Jβ 2). T-tests between the F and NF correlation distribution and the random distribution p < 1e - 100 for both Jβ 1 and Jβ 2).
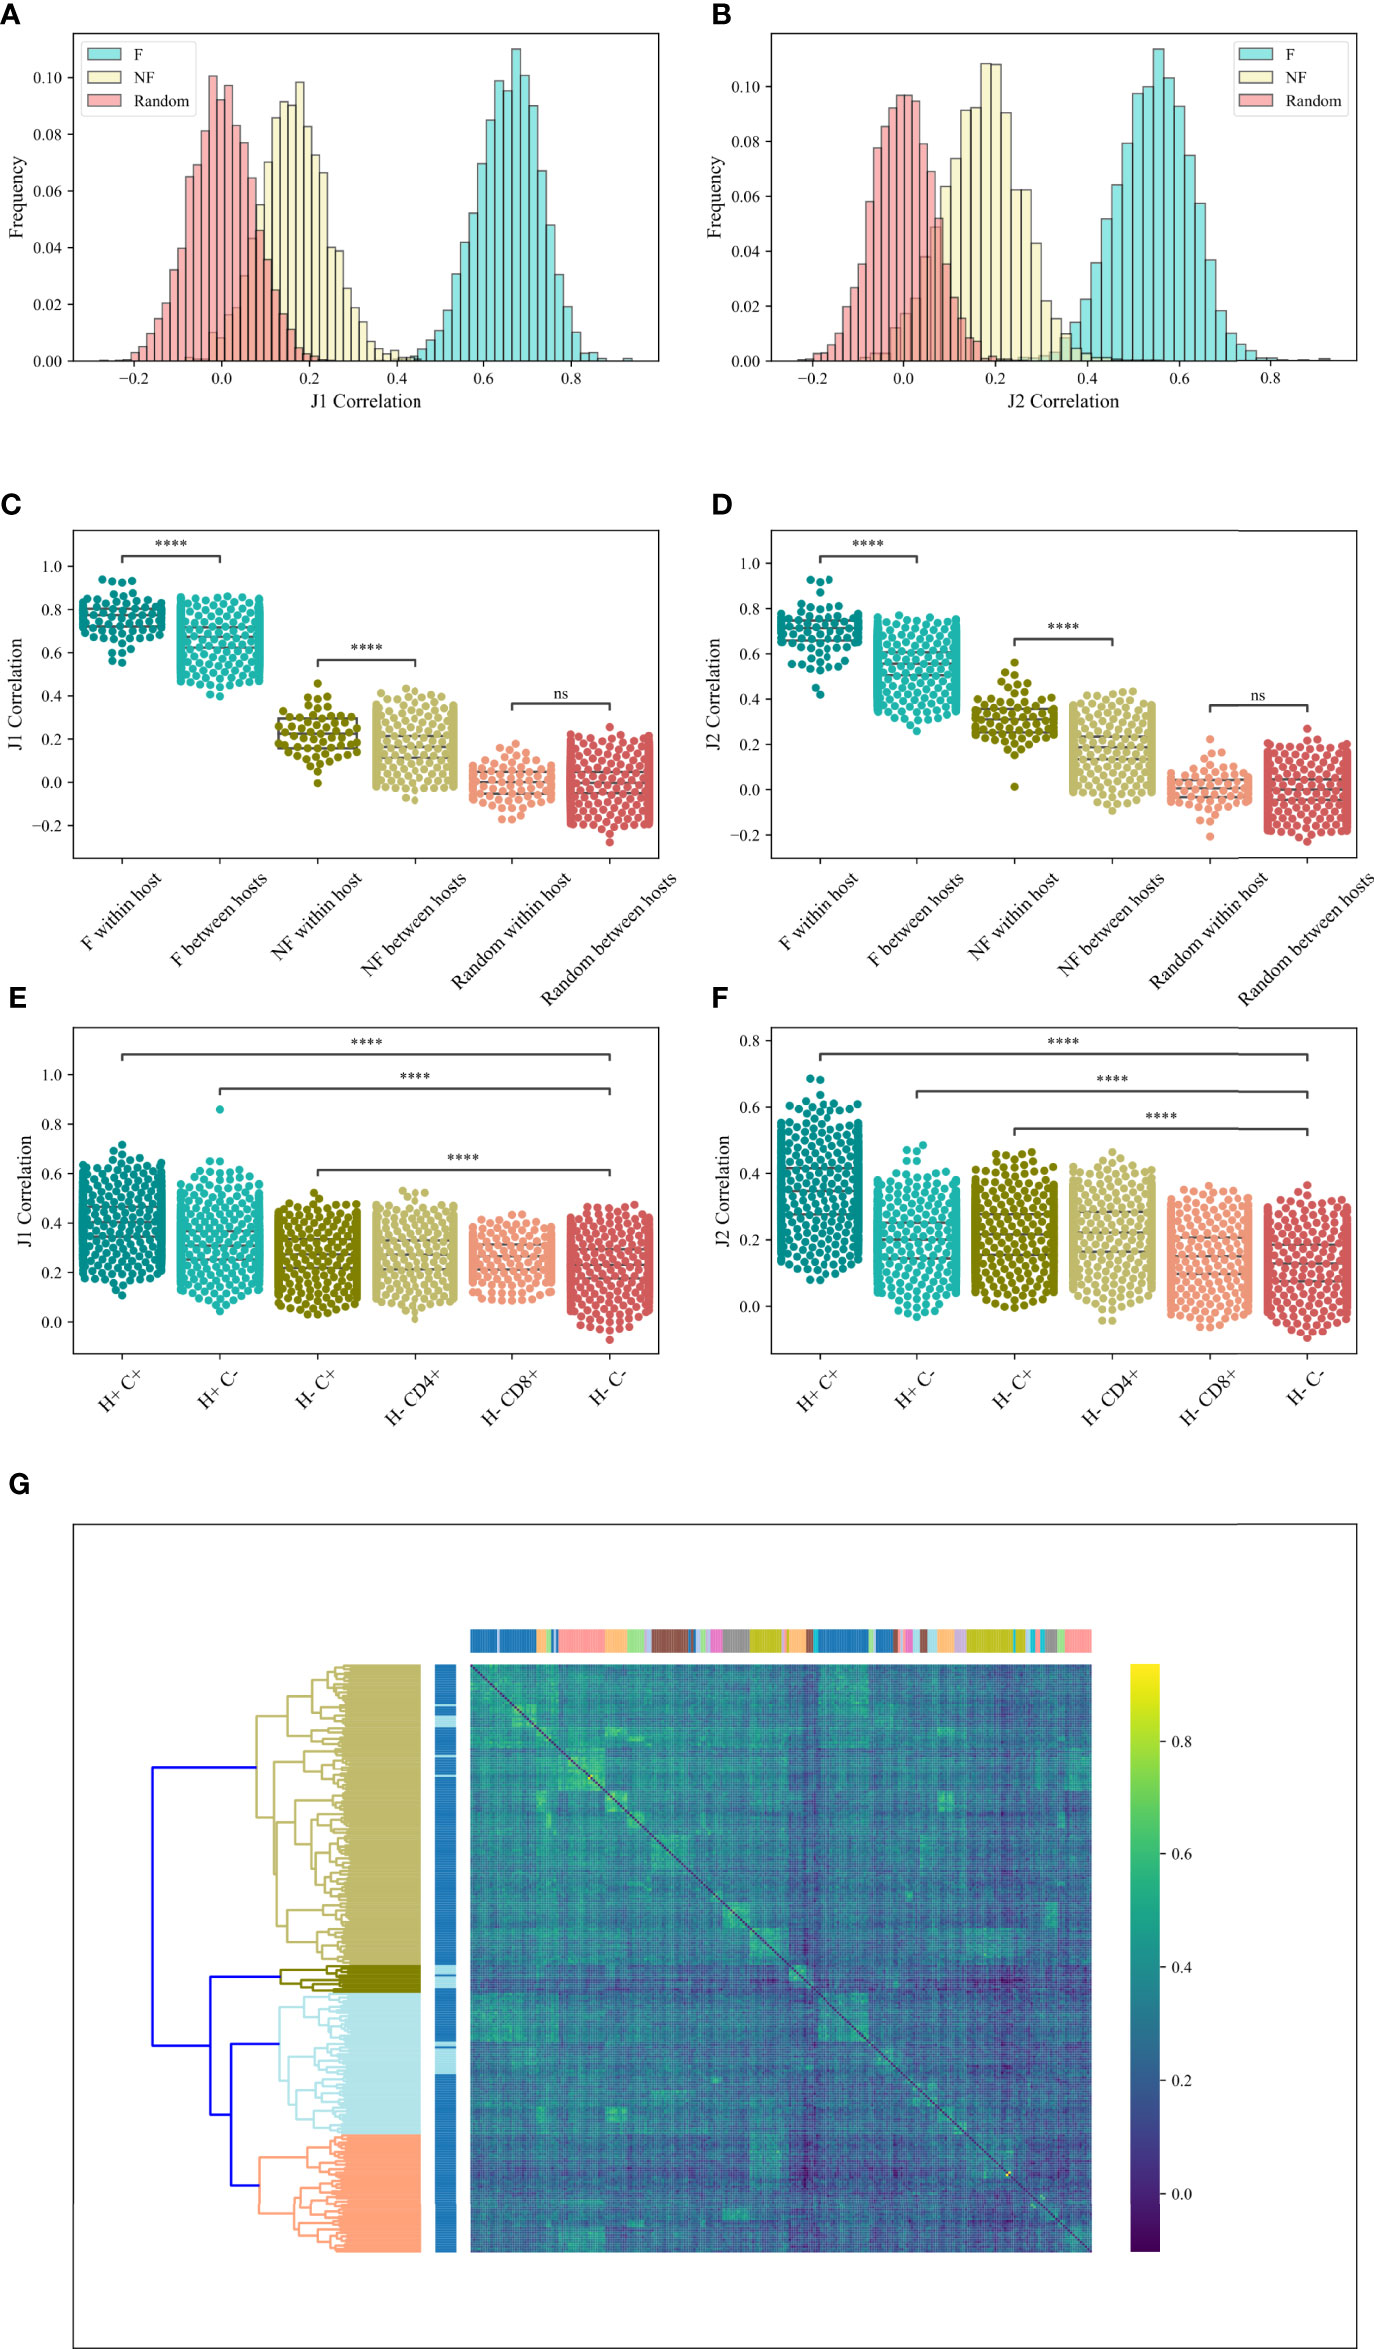
Figure 4 M (Vβ, Jβ) correlation. (A, B) The correlations histogram of the M (Vβ, Jβ) values for the Jβ 1 family gene (A) and the Jβ 2 family gene (B) in the RH dataset. The blue histogram represents the F clones, the beige histogram is the NF clones and the pink histogram represents the null model. (C, D) Correlations of M (Vβ, Jβ) values for the Jβ 1 family gene (C) and the Jβ 2 family gene (D) in the RH dataset within host and between hosts for F, NF and random clones. Star symbols follow the previous plot. (E, F) Correlations of M (Vβ, Jβ) values for the Jβ 1 family gene (E) and the Jβ 2 family gene (F) in the MM dataset, where H+ represents within host, H- represents between hosts, C+ represents within compartment, C- represents between compartments. (G) Heatmap of the correlations of M (Vβ, Jβ) values for the M Jβ 1 family gene of the F clones in the MM data set. At the top we colored according to a patient, while on the left we colored according to the compartments (CD4 or CD8).
Samples from the same host share the same genetic Vβ and Jβ loci compositions. If the Vβ, Jβ pairing is affected by a genetic bias, we expect samples from the same host to have more similar biases than between hosts. Indeed, a slightly higher correlation was observed in samples within-host than between hosts for both F and NF samples (T-test between the correlations within-host and the correlations between hosts for both Jβ 1 and Jβ 2 genes: F clones – p < 6.68e - 39 (Jβ 1) and p < 3.52e - 75 (Jβ 2), NF clones – p < 3.37e - 8 (Jβ 1) and p < 3.39e - 50 (Jβ 2), null model – p = 0.91 (Jβ 1) and p = 0.22 (Jβ 2) (Figures 4C, D, RH dataset).
In contrast, CD4 and CD8 T cells recognize completely different epitopes (presented by either MHC class I or class II). If antigen-driven selection also contributes to the paring mechanisms, we would expect CD4 T cells clones to have more similar pairing to other CD4 T cells than to CD8 T cells and vice versa.
To test for that, we explored the correlations between the values of M (Vβ, Jβ) among patients and compartments and compared the effect of compartment vs the effect of hosts. We analyzed the F clones of the MM dataset. In order to check whether samples of the same patient or the same compartment are more similar, we computed the correlation within hosts (H+), within compartments (C+) and between hosts (H-) and between compartments (C-). For Jβ 1 family, the correlations within compartment (H-C+) were only slightly higher than the one between compartments (H-C-) (0.27 vs 0.23 on average, T-test p < 2.46e - 225). However, the correlations within hosts (H+C-) were much higher (0.31 on average, T-test vs H-C- p <1.23e - 148). The correlations within-host and compartment (H+C+) were the highest (0.4 on average, T-test vs H-C- p < 1e - 100) (Figure 4E). For Jβ 2 family gene, the correlations within compartment (H-C+) and within hosts (H+C-) were slightly higher than the one between compartments (H-C-) (0.2 vs 0.12 on average, T-test p < 1e - 100). The correlations within-host and compartment (H+C+) were the highest (0.34 on average, T-test vs H-C- p < 1e - 100) (Figure 4F). In addition, two-way ANOVA was done for the Jβ 1 and the Jβ 2 family genes (p < 0.0001 and p < 1.6e - 35 for CD4 vs CD8, p < 1e - 100 for functional vs random for both families, and p < 0.0046 and p < 1.97e - 63 for the interaction effects, respectively).
We further tested if samples in the same host or same compartment were clustered together, we clustered the correlations using hierarchical clustering based on the Euclidean distance and complete linkage [Figure 4E - Top coloring is according to a patient, and left coloring is according to the compartments (CD4 or CD8)]. As one can see, samples from the same patient (neighbors of the same color on the top) are grouped together and there is a clean division between samples from different patients, with no separation between CD4 and CD8 T cells (chi-square test vs random label permutations p < 2.39e - 124). Compartments were not grouped more than expected randomly. The stronger similarity within donors further suggests a stronger effect of the genetically induced bias in the rearrangement mechanism than the antigen-driven one, and the correlation in all samples that is higher in the F than NF clones suggest an important component of structural selection.
If the selection is indeed genetic/structural and it happens before any antigen-induced selection, we expect the pairs selected for and against to be consistent among datasets, and between CD4 and CD8 T cells. To test that, we analyzed all the (Vβ, Jβ) pairs with the most significant deviation from random pairing (p < 0.01), and found that there is a large overlap in these specific pairs between the different datasets (107 vs 49.66 expected randomly, chi-square p < 4.1e - 16 for the Jβ 1 family, and 82 vs 45.9 expected randomly, chi-square p < 9.9e – 8 for the Jβ 2 family). In addition, most of the significant pairs that overlap between the three datasets have the same deviation sign (98/107, i.e., 91% for Jβ 1 and 70/82, i.e. 85% for Jβ 2).
We further analyzed the common significant pairs (p – value < 0.01) between any two datasets, and compared M (Vβ, Jβ) values among datasets, or among compartments in the same dataset (CD8 vs CD4 cells). Indeed, M (Vβ, Jβ) is highly consistent among the datasets for both Jβ 1 and Jβ 2, with a higher average correlation for Jβ 1 (0.81 vs 0.72) (Figure 5, where the pink points represent the common pairs of the 10 most significant pairs between each of the two datasets). The same happens between compartments (Jβ 1 R=0.8 correlation and Jβ 2 R=0.69, p < 3.16e – 18 and p < 2.03e - 13, respectively).
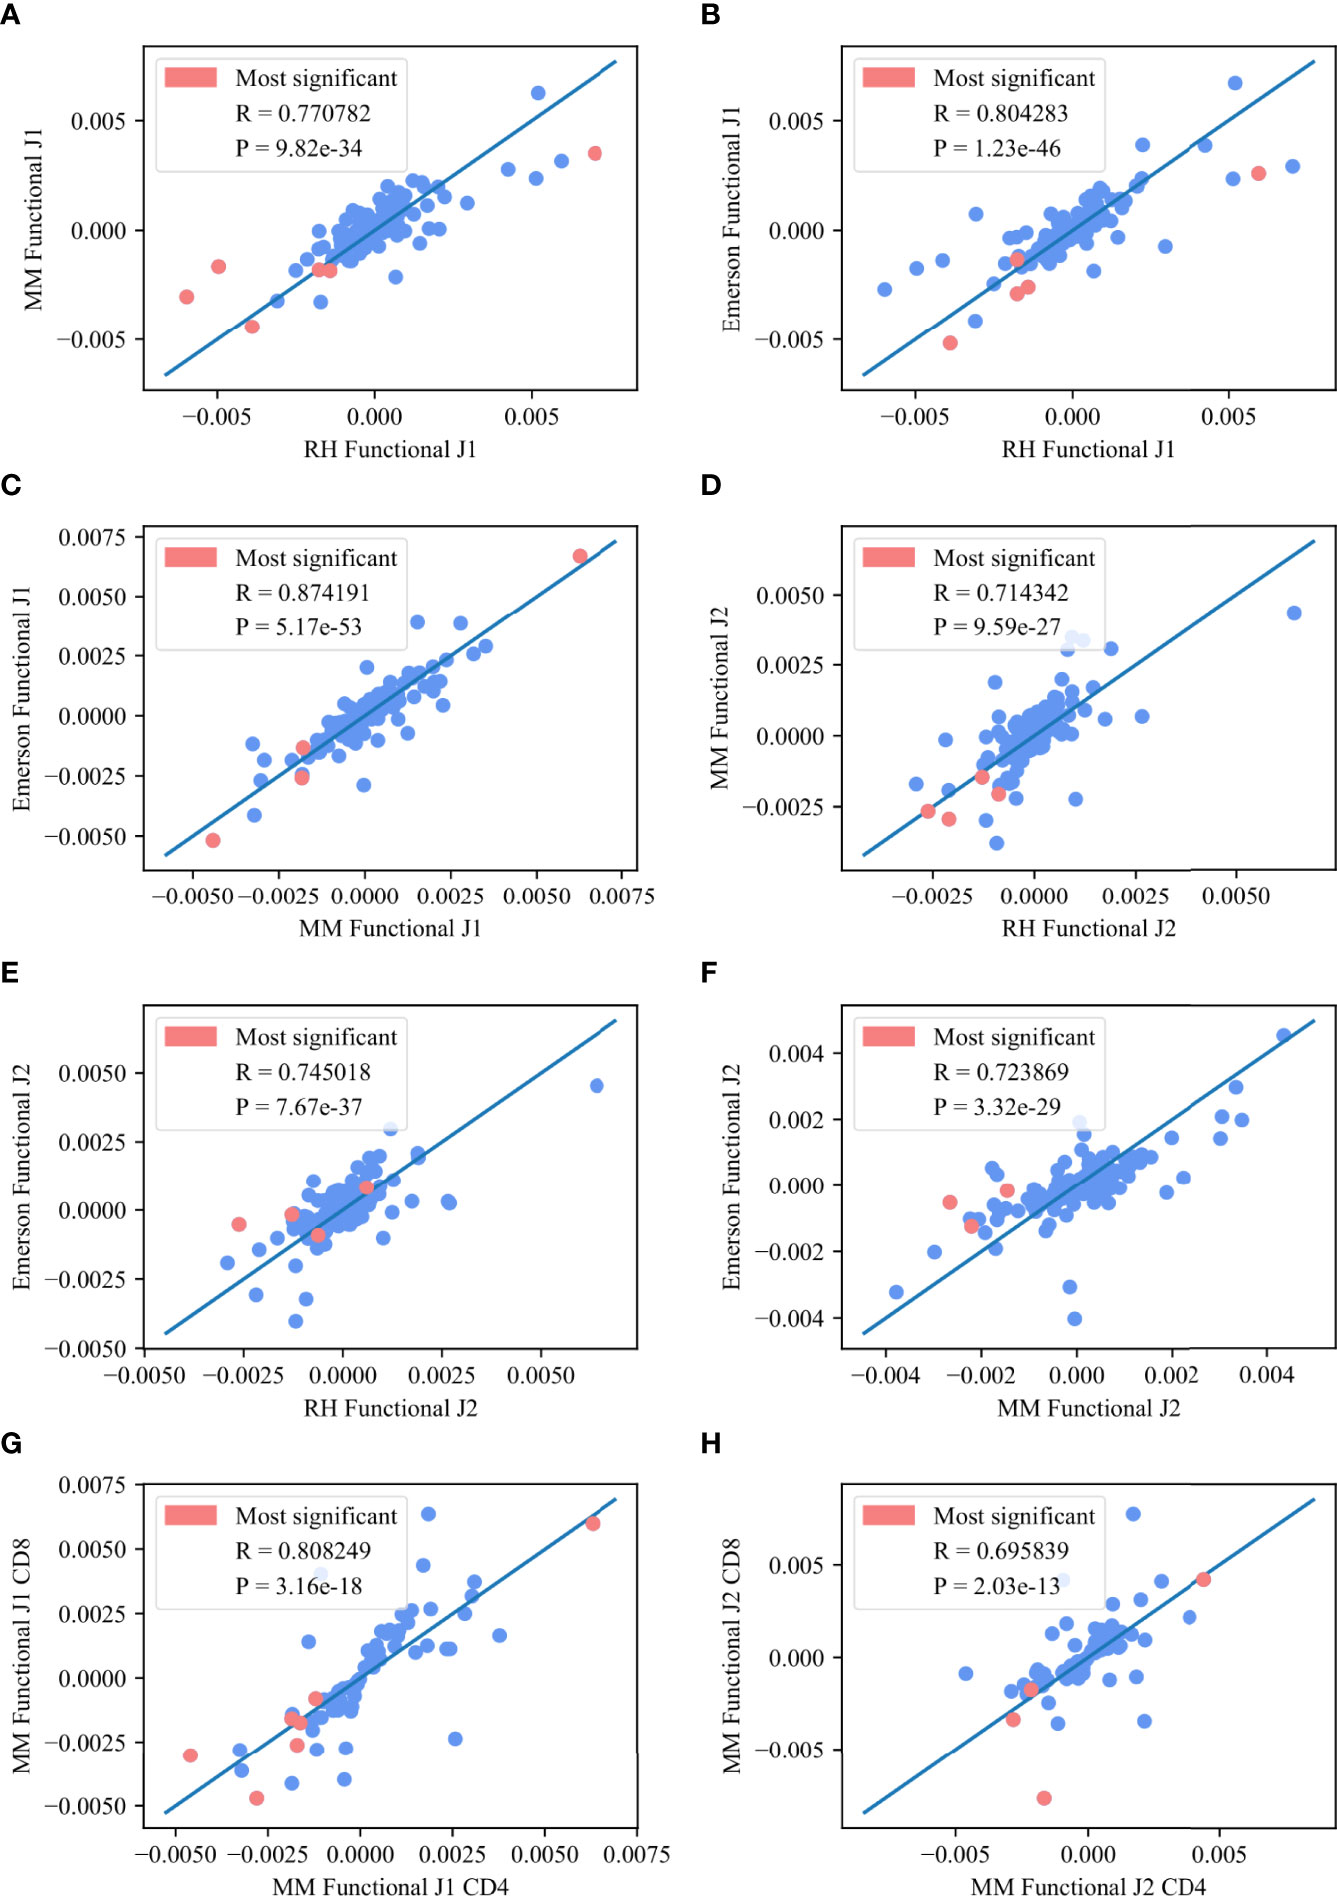
Figure 5 Deviation from random pairing. (A–F) M (Vβ, Jβ) values between any two functional datasets for the Jβ 1 family gene (A–C) and the Jβ 2 family gene (D–F). The pink points represent the common pairs of the 10 most significant pairs between these two datasets. (G, H) M (Vβ, Jβ) values for the CD8 T-cells in the MM functional for the M Jβ 1 family gene (G) and the Jβ 2 family gene (H) asa function of M (Vβ, Jβ) values for the CD4 T-cells in the MM functional for the same family gene. The pink points represent the common pairs of the 10 most significant pairs between these two data sets.
The top Vβ - Jβ preferential gene pairings were V05 – 01 / J01 - 05, V29 – 01 / J01 - 01, V05 – 04 / J01 - 05, V29 – 01 / J01 - 06, V06 – 01 / J01 - 05, V29 – 01 / J01 - 05, V09 – 01 / J01 - 05, V19 – 01 / J01 - 05 and V11 – 02 / J01 - 05 for the Jβ 1 family and V24 – 01 / J02 - 07, V20 – 01 / J02 - 06, V06 – 05 / J02 - 03, V07 – 07 / J02 - 05, V20 – 01 / J02 - 02, V11 – 03 / J02 - 07 and V07 – 07 / J02 - 07 for the Jβ 2 family. All of these pairs are in the 10 most significant pairs for each dataset and overlap between at least two of the three datasets. This high correlation again suggests a generic structural mechanism that is not antigen driven.
To further show that the bias is due to rearrangement and structural selection, the Vβ,Jβ preferred pairing should be present even before any antigen-induced selection event, and should be much larger in F than NF clones even early in thymic development. To test for that, we analyzed mice thymocytes, and computed deviation from random pairing in samples of Double Positive cells. As was done for the human data, we computed for each functional sample the standard deviation of the real and null model $M(V_\β,J_\β)$ i.e. M(Vb,Jb) distributions and performed a paired T-test on the standard deviations in the real and null models (Figure 6). Indeed, there is a very clear bias already in the Double Positive samples both for the Jβ 1 family (Figure 6A, p-value 6.47e-11) and for the Jβ 2 family (Figure 6B, p-value 8.89e-13), and the preferred pairing is much stronger in F than NF.
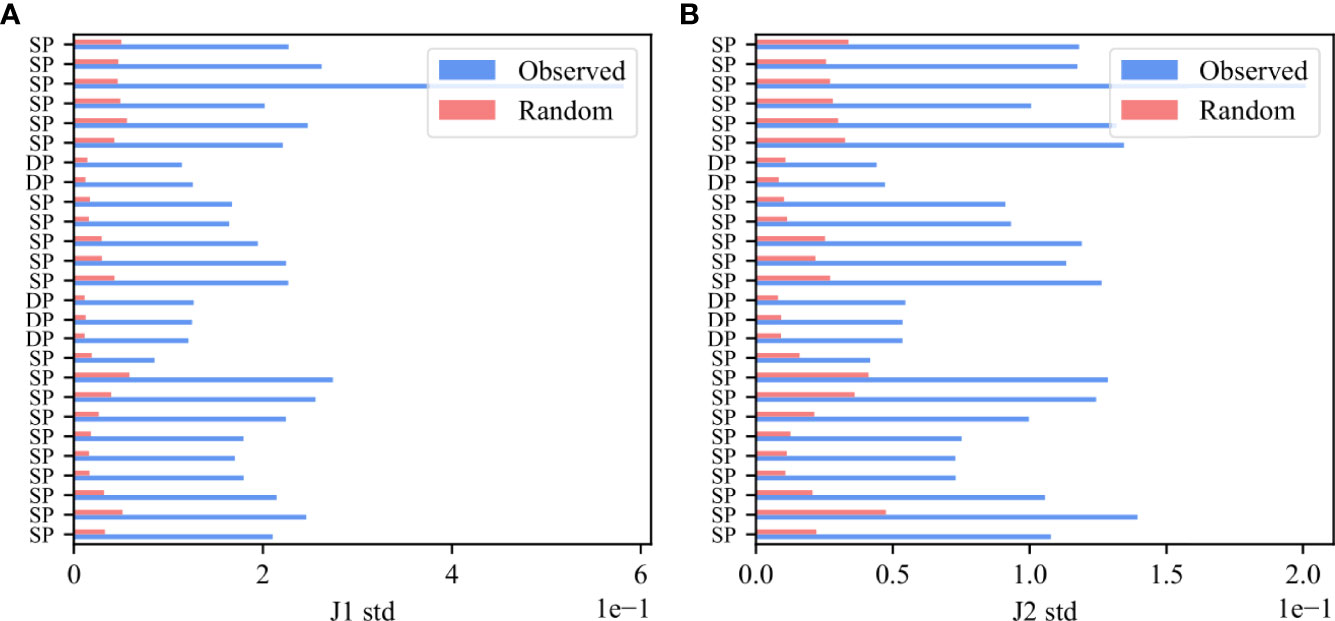
Figure 6 Bias in Double Positive samples in mice thymocytes. The standard deviation of M (Vβ, Jβ) values for the Jβ 1 family gene (A) and for the Jβ 2 family gene (B). The blue bars describe the F clones values and the pink bars represent the null model.
We have shown that (Vβ, Jβ) pairing exists even in the Jβ 1 family genes that only use Dβ 1 in NF clones. However, there is no direct rearrangement of Vβ and Jβ, so it is unclear how can such a pairing occur. We hypothesized that the pairing between Vβ and Jβ is through the length of the junction between Vβ and Dβ and the length of Jβ and Dβ. In other words, different Jβ genes favor different junction lengths and so do different Vβ genes. This length preference combined with a preference for intermediate length CDR3 genes (5) can induce an indirect pairing mechanism.
To test that, we calculated the average number of insertions minus the number of deletions for each Vβ, Dβ pair, and Dβ, Jβ (Figure 7). Specifically, we computed the junction lengths by inferring the initial and final position of the germline Dβ gene, and computing the final position of the germline Vβ gene and the initial position of the germline Jβ gene, based on the beginning and end of the variable region. The junction length (that can be negative) is the difference between the end of germline Vβ and the beginning of germline Dβ for the first junction and similarly with Dβ and Jβ for the second junction. For the Jβ gene, we performed this analysis on Jβ 1 and Jβ 2 separately (Figures 7A, B), while for the V gene, we performed it only on Jβ 1 (Figure 7C). The results are similar for Jβ 2 (data not shown). Indeed, consistently, J01 - 03 has the highest average junction length and J01 - 06 has the lowest for the Jβ 1 family gene. For the Jβ 2 family, J02 - 06 has the highest, and J02 - 01 has the lowest junction length. Similarly, different Vβ have different junction lengths. Thus, Vβ and Jβ may match to ensure the proper CDR3 length.
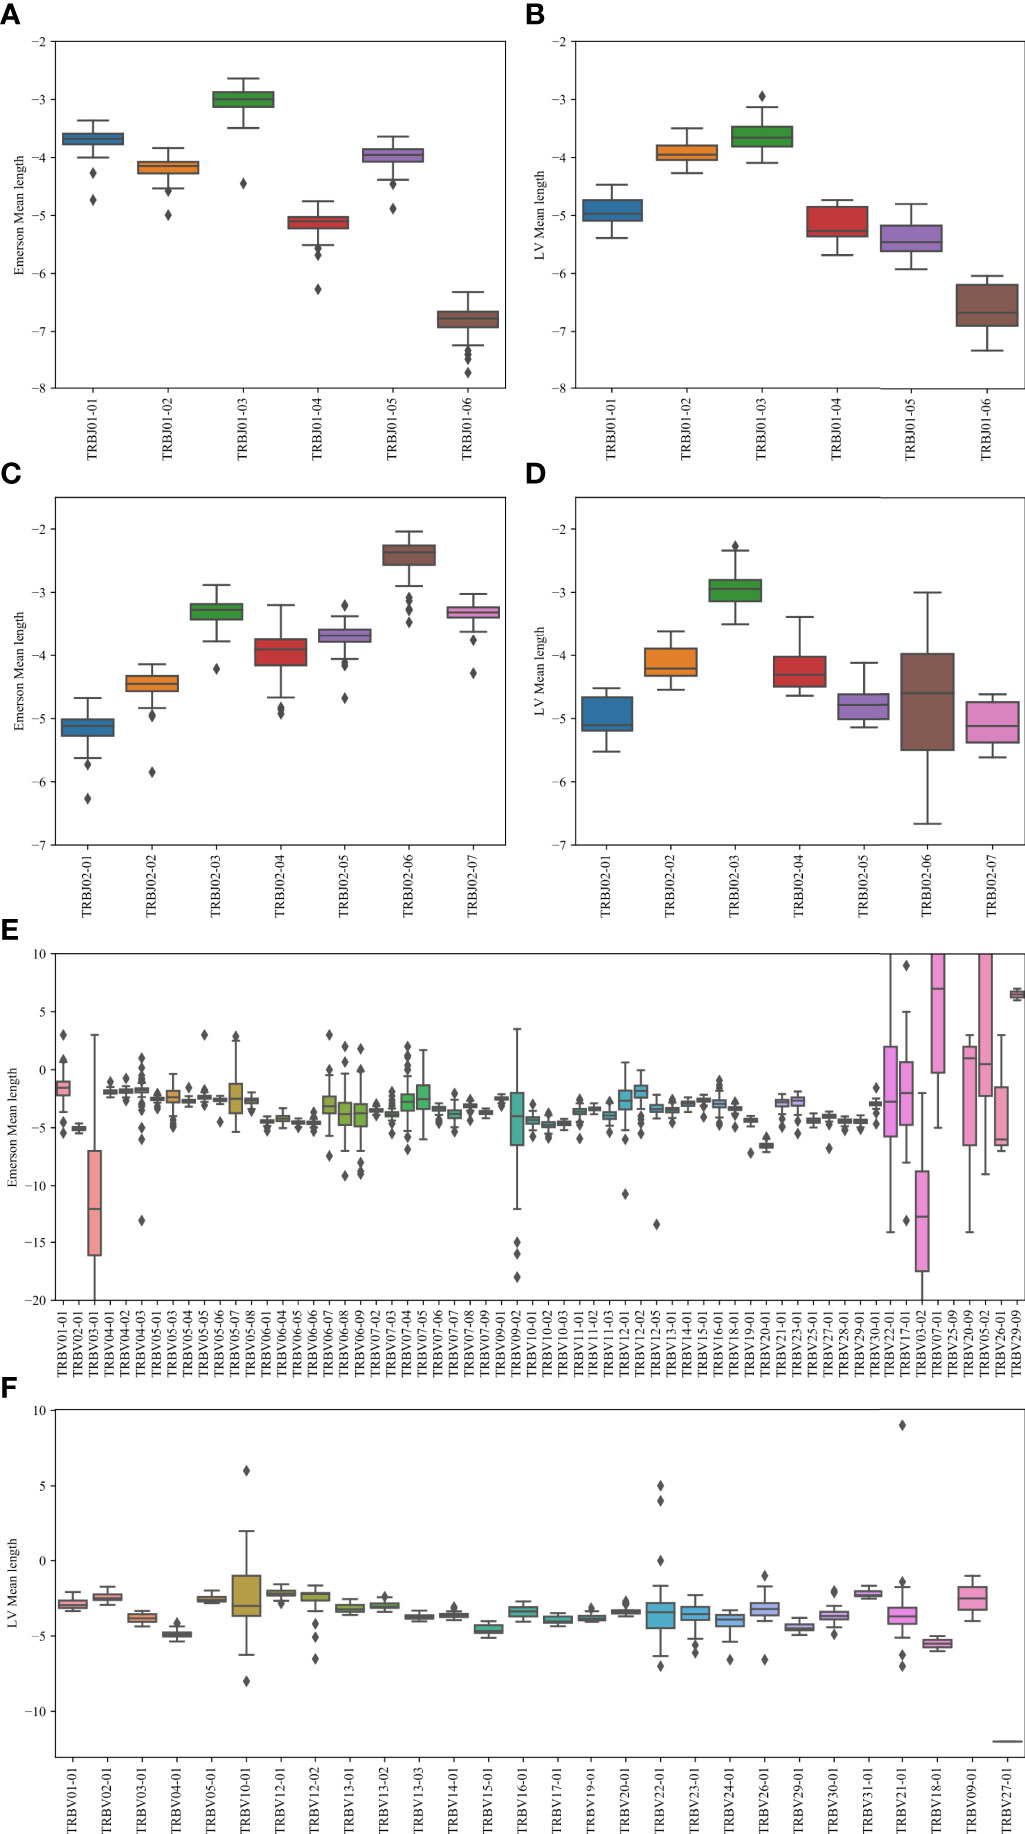
Figure 7 Junction length. In the Jβ plots, the junction length is the average distance between the beginning of the germline Jβ gene, and the end of the germline Dβ gene. In the Vβ plot, the difference is between the Vβ germline and the Dβ germline genes. (A, B) The mean distance for the Emerson dataset (A) and for the LV dataset (B). The x-axis represents the various Jβ genes within the Jβ 1 family gene. (C, D) The mean distance values for the Emerson dataset (C) and for the LV dataset (D). The x-axis represents the various Jβ genes within the Jβ 2 family gene. (E, F) The mean distance values for the Emerson dataset (E) and for the LV dataset (F). The x-axis represents the various Vβ genes within the Jβ 1 family gene. The interpretation of the boxes follows the previous plots.
To test that pairings that produce intermediate receptor sizes are preferred, we computed for the receptor with each (Vβ, Jβ) pair in each F sample, the average length (the sum of Vβ and Jβ genes length in AA), molecular weight (MW), hydrophobicity (as measured by the kyte doolittle -KD score), and charge (as measured by the iso-electric point - IP).
We computed a two-dimensional histogram on the RH dataset for both the Jβ 1 and Jβ 2 family genes for each measure (Figure 8). One can clearly see a preference of high M (Vβ, Jβ) values for intermediate to low isoelectric points, molecular weights and length, and a more complex picture for the KD. In other words, V and J genes pair to favor intermediate polarity and weight, but also some specific polarity of the resulting receptor.
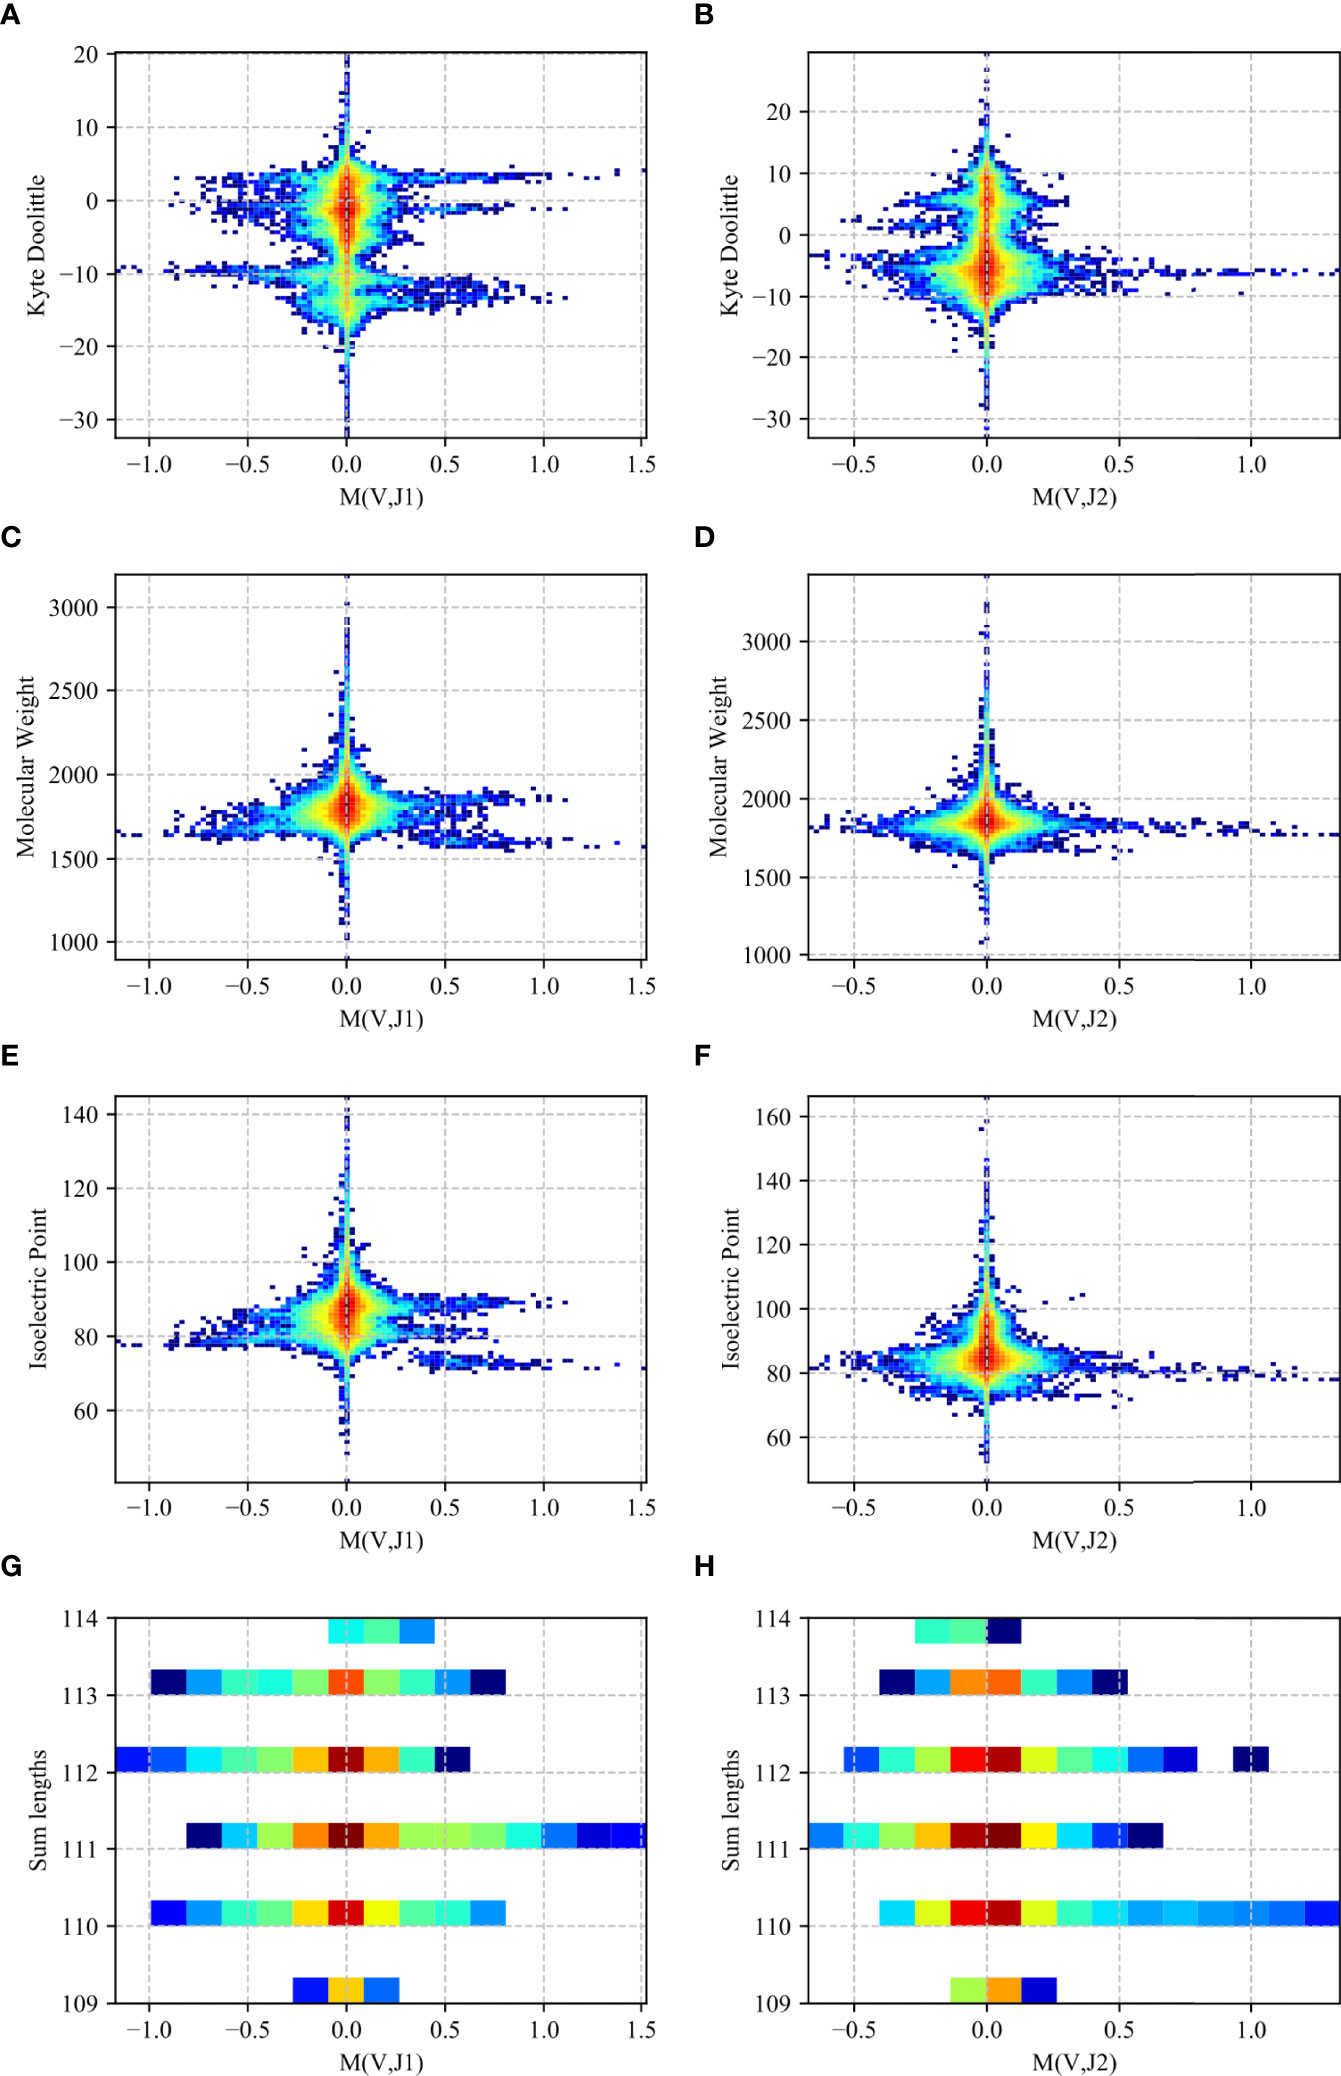
Figure 8 Two-dimensional histogram (RH dataset). 2D histogram where the x-axis represents the M (Vβ, Jβ) values for the Jβ 1 family gene (A, C, E, G) and the Jβ 2 family gene (B, D, F, H) while the y-axis represents the Kyte-Doolittle values (A, B), Molecular Weight values (C, D), Isoelectric Point values (E, F) and the sum of the gene lengths values (G, H). The colors represent the fraction of clones with such a value. Blue colors are low frequencies, while red colors are high.
The peripheral T cell receptor repertoire is known to be shaped by three main selection mechanisms - thymic positive and negative selection and antigen-driven peripheral selection (30–32). We have here shown that this repertoire is affected by another major selection step occurring in the bone marrow or in the thymus at or before the double-positive stage - a structural mechanism leading to preferred Vβ - Jβ pairing.
The genetic engineering of T cells for immunotherapy is one of the best hopes for novel cancer treatments (33). Such receptors are optimized to recognize a p-MHC target. However, the results presented here suggest that the target affinity maybe not be the only goal to optimize. To ensure that the resulting receptors are structurally stable, one may favor receptors produced naturally. We have here shown in such receptors one type of bias - preferred Vβ - Jβ pairing, associated with a preference for intermediate length, molecular weight and polarity of the CDR3. However, other biases may have to be incorporated when developing artificial TCRs.
We have shown that preferred Vβ - Jβ pairing is ubiquitous and shared in all datasets studied in F clones, with some preferential pairing occurring in NF clones too. We proposed multiple evidences for structural selection events. Specifically, we showed that the frequency of human Vβ Jβ combinations deviates from the one expected based on random pairing and each gene usage frequency. Preferred Vβ - Jβ pairs are shared between samples and between datasets. This sharing (as measured by the correlation coefficient) is maximal in samples within a donor. The correlations within each host are much higher than the correlations between different hosts, and the correlation between CD4 and CD8 T cell samples is higher than between samples from different compartments. Beyond the general distribution, the Vβ, Jβ pairs most deviating from random pairing are similar in different datasets and conditions. We have analyzed bulk sequencing, and not single-cell data. Our results are robust in different sets sampled with different methods and different primers. We thus believe they should hold in single-cell data.
Finally, very clear pairing was found already in Double Positive samples using both Jβ 1 and Jβ 2 J genes in mice. The simplest molecular explanation for such a preferential pairing would be that Vβ - Jβ pairs affect the biochemical properties of the receptor, and that receptors on the extremities of the distribution are selected against, as we have shown here for multiple biochemical properties, such as the length in nucleotides, the molecular weight, the charge and the polarity of the receptor. This is consistent with the relation between the V-J combination used and the CDR3 length distribution, especially for pathogen-specific TCRs (34) and the effect of the mouse compartment on the usage frequency of Vβ, Jβ, and Vβ - Jβ heterogeneity (35). This is further consistent with the bias in MHC-constrained systems for CDR3 length and amino acid composition. TCRs with CDR3 longer than 13 amino acids were shown to be disfavored, and positively charged and hydrophobic amino acids in CDR3β are limited, and cysteine-containing CDR3 peptide-binding regions are clonally deleted (8).
While Jβ usage is conserved between datasets, Vβ is not. However, the pairing between Vβ and Jβ is actually even more conserved than the usage of Vβ (Appendix Figure 9).
Previous studies have shown Vβ Jβ pairs that are frequent in TCR repertoires. However, to the best of our knowledge, no previous results reported a consistent deviation of Vβ Jβ usage from the one expected randomly.
Vβ (Dβ) Jβ recombination is the main diversity generation mechanism in receptor repertoires. This diversity derives in large part from the multiple combinations of possible joining events and through an inherent imprecision in the joining reaction (36, 37). This large diversity is then reduced step by step by multiple selection events. Our results suggest that beyond the antigen induced selection steps, there is a strong structural selection step. The simplest mechanism would be a preferred length for the CDR3 or a total weight for this CDR3. This could be the result for example of the need to maintain a given surface to bind the MHC, or ensure the curvature of the CDR3, again to ensure proper binding to the HLA.
While we have focused on a specific measure - the Vβ Jβ usage, such a selection may be observed in multiple other measures, such as the CDR3 amino acid usage or the pairing between α and β chains. Tests should be developed for the detection of such a selection in these other measures, and to estimate the fraction of the TCRs removes following structural selection.
As for the bias in VH and JH pairing in B cells, it is more complex based on the structure of DH in IGH (there are not only two DH genes as in the T cells, and each DH can bind each JH). Thus, a different analysis is required, since we cannot neutralize the effect of DH. We now explore this as a follow-up work.
Publicly available datasets were analyzed in this study. This data can be found here: https://elifesciences.org/articles/54747 https://link.springer.com/article/10.1186/s13073-021-00918-7 https://www.nature.com/articles/ng.3822?report=reader https://www.nature.com/articles/s41467-019-08906-7.
RL performed the analysis, produced the figures and wrote a part of the manuscript. YL supervised and conceptualized the analysis and wrote a part of the manuscript. All authors contributed to the article and approved the submitted version.
The work of RL was funded by ISF grant 870/20 and by an internal BIU DSI grant.
The authors declare that the research was conducted in the absence of any commercial or financial relationships that could be construed as a potential conflict of interest. t:
All claims expressed in this article are solely those of the authors and do not necessarily represent those of their affiliated organizations, or those of the publisher, the editors and the reviewers. Any product that may be evaluated in this article, or claim that may be made by its manufacturer, is not guaranteed or endorsed by the publisher.
We thank Miriam Beller for the English editing and prof Eline Luning Prak for the discussion on the content of the current analysis.
1. Wucherpfennig KW, Call MJ, Deng L, Mariuzza R. Structural Alterations in Peptide–Mhc Recognition by Self-Reactive T Cell Receptors. Curr Opin Immunol (2009) 21:590–5. doi: 10.1016/j.coi.2009.07.008
2. Deng L, Mariuzza RA. Recognition of Self-Peptide–Mhc Complexes by Autoimmune T-Cell Receptors. Trends Biochem Sci (2007) 32:500–8. doi: 10.1016/j.tibs.2007.08.007
3. Sewell AK. Why Must T Cells be Cross-Reactive? Nat Rev Immunol (2012) 12:669–77. doi: 10.1038/nri3279
4. Bassing CH, Swat W, Alt FW. The Mechanism and Regulation of Chromosomal V (D) J Recombination. Cell (2002) 109:S45–55. doi: 10.1016/S0092-8674(02)00675-X
5. Benichou JI, van Heijst JW, Glanville J, Louzoun Y. Converging Evolution Leads to Near Maximal Junction Diversity Through Parallel Mechanisms in B and T Cell Receptors. Phys Biol (2017) 14:045003. doi: 10.1088/1478-3975/aa7366
6. Starr TK, Jameson SC, Hogquist KA. Positive and Negative Selection of T Cells. Annu Rev Immunol (2003) 21:139–76. doi: 10.1146/annurev.immunol.21.120601.141107
7. Pobezinsky LA, Angelov GS, Tai X, Jeurling S, Van Laethem F, Feigenbaum L, et al. Clonal Deletion and the Fate of Autoreactive Thymocytes That Survive Negative Selection. NatureImmunology (2012) 13:569–78. doi: 10.1038/ni.2292
8. Lu J, Van Laethem F, Bhattacharya A, Craveiro M, Saba I, Chu J, et al. Molecular Constraints on Cdr3 for Thymic Selection of Mhc-Restricted Tcrs From a Random Pre-Selection Repertoire. Nat Cmmunicat (2019) 10:1–14. doi: 10.1038/s41467-019-08906-7
9. Matechak EO, Killeen N, Hedrick SM, Fowlkes JB. Mhc Class Ii–Specific T Cells can Develop in the Cd8 Lineage When Cd4 Is Absent. Immunity (1996) 4:337–47. doi: 10.1016/S1074-7613(00)80247-2
10. Louzoun Y, Friedman T, Prak EL, Litwin S, Weigert M. Analysis of B Cell Receptor Production and Rearrangement: Part I. Light Chain Rearrangement. Semin Immunol (2002) 14:169–90. doi: 10.1016/S1044-5323(02)00041-6
11. Tiegs SL, Russell DM, Nemazee D. Receptor Editing in Self-Reactive Bone Marrow B Cells. J Exp Med (1993) 177:1009–20. doi: 10.1084/jem.177.4.1009
12. Wallace ME, Bryden M, Cose SC, Coles RM, Schumacher TN, Brooks A, et al. Junctional Biases in the Naive Tcr Repertoire Control the Ctl Response to an Immunodominant Determinant of Hsv-1. Immunity (2000) 12:547–56. doi: 10.1016/S1074-7613(00)80206-X
13. Manfras BJ, Terjung D, Boehm BO. Non-Productive Human Tcr β Chain Genes Represent Vdj Diversity Before Selection Upon Function: Insight Into Biased Usage of Tcrbd and Tcrbj Genes and Diversity of Cdr3 Region Length. Hum Immunol (1999) 60:1090–100. doi: 10.1016/S0198-8859(99)00099-3
14. Krangel MS. Gene Segment Selection in V (D) J Recombination: Accessibility and Beyond. Nat Immunol (2003) 4:624–30. doi: 10.1038/ni0703-624
15. Gordin M, Philip H, Zilberberg A, Gidoni M, Margalit R, Clouser C, et al. Breast Cancer Is Marked by Specific, Public T-Cell Receptor Cdr3 Regions Shared by Mice and Humans. PloS Comput Biol (2021) 17:e1008486. doi: 10.1371/journal.pcbi.1008486
16. Roldan EQ, Sottini A, Bettinardi A, Albertini A, Imberti L, Primi D. Different Tcrbv Genes Generate Biased Patterns of Vdj Diversity in Human T Cells. Immunogenetics (1995) 41:91–100. doi: 10.1007/BF00182318
17. Fuchs YF, Eugster A, Dietz S, Sebelefsky C, Kühn D, Wilhelm C, et al. Cd8+ T Cells Specific for the Islet Autoantigen Igrp Are Restricted in Their T Cell Receptor Chain Usage. Sci Rport (2017) 7:1–10. doi: 10.1038/srep44661
18. Chung W-H, Hung S-I, Hong H-S, Hsih M-S, Yang L-C, Ho H-C, et al. Medical Genetics: A Marker for Stevens-Johnson Syndrome. Nature (2004) 428:486. doi: 10.1038/428486a
19. Ma L, Yang L, Shi B, He X, Peng A, Li Y, et al. Analyzing the Cdr3 Repertoire With Respect to Tcr—Beta Chain Vdj and Vj Rearrangements in Peripheral T Cells Using Hts. Sci Rep (2016) 6:1–10. doi: 10.1038/srep29544
20. Freeman JD, Warren RL, Webb JR, Nelson BH, Holt RA. Profiling the T-Cell Receptor Beta-Chain Repertoire by Massively Parallel Sequencing. Genome Res (2009) 19:1817–24. doi: 10.1101/gr.092924.109
21. Ritmahan W, Kesmir C, Vroomans R. Revealing Factors Determining Immunodominant Responses Against Dominant Epitopes. Immunogenetics (2020) 72:109–18. doi: 10.1007/s00251-019-01134-9
22. Bradley P, Thomas PG. Using T Cell Receptor Repertoires to Understand the Principles of Adaptive Immune Recognition. Annu Rev Immunol (2019) 37:547–70. doi: 10.1146/annurev-immunol-042718-041757
23. Marcou Q, Mora T, Walczak AM. High-Throughput Immune Repertoire Analysis With Igor. Nat Commun (2018) 9:1–10. doi: 10.1038/s41467-018-02832-w
24. Dupic T, Marcou Q, Walczak AM, Mora T. Genesis of the αβ T-Cell Receptor. PloS Comput Biol (2019) 15:e1006874. doi: 10.1371/journal.pcbi.1006874
25. Ronel T, Harries M, Wicks K, Oakes T, Singleton H, Dearman R, et al. The Clonal Structure and Dynamics of the Human T Cell Response to an Organic Chemical Hapten. Elife (2021) 10:e54747. doi: 10.7554/eLife.54747
26. Miron M, Meng W, Rosenfeld AM, Dvorkin S, Poon MML, Lam N, et al. Maintenance of the Human Memory T Cell Repertoire by Subset and Tissue Site. Genome Med (2021) 13:1–14. doi: 10.1186/s13073-021-00918-7
27. Emerson RO, DeWitt WS, Vignali M, Gravley J, Hu JK, Osborne EJ, et al. Immunosequencing Identifies Signatures of Cytomegalovirus Exposure History and Hla-Mediated Effects on the T Cell Repertoire. Nat Genet (2017) 49:659–65. doi: 10.1038/ng.3822
28. Benjamini Y, Hochberg Y. Controlling the False Discovery Rate: A Practical and Powerful Approach to Multiple Testing. J R Stat Soc: Ser B (Methodol) (1995) 57:289–300. doi: 10.1111/j.2517-6161.1995.tb02031.x
29. Kolmogorov A. Sulla Determinazione Empirica Di Una Lgge Di Distribuzione. Inst Ital. Attuari Giorn (1933) 4:83–91.
30. Mackall CL, Bare CV, Granger LA, Sharrow SO, Titus JA, Gress RE. Thymic-Independent T Cell Regeneration Occurs via Antigen-Driven Expansion of Peripheral T Cells Resulting in a Repertoire That Is Limited in Diversity and Prone to Skewing. J Immunol (1996) 156:4609–16.
31. Hou X, Zeng P, Zhang X, Chen J, Liang Y, Yang J, et al. Shorter Tcr β-Chains are Highly Enriched During Thymic Selection and Antigen-Driven Selection. Front Immunol (2019) 10:299. doi: 10.3389/fimmu.2019.00299
32. Coutinho A, Caramalho I, Seixas E, Demengeot J. Thymic Commitment of Regulatory T Cells Is a Pathway of Tcr-Dependent Selection That Isolates Repertoires Undergoing Positive or Negative Selection. CD4+ CD25+ Regul T Cell: Origin Funct Ther Potent (2005) 293:43–71. doi: 10.1007/3-540-27702-1_3
33. Ellis GI, Sheppard NC, Riley JL. Genetic Engineering of T Cells for Immunotherapy. Nat Rev Genet (2021) 22:427–47. doi: 10.1038/s41576-021-00329-9
34. Chen G, Yang X, Ko A, Sun X, Gao M, Zhang Y, et al. Sequence and Structural Analyses Reveal Distinct and Highly Diverse Human Cd8+ Tcr Repertoires to Immunodominant Viral Antigens. Cell Rep (2017) 19:569–83. doi: 10.1016/j.celrep.2017.03.072
35. Li J, Xue H, Ma Q, He X, Ma L, Shi B, et al. Heterogeneity of Cd4+ Cd25+ Foxp3+ Treg Tcr β Cdr3 Repertoire Based on the Differences of Symbiotic Microorganisms in the Gut of Mice. Front Cell Dev Biol (2020), 885. doi: 10.3389/fcell.2020.576445
36. Omer A, Peres A, Rodriguez OL, Watson CT, Lees W, Polak P, et al. T Cell Receptor Beta (Trb) Germline Variability Is Revealed by Inference From Repertoire Data. Genome Med (2022) 14. doi: 10.1101/2021.05.17.444409
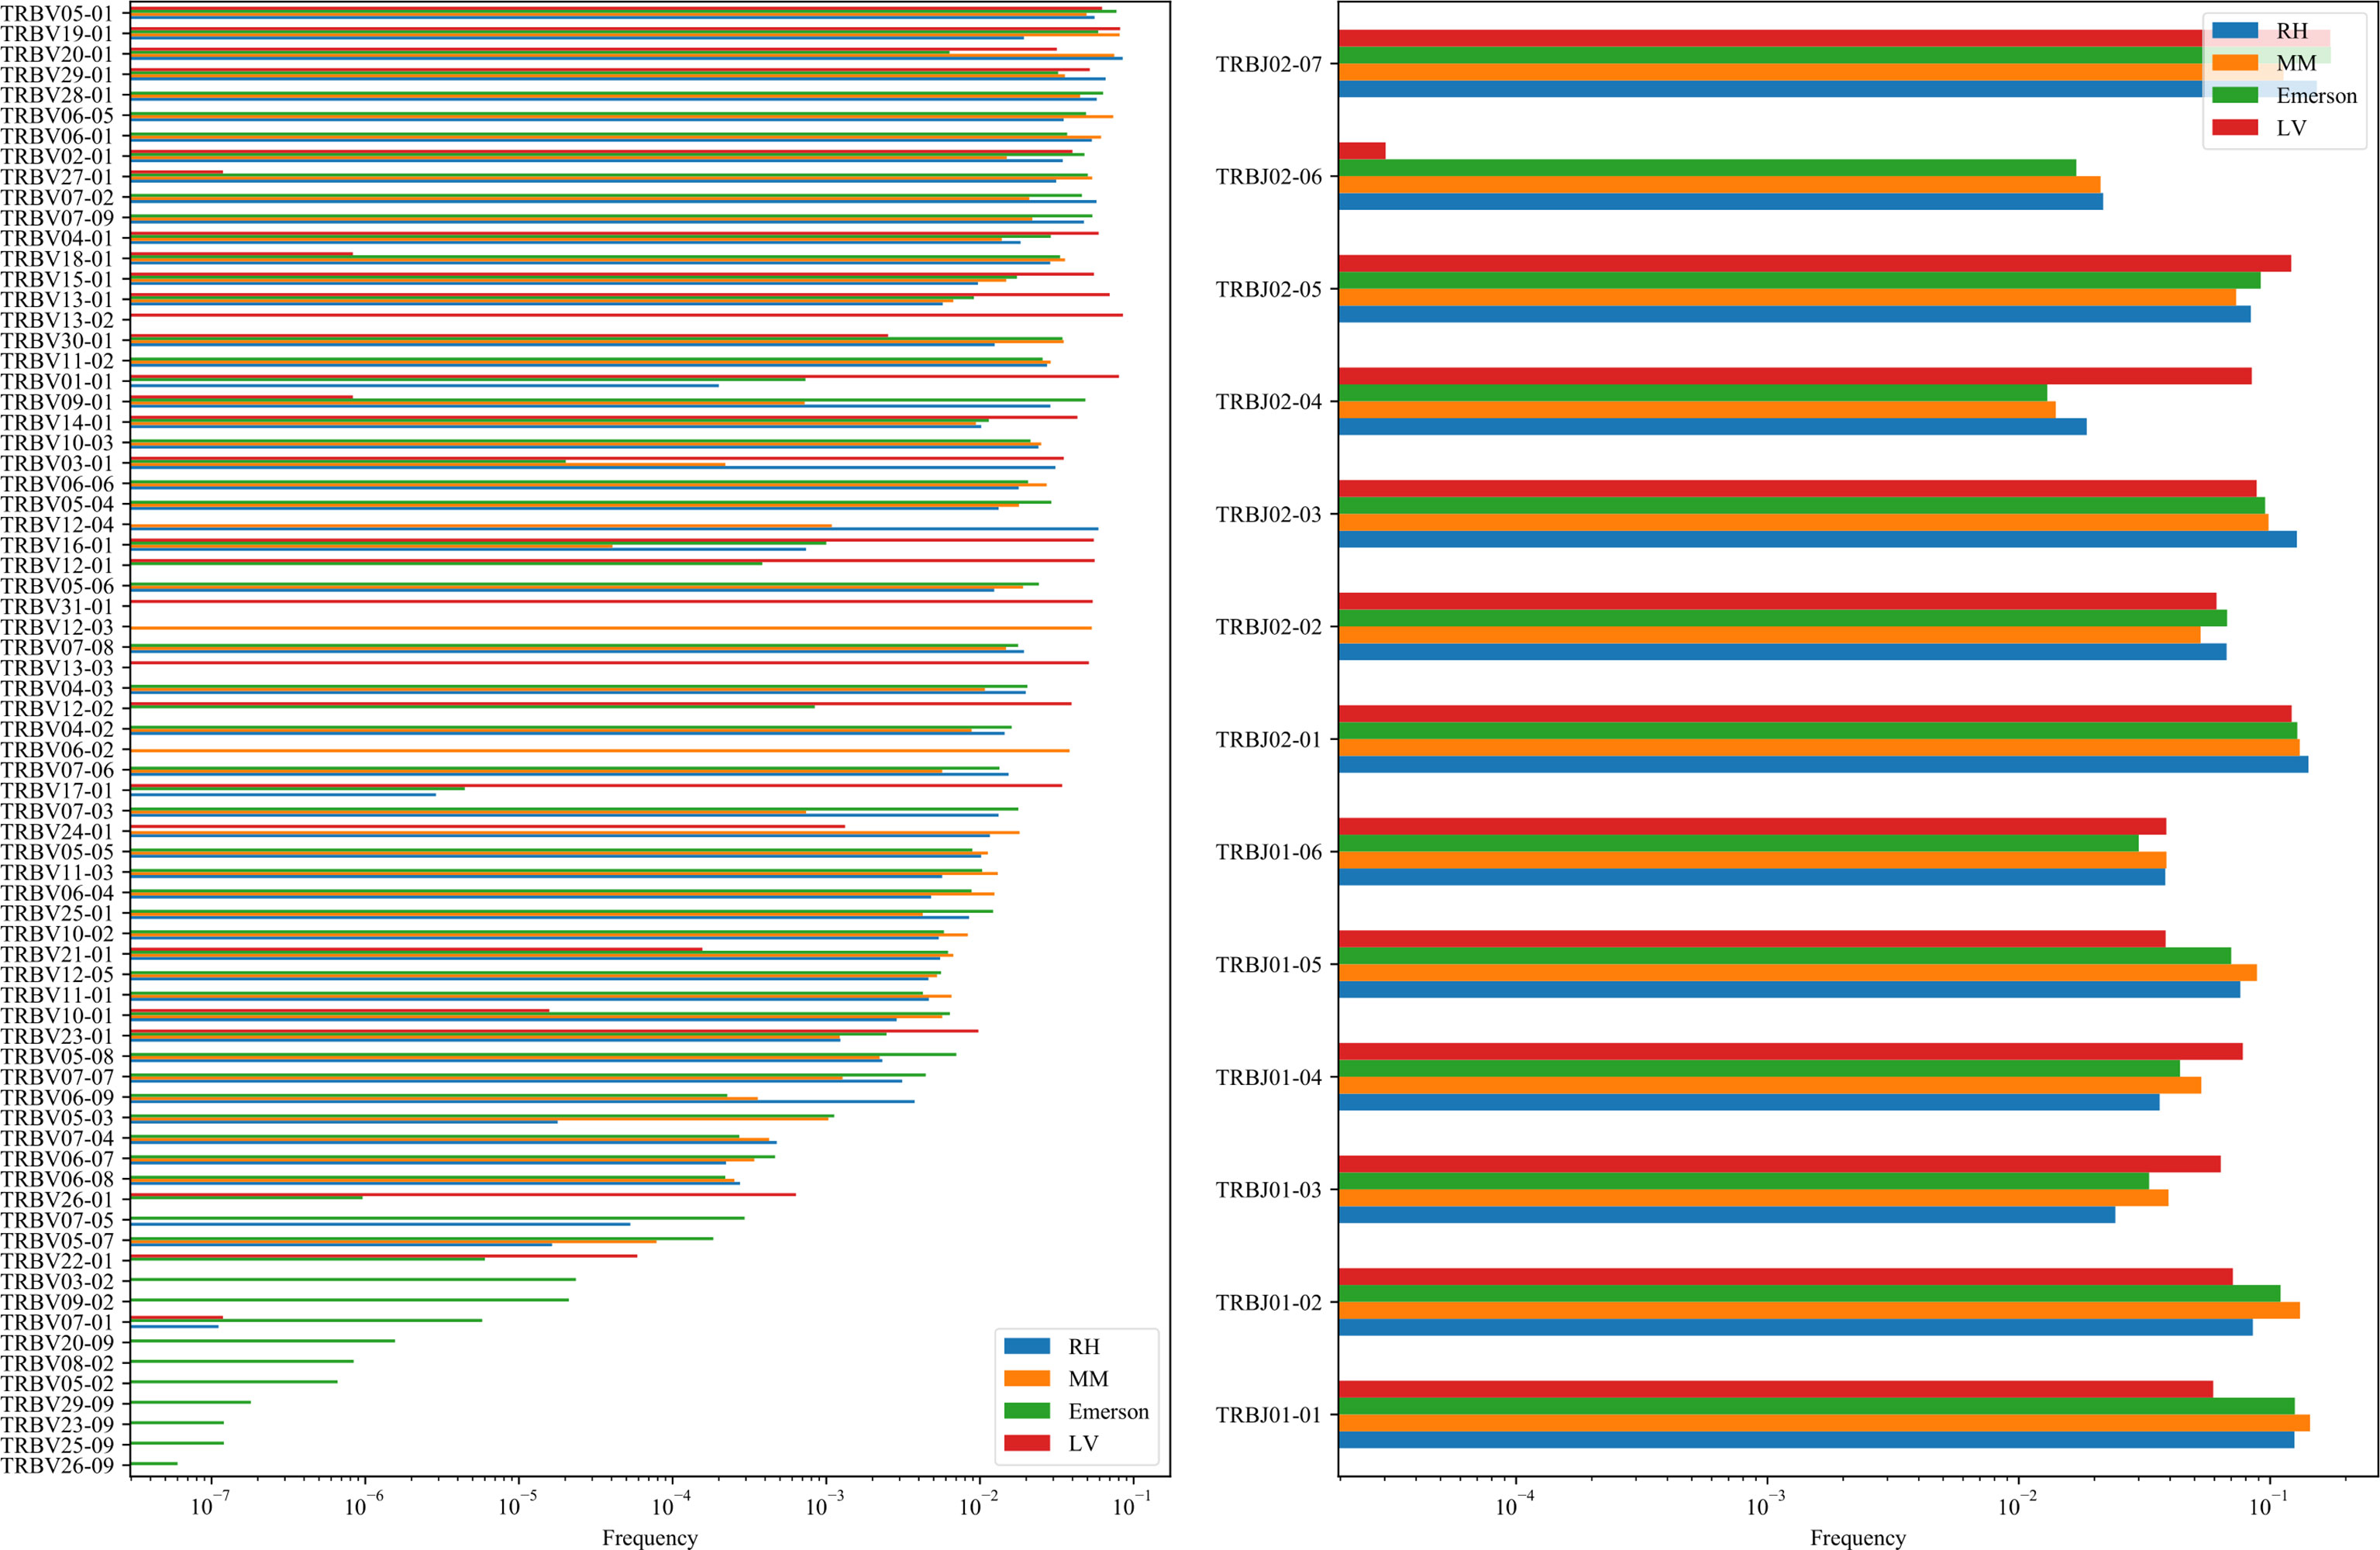
Figure 9 Vβ (A) and Jβ (B) distribution.
Keywords: TCR repertoire, TCR beta chain CDR3 repertoire, V-D-J rearrangement, junction length, selection
Citation: Levi R and Louzoun Y (2022) Two Step Selection for Bias in β Chain V-J Pairing. Front. Immunol. 13:906217. doi: 10.3389/fimmu.2022.906217
Received: 28 March 2022; Accepted: 06 June 2022;
Published: 14 July 2022.
Edited by:
Irun R. Cohen, Weizmann Institute of Science, IsraelCopyright © 2022 Levi and Louzoun. This is an open-access article distributed under the terms of the Creative Commons Attribution License (CC BY). The use, distribution or reproduction in other forums is permitted, provided the original author(s) and the copyright owner(s) are credited and that the original publication in this journal is cited, in accordance with accepted academic practice. No use, distribution or reproduction is permitted which does not comply with these terms.
*Correspondence: Yoram Louzoun, bG91em91eUBtYXRoLmJpdS5hYy5pbA==
Disclaimer: All claims expressed in this article are solely those of the authors and do not necessarily represent those of their affiliated organizations, or those of the publisher, the editors and the reviewers. Any product that may be evaluated in this article or claim that may be made by its manufacturer is not guaranteed or endorsed by the publisher.
Research integrity at Frontiers
Learn more about the work of our research integrity team to safeguard the quality of each article we publish.