
95% of researchers rate our articles as excellent or good
Learn more about the work of our research integrity team to safeguard the quality of each article we publish.
Find out more
ORIGINAL RESEARCH article
Front. Immunol. , 07 November 2022
Sec. Cancer Immunity and Immunotherapy
Volume 13 - 2022 | https://doi.org/10.3389/fimmu.2022.894919
This article is part of the Research Topic Tumor Microenvironment Immunophenotypes and Disease Progression View all 12 articles
 Zhen Chen1‡
 Meng-Li Guo2†‡
 Ya-Yi Li1
 Kai Yan3
 Liang Li4
 Fei Shen1
 Haixia Guan5,6
 Qing-Zhi Liu7*
 Bo Xu1*
 Zhe-Xiong Lian4
Background: Thyroid tissue has a special immune microenvironment that is not well characterized. Whether immune cells have a prognostic value in the recurrence of papillary thyroid cancer (PTC) needs further investigation.
Methods: Multinodular non-toxic goiter (MNG) was taken as normal tissue for the difficulty in obtaining completely normal thyroid tissue (normal thyroid function, no thyroiditis, and no nodules). We compared the composition of mononuclear cells (MNCs) in peripheral blood and thyroid tissues from MNG and PTC patients by high-dimensional flow cytometry profiling and verified the results by multiplex immunohistochemistry. The recurrence rates of PTC patients with different CD8+T cell subset signatures were compared using TCGA database.
Results: We observed that the immune cell composition of MNG was different from that in peripheral blood. Thyroid tissue contains higher percentages of T cells and NK cells. Moreover, the percentages of memory T cells and Treg cells were higher in thyroid than in peripheral blood and increased in PTC tumors. We further focused on the antitumoral CD8+T cells and found that the expression patterns of PD-1, CD39, and CD103 on CD8+T cells were different between MNG and PTC. Importantly, we found higher percentages of PD-1+CD39+CD103+CD8+T and PD-1+CD39+CD103-CD8+T cells in PTC tumor tissues from recurrent patients than non-recurrent patients. By analyzing PTC data from TCGA database, we found that the expression patterns of these molecules were associated with different pathologic types and genders among PTC patients. Moreover, patients with PD-1hiCD39loCD103hiCD8hi, PD-1hiCD39hiCD103loCD8hi, and PD-1loCD39hiCD103hiCD8hi expression patterns have a higher 10-year recurrence-free survival.
Conclusion: The immune microenvironment in MNG tissue is distinct from that in peripheral blood and paratumor tissue. More memory CD8+T cells were detected in PTC, and expression patterns of PD-1, CD39, and CD103 on CD8+T cells were significantly different in physiology and gender and associated with the recurrence rate of PTC. These observations indicate that CD8+T cell signatures may be useful prognostic markers for PTC recurrence.
Papillary thyroid cancer (PTC), the most common endocrine malignancy, accounts for 90% of thyroid cancer which has the seventh increase in new cases of cancer in women (1). Although it has low mortality, PTC, in some cases, can develop into progressive invasive primary disease. Ten percent to 30% of patients experience tumor recurrence and even distant metastasis, especially 10 years after initial treatment (2, 3). Most recurrences require additional surgical intervention with increased psychological stress to patients and expense (4). Patients with aggressive PTC who are resistant to standard treatments may benefit from immunotherapy (5).
Immune responses against thyroid carcinoma have long been recognized (6, 7), evidenced by the frequent existence of lymphocytes within primary thyroid tumor and tumor surrounding areas (8). CD4+T, CD8+T, B, NK, and regulatory T (Treg) cells have been reported to be present in nodular goiter (NG) (9–11) and play different roles during thyroid tumor progression (12, 13). CD4+T and B cells are reported to be positively correlated with reduced tumor sizes in PTC (14). Increased tissue infiltration of Treg cells was positively correlated with advanced thyroid cancer stage, whereas NK-cell infiltration was negatively correlated, indicating that NK and Treg cells might be important regulators of PTC progression (10, 11, 15). High tumor-infiltrating CD8+T cell density was associated with a favorable prognosis in thyroid cancer patients (14, 16). On the other hand, a retrospective cohort study found that patients whose thyroid tumor samples were enriched in CD8+T cells present a poor outcome (17). Thus, the prognostic value of CD8+T cells in thyroid cancer is controversial, and the association of different CD8+T-cell subsets with PTC recurrence remains unclear. Moreover, in view of the differences in experimental methods and samples, the proportions of lymphocytes from PTC and MNG patients varied in different studies (9, 11, 15, 16, 18, 19). It is of great importance to profile the immune cells in tissues and peripheral blood of MNG and PTC patients.
Here, we delineated the specific immune landscape of multinodular non-toxic goiter (MNG) tissue and PTC tumor tissue via flow cytometry and multiplex immunohistochemistry. Interestingly, we found significant differences in phenotypes of thyroid infiltrated CD8+T cells between MNG and PTC patients. Particularly, PD-1-CD39+CD103+CD8+T, PD-1+CD39-CD103+CD8+T, and PD-1+CD39+CD103-CD8+T cells were associated with the recurrence of PTC.
This study was performed following the regulations of the ethics committee of the second affiliated hospital of South China University of Technology. Thirteen multinodular non-toxic goiter (MNG) samples paired with peripheral blood samples and 17 papillary thyroid cancer (PTC) samples paired with paratumor and peripheral blood samples were analyzed by flow cytometry (Table 1). Thirteen MNG, 23 non-recurrent PTC, and eight recurrent PTC samples were subjected to multiplex immunohistochemistry (Table 1). Paratumor tissue was defined as 2~3 cm away from lesions. Thyroid tissue was collected and placed in 1640 medium containing 10% fetal bovine serum. PTC and MNG patients were confirmed by surgery and pathology. Patients with the following conditions were excluded: treated with chemoradiation therapy preoperatively; with hyperthyroidism, hypothyroidism, diabetes, hypertension and hyperlipidemia, or serum anti-thyroglobulin antibody (TGAb) or thyroid peroxidase antibody (TPOAb) levels higher than the reference range (TGAb >115 IU/ml, TPOAb >35 IU/ml); or with a background of thyroiditis. PTC recurrence was defined as recurrent or persistent disease based on authoritative histologic, cytologic, radiographic, or biochemical criteria (20). Patients with local, regional, and distant recurrences were all included.
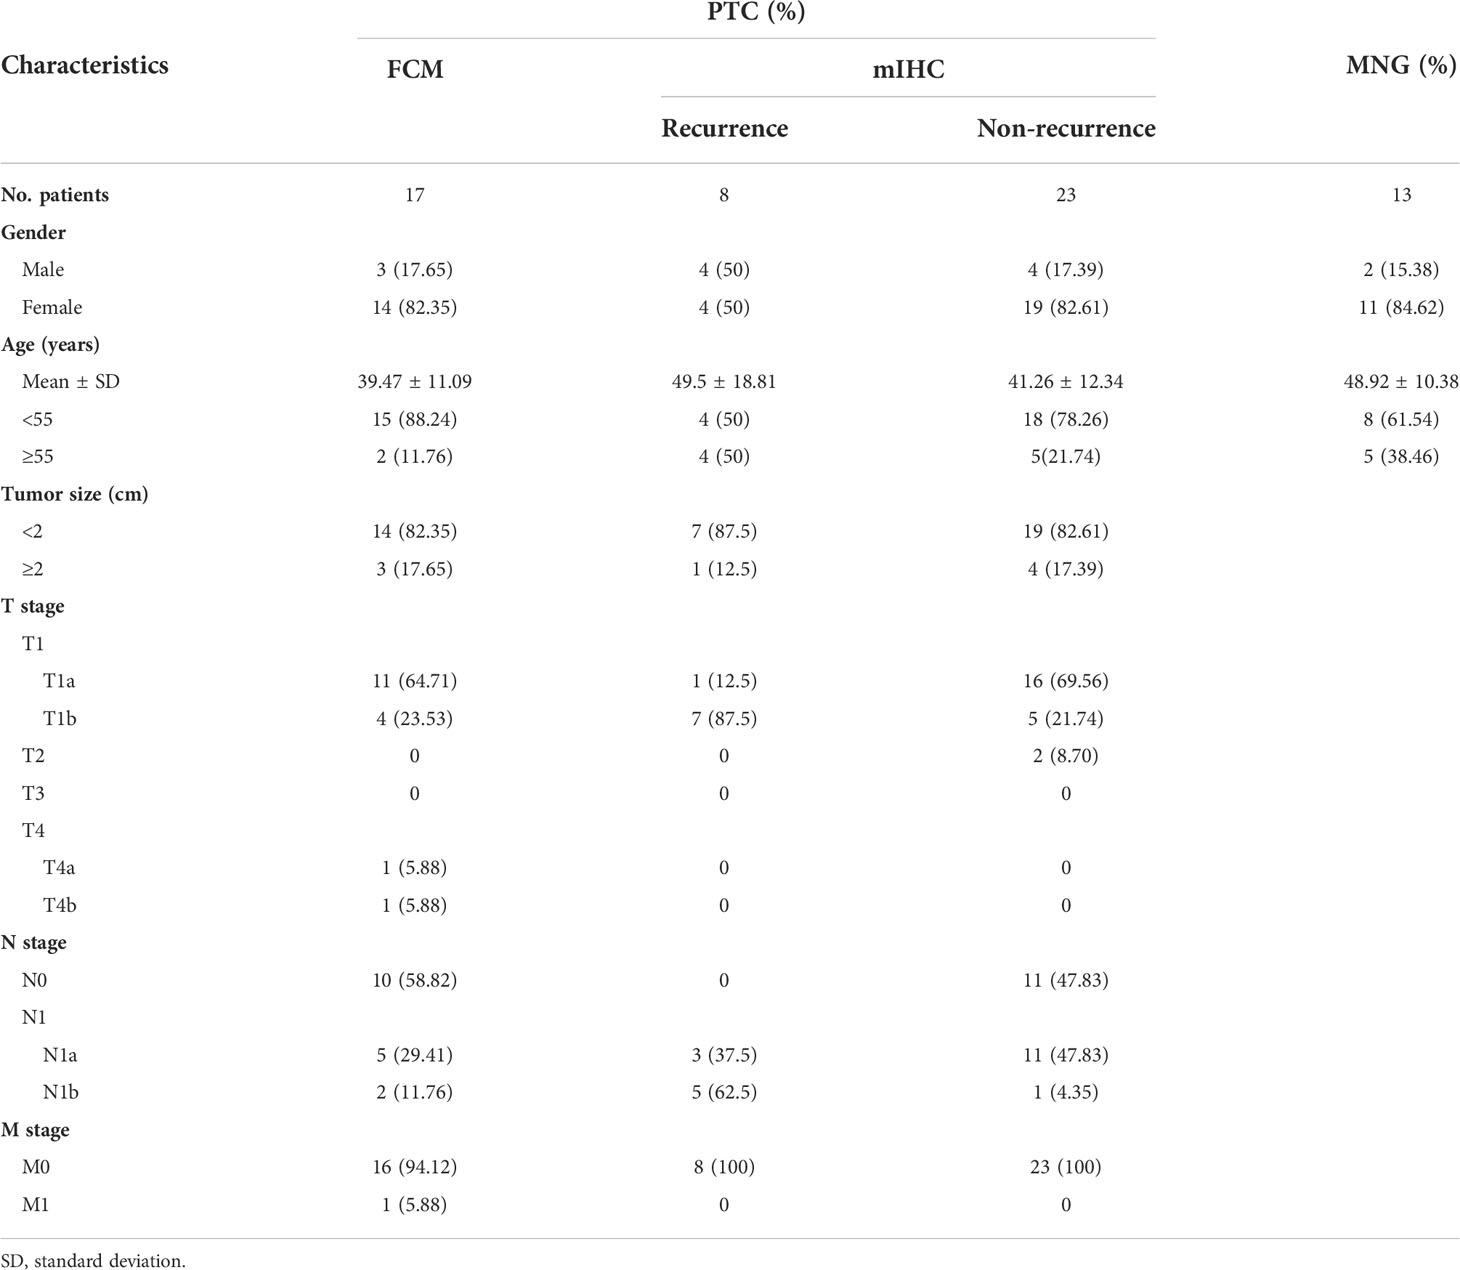
Table 1 Demographics and clinicopathologic characteristics of PTC patients.
THCA RNA-seq expression profiles from TCGA database (https://portal.gdc.cancer.gov/) were downloaded using the GDC Data Transfer Tool Client (https://gdc.cancer.gov/access-data/gdc-data-transfer-tool). Custom Perl scripts (Perl version 5.8.9) used for processing the FPKM expression data are available on request. Four sets of datasets GSE197852 (21), GSE3467 (22), GSE33630 (23), and GSE6004 (24) from the GEO database were used to analyze Treg-cell subpopulations. Marker genes for microenvironment cells were obtained from previous studies (25–30). The 470 genes representing 18 microenvironment cell types are listed in Supplementary Table 3. We used single-sample gene set enrichment analysis (ssGSEA, “GSVA” function in R) to calculate the abundance of microenvironment cells in each sample. The CD8hi samples were selected based on the mean level of CD8+T-cell marker gene expression and were considered to be enriched in CD8+T cells. These patients were separated into eight clusters based on the expression levels of PDCD1, ENTPD1, and ITGAE genes. PD-1hi, CD103hi, and CD39hi were defined as higher than the mean expression levels of PDCD1, ENTPD1, and ITGAE in the CD8hi samples, respectively, whereas PD-1lo, CD103lo, and CD39lo were the opposite.
Tumor or paratumor tissues from PTC and control thyroid tissue from MNG were washed with precooled saline. Tissues were cut into small pieces in a tube containing RPMI-1640 medium and 10% FBS on ice. Cells were collected by washing the thyroid tissues and filtering cell suspension through a 100-mesh strainer. After centrifugation at 450g for 5 min, cells were collected and red blood cells were depleted by adding 1–2 ml red blood cell lysis buffer (Beyotime, China) and incubating at 4°C for 5 min. Lymphoprep (Axis Shield, Norway) was used to isolate peripheral blood mononuclear cells (PBMCs) according to the manufacturer’s instructions. Peripheral blood was centrifuged to collect plasma and cells. The cells were diluted by addition of an equal volume of 0.9% saline. Diluted blood was layered over 3 ml Lymphoprep and centrifuged at 800g for 20 min at room temperature. Cells at the interface were collected and counted on a hemocytometer in the presence of trypan blue.
For surface marker staining, mononuclear cells (MNCs) from tissue and blood were incubated with mouse serum for 15 min at 4°C, followed by fluorescent antibodies at 4°C for 20 min. BV421-conjugated anti-CD39 (A1), BV510-conjugated anti-CD3 (OKT3), BV605-conjugated anti-CD123 (6H6), BV650-conjugated anti-CD45RA (HI100), BV711-conjugated anti-CD14 (M5E2), BV785-conjugated anti-CD19 (HIB19), FITC-conjugated anti-CD45RO (UCHL1), PerCP-Cy5.5-conjugated anti-CD16 (3G8), PE-conjugated anti-CD25 (BC96), PE/Dazzle594-conjugated anti-PD-1 (EH12.2H7), PE/Cy5-conjugated anti-CD56 (5.1H11), Alexa700-conjugated anti-CD8a (HIT8a), PE/Cy7-conjugated anti-HLA-DR (LN3), APC-conjugated antibodies against CD103 (Ber-ACT8), and APC/Cy7-conjugated anti-CD45 (HI30) were purchased from BioLegend (San Diego, CA, USA). BUV563-conjugated anti-CD4 (SP3) and BUV737-conjugated anti-CD127 (HIL-7R-M21) were purchased from BD Biosciences (Franklin Lakes, New Jersey, USA). Dead cells were stained with DAPI (Beyotime, China). Live cells were gated as CD45+DAPI−. Data were acquired using a FACS LSRFortessa flow cytometer (BD Biosciences) and analyzed with the FlowJo (Tree Star, Ashland, OR, USA). Gating strategies for the flow experiment are described in Figure S1.
Live MNCs were gated in FlowJo to perform t-distributed stochastic neighbor embedding (t-SNE) analysis. Data from 10,000 cells of PBMCs or tissue MNCs were randomly selected and merged into one matrix and normalized by a channel using the scale function in R (version 3.5.3). Then, we ran the t-SNE algorithm by the RunTSNE function in the Seurat package (version 3.0.1) to output the results. The parameters used for t-SNE analysis were CD3, CD56, CD19, CD4, CD8, CD45RA, CD45RO, and CD14.
Formalin-fixed paraffin-embedded tissues were cut into 4-μm slices and stained using the PANO 7-plex IHC kit (TSA-RM) (Panovue) according to the manufacturer’s instructions. Slides were deparaffinized with xylene and rehydrated with an ethanol gradient. Heat-induced antigen retrieval was performed in sodium citrate buffer (0.01M, pH = 6.0) before each primary antibody incubation, and the slides were cooled to room temperature. After deactivating the endogenous peroxidase with 3% H2O2 in methanol, the slices were blocked with 10% goat serum for 30 min followed by primary antibody staining. The primary antibodies and dilutions with PANO amplification diluent were applied in the following order: CD4 (ab133616, 1:500, Abcam) with Opal 620, CD20 (ab78237, 1:2,000, Abcam) with Opal 520, CD8 (C8/144B, 1:200, CST) with Opal 690, CD56 (123C3, 1:200, CST) with Opal 570, and CD45 (60287-1-Ig, 1:4,000, Proteintech) with Akoya 580. The CD8+T-cell subsets were labeled by CD8 (C8/144B, 1:200, CST) with Opal 690, CD103 (ab224202, 1:200, Abcam) with Opal 620, PD-1 (EH33, 1:200, CST) with Opal520, and CD39 (ab223842, 1:3000, Abcam) with Opal 540. All slides were incubated with PANO polymer HRP Ms+Rb for 15 min at room temperature. Nuclei were stained for 10 min with DAPI (Beyotime, China). All slides were scanned using the Vectra Automated Quantitative Pathology Imaging System (Vectra Polaris featuring MOTiF™), and images were analyzed with the HALO (version 3.1.1076) Digital Pathology system (Indica Labs).
All data were presented as mean ± standard error of mean (SEM) and analyzed using GraphPad Prism 8.3 (San Diego, CA) and R (version 3.6.2). The comparison between two groups was performed with two-tailed Student’s t test (paired or unpaired) if both data conformed normal distribution and equality of variance in standard deviation. Otherwise, the non-parametric test (Wilcoxon signed-rank test or Mann–Whitney U test) was used. Recurrence-free survival (RFS) was analyzed with Kaplan–Meier estimates and log-rank tests. Cox proportional hazard regression models were constructed for clinicopathologic characteristics, CD8hiT-cell subsets, and RFS. Results were expressed as hazard ratio (HR) with 95% confidence interval (CI). Univariate logistic regression was used to estimate associations between clinical parameters and CD8+T subsets in tumor from flow cytometry and multiplex immunohistochemistry (mIHC) data, respectively. The relationships of PD-1loCD39hiCD103hi CD8hiT, PD-1hiCD39hiCD103lo CD8hiT, and PD-1hiCD39loCD103hi CD8hiT cells in tumor from TCGA data with clinical parameters and other immune cells were analyzed using multinomial logistic regression analyses. Pearson’s chi-square test or Fisher’s exact test were employed for the comparison of unordered categorical variables. *p < 0.05; **p < 0.01; ***p < 0.001.
To explore the immune microenvironment of thyroid, we collected thyroid tissues and peripheral blood from MNG and PTC patients and performed flow cytometry and mIHC, in combination with bioinformatics analysis (Figure 1A). First, we used t-SNE maps to present the immune landscape of the thyroid and peripheral blood from MNG patients. Specific immune lineages were recognized using a color-based representation of expression levels of a single parameter. We identified six major cell clusters: CD8+T, CD4+ T, CD3+CD56+, NK, B cells, and monocytes (Figures 1B, S2A). We also used mIHC to detect the locations of these immune cell subsets in the thyroid. We found these immune cell subsets aggregated in the thyroid interfollicular space (Figure 1C). The frequencies and density of CD8+T, CD4+ T, NK, and B cells of MNG tissues obtained by mIHC were displayed (Figures S2B, C). The percentages of T and NK cells from thyroid tissues were decreased compared with peripheral blood (p = 0.0068 for T cells, p = 0.0134 for NK cells, Figures 1D, E). However, the percentage of CD3+CD56+ cells was significantly higher in thyroid tissues than in peripheral blood (p < 0.0001, Figure 1F). For T-cell subgroups in thyroid, the CD8+T/CD4+ T-cell ratio (p = 0.0171, Figure 1G) and the percentage of Treg cells (CD127-CD25+CD4+T cells, p = 0.0044, Figure 1H) were increased when compared with peripheral blood. Moreover, T cells presented increased memory CD4+T cells (CD45RO+CD45RA-CD4+T cells, p = 0.0005, Figure 1I) and memory CD8+T cells (CD45RO+CD45RA-CD8+T cells, p = 0.0002, Figure 1J) in thyroid tissues. The percentages of B cells (Figure S2D) and monocytes (Figure S2E), between two groups did not show a statistically significant difference. These results show diverse immune landscapes across MNG tissues and paired peripheral blood, especially T-cell subsets.
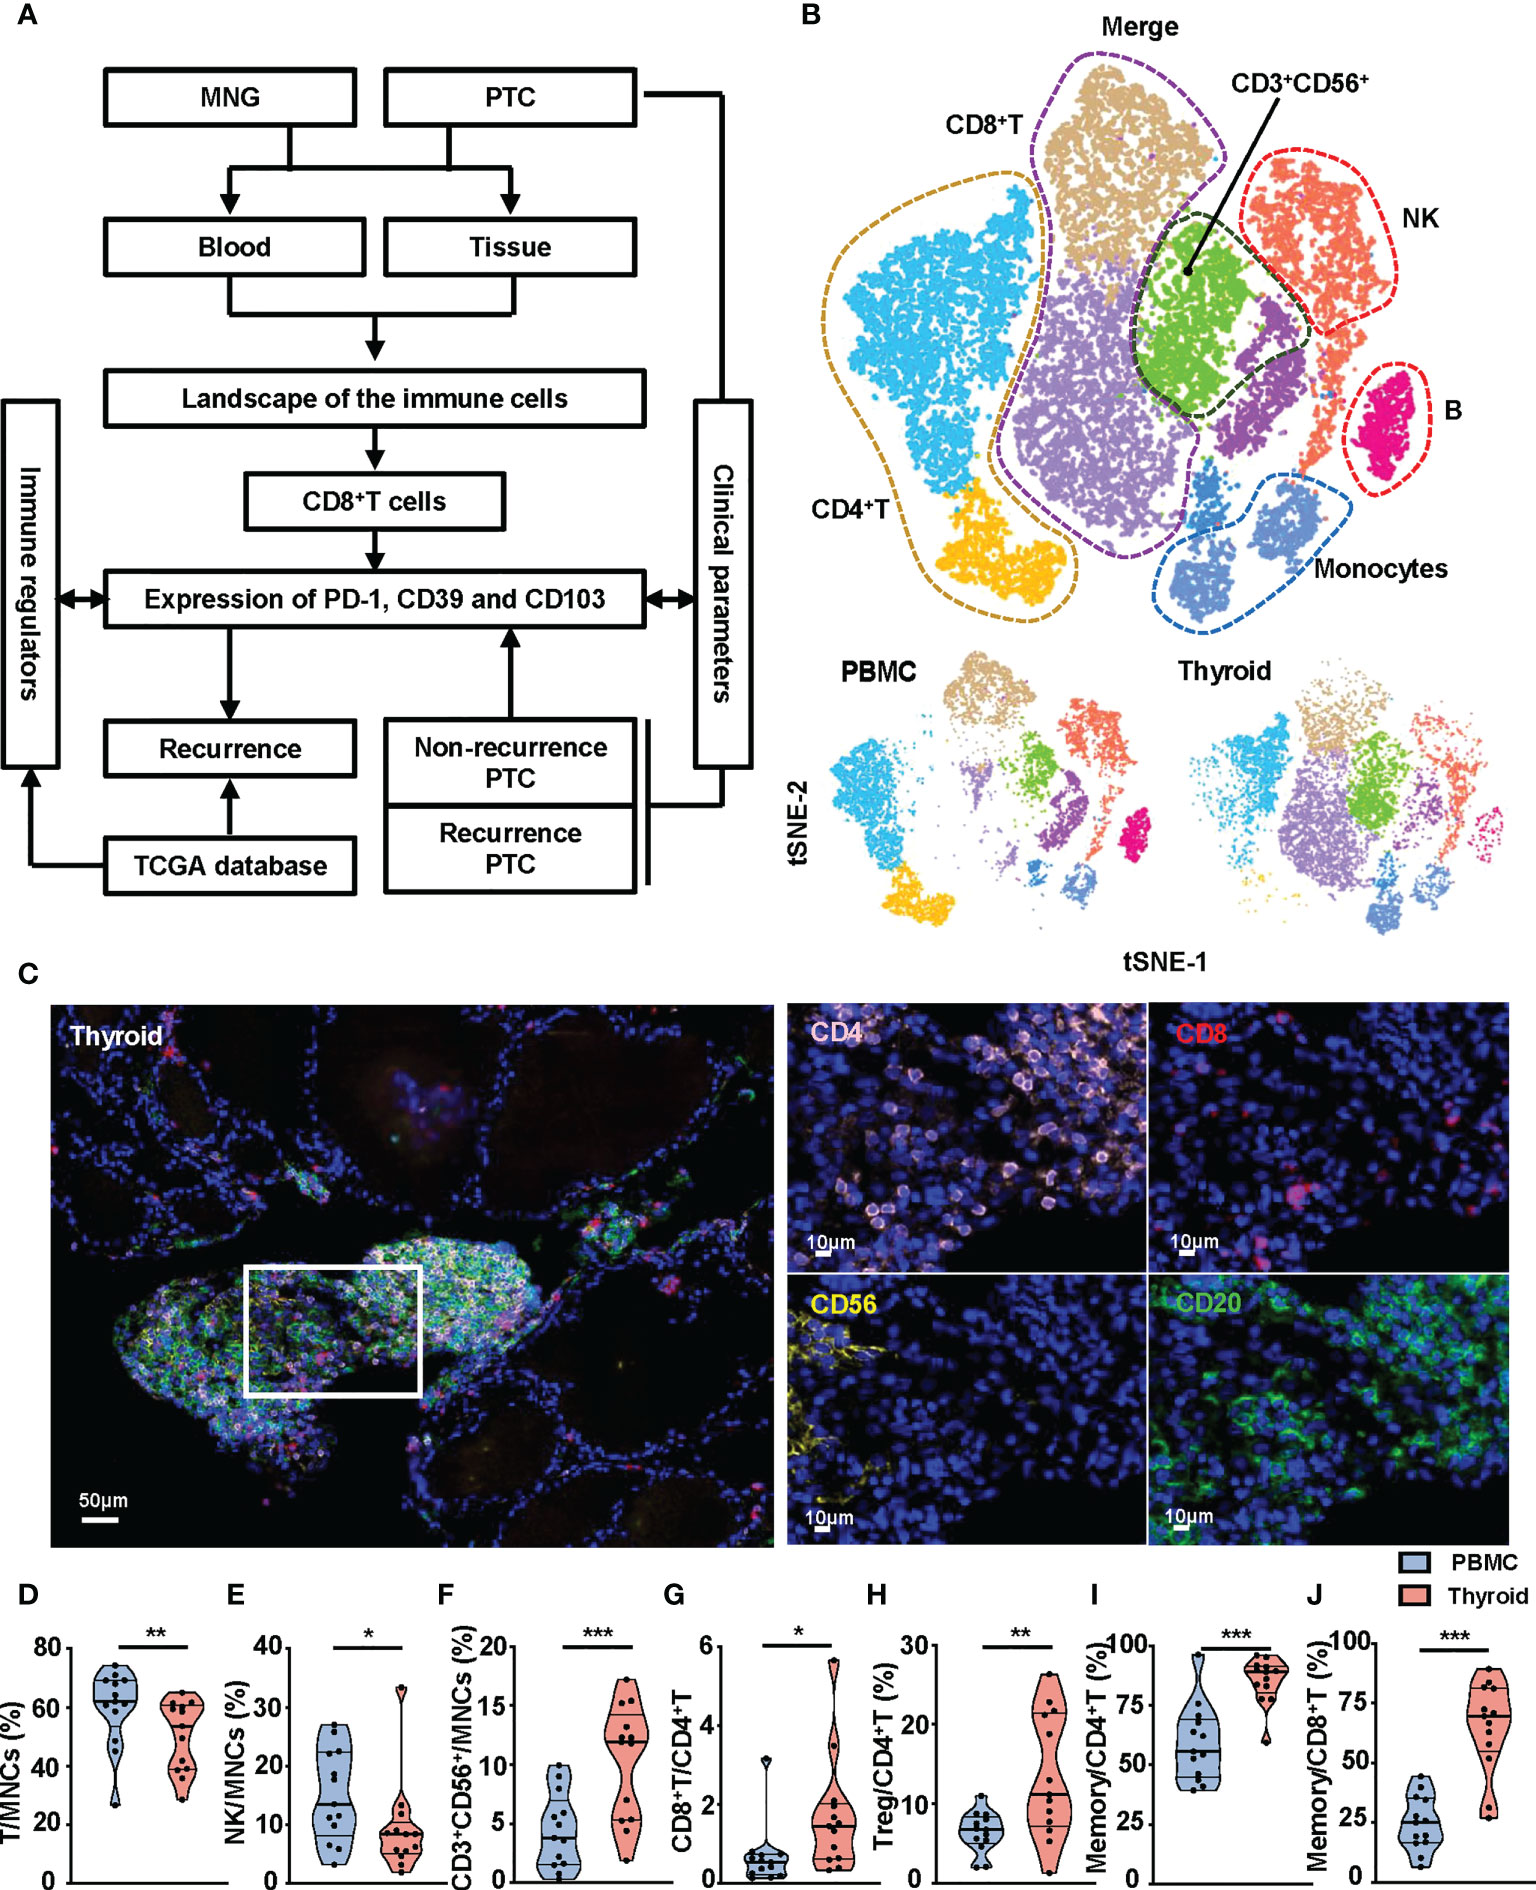
Figure 1 Composition of immune cell subsets in peripheral blood and thyroid tissues from MNG patients. (A) The flowchart of the work. (B) t-SNE islands for CD3+T cells, CD4+T cells, CD8+T cells, CD3+CD56+ cells, CD56+ NK cells, CD19+ B cells, and CD14+ monocytes of flow cytometry data. (C) Representative immunofluorescence staining of CD4 (pink), CD8 (red), CD56 (yellow), and CD20 (green) in an MNG. DAPI staining is shown in blue. Scale bar, 50 μm (left), 10 μm (right). Percentages of T cells (D), NK cells (E), and CD3+CD56+ cells (F) in MNCs in peripheral blood and thyroid tissue. (G) Ratio of CD8+T to CD4+T cells in peripheral blood and thyroid tissue. (H) Percentage of Treg cells in total CD4+T cells. Percentages of memory T cells (CD45RO+CD45RA-) in CD4+T (I) and CD8+T (J) cells. (D–J) The individual dot represents a patient, and data are presented as mean ± SEM. *p < 0.05; **p < 0.01; ***p < 0.001.
There was no statistical difference in percentages of CD8+T, CD4+T, CD3+CD56+, NK, B cells, and monocytes between tumor, paratumor, and MNG tissues (Figure S3A), nor between the peripheral blood from PTC and MNG patients (Figure S3B). However, CD45RO was highly expressed on CD8+T and CD4+T cells in thyroid tissues (Figure 2A). Correspondingly, percentages of memory CD8+T cells were increased in tumor and paratumor as compared with MNG (p = 0.0216 for tumor vs. MNG, p = 0.0154 for paratumor vs. MNG), whereas a significant difference was not detected between tumor and paratumor (Figure 2B). Percentages of memory CD4+T cells were also significantly higher in tumor whether compared with MNG or paratumor, but there was no difference between paratumor and MNG (p = 0.0011 for tumor vs. MNG, p < 0.0001 for tumor vs. paratumor, Figure 2C). Furthermore, CD4+ T cells from PTC and MNG patients exhibited different expression levels of CD25 (Figure 2D). The percentage of Treg cells was increased in tumor compared with MNG or paratumor but decreased in paratumor when compared with MNG (p = 0.0012 for tumor vs. MNG, p < 0.0001, for tumor vs. paratumor, p = 0.0284, for paratumor vs. MNG, Figure 2E). Furthermore, we found that the ssGSEA score of CD45RA+FoxP3loCD25++ cells in MNG was higher than that in paratumor (p = 0.0008) and tumor (p = 0.0102). The ssGSEA score of CD45RA-FoxP3loCD25++ cells was higher in MNG compared with paratumor (p = 0.0019). The ssGSEA scores of CD45RA+FoxP3loCD25++ cells (p = 0.0016), CD45RA-FoxP3hiCD25+++ cells (p < 0.0001), or CD45RA-FoxP3loCD25++ cells (p < 0.0001) in tumor were all higher than paratumor (Figure S4).
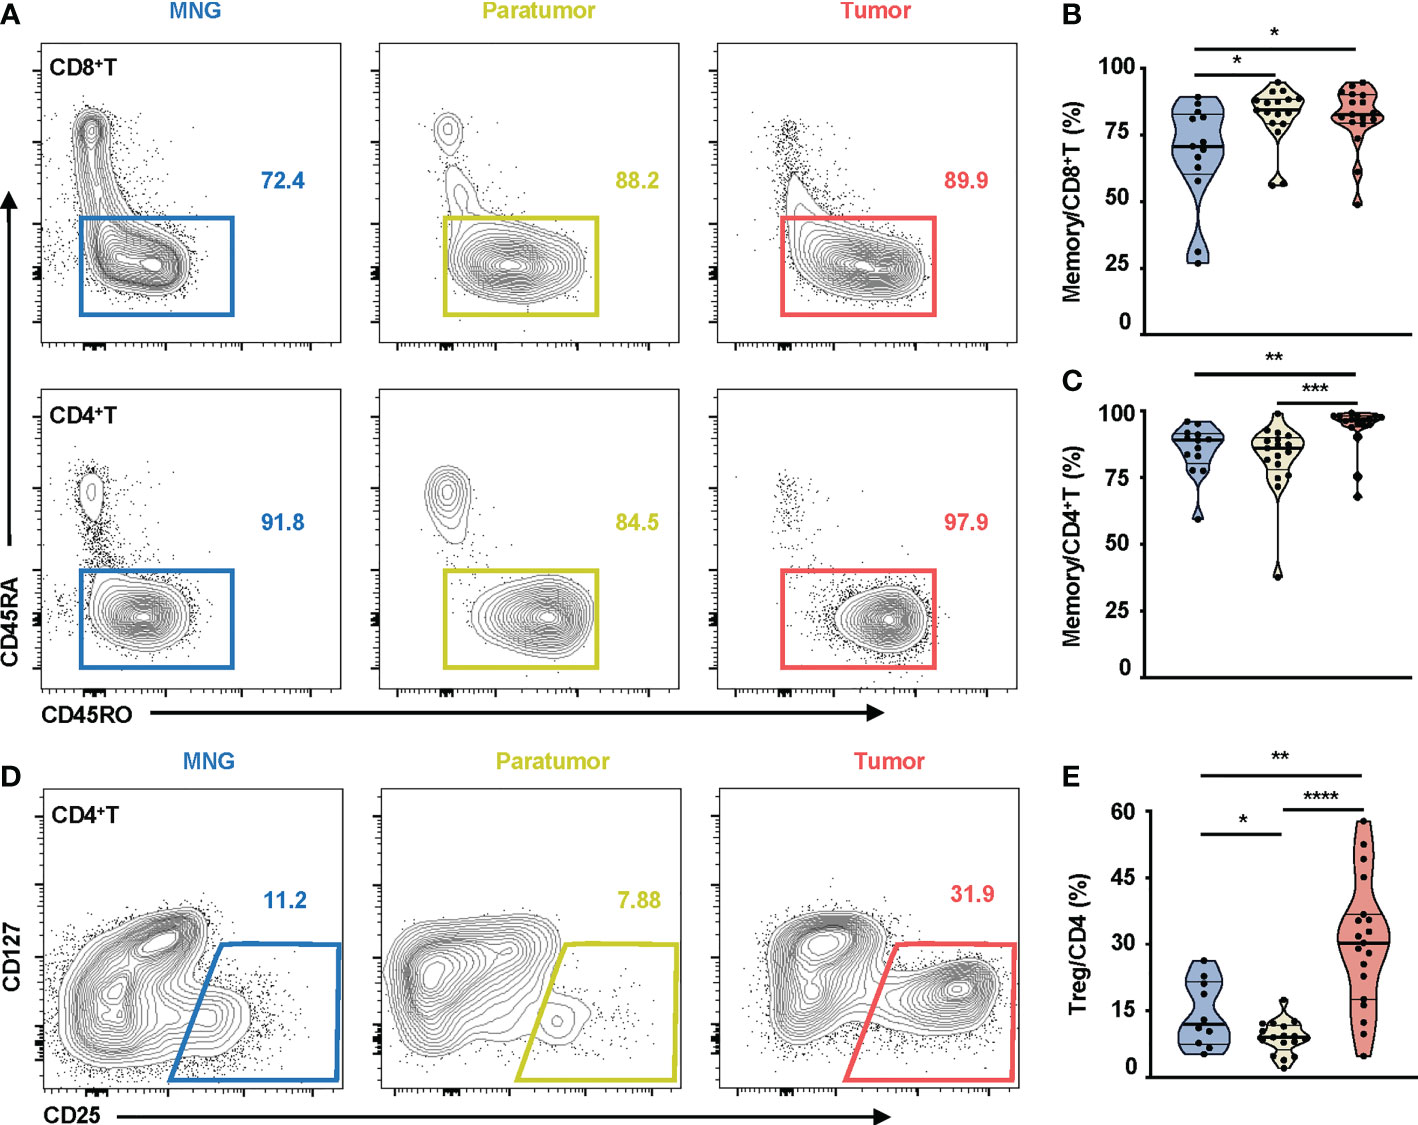
Figure 2 Memory T cells and Treg cells in thyroid tissues from MNG and PTC patients. (A) Representative FACS plots show CD45RO and CD45RA expressions on CD8+T and CD4+T cells. The values within solid line boxes indicate the proportions of memory T cells (CD45RO+CD45RA-) to CD8+T or CD4+T cells. (B) Frequencies of memory T cells relative to CD8+T cells are shown. (C) Frequencies of memory T cells relative to CD4+T cells are shown. (D) Representative FACS plots show CD25 and CD127 expressions on CD4+T cells. The values within solid line boxes indicate the proportions of Treg cells (CD25+CD127-) to CD4+T cells. (E) Frequencies of Treg cells relative to CD4+T cells are shown. Blue means MNG, yellow means paratumor, and red means tumor. (B–E) Data presented as mean ± SEM. *p < 0.05; **p < 0.01; ***p < 0.001; ****p < 0.0001.
The controversial prognostic value of CD8+T cells in thyroid cancer may be due to the complexity and heterogeneity of the CD8+T-cell landscape. PD-1, CD103, and CD39 have been independently proposed as markers of tumor-reactive CD8+T cells in various cancers, possessing a distinct prognostic implication (31–33). Thus, we investigated the clinical relevance of these CD8+T-cell subsets in PTC. First, based on the expressions of PD-1 and CD39, CD8+T cells from PTC and MNG tissues were divided into four subgroups (PD-1+: PD-1+CD39-, DN: PD-1-CD39-, CD39+: PD-1-CD39+, DP: PD-1+CD39+). These four subgroups were further divided into eight subsets according to the expression levels of CD103 (Figure 3A). Percentages of triple-positive subsets (p = 0.0067), PD-1-CD39+CD103+CD8+T (p = 0.0005), and PD-1+CD39+CD103-CD8+T cells (p = 0.0106) were higher in tumor than in paratumor (Figures 3B–D). The percentages of PD-1-CD39+CD103+CD8+T cells (p = 0.0133) and PD-1+CD39+CD103-CD8+T cells (p = 0.0174) from paratumor were lower than from MNG (Figures 3C, D). The percentage of PD-1+CD39-CD103+ cells in tumor was lower compared with paratumor (p < 0.0001) but higher than MNG (p = 0.0389, Figure 3E). In addition, the percentage of PD-1+CD39-CD103+CD8+T cells derived from paratumor was significantly increased compared with MNG (p = 0.0004, Figure 3E). Our univariate logistic regression analysis of CD8+T-cell subsets and clinical parameters indicated that big tumor size was a risk factor for high PD-1-CD39+CD103+CD8+T cells, but older age was a protective factor for high PD-1+CD39-CD103+CD8+T cells (Table S1). Together, these results revealed CD8+T-cell subsets may play different roles during PTC tumor development and progression.
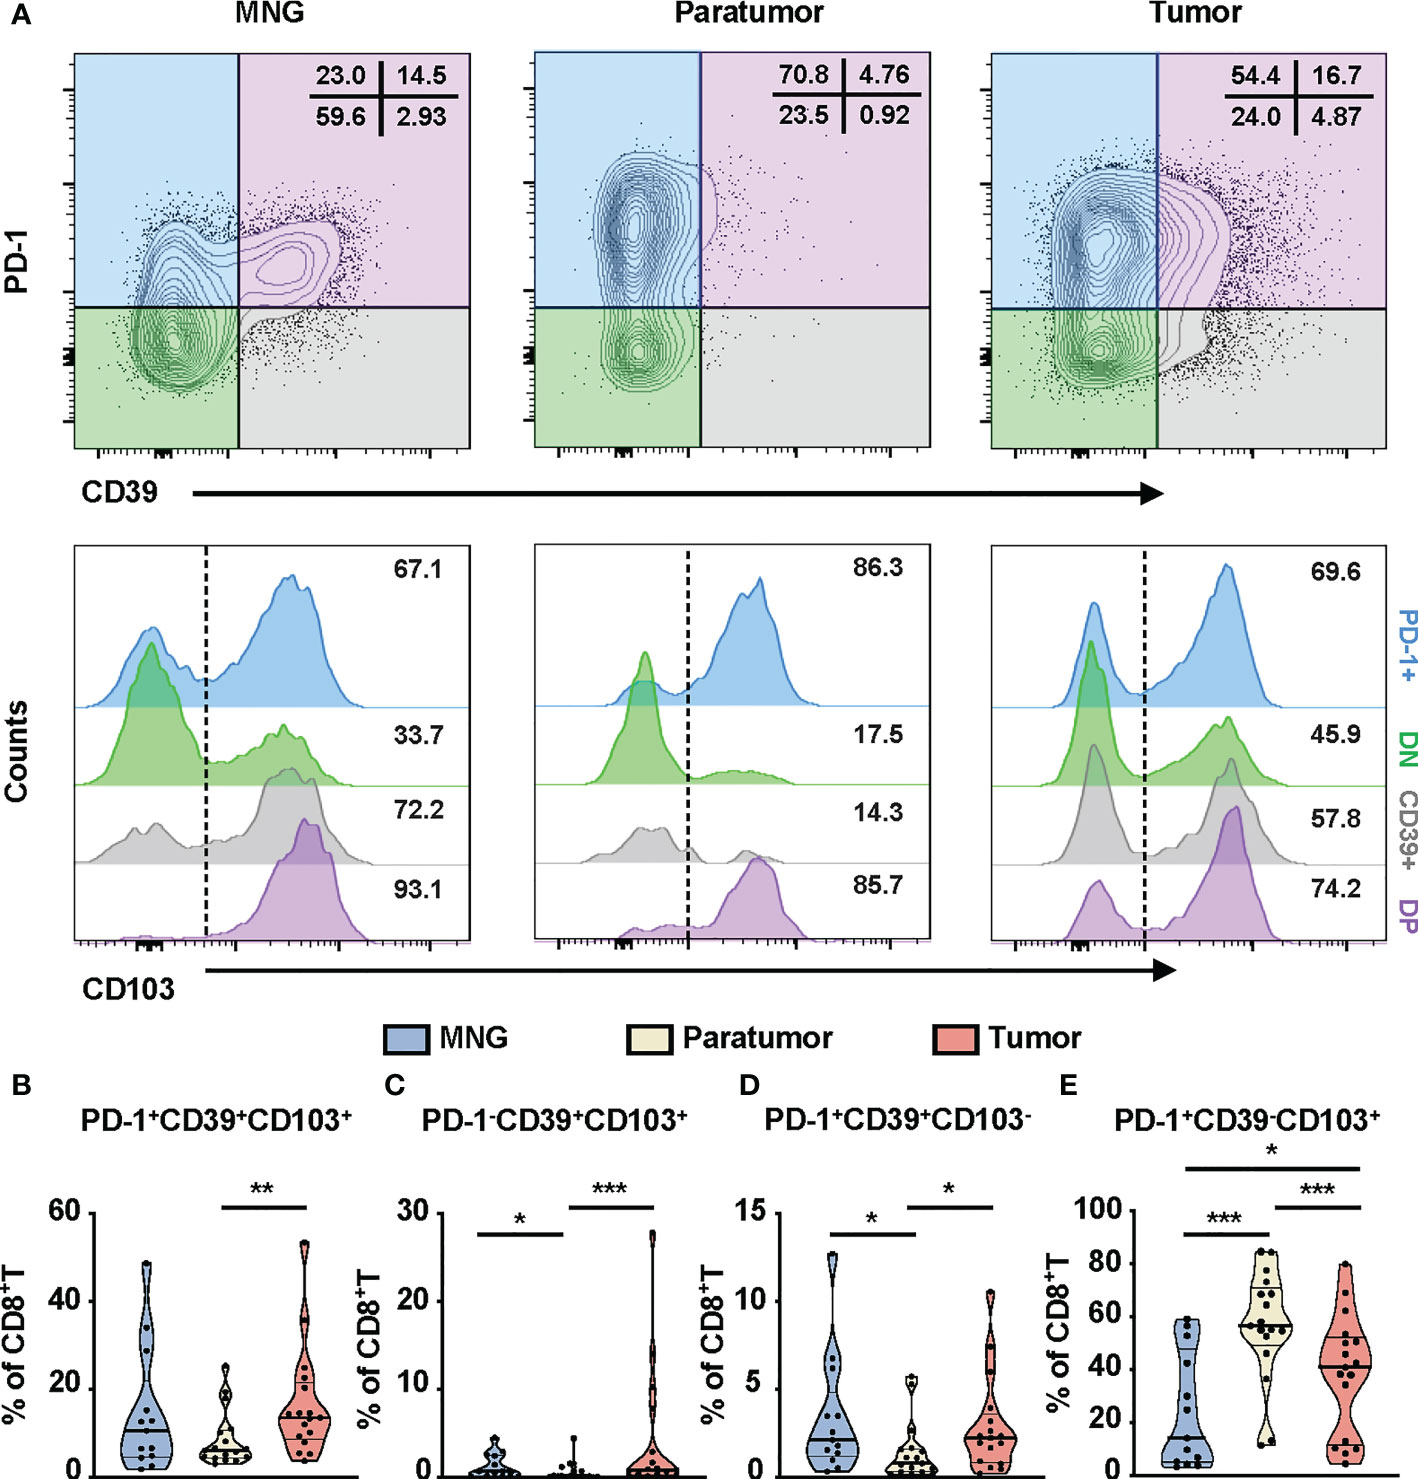
Figure 3 Phenotypic characteristics of CD8+T cells in thyroid tissues from MNG and PTC patients. (A) Flow cytometric analysis PD-1 and CD39 expression on CD8+T cells from thyroid tissues of MNG and PTC patients. Numbers in each quadrant indicate percent cells positive for PD-1 and/or CD39 on CD8+T cells. Below, histograms show the CD103 expression on PD-1+CD39- (PD-1+, blue), PD-1-CD39- (DN, green), PD-1-CD39+ (CD39+, gray), and PD-1+CD39+ (DP, purple) cells. Frequencies of PD-1+CD39+CD103+CD8+T (B), PD-1-CD39+CD103+CD8+T (C), PD-1+CD39+CD103-CD8+T (D), and PD-1+CD39-CD103+CD8+T (E) cells in thyroid tissues of MNG and PTC patients. Data presented as mean ± SEM. *p < 0.05; **p < 0.01; ***p < 0.001.
We further compared the percentages of these subsets in tumors from recurrent and non-recurrent PTC patients by mIHC. Immunofluorescence staining of CD8+T-cell subset markers (PD-1, CD39, CD103, CD8) was used to calculate their number in the PTC (Figures 4A, B). The percentages (p = 0.0015) and density (p = 0.0251) of PD-1+CD39+CD8+T cells were both significantly higher in recurrence tumor than in non-recurrence tumor (Figure S5A). Furthermore, the percentages of PD-1+CD39+CD103+CD8+T (p = 0.0022) and PD-1+CD39+CD103-CD8+T (p = 0.001) cells were significantly higher in recurrence tumor than non-recurrence tumor, and this phenomenon was seen for the density of these two CD8+T-cell subsets (p = 0.0178 for PD-1+CD39+CD103+CD8+T cells, p = 0.0332, for PD-1+CD39+CD103-CD8+T cells, Figures 4C, D). As for other CD8+T-cell subsets, there was no significant difference in the two groups of PTC patients (Figures S5B–G). It was notable that no difference between tumors with recurrence and without recurrence was observed in the number and density of CD8+T cells (data not shown). Logistic regression analysis also demonstrated that PD-1+CD39+CD103+CD8+T (OR = 13.125, 95% CI: 1.876–268.997, p = 0.026) and PD-1+CD39+CD103-CD8+T (OR = 13.125, 95% CI: 1.876–268.997, p = 0.026) cells in tumor were both associated with high risk of tumor recurrence, despite no association found between these two CD8+T subsets and clinical parameters (Table S2). These results confirmed that the prominent infiltration of PD-1+CD39+CD103+CD8+T and PD-1+CD39+CD103-CD8+T cells was associated with relapse of PTC.
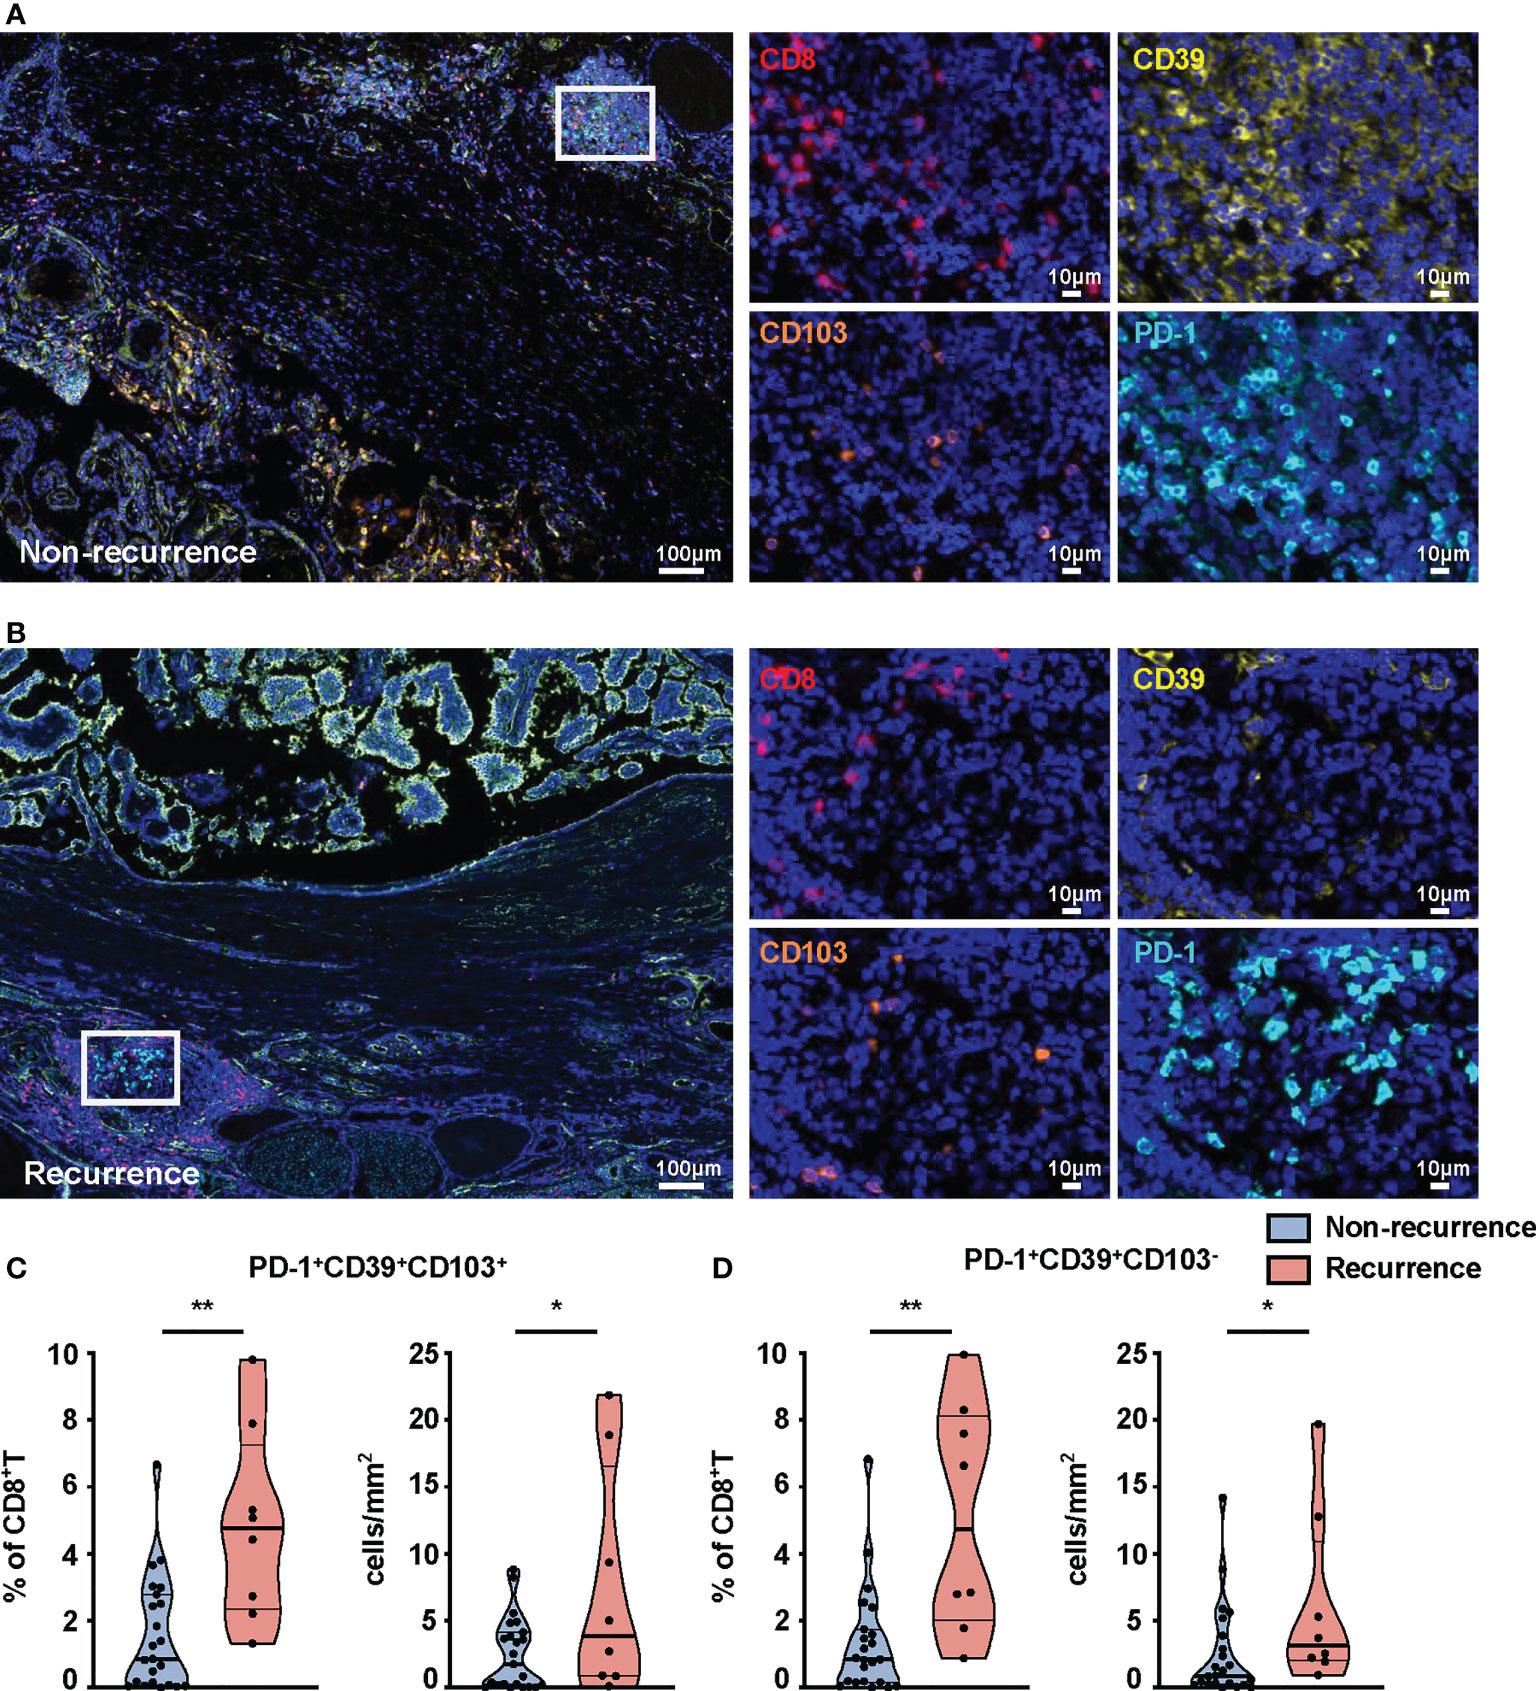
Figure 4 mIHC-based quantification of CD8+T-cell subsets in tissues from non-recurrent and recurrent PTC patients. Representative immunofluorescence staining of CD8 (red), CD39 (yellow), CD103 (orange), and PD-1 (cyan) in non-recurrent (A) and recurrent PTC tissues (B). DAPI staining is shown in blue. Scale bar, 100 μm, 10 μm. Frequencies (C) and density (D) of PD-1+CD39+CD103+CD8+T cells and PD-1+CD39+CD103-CD8+T cells in non-recurrent PTC tissues (n = 23) and recurrent PTC tissues (n = 8). (Density: total PD-1+CD39+CD103+CD8+T- and PD-1+CD39+CD103-CD8+T-cell numbers divided by area of tissue per paraffin sections). Data presented as mean ± SEM. *p < 0.05; **p < 0.01.
We also investigated the clinical relevance and prognostic significance of these CD8+T-cell subsets by employing TCGA database. Although the PD-1hiCD39hiCD8hiT-cell subset was not associated with clinical features and recurrence of PTC (Figure S5H), significant differences in histology (p = 0.0406) and sex (p = 0.0019) were observed among the eight clusters of CD8hi patients (Figures 5A, B). Male (OR = inf, 95% CI: 9.86E+32-1.52E+35, p < 0.001) was a significant risk factor for high PD-1loCD39hiCD103hi CD8hiT cells, but no significant association was detected between the other two CD8hiT subsets and clinical parameters (Table 2). More importantly, the PD-1hiCD39loCD103hi (p = 0.021), PD-1hiCD39hiCD103lo (p = 0.046), and PD-1loCD39hiCD103hi (p = 0.021) clusters showed a higher recurrence risk in CD8hi samples as compared with the PD-1hiCD39hiCD103hi cluster (Figure 5C). When other five clusters as a whole were compared with these three clusters, only the PD-1hiCD39loCD103hi cluster still had a greater recurrence risk (p = 0.011, Figure 5D). The multivariate Cox proportional hazard model also revealed that the PD-1hiCD39loCD103hi cluster independently predicted worse recurrence-free survival (HR = 3.600, 95% CI: 1.070–12.110, p = 0.0385, Table 3).
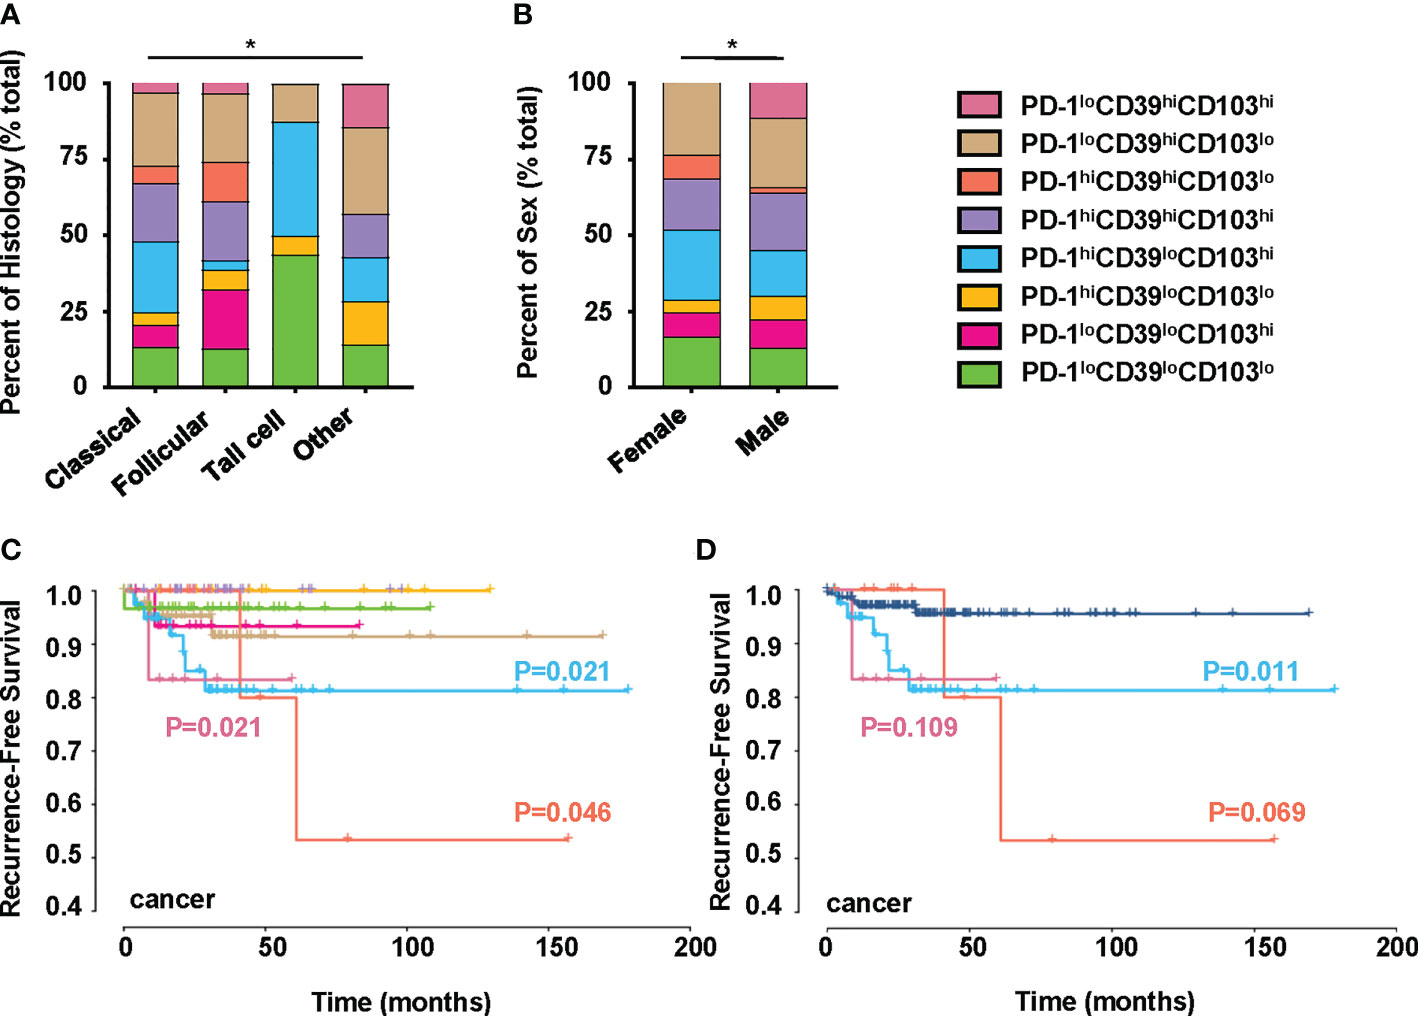
Figure 5 Clinical significance of PTC-infiltrating CD8hiT-cell subsets. This figure refers to TCGA THCA cohort (n = 195). (A) Comparison of pathological subtypes with CD8hiT-cell subsets. (B) Comparison of gender with CD8hiT-cell subsets. (C) The recurrence-free survival compared among eight clusters in TCGA database, including the PD-1loCD39loCD103lo (n = 31), PD-1loCD39loCD103hi (n = 16), PD-1hiCD39loCD103lo (n = 10), PD-1hiCD39loCD103hi (n = 41), PD-1hiCD39hiCD103hi (n = 34), PD-1hiCD39hiCD103lo (n = 12), PD-1loCD39hiCD103lo (n = 45), and PD-1loCD39hiCD103hi (n = 6) clusters. (D) The recurrence-free survival compared between the PD-1hiCD39loCD103hi, PD-1hiCD39hiCD103lo, and PD-1loCD39hiCD103hi clusters and the other five clusters. Analyses were performed with Kaplan–Meier estimates and two-sided log-rank tests. p < 0.05 was considered significant. *p < 0.05.
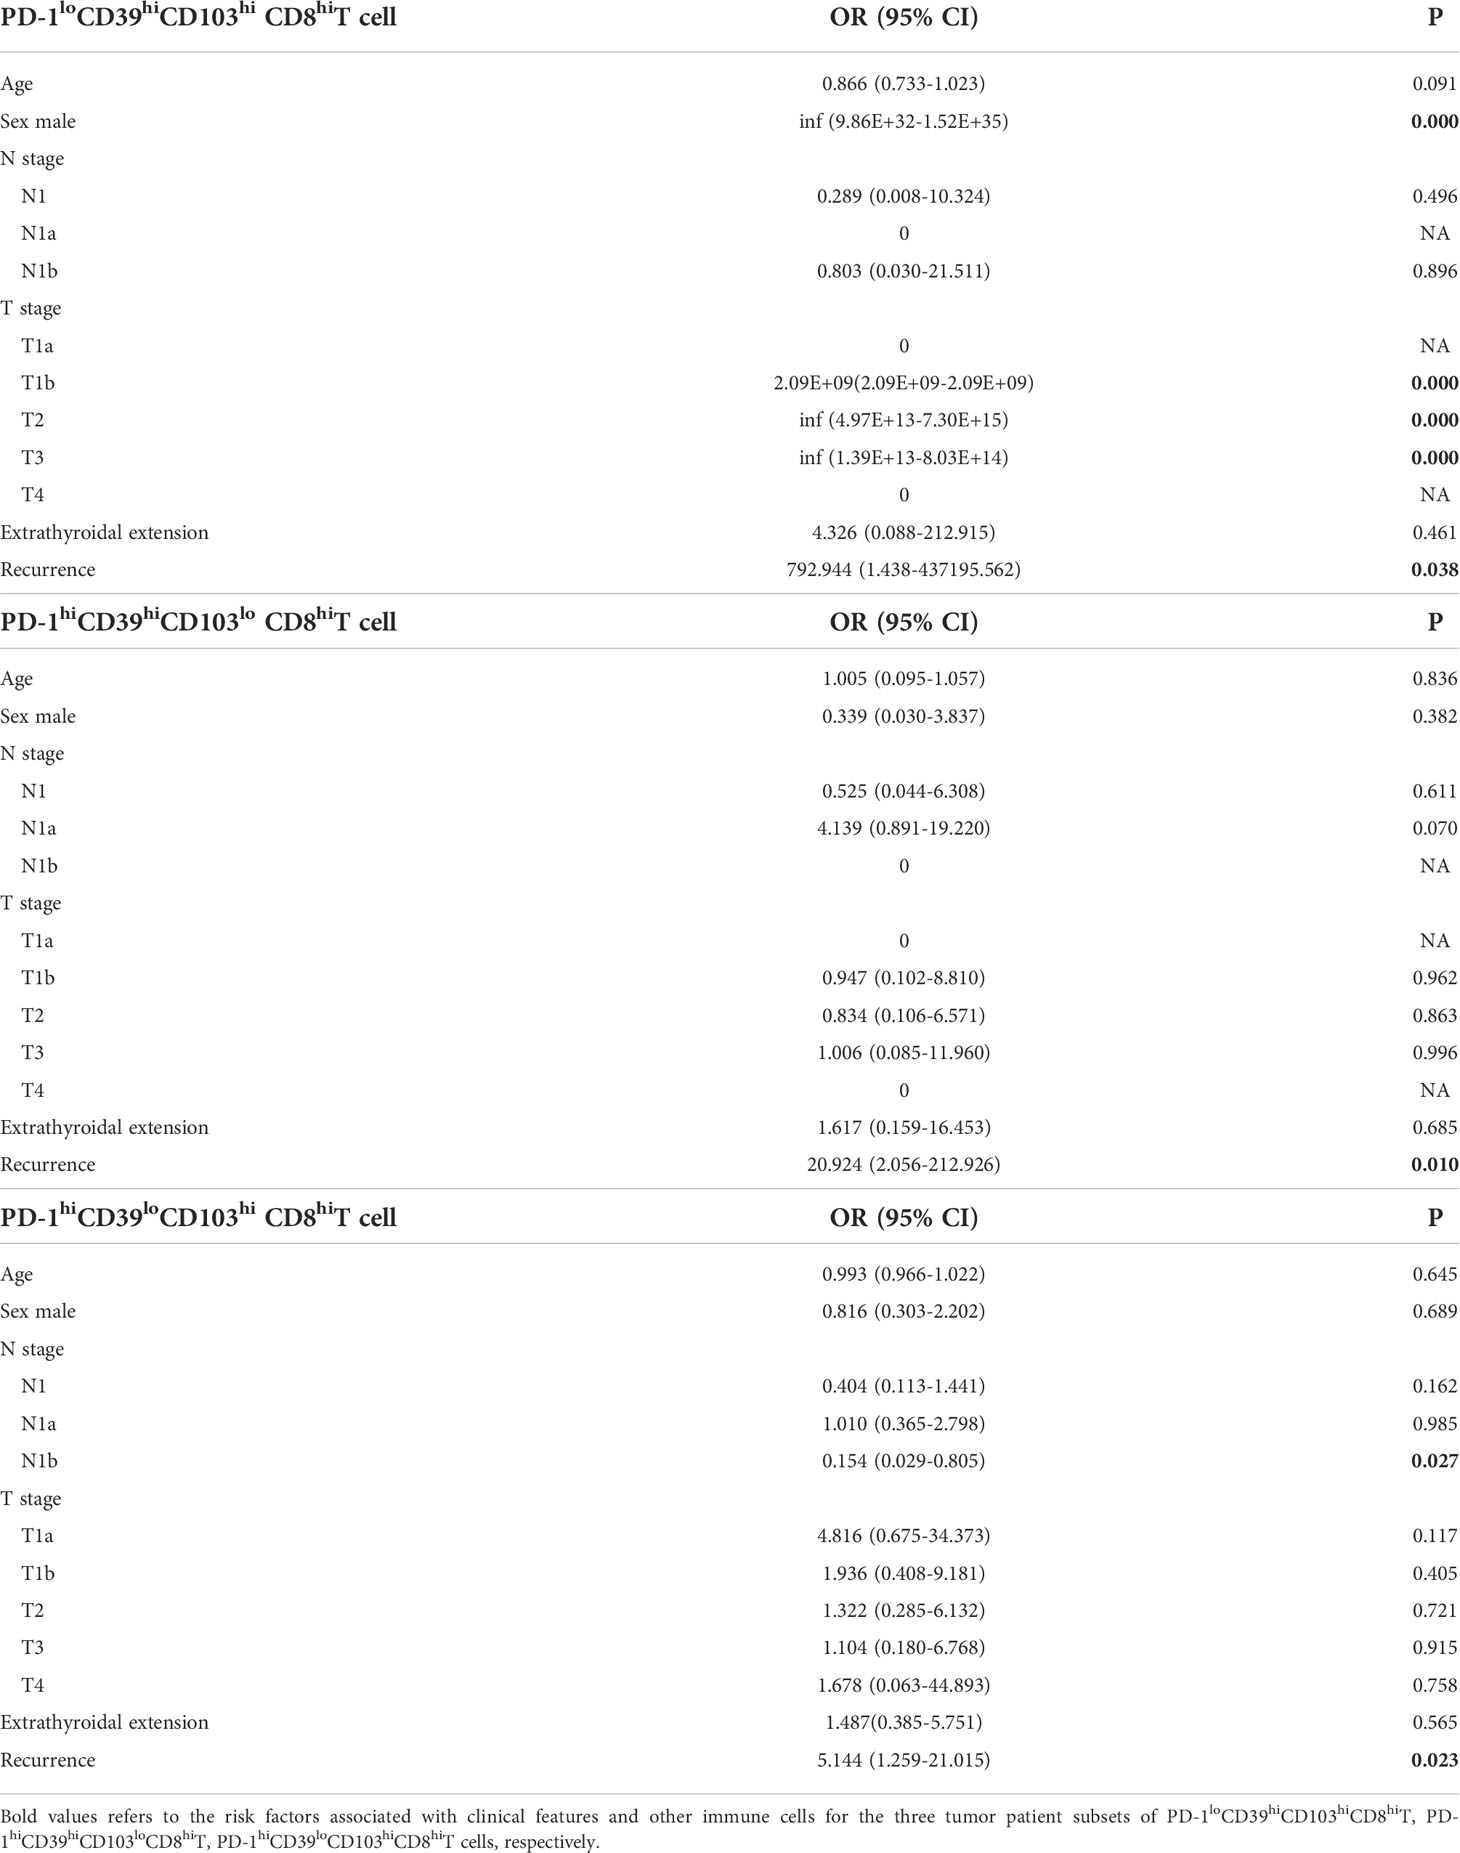
Table 2 Multinomial logistic regression analysis of clinical parameters associated with PD-1loCD39hiCD103hi CD8hiT, PD-1hiCD39hiCD103lo CD8hiT, and PD-1hiCD39loCD103hi CD8hiT cells in tumor from TCGA data.
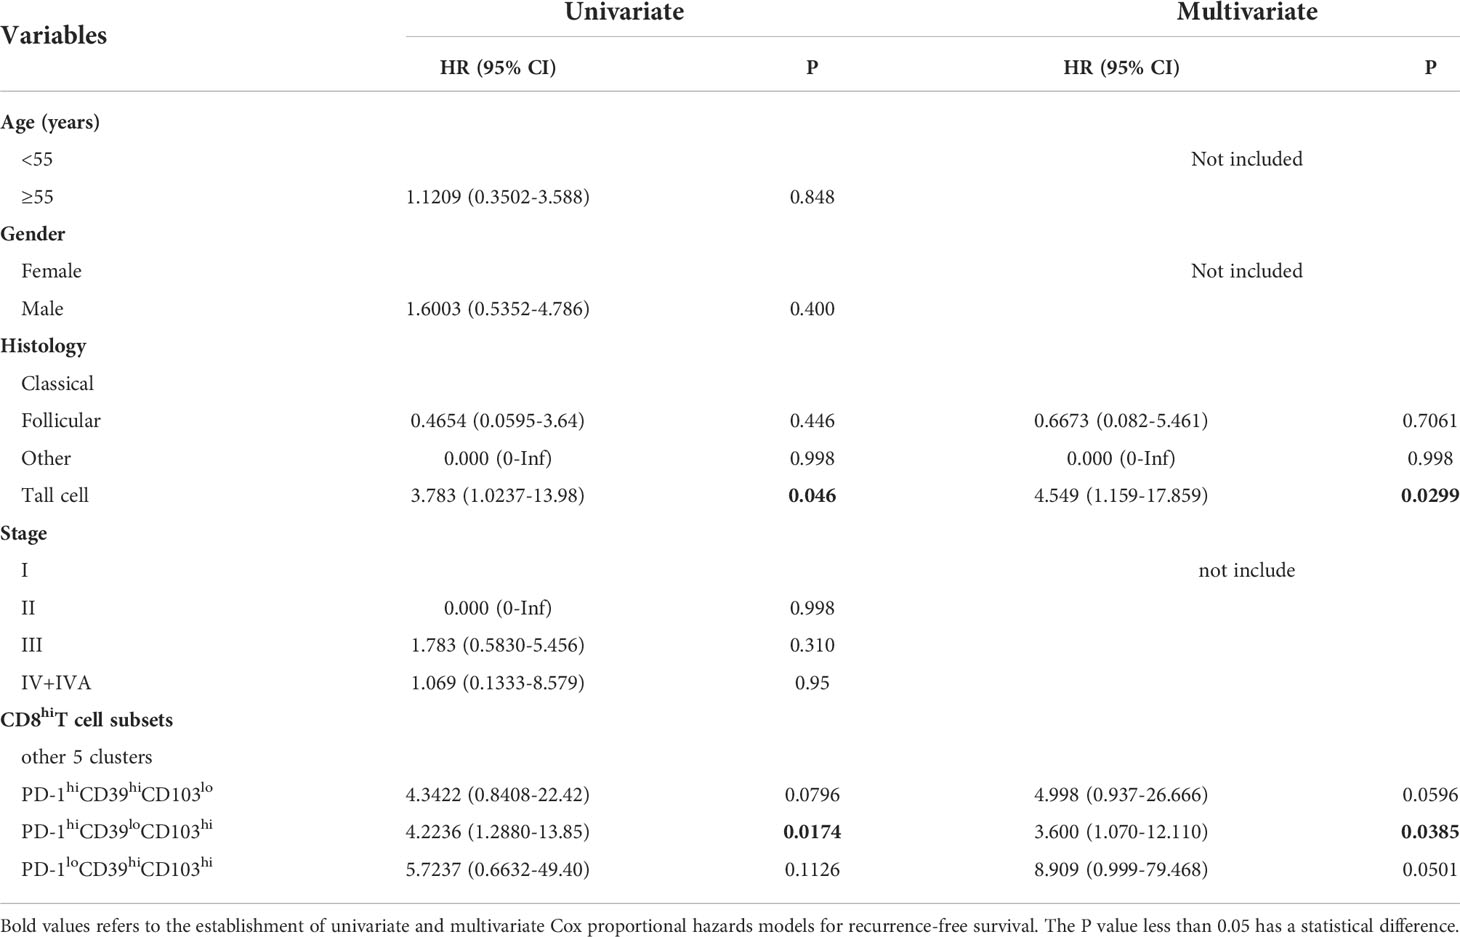
Table 3 Univariate and multivariate Cox proportional hazard models for recurrence-free survival.
We also analyzed the immune environment in the PD-1hiCD39loCD103hi, PD-1hiCD39hiCD103lo, and PD-1loCD39hiCD103hi clusters and compared them with the other five clusters. We found that the PD-1hiCD39loCD103hi subset was markedly enriched in the monocytic lineage (p < 0.0001), myeloid-derived suppressor cells (MDSC, p < 0.0001), macrophage (p < 0.0001), fibroblasts (p < 0.0001), B cells (p < 0.001), regulatory T cells (Treg, p < 0.0001), myeloid dendritic cells (mDC, p < 0.0001), T follicular helper cells (Tfh, p < 0.0001), T cells (p < 0.0001), type 1 T helper cells (Th1, p < 0.0001), and type 2 T helper cells (Th2, p < 0.0001) (Figure 6A). Multinomial logistic regression analysis results also showed that the PD-1hiCD39loCD103hi subset was associated with the monocytic lineage (OR = 202.519, 95% CI: 27.920–1469.000, p < 0.001), MDSC (OR = 631.485, 95% CI: 65.345–6102.553, p < 0.001), macrophage (OR = 133.061, 95% CI: 18.424–960.976, p < 0.001), fibroblast (OR = 19.328, 95% CI: 3.085–121.090, p = 0.002), B cells (OR = 319.830, 95% CI: 46.454–2201.962, p < 0.001), Treg cells (OR = 123.978, 95% CI: 20.187–761.406, p < 0.001), mDC (OR = 11.857, 95% CI: 2.552–55.092, p = 0.002), Tfh cells (OR = 212.966, 95% CI: 28.659–1582.536, p < 0.001), T cells (OR = 545.290, 95% CI: 69.589–4272.833, p < 0.001), Th1 cells (OR = 413.319, 95% CI: 51.615–3309.738, p < 0.001), and Th2 cells (OR = 32.775, 95% CI: 5.808–184.943, p < 0.001) (Table 4). However, B cells (p < 0.001), mDC (p = 0.044), and T cells (p = 0.011) were decreased in the PD-1loCD39hiCD103hi cluster than in the other five clusters (Figure 6A). There was no statistical difference in the scores of neutrophil, NK cell, and type 17 T helper cell (Th17) among these four CD8+T-cell subsets (Figure S6). There was a decreased trend of mDC (p = 0.068) in the PD-1hiCD39hiCD103lo cluster than in the other five clusters, whereas the difference did not reach statistical significance (Figure 6A). Of note, compared with the other five clusters, the PD-1hiCD39loCD103hi subset was highly enriched in immune checkpoint molecules (LAG3, CTLA4, TIGIT, IDO1, p < 0.001 for all molecules), cytotoxic molecules (GZMA, GZMB, PRF1, IFNG, p < 0.001 for all molecules), and chemokines (CCL4, CCL5, CXCL9, CXCL10, p < 0.001 for molecules). However, these genes in the PD-1loCD39hiCD103hi subset were in a low-expression state (Figure 6B). These results indicate that there are different mechanisms of CD8+T-cell subsets in PTC recurrence.
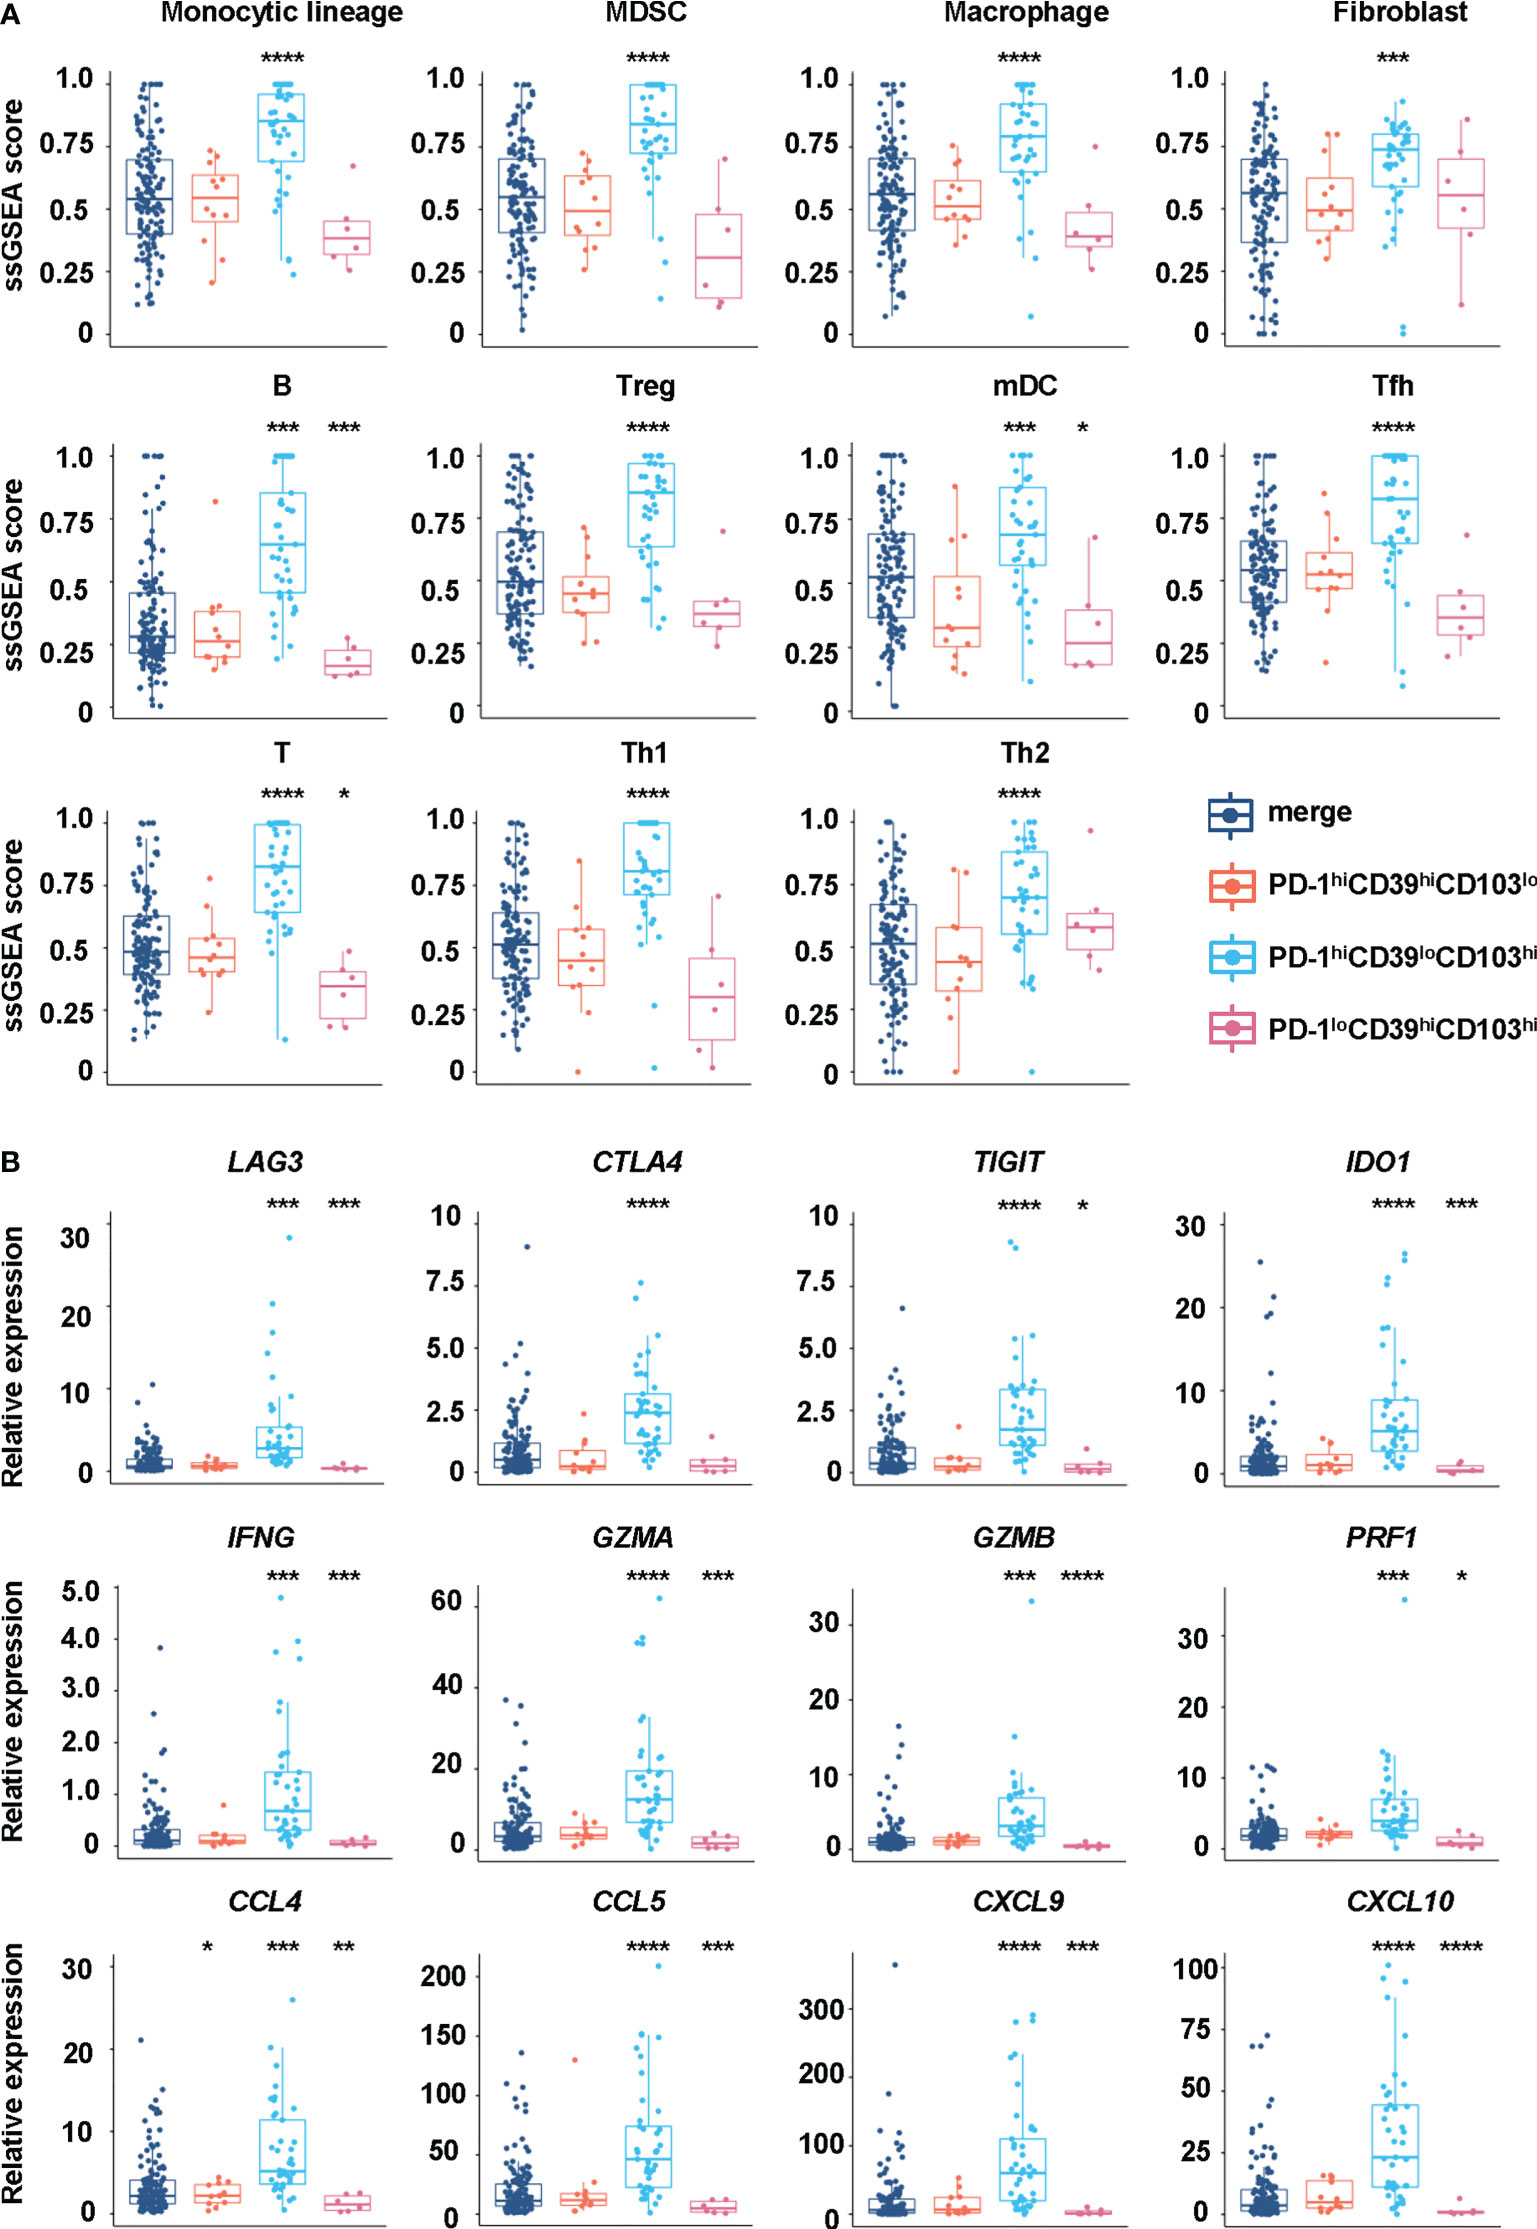
Figure 6 Differences in immune cells and regulatory factors in CD8hiT-cell subsets. (A) GSVA enrichment scores of the classical gene signatures for immune cells among the PD-1hiCD39loCD103hi, PD-1hiCD39hiCD103lo, and PD-1loCD39hiCD103hi clusters and the other five clusters. (B) The mRNA expression of immune cell regulatory factors in the PD-1hiCD39loCD103hi, PD-1hiCD39hiCD103lo, and PD-1loCD39hiCD103hi clusters compared with the other five clusters. *p < 0.05; **p < 0.01; ***p < 0.001; ****p < 0.0001.
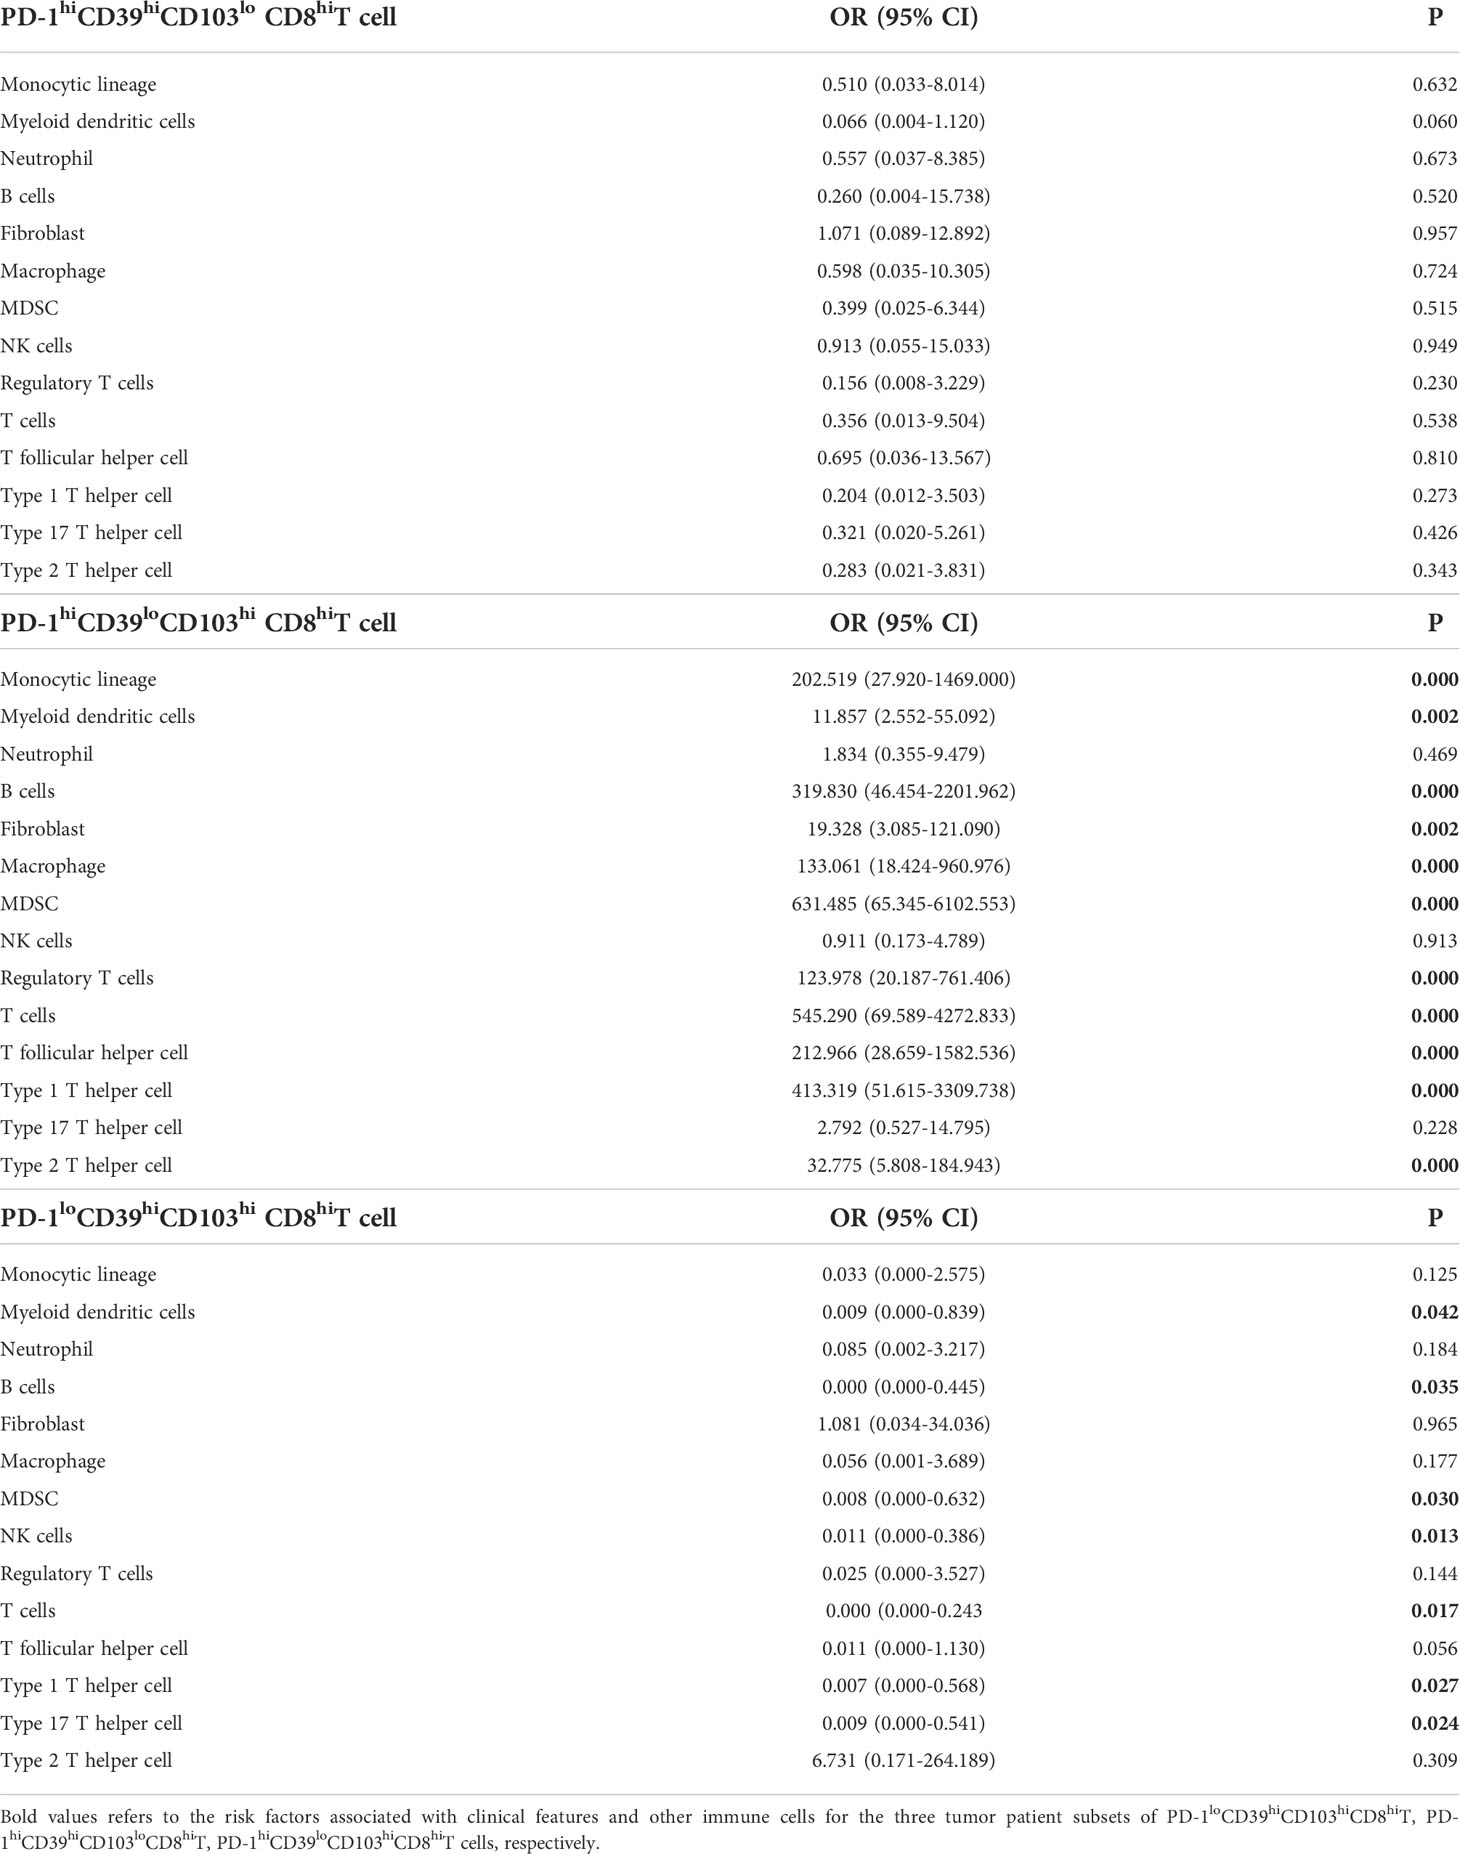
Table 4 Multinomial logistic regression analysis of immune cells associated with PD-1hiCD39hiCD103lo CD8hiT, PD-1hiCD39loCD103hi CD8hiT, and PD-1loCD39hiCD103hi CD8hiT cells in tumor from TCGA data.
In this study, multinodular non-toxic goiter (MNG), a benign disease with normal function of the thyroid gland, was taken as normal tissue to delineate the immune microenvironment, because completely normal thyroid tissue could not be obtained. We found that mononuclear cells distributed in clusters around the thyroid follicles and the percentages of mononuclear cells in MNG tissues were altered as compared with peripheral blood, especially the increase in memory T cells. During thyroid tumorigenesis, more memory T cells and Treg cells were detected in PTC tumor tissues. By delineating the immune microenvironment of MNG tissues, relatively normal thyroid tissues, and comparing them with PTC, we illustrated that CD8+T cells exhibited distinct activation patterns according to PD-1, CD39, and CD103 expression profiles in PTC, which were correlated with PTC relapse.
In line with the previous studies (11), we detected approximately 30.55% CD8+T (Figure S2F) and 62.32% CD4+T (Figure S2G) cells in PBMC of MNG. However, the percentages of several cell subsets in our observations differ markedly from those in a previous study (34), including 59.18% vs. 18.74% for memory CD4+T cells (Figure 1I), 23.16% vs. 42.8% for memory CD8+T cells (Figure 1J), and 9.61% vs. 12.7% for B cells (Figure S2D) in PBMC. We speculated that this may be due to differences in the method of peripheral blood immune cell preparation. Consistent with the results of Gogali et al. (11), we found the Treg cell and CD8+T/CD4+T cell ratio especially memory T cells in thyroid tissues significantly higher than peripheral blood of MNG patients, whereas that in NK cells was the opposite (Figures 1E–J), indicating the activation of antigen-specific naïve T cells in thyroid tissue and migration of memory T cells through blood and home to inflamed tissue (35). CD3+CD56+ cells are a heterogeneous lymphoid population that recognizes the lipid antigens presented by CD1d and has both immune-enhancing and immunosuppressive roles (36). The proportion of CD3+CD56+ cells was increased in thyroid tissues than in peripheral blood. NKT cells have not been characterized in thyroid tissues. In this study, we summarized the percentage of immune cells from MNG, which was different from peripheral blood and mapped the lymphocyte cells in spatial positions.
Consistent with previous studies (9, 11), we found no significant differences in the percentages of CD8+T, CD4+T, and NK cells in PTC tissues compared with MNG tissues (Figure S3A) and in PTC peripheral blood compared with MNG peripheral blood (Figure S3B). The difference in the percentages of CD8+T and CD4+T cells between tumor and paratumor tissues also had no statistical significance (Figure S3A). However, in TCGA database, the proportion of CD8+T cells was significantly decreased (16), whereas the proportion of CD4+T cells from tumor tissues was increased as compared with that from paratumor (37). It is well known that memory T cells are antigen-specific T cells that typically express CD45RO and can rapidly differentiate into effector T cells to kill the target cells once encountering the same antigen again (38). Therefore, increased memory T cells in PTC reflect that the immune response has been fully activated. Paratumor had more memory CD8+T cells compared with MNG, suggesting that the immune microenvironment of the thyroid lobe with tumor involvement may have already altered. Our data displayed that there were differences in Treg cells between MNG, paratumor, and tumor, with the highest proportion of tumor, which was consistent with other PTC studies (11, 19). Notably, the proportion of Treg cells in paratumor was the lowest and distinct from MNG in our results. Human CD4+CD25+ Treg cells were composed of phenotypically and functionally distinct subpopulations, which could be separated by the combination of FoxP3 and CD45RA staining, including CD45RA+FoxP3loCD25++ resting Treg cells (rTreg cells) and CD45RA-FoxP3hiCD25+++ activated Treg cells (aTreg cells), both of which were suppressive in vitro, and cytokine-secreting CD45RA-FoxP3loCD25++ (non-suppressive Treg cells) (26). Our results showed that rTreg cells and non-suppressive Treg cells were dominant Treg-cell subsets in MNG (Figure S4). In addition, Treg cells can migrate into the tumor microenvironment via various chemokine–chemokine receptor pathways (39–43). Based on this, we speculated that Treg cells in paratumor migrated into tumor nests, resulting in lower Treg cells than MNG (Figure 2E). Altogether, once PTC had developed, T cells presented a more activated state, and the variations of paratumor and MNG were different.
Our results found that PD-1, CD39, and CD103 were expressed on the CD8+T-cell surface in MNG and PTC tissues and presented diverse phenotypes. PD-1 is primarily a marker of T-cell activation (44, 45), but the PD-1 pathway can also regulate T-cell responses during cancer, where persistent antigen stimulation can lead to T-cell exhaustion (46). PD-1 has also been reported to be highly expressed on the T-cell surface in PTC, which was related to the aggressiveness of the disease (47, 48). CD39 is a ectonucleotidase encoded by the ENTPD1 gene, which can catalyze the hydrolysis of eATP and ADP released due to inflammatory stimulation or cell damage into AMP, which is then used by CD73 to synthesize adenosine with immunosuppressive effects (49). CD103 is expressed on a population of T cells found among peripheral tissues, known as tissue-resident memory T cells (TRM) (50). CD8+T cells are important for PTC recurrence (17), but we found that only some PTC patients with a specific phenotype of CD8+T cells showed a high recurrence risk. In our study, not only did PD-1+CD39+CD103-CD8+T, PD-1+CD39-CD103+CD8+T, and PD-1-CD39+CD103+CD8+T cells increase in PTC (Figures 3, 4) but also the increase in these three CD8+T-cell subsets, especially PD-1+CD39-CD103+CD8+T cells, predicted a poor recurrence-free survival of PTC patients (Figure 5). In lung cancer with a more advanced stage, the fractions of PD-1+CD39+CD8+T cells tend to be higher (51). PTC patients with PD-1-CD39+CD103+CD8+T cells had decreased B cells and mDC (Figure 6A), which are essential for CD8+T-cell activation and antitumor response (52, 53). In addition, our research showed that CD8+T cells in these patients were also in a state of impaired function with low expressions of cytotoxic molecules and perforin, which is critical for antitumor immunity (46) (Figure 6B). Interestingly, PTC patients with PD-1+CD39-CD103+ CD8+T cells were enriched in immune cells and had a high expression of inhibitory immune checkpoints and chemokines (Figure 6, Table 4), which is similar with the phenotype of anaplastic thyroid carcinoma-like PTC (54). The anaplastic thyroid carcinoma-like tumors are hot and altered–immunosuppressed tumors, indicating that PD-1+CD39-CD103+CD8+T cells may be in a dysfunctional state and exert immune suppressive potential in PTC progression. Although BRAFV600E mutation is related to CD8+T cells in PTC (16), our data showed that CD8+T-cell subsets were not correlated with BRAFV600E mutation (data not shown), only with histology and sex (Figures 5A, B). Herein, these specific CD8+T cells in PTC were detected to have an association with age, tumor size, or sex (Tables 2, S1), which are reported as risk factors for PTC recurrence (55–57).
In summary, we described the differences in immune cell composition between thyroid tissues and peripheral blood of MNG patients. More importantly, we compared the changes of immune cells in the process of MNG to PTC and discovered the changes in the active status of T cells after the occurrence of malignancy. We also revealed the heterogeneity for PTC based on the expressions of PD1, CD39, and CD103 on CD8+T cells. Although the detailed mechanisms need to be further elucidated in future studies, our findings have shown an important role of CD8+T-cell subsets in PTC rapid progression or recurrence, which might provide new ideas for the treatment of patients who dedifferentiate from differentiated thyroid cancer to anaplastic thyroid carcinoma.
The raw data supporting the conclusions of this article will be made available by the authors, without undue reservation.
The research was approved by Medical Ethics Committee of the second affiliated hospital of South China University of Technology (K-2019-185). The patients/participants provided their written informed consent to participate in this study. Written informed consent was obtained from the individual(s) for the publication of any potentially identifiable images or data included in this article.
ZC, M-LG, and Y-YL performed the experiments. ZC and M-LG analyzed the data. KY and LL helped to analyze the mIHC results. FS and HG collected samples for the experiments. Q-ZL, BX, and Z-XL designed and provided the funding of the project. ZC wrote the manuscript. Q-ZL, LL, HG, BX, and Z-XL revised the manuscript. All authors contributed to the article and approved the submitted version.
This work was supported by the Guangzhou Science and Technology Plan Project (202102080170).
We would like to thank The Cancer Genome Atlas (TCGA) database for providing great help to our research.
The authors declare that the research was conducted in the absence of any commercial or financial relationships that could be construed as a potential conflict of interest.
All claims expressed in this article are solely those of the authors and do not necessarily represent those of their affiliated organizations, or those of the publisher, the editors and the reviewers. Any product that may be evaluated in this article, or claim that may be made by its manufacturer, is not guaranteed or endorsed by the publisher.
The Supplementary Material for this article can be found online at: https://www.frontiersin.org/articles/10.3389/fimmu.2022.894919/full#supplementary-material
Supplementary Figure 1 | Gating strategies for flow cytometry of peripheral blood (A) and tissue (B). Mononuclear cells (MNCs, DAPI-CD45+CD16-) were gated from live leukocytes without doublets. T cells (CD3+CD56-), NK cells (CD3-CD56+) and CD3+CD56+ cells were identified from MNCs. B cells (CD19+) and monocytes (CD14+) were identified from CD3-CD56- population. Memory T cells (CD45RO+CD45RA-) were gated separately on CD8+T and CD4+T cells. Treg cells were defined as CD127-CD25+CD4+T cells. Tissue CD8+T cells were further divided into eight subsets by PD-1, CD39 and CD103.
Supplementary Figure 2 | Feature plots of t-SNE maps and comparison of CD8+T, CD4+T, B cells and monocytes in peripheral blood and thyroid tissues from MNG patients. (A) Feature plots of CD3, CD4, CD8, CD56, CD19, and CD14 expression. Frequencies (B) and density (C) of CD4+T (CD4+CD45+), CD8+T (CD8+CD45+), NK (CD56+CD45+) and B (CD20+CD45+) cells in CD45+ cells in MNG tissues by mIHC. Percentages of B cells (D) and monocytes (E) in MNCs in peripheral blood and thyroid tissue by flow cytometry. Percentages of CD8+T (F) and CD4+T (G) cells in T cells (CD3+ CD56-) in peripheral blood and thyroid tissue by flow cytometry. Data presented as mean ± SEM. * p < 0.05; ** p < 0.01; *** p < 0.001.
Supplementary Figure 3 | Composition of immune cell subsets in MNG and PTC patients. (A) Percentages of CD8+T, CD4+T, CD3+CD56+, NK, B cells and monocytes in MNCs in MNG, paratumor, tumor tissue. (B) Percentages of CD8+T, CD4+T, CD3+CD56+, NK, B cells and monocytes in PBMC from MNG and PTC patients.
Supplementary Figure 4 | Treg cell subsets in MNG and PTC patients. The ssGSEA score of CD45RA+FoxP3loCD25++ cells (A), CD45RA-FoxP3hiCD25+++ cells (B), and CD45RA-FoxP3loCD25++ (C) in MNG, paratumor and tumor tissues.
Supplementary Figure 5 | mIHC-based quantification of immune cell subsets in tissues from MNG and PTC patients and clinical significance of PTC-infiltrating CD8hiT cell subsets based on the expression of PD-1 and CD39. Frequencies and density of PD-1+CD39+CD8+T (A), PD-1+CD39-CD103-CD8+T (B), PD-1+CD39-CD103+CD8+T (C), PD-1-CD39+CD103-CD8+T (D), PD-1-CD39+CD103+CD8+T (E), PD-1-CD39-CD103-CD8+T (F) and PD-1-CD39-CD103+CD8+T (G) cells in non-recurrent PTC tissues (n=23) and recurrent PTC tissues (n=8) by mIHC. (H) Comparison of pathological subtypes, gender and the recurrence free survival among 4 clusters in TCGA database, including PD-1hiCD39hi (n=46), PD-1loCD39lo (n=47), PD-1loCD39hi (n=51), PD-1hiCD39lo (n=51) clusters.
Supplementary Figure 6 | Enrichment scores of neutrophils, NK cells and Th17 cells in CD8hiT cell subsets. GSVA enrichment scores of the classical gene signatures for neutrophils (A), NK cells (B) and Th17 cells (C) among PD-1hiCD39loCD103hi, PD-1hiCD39hiCD103lo, PD-1loCD39hiCD103hi clusters and other 5 clusters.
1. Siegel RL, Miller KD, Fuchs HE, Jemal A. Cancer statistics, 2021. CA Cancer J Clin (2021) 71(1):7–33. doi: 10.3322/caac.21654
2. Sipos JA, Mazzaferri EL. Thyroid cancer epidemiology and prognostic variables. Clin Oncol (R Coll Radiol) (2010) 22(6):395–404. doi: 10.1016/j.clon.2010.05.004
3. Dong W, Horiuchi K, Tokumitsu H, Sakamoto A, Noguchi E, Ueda Y, et al. Time-varying pattern of mortality and recurrence from papillary thyroid cancer: Lessons from a long-term follow-up. Thyroid (2019) 29(6):802–8. doi: 10.1089/thy.2018.0128
4. Young S, Harari A, Smooke-Praw S, Ituarte PH, Yeh MW. Effect of reoperation on outcomes in papillary thyroid cancer. Surgery (2013) 154(6):1354–61. doi: 10.1016/j.surg.2013.06.043
5. French JD. Immunotherapy for advanced thyroid cancers - rationale, current advances and future strategies. Nat Rev Endocrinol (2020) 16(11):629–41. doi: 10.1038/s41574-020-0398-9
6. Matsubayashi S, Kawai K, Matsumoto Y, Mukuta T, Morita T, Hirai K, et al. The correlation between papillary thyroid carcinoma and lymphocytic infiltration in the thyroid gland. J Clin Endocrinol Metab (1995) 80(12):3421–4. doi: 10.1210/jcem.80.12.8530576
7. Modi J, Patel A, Terrell R, Tuttle RM, Francis GL. Papillary thyroid carcinomas from young adults and children contain a mixture of lymphocytes. J Clin Endocrinol Metab (2003) 88(9):4418–25. doi: 10.1210/jc.2003-030342
8. Yin H, Tang Y, Guo Y, Wen S. Immune microenvironment of thyroid cancer. J Cancer (2020) 11(16):4884–96. doi: 10.7150/jca.44506
9. Yu H, Huang X, Liu X, Jin H, Zhang G, Zhang Q, et al. Regulatory T cells and plasmacytoid dendritic cells contribute to the immune escape of papillary thyroid cancer coexisting with multinodular non-toxic goiter. Endocrine (2013) 44(1):172–81. doi: 10.1007/s12020-012-9853-2
10. Gogali F, Paterakis G, Rassidakis GZ, Liakou CI, Liapi C. CD3(-)CD16(-)CD56(bright) immunoregulatory NK cells are increased in the tumor microenvironment and inversely correlate with advanced stages in patients with papillary thyroid cancer. Thyroid (2013) 23(12):1561–8. doi: 10.1089/thy.2012.0560
11. Gogali F, Paterakis G, Rassidakis GZ, Kaltsas G, Liakou CI, Gousis P, et al. Phenotypical analysis of lymphocytes with suppressive and regulatory properties (Tregs) and NK cells in the papillary carcinoma of thyroid. J Clin Endocrinol Metab (2012) 97(5):1474–82. doi: 10.1210/jc.2011-1838
12. Wang X, Li J, Lu C, Wang G, Wang Z, Liu X, et al. IL-10-producing b cells in differentiated thyroid cancer suppress the effector function of T cells but improve their survival upon activation. Exp Cell Res (2019) 376(2):192–7. doi: 10.1016/j.yexcr.2019.01.021
13. Varricchi G, Loffredo S, Marone G, Modestino L, Fallahi P, Ferrari SM, et al. The immune landscape of thyroid cancer in the context of immune checkpoint inhibition. Int J Mol Sci (2019) 20(16):3934. doi: 10.3390/ijms20163934
14. Cunha LL, Morari EC, Guihen AC, Razolli D, Gerhard R, Nonogaki S, et al. Infiltration of a mixture of immune cells may be related to good prognosis in patients with differentiated thyroid carcinoma. Clin Endocrinol (Oxf) (2012) 77(6):918–25. doi: 10.1111/j.1365-2265.2012.04482.x
15. French JD, Weber ZJ, Fretwell DL, Said S, Klopper JP, Haugen BR. Tumor-associated lymphocytes and increased FoxP3+ regulatory T cell frequency correlate with more aggressive papillary thyroid cancer. J Clin Endocrinol Metab (2010) 95(5):2325–33. doi: 10.1210/jc.2009-2564
16. Yang Z, Wei X, Pan Y, Xu J, Si Y, Min Z, et al. A new risk factor indicator for papillary thyroid cancer based on immune infiltration. Cell Death Dis (2021) 12(1):51. doi: 10.1038/s41419-020-03294-z
17. Cunha LL, Marcello MA, Nonogaki S, Morari EC, Soares FA, Vassallo J, et al. CD8+ tumour-infiltrating lymphocytes and COX2 expression may predict relapse in differentiated thyroid cancer. Clin Endocrinol (Oxf) (2015) 83(2):246–53. doi: 10.1111/cen.12586
18. Imam S, Paparodis R, Sharma D, Jaume JC. Lymphocytic profiling in thyroid cancer provides clues for failure of tumor immunity. Endocr Relat Cancer (2014) 21(3):505–16. doi: 10.1530/erc-13-0436
19. Liu Y, Yun X, Gao M, Yu Y, Li X. Analysis of regulatory T cells frequency in peripheral blood and tumor tissues in papillary thyroid carcinoma with and without hashimoto's thyroiditis. Clin Transl Oncol (2015) 17(4):274–80. doi: 10.1007/s12094-014-1222-6
20. Luster M, Aktolun C, Amendoeira I, Barczyński M, Bible KC, Duntas LH, et al. European Perspective on 2015 American thyroid association management guidelines for adult patients with thyroid nodules and differentiated thyroid cancer: Proceedings of an interactive international symposium. Thyroid (2019) 29(1):7–26. doi: 10.1089/thy.2017.0129
21. Yao Y, Xu P, Ying T, Wang Y, Wang X, Shu L, et al. Integrative analysis of DNA methylation and gene expression identified follicular thyroid cancer-specific diagnostic biomarkers. Front Endocrinol (Lausanne) (2021) 12:736068. doi: 10.3389/fendo.2021.736068
22. He H, Jazdzewski K, Li W, Liyanarachchi S, Nagy R, Volinia S, et al. The role of microRNA genes in papillary thyroid carcinoma. Proc Natl Acad Sci U.S.A. (2005) 102(52):19075–80. doi: 10.1073/pnas.0509603102
23. Dom G, Tarabichi M, Unger K, Thomas G, Oczko-Wojciechowska M, Bogdanova T, et al. A gene expression signature distinguishes normal tissues of sporadic and radiation-induced papillary thyroid carcinomas. Br J Cancer (2012) 107(6):994–1000. doi: 10.1038/bjc.2012.302
24. Vasko V, Espinosa AV, Scouten W, He H, Auer H, Liyanarachchi S, et al. Gene expression and functional evidence of epithelial-to-mesenchymal transition in papillary thyroid carcinoma invasion. Proc Natl Acad Sci U.S.A. (2007) 104(8):2803–8. doi: 10.1073/pnas.0610733104
25. Bindea G, Mlecnik B, Tosolini M, Kirilovsky A, Waldner M, Obenauf AC, et al. Spatiotemporal dynamics of intratumoral immune cells reveal the immune landscape in human cancer. Immunity (2013) 39(4):782–95. doi: 10.1016/j.immuni.2013.10.003
26. Miyara M, Yoshioka Y, Kitoh A, Shima T, Wing K, Niwa A, et al. Functional delineation and differentiation dynamics of human CD4+ T cells expressing the FoxP3 transcription factor. Immunity (2009) 30(6):899–911. doi: 10.1016/j.immuni.2009.03.019
27. Sharma A, Rudra D. Emerging functions of regulatory T cells in tissue homeostasis. Front Immunol (2018) 9:883. doi: 10.3389/fimmu.2018.00883
28. Mohr A, Malhotra R, Mayer G, Gorochov G, Miyara M. Human FOXP3(+) T regulatory cell heterogeneity. Clin Transl Immunol (2018) 7(1):e1005. doi: 10.1002/cti2.1005
29. Zemmour D, Zilionis R, Kiner E, Klein AM, Mathis D, Benoist C. Single-cell gene expression reveals a landscape of regulatory T cell phenotypes shaped by the TCR. Nat Immunol (2018) 19(3):291–301. doi: 10.1038/s41590-018-0051-0
30. Charoentong P, Finotello F, Angelova M, Mayer C, Efremova M, Rieder D, et al. Pan-cancer immunogenomic analyses reveal genotype-immunophenotype relationships and predictors of response to checkpoint blockade. Cell Rep (2017) 18(1):248–62. doi: 10.1016/j.celrep.2016.12.019
31. Kansy BA, Concha-Benavente F, Srivastava RM, Jie HB, Shayan G, Lei Y, et al. PD-1 status in CD8(+) T cells associates with survival and anti-PD-1 therapeutic outcomes in head and neck cancer. Cancer Res (2017) 77(22):6353–64. doi: 10.1158/0008-5472.Can-16-3167
32. Xiao Y, Li H, Mao L, Yang QC, Fu LQ, Wu CC, et al. CD103(+) T and dendritic cells indicate a favorable prognosis in oral cancer. J Dent Res (2019) 98(13):1480–7. doi: 10.1177/0022034519882618
33. Qi Y, Xia Y, Lin Z, Qu Y, Qi Y, Chen Y, et al. Tumor-infiltrating CD39(+)CD8(+) T cells determine poor prognosis and immune evasion in clear cell renal cell carcinoma patients. Cancer Immunol Immunother (2020) 69(8):1565–76. doi: 10.1007/s00262-020-02563-2
34. Bossowski A, Urban M, Stasiak-Barmuta A. Analysis of changes in the percentage of b (CD19) and T (CD3) lymphocytes, subsets CD4, CD8 and their memory (CD45RO), and naive (CD45RA) T cells in children with immune and non-immune thyroid diseases. J Pediatr Endocrinol Metab (2003) 16(1):63–70. doi: 10.1515/jpem.2003.16.1.63
35. Masopust D, Schenkel JM. The integration of T cell migration, differentiation and function. Nat Rev Immunol (2013) 13(5):309–20. doi: 10.1038/nri3442
36. Crosby CM, Kronenberg M. Tissue-specific functions of invariant natural killer T cells. Nat Rev Immunol (2018) 18(9):559–74. doi: 10.1038/s41577-018-0034-2
37. Xie Z, Li X, He Y, Wu S, Wang S, Sun J, et al. Immune cell confrontation in the papillary thyroid carcinoma microenvironment. Front Endocrinol (Lausanne) (2020) 11:570604. doi: 10.3389/fendo.2020.570604
38. Han J, Khatwani N, Searles TG, Turk MJ, Angeles CV. Memory CD8(+) T cell responses to cancer. Semin Immunol (2020) 49:101435. doi: 10.1016/j.smim.2020.101435
39. Sugiyama D, Nishikawa H, Maeda Y, Nishioka M, Tanemura A, Katayama I, et al. Anti-CCR4 mAb selectively depletes effector-type FoxP3+CD4+ regulatory T cells, evoking antitumor immune responses in humans. Proc Natl Acad Sci U.S.A. (2013) 110(44):17945–50. doi: 10.1073/pnas.1316796110
40. Tan MC, Goedegebuure PS, Belt BA, Flaherty B, Sankpal N, Gillanders WE, et al. Disruption of CCR5-dependent homing of regulatory T cells inhibits tumor growth in a murine model of pancreatic cancer. J Immunol (2009) 182(3):1746–55. doi: 10.4049/jimmunol.182.3.1746
41. De Simone M, Arrigoni A, Rossetti G, Gruarin P, Ranzani V, Politano C, et al. Transcriptional landscape of human tissue lymphocytes unveils uniqueness of tumor-infiltrating T regulatory cells. Immunity (2016) 45(5):1135–47. doi: 10.1016/j.immuni.2016.10.021
42. Nishikawa H, Koyama S. Mechanisms of regulatory T cell infiltration in tumors: implications for innovative immune precision therapies. J Immunother Cancer (2021) 9(7):e002591. doi: 10.1136/jitc-2021-002591
43. Facciabene A, Peng X, Hagemann IS, Balint K, Barchetti A, Wang LP, et al. Tumour hypoxia promotes tolerance and angiogenesis via CCL28 and t(reg) cells. Nature (2011) 475(7355):226–30. doi: 10.1038/nature10169
44. Gros A, Robbins PF, Yao X, Li YF, Turcotte S, Tran E, et al. PD-1 identifies the patient-specific CD8⁺ tumor-reactive repertoire infiltrating human tumors. J Clin Invest (2014) 124(5):2246–59. doi: 10.1172/jci73639
45. Gros A, Parkhurst MR, Tran E, Pasetto A, Robbins PF, Ilyas S, et al. Prospective identification of neoantigen-specific lymphocytes in the peripheral blood of melanoma patients. Nat Med (2016) 22(4):433–8. doi: 10.1038/nm.4051
46. van der Leun AM, Thommen DS, Schumacher TN. CD8(+) T cell states in human cancer: insights from single-cell analysis. Nat Rev Cancer (2020) 20(4):218–32. doi: 10.1038/s41568-019-0235-4
47. Bastman JJ, Serracino HS, Zhu Y, Koenig MR, Mateescu V, Sams SB, et al. Tumor-infiltrating T cells and the PD-1 checkpoint pathway in advanced differentiated and anaplastic thyroid cancer. J Clin Endocrinol Metab (2016) 101(7):2863–73. doi: 10.1210/jc.2015-4227
48. Severson JJ, Serracino HS, Mateescu V, Raeburn CD, McIntyre RC Jr., Sams SB, et al. PD-1+Tim-3+ CD8+ T lymphocytes display varied degrees of functional exhaustion in patients with regionally metastatic differentiated thyroid cancer. Cancer Immunol Res (2015) 3(6):620–30. doi: 10.1158/2326-6066.Cir-14-0201
49. Moesta AK, Li XY, Smyth MJ. Targeting CD39 in cancer. Nat Rev Immunol (2020) 20(12):739–55. doi: 10.1038/s41577-020-0376-4
50. Yang K, Kallies A. Tissue-specific differentiation of CD8(+) resident memory T cells. Trends Immunol (2021) 42(10):876–90. doi: 10.1016/j.it.2021.08.002
51. Tøndell A, Wahl SGF, Sponaas AM, Sørhaug S, Børset M, Haug M. Ectonucleotidase CD39 and checkpoint signalling receptor programmed death 1 are highly elevated in intratumoral immune cells in non-small-cell lung cancer. Transl Oncol (2020) 13(1):17–24. doi: 10.1016/j.tranon.2019.09.003
52. Smith AS, Knochelmann HM, Wyatt MM, Rangel Rivera GO, Rivera-Reyes AM, Dwyer CJ, et al. B cells imprint adoptively transferred CD8(+) T cells with enhanced tumor immunity. J Immunother Cancer (2022) 10(1):e003078. doi: 10.1136/jitc-2021-003078
53. Kuhn S, Hyde EJ, Yang J, Rich FJ, Harper JL, Kirman JR, et al. Increased numbers of monocyte-derived dendritic cells during successful tumor immunotherapy with immune-activating agents. J Immunol (2013) 191(4):1984–92. doi: 10.4049/jimmunol.1301135
54. Giannini R, Moretti S, Ugolini C, Macerola E, Menicali E, Nucci N, et al. Immune profiling of thyroid carcinomas suggests the existence of two major phenotypes: An ATC-like and a PDTC-like. J Clin Endocrinol Metab (2019) 104(8):3557–75. doi: 10.1210/jc.2018-01167
55. Hwangbo Y, Kim JM, Park YJ, Lee EK, Lee YJ, Park DJ, et al. Long-term recurrence of small papillary thyroid cancer and its risk factors in a Korean multicenter study. J Clin Endocrinol Metab (2017) 102(2):625–33. doi: 10.1210/jc.2016-2287
56. Zahedi A, Bondaz L, Rajaraman M, Leslie WD, Jefford C, Young JE, et al. Risk for thyroid cancer recurrence is higher in men than in women independent of disease stage at presentation. Thyroid (2020) 30(6):871–7. doi: 10.1089/thy.2018.0775
Keywords: papillary thyroid cancer (PTC), recurrence, CD8+T cells, multiplex immunohistochemistry, PD-1, CD39, CD103
Citation: Chen Z, Guo M-L, Li Y-Y, Yan K, Li L, Shen F, Guan H, Liu Q-Z, Xu B and Lian Z-X (2022) Immune profiling identifies CD8+ T-cell subset signatures as prognostic markers for recurrence in papillary thyroid cancer. Front. Immunol. 13:894919. doi: 10.3389/fimmu.2022.894919
Received: 12 March 2022; Accepted: 19 October 2022;
Published: 07 November 2022.
Edited by:
Ana Carolina Monteiro, Fluminense Federal University, BrazilReviewed by:
Mai Chan Lau, Institute of Molecular and Cell Biology (A*STAR), SingaporeCopyright © 2022 Chen, Guo, Li, Yan, Li, Shen, Guan, Liu, Xu and Lian. This is an open-access article distributed under the terms of the Creative Commons Attribution License (CC BY). The use, distribution or reproduction in other forums is permitted, provided the original author(s) and the copyright owner(s) are credited and that the original publication in this journal is cited, in accordance with accepted academic practice. No use, distribution or reproduction is permitted which does not comply with these terms.
*Correspondence: Bo Xu, ZXlib3h1QHNjdXQuZWR1LmNu; Qing-Zhi Liu, bGl1cXpoQHNjdXQuZWR1LmNu
†Present address: Meng-Li Guo, Xiangyang Central Hospital, Affiliated with Hubei University of Arts and Science, Xiangyang, Hubei, China
‡These authors have contributed equally to this work and share first authorship
Disclaimer: All claims expressed in this article are solely those of the authors and do not necessarily represent those of their affiliated organizations, or those of the publisher, the editors and the reviewers. Any product that may be evaluated in this article or claim that may be made by its manufacturer is not guaranteed or endorsed by the publisher.
Research integrity at Frontiers
Learn more about the work of our research integrity team to safeguard the quality of each article we publish.