 Manon Rival
 Manon Galoppin
 Eric Thouvenot
94% of researchers rate our articles as excellent or good
Learn more about the work of our research integrity team to safeguard the quality of each article we publish.
Find out more
MINI REVIEW article
Front. Immunol. , 27 April 2022
Sec. Autoimmune and Autoinflammatory Disorders
Volume 13 - 2022 | https://doi.org/10.3389/fimmu.2022.866092
This article is part of the Research Topic Understanding the Concept of Pre-Clinical Autoimmunity View all 15 articles
Radiologically Isolated Syndrome (RIS) is characterized by MRI-typical brain lesions fulfilling the 2009 Okuda criteria, detected in patients without clinical conditions suggestive of MS. Half of all RIS patients convert to MS within 10 years. The individual course of the disease, however, is highly variable with 12% of RIS converting directly to progressive MS. Demographic and imaging markers have been associated with the risk of clinical MS in RIS: male sex, younger age, infra-tentorial, and spinal cord lesions on the index scan and gadolinium-enhancing lesions on index or follow-up scans. Although not considered as a distinct MS phenotype, RIS certainly shares common pathological features with early active and progressive MS. In this review, we specifically focus on biological markers that may help refine the risk stratification of clinical MS and disability for early treatment. Intrathecal B-cell activation with cerebrospinal fluid (CSF) oligoclonal bands, elevated kappa free light chains, and cytokine production is specific to MS, whereas neurofilament light chain (NfL) levels reflect disease activity associated with neuroaxonal injury. Specific microRNA profiles have been identified in RIS converters in both CSF and blood. CSF levels of chitinases and glial acidic fibrillary protein (GFAP) reflecting astrogliosis might help predict the evolution of RIS to progressive MS. Innovative genomic, proteomic, and metabolomic approaches have provided several new candidate biomarkers to be explored in RIS. Leveraging data from randomized controlled trials and large prospective RIS cohorts with extended follow-up to identify, as early as possible, biomarkers for predicting greater disease severity would be invaluable for counseling patients, managing treatment, and monitoring.
In 2013, the classical definitions of MS clinical courses were modified to take disease activity and disease progression into account (1). Additionally, a clinically isolated syndrome (CIS), the first attack of typical clinical MS symptoms, was defined as early-stage MS, later becoming relapsing–remitting multiple sclerosis (RRMS) if subsequently clinically active and fulfilling the current MS diagnostic criteria (1). Various signs and symptoms (namely, fatigue, pain, bowel and bladder dysfunction, sleep disturbances, and cognitive impairment) and increased healthcare usage may occur in the latent period between the start of neuropathological lesions and CIS, defining the concept of a prodromal phase of MS (2). However, profiles associating multiple biological and clinical features suggestive of MS should be carefully defined to reach appropriate diagnostic specificity before they can be used as markers to screen for MS in populations at risk, such as the offspring of MS patients. In the absence of clinical conditions suggestive of MS, only MRI lesions that fulfill the 2005 dissemination in space criteria (the so-called Okuda criteria) have shown enough specificity for the risk of clinical conversion during follow-up and therefore reached a consensus for the definition of radiologically isolated syndrome (RIS) (3, 4). With this definition, one-third of RIS patients experience their first clinical event, typical of RRMS, after 5 years, while another third show new brain lesions on follow-up scans (5). A long-term retrospective multinational study showed that more than 50% of RIS subjects converted to MS within 10 years, with 11.7% meeting the criteria for primary progressive MS (PPMS) (6).
Predicting the evolution of RIS is of utmost importance for adapting follow-up and therapeutic strategies for effective, personalized care. In large cohorts, male sex and younger age have been identified as baseline predictors of clinical conversion (5–8). Validated MRI prognostic biomarkers are infra-tentorial (IT) and spinal cord (SC) lesions on the index scan and the presence of gadolinium-enhanced (Gd+) lesions on index or follow-up scans (5–8). Recently, studies have shown that the presence of white matter lesions with a central vein sign (CVS) or a paramagnetic rim sign in RIS patients is associated with the presence of SC lesions, suggesting their potential for predicting RIS evolution (9, 10). Optic nerve demyelination identified by visual evoked potentials (VEP), thinning of the peripapillary retinal nerve fiber layer (pRNFL) and the common ganglion cell and inner plexiform layer (GCIP) at baseline and during follow-up on optical coherence tomography (OCT) has also been correlated with a higher risk of clinical conversion (8, 11).
Although RIS is not considered a distinct MS phenotype due to the absence of MS symptoms (12), it certainly shares common pathological features with CIS and early progressive MS, encompassing several biological characteristics and markers, forming a set of putative biological markers for the prognosis of RIS (13–15). Except for oligoclonal bands (OCBs) from cerebrospinal fluid (CSF), for 40 years now, have been considered as a biomarker for MS (12), biological markers for early MS remain largely unexplored in RIS. There is a need to identify biomarkers for early MS that may help refine the risk stratification for clinical MS and disability for early treatment. Exploring the pathophysiological pathways for MS involving risk factors for MS, immune system dysfunction, neuroaxonal injury and degeneration, and glial activation in RIS might improve our understanding of this complex disease (16). Additionally, biomarkers for RIS might reveal early pathological features of MS that were unidentified in the later stages and may constitute future therapeutic targets to slow the disease in its pre-symptomatic phase. In this review, we focus on published biological markers predictive of disease activity and progression at the earliest stages of MS, as depicted in Figure 1, and discuss their potential interest in RIS subjects.
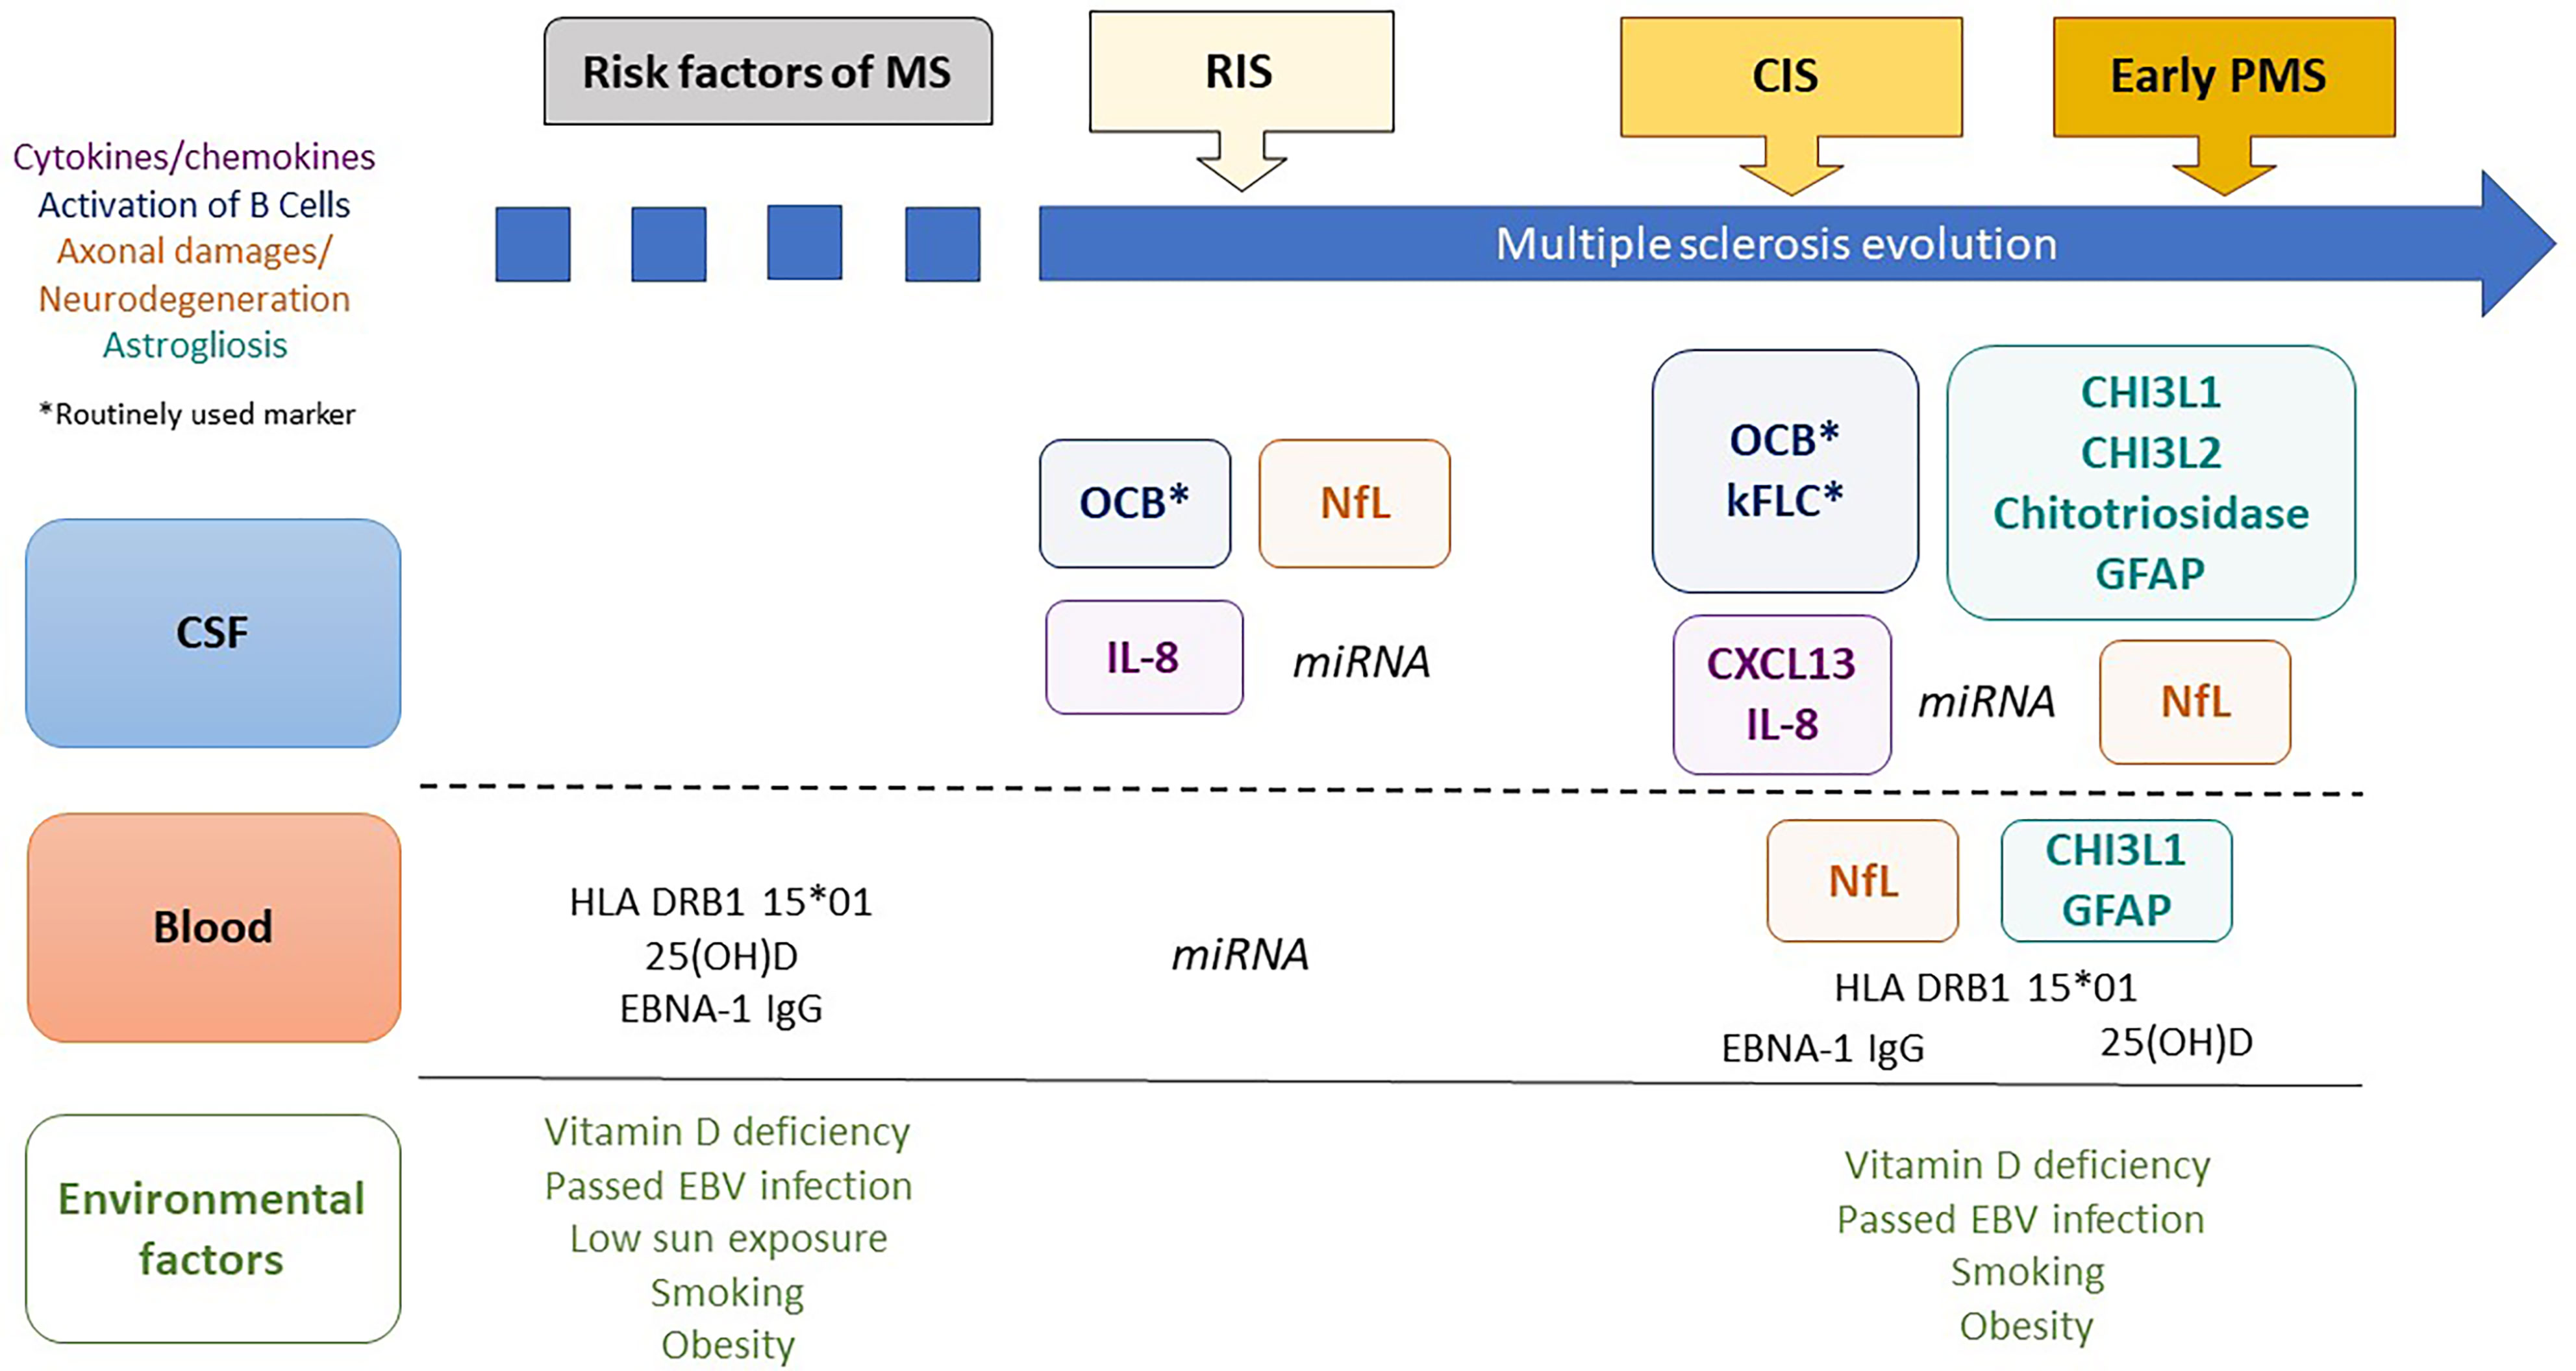
Figure 1 Biological markers predictive of clinical evolution in early multiple sclerosis. MS, multiple sclerosis; CSF, cerebrospinal fluid; RIS, radiologically isolated syndrome; CIS, clinically isolated syndrome; PMS, progressive MS; 25(OH)D, 25-hydroxy vitamin D; EBNA1-IgG, Epstein–Barr Virus-encoded nuclear antigen 1 specific immunoglobulin G; OCBs, oligoclonal bands; CHI3L1, chitinase 3-like protein 1; CHI3L2, chitinase 3-like protein 2; GFAP, glial fibrillary acidic protein; NFL, neurofilament-light chain; kFLC, kappa Free Light Chains; miRNA, microRNA.
In the relatives of MS patients, the risk of MS is much greater and correlates with the degree of kinship, origin, and sex, partly due to several genetic risk factors for MS, especially human leukocyte antigen (HLA) genes (16). Accordingly, there is a higher incidence of RIS in healthy relatives of patients with MS compared to people with healthy relatives (17). HLA-DRB1∗1501 is the main allele responsible for the genetic risk of MS in patients with European ancestry (18). It has also been associated with the risk of clinical events in CIS patients (19), but not in RIS patients (20). Although they are not routinely determined in MS and RIS, analysis of genetic variants associated with MS might still have a minor interest in clinical care.
Low sun exposure, poor vitamin D intake, and low 25-hydroxy vitamin D (25(OH)D) levels in serum, smoking, obesity, and a history of Epstein–Barr virus (EBV) infection are all environmental risk factors for MS (21). Immunoglobulins against EBV-encoded nuclear antigens (EBNA-1,2,3,4,6-IgG) are associated with the risk of developing MS (22). Most of these have also been linked to disease severity (25(OH)D, EBNA1-IgG, obesity, and smoking) (23, 24). Smoking, especially in healthy relatives of patients with MS, is associated with the presence of white matter (WM) signal abnormalities, whereas obesity is related to the presence of ≥9 WM signal abnormalities and fulfillment of the Swanton criteria (17). Lower 25(OH)D levels were associated with the risk of clinical events in a large cohort of CIS patients in univariate analysis, but EBNA1-IgG and smoking status as defined by cotinine levels (>14 ng/ml) were not (25). In a small RIS cohort, there was no difference in 25(OH)D levels in the serum of converters or non-converters (20). The predictive value of 25(OH)D deficiency should be investigated further, as the relatively minor clinical impact of vitamin D therapy in MS may be enhanced if started before disease onset (26, 27).
B cells are a key component of acute and chronic inflammatory activity in MS (28), with specific activated clones promoting cytokine production, antigen presentation, differentiation into plasma cells, T cell activation, and CNS invasion by immune cells (29). Inflammatory aggregates of B cells in the subarachnoid spaces were associated with a worse evolution of the disease (30). In analyzing different B-cell subsets (transitional, mature naive, marginal zone, switched memory B cells, IgM-only, IgD-only B cells, and plasmablasts), Guerrier et al. observed that double-negative IgD2/CD272 B cells increased in CIS patients (31). Analysis of the different subsets of T and B cells in RIS could bring new insights into the mechanisms of MS and serve as biomarkers.
Clonally expanded B and plasma cells in the CNS locally produce clonal IgGs, leading to CSF restricted oligoclonal bands (OCBs). The presence of OCBs was the first established biological marker for the diagnosis of MS (29) and predicts CIS conversion to clinically definite MS (29). Moreover, RRMS or CIS patients with intrathecal IgG synthesis had a higher risk of and shorter time-to-EDSS worsening over a 4-year follow-up period (32).
In RIS, the presence of OCBs is predictive of clinical conversion in adults (33) and children (34, 35) (Table 1), although the presence of OCBs is not correlated with the conversion time in adults (33). Conversely, the IgG index has not shown an independent prognostic value (8, 20). In large cohorts, abnormal CSF, defined as the presence of ≥2 OCBs and/or an IgG index >0.7, revealed a relevant predictive value for disease activity (5, 6, 8). It was also an independent predictor of clinical conversion at 10 years in a multivariate analysis compared to MRI and epidemiological data (6) but not in shorter term studies (5) (Table 1). Interestingly, OCBs have been accurately detected in tears and could be used as a minimally-invasive diagnostic tool for RIS if further confirmed in independent cohorts (38).
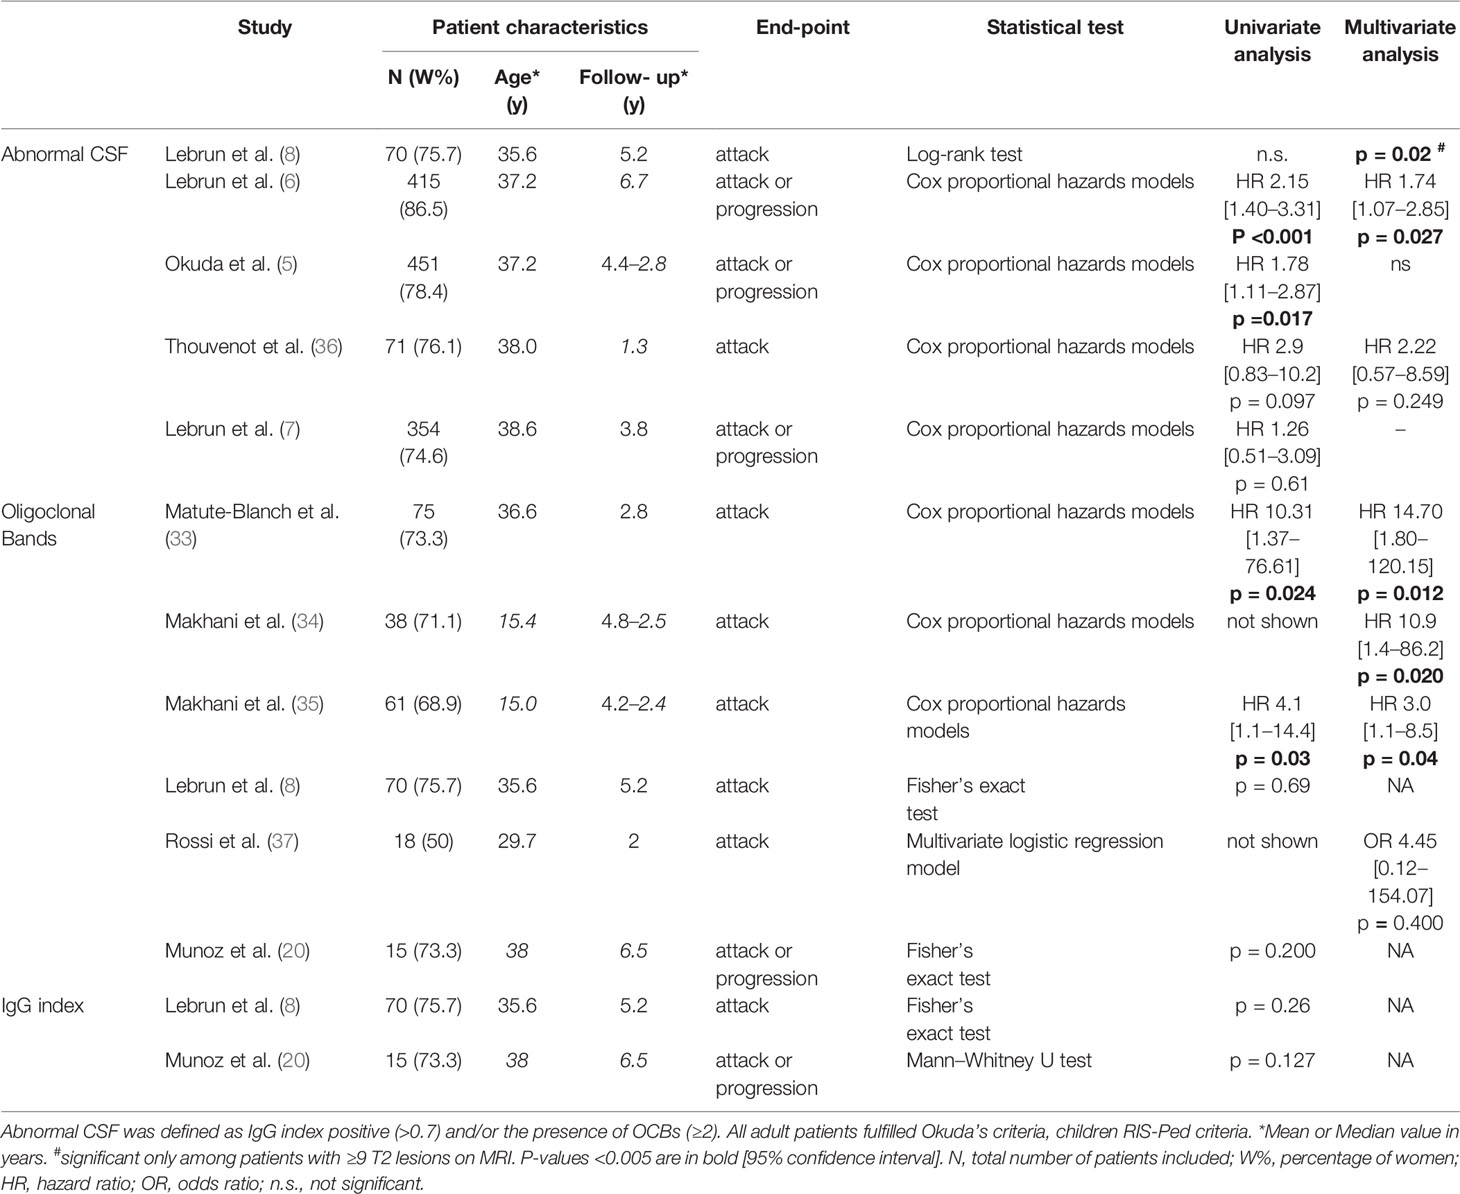
Table 1 Prognostic value of oligoclonal bands and/or IgG index in cerebrospinal fluid in patients with radiologically isolated syndrome.
Intrathecal synthesis of IgM has been associated with higher disease activity and shorter progression toward disability compared with abnormal CSF in RRMS patients and an active inflammatory disease phenotype in PPMS patients, but its prognostic value has not been studied for RIS (39, 40).
Kappa free light chains (kFLC) measured by nephelometry (41) reflect the quantitative intrathecal immunoglobulin synthesis with better accuracy than OCBs and IgG index for MS diagnosis (42) and for predicting clinical conversion in CIS (43), suggesting that it could represent a good candidate biomarker for RIS prognosis. However, studies evaluating small numbers of pooled RIS and CIS patients provide divergent results, and sound investigations of kFLC in RIS are needed (44, 45).
CXCL13 is a pro-inflammatory chemokine involved mainly in the migration of B cells, a critical stage in the pathology of MS (46). CXCL13 levels assessed in CSF by ELISA have been associated with the conversion of CIS to MS, a higher relapse rate and accumulation of disability (47–49). In only one study of a few RIS patients (n = 4), the CXCL13 index in RIS showed no difference from healthy controls or other stages of MS (50).
In the study by Guerrier, an imbalance in the cytokine production by circulating B cells, especially the alteration of IL-10 production with a high IL-6/IL-10-producing B-cell ratio, was associated with clinical conversion and its delay in a mixed cohort of CIS and RIS patients (31). Concentrations of B cell-related factors, notably CD27, FCRL2, CXCL10, and CXCL13, increase in MS CSF, especially in the early stages of the disease (51). Further studies must confirm B-cell phenotyping as a valuable prognostic biomarker.
A soluble form of CD27 (sCD27) is released by activated T cells and co-stimulates B and T cell activation and proliferation in autoimmune diseases like MS (52–54). High sCD27 levels in the CSF of CIS patients have been associated with a 5.5 times higher annual relapse rate (53) and the CSF sCD27/T-cell ratio increases in progressive MS (55). However, serum sCD27 levels do not discriminate between MS patients and healthy individuals (54).
Interleukin-8 (IL-8) is a pro-inflammatory chemokine produced by astrocytes and microglia in response to active intrathecal inflammation (56). It activates monocytes and neutrophils (37) and binds to oligodendrocytes and hypertrophic astrocytes in MS (57). Elevated CSF IL-8 levels are predictive of MS conversion following a CIS (37). In a small group of 18 RIS patients, a high level of CSF IL-8 was an independent predictor of clinical conversion (37), making IL-8 a candidate for RIS prognosis to be further validated.
Studies on experimental autoimmune encephalomyelitis, an animal model of MS, highlighted the role of Th17 lymphocytes, characterized by interleukin 17A (IL-17A) secretion, as strong inducers of pro-inflammatory responses (58). In a large cohort of 1,327 MS spectrum patients (RIS-CIS-RRMS), IL-17A levels were higher than in healthy controls in CSF but not in serum (59). Serum and CSF IL-17A did not discriminate between MS subtypes and did not demonstrate any prognostic value in 35 RIS patients (59).
Neurofilaments encompass a family of 5 intermediate filaments (heavy, medium, light chains (NfL), a-internexin, and peripherin) involved in axonal growth and stability as well as mitochondrial and synaptic functions in central and peripheral neurons (60). Neurofilaments can be released into the interstitial fluid from injured neurons, either due to the loss of neuronal membrane integrity or to active secretion related to axonal damage or neurodegeneration. According to other brain protein clearance, degraded neurofilaments may be absorbed from interstitial fluid into lymphatic vessels or directly absorbed by the blood vessels via perivascular drainage along the basement membranes of capillaries (61). Different levels of blood–brain barrier leakage induced by inflammation probably modify the kinetics of the neurofilament-light chain, circulating between the brain and blood compartments and its final blood concentration (60). NfL in CSF (cNfL) has been associated with clinical activity in CIS patients (62). cNFL can tell RIS apart from RRMS and PPMS, but not from early-stage CIS or healthy controls (63). Among 75 RIS patients, high cNfL measured by ELISA (Uman-Diagnostics; Umeå, Sweden) has been associated with an increased risk of conversion to CIS or to RRMS (CIS was based on the 2010 McDonald criteria in this study) (33).
Recently, ultrasensitive technologies such as the single molecule array (Simoa™) and the microfluidic platform (Simple Plex™ Ella) have been developed, allowing for the accurate determination of NfL levels in serum (sNfL) and highly correlated cNfL levels (64, 65). Using Simoa™, sNfL levels have been associated with disease activity, treatment response, and long-term outcomes at different stages of MS (66, 67) and identified as an independent predictor of relapse in newly-diagnosed MS and CIS patients (68, 69). The prognostic value of sNfL has not been investigated in RIS subjects. However, in a large epidemiological study among US military personnel, it was significantly higher among people who developed MS within 6 years (70). sNfL might provide a potentially less invasive option for assessing RIS prognosis when a lumbar puncture cannot be performed.
Glial Fibrillary Acidic Protein (GFAP) measurement has recently been implemented with NfL in multiplex kits (2-PLEX B and 4-PLEX A) by Quanterix®, making it possible to investigate astrocytic activation along with neuroaxonal damage in serum samples. GFAP is one of the major intermediate filament proteins expressed in astrocytes. CSF GFAP levels correlate with different subtypes of MS, reflecting different degrees of damage to astrocytes and may represent a useful marker of disease progression (71). CSF and serum GFAP (sGFAP) levels are correlated with MS patients (72). sGFAP has been associated with a higher Expanded Disability Status Scale (EDSS) score, older age, longer disease duration, progressive disease course, and MRI pathology (73, 74). The positive correlation between sGFAP and the clinical severity of the disease may highlight a particular role of astrocytes in progressive MS and mark the potential of sGFAP as a marker of disease severity (73). In RIS, the prognostic value of sGFAP as a minimally invasive biomarker of conversion to PPMS should be evaluated.
Chitinase 3-like protein 1 (CHI3L1, also known as YKL-40) is a protein of the chitin family mainly released in the CNS by activated astrocytes (75), microglia, and macrophages (76) in response to acute and chronic inflammation. It has been described as inhibiting oxidant-induced injury, increasing Th2 immunity, and regulating apoptosis (77). CSF CHI3L1 levels (cCHI3L1) measured by ELISA predict conversion from CIS to clinically definite MS and development of disability (75, 78). Indeed, cCHI3L1may reflect non-lymphocytic low-grade inflammation leading to active neurodegeneration (79), explaining its association with neurological disability quantified by EDSS in PPMS (80). However, all studies consistently show the absence of prognostic value of cCHI3L1 in RIS (20, 33, 36), suggesting that astrocytic and microglial activation is too scarce at the pre-symptomatic stage of MS. However, chitotriosidase and chitinase 3-like protein 2 (CHI3L2), two other members of the chitin family with similar properties, also need to be evaluated (75, 81, 82).
Although at a much lower concentration than in the CSF, ELISA made it possible to quantify serum CHI3L1 (sCHI3L1) levels, which are also associated with the risk of conversion to RRMS in CIS patients (75). Additionally, sCHI3L1 is higher in PMS patients than in RRMS patients and correlates with disability as determined by EDSS in PMS patients (83). However, the prognostic value of sCHI3L1 for the conversion to CIS or to PMS in RIS patients has not been assessed.
Altogether, NfL, likely associated with acute neuroaxonal injury, might have an interesting predictive value in the early stages of MS for disease activity, whereas GFAP and sCHI3L1 seem rather to be associated with glial activation, and could be of interest for predicting conversions to progressive MS. Their association in a CSF or serum “glia score” (GFAP*CHI3L1/NfL) better discriminates RRMS vs. PPMS than each biomarker alone, CSF being more accurate than serum (AUC 0.80 vs. 0.68, respectively) (83).
MicroRNA (miRNA) is an extremely stable class of non-coding single-stranded RNA with post-transcriptional regulatory functions (84) that can be detected in peripheral blood or CSF. Some serum and CSF miRNA profiles have been associated with MS (84, 85), while others predict clinical evolution in CIS patients (86). In 15 RIS patients, miRNA specific profiles in CSF (miR-144-3p, miR-448, and miR-653-3p) and in plasma (miR-142-3p, miR-338-3p, miR-363-3p, miR-374b-5p, miR-424-5p, and miR-483-3p) have been associated with the risk of conversion after 5 years of follow-up (20) and require further validation.
Mass cytometry (CyTOF) can help decipher immune cell phenotypes. In CSF from early MS patients, a B-cell population expressing CD49d, CD69, CD27, CXCR3, and HLA-DR could be a strong candidate for an MS-specific cell type (51). In the blood of CIS patients, an increased proportion of both a T-bet-expressing B cell subset and a CD206+ classical monocyte subset has been identified, especially in very active MS patients (disease activity after 6 months of disease modifying therapy or two or more relapses within one year with residual disability and radiological activity) (87).
These approaches provide new insights into the pathophysiology of MS and allow the identification of immunological biomarkers of early MS. Further studies will be required to determine the exact role of new candidate biomarkers and validate their diagnostic and prognostic value in RIS patients.
In the past few years, technical breakthroughs have made it possible to screen for many molecules as candidate biomarkers through unbiased -omic approaches. SOMAscan™ has identified specific protein profiles in the CSF extracellular vesicles of RRMS patients (88). The Olink inflammation panel has identified CCL11 and CCL20 as plasma biomarkers associated with MS progression and severity (89).
Metabolomics can identify the disturbed pathways involved in signaling and energy supply, providing potential signature profiles for MS diagnosis, stages, and assessment of drug responses, especially involving the alpha-linoleic acid pathway, nucleotide metabolism, amino acid metabolism, tricarboxylic acid cycle, D-ornithine, and D-arginine pathways (90).
The multi-omics-based algorithm based on protein profiling by SOMAScan™ and nuclear magnetic resonance metabolite measures has outperformed the current individual biomarkers for predicting the risk of conversion to clinically definite MS in CIS patients (91), although a reproducible MS-specific metabolome-based signature remains to be identified. Applied to RIS, these approaches could bring new insights into the molecular pathways promoting the disease and more accurately predict individual prognoses.
Prognostic values of several biological factors have been tested in RIS owing to their interest in different subtypes of MS, especially in CIS and early progressive MS.
First, the most studied biomarker in MS and validated MS diagnostic criteria, OCBs, remains the most relevant prognostic biomarker for RIS. Physiologically linked to OCBs and with greater accuracy in other phases of the disease, kFLC might be a good candidate prognostic biomarker for RIS.
Secondly, although unavailable in routine clinical care, data concerning NfL, IL-8, and miRNA profiles in CSF have encouraged us to explore their potential as biomarkers for RIS prognosis (Figure 1). Additionally, CHI3L1 and GFAP, reflecting glial activation, need to be explored in CSF as possible biomarkers for early PPMS and disability progression.
Finally, no peripheral biological markers have so far been identified as providing additional prognostic value, except for the miRNA profile. CHI3L1, GFAP, and NfL, accurately measurable in blood, might also constitute potential peripheral biomarkers of disease activity and progression.
Along with candidate biomarkers from current knowledge of early MS and -omics approaches, therapeutic response biomarkers may arise from ongoing randomized controlled trials (RCTs) in RIS subjects [TERIS, NCT03122652 (92) and ARISE, NCT02739542 (93)]. Leveraging samples and data from RIS patients in RCTs and large prospective cohorts with extended follow-up will be necessary to validate these candidate biomarkers for RIS, which predict greater disease severity. Moreover, identifying biological biomarkers obtained from blood samples—far less invasive than a lumbar puncture—should be a priority for future studies.
MR wrote the first draft of the manuscript, wrote sections of the manuscript, and contributed to manuscript revision, read, and approved the submitted version. MG contributed to manuscript revision, read, and approved the submitted version. ET contributed to the conception and design of the study, wrote sections of the manuscript, contributed to manuscript revision, read, and approved the submitted version. All authors listed have made a substantial, direct, and intellectual contribution to the work and approved it for publication.
ET received fees, travelling expenses and research grants from the following pharmaceutical companies: Actelion, Biogen, Genzyme, Merck Serono, Novartis, Roche, Teva pharma.
The remaining authors declare that the research was conducted in the absence of any commercial or financial relationships that could be construed as a potential conflict of interest.
All claims expressed in this article are solely those of the authors and do not necessarily represent those of their affiliated organizations, or those of the publisher, the editors and the reviewers. Any product that may be evaluated in this article, or claim that may be made by its manufacturer, is not guaranteed or endorsed by the publisher.
We are most grateful to Teresa Sawyers, Medical Writer at the B.E.S.P.I.M, Nîmes University Hospital, for revising and editing this article.
1. Lublin FD, Reingold SC, Cohen JA, Cutter GR, Sørensen PS, Thompson AJ, et al. Defining the Clinical Course of Multiple Sclerosis: The 2013 Revisions. Neurol (2014) 83(3):278–86. doi: 10.1212/WNL.0000000000000560
2. Makhani N, Tremlett H. The Multiple Sclerosis Prodrome. Nat Rev Neurol (2021) 17(8):515–21. doi: 10.1038/s41582-021-00519-3
3. Okuda DT, Mowry EM, Beheshtian A, Waubant E, Baranzini SE, Goodin DS, et al. Incidental MRI Anomalies Suggestive of Multiple Sclerosis: The Radiologically Isolated Syndrome. Neurol (2009) 72(9):800–5. doi: 10.1212/01.wnl.0000335764.14513.1a
4. Barkhof F, Filippi M, Miller DH, Scheltens P, Campi A, Polman CH, et al. Comparison of MRI Criteria at First Presentation to Predict Conversion to Clinically Definite Multiple Sclerosis. Brain J Neurol (1997) 120(Pt 11):2059–69. doi: 10.1093/brain/120.11.2059
5. Okuda DT, Siva A, Kantarci O, Inglese M, Katz I, Tutuncu M, et al. Radiologically Isolated Syndrome: 5-Year Risk for an Initial Clinical Event. PloS One (2014) 9(3):e90509. doi: 10.1371/journal.pone.0090509
6. Lebrun-Frenay C, Kantarci O, Siva A, Sormani MP, Pelletier D, Okuda DT, et al. Radiologically Isolated Syndrome: 10-Year Risk Estimate of a Clinical Event. Ann Neurol (2020) 88(2):407–17. doi: 10.1002/ana.25799
7. Lebrun-Frénay C, Rollot F, Mondot L, Zephir H, Louapre C, Le Page E, et al. Risk Factors and Time to Clinical Symptoms of Multiple Sclerosis Among Patients With Radiologically Isolated Syndrome. JAMA Netw Open (2021) 4(10):e2128271. doi: 10.1001/jamanetworkopen.2021.28271
8. Lebrun C, Bensa C, Debouverie M, Wiertlevski S, Brassat D, de Seze J, et al. Association Between Clinical Conversion to Multiple Sclerosis in Radiologically Isolated Syndrome and Magnetic Resonance Imaging, Cerebrospinal Fluid, and Visual Evoked Potential: Follow-Up of 70 Patients. Arch Neurol (2009) 66(7):841–6. doi: 10.1001/archneurol.2009.119
9. Suthiphosuwan S, Sati P, Guenette M, Montalban X, Reich DS, Bharatha A, et al. The Central Vein Sign in Radiologically Isolated Syndrome. AJNR Am J Neuroradiol (2019) 40(5):776–83. doi: 10.3174/ajnr.A6045
10. Suthiphosuwan S, Sati P, Absinta M, Guenette M, Reich DS, Bharatha A, et al. Paramagnetic Rim Sign in Radiologically Isolated Syndrome. JAMA Neurol (2020) 77(5):653–5. doi: 10.1001/jamaneurol.2020.0124
11. Aly L, Havla J, Lepennetier G, Andlauer TFM, Sie C, Strauß E-M, et al. Inner Retinal Layer Thinning in Radiologically Isolated Syndrome Predicts Conversion to Multiple Sclerosis. Eur J Neurol (2020) 27(11):2217–24. doi: 10.1111/ene.14416
12. Thompson AJ, Banwell BL, Barkhof F, Carroll WM, Coetzee T, Comi G, et al. Diagnosis of Multiple Sclerosis: 2017 Revisions of the McDonald Criteria. Lancet Neurol (2018) 17(2):162–73. doi: 10.1016/S1474-4422(17)30470-2
13. Thouvenot É. Update on Clinically Isolated Syndrome. Presse Medicale Paris Fr 1983 (2015) 44(4 Pt 2):e121–136. doi: 10.1016/j.lpm.2015.03.002
14. Deisenhammer F, Zetterberg H, Fitzner B, Zettl UK. The Cerebrospinal Fluid in Multiple Sclerosis. Front Immunol (2019) 10:726. doi: 10.3389/fimmu.2019.00726
15. Krajnc N, Bsteh G, Berger T. Clinical and Paraclinical Biomarkers and the Hitches to Assess Conversion to Secondary Progressive Multiple Sclerosis: A Systematic Review. Front Neurol (2021) 12:666868. doi: 10.3389/fneur.2021.666868
16. Ramagopalan SV, Dobson R, Meier UC, Giovannoni G. Multiple Sclerosis: Risk Factors, Prodromes, and Potential Causal Pathways. Lancet Neurol (2010) 9(7):727–39. doi: 10.1016/S1474-4422(10)70094-6
17. Gabelic T, Ramasamy DP, Weinstock-Guttman B, Hagemeier J, Kennedy C, Melia R, et al. Prevalence of Radiologically Isolated Syndrome and White Matter Signal Abnormalities in Healthy Relatives of Patients With Multiple Sclerosis. AJNR Am J Neuroradiol (2014) 35(1):106–12. doi: 10.3174/ajnr.A3653
18. Allen CM, Mowry E, Tintore M, Evangelou N. Prognostication and Contemporary Management of Clinically Isolated Syndrome. J Neurol Neurosurg Psychiatry (2020) 323087:jnnp–2020-323087. doi: 10.1136/jnnp-2020-323087
19. Katsavos S, Anagnostouli M. Biomarkers in Multiple Sclerosis: An Up-To-Date Overview. Mult Scler Int (2013) 2013:340508. doi: 10.1155/2013/340508
20. Muñoz-San Martín M, Torras S, Robles-Cedeño R, Buxó M, Gomez I, Matute-Blanch C, et al. Radiologically Isolated Syndrome: Targeting miRNAs as Prognostic Biomarkers. Epigenomics (2020) 12(23):2065–76. doi: 10.2217/epi-2020-0172
21. Thompson AJ, Baranzini SE, Geurts J, Hemmer B, Ciccarelli O. Multiple Sclerosis. Lancet Lond Engl (2018) 391(10130):1622–36. doi: 10.1016/S0140-6736(18)30481-1
22. Bjornevik K, Cortese M, Healy BC, Kuhle J, Mina MJ, Leng Y, et al. Longitudinal Analysis Reveals High Prevalence of Epstein-Barr Virus Associated With Multiple Sclerosis. Sci (2022) 375(6578):296–301. doi: 10.1126/science.abj8222
23. Grzegorski T, Losy J. What do We Currently Know About the Clinically Isolated Syndrome Suggestive of Multiple Sclerosis? An Update. Rev Neurosci (2020) 31(3):335–49. doi: 10.1515/revneuro-2019-0084
24. Miller DH, Chard DT, Ciccarelli O. Clinically Isolated Syndromes. Lancet Neurol (2012) 11(2):157–69. doi: 10.1016/S1474-4422(11)70274-5
25. Kuhle J, Disanto G, Dobson R, Adiutori R, Bianchi L, Topping J, et al. Conversion From Clinically Isolated Syndrome to Multiple Sclerosis: A Large Multicentre Study. Mult Scler Houndmills Basingstoke Engl (2015) 21(8):1013–24. doi: 10.1177/1352458514568827
26. Camu W, Lehert P, Pierrot-Deseilligny C, Hautecoeur P, Besserve A, Jean Deleglise A-S, et al. Cholecalciferol in Relapsing-Remitting MS: A Randomized Clinical Trial (CHOLINE). Neurol Neuroimmunol Neuroinflamm (2019) 6(5). doi: 10.1212/NXI.0000000000000597
27. Hupperts R, Smolders J, Vieth R, Holmøy T, Marhardt K, Schluep M, et al. Randomized Trial of Daily High-Dose Vitamin D3 in Patients With RRMS Receiving Subcutaneous Interferon β-1a. Neurol (2019) 93(20):e1906–16. doi: 10.1212/WNL.0000000000008445
28. Disanto G, Morahan JM, Barnett MH, Giovannoni G, Ramagopalan SV. The Evidence for a Role of B Cells in Multiple Sclerosis. Neurol (2012) 78(11):823–32. doi: 10.1212/WNL.0b013e318249f6f0
29. Dobson R, Ramagopalan S, Davis A, Giovannoni G. Cerebrospinal Fluid Oligoclonal Bands in Multiple Sclerosis and Clinically Isolated Syndromes: A Meta-Analysis of Prevalence, Prognosis and Effect of Latitude. J Neurol Neurosurg Psychiatry (2013) 84(8):909–14. doi: 10.1136/jnnp-2012-304695
30. Magliozzi R, Howell O, Vora A, Serafini B, Nicholas R, Puopolo M, et al. Meningeal B-Cell Follicles in Secondary Progressive Multiple Sclerosis Associate With Early Onset of Disease and Severe Cortical Pathology. Brain J Neurol (2007) 130(Pt 4):1089–104. doi: 10.1093/brain/awm038
31. Guerrier T, Labalette M, Launay D, Lee-Chang C, Outteryck O, Lefèvre G, et al. Proinflammatory B-Cell Profile in the Early Phases of MS Predicts an Active Disease. Neurol Neuroimmunol Neuroinflamm (2018) 5(2):e431. doi: 10.1212/NXI.0000000000000431
32. Gasperi C, Salmen A, Antony G, Bayas A, Heesen C, Kümpfel T, et al. Association of Intrathecal Immunoglobulin G Synthesis With Disability Worsening in Multiple Sclerosis. JAMA Neurol (2019) 76(7):841–9. doi: 10.1001/jamaneurol.2019.0905
33. Matute-Blanch C, Villar LM, Álvarez-Cermeño JC, Rejdak K, Evdoshenko E, Makshakov G, et al. Neurofilament Light Chain and Oligoclonal Bands are Prognostic Biomarkers in Radiologically Isolated Syndrome. Brain J Neurol (2018) 141(4):1085–93. doi: 10.1093/brain/awy021
34. Makhani N, Lebrun C, Siva A, Brassat D, Carra Dallière C, de Seze J, et al. Radiologically Isolated Syndrome in Children: Clinical and Radiologic Outcomes. Neurol Neuroimmunol Neuroinflamm (2017) 4(6):e395. doi: 10.1212/NXI.0000000000000395
35. Makhani N, Lebrun C, Siva A, Narula S, Wassmer E, Brassat D, et al. Oligoclonal Bands Increase the Specificity of MRI Criteria to Predict Multiple Sclerosis in Children With Radiologically Isolated Syndrome. Mult Scler J - Exp Transl Clin (2019) 5(1):2055217319836664. doi: 10.1177/2055217319836664
36. Thouvenot E. Multiple Sclerosis Biomarkers: Helping the Diagnosis? Rev Neurol (Paris) (2018) 174(6):364–71. doi: 10.1016/j.neurol.2018.04.002
37. Rossi S, Motta C, Studer V, Macchiarulo G, Germani G, Finardi A, et al. Subclinical Central Inflammation Is Risk for RIS and CIS Conversion to MS. Mult Scler Houndmills Basingstoke Engl (2015) 21(11):1443–52. doi: 10.1177/1352458514564482
38. Lebrun C, Forzy G, Collongues N, Cohen M, de Seze J, Hautecoeur P, et al. Tear Analysis as a Tool to Detect Oligoclonal Bands in Radiologically Isolated Syndrome. Rev Neurol (Paris) (2015) 171(4):390–3. doi: 10.1016/j.neurol.2014.11.007
39. Oechtering J, Schaedelin S, Benkert P, Müller S, Achtnichts L, Vehoff J, et al. Intrathecal Immunoglobulin M Synthesis is an Independent Biomarker for Higher Disease Activity and Severity in Multiple Sclerosis. Ann Neurol (2021) 90(3):477–89. doi: 10.1002/ana.26137
40. Villar LM, Casanova B, Ouamara N, Comabella M, Jalili F, Leppert D, et al. Immunoglobulin M Oligoclonal Bands: Biomarker of Targetable Inflammation in Primary Progressive Multiple Sclerosis. Ann Neurol (2014) 76(2):231–40. doi: 10.1002/ana.24190
41. Desplat-Jégo S, Feuillet L, Pelletier J, Bernard D, Chérif AA, Boucraut J. Quantification of Immunoglobulin Free Light Chains in Cerebrospinal Fluid by Nephelometry. J Clin Immunol (2005) 25(4):338–45. doi: 10.1007/s10875-005-5371-9
42. Presslauer S, Milosavljevic D, Huebl W, Parigger S, Schneider-Koch G, Bruecke T. Kappa Free Light Chains: Diagnostic and Prognostic Relevance in MS and CIS. PloS One (2014) 9(2):e89945. doi: 10.1371/journal.pone.0089945
43. Senel M, Tumani H, Lauda F, Presslauer S, Mojib-Yezdani R, Otto M, et al. Cerebrospinal Fluid Immunoglobulin Kappa Light Chain in Clinically Isolated Syndrome and Multiple Sclerosis. PloS One (2014) 9(4):e88680. doi: 10.1371/journal.pone.0088680
44. Vecchio D, Bellomo G, Serino R, Virgilio E, Lamonaca M, Dianzani U, et al. Intrathecal Kappa Free Light Chains as Markers for Multiple Sclerosis. Sci Rep (2020) 10(1):20329. doi: 10.1038/s41598-020-77029-7
45. Rosenstein I, Rasch S, Axelsson M, Novakova L, Blennow K, Zetterberg H, et al. Kappa Free Light Chain Index as a Diagnostic Biomarker in Multiple Sclerosis: A Real-World Investigation. J Neurochem (2021) 159(3):618–28. doi: 10.1111/jnc.15500
46. Kalinowska-Łyszczarz A, Szczuciński A, Pawlak MA, Losy J. Clinical Study on CXCL13, CCL17, CCL20 and IL-17 as Immune Cell Migration Navigators in Relapsing-Remitting Multiple Sclerosis Patients. J Neurol Sci (2011) 300(1–2):81–5. doi: 10.1016/j.jns.2010.09.026
47. Brettschneider J, Czerwoniak A, Senel M, Fang L, Kassubek J, Pinkhardt E, et al. The Chemokine CXCL13 Is a Prognostic Marker in Clinically Isolated Syndrome (CIS). PloS One (2010) 5(8):e11986. doi: 10.1371/journal.pone.0011986
48. Khademi M, Kockum I, Andersson ML, Iacobaeus E, Brundin L, Sellebjerg F, et al. Cerebrospinal Fluid CXCL13 in Multiple Sclerosis: A Suggestive Prognostic Marker for the Disease Course. Mult Scler Houndmills Basingstoke Engl (2011) 17(3):335–43. doi: 10.1177/1352458510389102
49. Sellebjerg F, Börnsen L, Khademi M, Krakauer M, Olsson T, Frederiksen JL, et al. Increased Cerebrospinal Fluid Concentrations of the Chemokine CXCL13 in Active MS. Neurol (2009) 73(23):2003–10. doi: 10.1212/WNL.0b013e3181c5b457
50. DiSano KD, Gilli F, Pachner AR. Intrathecally Produced CXCL13: A Predictive Biomarker in Multiple Sclerosis. Mult Scler J - Exp Transl Clin (2020) 6(4):2055217320981396. doi: 10.1177/2055217320981396
51. Johansson D, Rauld C, Roux J, Regairaz C, Galli E, Callegari I, et al. Mass Cytometry of CSF Identifies an MS-Associated B-Cell Population. Neurol Neuroimmunol Neuroinflamm (2021) 8(2):e943. doi: 10.1212/NXI.0000000000000943
52. Han BK, Olsen NJ, Bottaro A. The CD27-CD70 Pathway and Pathogenesis of Autoimmune Disease. Semin Arthritis Rheumatol (2016) 45(4):496–501. doi: 10.1016/j.semarthrit.2015.08.001
53. van der Vuurst de Vries RM, Mescheriakova JY, Runia TF, Jafari N, Siepman TAM, Hintzen RQ. Soluble CD27 Levels in Cerebrospinal Fluid as a Prognostic Biomarker in Clinically Isolated Syndrome. JAMA Neurol (2017) 74(3):286–92. doi: 10.1001/jamaneurol.2016.4997
54. Hintzen RQ, van Lier RA, Kuijpers KC, Baars PA, Schaasberg W, Lucas CJ, et al. Elevated Levels of a Soluble Form of the T Cell Activation Antigen CD27 in Cerebrospinal Fluid of Multiple Sclerosis Patients. J Neuroimmunol (1991) 35(1–3):211–7. doi: 10.1016/0165-5728(91)90175-7
55. Komori M, Blake A, Greenwood M, Lin YC, Kosa P, Ghazali D, et al. Cerebrospinal Fluid Markers Reveal Intrathecal Inflammation in Progressive Multiple Sclerosis. Ann Neurol (2015) 78(1):3–20. doi: 10.1002/ana.24408
56. Bielekova B, Komori M, Xu Q, Reich DS, Wu T. Cerebrospinal Fluid IL-12p40, CXCL13 and IL-8 as a Combinatorial Biomarker of Active Intrathecal Inflammation. PloS One (2012) 7(11):e48370. doi: 10.1371/journal.pone.0048370
57. Müller-Ladner U, Jones JL, Wetsel RA, Gay S, Raine CS, Barnum SR. Enhanced Expression of Chemotactic Receptors in Multiple Sclerosis Lesions. J Neurol Sci (1996) 144(1–2):135–41. doi: 10.1016/S0022-510X(96)00217-1
58. Rostami A, Ciric B. Role of Th17 Cells in the Pathogenesis of CNS Inflammatory Demyelination. J Neurol Sci (2013) 333(1–2):76–87. doi: 10.1016/j.jns.2013.03.002
59. Lebrun C, Cohen M, Pignolet B, Seitz-Polski B, Bucciarelli F, Benzaken S, et al. Interleukin 17 Alone Is Not a Discriminant Biomarker in Early Demyelinating Spectrum Disorders. J Neurol Sci (2016) 368:334–6. doi: 10.1016/j.jns.2016.07.052
60. Gafson AR, Barthélemy NR, Bomont P, Carare RO, Durham HD, Julien J-P, et al. Neurofilaments: Neurobiological Foundations for Biomarker Applications. Brain J Neurol (2020) 143(7):1975–98. doi: 10.1093/brain/awaa098
61. Carare RO, Bernardes-Silva M, Newman TA, Page AM, Nicoll JAR, Perry VH, et al. Solutes, But Not Cells, Drain From the Brain Parenchyma Along Basement Membranes of Capillaries and Arteries: Significance for Cerebral Amyloid Angiopathy and Neuroimmunology. Neuropathol Appl Neurobiol (2008) 34(2):131–44. doi: 10.1111/j.1365-2990.2007.00926.x
62. Håkansson I, Tisell A, Cassel P, Blennow K, Zetterberg H, Lundberg P, et al. Neurofilament Light Chain in Cerebrospinal Fluid and Prediction of Disease Activity in Clinically Isolated Syndrome and Relapsing-Remitting Multiple Sclerosis. Eur J Neurol (2017) 24(5):703–12. doi: 10.1111/ene.13274
63. Pawlitzki M, Sweeney-Reed CM, Bittner D, Lux A, Vielhaber S, Schreiber S, et al. CSF-Progranulin and Neurofilament Light Chain Levels in Patients With Radiologically Isolated Syndrome-Sign of Inflammation. Front Neurol (2018) 9:1075. doi: 10.3389/fneur.2018.01075
64. Kuhle J, Barro C, Andreasson U, Derfuss T, Lindberg R, Sandelius Å, et al. Comparison of Three Analytical Platforms for Quantification of the Neurofilament Light Chain in Blood Samples: ELISA, Electrochemiluminescence Immunoassay and Simoa. Clin Chem Lab Med (2016) 54(10):1655–61. doi: 10.1515/cclm-2015-1195
65. Gauthier A, Viel S, Perret M, Brocard G, Casey R, Lombard C, et al. Comparison of SimoaTM and EllaTM to Assess Serum Neurofilament-Light Chain in Multiple Sclerosis. Ann Clin Transl Neurol (2021) 8(5):1141–50. doi: 10.1002/acn3.51355
66. Kuhle J, Kropshofer H, Haering DA, Kundu U, Meinert R, Barro C, et al. Blood Neurofilament Light Chain as a Biomarker of MS Disease Activity and Treatment Response. Neurol (2019) 92(10):e1007–15. doi: 10.1212/WNL.0000000000007032
67. Kuhle J, Plavina T, Barro C, Disanto G, Sangurdekar D, Singh CM, et al. Neurofilament Light Levels are Associated With Long-Term Outcomes in Multiple Sclerosis. Mult Scler Houndmills Basingstoke Engl (2020) 26(13):1691–9. doi: 10.1177/1352458519885613
68. Sellebjerg F, Royen L, Soelberg Sørensen P, Oturai AB, Jensen PEH. Prognostic Value of Cerebrospinal Fluid Neurofilament Light Chain and Chitinase-3-Like-1 in Newly Diagnosed Patients With Multiple Sclerosis. Mult Scler Houndmills Basingstoke Engl (2019) 25(11):1444–51. doi: 10.1177/1352458518794308
69. Dalla Costa G, Martinelli V, Sangalli F, Moiola L, Colombo B, Radaelli M, et al. Prognostic Value of Serum Neurofilaments in Patients With Clinically Isolated Syndromes. Neurol (2019) 92(7):e733–41. doi: 10.1212/WNL.0000000000006902
70. Bjornevik K, Munger KL, Cortese M, Barro C, Healy BC, Niebuhr DW, et al. Serum Neurofilament Light Chain Levels in Patients With Presymptomatic Multiple Sclerosis. JAMA Neurol (2020) 77(1):58–64. doi: 10.1001/jamaneurol.2019.3238
71. Sun M, Liu N, Xie Q, Li X, Sun J, Wang H, et al. A Candidate Biomarker of Glial Fibrillary Acidic Protein in CSF and Blood in Differentiating Multiple Sclerosis and its Subtypes: A Systematic Review and Meta-Analysis. Mult Scler Relat Disord (2021) 51:102870. doi: 10.1016/j.msard.2021.102870
72. Abdelhak A, Hottenrott T, Morenas-Rodríguez E, Suárez-Calvet M, Zettl UK, Haass C, et al. Glial Activation Markers in CSF and Serum From Patients With Primary Progressive Multiple Sclerosis: Potential of Serum GFAP as Disease Severity Marker? Front Neurol (2019) 10:280. doi: 10.3389/fneur.2019.00280
73. Högel H, Rissanen E, Barro C, Matilainen M, Nylund M, Kuhle J, et al. Serum Glial Fibrillary Acidic Protein Correlates With Multiple Sclerosis Disease Severity. Mult Scler Houndmills Basingstoke Engl (2020) 26(2):210–9. doi: 10.1177/1352458518819380
74. Ayrignac X, Le Bars E, Duflos C, Hirtz C, Maleska Maceski A, Carra-Dallière C, et al. Serum GFAP in Multiple Sclerosis: Correlation With Disease Type and MRI Markers of Disease Severity. Sci Rep (2020) 10(1):10923. doi: 10.1038/s41598-020-67934-2
75. Hinsinger G, Galéotti N, Nabholz N, Urbach S, Rigau V, Demattei C, et al. Chitinase 3-Like Proteins as Diagnostic and Prognostic Biomarkers of Multiple Sclerosis. Mult Scler Houndmills Basingstoke Engl (2015) 21(10):1251–61. doi: 10.1177/1352458514561906
76. Bonneh-Barkay D, Bissel SJ, Kofler J, Starkey A, Wang G, Wiley CA. Astrocyte and Macrophage Regulation of YKL-40 Expression and Cellular Response in Neuroinflammation. Brain Pathol Zurich Switz (2012) 22(4):530–46. doi: 10.1111/j.1750-3639.2011.00550.x
77. Lee CG, Da Silva CA, Dela Cruz CS, Ahangari F, Ma B, Kang M-J, et al. Role of Chitin and Chitinase/Chitinase-Like Proteins in Inflammation, Tissue Remodeling, and Injury. Annu Rev Physiol (2011) 73:479–501. doi: 10.1146/annurev-physiol-012110-142250
78. Cantó E, Tintoré M, Villar LM, Costa C, Nurtdinov R, Álvarez-Cermeño JC, et al. Chitinase 3-Like 1: Prognostic Biomarker in Clinically Isolated Syndromes. Brain J Neurol (2015) 138(Pt 4):918–31. doi: 10.1093/brain/awv017
79. Cubas-Núñez L, Gil-Perotín S, Castillo-Villalba J, López V, Solís Tarazona L, Gasqué-Rubio R, et al. Potential Role of CHI3L1+ Astrocytes in Progression in MS. Neurol Neuroimmunol Neuroinflamm (2021) 8(3):e972. doi: 10.1212/NXI.0000000000000972
80. Pérez-Miralles F, Prefasi D, García-Merino A, Gascón-Giménez F, Medrano N, Castillo-Villalba J, et al. CSF Chitinase 3-Like-1 Association With Disability of Primary Progressive MS. Neurol Neuroimmunol Neuroinflammation (2020) 7(5):e815. doi: 10.1212/NXI.0000000000000815
81. Møllgaard M, Degn M, Sellebjerg F, Frederiksen JL, Modvig S. Cerebrospinal Fluid Chitinase-3-Like 2 and Chitotriosidase Are Potential Prognostic Biomarkers in Early Multiple Sclerosis. Eur J Neurol (2016) 23(5):898–905. doi: 10.1111/ene.12960
82. Comabella M, Sastre-Garriga J, Borras E, Villar LM, Saiz A, Martínez-Yélamos S, et al. CSF Chitinase 3-Like 2 Is Associated With Long-Term Disability Progression in Patients With Progressive Multiple Sclerosis. Neurol Neuroimmunol Neuroinflammation (2021) 8(6):e1082. doi: 10.1212/NXI.0000000000001082
83. Huss A, Otto M, Senel M, Ludolph AC, Abdelhak A, Tumani H. A Score Based on NfL and Glial Markers May Differentiate Between Relapsing-Remitting and Progressive MS Course. Front Neurol (2020) 11:608. doi: 10.3389/fneur.2020.00608
84. Zailaie SA, Siddiqui JJ, Al Saadi RM, Anbari DM, S Alomari A, Cupler EJ. Serum Based miRNA as a Diagnostic Biomarker for Multiple Sclerosis: A Systematic Review and Meta-Analysis. Immunol Invest (2021) 4:1–16. doi: 10.1080/08820139.2021.1887888
85. Ebrahimkhani S, Vafaee F, Young PE, Hur SSJ, Hawke S, Devenney E, et al. Exosomal microRNA Signatures in Multiple Sclerosis Reflect Disease Status. Sci Rep (2017) 7(1):14293. doi: 10.1038/s41598-017-14301-3
86. Ahlbrecht J, Martino F, Pul R, Skripuletz T, Sühs K-W, Schauerte C, et al. Deregulation of microRNA-181c in Cerebrospinal Fluid of Patients With Clinically Isolated Syndrome is Associated With Early Conversion to Relapsing-Remitting Multiple Sclerosis. Mult Scler Houndmills Basingstoke Engl (2016) 22(9):1202–14. doi: 10.1177/1352458515613641
87. Couloume L, Ferrant J, Le Gallou S, Mandon M, Jean R, Bescher N, et al. Mass Cytometry Identifies Expansion of T-Bet+ B Cells and CD206+ Monocytes in Early Multiple Sclerosis. Front Immunol (2021) 12:653577. doi: 10.3389/fimmu.2021.653577
88. Welton JL, Loveless S, Stone T, von Ruhland C, Robertson NP, Clayton A. Cerebrospinal Fluid Extracellular Vesicle Enrichment for Protein Biomarker Discovery in Neurological Disease; Multiple Sclerosis. J Extracell Vesicles (2017) 6(1):1369805. doi: 10.1080/20013078.2017.1369805
89. Huang J, Khademi M, Fugger L, Lindhe Ö, Novakova L, Axelsson M, et al. Inflammation-Related Plasma and CSF Biomarkers for Multiple Sclerosis. Proc Natl Acad Sci U S A (2020) 117(23):12952–60. doi: 10.1073/pnas.1912839117
90. Zahoor I, Rui B, Khan J, Datta I, Giri S. An Emerging Potential of Metabolomics in Multiple Sclerosis: A Comprehensive Overview. Cell Mol Life Sci CMLS (2021) 78(7):3181–203. doi: 10.1007/s00018-020-03733-2
91. Probert F, Yeo T, Zhou Y, Sealey M, Arora S, Palace J, et al. Integrative Biochemical, Proteomics and Metabolomics Cerebrospinal Fluid Biomarkers Predict Clinical Conversion to Multiple Sclerosis. Brain Commun (2021) 3(2):fcab084. doi: 10.1093/braincomms/fcab084
92. Centre Hospitalier Universitaire de Nice. Multi-Center, Randomized, Double-Blinded Study of Teriflunomide® in Radiologically Isolated Syndrome (RIS) The TERIS Study (2020). Available at: https://clinicaltrials.gov/ct2/show/NCT03122652.
Keywords: multiple sclerosis (MS), radiologically isolated syndrome (RIS), prognosis, biomarkers, personalized medicine, Kappa free-light chain index (kFLC index), glial fibrillary acidic protein (GFAP), neurofilament-light chain (NfL)
Citation: Rival M, Galoppin M and Thouvenot E (2022) Biological Markers in Early Multiple Sclerosis: the Paved Way for Radiologically Isolated Syndrome. Front. Immunol. 13:866092. doi: 10.3389/fimmu.2022.866092
Received: 30 January 2022; Accepted: 28 March 2022;
Published: 27 April 2022.
Edited by:
Darin T. Okuda, University of Texas Southwestern Medical Center, United StatesReviewed by:
Anke Salmen, University Hospital Bern, SwitzerlandCopyright © 2022 Rival, Galoppin and Thouvenot. This is an open-access article distributed under the terms of the Creative Commons Attribution License (CC BY). The use, distribution or reproduction in other forums is permitted, provided the original author(s) and the copyright owner(s) are credited and that the original publication in this journal is cited, in accordance with accepted academic practice. No use, distribution or reproduction is permitted which does not comply with these terms.
*Correspondence: Eric Thouvenot, ZXJpYy50aG91dmVub3RAY2h1LW5pbWVzLmZy
Disclaimer: All claims expressed in this article are solely those of the authors and do not necessarily represent those of their affiliated organizations, or those of the publisher, the editors and the reviewers. Any product that may be evaluated in this article or claim that may be made by its manufacturer is not guaranteed or endorsed by the publisher.
Research integrity at Frontiers
Learn more about the work of our research integrity team to safeguard the quality of each article we publish.