 Michael Levraut1,2*
 Cassandre Landes1
 Lydiane Mondot1,3,4
 Mikael Cohen1,3
 Saskia Bresch3
 Vesna Brglez5,6
 Barbara Seitz-Polski5,6
 Christine Lebrun-Frenay1,3
- 1URRIS-UR2CA, Centre Hospitalier Universitaire de Nice, Nice, France
- 2Département de Médecine Interne, Centre Hospitalier Universitaire de Nice, Nice, France
- 3Département de Neurologie, CRC SEP, Centre Hospitalier Universitaire de Nice, Nice, France
- 4Département de Radiologie, Centre Hospitalier Universitaire de Nice, Nice, France
- 5ImmunoPredict-UR2CA, Centre Hospitalier Universitaire de Nice, Nice, France
- 6Laboratoire d’Immunologie, Centre Hospitalier Universitaire de Nice, Nice, France
Introduction: Many patients are referred to multiple sclerosis (MS) tertiary centers to manage brain white matter hyperintensities (WMH). Multiple diagnoses can match in such situations, and we lack proper tools to diagnose complex cases.
Objective: This study aimed to prospectively analyze and correlate with the final diagnosis, cerebrospinal fluid (CSF) interleukin (IL)-1β, soluble IL-2 receptor (CD25), IL-6, IL-10, and kappa free light chains (KFLC) concentrations in patients presenting with brain WMH.
Methods: All patients over 18 years addressed to our MS tertiary center for the diagnostic workup of brain WMH were included from June 1, 2020, to June 1, 2021. Patients were separated into three groups—MS and related disorder (MSARD), other inflammatory neurological disorder (OIND), and non-inflammatory neurological disorder (NIND) groups—according to clinical presentation, MRI characteristics, and biological workup.
Results: A total of 176 patients (129 women, mean age 45.8 ± 14.7 years) were included. The diagnosis was MSARD (n = 88), OIND (n = 35), and NIND (n = 53). Median CSF KFLC index and KFLC intrathecal fraction (IF) were higher in MSARD than in the OIND and NIND groups; p < 0.001 for all comparisons. CSF CD25 and IL-6 concentrations were higher in the OIND group than in both the MSARD and NIND groups; p < 0.001 for all comparisons. KFLC index could rule in MSARD when compared to NIND (sensitivity, 0.76; specificity, 0.91) or OIND (sensitivity, 0.73; specificity, 0.76). These results were similar to those with oligoclonal bands (sensitivity, 0.59; specificity, 0.98 compared to NIND; sensitivity, 0.59; specificity, 0.88 compared to OIND). In contrast, elevated CSF CD25 and IL-6 could rule out MSARD when compared to OIND (sensitivity, 0.58 and 0.88; specificity, 0.95 and 0.74, respectively).
Discussion: Our results show that, as OCBs, KFLC biomarkers are helpful tools to rule in MSARD, whereas elevated CSF CD25 and IL-6 rule out MSARD. Interestingly, CSF IL-6 concentration could help identify neuromyelitis optica spectrum disorder, myelin oligodendrocyte glycoprotein antibody-associated disease, and central nervous system (CNS) vasculitis. These results need to be confirmed within more extensive and multicentric studies. Still, they sustain that KFLC, CSF CD25, and CSF IL-6 could be reliable biomarkers in brain WMH diagnostic workup for differentiating MSARD from other brain inflammatory MS mimickers.
Introduction
Multiple sclerosis (MS) is a chronic inflammatory and demyelinating central nervous system (CNS) disease. It presents as relapsing clinical demyelinating events or a progressive worsening neurological deficit disease with suggestive white matter hyperintensities on the brain or spinal cord MRI T2-weighted images. Clinical research has focused on diagnosing MS as early as possible to prevent relapse and disability by initiating disease-modifying treatments. In this condition, many patients may have an early demyelinating disease diagnosis: i) after a single demyelinating event (1, 2) or ii) before any clinical event (3, 4). In early-MS patients, biology may have an essential role in identifying an intrathecal B-cell activation by the detection of cerebrospinal fluid (CSF) oligoclonal bands (OCBs) on isoelectric focusing, which can replace dissemination in time in patients presenting with a typical first demyelinating event (1, 2). Unfortunately, misdiagnosis may occur in such situations (5, 6), while many other neurological diseases may mimic early MS (6, 7).
The immunopathology of MS is complex and implicates a large number of cells. CD4+ Th1 and Th17 cells are thought to promote while CD4+ Th2 and Treg cells are thought to downregulate inflammation in MS (8–10). B cells are also crucial effector cells in MS (11). In contrast, i) B cell-depletive therapies are effective in relapsing MS (12, 13), and ii) intrathecal immunoglobulin synthesis is part of the MS diagnostic criteria (1). However, we lack a reliable biomarker that could help separate MS from other inflammatory-mimicking diseases to avoid misdiagnosis.
During the last decade, many biomarkers have been explored. Kappa free light chains (KFLC), low-weighted immunoglobulin compounds, are a reliable biomarker in MS (14–16). This activated B-cell biomarker has the advantage, compared to OCBs, to quantify intrathecal B-cell activity by an automatized procedure. However, prospective data on the effectiveness of KFLC biomarkers are poor (14). Cytokines are low-molecular-weight proteins secreted by many cells, implicated in many immune functions, such as chemotaxis, activation, or repression of the immune cells. In autoimmune CNS diseases, cytokine measurement may reflect a unique immunopathological profile and help etiological diagnosis. It has been shown that CSF interleukin (IL)-6 is increased in neuromyelitis optica spectrum disorders (NMOSD) or in myelin oligodendrocyte glycoprotein antibody-associated disease (MOGAD) compared to MS (17). Soluble IL-2 receptor (s-IL2R), also called CD25, is increased in many CNS granulomatosis, such as neurosarcoidosis or in infectious meningitis (18), and CSF IL-10 is now part of the diagnostic workup in CNS lymphoma (19). However, our knowledge about cytokine expression in such diseases comes from retrospective cohorts. Based on these data, our MS tertiary center included OCBs, KFLC, and CSF IL-1β, sIL-2R, IL-6, and IL-10 concentration measurement in the routine diagnostic workup of patients presenting with white matter hyperintensities suggestive of MS.
Therefore, in this study, we prospectively evaluated the expression of KFLC biomarkers and CSF concentration of IL-1β, sIL-2R (CD25), IL-6, and IL-10, and we correlated each biomarker measurement with diagnosis in patients referred to our MS center for suspected MS.
Methods
Patients
All patients referred to our MS tertiary center in the University Hospital of Nice, France, were eligible for the study from June 1, 2020, to June 1, 2021. Patients were included if they i) were at least 18 years old and ii) had brain white matter hyperintensities on MRI T2-weighted images. According to routine care, all patients underwent the same diagnostic workup with a blood and CSF analysis and 3-T brain MRI.
At the end of the diagnostic workup, patients were separated into three groups according to their diagnosis. First, patients were divided as having an inflammatory or a non-inflammatory CNS disorder according to clinical presentation, MRI (topography, number, size, and gadolinium enhancement of the lesions), and biology (identification of blood or CSF red flags for MS). All non-inflammatory diagnoses were pooled together as a control group named non-inflammatory neurological disorder (NIND). Patients identified as having an inflammatory CNS disorder were separated into two groups. Patients who fulfilled the 2017 McDonald criteria for MS and clinically isolated syndrome (CIS) (1), or the 2009 criteria for radiologically isolated syndrome (RIS) (3, 20), were pooled together into the MS and related disorder (MSARD) group. The other inflammatory patients were pooled together as having another inflammatory disease: the other inflammatory neurological disease (OIND) group.
A non-opposition to research was obtained for each patient according to French law. Our institutional review board approved the study design, and the study was registered on Clinical Trial (NCT05056740) as the CyBIRD (Cytokine and Brain Inflammatory Related Disorders) Study.
Kappa Free Light Chains and Cytokine Measurement
Blood and CSF were collected the same day for all patients. Fluids were sent within 2 h after collection into the Immunology Laboratory of Nice’s University Hospital.
Detection of OCBs was performed by isoelectric focusing and subsequent immunoglobulin using IgG-specific antibody staining. OCB patterns were evaluated by experienced biologists and classified as negative or positive. A cutoff ≥2 CSF-restricted bands was used to define OCB positivity. CSF KFLC was measured on fresh samples using the turbidimetric analyzer Optilite® (The Binding Site, Birmingham, UK) with the serum-free light chain immunoassay Freelite® (The Binding Site, Birmingham, UK). Serum and CSF albumin were also measured with the same turbidimetric analyzer and permitted to calculate KFLC index and KFLC intrathecal fraction (KFLC IF) as follows:
(i) KFLC index = KFLC quotient/albumin quotient with:
(ii) KLC IF was determined with Reiber’s formula (21):
The turbidimetric analyzer’s lower detection limit (LDL) for KFLC was 0.33 mg/L. For patients with CSF KFLC concentration lower than the LDL, an empirical value of KFLC = LDL/2 = 0.16 mg/L was assigned.
For cytokine measurement, CSF was directly centrifuged and kept frozen at −80°C until there were enough stored samples to perform analysis (16-well cartridges). CSF was thawed once, just before cytokine analysis. CSF IL-1β, sIL-2R (or CD25), IL-6, and IL-10 concentration were determined using a mixture of 25 μl of CSF and buffer, in a custom-designed cartridge Ella (ProteinSimple, Santa Clara, CA, USA) for the detection of IL-1β, sIL-2R, IL-6, and IL-10, according to the manufacturer’s instructions. The LDL of ELISA kits for cytokine measurement was 0.32 pg/ml for IL-1β, 6.56 pg/ml for sIL-2R, 0.5 pg/ml for IL-6, and 1.16 pg/ml for IL-10. As for CSF KFLC measurement, when the CSF cytokine concentration was under the LDL, an empirical CSF cytokine value of LDL/2 was assigned.
Statistical Analysis
Statistical analysis was performed using the online application EasyMedStat (version 3.14; www.easymedstat.com).
Data were presented as means with their SD for continuous values and counts and percentages for categorical variables for descriptive statistics. The data’s normality and heteroscedasticity were assessed using the Shapiro–Wilk and Levene’s tests. Constant values were compared using the Mann–Whitney U test. When more than two groups needed to be compared, the Kruskal–Wallis test was performed with a post hoc Conover’s multiple comparison test. Categorical variables were compared using the chi-square test. Receiver operating characteristic (ROC) curves were used to assess the ability of each biomarker to predict MSARD diagnosis and to calculate the area under the curve (AUC). DeLong’s test was performed to make pairwise comparisons of the predictive biomarkers according to MSARD diagnosis. The test implementation follows “Fast Implementation of DeLong’s Algorithm for Comparing the Areas Under Correlated Receiver Operating Characteristic Curves, by Xu Sun and Weichao Xu.” An optimal threshold that best discriminates MSARD from control populations was then determined with Youden’s index. Based on the defined threshold values, patients were classified as positive or negative for each biomarker as a binary result. Sensitivity, specificity, and positive and negative predictive values were then calculated for each biomarker. All comparisons were two-tailed. To identify the impact of demographic and clinical features on each biomarker concentration, CSF KFLC, IL-6, and CD25 were included in a multivariate linear regression model. According to the three identified groups, the explanatory variables were age, gender, disease duration, immune-modifying drug use at sampling, and final diagnosis. Data were checked for multicollinearity with the Belsley–Kuh–Welsch test. Patients with missing data were excluded from the analysis. The differences were considered significant when the p-value was <0.05.
Results
Study Cohort
In the study period, two hundred seventeen patients have been referred to our center for brain white matter T2 hyperintensities. Forty-one patients were excluded because of subnormal brain MRI or age <18 years. One hundred seventy-six patients were included in the study. After the diagnostic workup, patients were separated into the following groups: 88 patients (50%) in the MSARD group, 35 (20%) in the OIND group, and 53 (30%) in the NIND group (flowchart available in the Supplementary Material, Figure S1). MSARD patients were younger than OIND (p = 0.002) and NIND patients (p = 0.001). All MSARD patients, except for RIS, experienced a clinical demyelinating event, while 63% and 0% in the OIND and NIND groups, respectively, experienced the same (p < 0.001 for both comparisons). All groups were comparable for immune treatment exposure at sampling. MSARD patients had lower CSF protein level (p < 0.001), CSF white blood cell count (p < 0.001), and albumin quotient (p < 0.001) than had OIND patients but had a higher level of CSF immunoglobulin G (IgG) and positive OCB status (p = 0.005 and p < 0.001, respectively). All characteristics are shown in Table 1.
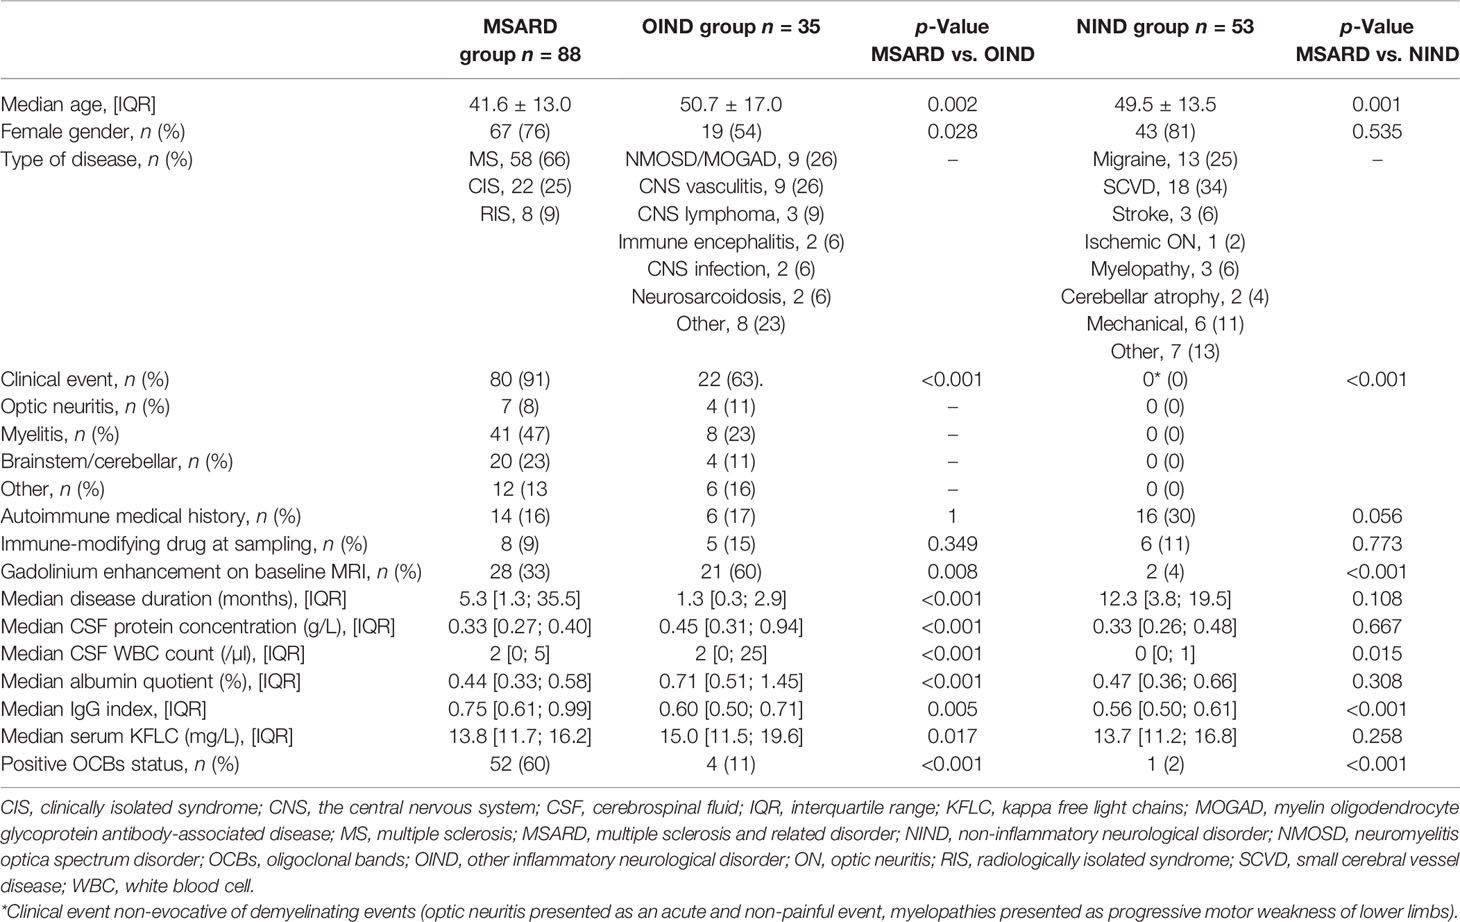
Table 1 Baseline demographic and clinical data.
Quantification of Kappa Free Light Chains Biomarkers
Median values of CSF KFLC (Figure 1A), KFLC index (Figure 1B), and KFLC IF (Figure 1C) were higher in the MSARD group (2.59 (IQR 9.18) mg/L; 37.80 (IQR 132.07); 95.06% (IQR 22.09%), respectively) than in the NIND group (0.16 (IQR 0.06) mg/L, p < 0.001 for CSF KFLC; 2.38 (IQR 1.82), p < 0.001 for KFLC index; 10.11% (IQR 38.10%), p < 0.001 for KFLC IF) and the OIND group (0.43 (IQR 1.03) mg/L, p = 0.001 for CSF KFLC; 4.53 (IQR 7.35), p < 0.001 for KFLC index; 60.21% (IQR 66.98%), p < 0.001 for KFLC IF).
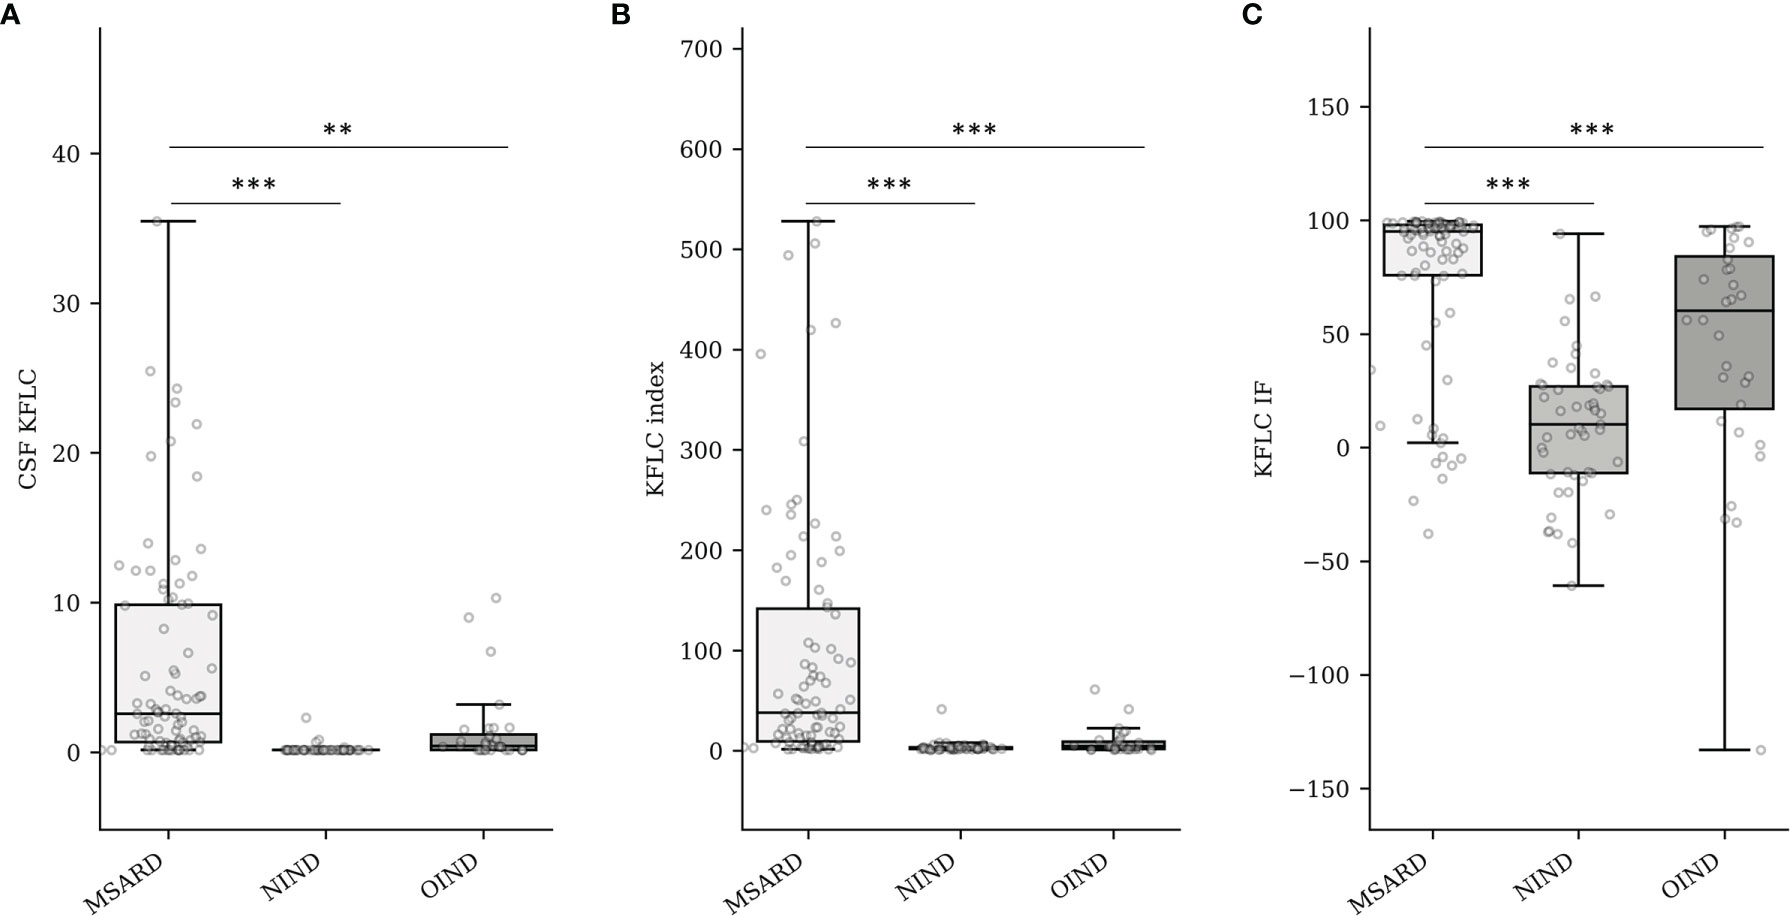
Figure 1 Quantification of CSF KFLC (mg/L) (A), KFLC index (B), and KFLC IF (%) into groups (C). MSARD, multiple sclerosis and related disorder (n = 88); NIND, non inflammatory neurological disorder (n = 53); OIND, other inflammatory neurological disorder (n = 35). ** determined a p-value < 0.01. *** determined a p-value < 0.001. CSF, cerebrospinal fluid; KFLC, kappa free light chains; IF, intrathecal fraction.
In the MSARD group, median values of CSF KFLC (figure in the Supplementary Material, Figure S2A), KFLC index (Figure S2B), and KFLC IF (Figure S2C) were lower in CIS (0.63 (IQR 1.64) mg/L, 14.2 (IQR 22.2), and 75.1% (IQR 87.19%), respectively) than in MS patients (3.8 (IQR 10.1) mg/L, 69.1 (IQR 161.23), and 96.6% (IQR 11.1%), respectively; p < 0.001 for all comparisons). There was no difference of KFLC biomarkers values between MS and RIS patients (3.4 (IQR 11.2) mg/L, 48.5 (IQR 213.6), and 94.2% (IQR 73.9%), for CSF KFLC (p = 0.403), KFLC index (p = 0.377), and KFLC IF (p = 0.320), respectively).
Quantification of Cerebrospinal Fluid IL-1β, CD25, IL-6, and IL-10
CSF concentration of IL-1β was often under the LDL of the analyzer (68% of the all cohort). Therefore, median values of CSF IL-1β (Figure 2A) were similar between groups: 0.16 (IQR 0.20) pg/ml in the MSARD group, 0.16 (IQR 0.17) pg/ml in the NIND group, and 0.16 (IQR 0.32) pg/ml in the OIND group. Median values of CSF CD25 (Figure 2B) were higher in the OIND group (45.9 (IQR 65.75) pg/ml) compared to the MSARD group (19.35 (IQR 12.12) pg/ml, p < 0.001), and the NIND group (15.7 (IQR 8.60) pg/ml, p < 0.001). Similar to CSF CD25, median values of CSF IL-6 (Figure 2C) were higher in the OIND group (13.6 (IQR 48.90) pg/ml) compared to the MSARD group (2.99 (IQR 1.67) pg/ml, p < 0.001), and the NIND group (2.68 (IQR 2.07) pg/ml, p < 0.001). CSF IL-10 concentration was under the LDL in most of the MSARD patients (67%) and the NIND patients (91%). Median values of CSF IL-10 (Figure 2D) were higher in the OIND group (1.40 (IQR 3.99) pg/ml) compared to the MSARD group (0.58 (IQR 0.69) pg/ml, p < 0.001) and the NIND group (0.58 (IQR 0.1) pg/ml, p = 0.002).
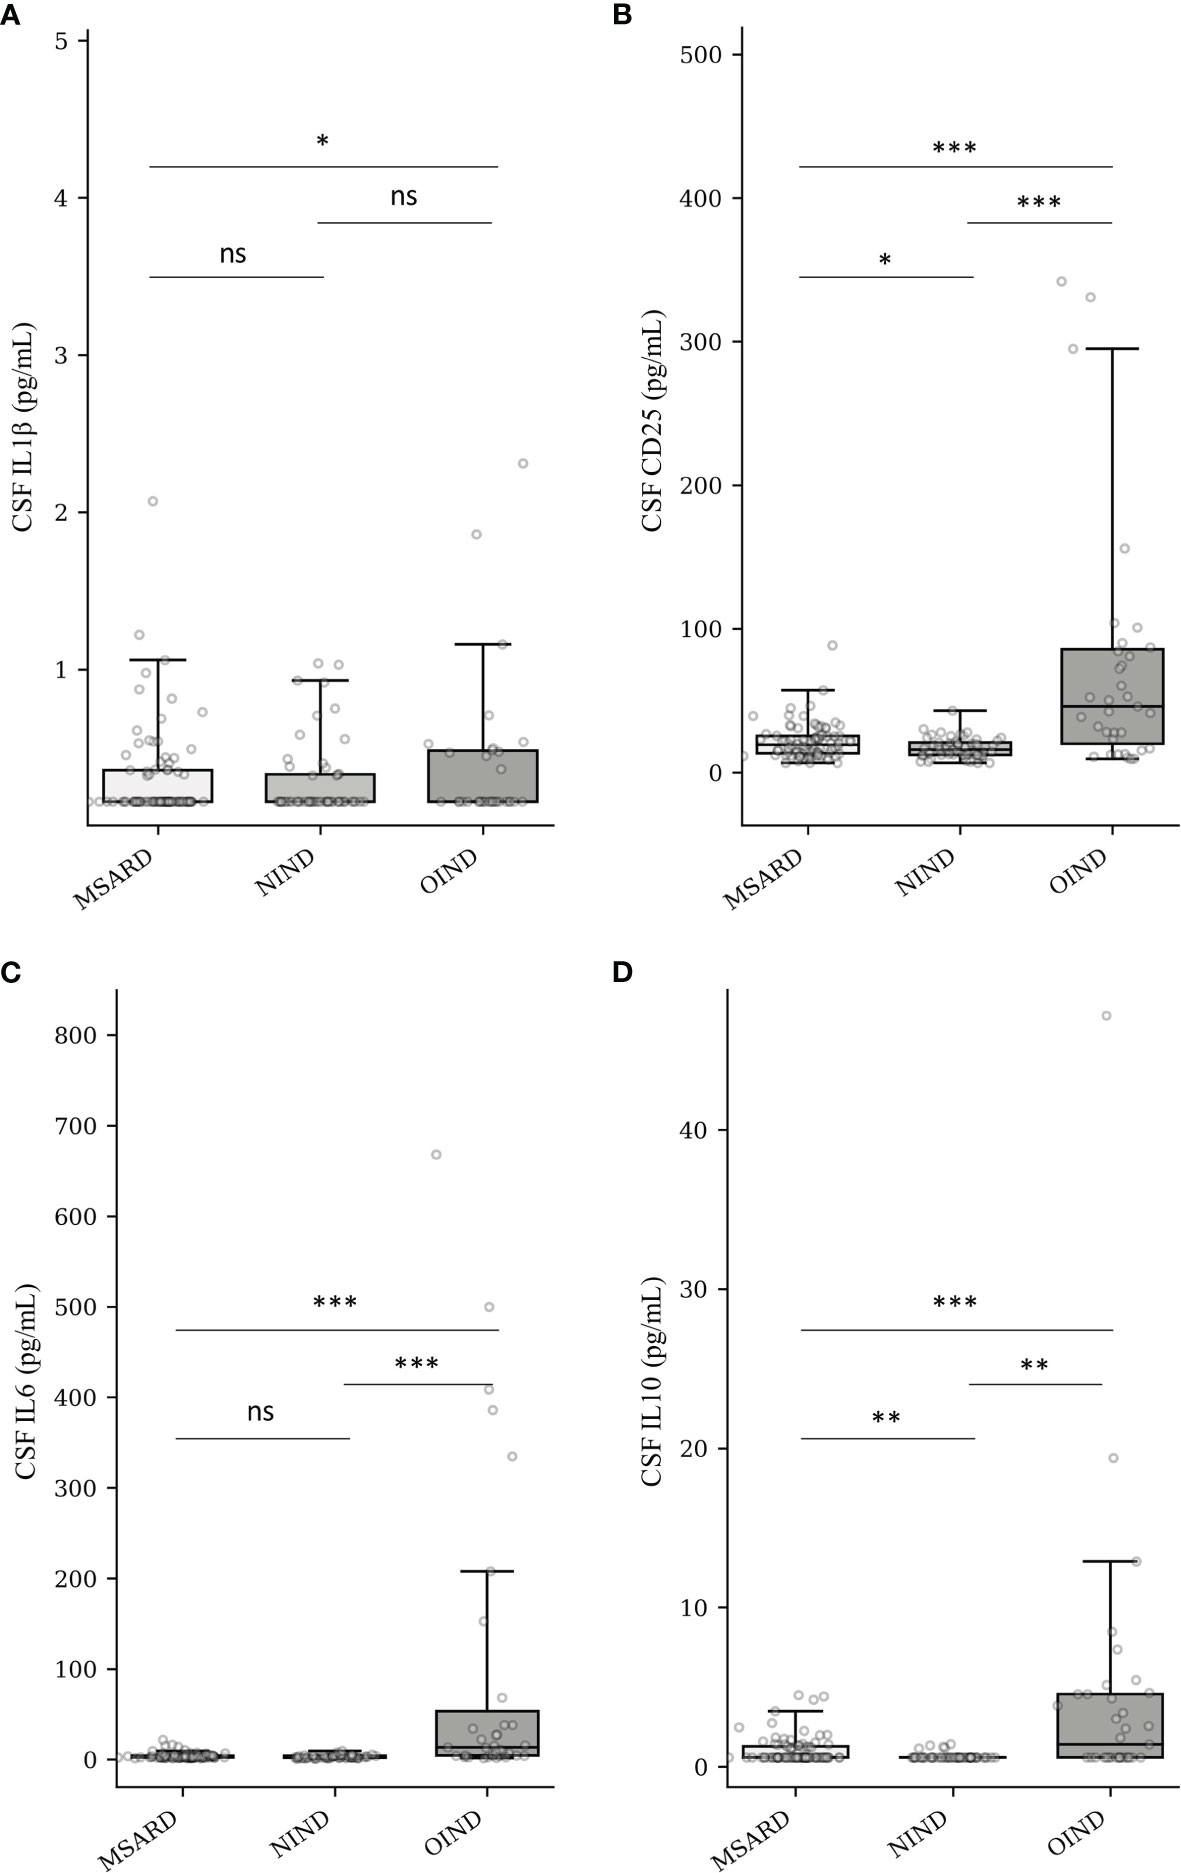
Figure 2 Quantification of CSF IL-1β (A), CD25 (sIL-2R) (B), IL-6 (C), and IL-10 (D) into groups. MSARD, multiple sclerosis and related disorders (n = 88); NIND, non-inflammatory neurological disorders (n = 53); OIND, other inflammatory neurological disorders (n = 35); ns, non-significant (p > 0.05). *p < 0.05. **p < 0.01. ***p < 0.001. CSF, cerebrospinal fluid.
In the MSARD group, median values of CSF CD25 (Figure S3A) were higher in MS (20.5 (IQR 16.3) pg/ml) than in CIS patients (14.6 (IQR 11.4) pg/ml), p = 0.023. CSF CD25 median values were similar between MS and RIS patients (20.3 (IQR 7.9) pg/ml), p = 0.836. Median values of CSF IL-6 (Figure S3B) and IL-10 (Figure S3C) were similar between MS (3.1 (IQR 1.6) and 0.58 (IQR 0.8) pg/ml, respectively), RIS (2.5 (IQR 1.7) and 0.58 (IQR 0.2) pg/ml, respectively), and CIS patients (2.9 (IQR 2.1) and 0.58 (IQR 0.1) pg/ml, respectively), p > 0.1 for all comparisons.
Biomarker Diagnostic Performances
We analyzed the ability of the KFLC index, KFLC IF, CSF CD25, CSF IL-6, and CSF IL-10 to diagnose MSARD i) against a non-inflammatory-mimicking disease by the comparison of the MSARD and NIND groups and ii) against another inflammatory-mimicking disease by the comparison of the MSARD and OIND groups. CSF IL-1β was not analyzed because of its low CSF concentration in most patients.
Kappa Free Light Chains Biomarkers Performed Better Than Cerebrospinal Fluid CD25, IL-6, and IL-10 in Separating Multiple Sclerosis and Related Disorder From Non-Inflammatory Neurological Disorder
KFLC index and KFLC IF had similar, and good, overall performances (AUC, 0.900 [0.849; 0.952] and 0.887 [0.830; 0.943], respectively) to diagnose MSARD compared to NIND. However, CSF CD25, CSF IL-6, and CSF IL-10 had lower performances (AUC, 0.596 [0.501; 0.690], 0.569 [0.467; 0.671], and 0.627 [0.565; 0.688], respectively) than both KFLC biomarkers (p < 0.001 for all comparisons). The thresholds that best separated MSARD from NIND were 8.4 for KFLC index, 73.1% for KFLC IF, 21.5 pg/ml for CSF CD25, 2.0 pg/ml for CSF IL-6, and 1.2 pg/ml for CSF IL-10. All data are shown in Table 2, and the ROC curves are available in the Supplementary Material (Figure S4A).
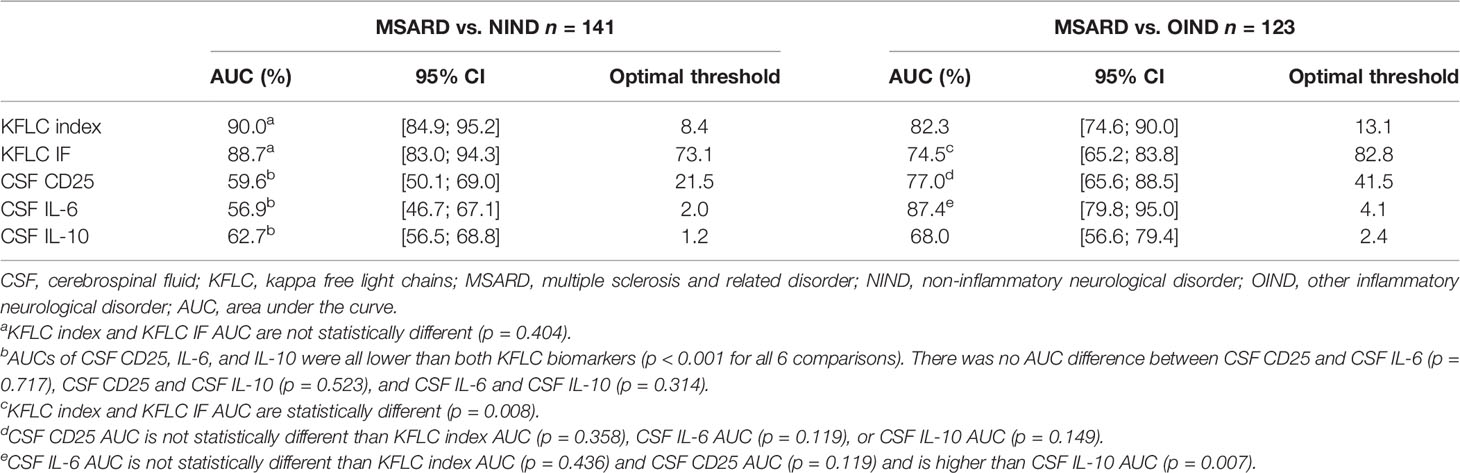
Table 2 Diagnostic performances of the different biomarkers for MSARD diagnosis compared to both control populations.
These cutoffs, KFLC index, KFLC IF, CSF CD25, IL-6, and IL-10 were changed into binary variables, and patients were categorized as positive or negative for each biomarker. As shown in Table 3, both OCBs and the KFLC index had good overall performances for MSARD diagnosis as compared to NIND. OCBs were more specific than the KFLC index (0.98 vs. 0.91, respectively) but less sensitive (0.59 vs. 0.76, respectively). However, the KFLC index diagnostic accuracy seemed to be higher than OCBs’ (0.82 vs. 0.74). Interestingly, the combination of an elevated KFLC index and CSF IL-6 had the same specificity for MSARD diagnosis than OCBs (specificity of 0.96 vs. 0.98, respectively) with a higher sensitivity (0.69 vs. 0.59, respectively) and higher diagnostic accuracy (0.79 vs. 0.74).
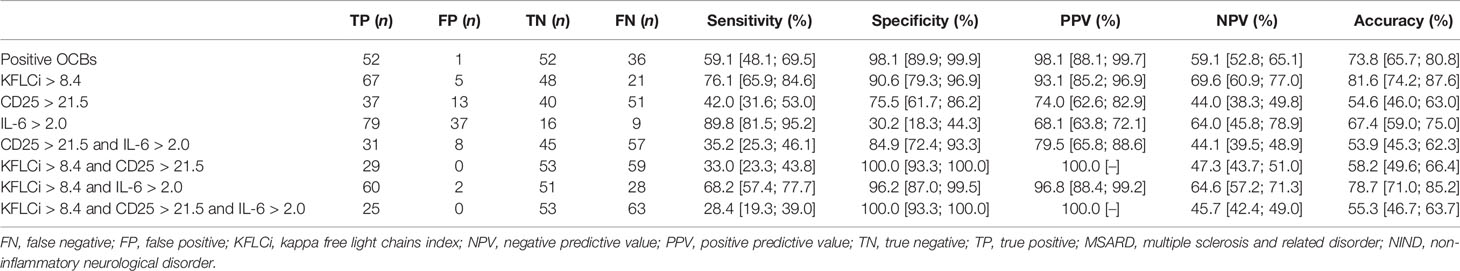
Table 3 Diagnostic performance of the different biomarkers comparing MSARD to NIND (n = 141).
Cerebrospinal Fluid IL-6, CD25, and Kappa Free Light Chains Index Showed Good Performances in Diagnosing Multiple Sclerosis and Related Disorder Compared to Other Inflammatory Neurological Disorder
When comparing MSARD to OIND, KFLC index showed better diagnostic performances than KFLC IF (AUC, 0.823 [0.746; 0.900], and 0.745 [0.652; 0.838] respectively, p = 0.008). In contrast with the comparison with the NIND group, in this situation, CSF CD25 and CSF IL-6 showed good diagnostic performances (AUC, 0.770 [0.656; 0.885], and 0.874 [0.798; 0.950], respectively), statistically similar to the KFLC index (p = 0.358, and p = 0.436, respectively). However, diagnostic performances of CSF IL-10 (AUC, 0.680 [0.566; 0.794]) were lower than those of both KFLC index (p = 0.02) and IL-6 (p < 0.001). The thresholds that best separated MSARD from OIND were 13.1 for KFLC index, 82.8% for KFLC IF, 41.5 pg/ml for CSF CD25, 4.1 pg/ml for CSF IL-6, and 2.4 pg/ml for CSF IL-10. All data are shown in Table 2, and the ROC curves are available in the Supplementary Material (Figure S4B).
As shown in Table 4, CSF IL-6 could separate both groups with better sensitivity and the same specificity than OCBs and a better specificity for the same sensitivity than the KFLC index (sensitivity of 0.74, 0.59, and 0.73 and specificity of 0.88, 0.88, and 0.76 for CSF IL-6, OCBs, and KFLC index, respectively). The better specific combination for MSARD diagnosis in such a situation was the association of low CSF IL-6 and CD25 (sensitivity 0.72, specificity 0.94).
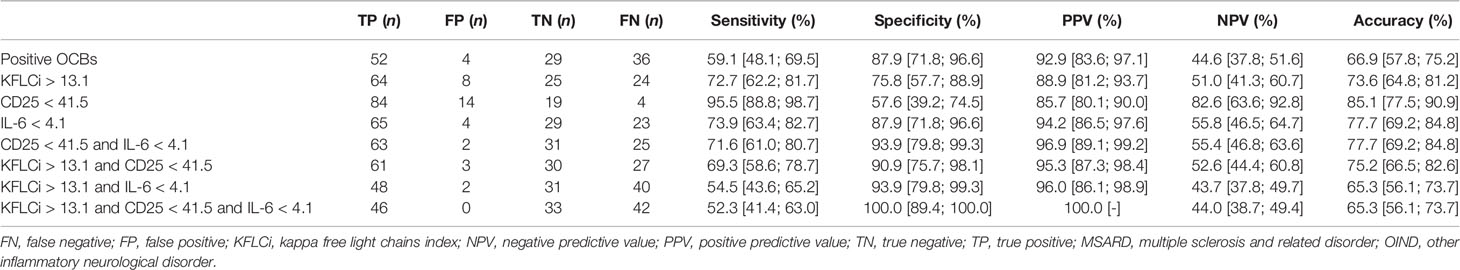
Table 4 Diagnostic performance of the different biomarkers comparing MSARD to OIND (n = 123).
Kappa Free Light Chains Index, Cerebrospinal Fluid CD25, and Cerebrospinal Fluid IL-6 Diagnostic Performances Needed to Be Studied in Homogenized Other Inflammatory Neurological Disorder Populations
As shown in Figure 3A, elevated KFLC index strongly suggests MS diagnosis independently of the compared OIND subgroups (median of 69.1, 5.49, 1.46, and 4.05 for MS, NMOSD/MOGAD, CNS vasculitis, and OIND diagnoses, respectively; p < 0.001 for all comparisons). The comparison between MS and CNS infection did not seem valid, while only two patients presented with a CNS infection in our cohort. The CSF CD25 concentration (Figure 3B) did not seem to be effective to separate MS from NMOSD/MOGAD (median CSF CD25 of 20.5 vs. 27.6 pg/ml for MS and NMOSD/MOGAD, respectively, p = 0.755). Nevertheless, CSF CD25 could separate MS from CNS vasculitis (median CSF CD25 of 81.0 pg/ml, p < 0.001) or other types of OIND (median CSF CD25 of 51.5 pg/ml, p = 0.012). Finally, CSF IL-6 (Figure 3C) seemed to be a good biomarker to distinguish MS from NMOSD/MOGAD (median CSF IL-6 of 3.1 vs. 27.0 pg/ml for MS and NMOSD/MOGAD, respectively, p < 0.001) and from CNS vasculitis (median CSF IL-6 for vasculitis of 27.7 pg/ml, p < 0.001). However, median CSF IL-6 concentrations were not different between MS and the other OIND (p = 0.392).
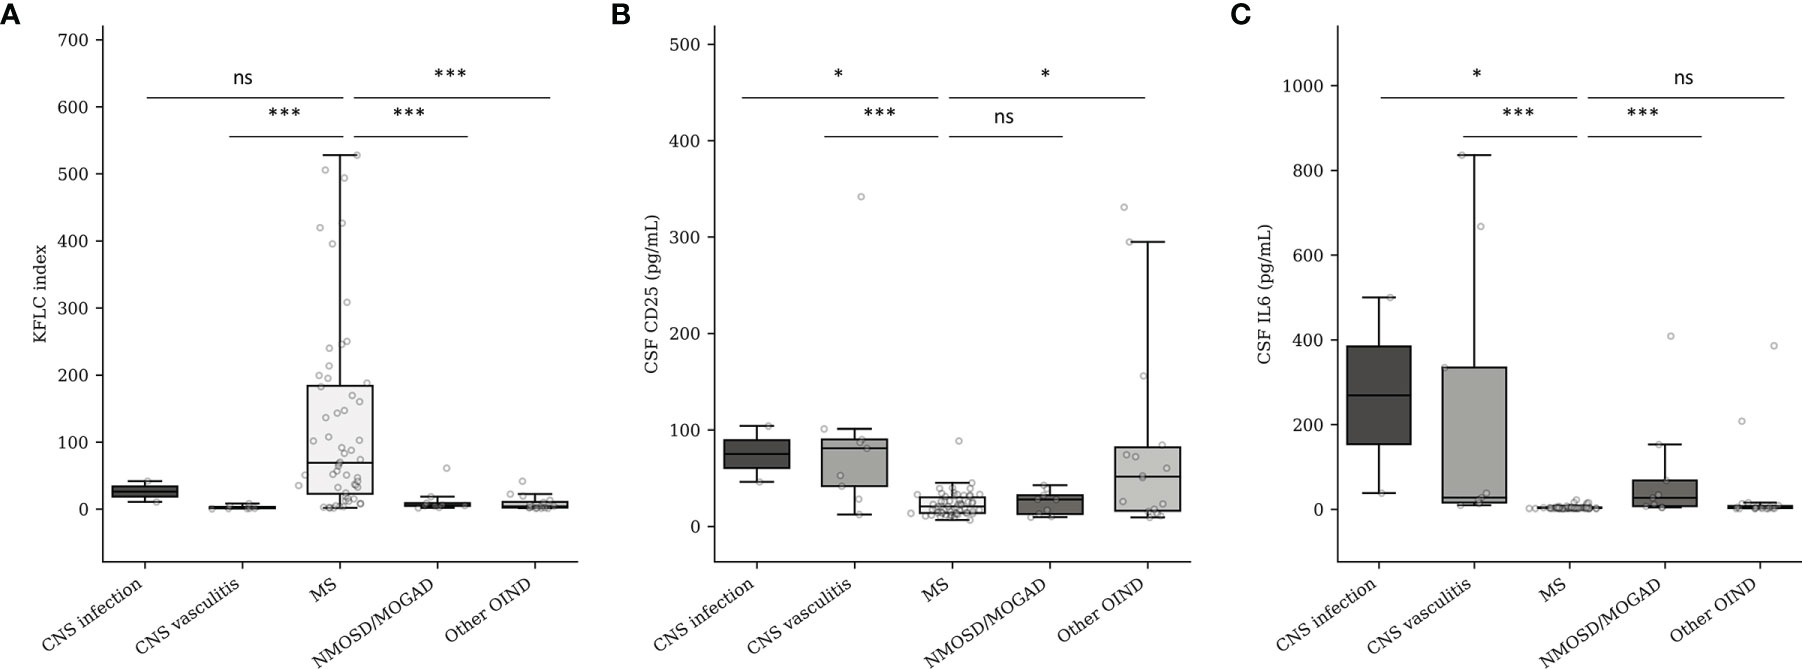
Figure 3 KFLC index (A), CSF CD25 (B), and CSF IL-6 (C) expression in MS and OIND subgroups. CNS, central nervous system; MS, multiple sclerosis; MOGAD, myelin oligodendrocyte antibody-associated disorder; NMOSD, neuromyelitis optica spectrum disorder; OIND, other inflammatory neurological disorder. Number of patients according to the different subgroups: CNS infection (n = 2), CNS vasculitis (n = 9), MS (n = 58), NMOSD/MOGAD (n = 9), OIND (n = 15). ns, non-significant (p > 0.05). *p < 0.05. ***p < 0.001.
Cerebrospinal Fluid Kappa Free Light Chains, CD25, and IL-6 Concentrations Were Not Influenced by Age, Gender, Disease Duration, and Immune-Modifying Drug Use at Sampling
Based on the linear regression multivariate analysis model, CSF KFLC, CSF CD25, and CSF IL-6 concentrations were not influenced by age (p = 0.423, 0.508, and 0.891, respectively), gender (p = 0.840, 0.564, and 0.072, respectively), immune-modifying drug use at sampling (p = 0.906, 0.530, and 0.215, respectively), or disease duration (p = 0.0931, 0.163, and 0.126, respectively). The only factor associated with elevated CSF KFLC was MSARD diagnosis (p < 0.001 when compared to NIND group, and p = 0.001 when compared to the OIND group as reference), and the only one associated with elevated CSF CD25 and IL-6 was OIND diagnosis (p = 0.018 for CD25 when compared to MSARD as a reference, and p = 0.003 for IL-6 when compared to MSARD as reference). All data are shown in Table 5.
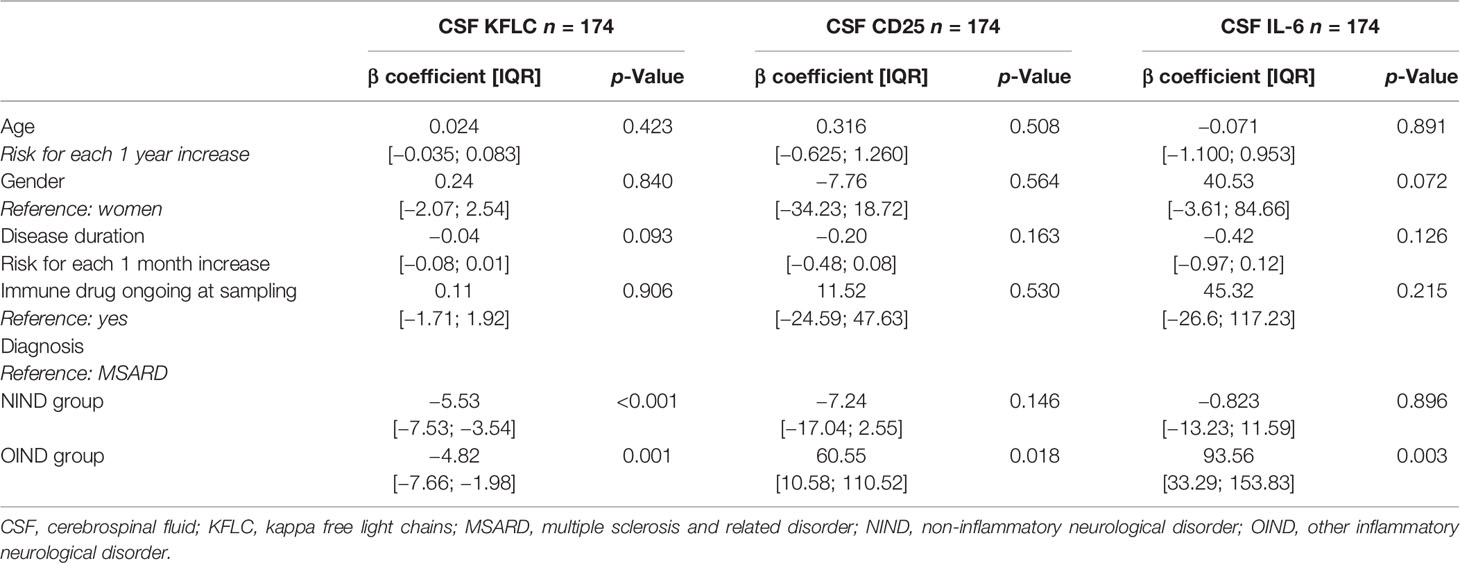
Table 5 Identification of clinical and demographic data influencing CSF KFLC, CSF CD25, and CSF IL-6 concentrations by linear regression multivariate analysis.
Discussion
Our study evaluates prospectively multiple CSF biomarkers in patients presenting for a diagnostic workup of brain white matter hyperintensities suggestive of MS. Our results suggest that activated B-cell biomarkers (OCBs or KFLC index/IF) may strongly recommend MSARD diagnosis regardless of the chosen control population. KFLC index has the advantage of being more sensitive than OCBs but suffered from less specificity. These results are consistent with previous retrospective (15, 16) and prospective (14, 22, 23) studies. We found that CIS patients may present with lower KFLC biomarkers values than MS and RIS patients. It may be explained that the 2017 McDonald criteria were applied for MS diagnosis. In doing so, all CIS patients presenting with radiological dissemination in space and positive OCBs were diagnosed as having MS. Therefore, in our cohort, most of the CIS patients presented with low intrathecal B-cell activity (negative OCBs).
We found that CSF CD25 and CSF IL-6 concentrations were lower in MSARD than in OIND. However, these biomarkers cannot rule in MSARD, while NIND patients also express low CSF CD25 and IL-6 concentrations. Nevertheless, high CSF CD25 and IL-6 could be helpful in rolling out MSARD diagnosis, while it would favor another MS-mimicking inflammatory CNS disease. Of note, elevated CSF CD25 presents the highest positive predictive value for OIND diagnosis, more than low KFLC index or negative OCBs. However, CSF CD25 lacks diagnostic performance in separating MSARD from NMOSD and MOGAD, whereas IL-6 seems to be an effective tool in such situations. This is why we think that CSF CD25 and CSF IL-6 should both be used in practice. Moreover, CSF KFLC, CD25, and IL6 concentrations were not influenced by age, gender, disease duration, or immune treatment used during sampling. This point is important, while diagnostic biomarkers need to be efficient at any time of the diagnostic workup.
Our results are consistent with previously published data, showing that a high KFLC index or KFLC IF is associated with MS diagnosis (14–16, 22, 24). KFLC has the advantage, compared to OCBs, in quantifying CSF B-cell activity. This is an important point to consider, while it has been shown, on pathological brain analysis, that MS patients present higher amounts of activated B cells than other inflammatory CNS disorders (25). However, many different KFLC index cutoff values were published to assess intrathecal immunoglobulin synthesis (i.e., KFLC index cutoff range from less than 3 to more than 10) (26, 27). This discrepancy could be explained by the heterogeneity of the different control populations, while many inflammatory CNS disorders may have an intrathecal B-cell activity. Therefore, as suggested by our study, cutoff values of KFLC biomarkers should be different depending on the suspected underlying MS-mimicking disorder, to avoid misdiagnosis.
Our findings agree with other retrospective studies that found an increased concentration of CSF IL-6 in NMOSD (17, 28, 29) and MOGAD (17, 30) compared to MS. Added to our results, these findings suggest that CSF IL-6 measurement may impact early diagnosis, while cytokine measurement is easy and fast to perform as compared to aquaporin-4 or MOG antibody, and may guide early therapeutic action, in suspected NMOSD/MOGAD patients. Moreover, tocilizumab, an IL-6 receptor blockade therapy, has shown promising efficacy in NMOSD (31–33) and has been reported to be effective in relapsing steroid-dependent MOGAD (31, 34), reinforcing the impact of the IL-6 pathway in these diseases. In contrast, CSF CD25 could not separate MSARD from NMOSD and MOGAD, as it has already been suggested in two previously published retrospective studies (17, 35). However, because of its high positive predictive value for OIND diagnosis, elevated CSF CD25 should be used as a non-specific MSARD red flag. Even if CSF CD25 is not associated with a specific disease in our heterogeneous cohort, it could be an exciting tool in neurosarcoidosis (18), bacterial meningitis (18), or CNS lymphoma (18, 35, 36).
Nonetheless, in clinical practice, a spinal tap is not performed in all suspected MS patients, while MS diagnostic criteria are based on the presence of a typical demyelinating event and MRI presentation (1). However, CSF analysis is often performed, while identifying OCBs is a key point to ensure MS diagnosis and avoid misdiagnosis. Moreover, our results show that extensive CSF analysis could help etiological diagnosis in many complicated cases. Importantly, none of the NIND patients in our cohort experienced a typical clinical demyelinating event, reinforcing the importance of clinical presentation in fulfilling MS criteria and identifying red flags for MS diagnosis. According to these findings and the current recommendations for MS diagnosis (1, 37, 38), we provide an MS practical diagnostic algorithm for patients presenting with brain white matter hyperintensities suggestive of MS (Figure 4).
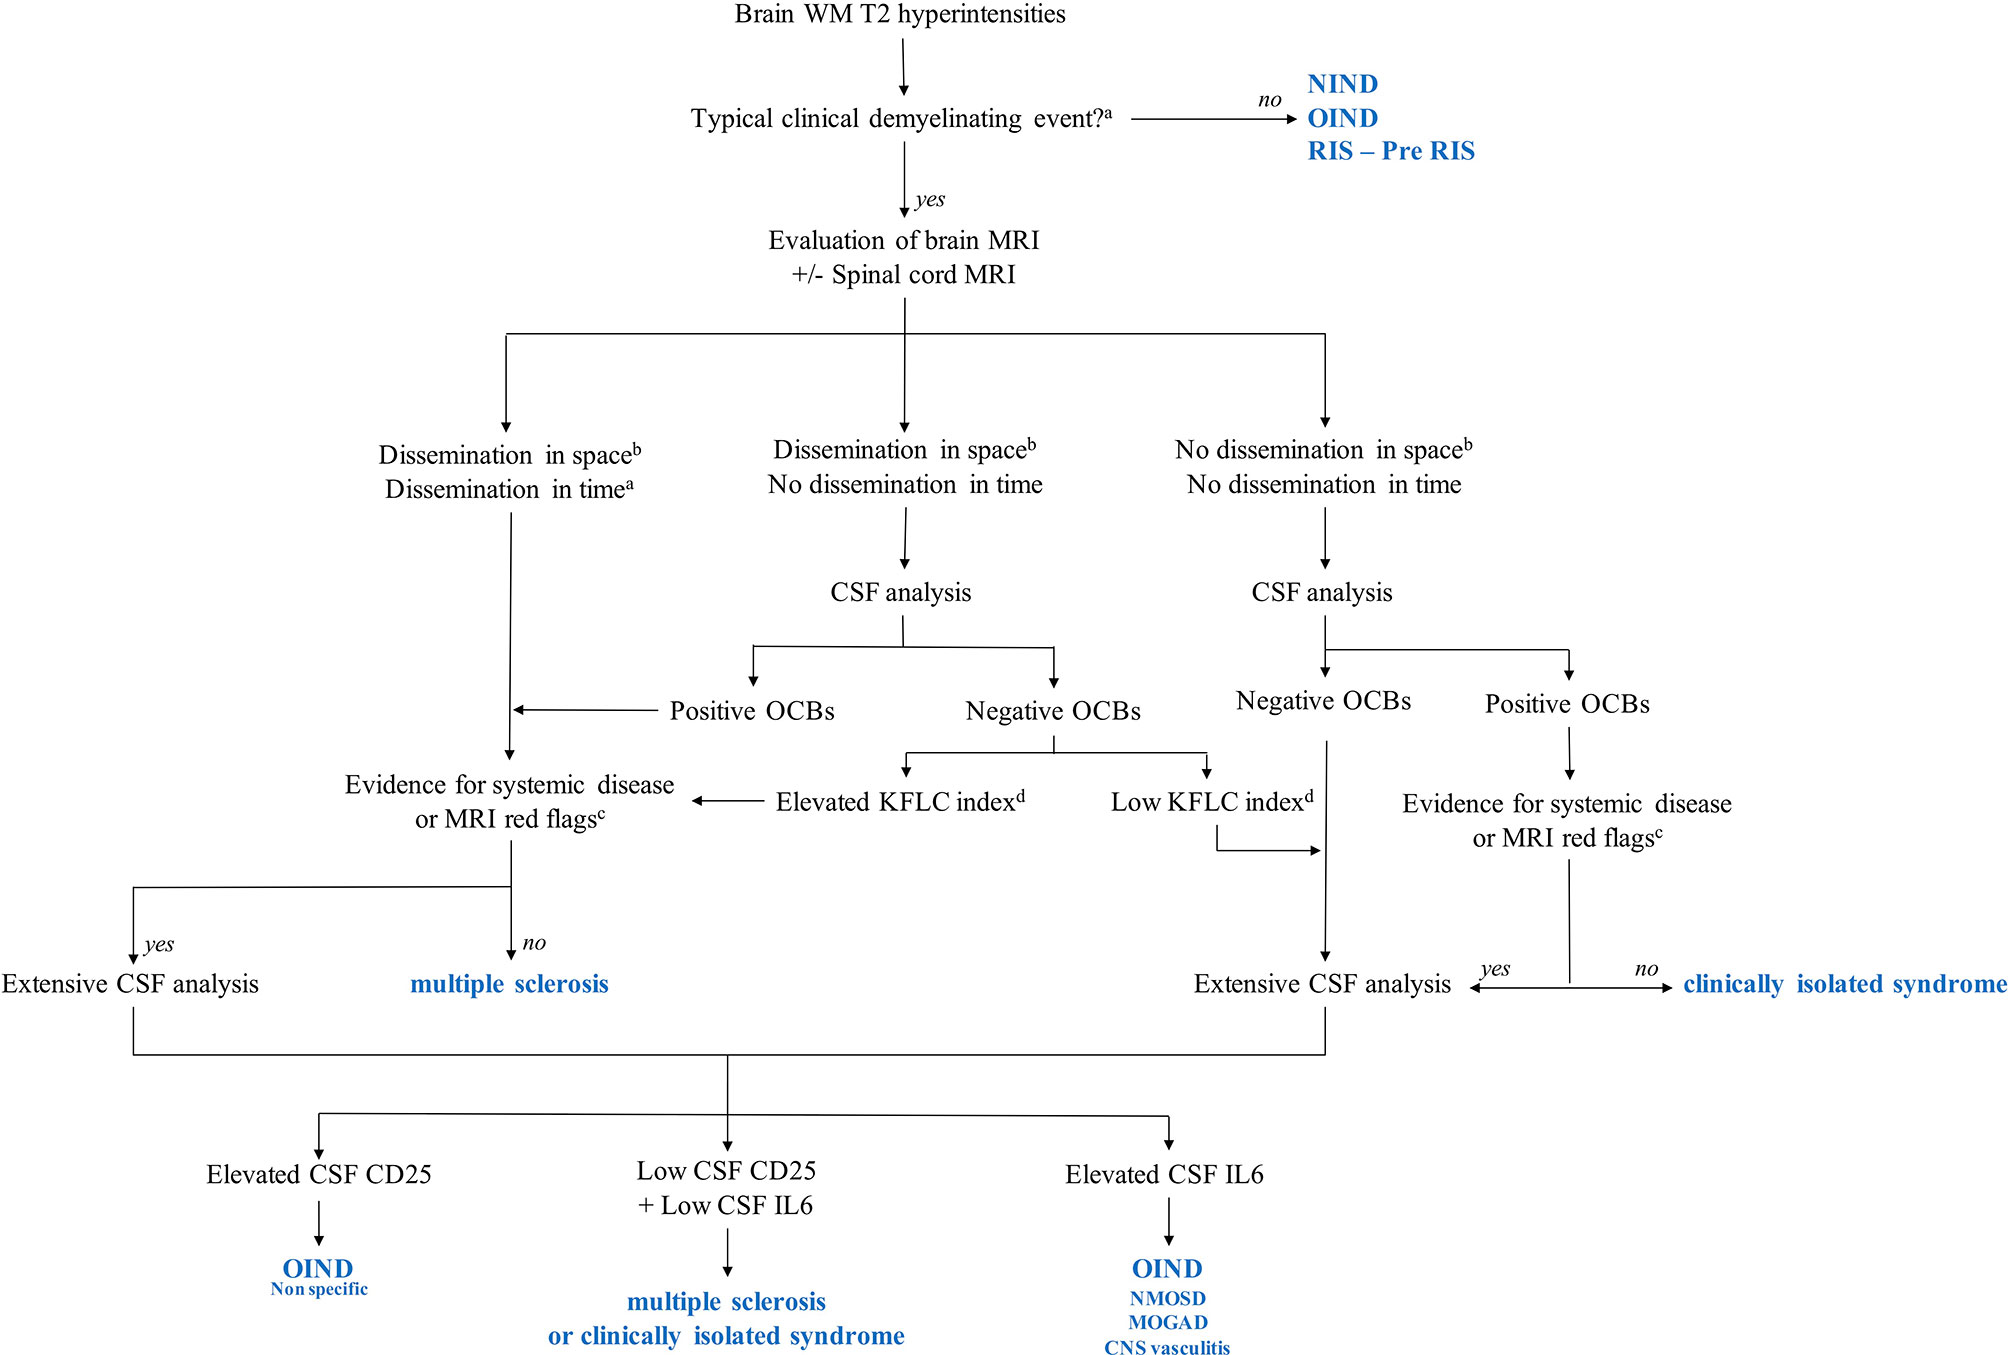
Figure 4 Multiple sclerosis (MS) diagnostic algorithms including KFLC index, CSF CD25, and CSF IL-6. MOGAD, myelin oligodendrocyte glycoprotein antibody-associated disease; NIND, non-inflammatory neurological disorder; NMOSD, neuromyelitis optica spectrum disorder; OIND, other inflammatory neurological disorder; Pre-RIS, radiologically isolated syndrome with one or two specific dissemination in space criteria; RIS, radiologically isolated syndrome; WM: white matter. aAccording to reference (1). bAccording to reference (37). cAccording to reference (38). dIn our study, the KFLC index cutoff was 13.1. This cutoff is specific to our cohort and should not be used in daily practice, while each MS tertiary center should determine its threshold values. KFLC, kappa free light chains; CSF, cerebrospinal fluid.
Our study suffers from several limits. First, being a monocentric study, our results need to be confirmed by others, even if these results are consistent with multiple retrospective data. Second, our cohort’s small size and heterogeneity, particularly in the OIND group, do not permit us to conclude on the effectiveness of these biomarkers for the different MS-mimicking diseases. However, it allows figuring out which biomarker may help in rolling in or rolling out MSARD. Third, it would have been interesting to measure serum IL-1β, CD25, IL-6, and IL-10 to calculate cytokine indexes, but our routine diagnostic workup of white matter hyperintensities does not include these analyses. Nevertheless, this study is pragmatic, evaluating these biomarkers prospectively in daily practice for the diagnostic workup of suspected MS. We think that these results will increase the etiological diagnostic accuracy of such patients.
Conclusion
In patients presenting for a diagnostic workup of MRI white matter hyperintensities, elevated CSF activated B-cell biomarkers such as KFLC index or KFLC IF strongly suggest MSARD. In contrast, elevated CSF IL-6 and CD25 suggest another inflammatory-mimicking disease. These findings need to be confirmed in other prospective cohort studies within larger samples.
Data Availability Statement
The raw data supporting the conclusions of this article will be made available by the authors, without undue reservation.
Ethics Statement
Ethical review and approval were not required for the study on human participants in accordance with the local legislation and institutional requirements. The patients/participants provided their written informed consent to participate in this study.
Author Contributions
ML and CL-F designed the study, collected the data, performed the data analysis, and drafted the manuscript. CL, LM, MC, and SB helped in designing the study, data collection, preparation of the manuscript, and review for intellectual content. VB and BS-P performed the biomarker analysis and helped in reviewing the manuscript for intellectual content. All authors contributed to the article and approved the submitted version.
Conflict of Interest
The authors declare that the research was conducted in the absence of any commercial or financial relationships that could be construed as a potential conflict of interest.
Publisher’s Note
All claims expressed in this article are solely those of the authors and do not necessarily represent those of their affiliated organizations, or those of the publisher, the editors and the reviewers. Any product that may be evaluated in this article, or claim that may be made by its manufacturer, is not guaranteed or endorsed by the publisher.
Supplementary Material
The Supplementary Material for this article can be found online at: https://www.frontiersin.org/articles/10.3389/fimmu.2022.864133/full#supplementary-material
Supplementary Figure 1 | Flow chart. CNS, central nervous system; MS, multiple sclerosis; MSARD, multiple sclerosis and related disorder; OIND, other inflammatory neurological disorder; WMH, white matter hyperintensities.
Supplementary Figure 2 | Distribution of KFLC biomarkers into RIS, CIS, and MS subgroups. CIS, clinically isolated syndrome (n=22); MS, multiple sclerosis (n=58); RIS, radiologically isolated syndrome (n=8); ns, non significant ***p < 0.001.
Supplementary Figure 3 | Distribution of CSF CD25, IL6, and IL10 into RIS, CIS, and MS subgroups. CIS, clinically isolated syndrome (n=22); MS, multiple sclerosis (n=58); RIS, radiologically isolated syndrome (n=8). ns, non significant *p < 0.05.
Supplementary Figure 4 | ROC curves of KFLC index, KFLC IF, CSF CD25, IL6, and IL10.[(A) ROC curve that separate MSARD from NIND (n=141)]. Panel (B) ROC curve that separate MSARD from OIND (n=123).
References
1. Thompson AJ, Banwell BL, Barkhof F, Carroll WM, Coetzee T, Comi G, et al. Diagnosis of Multiple Sclerosis: 2017 Revisions of the McDonald Criteria. Lancet Neurol (2017) 17(2):162–73. doi: 10.1016/S1474-4422(17)30470-2
2. Arrambide G, Tintore M, Espejo C, Auger C, Castillo M, Río J, et al. The Value of Oligoclonal Bands in the Multiple Sclerosis Diagnostic Criteria. Brain (2018) 141(4):1075–84. doi: 10.1093/brain/awy006
3. Okuda DT, Mowry EM, Beheshtian A, Waubant E, Baranzini SE, Goodin DS, et al. Incidental MRI Anomalies Suggestive of Multiple Sclerosis: The Radiologically Isolated Syndrome. Neurology (2009) 72(9):800–5. doi: 10.1212/01.wnl.0000335764.14513.1a
4. Lebrun-Frenay C, Kantarci O, Siva A, Sormani MP, Pelletier D, Okuda DT, et al. Radiologically Isolated Syndrome: 10-Year Risk Estimate of a Clinical Event. Ann Neurol (2020) 88(2):407–17. doi: 10.1002/ana.25799
5. Solomon AJ, Naismith RT, Cross AH. Misdiagnosis of Multiple Sclerosis: Impact of the 2017 McDonald Criteria on Clinical Practice. Neurology (2019) 92(1):26–33. doi: 10.1212/WNL.0000000000006583
6. Yamout BI, Khoury SJ, Ayyoubi N, Doumiati H, Fakhreddine M, Ahmed SF, et al. Alternative Diagnoses in Patients Referred to Specialized Centers for Suspected MS. Mult Scler Relat Disord (2017) 18:85–9. doi: 10.1016/j.msard.2017.09.016
7. Wildner P, Stasiołek M, Matysiak M. Differential Diagnosis of Multiple Sclerosis and Other Inflammatory CNS Diseases. Mult Scler Relat Disord (2020) 37:101452. doi: 10.1016/j.msard.2019.101452
8. Bar-Or A, Li R. Cellular Immunology of Relapsing Multiple Sclerosis: Interactions, Checks, and Balances. Lancet Neurol (2021) 20(6):470–83. doi: 10.1016/S1474-4422(21)00063-6
9. van Langelaar J, Rijvers L, Smolders J, van Luijn MM. B and T Cells Driving Multiple Sclerosis: Identity, Mechanisms and Potential Triggers. Front Immunol (2020) 11:760. doi: 10.3389/fimmu.2020.00760
10. van Langelaar J, van der Vuurst de Vries RM, Janssen M, Wierenga-Wolf AF, Spilt IM, Siepman TA, et al. T Helper 17.1 Cells Associate With Multiple Sclerosis Disease Activity: Perspectives for Early Intervention. Brain (2018) 141(5):1334–49. doi: 10.1093/brain/awy069
11. Comi G, Bar-Or A, Lassmann H, Uccelli A, Hartung HP, Montalban X, et al. Role of B Cells in Multiple Sclerosis and Related Disorders. Ann Neurol (2021) 89(1):13–23. doi: 10.1002/ana.25927
12. Hauser SL, Bar-Or A, Comi G, Giovannoni G, Hartung HP, Hemmer B, et al. Ocrelizumab Versus Interferon Beta-1a in Relapsing Multiple Sclerosis. N Engl J Med (2017) 376(3):221–34. doi: 10.1056/NEJMoa1601277
13. Hauser SL, Bar-Or A, Cohen JA, Comi G, Correale J, Coyle PK, et al. Ofatumumab Versus Teriflunomide in Multiple Sclerosis. N Engl J Med (2020) 383(6):546–57. doi: 10.1056/NEJMoa1917246
14. Saadeh RS, Bryant SC, McKeon A, Weinshenker B, Murray DL, Pittock SJ, et al. CSF Kappa Free Light Chains: Cut-Off Validation for Diagnosing Multiple Sclerosis. Mayo Clin Proc (2021) S0025–6196(21)00710-2. doi: 10.1016/j.mayocp.2021.09.014
15. Leurs CE, Twaalfhoven H, Lissenberg-Witte BI, van Pesch V, Dujmovic I, Drulovic J, et al. Kappa Free Light Chains Is a Valid Tool in the Diagnostics of MS: A Large Multicenter Study. Mult Scler (2020) 26(8):912–23. doi: 10.1177/1352458519845844
16. Senel M, Mojib-Yezdani F, Braisch U, Bachhuber F, Lewerenz J, Ludolph AC, et al. CSF Free Light Chains as a Marker of Intrathecal Immunoglobulin Synthesis in Multiple Sclerosis: A Blood-CSF Barrier Related Evaluation in a Large Cohort. Front Immunol (2019) 10:641. doi: 10.3389/fimmu.2019.00641
17. Kaneko K, Sato DK, Nakashima I, Ogawa R, Akaishi T, Takai Y, et al. CSF Cytokine Profile in MOG-IgG+ Neurological Disease Is Similar to AQP4-IgG+ NMOSD But Distinct From MS: A Cross-Sectional Study and Potential Therapeutic Implications. J Neurol Neurosurg Psychiatry (2018) 89(9):927–36. doi: 10.1136/jnnp-2018-317969
18. Otto C, Wengert O, Unterwalder N, Meisel C, Ruprecht K. Analysis of Soluble Interleukin-2 Receptor as CSF Biomarker for Neurosarcoidosis. Neurol Neuroimmunol Neuroinflamm (2020) 7(4):e725. doi: 10.1212/NXI.0000000000000725
19. Rubenstein JL, Wong VS, Kadoch C, Gao HX, Barajas R, Chen L, et al. CXCL13 Plus Interleukin 10 Is Highly Specific for the Diagnosis of CNS Lymphoma. Blood (2013) 121(23):4740–8. doi: 10.1182/blood-2013-01-476333
20. Montalban X, Tintoré M, Swanton J, Barkhof F, Fazekas F, Filippi M, et al. MRI Criteria for MS in Patients With Clinically Isolated Syndromes. Neurology (2010) 74(5):427–34. doi: 10.1212/WNL.0b013e3181cec45c
21. Reiber H, Zeman D, Kušnierová P, Mundwiler E, Bernasconi L. Diagnostic Relevance of Free Light Chains in Cerebrospinal Fluid – The Hyperbolic Reference Range for Reliable Data Interpretation in Quotient Diagrams. Clin Chim Acta (2019) 497:153–62. doi: 10.1016/j.cca.2019.07.027.21
22. Rosenstein I, Rasch S, Axelsson M, Novakova L, Blennow K, Zetterberg H, et al. Kappa Free Light Chain Index as a Diagnostic Biomarker in Multiple Sclerosis: A Real-World Investigation. J Neurochem (2021) 159(3):618–28. doi: 10.1111/jnc.15500
23. Duell F, Evertsson B, Al Nimer F, Sandin A, Olsson D, Olsson T, et al. Diagnostic Accuracy of Intrathecal Kappa Free Light Chains Compared With OCBs in MS. Neurol Neuroimmunol Neuroinflamm (2020) 7(4):e775. doi: 10.1212/NXI.0000000000000775
24. Süße M, Feistner F, Grothe M, Nauck M, Dressel A, Hannich MJ. Free Light Chains Kappa Can Differentiate Between Myelitis and Non-Inflammatory Myelopathy. Neurol Neuroimmunol Neuroinflamm (2020) 7(6):e892. doi: 10.1212/NXI.0000000000000892
25. Machado-Santos J, Saji E, Tröscher AR, Paunovic M, Liblau R, Gabriely G, et al. The Compartmentalized Inflammatory Response in the Multiple Sclerosis Brain Is Composed of Tissue-Resident CD8 + T Lymphocytes and B Cells. Brain (2018) 41(7):2066–82. doi: 10.1093/brain/awy151
26. Sanz Diaz CT, de Las Heras Flórez S, Carretero Perez M, Hernández Pérez MÁ, Martín García V. Evaluation of Kappa Index as a Tool in the Diagnosis of Multiple Sclerosis: Implementation in Routine Screening Procedure. Front Neurol (2021) 12:676527. doi: 10.3389/fneur.2021.676527
27. Menéndez-Valladares P, García-Sánchez MI, Adorna Martínez M, García De Veas Silva JL, Bermudo Guitarte C, Izquierdo Ayuso G. Validation and Meta-Analysis of Kappa Index Biomarker in Multiple Sclerosis Diagnosis. Autoimmun Rev (2019) 18(1):43–9. doi: 10.1016/j.autrev.2018.07.010
28. Uzawa A, Mori M, Masuda H, Ohtani R, Uchida T, Sawai S, et al. Interleukin-6 Analysis of 572 Consecutive CSF Samples From Neurological Disorders: A Special Focus on Neuromyelitis Optica. Clin Chim Acta (2017) 469:144–9. doi: 10.1016/j.cca.2017.03.006
29. Hou MM, Li YF, He LL, Li XQ, Zhang Y, Zhang SX, et al. Proportions of Th17 Cells and Th17-Related Cytokines in Neuromyelitis Optica Spectrum Disorders Patients: A Meta-Analysis. Int Immunopharmacol (2019) 75:105793. doi: 10.1016/j.intimp.2019.105793
30. Kothur K, Wienholt L, Tantsis EM, Earl J, Bandodkar S, Prelog K, et al. B Cell, Th17, and Neutrophil Related Cerebrospinal Fluid Cytokine/Chemokines Are Elevated in MOG Antibody Associated Demyelination. PloS One (2016) 11(2):e0149411. doi: 10.1371/journal.pone.0149411
31. Ringelstein M, Ayzenberg I, Lindenblatt G, Fischer K, Gahlen A, Novi G, et al. Interleukin-6 Receptor Blockade in Treatment-Refractory MOG-IgG-Associated Disease and Neuromyelitis Optica Spectrum Disorders. Neurol Neuroimmunol Neuroinflamm (2021) 9(1):e1100. doi: 10.1212/NXI.0000000000001100
32. Du C, Zeng P, Han JR, Zhang TX, Jia D, Shi FD, et al. Early Initiation of Tocilizumab Treatment Against Moderate-to-Severe Myelitis in Neuromyelitis Optica Spectrum Disorder. Front Immunol (2021) 12:660230. doi: 10.3389/fimmu.2021.660230
33. Zhang C, Zhang M, Qiu W, Ma H, Zhang X, Zhu Z, et al. Safety and Efficacy of Tocilizumab Versus Azathioprine in Highly Relapsing Neuromyelitis Optica Spectrum Disorder (TANGO): An Open-Label, Multicentre, Randomized, Phase 2 Trial. Lancet Neurol (2020) 19(5):391–401. doi: 10.1016/S1474-4422(20)30070-3
34. Elsbernd PM, Hoffman WR, Carter JL, Wingerchuk DM. Interleukin-6 Inhibition With Tocilizumab for Relapsing MOG-IgG Associated Disorder (MOGAD): A Case Series and Review. Mult Scler Relat Disord (2021) 48:102696. doi: 10.1016/j.msard.2020.102696
35. Ikeguchi R, Shimizu Y, Shimizu S, Kitagawa K. CSF and Clinical Data are Useful in Differentiating CNS Inflammatory Demyelinating Disease From CNS Lymphoma. Mult Scler (2018) 24(9):1212–23. doi: 10.1177/1352458517717804
36. Maeyama M, Sasayama T, Tanaka K, Nakamizo S, Tanaka H, Nishihara M, et al. Multi-Marker Algorithms Based on CXCL13, IL-10, sIL-2 Receptor, and Beta2-Microglobulin in Cerebrospinal Fluid to Diagnose CNS Lymphoma. Cancer Med (2020) 9(12):4114–25. doi: 10.1002/cam4.3048
37. Geraldes R, Ciccarelli O, Barkhof F, De Stefano N, Enzinger C, Filippi M, et al. The Current Role of MRI in Differentiating Multiple Sclerosis From its Imaging Mimics. Nat Rev Neurol (2018) 14(4):199–213. doi: 10.1038/nrneurol.2018.14
Keywords: white matter hyperintensities, multiple sclerosis, biomarker, IL-6, sIL-2R, kappa free light chains
Citation: Levraut M, Landes C, Mondot L, Cohen M, Bresch S, Brglez V, Seitz-Polski B and Lebrun-Frenay C (2022) Kappa Free Light Chains, Soluble Interleukin-2 Receptor, and Interleukin-6 Help Explore Patients Presenting With Brain White Matter Hyperintensities. Front. Immunol. 13:864133. doi: 10.3389/fimmu.2022.864133
Received: 28 January 2022; Accepted: 01 March 2022;
Published: 25 March 2022.
Edited by:
Darin T. Okuda, University of Texas Southwestern Medical Center, United StatesCopyright © 2022 Levraut, Landes, Mondot, Cohen, Bresch, Brglez, Seitz-Polski and Lebrun-Frenay. This is an open-access article distributed under the terms of the Creative Commons Attribution License (CC BY). The use, distribution or reproduction in other forums is permitted, provided the original author(s) and the copyright owner(s) are credited and that the original publication in this journal is cited, in accordance with accepted academic practice. No use, distribution or reproduction is permitted which does not comply with these terms.
*Correspondence: Michael Levraut, bWljaGFlbC5sZXZyYXV0QGdtYWlsLmNvbQ==