 Jie Jiang1
 Xinli Zhan1
 Haishun Qu2
 Tuo Liang1Hao Li1Liyi Chen1Shengsheng Huang1Xuhua Sun1Wenyong Jiang1Jiarui Chen1
 Tianyou Chen1Yuanlin Yao1Shaofeng Wu1Jichong Zhu1
 Chong Liu1*
- 1Department of Spinal Orthopedic Surgery, The First Clinical Affiliated Hospital of Guangxi Medical University, Nanning, China
- 2Department of Traditional Chinese Medicine, The People’s Hospital of Guangxi Zhuang Autonmous Region, Nanning, China
Introduction: The specific pathogenesis of ankylosing spondylitis (AS) remains unclear, and our study aimed to investigate the possible pathogenesis of AS.
Materials and Methods: Two datasets were downloaded from the GEO database to perform differentially expressed gene analysis, GO enrichment analysis, KEGG pathway analysis, DO enrichment analysis, GSEA analysis of differentially expressed genes, and construction of diagnostic genes using SVM and WGCNA along with Hypoxia-related genes. Also, drug sensitivity analysis was performed on diagnostic genes. To identify the differentially expressed immune genes in the AS and control groups, we analyzed the composition of immune cells between them. Then, we examined differentially expressed genes in three AS interspinous ligament specimens and three Degenerative lumbar spine specimens using high-throughput sequencing while the immune cells were examined using the neutrophil count data from routine blood tests of 1770 HLA-B27-positive samples and 7939 HLA-B27-negative samples. To assess the relationship between ANXA3 and SORL1 and disease activity, we took the neutrophil counts of the first 50 patients with above-average BASDAI scores and the last 50 patients with below-average BASDAI scores for statistical analysis. We used immunohistochemistry to verify the expression of ANXA3 and SORL1 in AS and in controls.
Results: ANXA3 and SORL1 were identified as new diagnostic genes for AS. These two genes showed a significant differential expression between AS and controls, along with showing a significant positive correlation with the neutrophil count. The results of high-throughput sequencing verified that these two gene deletions were indeed differentially expressed in AS versus controls. Data from a total of 9707 routine blood tests showed that the neutrophil count was significantly higher in AS patients than in controls (p < 0.001). Patients with AS with a high BASDAI score had a much higher neutrophil count than those with a low score, and the difference was statistically significant (p < 0.001). The results of immunohistochemistry showed that the expression of ANXA3 and SORL1 in AS was significantly higher than that in the control group.
Conclusion: Upregulated of ANXA3, SORL1, and neutrophils may be a key factor in the progression of Ankylosing spondylitis.
Introduction
Ankylosing spondylitis (AS) is a chronic inflammatory disease whose cause is not fully understood (1, 2). Compared to other inflammatory diseases, the innate immune system plays a dominant role in AS. Additionally, biomechanical factors (e.g., periosteal microdamage) may also play an important role in the pathogenesis of joint manifestations of AS with the immune cells in the periosteum having a link to genetic susceptibility, chronic inflammation, and local damage (3). More than half the population with AS is male, along with genetic susceptibility in more than 90%. The strongest genetic link of AS is with HLA-B27 (4). AS can lead to the development of spinal ankylosis and cause structural damage, which is irreversible (5). The pathological changes and osteoimmunological features of AS mainly include osteolytic bone destruction and osteogenic changes. The interaction of T cells, B cells, osteoblasts, and osteoclasts together regulate the pathogenesis of AS (6). More importantly, the long course of AS as a chronic inflammatory disease makes the emotional and financial devastation of the patient unbearable. Thus, there is an urgent need to find more accurate biomarkers for pre-diagnosis and possible pathogenesis of AS.
Immune cell infiltration plays an important role in inflammatory diseases. Kidney damage has been leading to chronic inflammation, causing an imbalance between infiltrating immune cells and resident cells (7). Furthermore, in human autoimmune systemic diseases, the persistence of an activated autoreactive B-cell response, triggered by the persistence of autoreactive B cells, is considered a key factor in the development of rheumatoid arthritis (8). The T-cell profile is determined by the differential expression and specific functions of the cytokines, surface antigens, and transcription factors, while the defects in unconventional T cells are particularly relevant to autoimmunity and chronic inflammation (9). However, studies are also available on immune cells involved in diseases that appear to be very precisely articulated not just in rheumatoid arthritis and chronic inflammatory nephrotic injury but also in many other diseases (10–12). Interestingly, research is still insufficient on this aspect of AS, where specific mechanisms need further elucidation for AS as an immune-mediated and continuously progressive disease.
Hypoxia is an important feature of the immune ecology of human physiology and pathology, and the effects of hypoxia on immunity and inflammation may vary depending on the immune processes and microenvironment occurring in specific ecological niches (13). In rheumatoid arthritis, the highly dysregulated structure of the microvascular system results in inadequate synovial oxygenation, which continues to increase with the metabolic turnover of the expanding synovial vascular cataract, resulting in a hypoxic microenvironment (14). Osteoarthritis (OA), a common aging-related disease, is caused by an imbalance between extracellular matrix degradation and and formation, and an abnormal chondrocyte metabolism in response to changes in the inflammatory microenvironment may play a key role in cartilage degeneration and OA progression; under environmental stress conditions, chondrocytes may adapt to changes in the microenvironment by altering metabolic pathways, which may be oxidative phosphorylation to glycolysis (15, 16). However, the specific mechanisms by which hypoxia plays a role in the development of ankylosing spondylitis, a chronic inflammatory disease, remain unclear, and there is little research on hypoxia in AS.
Our research aimed to explore the genes closely related to Hypoxia and immunity in AS using a bioinformatics approach along with searching new diagnostic genes for AS and the impact of immune cells on it. It is necessary to investigate in depth the important role assumed by hypoxia genes in AS and the relationship with the interaction with immune cells.
Materials and Methods
Data Download and Processing
We downloaded two AS datasets from the Gene Expression Omnibus (GEO) repository for analyzing the possible diagnostic markers. GSE25101 (17) (https://www.ncbi.nlm.nih.gov/geo/query/acc.cgi?acc=GSE25101) dataset contained a total of 32 samples while the GSE73754 (18) (https://www.ncbi.nlm.nih.gov/geo/query/acc.cgi) dataset contained a total of 72 samples. We first matched the probe names of the two datasets to their corresponding gene symbols using the programming language PERL (v5.30.2) and then, de-batched and normalized the two datasets so that they could be analyzed at the same level. We combined the AS samples from both datasets and the control group into a single file for unified analysis. In this study, we used the turning language PERL for text processing and turning language R (version 4.0.2) for statistical analysis and drawing of images.
Differential Expression Analysis and Construction of Heat and Volcano Plots
To analyze the differentially expressed genes between the AS and control groups, we used the ‘limma’ package to carry out an in-depth analysis between the two groups. The cut-off values were set to |logFC|filter = 0.2 and adjusted to p < 0.05. The details of differentially expressed genes are given in Table 1. We also used the ‘pheatmap’ package to visualize differentially expressed genes as heat maps, while the ‘dplyr’ package, ‘ggplot2’ package, and ‘ggrepel’ package were used to visualize the genes with significant differential expression shown in the volcano maps.
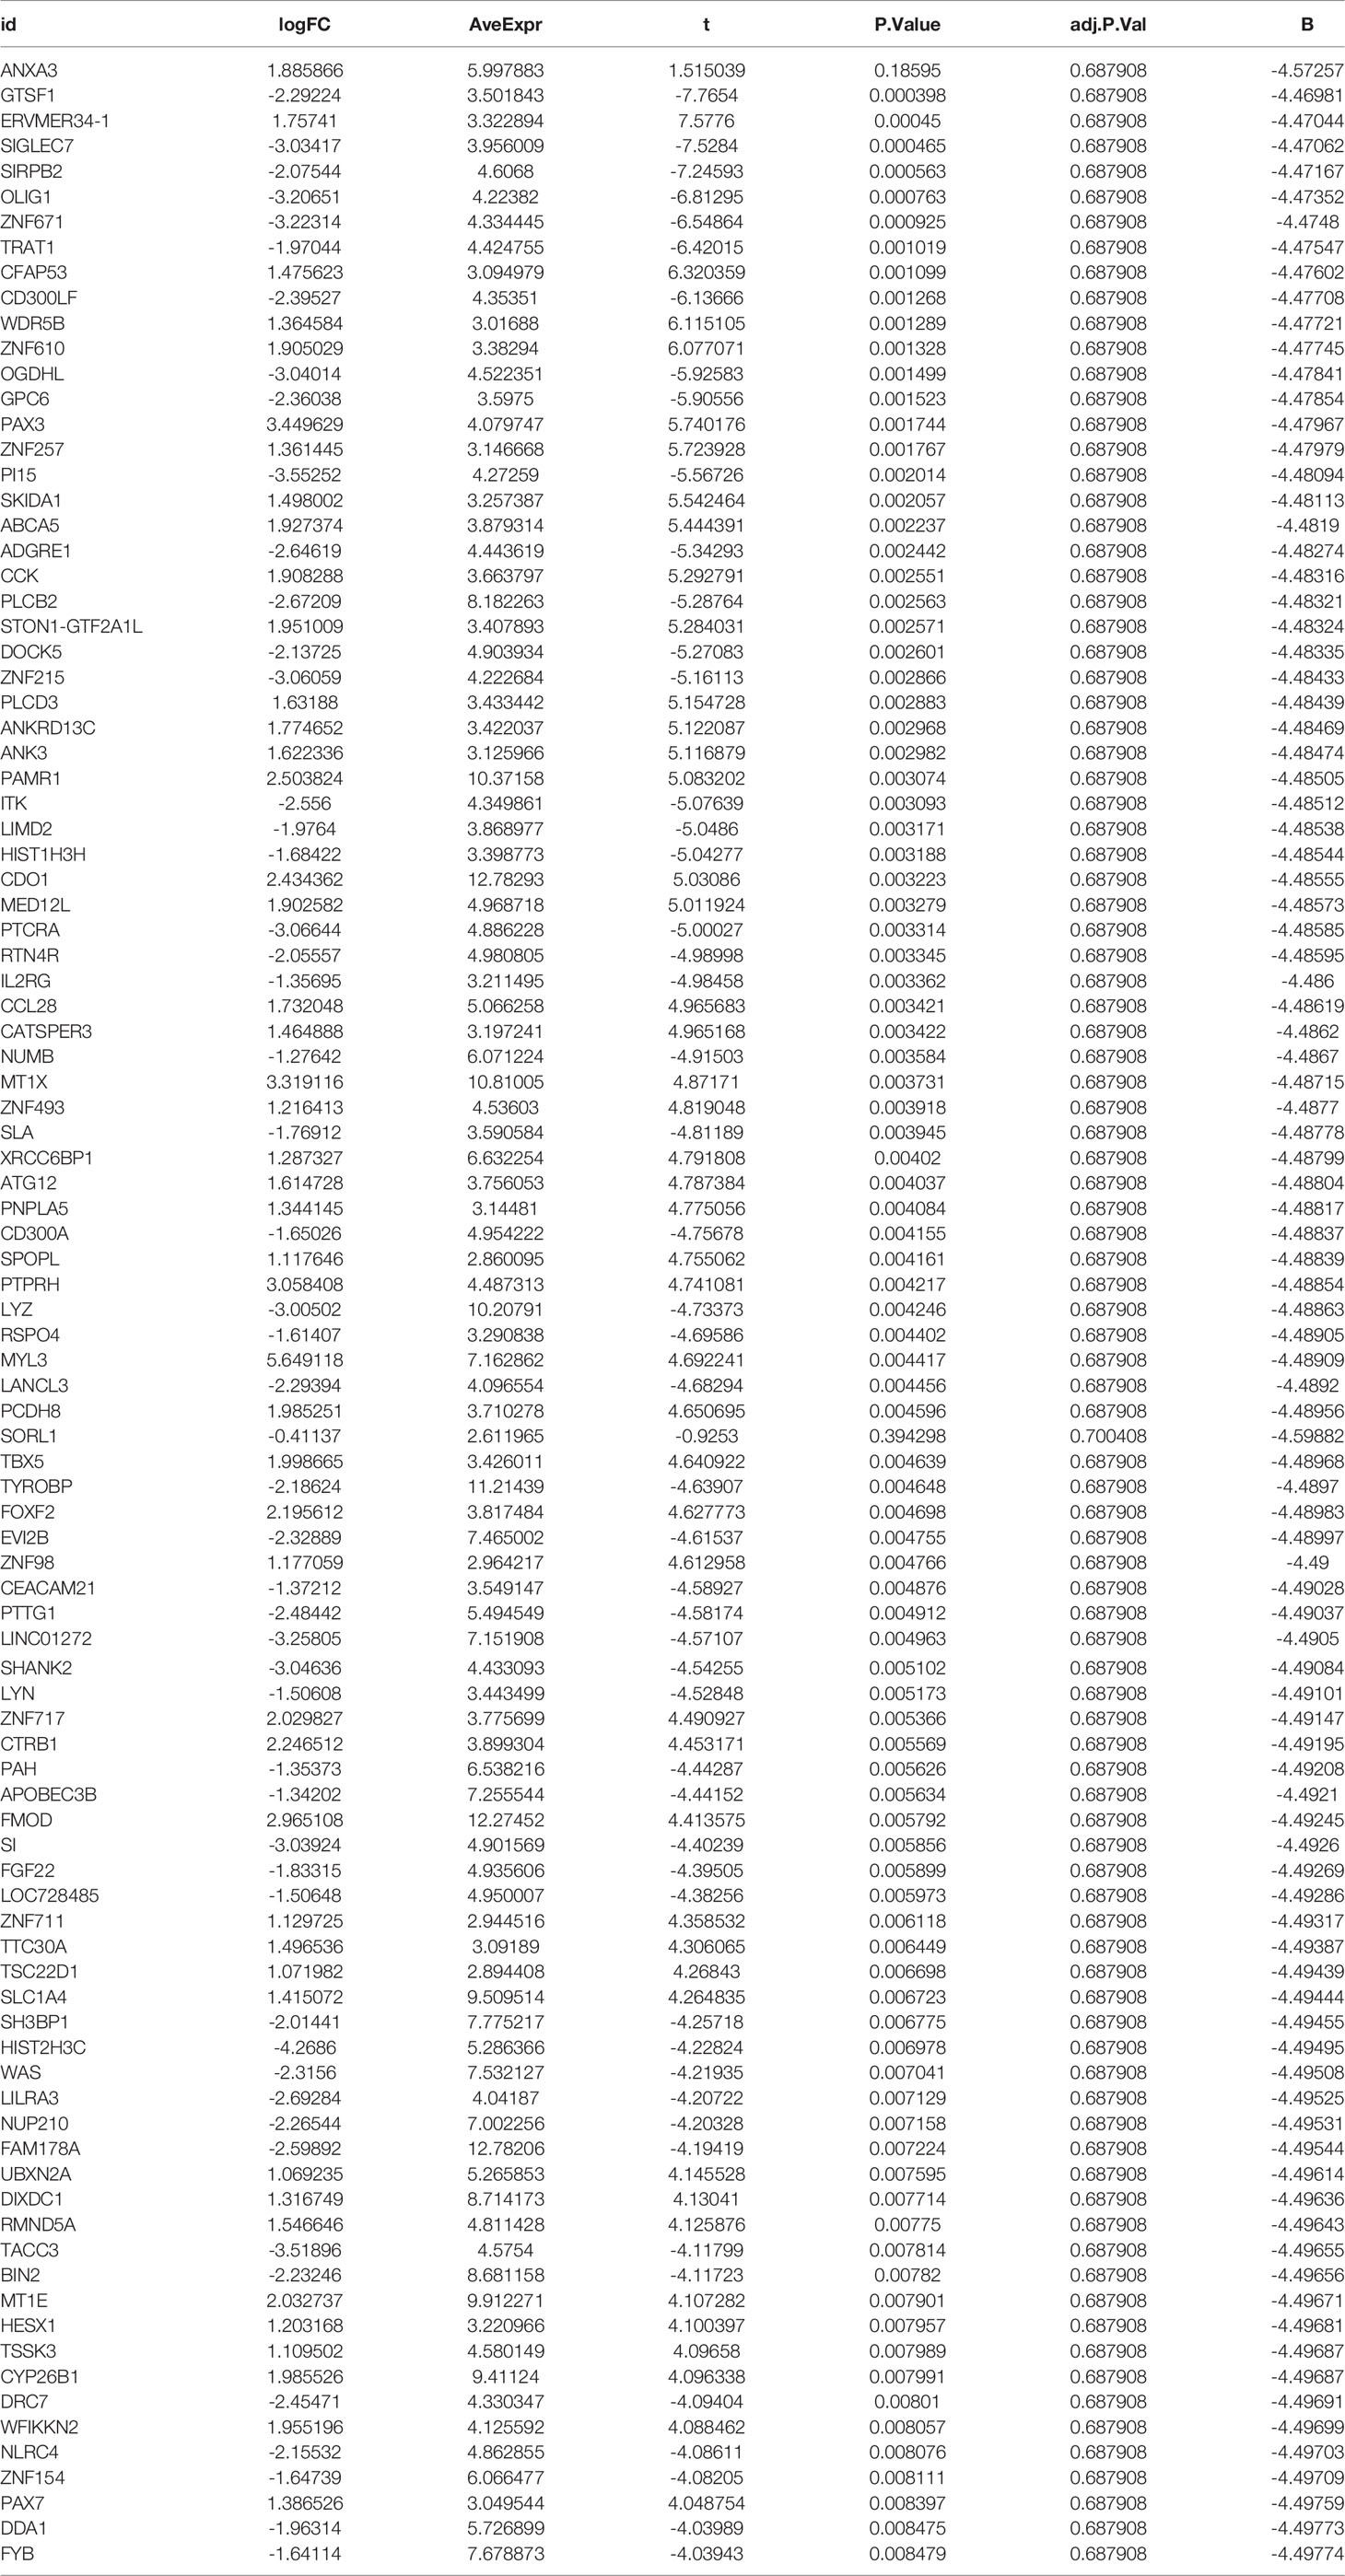
Table 1 List of differentially expressed genes in the GEO dataset.
GO Enrichment Analysis and KEGG Pathway Enrichment Analysis
To gain more insight into the molecular functions (MF), biological processes (BP), cellular composition (CC), and pathway enrichment of these differentially expressed genes, we performed GO enrichment and KEGG pathway analysis using the “clusterProfiler” package, “org.Hs.eg.db” package, “enrichplot” package, “ggplot2” package, and “GOplot” package. Here, the “enrichplot”, “ggplot2”, and “GOplot” packages were used for the GO enrichment and KEGG pathway enrichment analysis for differentially expressed genes. The cut-off values were set and adjusted to p < 0.05.
Disease Ontology Enrichment Analysis (DO) and Gene Set Enrichment Analysis (GSEA)
The DO enrichment analysis is important for understanding complex pathogenesis, diagnosis, and early prevention of major diseases (19–21). We used the ‘clusterProfiler’ package, ‘org.Hs.eg.db’ package, ‘enrichplot’ package, ‘ggplot2’ package, ‘GSEABase’ package, and ‘DOSE’ package to perform DO enrichment analysis and visualize the results of all differentially expressed genes. The GSEA enrichment analysis is a method used for genome-wide expression profiling of microarray data that integrates prior knowledge of localization, function, and biological significance of genes, which is used to construct a database of tags to understand their centralized expression (22–24). We used the ‘limma’ package, ‘org.Hs.eg.db’ package, ‘clusterProfiler’ package, and ‘enrichplot’ package to enrich the genes and visualize the results.
Weighted Gene Co-Expression Network Analysis (WGCNA), Support Vector Machine (SVM) Analysis, Hypoxia-Related Gene Construction Prognostic Models, and ROC Diagnostic Curves
WGCNA is a framework used for building and analyzing weighted gene coexpression networks. It is a very advanced bioinformatics analysis method that uses two-two variable correlation coefficients to study biological networks. It selects the ones that satisfy the scale-free network topology by calculating soft thresholds and also calculates the coefficient of dissimilarity of each node, thus, building hierarchical clustering trees and finally finding the target genes and gene networks (25–27). SVM analysis methods are a class of generalized linear classifiers that can perform binary classification of data in a supervised learning manner, where the decision convenience is the maximum margin plane that can be solved for the learned samples, i.e., the separation hyperplane solves the dataset that correctly divides it and also has the largest geometric separation (28–30). We downloaded Hypoxia-related genes from the GSEA database (http://www.gsea-msigdb.org/gsea/msigdb/search.jsp) for the in-depth analysis and used these two advanced bioinformatics analysis techniques with Hypoxia-associated genes to take intersections for subsequent analysis. To test the accuracy of the constructed diagnostic model, ROC diagnostic curves were constructed using the “pROC” package.
Drug Sensitivity Analysis
In order to better treat AS, a chronic inflammatory disease, and develop more drugs to improve the condition, we have performed an in-depth analysis of the drug sensitivity of genes closely related to AS and antineoplastic drugs in an attempt to find new drugs for better treatment of it. We downloaded gene expression files and drug sensitivity files from the CellMiner database (version: 2021.1, database: 2.6) and then used the “impute” package, the “limma” package, the “ggplot2” package and the “ggpubr” package for drug sensitivity analysis of ANXA3 and SORL1 for antitumor drugs.
CIBERSORT Immune Cell Composition Analysis, Differential Analysis, and Genetic Correlation Analysis
The CIBERSORT software was developed by extracting the expression of genes in the immune cells as a reference value, and then a linear model was used to predict the number of immune cells in the sample, while a permutation test was used to assess the significance of the results (31–33). We quantified the content of 22 immune cells and defined the total immune cell content of each sample as 100%. After assessing the significance using a permutation test, we used the “vioplot” package to visualize the immune cell differences between the AS and control samples as violin plots. The ‘limma’ package, ‘reshape2’ package, ‘ggpubr’ package, and ‘ggExtra’ package were used to correlate immune cells with the genes. Finally, we also Lollipop Charted the proportion of immune cells and their differences between the AS and control groups.
RNA Extraction, High-Throughput Sequencing, and Routine Blood Tests
To test the accuracy of our bioinformatics analysis, we performed a high-throughput sequencing analysis of three AS and three lumbar degenerative intervertebral ligament cases from the First Clinical Affiliated Hospital of Guangxi Medical University. The samples were taken intraoperatively for pathological testing and were used as external validation. This study was approved by the ethics department of the First Clinical Affiliated Hospital of Guangxi Medical University and was also compliant with the Declaration of Helsinki requirements for the analysis of intervertebral ligaments in anonymous patients. Therefore, this study also requested an exemption from patient informed consent. Inclusion criteria for the AS group were as follows: 1. AS with a posterior convexity deformity requiring surgical correction; 2. Patients who were not recently treated with medication or other modalities. The exclusion criteria included combined rheumatic disease and or with other serious organic diseases. Inclusion criteria for the lumbar degeneration group were as follows: 1. Those diagnosed with lumbar disc herniation and had reached the surgical threshold; 2. Those with a mild or normal loss of intervertebral space height with no bone destruction. The detailed baseline information for all cases can be found in Table 2. We first extracted the total RNA using the mirVana™ miRNA Isolation kit and then tested the quality of total RNA. After several laboratory operations such as cRNA synthesis and labeling, hybridization and washing, and microarray scanning, we obtained all mRNA expressions between the AS and lumbar degeneration groups. We then used the “limma” package to analyze the differentially expressed genes with the cut-off value set as before, which was |logFC|filter = 0.2, adjusted to p < 0.05. Having obtained all the differentially expressed genes, we placed the details of externally validated differentially expressed genes in Table 3. On the other hand, we also collected data on neutrophils, hematocrit, red blood cells, and white blood cells from 1770 HLA-B27-positive cases and 7939 HLA-B27-negative cases obtained from the First Clinical Affiliated Hospital of Guangxi Medical University and also statistically analyzed the two groups using the two independent samples t-test in SPSS 25. Finally, we visualized them using the R software. We also collected the Bath Ankylosing Spondylitis Disease Activity Index (BASDAI) (34) from 199 AS cases to assess disease activity in AS patients. We statistically analyzed the neutrophil counts of the first 50 patients with above-average BASDAI scores with the neutrophil counts of the last 50 patients with below-average BASDAI scores. In addition, we performed a correlation analysis of data from 1717 cases with complete data on both neutrophil and CRP blood routine examinations.
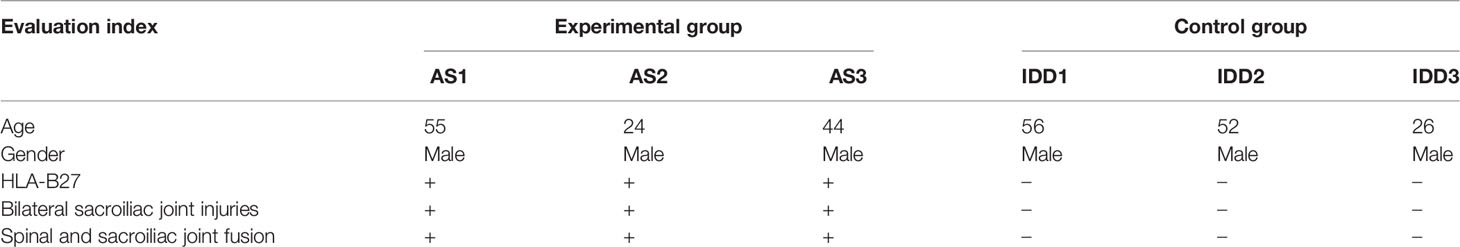
Table 2 Baseline information of all cases by high-throughput sequencing.
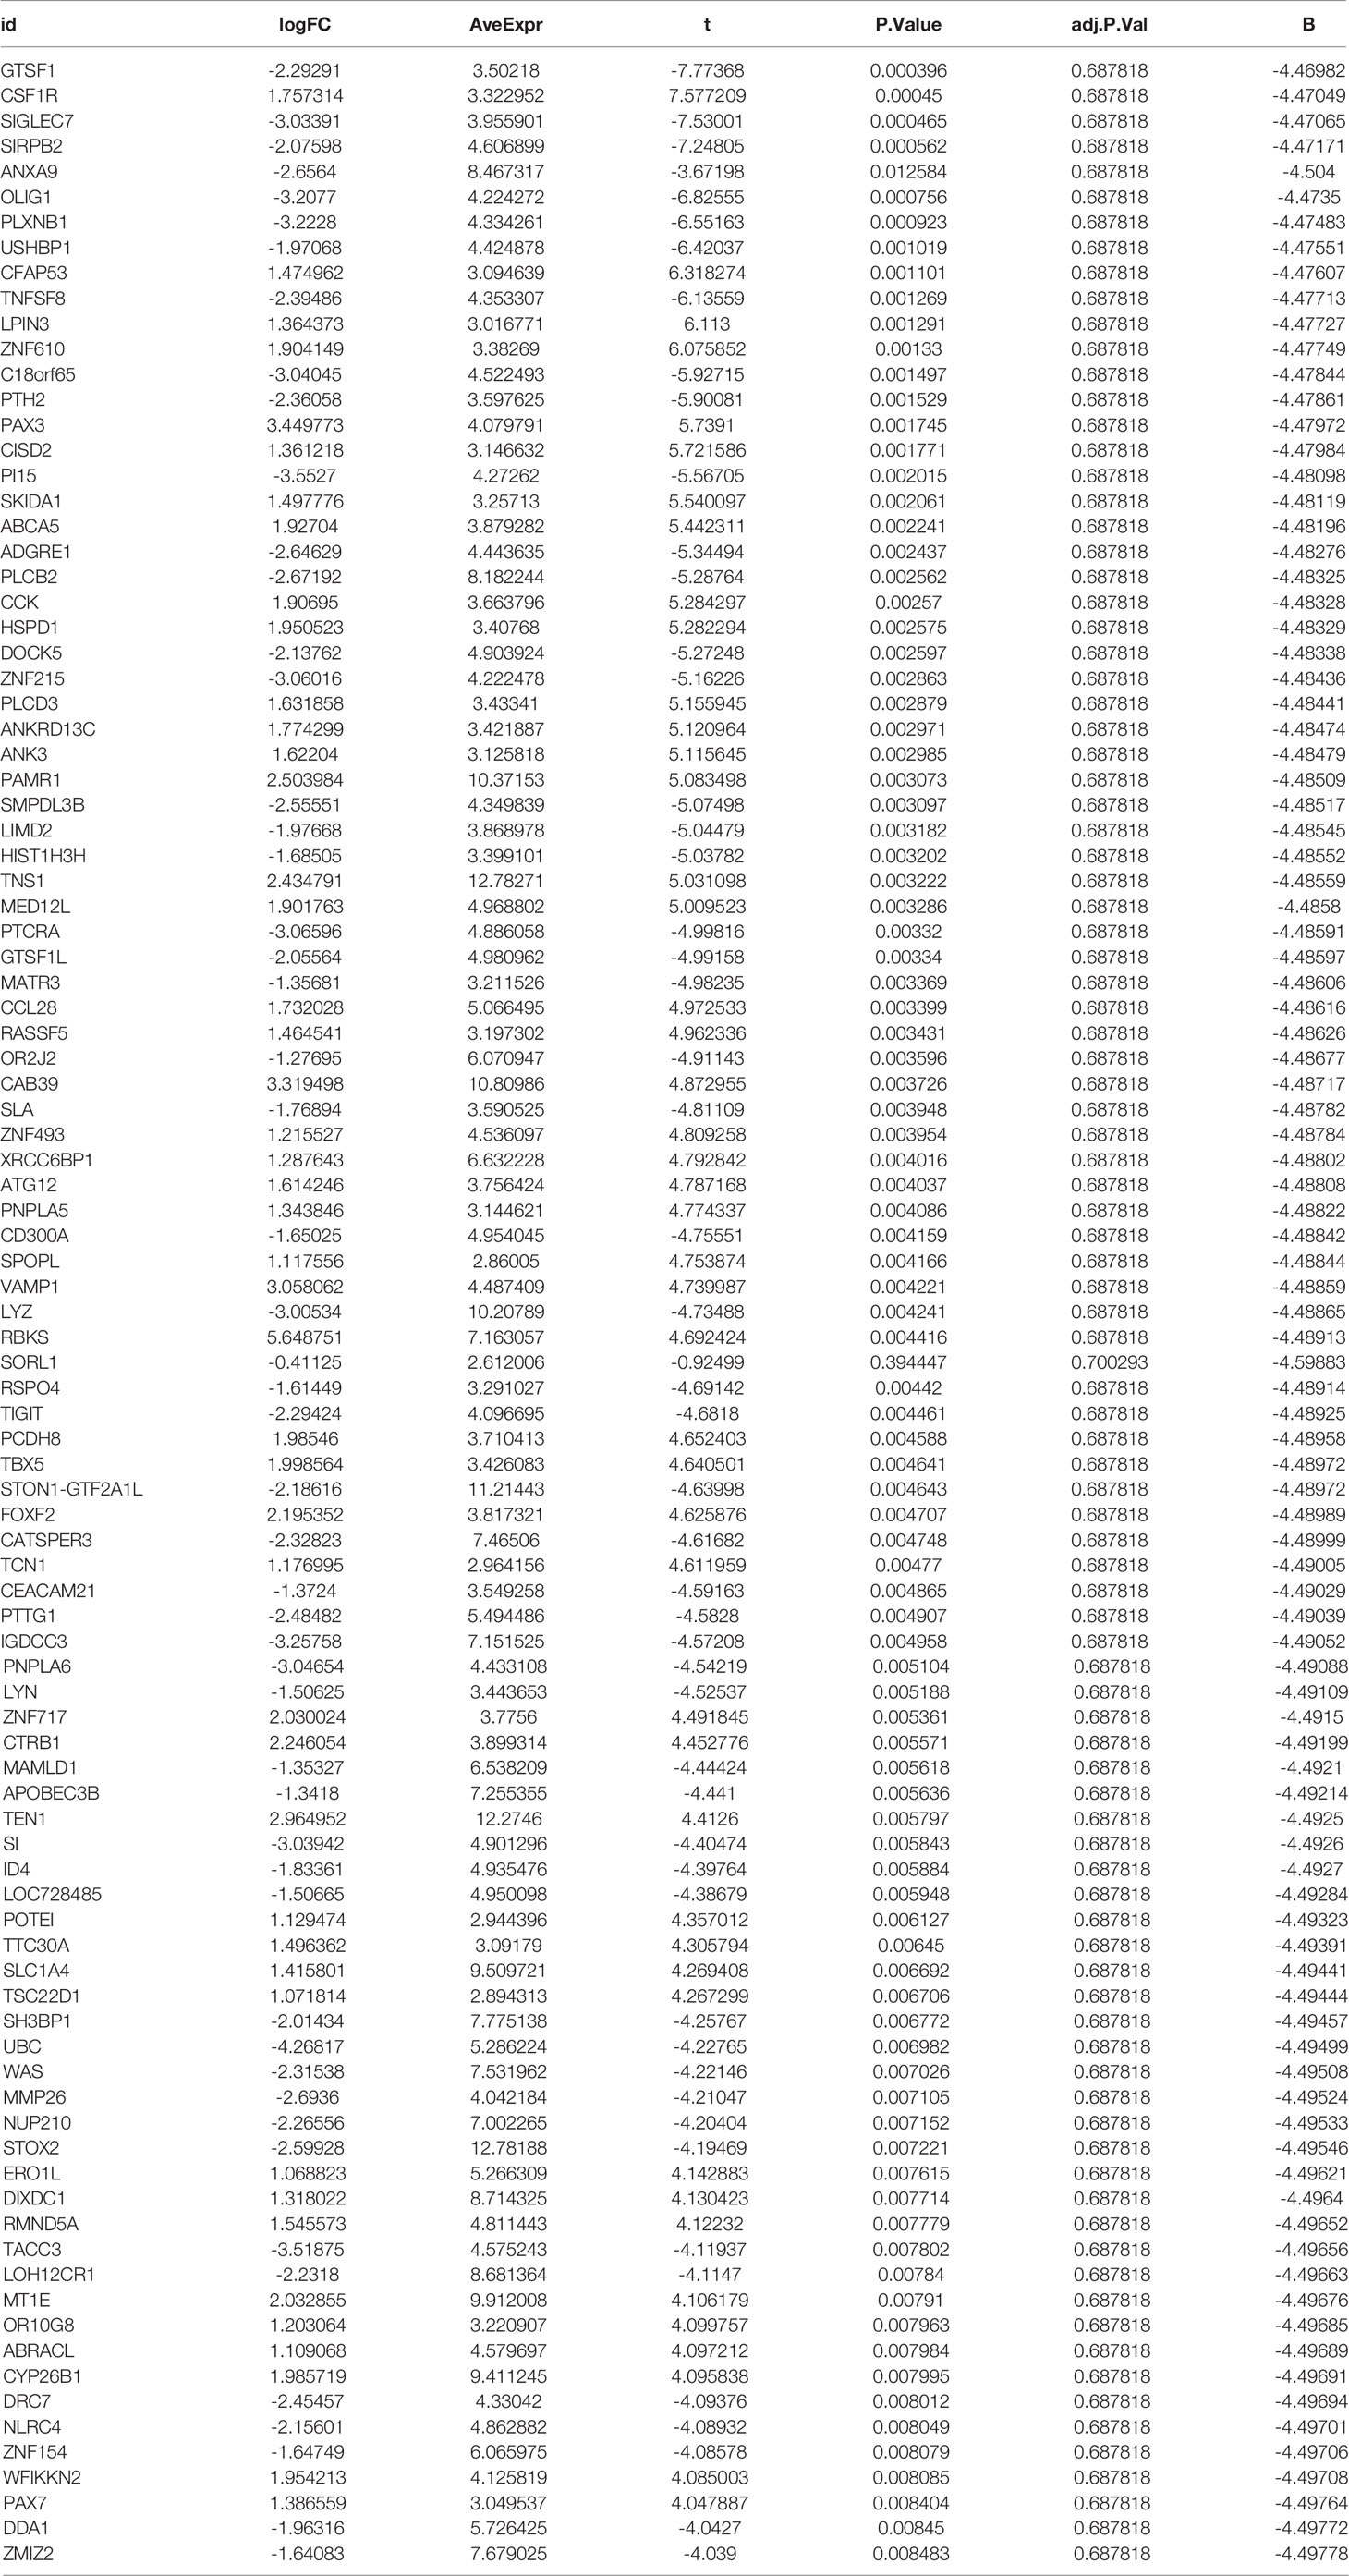
Table 3 List of differentially expressed genes by high-throughput sequencing.
Immunohistochemical Analysis
Here, five cases of interspinous ligaments diagnosed as AS with kyphosis and resected during surgery at the First Clinical Affiliated Hospital of Guangxi Medical University were used as the experimental group, and three cases of interspinous ligaments diagnosed as spinal fracture and resected during surgery were used as the normal control group to examine the differences in the expression of ANXA3 and SORL1 between the AS and control groups. The baseline information table for cases used for immunohistochemistry can be found in Table 4. Antibodies specific to ANXA3 for specific staining were purchased from the Proteintech (https://www.ptgcn.com/products/ANXA3-Antibody-11804-1-AP.htm, Catalog number: 11804-1-AP), dilution ratio of 1:200. SORL1-specific antibody was purchased from the abcam company (https://www.abcam.cn/sorlasorl1-antibody-epr14670-ab190684.html, item number: ab190684), dilution ratio of 1:1000. After the interspinous ligament tissue was isolated, we preserved it by immersing it in formalin solution within 10 minutes. Subsequently, we obtained all 16 immunohistochemical sections with completed staining after laboratory operations such as wax sealing, sectioning, antigen repair, antibody hybridization, color development, and sealing of the tissue. We performed observation under an inverted microscope, and image interceptions were performed separately for the AS and control groups. We assessed the positivity of all immunohistochemical images using Image J software and performed statistical analysis of the positivity of ANXA3 and SORL1 in the AS and control groups separately using IBM SPSS Statistics 25 independent samples t-test.
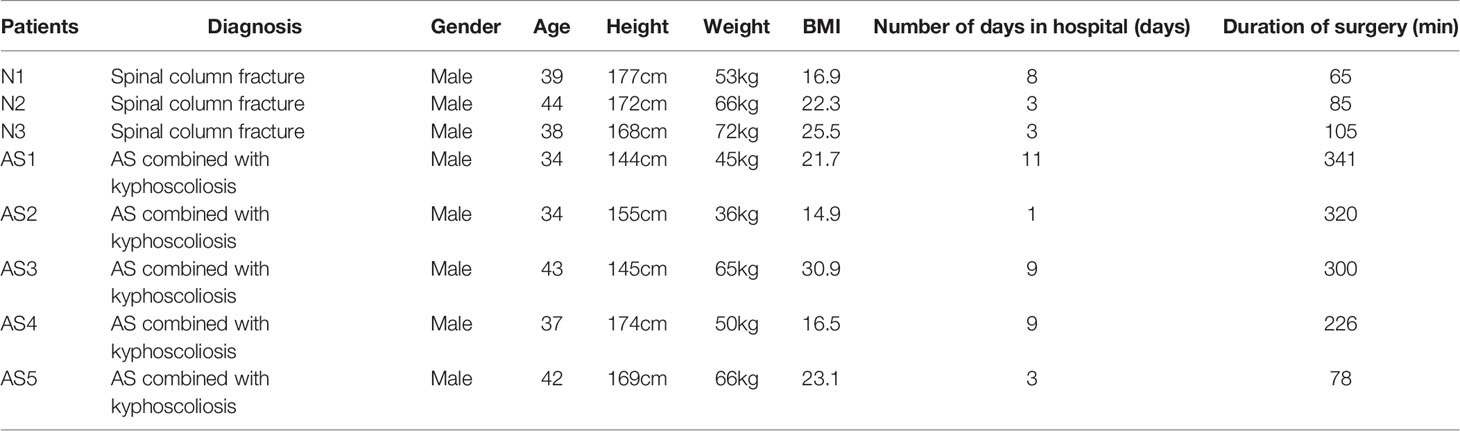
Table 4 Baseline information of the patients used for immunohistochemical analysis.
Results
Data Download and Processing, Differential Expression Analysis, Construction of Heat Map and Volcano Map
We downloaded the two datasets, GSE25101 and GSE73754, from the GEO database that contained a total of 68 AS samples and 36 control samples. After removing inter-batch differences and normalizing the two datasets, we merged the two datasets for analysis. We obtained a list of differentially expressed genes after performing differential expression analysis of gene expressions in AS cases versus control samples and found a total of 295 differentially expressed genes, where the first 100 genes with significant differences were visualized as a heat map, and are shown in Figure 1A. The first 50 genes showed higher expression in the AS group than in the control group, while the last 50 genes showed higher expression in the control group than in the AS group. We visualized the differentially expressed genes as a volcano plot (Figure 1B), which identified 166 highly expressed genes and 129 low expressing genes.
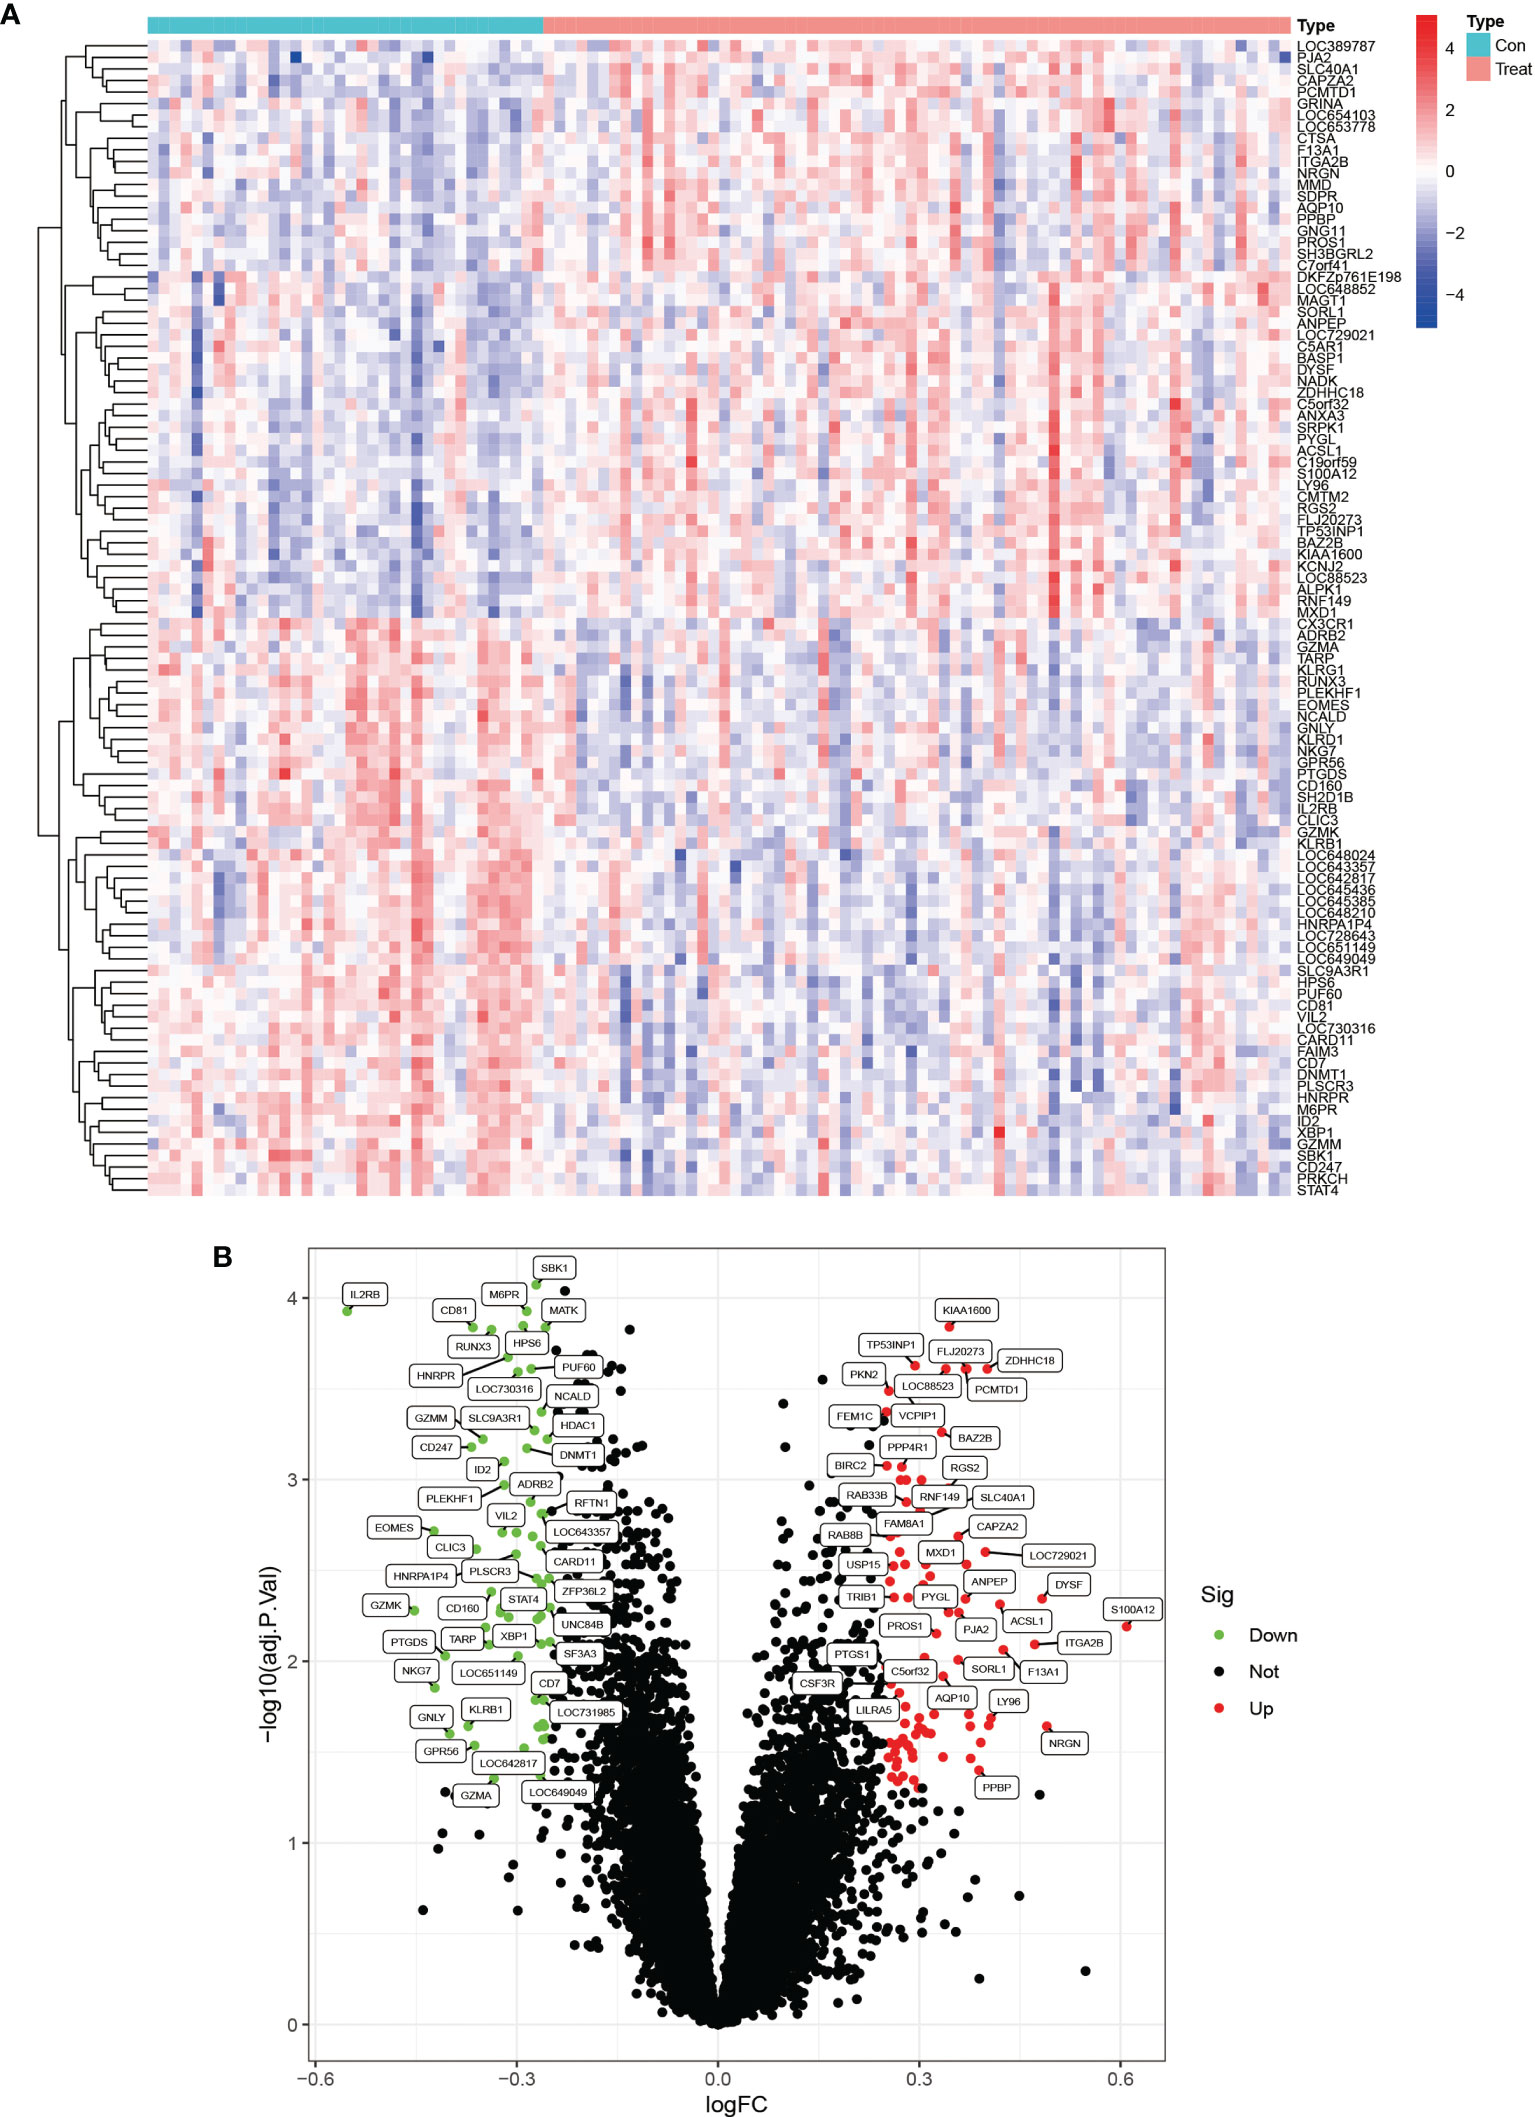
Figure 1 Heat map and volcano plots of differentially expressed genes. (A) shows the heat map of differentially expressed genes, red indicates high expression genes and blue indicates low expression genes. (B) shows the volcano plots of differentially expressed genes, red is for high expression genes and green is for low expression genes.
GO Enrichment and KEGG Pathway Enrichment Analysis Revealed a Strong Association With Neutrophils and Osteoblasts
We performed the GO enrichment analysis on these differentially expressed genes to analyze their BP, CC, and MF and obtained the results of all enrichment analyses along with visualizing the top 10 most significant ones (Figure 2A). Figure 2A showed that the GO entries were mainly enriched in neutrophil degranulation, neutrophil activation involved in immune response, neutrophil-mediated immunity, regulation of toll−like receptor signaling pathway, I−kappaB kinase/NF−kappaB signaling, positive regulation of cytokine production, and regulation of response to the biotic stimulus. The KEGG pathway (Figure 2B) was mainly enriched in the phagosome, hematopoietic cell lineage, leishmaniasis, necroptosis, neutrophil extracellular trap formation, Th1 and Th2 cell differentiation, and osteoclast differentiation.
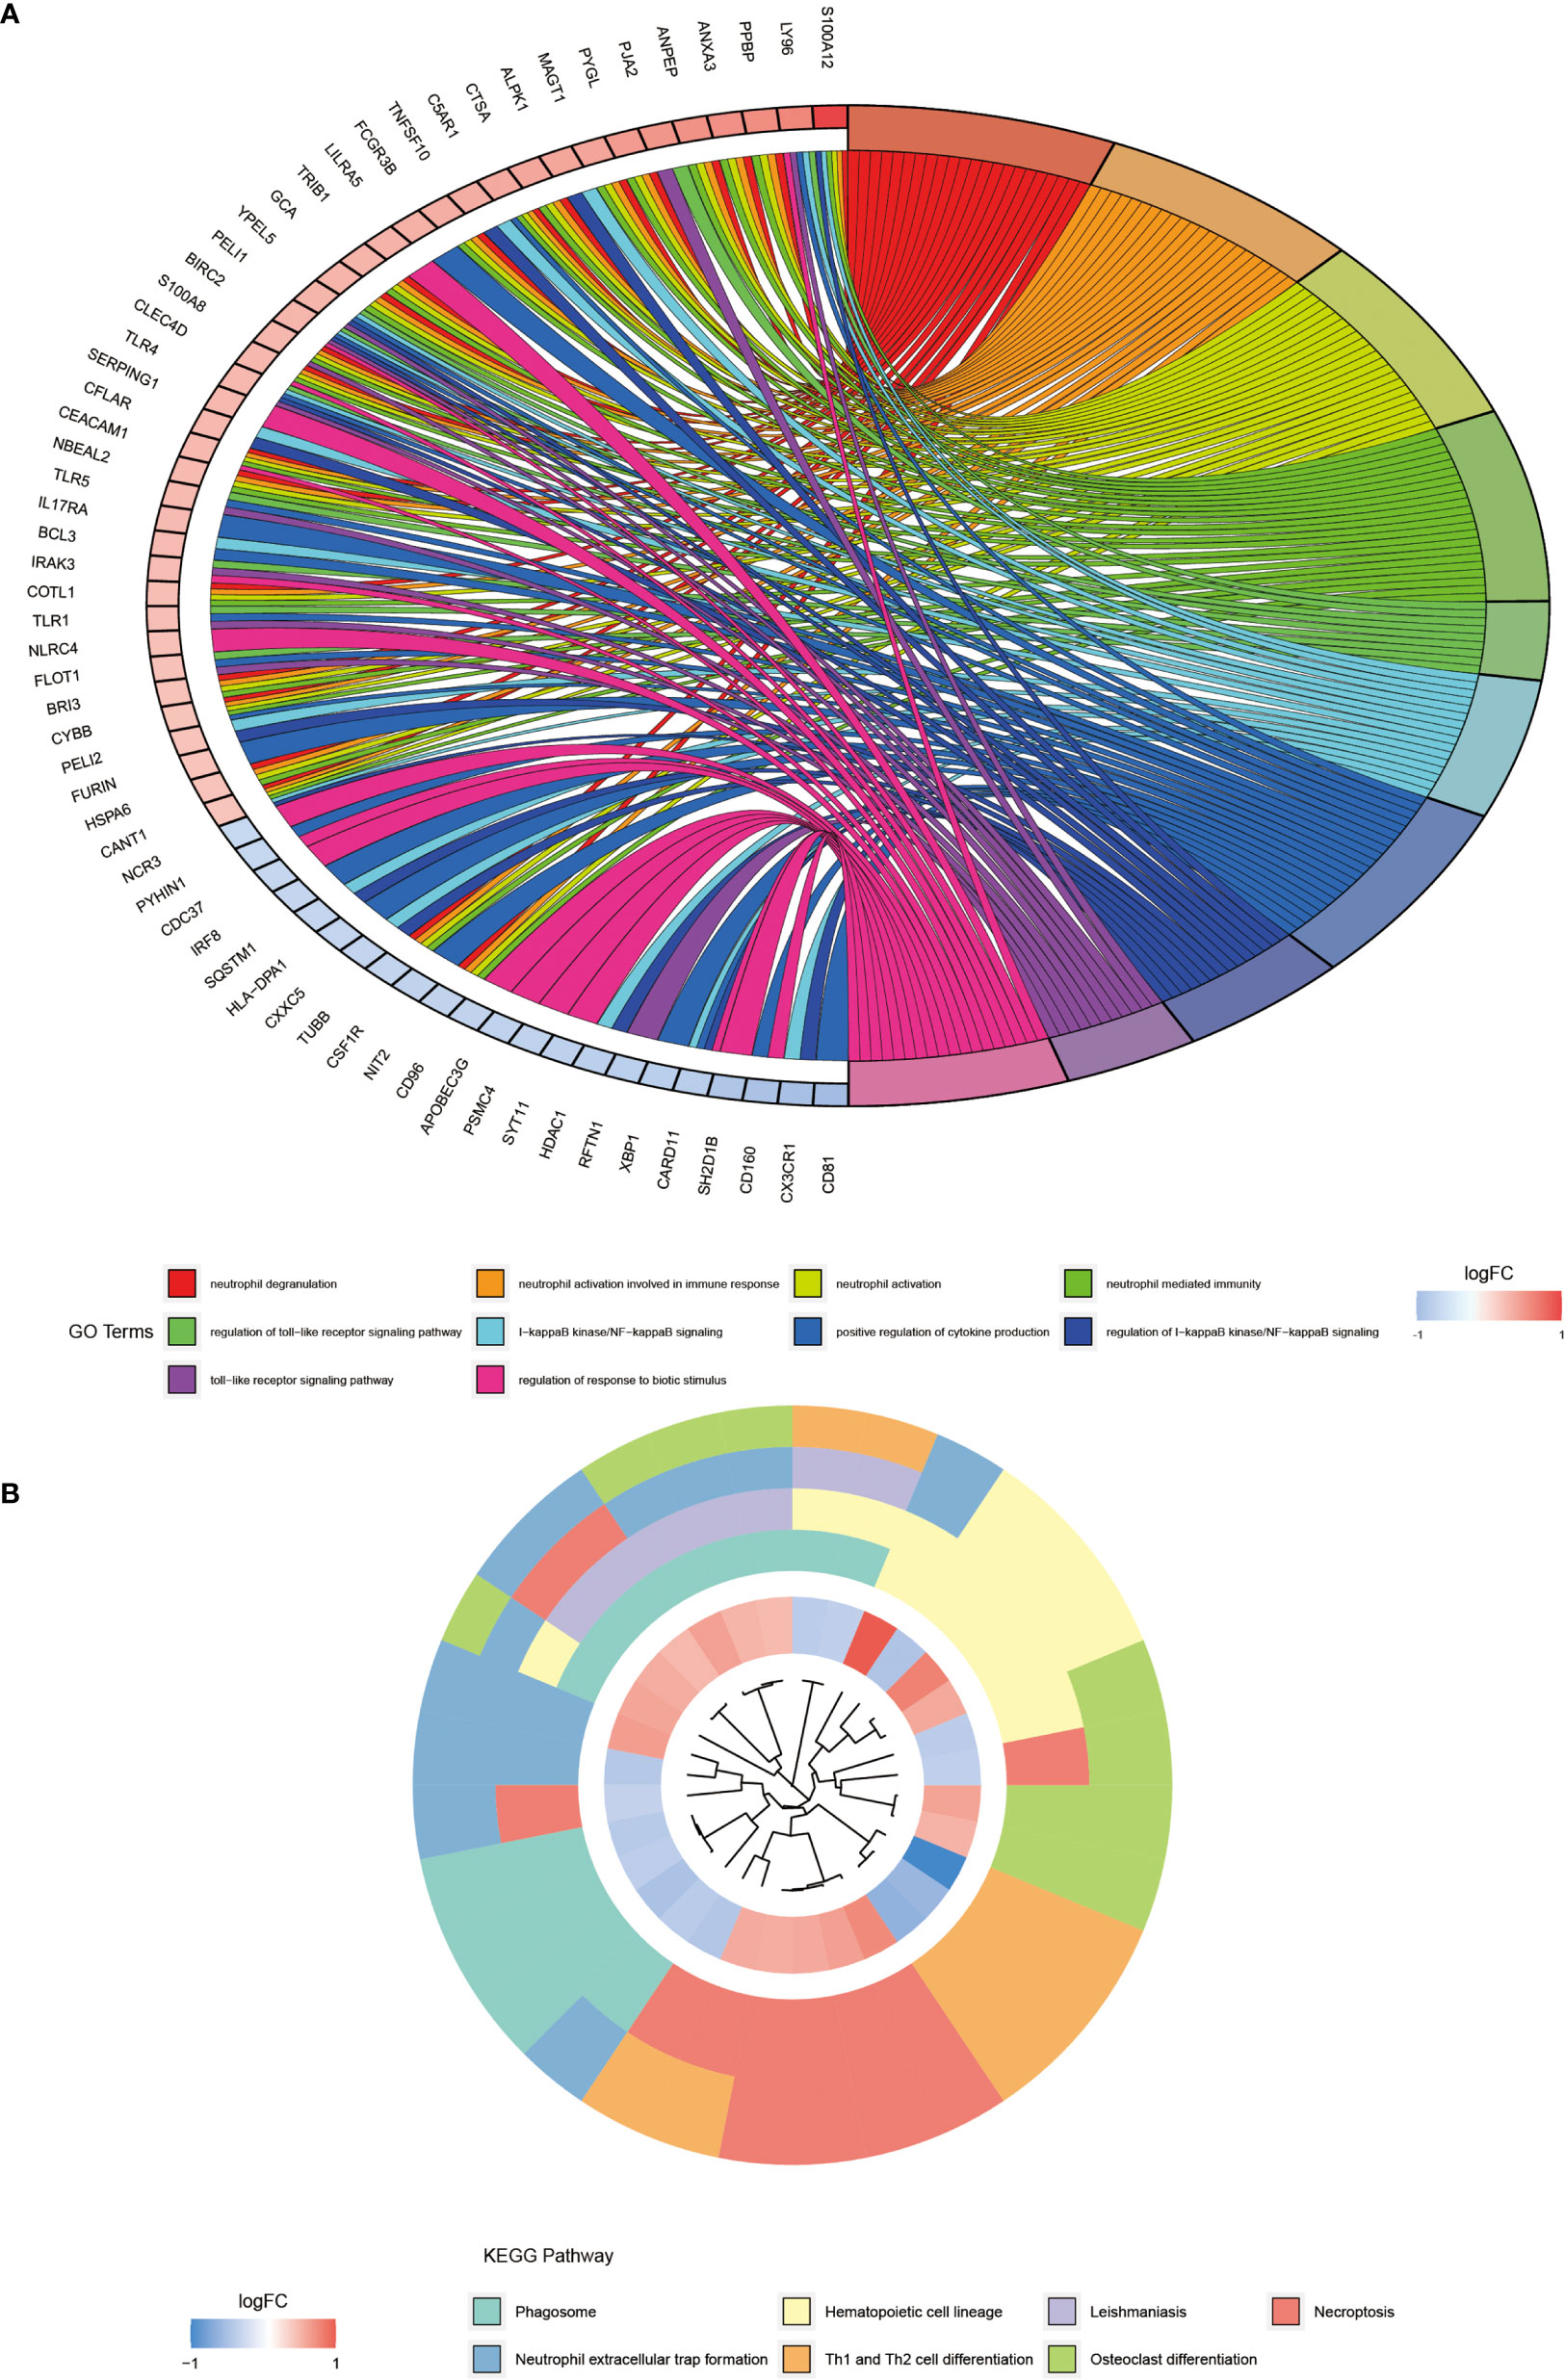
Figure 2 GO and KEGG pathway enrichment analysis of differentially expressed genes. (A) shows the first 10 entries of GO enrichment analysis of differentially expressed genes. (B) shows the top 7 pathways of KEGG pathway.
DO and GSEA Analysis Found Close Association With Multiple Inflammatory Diseases
The result of DO enrichment analysis (Figure 3E) showed enrichment mainly in primary immunodeficiency disease, muscle tissue disease, myopathy, phagocytic bactericidal dysfunction, blood platelet disease, cystic fibrosis, and vasculitis. The GSEA enrichment analysis of the AS group showed that the main pathway of GO enrichment was in the myeloid leukocyte-mediated immunity, actin cytoskeleton, secretory granule membrane, specific granule, and tertiary granule (Figure 3C), while the KEGG pathway was mainly enriched in the complement and coagulation cascades, ECM-receptor interaction, focal adhesion, leukocyte transendothelial migration, and toll-like receptor signaling pathway (Figure 3D).
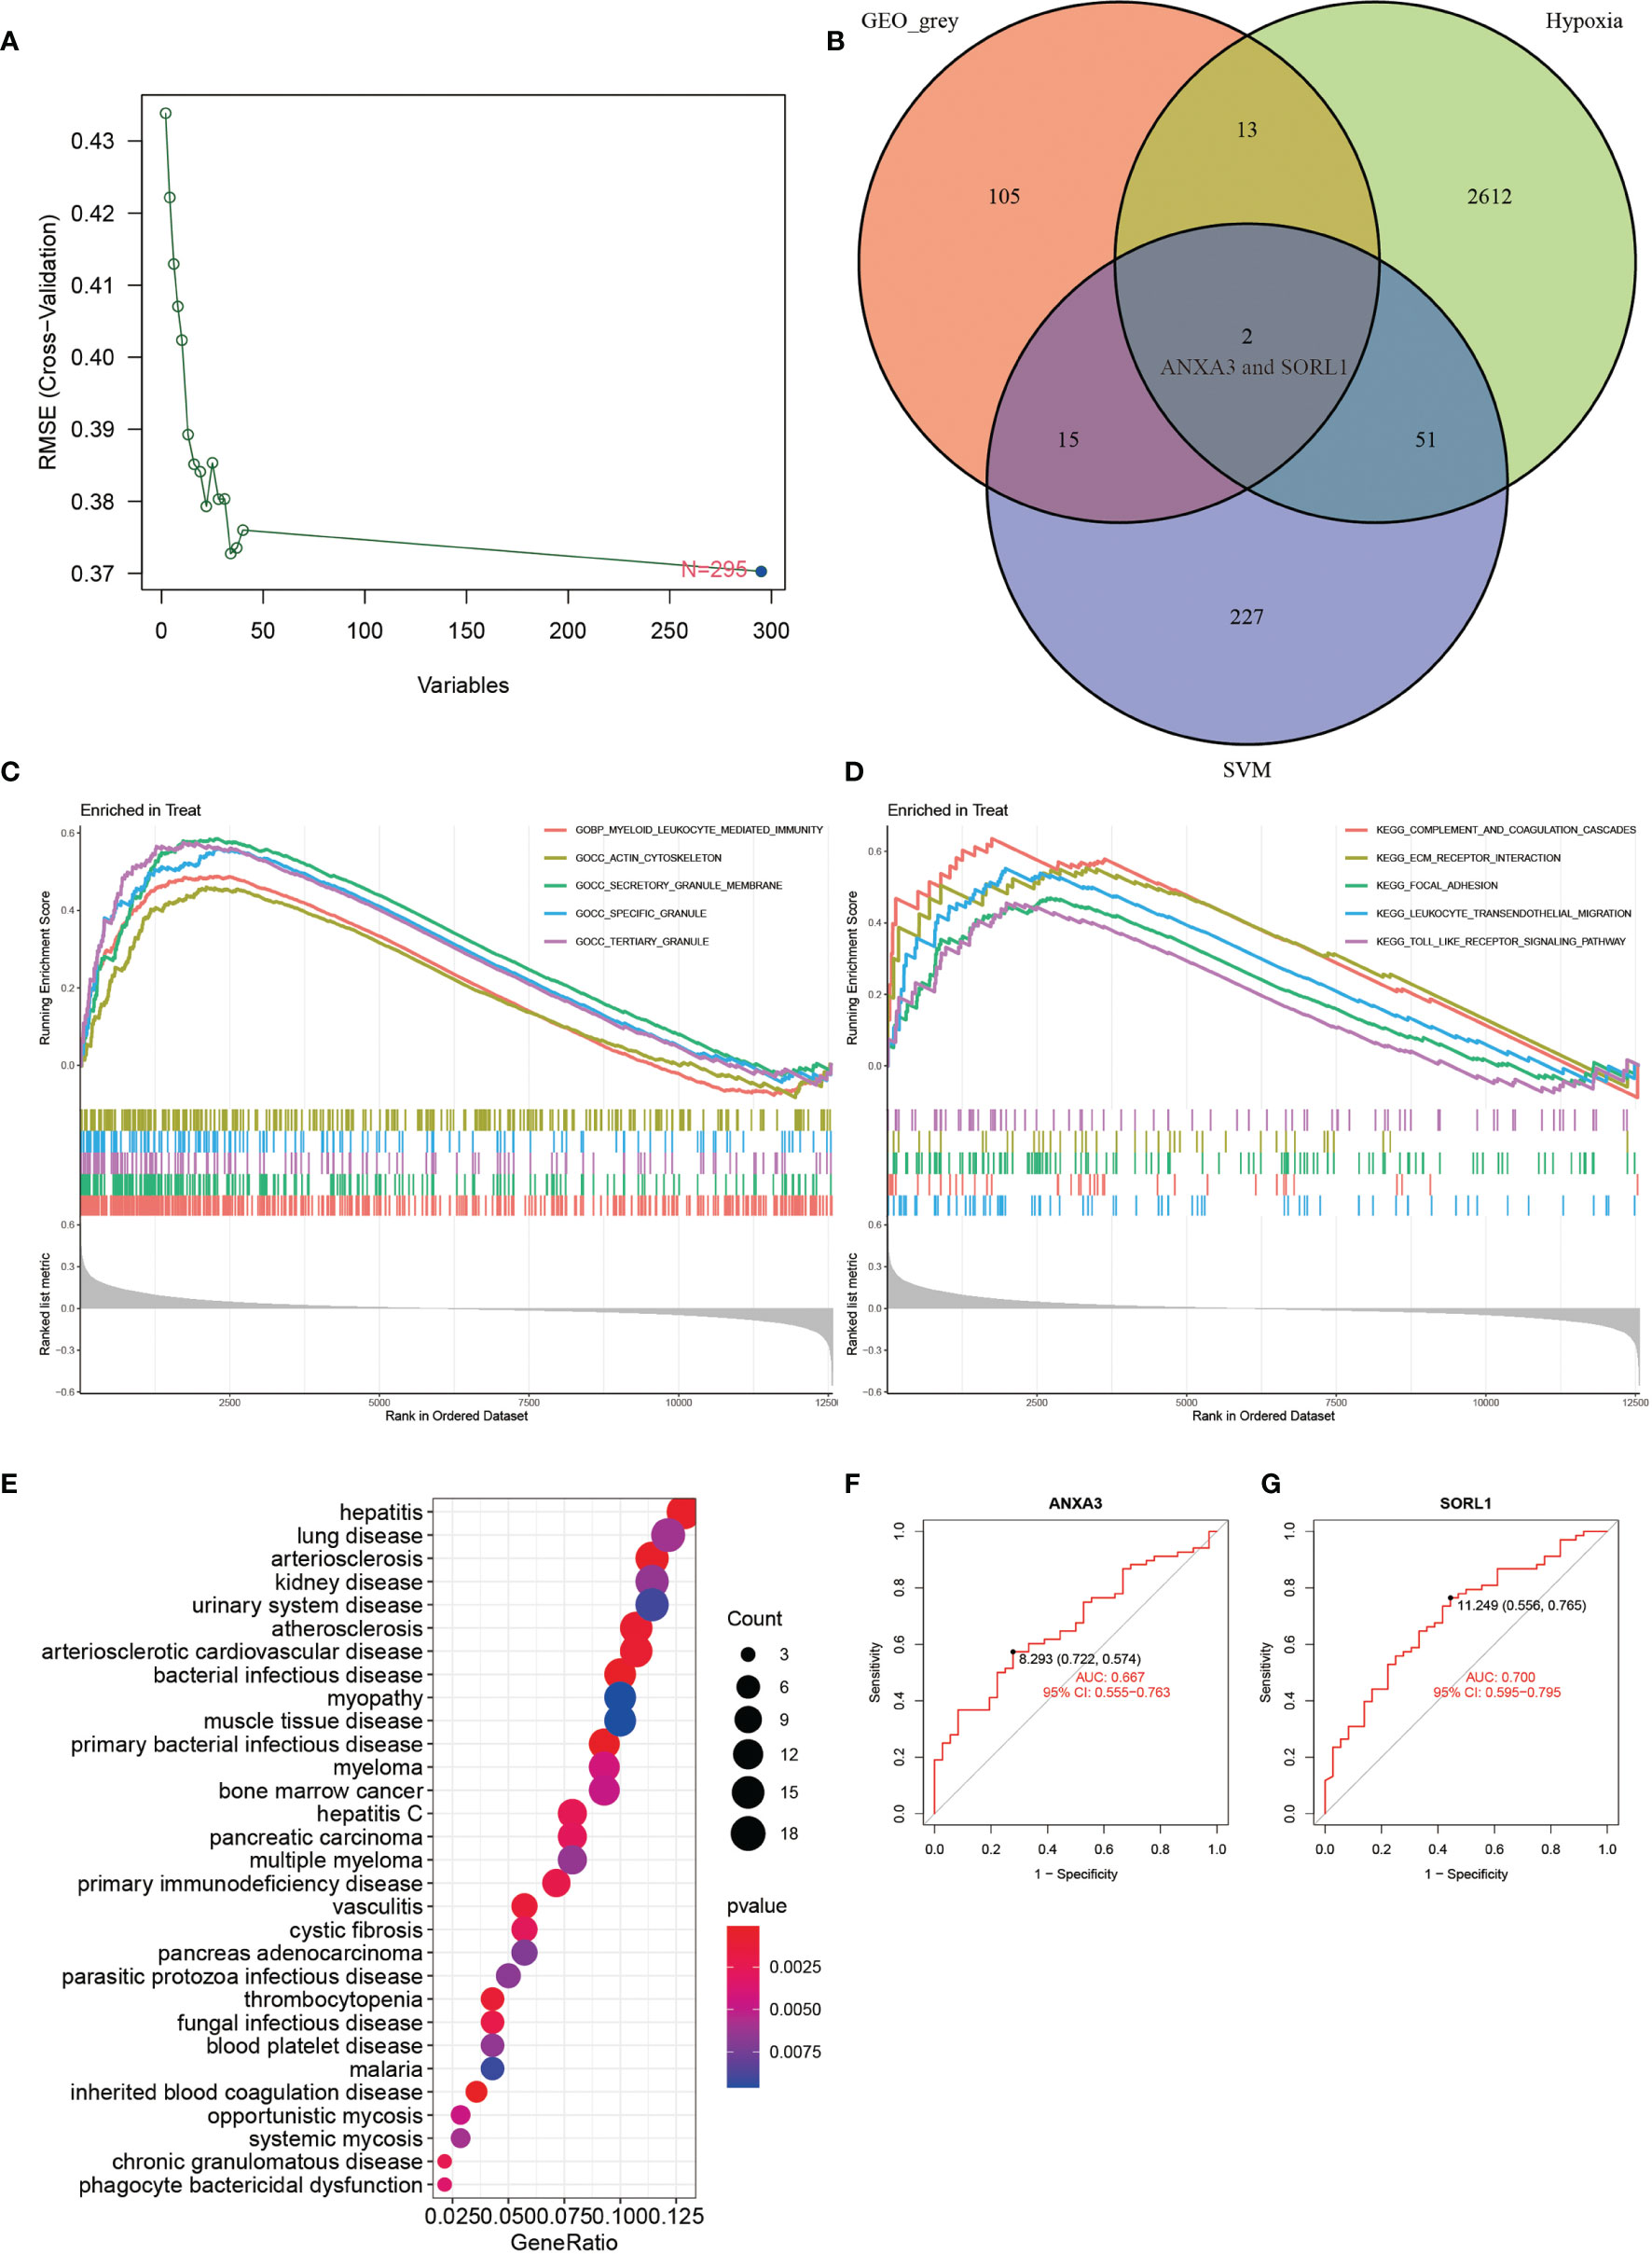
Figure 3 SVM analysis, GSEA, DO analysis, veen plot and ROC curve. (A) shows the results of SVM analysis. (B) shows the results of intersection of GEO_grey module, hypoxia-related genes and SVM analysis. (C, D) show the results of GO and KEGG from GSEA enrichment analysis. (E) shows the results of DO enrichment analysis. (F, G) show the ROC diagnostic curves of 2 genes of the model. (F, G) show the ROC curves of 2 genes of the model.
ANXA3 and SORL1 Are Genes Used as Diagnostic Models for AS
The results of WGCNA revealed (Figure 4) that the MEgrey module showed the highest Pearson correlation coefficient with AS (Figure 4G), resulting in a Cor value of 0.33 (p < 0.05). On the other hand, the SVM analysis of all differentially expressed genes showed that a total of 295 genes remained available for diagnosis in the model (Figure 3A). All human Hypoxia-associated genes were downloaded from the GSEA database, which contained a total of 207 Hypoxia-associated genes. We then constructed diagnostic models by taking the intersection of genes from the MEgrey module of WGCNA and obtained 295 genes from the SVM analysis along with 2678 Hypoxia-related genes. Our results showed that two genes, ANXA3 and SORL1, met all our screening requirements (Figure 3B). Subsequently, we constructed ROC diagnostic curves to test the results of our analysis and found that the area under the curve for the AS diagnostic model constructed by ANXA3 was 0.667 with a 95% CI of 0.558–0.765, specificity is 0.722 and sensitivity is 0.574 (Figure 3F). The area under the curve for the AS diagnostic model constructed by SORL1 was 0.700 with a 95% CI of 0.587-0.796, specificity of 0.556 and sensitivity of 0.765 (Figure 3G). The area under the ROC curve for both these genes was much greater than 0.5, indicating a more accurate diagnostic curve.
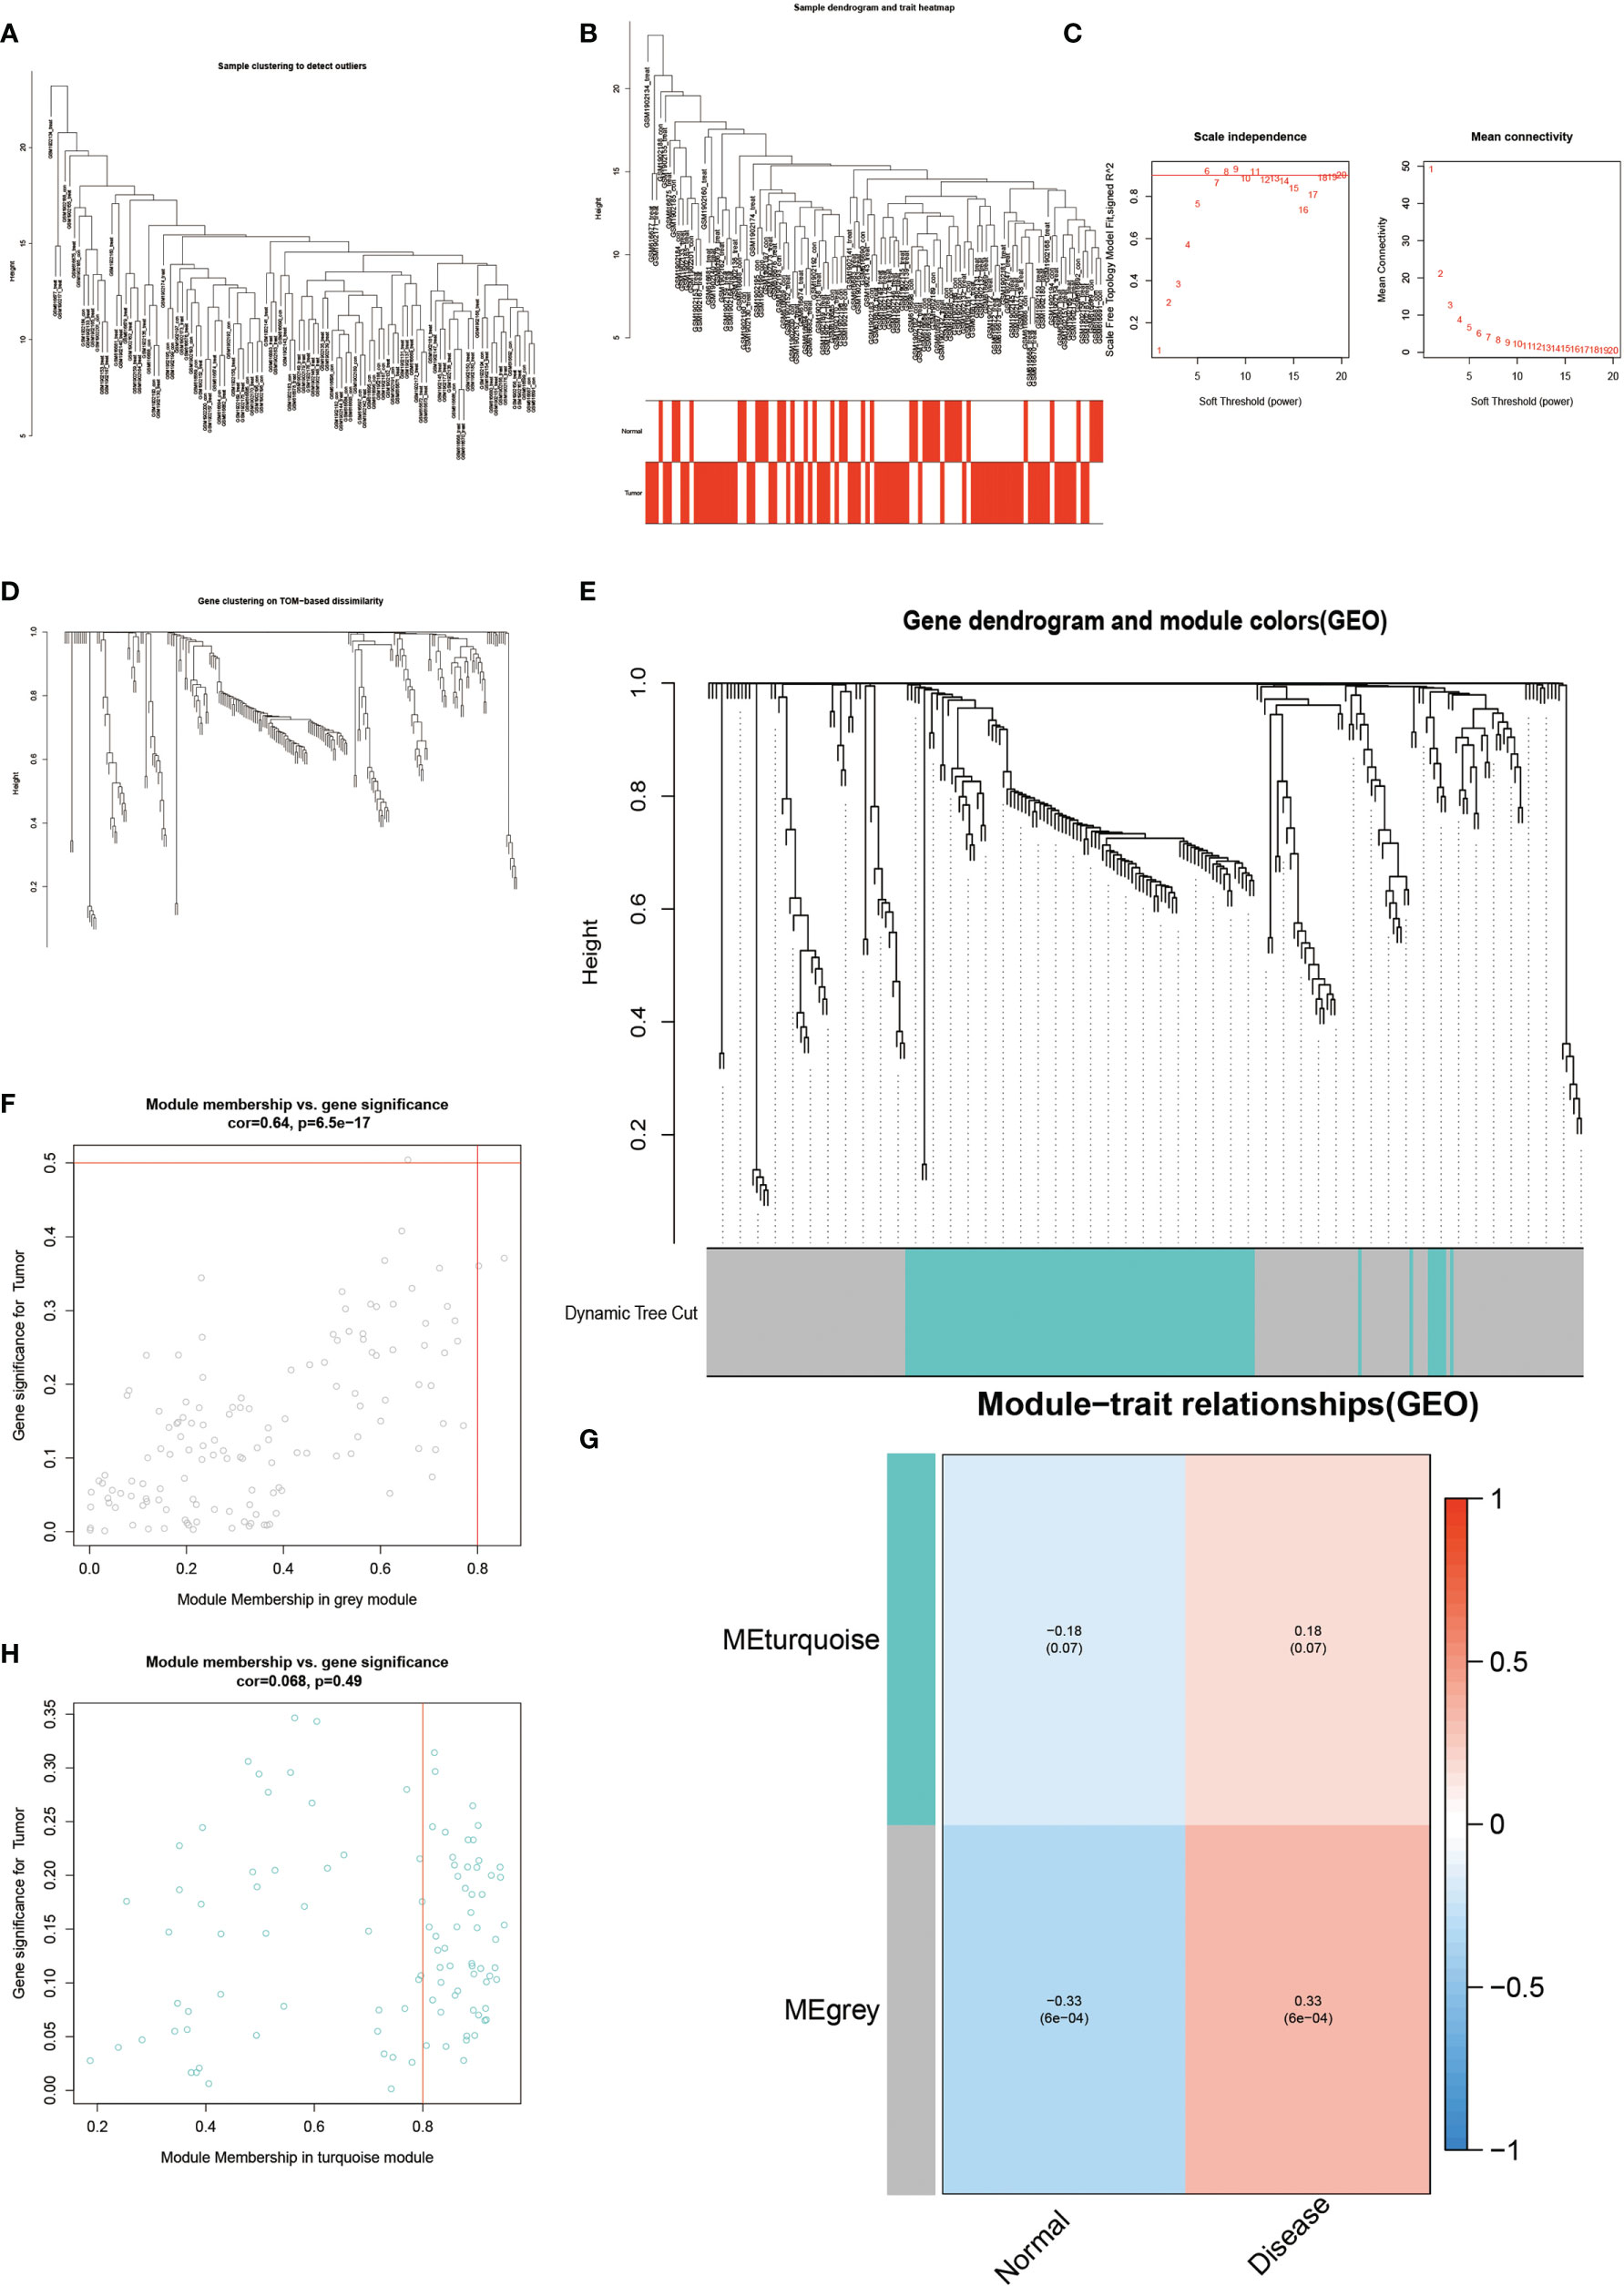
Figure 4 Results of WGCNA analysis. (A-E) shows the results of cluster analysis. (G) shows the Person correlation with disease and normal groups. (F, H) show the scatter plot of correlation.
Relationship Between ANXA3 and SORL1 and Antitumor Drug Sensitivity
The drug sensitivity analysis (Figure 5) showed that ANXA3 and SORL1 were significantly correlated with the sensitivity of multiple drugs. ANXA3 showed a significant negative correlation (P< 0.05) with several drugs, including Carmustine, Lomustine, Pipamperone, and Arsenic trioxide but had a positive correlation (p < 0.05) with Afatinib, Dacomitinib, and Neratinib. The SORL1 was negatively correlated with Gemcitabine, Lenvatinib, and Cabozantinib (p < 0.05).
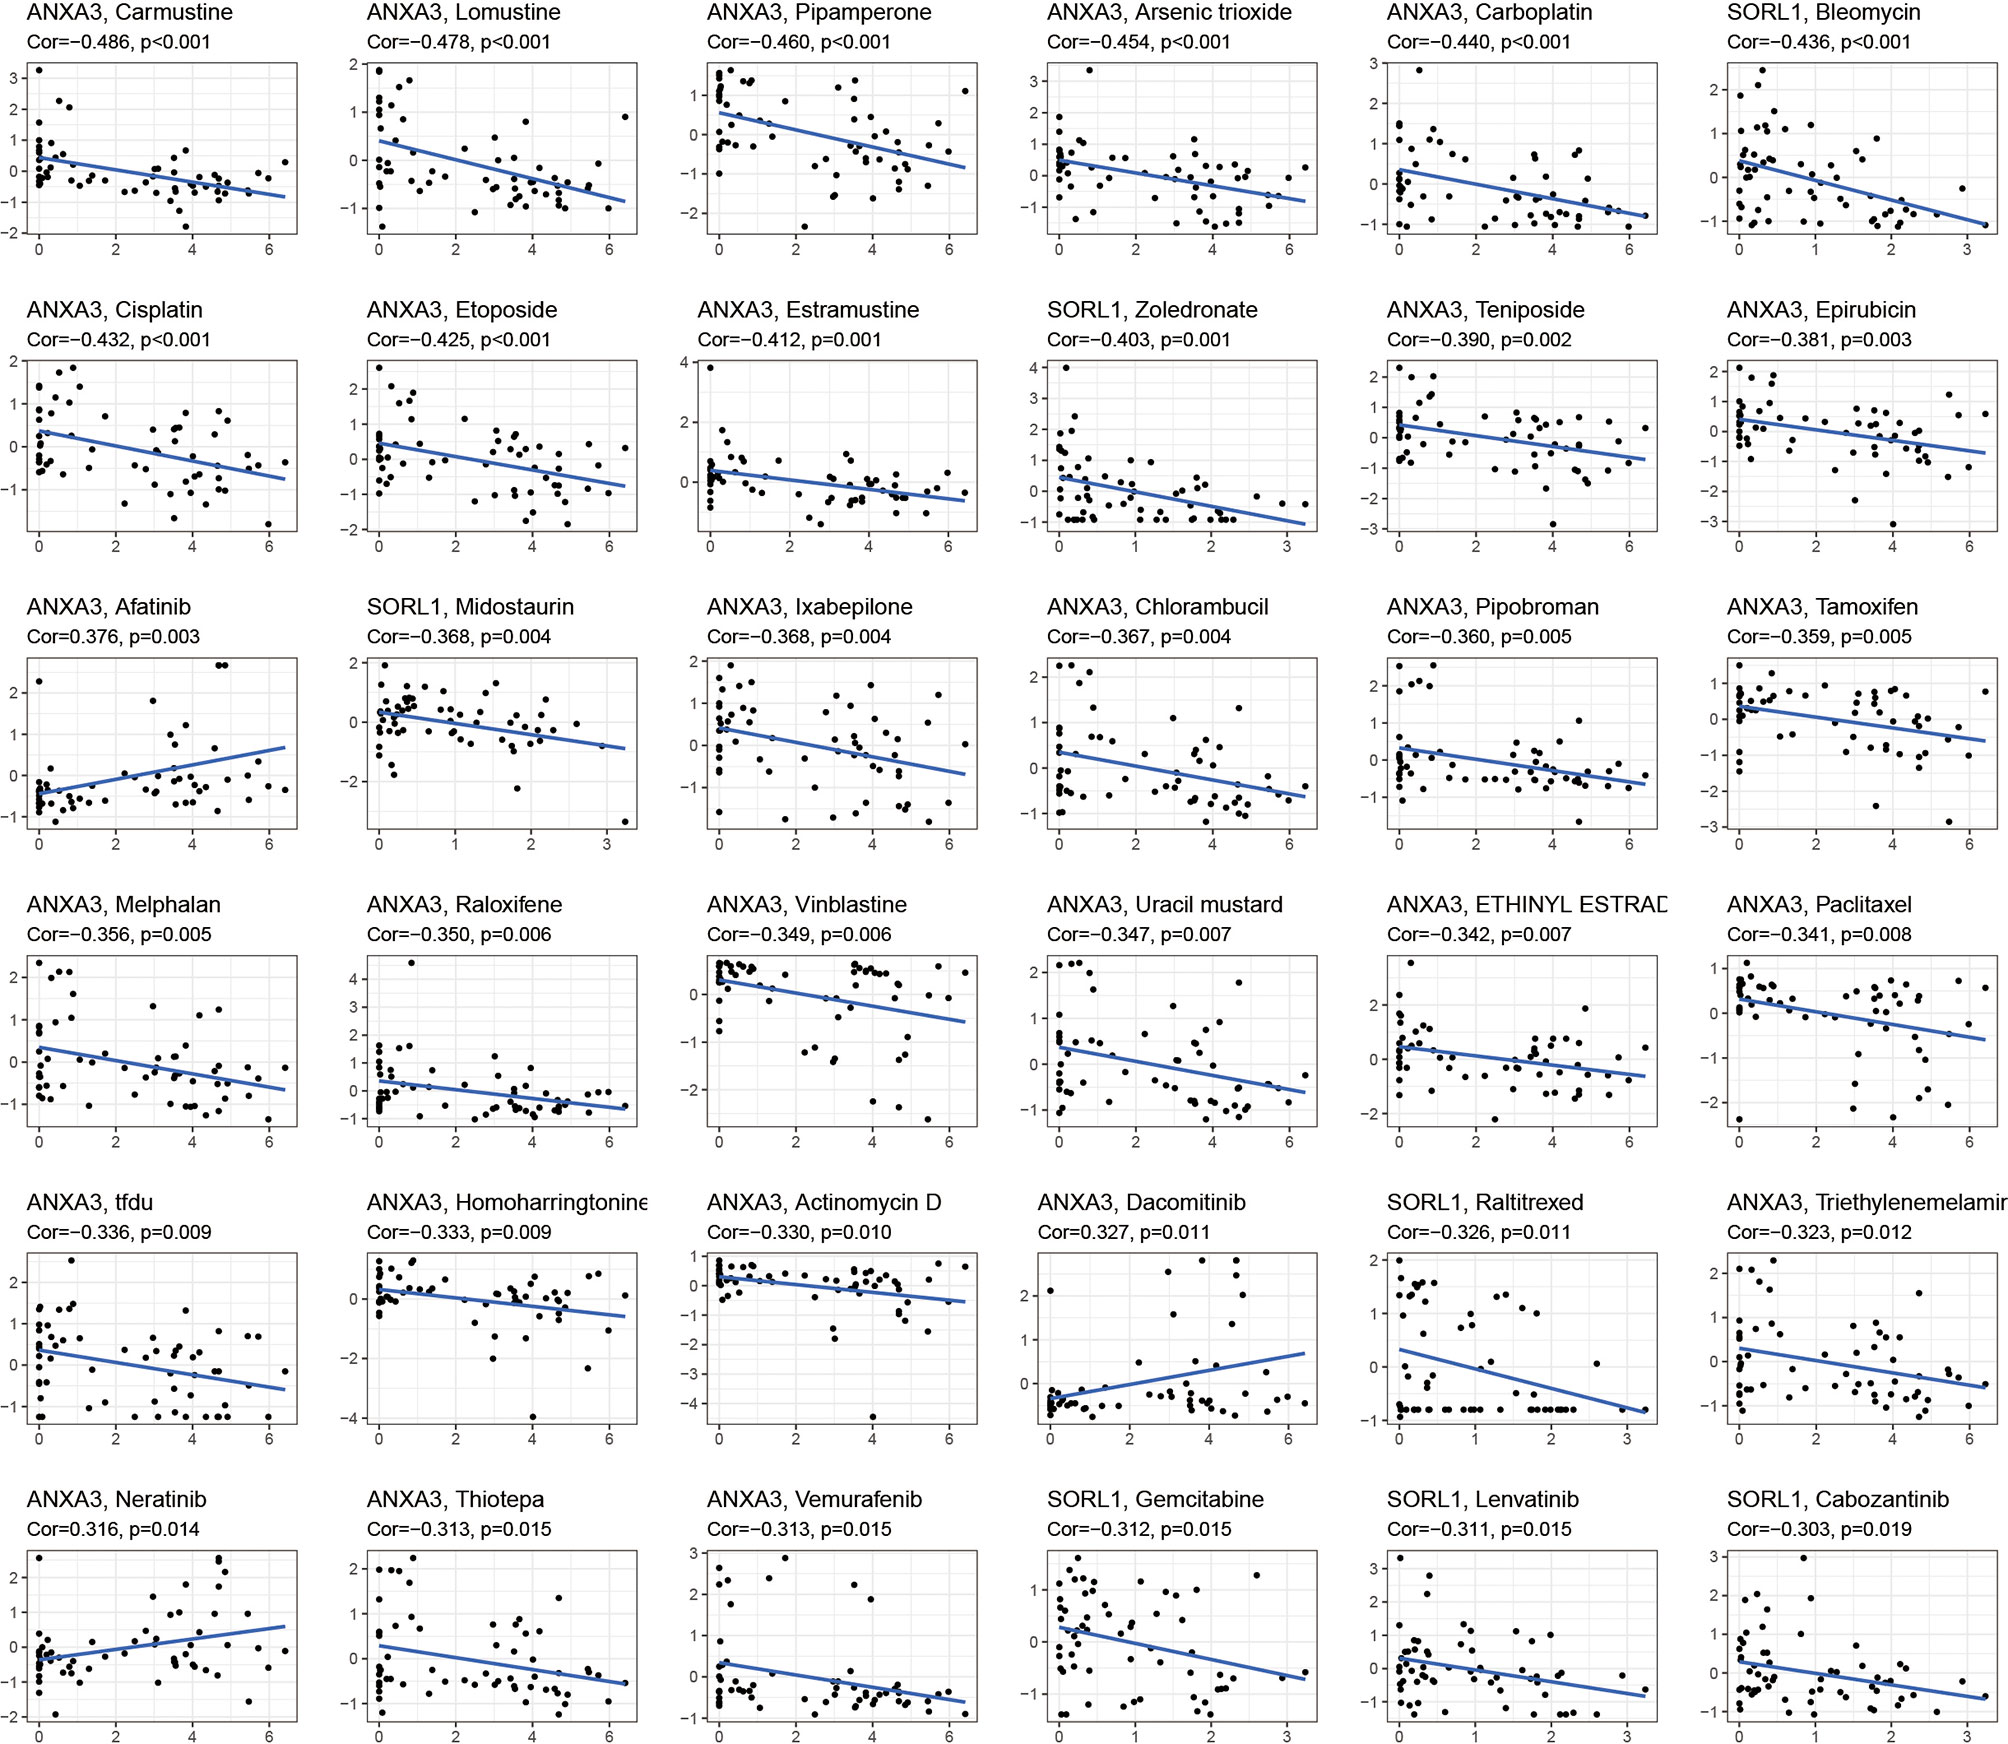
Figure 5 Drug sensitivity analysis. The graph shows the drug sensitivity analysis of ANXA3 and SORL1 with various drugs. If Cor > 0, it means the gene is positively correlated with drug sensitivity, the higher the gene expression, the stronger the sensitivity of this drug; conversely, Cor < 0 means the gene is negatively correlated with drug sensitivity, the higher the gene expression, the worse the sensitivity of this drug.
CIBERSORT Analysis Found Close Association With a Variety of Immune Cells Including Neutrophils
In order to analyze the composition of immune cells between the AS versus control group, we used CIBERSORT software and obtained the amount of immune cell expression in each sample, which was visualized as a percentage plot (Figure 6A). Subsequently, we also analyzed the differences in immune cells between the AS and control groups (Figure 6B) and found significant differences in memory B cells, CD8 T cells, activated gamma and delta T cells, NK cells, and neutrophils (P< 0.05). Immediately, we also analyzed the correlation between the two genes used to construct the diagnostic model and the immune cells and then constructed a fitted curve for the correlation analysis between them (Figure 7). Interestingly, we found that ANXA3 showed a significant negative correlation with memory B cells and CD8T cells but showed a significant positive correlation with NK cell activation. On the other hand, SOCRL1 showed a significant negative correlation with memory B cells, activated NK cells, and CD8 T cells, while it showed a significant positive correlation with neutrophils. Figure 8A showed that six immune cells were correlated with ANXA3 (p < 0.05) while nine immune cells were correlated with SOCRL1 (p < 0.05, Figure 8B).
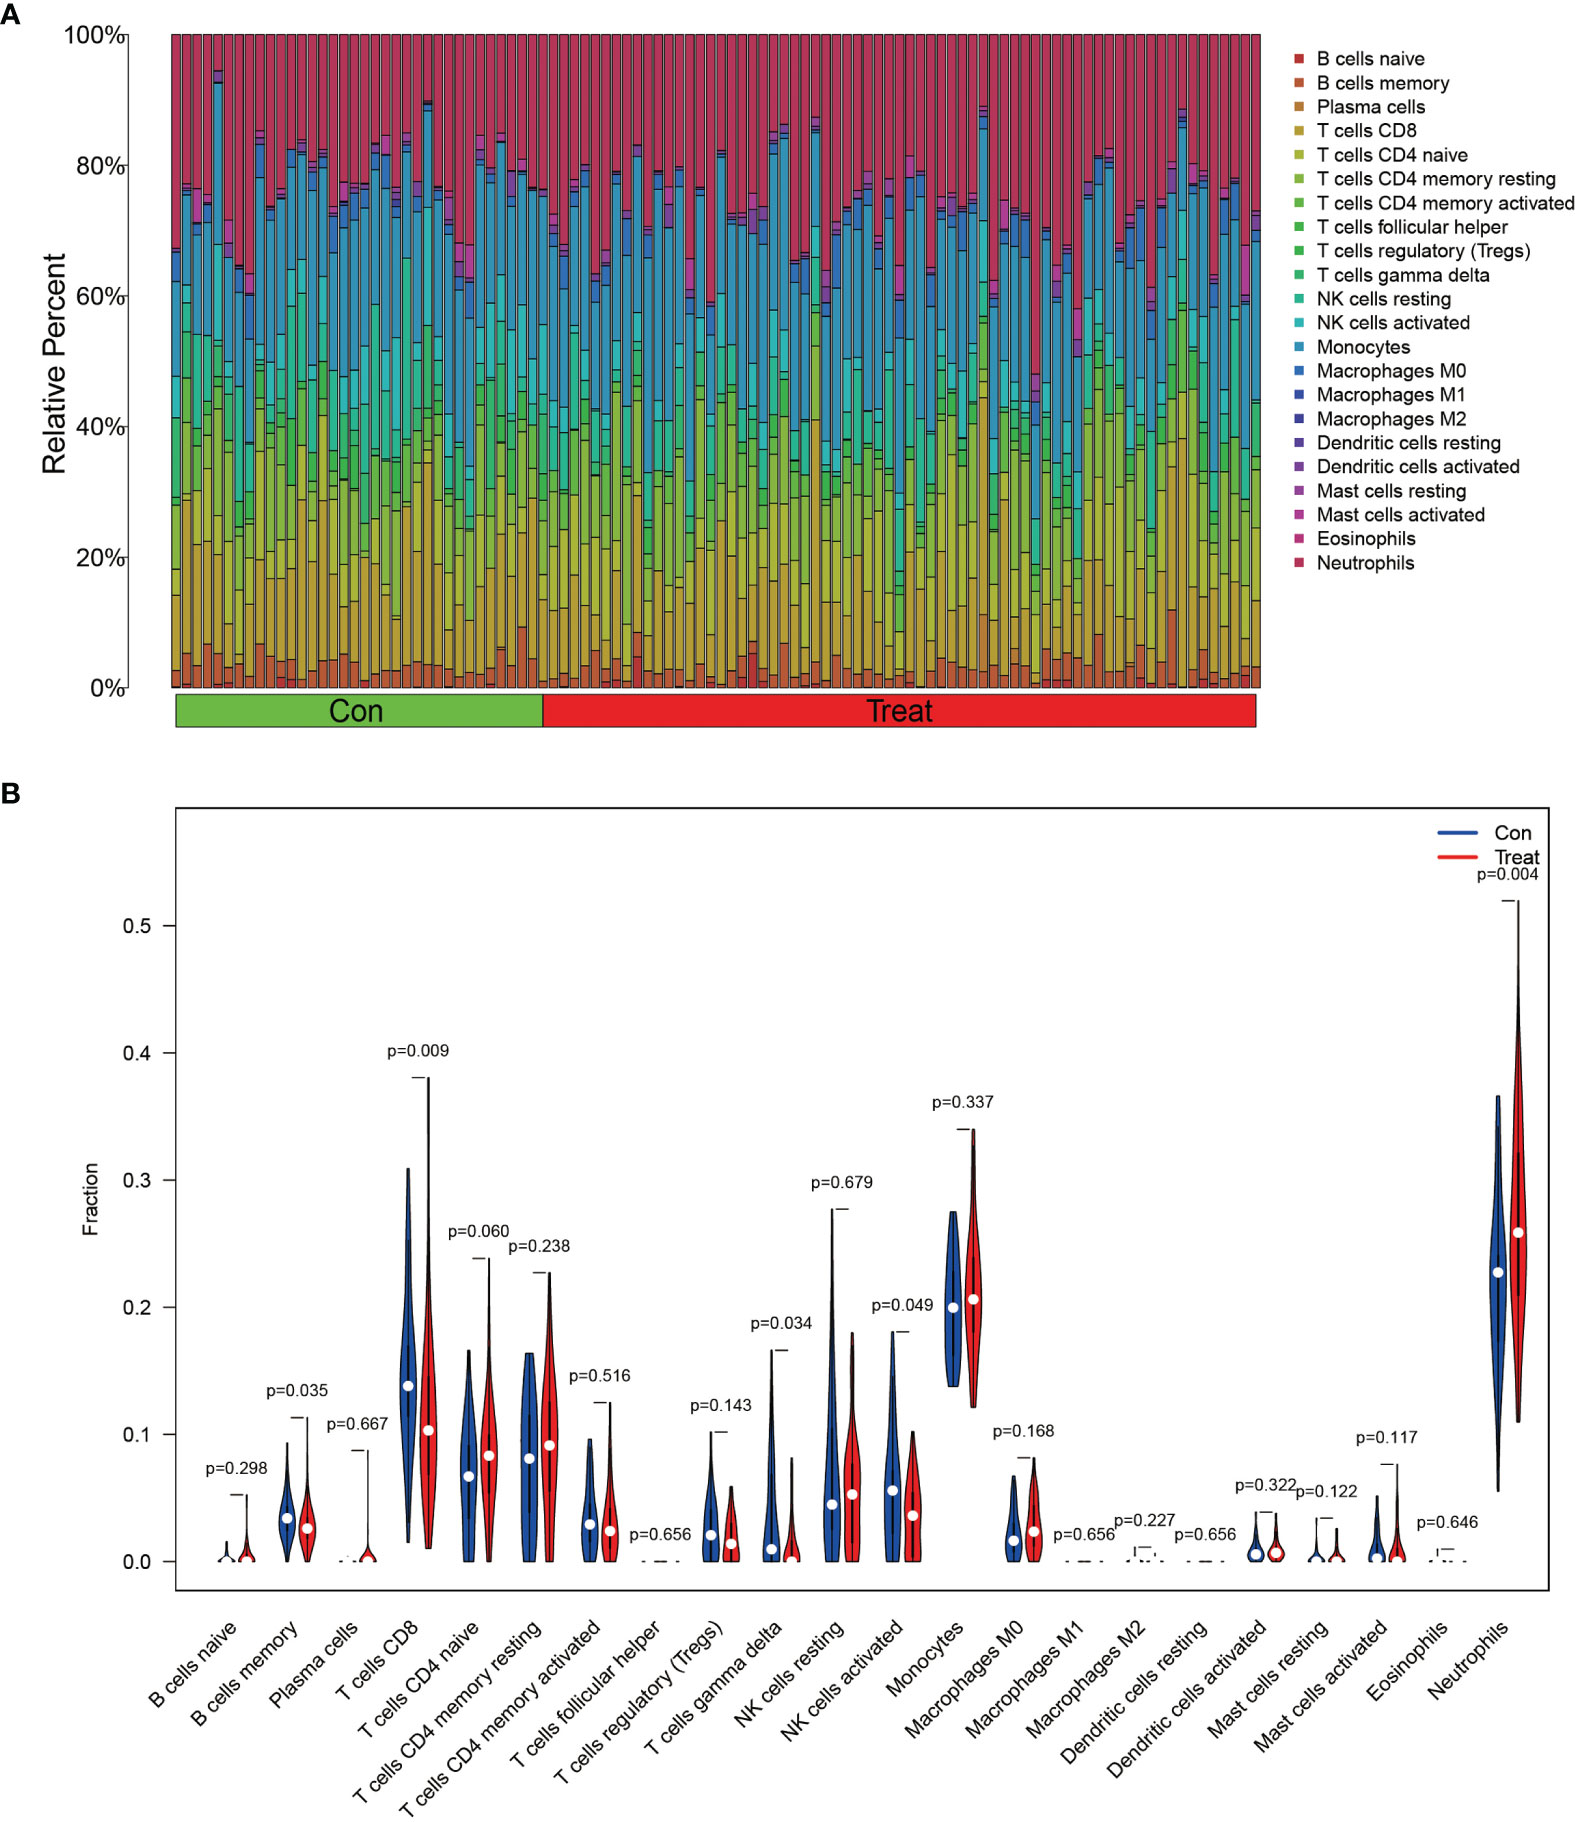
Figure 6 Immune cell composition analysis and differential expression analysis of immune cells. (A) shows the immune cell composition of all GEO downloaded samples, each sample consists of 22 immune cells with a total ratio of 100%. (B) shows the differences in immune cells in AS and control group, as seen in Neutrophils, NK cells activated, T cells gamma delta, T cells CD8 and B cells memory were significantly different (p < 0.05).
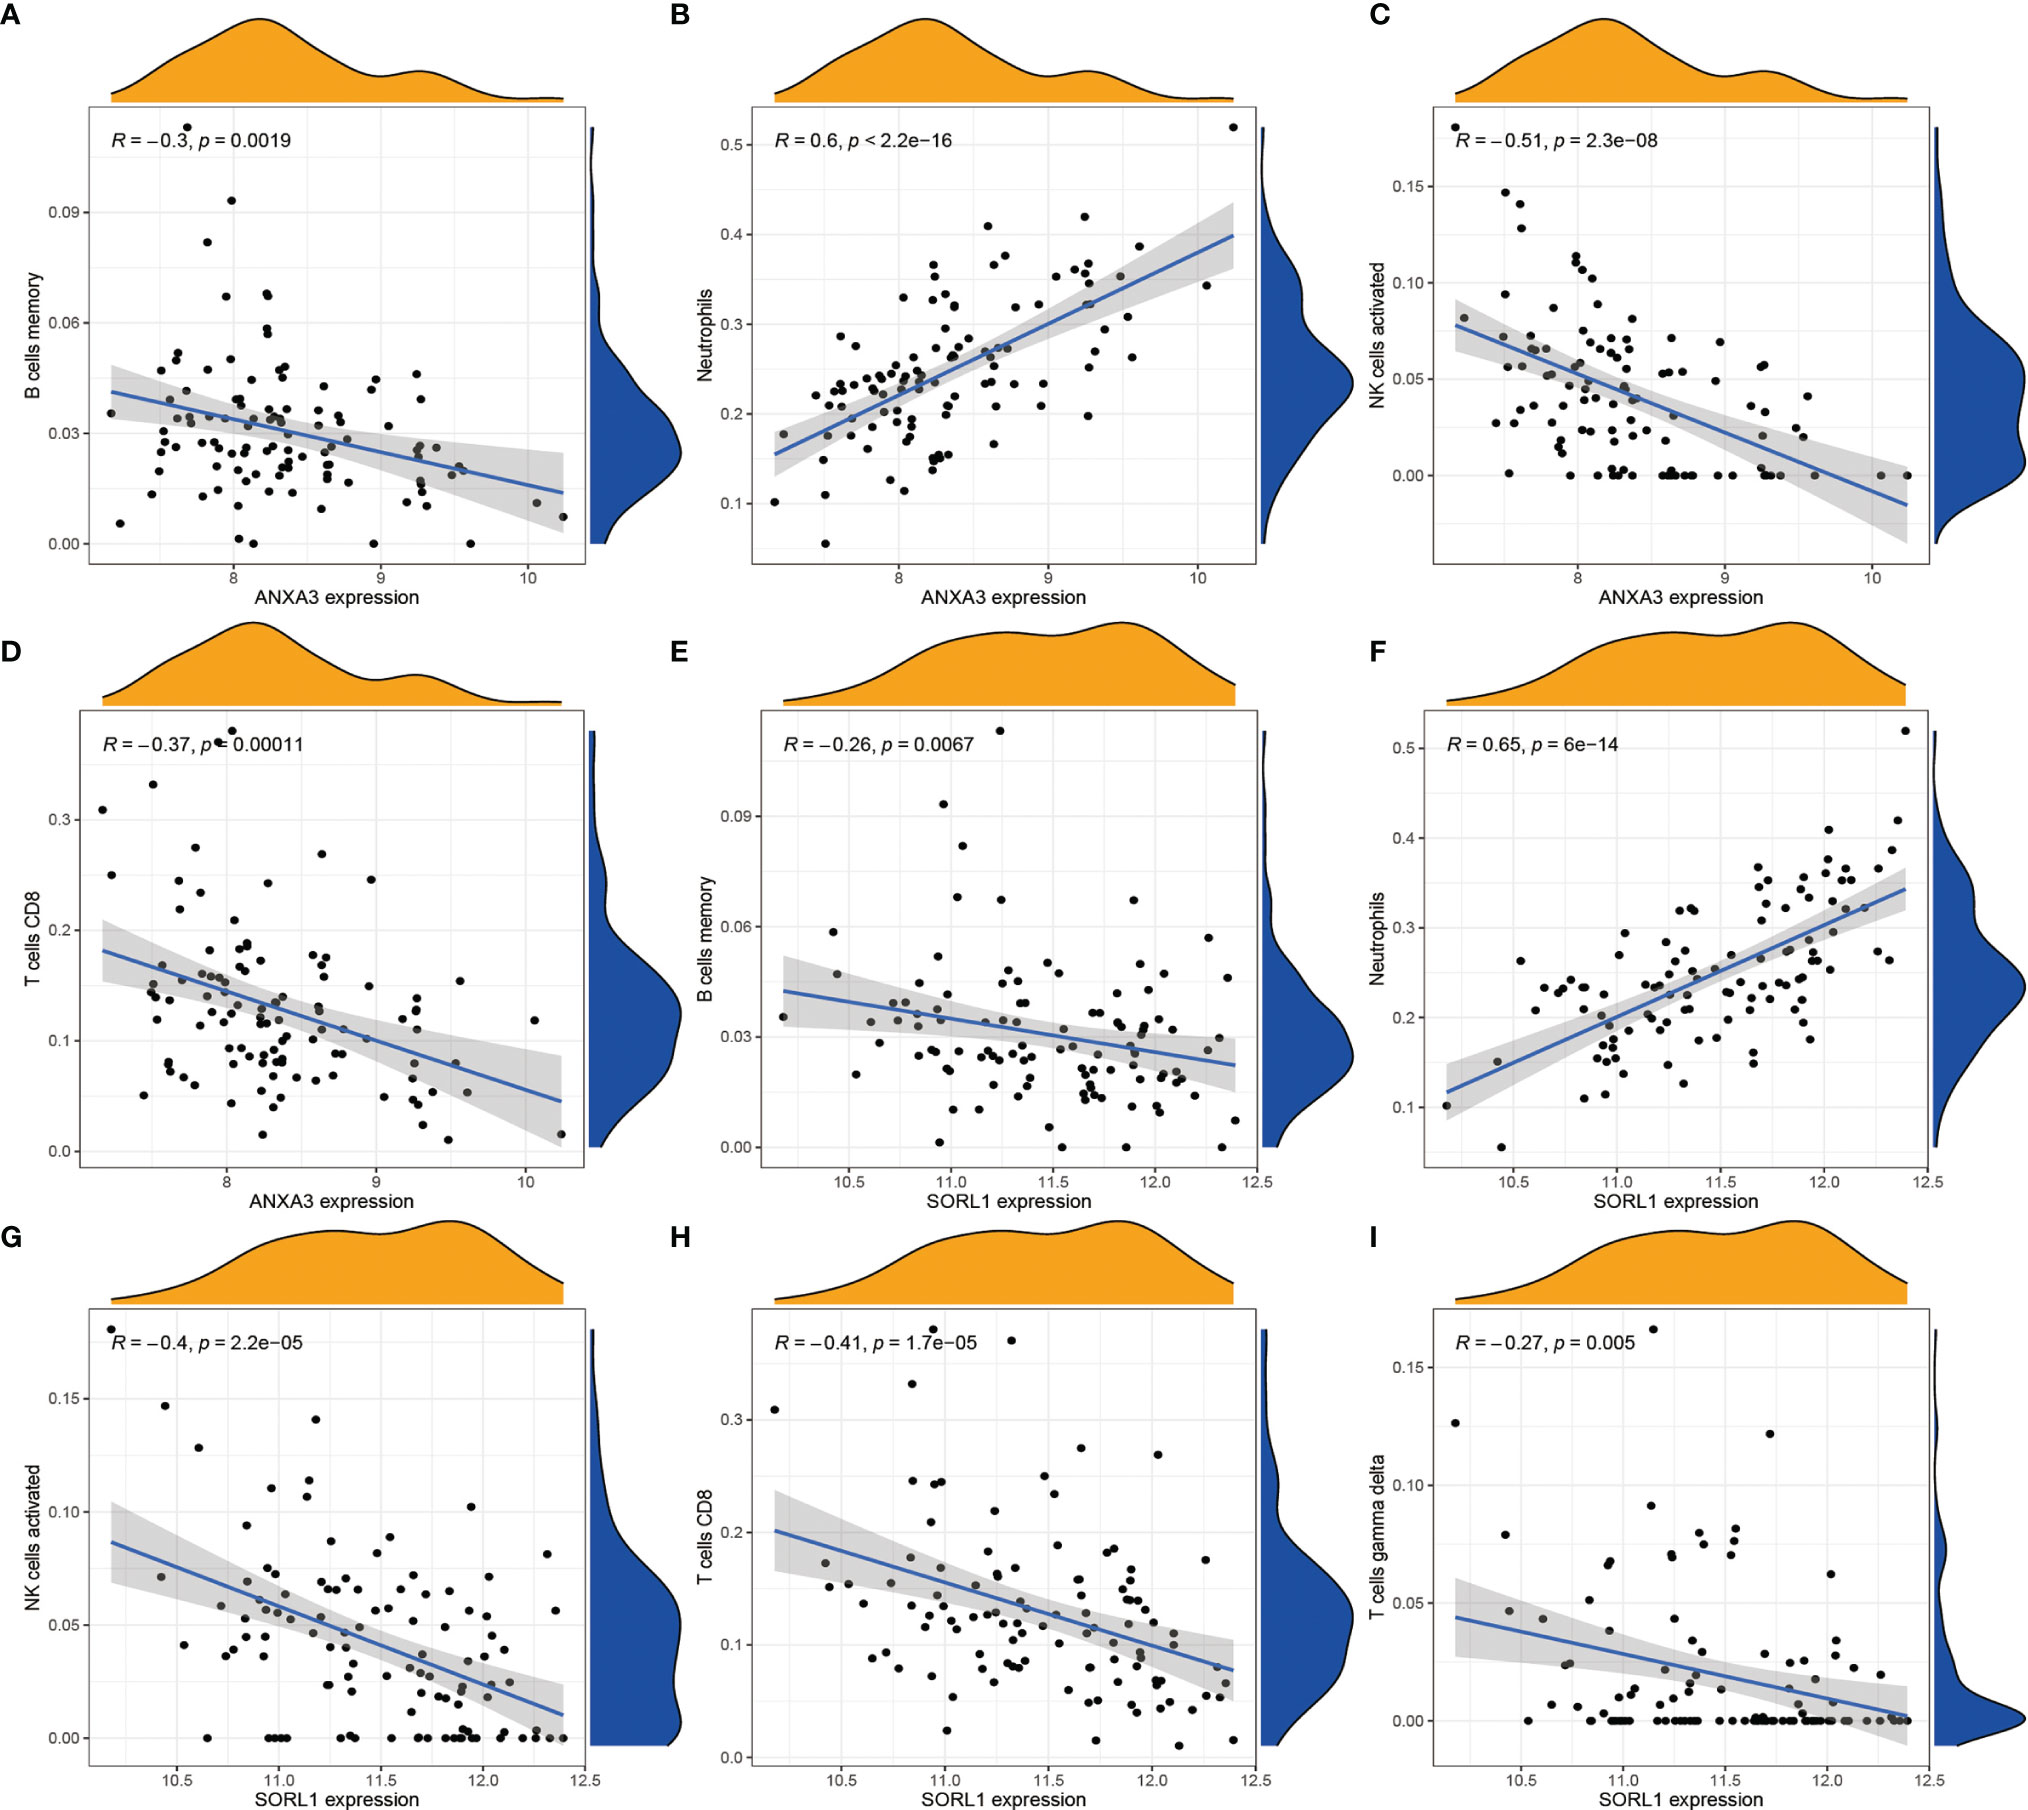
Figure 7 Correlation analysis of ANXA3, SORL1 and immune cells respectively. (A-D) shows the correlation analysis of ANXA3 and 4 immune cells. (E-I) shows the correlation analysis of SORL1 and 5 immune cells. If R > 0, it means higher gene expression and higher immune cell content; if R < 0, it means higher gene expression and lower immune cell content.
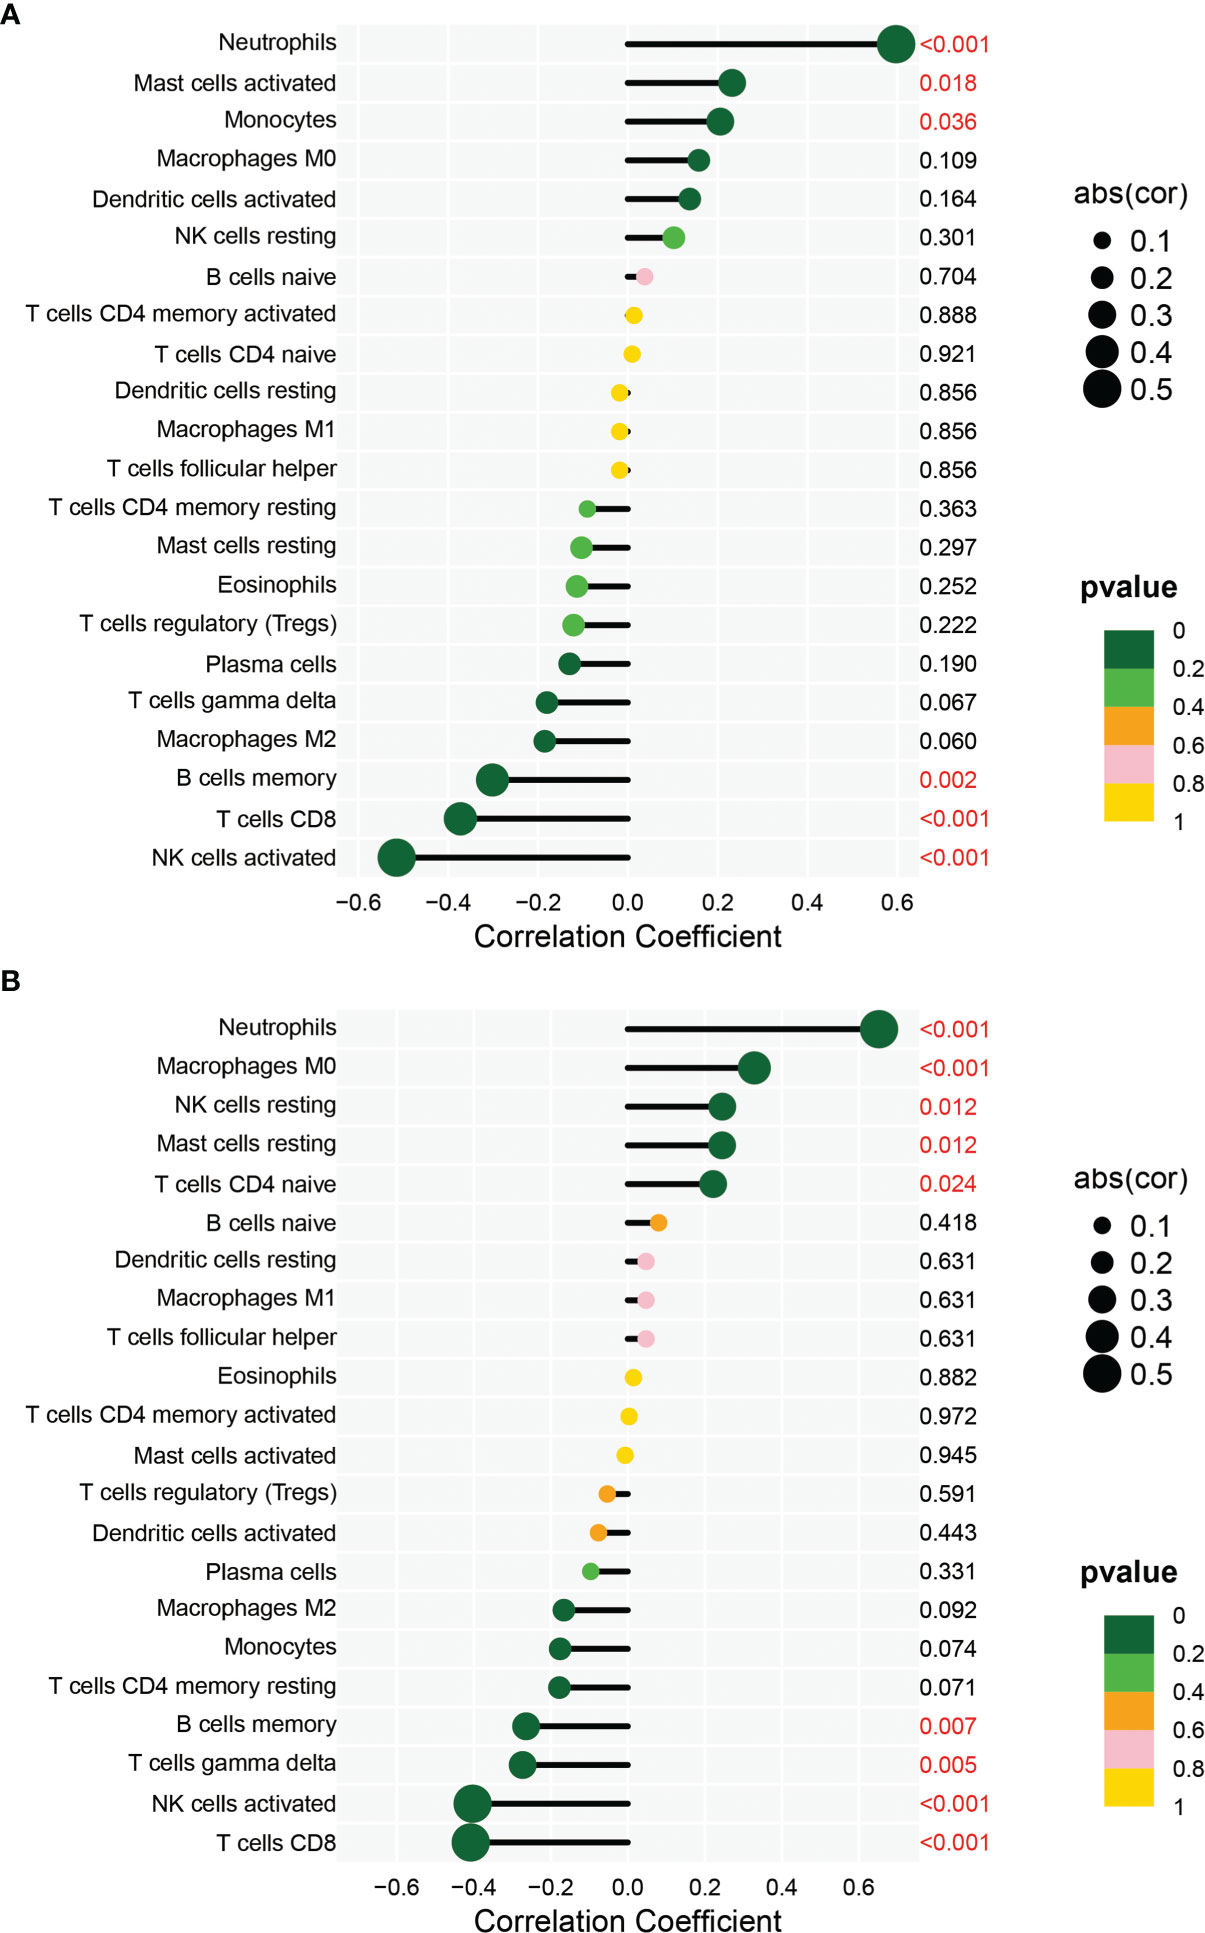
Figure 8 Immune correlation lollipop plot. (A) shows the immune cells with significant difference of ANXA3 in AS and control. (B) shows the immune cells with significant difference of SORL1 in AS and control.
High-Throughput Sequencing and Routine Blood Test Results
We performed RNA extraction from the interspinous ligaments of three AS patients and three lumbar degenerative interspinous ligament cases who met the inclusion-exclusion criteria. We finally obtained the gene expression of mRNAs of all AS and normal controls by the above mentioned laboratory manipulations. The differential expression analysis on the validation set was based on the cut-off values of the experimental set, using which, we obtained all the differentially expressed genes. Then, we constructed the heat maps and volcano maps of differentially expressed genes (Figures 9A, B) and found that the difference between ANXA3 and SORL1 in the validation set was highly significant. Thus, we further tested the accuracy of our bioinformatics analysis. Also, we compared the neutrophils (Figure 9C), Erythrocyte sedimentation Rate (Figure 9D), red blood cells (Figure 9E), and white blood cells (Figure 9F) between 1770 HLA-B27-positive cases and 7939 HLA-B27-negative cases and found that the values of these indicators were significantly higher in AS than in the healthy controls (P<0.001). Our statistical analysis by the number of neutrophils with AS with high BASDAI scores versus AS with low BASDAI scores revealed that the number of neutrophils with AS with high BASDAI scores was significantly higher than the number of neutrophils with low scores (Figure 9G), and the difference was statistically significant (p < 0.001). On the other hand, the correlation analysis of neutrophils and CRP (Figure 9H) showed a positive correlation between neutrophils and CRP with a correlation coefficient of 0.31, a statistically significant difference (p < 0.001).
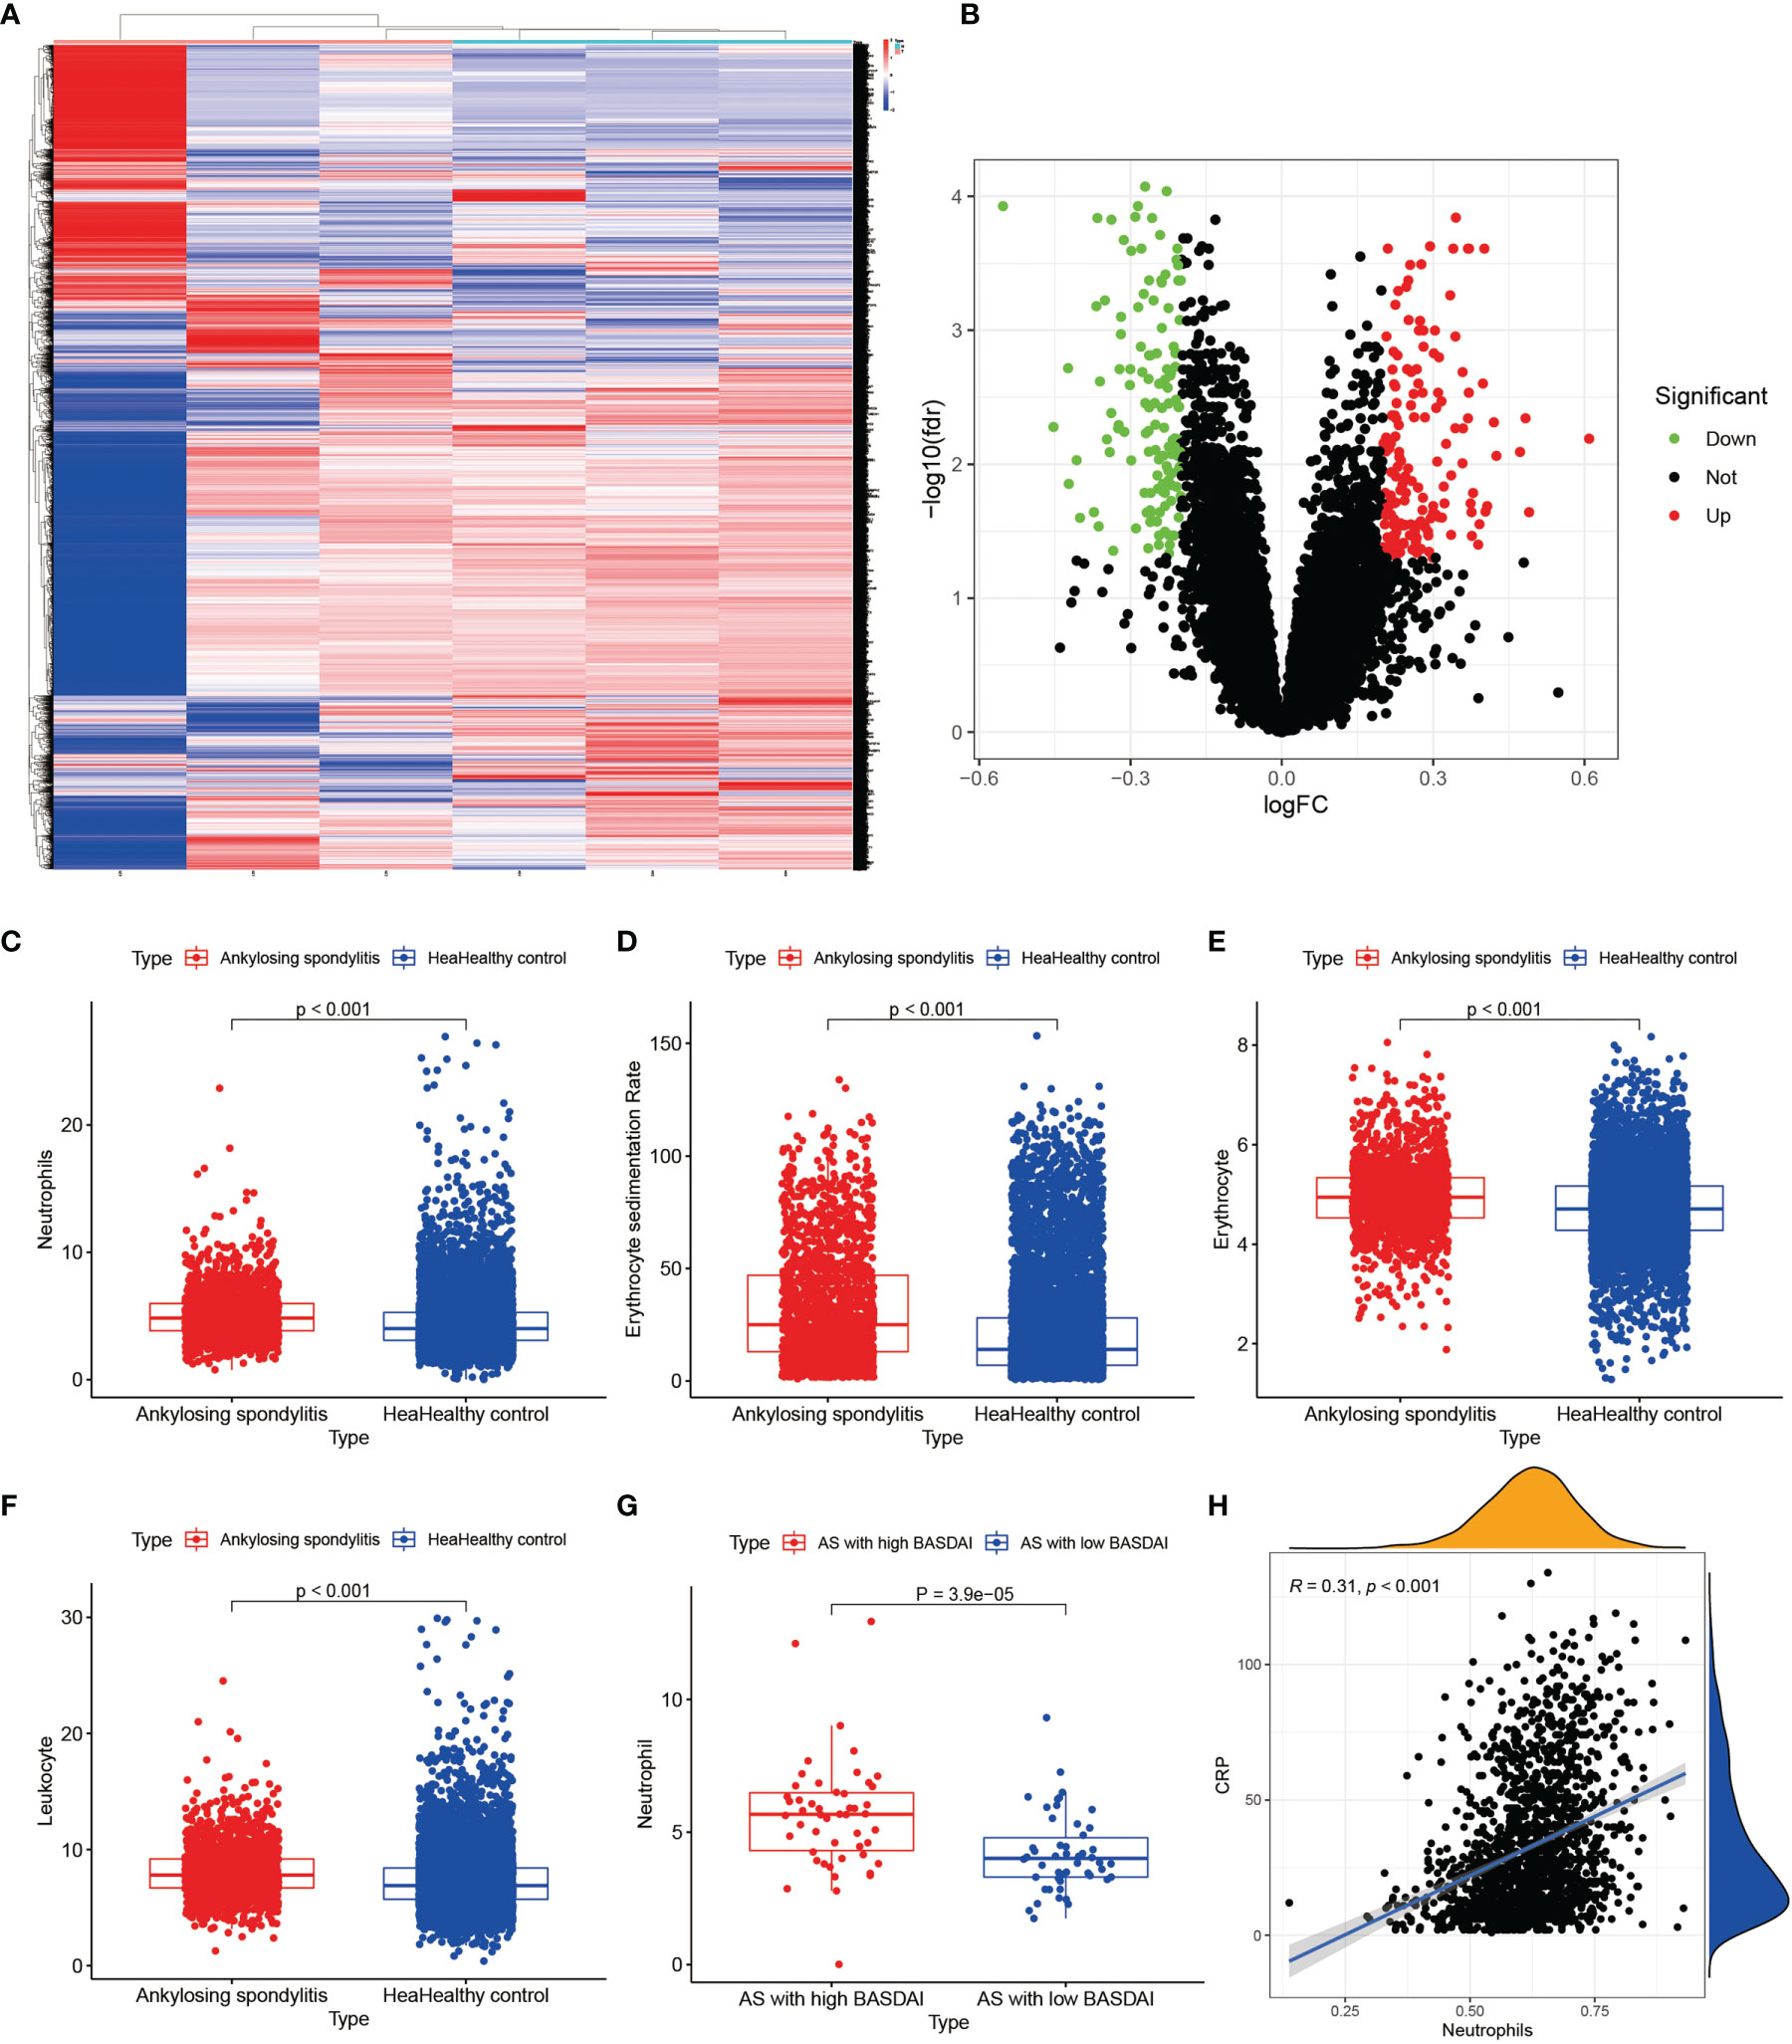
Figure 9 Results of external validation sets are shown. (A, B) show heat and volcano maps of differentially expressed genes measured by high-throughput sequencing, confirming that ANXA3 and SORL1 are also differentially expressed genes in the interspinous ligament of AS. (C-F) show the variance analysis of the routine blood tests. (G) shows the difference in neutrophils between high BASDAI cases and low BASDAI cases. (H) shows the relationship between neutrophils and CRP.
Immunohistochemical Analysis Results
We performed immunohistochemical staining of the interspinous ligaments of five patients with AS and three patients with spinal fractures for ANXA3 and SORL1, respectively. The results revealed that the specific expression of each of ANXA3 and SORL1 in AS was significantly higher than that in the control group (Figures 10A1-D2). After detecting the positive rate of all immunohistochemical images with Image J software, the positive rate data of ANXA3 and SORL1 were imported into IBM SPSS Statistics 25 software and statistically analyzed by independent sample t-test, and the positive rate statistics of ANXA3 and SORL1 were found to be much higher in AS than in the control group (Figures 10E, F), and the difference was statistically significant (P<0.05). This further confirms the accuracy of our preliminary analysis, demonstrating that ANXA3 and SORL1 are differentially expressed in AS and control groups.
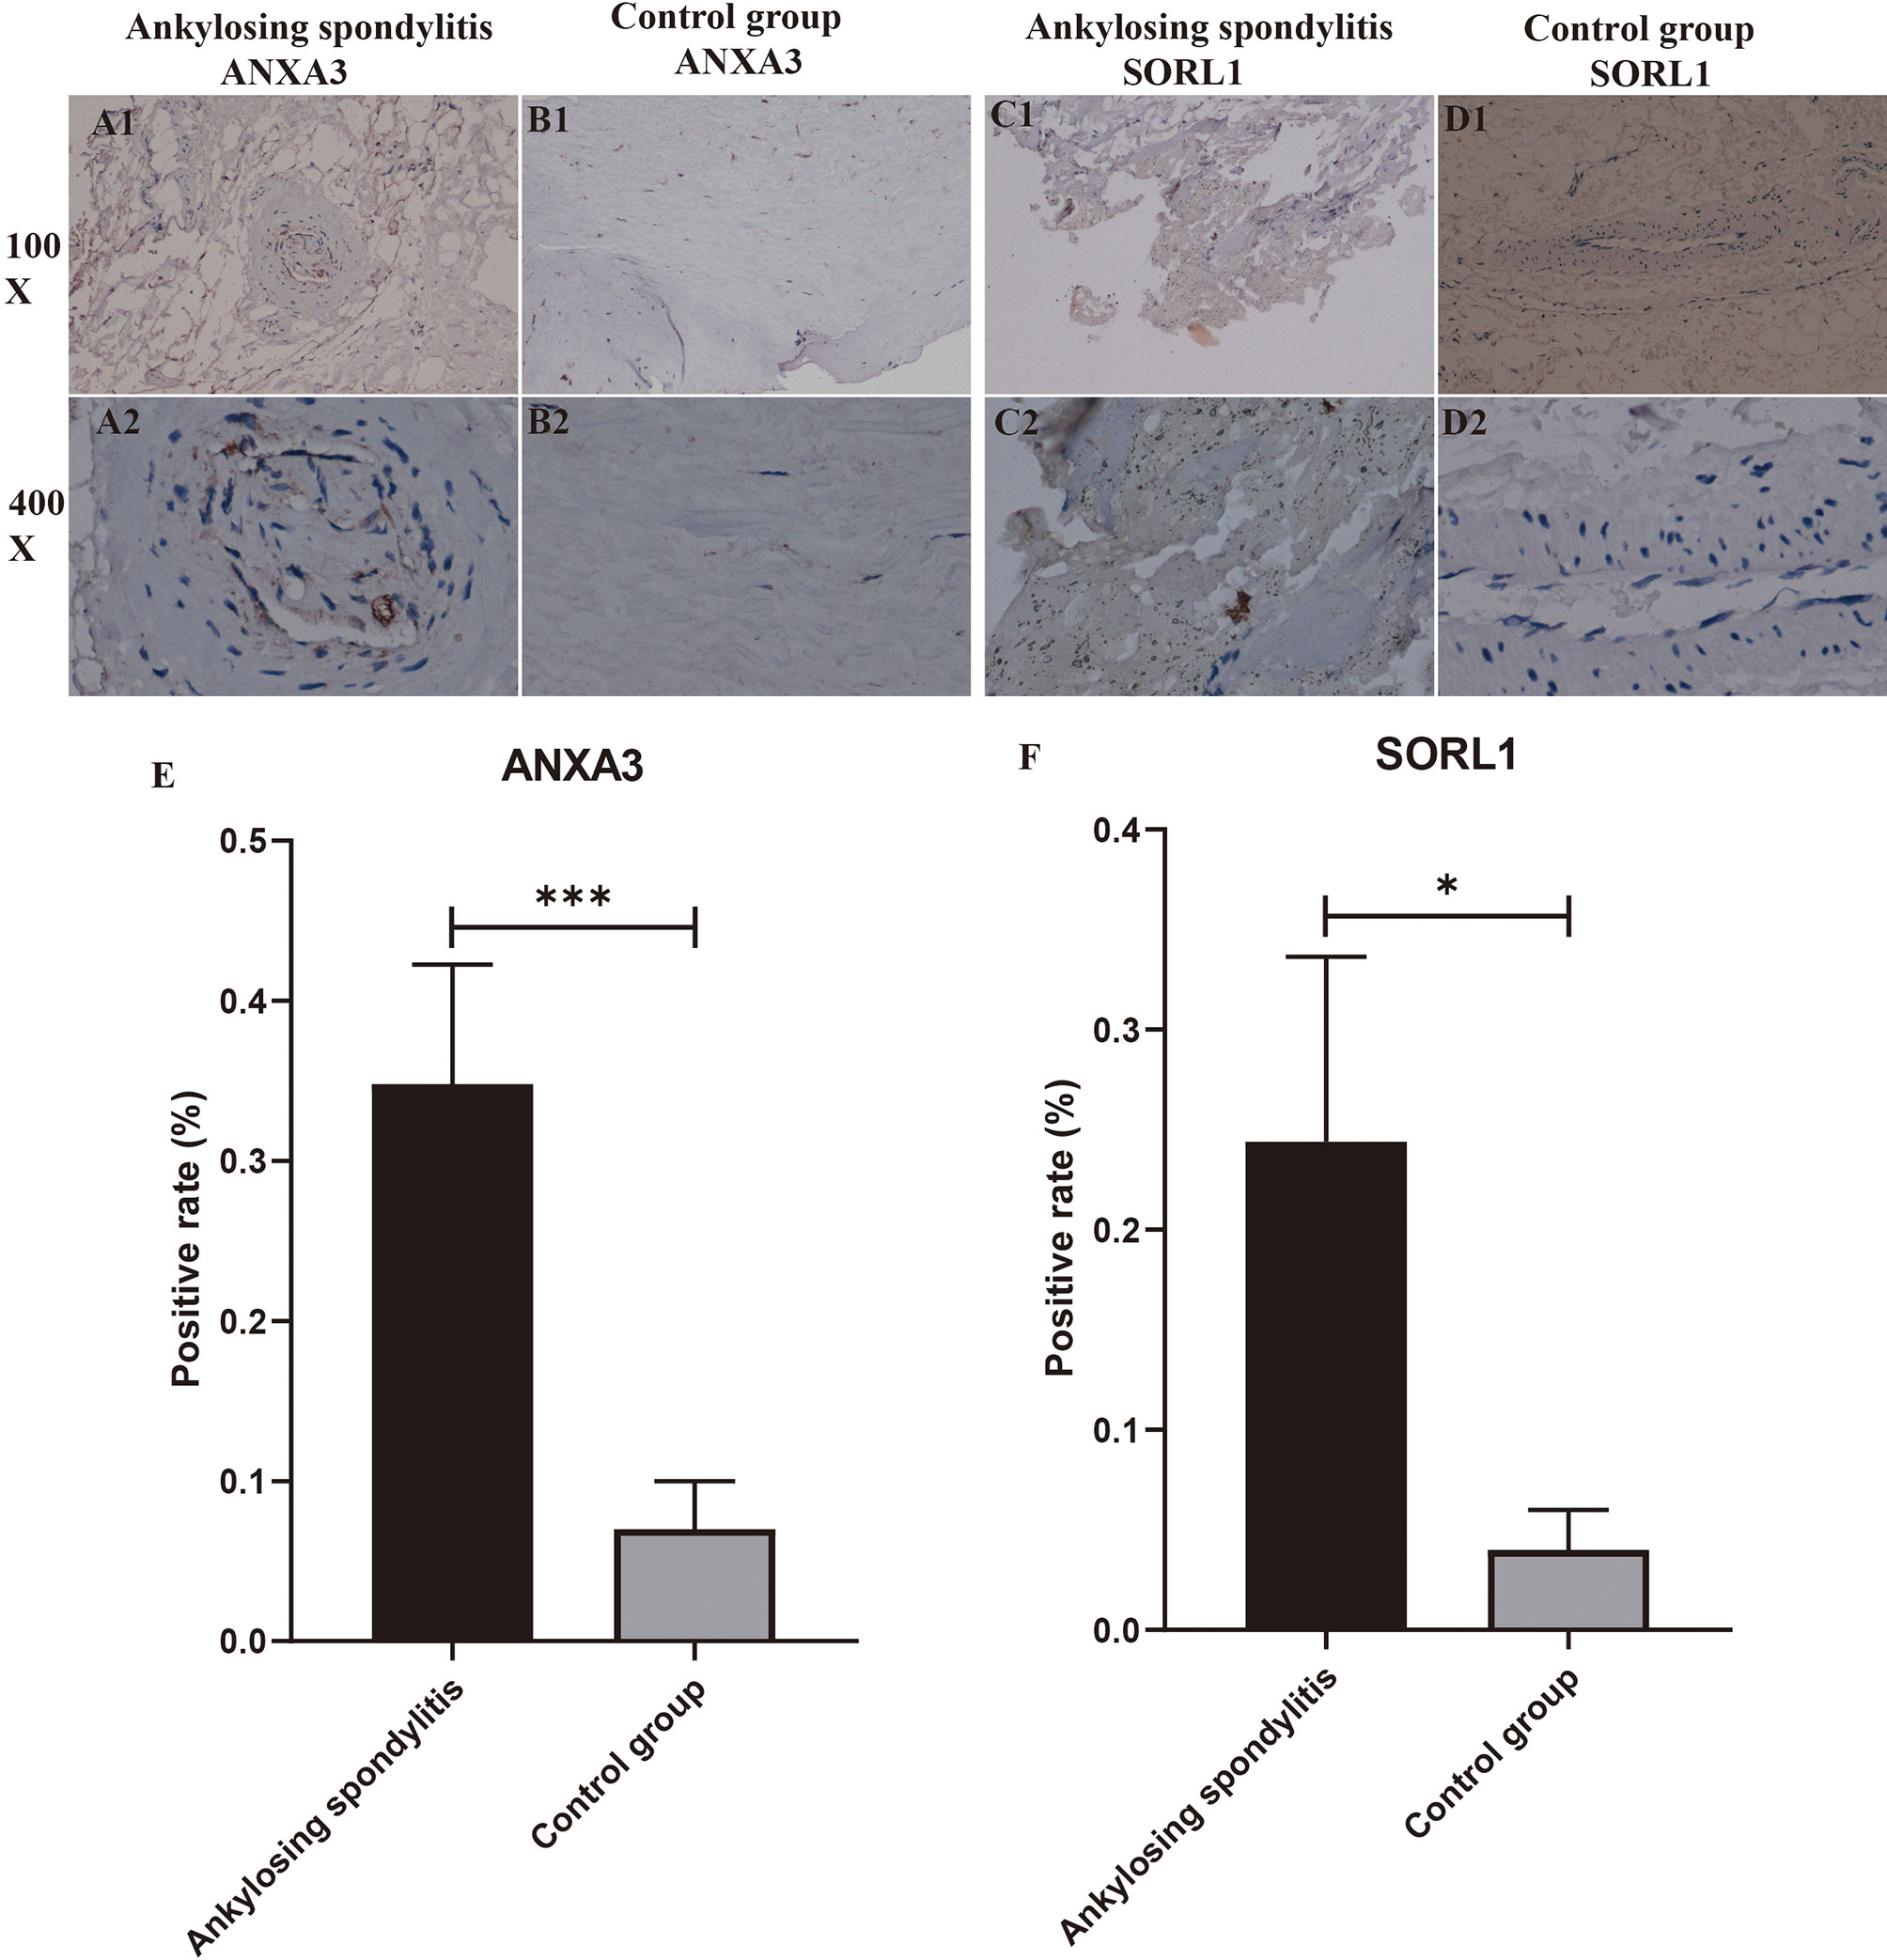
Figure 10 Immunohistochemistry and positive rate statistics. (A1-D2) show the specific expression of ANXA3 with SORL1 in AS and controls. (E, F) shows the positive rate statistics of all immunohistochemical images of SORL1 in AS and control groups. “*” indicates p < 0.05, “***” indicates p < 0.001.
Discussion
In our study, we conducted GO enrichment analysis of 68 AS samples and 36 control samples obtained from the GEO database for differentially expressed genes, and our results showed that entries were mainly enriched in neutrophil degranulation, neutrophil activation involved in immune response, and neutrophil-mediated immunity. Previous studies have shown that neutrophils in cells have a limited pro-inflammatory function (35). Reactive oxygen species (ROS) have also been an important factor in the progression of inflammatory diseases. The enhanced ROS production by polymorphonuclear neutrophils in inflammation can cause tissue damage and endothelial dysfunction. Also, the oxidative stress produced by neutrophils in an inflammatory environment leads to the opening of endothelial junctions, facilitating the passage of inflammatory cells across the endothelial barrier (36). Neutrophils are the immune cells involved in the development of many diseases. Interestingly, our diagnostic model showed that both ANXA3 and SORL1 showed a significant positive correlation with neutrophils (p < 0.05) with neutrophil expression being much higher in the AS patients than in the controls (p < 0.01). Enrichment analysis of the KEGG pathway showed that it was mainly enriched in neutrophil extracellular trap formation, Th1 and Th2 cell differentiation, and osteoclast differentiation. Fernanda V S Castanheira et al. showed that neutrophils can fight inflammation through phagocytosis and/or by releasing extra-neutrophilic traps (NETs). The neutrophils also help in repairing already damaged tissues while limiting the production of NETs (37). This was also in line with our study, which showed that a significant rise in neutrophils might contribute to the progression of AS.
Annexin A3 (ANXA3) is a protein-coding gene, which is associated with diseases that mainly include ovarian cancer and upper urinary tract uroepithelial carcinoma. Previous studies have shown that miR-18b can prevent cerebral ischemia-reperfusion injury by activating the PI3K/Akt pathway and inhibiting ANXA3 in an oxygen-glucose deprivation/reperfusion model (OGDR) in vitro and middle cerebral artery occlusion model (MCAO) in vivo simulating the cerebral ischemia-reperfusion injury (38). Also, ANXA3 has been identified as a potential biomarker in Zhizhong Yan et al. ‘s study of aneurysmal subarachnoid hemorrhage, which was identified through the construction of a coexpression network by WGCNA (39). However, to date, no studies have reported ANXA3 in AS, and our study is the first to suggest that dysregulation of ANXA3 may contribute to the progression of AS and lead to dysregulation of immune cells, particularly neutrophils, thereby contributing to the development of the disease. Our high-throughput sequencing results showed that ANXA3 is also a significantly different gene found in the interspinous ligaments of AS. On the other hand, we compared the neutrophil counts of 1770 HLA-B27-positive cases and 7939 HLA-B27-negative cases and found that the neutrophil counts in the AS group were significantly higher than those of the healthy controls, further confirming our bioinformatics analysis. On the other hand, the results of immunohistochemical analysis of ANXA3, which we performed in order to test in vitro whether there were differences between AS and normal groups, also showed that its specific expression was significantly higher in AS than in normal controls, with statistically significant differences (p < 0.05). This result is consistent with the results of our analysis.
Sortilin Related Receptor 1 (SORL1) is a protein-coding gene that is currently known to be most closely associated with Alzheimer’s disease (40–42). Abnormalities within the neurons in the lysosomal and autophagy/macroautophagy systems are prominent features of the early stages of Alzheimer’s disease (AD). SORL1 mutations are an important cause of rare autosomal dominant AD, increasing the risk of late-onset AD (43). The deletion of SORL1 may affect the regulatory protein-induced cell proliferation enabling metastatic resistance to HER2 treatment in breast cancer cells (44). Interestingly, our KEGG pathway enrichment analysis showed that it was mainly enriched in the phagosome, neutrophil extracellular trap formation, and osteoclast differentiation pathways. Interestingly, our findings suggested that SORL1 is a key differentially expressed gene in AS. Also, our results from high-throughput sequencing showed that it is an important differentially expressed gene in the pathogenesis of AS. Moreover, SORL1 showed a significant positive correlation with neutrophil expression (Cor = 0.65, p < 0.001), where the neutrophil counts were significantly higher in AS than that of the healthy controls. We also obtained the data of neutrophils from routine blood tests from 1770 HLA-B27-positive cases and 7939 HLA-B27-negative cases. Since no reports have identified and studied SORL1 in AS, we propose for the first time that it may also be a possible key gene in the pathogenesis of AS. We found that SORL1 expression was significantly higher in AS than in normal controls by immunohistochemistry of SORL1 in the interspinous ligaments of five AS cases and in the interspinous ligaments of three spinal fractures, and the difference was statistically significant (P < 0.05). This result tests the accuracy of our analysis at the level of in vitro experiments. In our study, we found that both ANXA3 and SORL1 showed a significant positive correlation with neutrophil count. Thus, in order to assess the relationship between ANXA3 and SORL1 and disease activity, we took the neutrophil counts of the first 50 patients with BASDAI scores above the mean and the last 50 patients with BASDAI scores below the mean for statistical analysis, and we found that the neutrophil counts of patients with high scores were significantly higher than those of patients with low scores, and the differences were statistically significant (p < 0.001). This result indirectly confirms a strong association of ANXA3 and SORL1 with disease progression in AS patients.
We first screened the differentially expressed genes in AS by combining the two GEO datasets and then performed GO enrichment analysis, KEGG pathway enrichment analysis, DO enrichment analysis, GSEA enrichment analysis, followed by SVM analysis, WGCNA, and intersection with Hypoxia-related genes to obtain the diagnostic models for the genes ANXA3 and SORL1. We also performed a drug sensitivity analysis, immune cell content analysis, and immune cell differences analysis and found that both ANXA3 and SORL1 showed a significant positive correlation with neutrophils, which was confirmed by the routine blood data obtained from AS and healthy control samples. Also, we confirmed that these two genes were indeed differentially expressed in AS by high-throughput sequencing of three AS samples and three lumbar degeneration samples. We also analyzed the staining by immunohistochemistry for ANXA3 and SORL1, respectively, whose results revealed that both ANXA3 and SORL1 were more expressed in AS than in normal controls. The results of immunohistochemistry also supported the results of our analysis. We analyzed and tested for differences in immune cells using a total of 9707 cases of routine blood data, and the test results were consistent with our analysis.
Similar to other studies, our study also had limitations. Firstly, the sample size was inadequate. Our bioinformatics analysis used a total of 104 samples, including 68 AS samples and 36 control samples, while three AS interspinous ligament samples and three Degenerative lumbar spine samples were used for high-throughput sequencing. Also, we collected data on neutrophil counts from a total of 361 cases belonging to 1770 HLA-B27-positive cases and 7939 HLA-B27-negative cases, which is far from adequate for a large sample size. Secondly, we did not have more laboratory analyses to test our results and used only two different external validations, which is not nearly enough.
Conclusion
Upregulated of ANXA3, SORL1, and neutrophils can be key factors in the progression of Ankylosing Spondylitis.
Data Availability Statement
The datasets supporting the conclusions of this article are available in the GEO database: https://www.ncbi.nlm.nih.gov/geo/query/acc.cgi?acc=GSE25101 and https://www.ncbi.nlm.nih.gov/geo/query/acc.cgi?acc=GSE73754.
Ethics Statement
The studies involving human participants were reviewed and approved by Ethics Department of the First Affiliated Hospital of Guangxi Medical University. Written informed consent for participation was not required for this study in accordance with the national legislation and the institutional requirements.
Author Contributions
JJ, CL, and XZ designed the study. TL, LC, SH, and XS analyze the data. WJ, JC, TC, HL, and YY digital visualization. SW and JZ collected data on routine blood data. JJ, HQ, HL, TL, YY, XZ, and CL performed the laboratory operation. JJ wrote and revised the manuscript. CL and XZ revised the manuscript. All co-authors participated in the laboratory operation. All authors contributed to the article and approved the submitted version.
Funding
This study was supported by the Youth Science Foundation of Guangxi Medical University, Grant/Award Numbers: GXMUYFY201712, Guangxi Young and Middle-aged Teacher’s Basic Ability Promoting Project, Grant/Award Number: 2019KY0119.
Conflict of Interest
The authors declare that the research was conducted in the absence of any commercial or financial relationships that could be construed as a potential conflict of interest.
Publisher’s Note
All claims expressed in this article are solely those of the authors and do not necessarily represent those of their affiliated organizations, or those of the publisher, the editors and the reviewers. Any product that may be evaluated in this article, or claim that may be made by its manufacturer, is not guaranteed or endorsed by the publisher.
Acknowledgments
The authors are grateful to Dr. Xin Li Zhan (Spine and Osteopathy Ward, The First Affiliated Hospital of Guangxi Medical University) for his kindly assistance in all present study stages.
References
1. Ritchlin C, Adamopoulos IE. Axial Spondyloarthritis: New Advances in Diagnosis and Management. BMJ (Clin Res ed) (2021) 372:m4447. doi: 10.1136/bmj.m4447
2. Tavasolian F, Inman RD. Gut microbiota-microRNA Interactions in Ankylosing Spondylitis. Autoimmun Rev (2021) 20:102827. doi: 10.1016/j.autrev.2021.102827
3. Mauro D, Thomas R, Guggino G, Lories R, Brown MA, Ciccia F. Ankylosing Spondylitis: An Autoimmune or Autoinflammatory Disease? Nat Rev Rheumatol (2021) 17:387–404. doi: 10.1038/s41584-021-00625-y
4. Sieper J, Poddubnyy D. Axial Spondyloarthritis. Lancet (Lond Engl) (2017) 390:73–84. doi: 10.1016/s0140-6736(16)31591-4
5. van der Heijde D, Braun J, Deodhar A, Baraliakos X, Landewé R, Richards HB, et al. Modified Stoke Ankylosing Spondylitis Spinal Score as an Outcome Measure to Assess the Impact of Treatment on Structural Progression in Ankylosing Spondylitis. Rheumatol (Oxford England) (2019) 58:388–400. doi: 10.1093/rheumatology/key128
6. Liu L, Yuan Y, Zhang S, Xu J, Zou J. Osteoimmunological Insights Into the Pathogenesis of Ankylosing Spondylitis. J Cell Physiol (2021) 236:6090–100. doi: 10.1002/jcp.30313
7. Brandt S, Ballhause TM, Bernhardt A, Becker A, Salaru D, Le-Deffge HM, et al. Fibrosis and Immune Cell Infiltration Are Separate Events Regulated by Cell-Specific Receptor Notch3 Expression. J Am Soc Nephrol: JASN (2020) 31:2589–608. doi: 10.1681/asn.2019121289
8. Kristyanto H, Blomberg NJ, Slot LM, van der Voort EIH, Kerkman PF, Bakker A, et al. Persistently Activated, Proliferative Memory Autoreactive B Cells Promote Inflammation in Rheumatoid Arthritis. Sci Trans Med (2020) 12(570):eaaz5327. doi: 10.1126/scitranslmed.aaz5327
9. Pellicci DG, Koay HF, Berzins SP. Thymic Development of Unconventional T Cells: How NKT Cells, MAIT Cells and γδ T Cells Emerge. Nat Rev Immunol (2020) 20:756–70. doi: 10.1038/s41577-020-0345-y
10. Marogianni C, Sokratous M, Dardiotis E, Hadjigeorgiou GM, Bogdanos D, Xiromerisiou G. Neurodegeneration and Inflammation-An Interesting Interplay in Parkinson’s Disease. Int J Mol Sci (2020) 21(22):8421. doi: 10.3390/ijms21228421
11. Tan TH, Perucca P, O’Brien TJ, Kwan P, Monif M. Inflammation, Ictogenesis, and Epileptogenesis: An Exploration Through Human Disease. Epilepsia (2021) 62:303–24. doi: 10.1111/epi.16788
12. Luci C, Bourinet M, Leclère PS, Anty R, Gual P. Chronic Inflammation in Non-Alcoholic Steatohepatitis: Molecular Mechanisms and Therapeutic Strategies. Front Endocrinol (2020) 11:597648. doi: 10.3389/fendo.2020.597648
13. Taylor CT, Colgan SP. Regulation of Immunity and Inflammation by Hypoxia in Immunological Niches. Nat Rev Immunol (2017) 17:774–85. doi: 10.1038/nri.2017.103
14. Fearon U, Canavan M, Biniecka M, Veale DJ. Hypoxia, Mitochondrial Dysfunction and Synovial Invasiveness in Rheumatoid Arthritis. Nat Rev Rheumatol (2016) 12:385–97. doi: 10.1038/nrrheum.2016.69
15. Ito Y, Matsuzaki T, Ayabe F, Mokuda S, Kurimoto R, Matsushima T, et al. Both microRNA-455-5p and -3p Repress Hypoxia-Inducible Factor-2α Expression and Coordinately Regulate Cartilage Homeostasis. Nat Commun (2021) 12:4148. doi: 10.1038/s41467-021-24460-7
16. Zheng L, Zhang Z, Sheng P, Mobasheri A. The Role of Metabolism in Chondrocyte Dysfunction and the Progression of Osteoarthritis. Ageing Res Rev (2021) 66:101249. doi: 10.1016/j.arr.2020.101249
17. Pimentel-Santos FM, Ligeiro D, Matos M, Mourão AF, Costa J, Santos H, et al. Whole Blood Transcriptional Profiling in Ankylosing Spondylitis Identifies Novel Candidate Genes That Might Contribute to the Inflammatory and Tissue-Destructive Disease Aspects. Arthritis Res Ther (2011) 13:R57. doi: 10.1186/ar3309
18. Gracey E, Yao Y, Green B, Qaiyum Z, Baglaenko Y, Lin A, et al. Sexual Dimorphism in the Th17 Signature of Ankylosing Spondylitis. Arthritis Rheumatol (Hoboken NJ) (2016) 68:679–89. doi: 10.1002/art.39464
19. Schriml LM, Mitraka E, Munro J, Tauber B, Schor M, Nickle L, et al. Human Disease Ontology 2018 Update: Classification, Content and Workflow Expansion. Nucleic Acids Res (2019) 47:D955–d962. doi: 10.1093/nar/gky1032
20. Bello SM, Shimoyama M, Mitraka E, Laulederkind SJF, Smith CL, Eppig JT, et al. Disease Ontology: Improving and Unifying Disease Annotations Across Species. Dis Models Mech (2018) 11(3):dmm032839. doi: 10.1242/dmm.032839
21. Schriml LM, Arze C, Nadendla S, Chang YW, Mazaitis M, Felix V, et al. Disease Ontology: A Backbone for Disease Semantic Integration. Nucleic Acids Res (2012) 40:D940–946. doi: 10.1093/nar/gkr972
22. Ji C, Sun LS, Xing F, Niu N, Gao HL, Dai JW, et al. HTRA3 Is a Prognostic Biomarker and Associated With Immune Infiltrates in Gastric Cancer. Front Oncol (2020) 10:603480. doi: 10.3389/fonc.2020.603480
23. Xu WX, Zhang J, Hua YT, Yang SJ, Wang DD, Tang JH. An Integrative Pan-Cancer Analysis Revealing LCN2 as an Oncogenic Immune Protein in Tumor Microenvironment. Front Oncol (2020) 10:605097. doi: 10.3389/fonc.2020.605097
24. Liu Z, Sun T, Zhang Z, Bi J, Kong C. An 18-Gene Signature Based on Glucose Metabolism and DNA Methylation Improves Prognostic Prediction for Urinary Bladder Cancer. Genomics (2021) 113:896–907. doi: 10.1016/j.ygeno.2020.10.022
25. Zhou J, Guo H, Liu L, Hao S, Guo Z, Zhang F, et al. Construction of Co-Expression Modules Related to Survival by WGCNA and Identification of Potential Prognostic Biomarkers in Glioblastoma. J Cell Mol Med (2021) 25:1633–44. doi: 10.1111/jcmm.16264
26. Shi M, Dai WQ, Jia RR, Zhang QH, Wei J, Wang YG, et al. APC(CDC20)-Mediated Degradation of PHD3 Stabilizes HIF-1a and Promotes Tumorigenesis in Hepatocellular Carcinoma. Cancer Lett (2021) 496:144–55. doi: 10.1016/j.canlet.2020.10.011
27. Long J, Huang S, Bai Y, Mao J, Wang A, Lin Y, et al. Transcriptional Landscape of Cholangiocarcinoma Revealed by Weighted Gene Coexpression Network Analysis. Briefings Bioinf (2021) 22(4):bbaa224. doi: 10.1093/bib/bbaa224
28. Jiang H, Zou B, Xu C, Xu J, Tang YY. SVM-Boosting Based on Markov Resampling: Theory and Algorithm. Neural Netw: Off J Int Neural Netw Soc (2020) 131:276–90. doi: 10.1016/j.neunet.2020.07.036
29. Ma Y, Liang X, Sheng G, Kwok JT, Wang M, Li G. Noniterative Sparse LS-SVM Based on Globally Representative Point Selection. IEEE Trans Neural Networks Learn Syst (2021) 32:788–98. doi: 10.1109/tnnls.2020.2979466
30. Jia W, Liu X, Wang Y, Pedrycz W, Zhou J. Semisupervised Learning via Axiomatic Fuzzy Set Theory and SVM. IEEE Trans Cybernetics (2020). doi: 10.1109/tcyb.2020.3032707
31. Sui S, An X, Xu C, Li Z, Hua Y, Huang G, et al. An Immune Cell Infiltration-Based Immune Score Model Predicts Prognosis and Chemotherapy Effects in Breast Cancer. Theranostics (2020) 10:11938–49. doi: 10.7150/thno.49451
32. Cannon A, Thompson CM, Maurer HC, Atri P, Bhatia R, West S, et al. CXCR3 and Cognate Ligands are Associated With Immune Cell Alteration and Aggressiveness of Pancreatic Ductal Adenocarcinoma. Clin Cancer Res (2020) 26:6051–63. doi: 10.1158/1078-0432.Ccr-20-1359
33. Zhang C, Chen T, Li Z, Liu A, Xu Y, Gao Y, et al. Depiction of Tumor Stemlike Features and Underlying Relationships With Hazard Immune Infiltrations Based on Large Prostate Cancer Cohorts. Briefings Bioinf (2021) 22(3):bbaa211. doi: 10.1093/bib/bbaa211
34. Gossec L, Portier A, Landewé R, Etcheto A, Navarro-Compán V, Kroon F, et al. Preliminary Definitions of ‘Flare’ in Axial Spondyloarthritis, Based on Pain, BASDAI and ASDAS-CRP: An ASAS Initiative. Ann Rheumatic Dis (2016) 75:991–6. doi: 10.1136/annrheumdis-2015-208593
35. Kolaczkowska E, Kubes P. Neutrophil Recruitment and Function in Health and Inflammation. Nat Rev Immunol (2013) 13:159–75. doi: 10.1038/nri3399
36. Mittal M, Siddiqui MR, Tran K, Reddy SP, Malik AB. Reactive Oxygen Species in Inflammation and Tissue Injury. Antioxid Redox Signaling (2014) 20:1126–67. doi: 10.1089/ars.2012.5149
37. Castanheira FVS, Kubes P. Neutrophils and NETs in Modulating Acute and Chronic Inflammation. Blood (2019) 133:2178–85. doi: 10.1182/blood-2018-11-844530
38. Min XL, He M, Shi Y, Xie L, Ma XJ, Cao Y. miR-18b Attenuates Cerebral Ischemia/Reperfusion Injury Through Regulation of ANXA3 and PI3K/Akt Signaling Pathway. Brain Res Bull (2020) 161:55–64. doi: 10.1016/j.brainresbull.2020.04.021
39. Yan Z, Wu Q, Cai W, Xiang H, Wen L, Zhang A, et al. Identifying Critical Genes Associated With Aneurysmal Subarachnoid Hemorrhage by Weighted Gene Co-Expression Network Analysis. Aging (2021) 13:22345–60. doi: 10.18632/aging.203542
40. Karch CM, Goate AM. Alzheimer’s Disease Risk Genes and Mechanisms of Disease Pathogenesis. Biol Psychiatry (2015) 77:43–51. doi: 10.1016/j.biopsych.2014.05.006
41. Campion D, Charbonnier C, Nicolas G. SORL1 Genetic Variants and Alzheimer Disease Risk: A Literature Review and Meta-Analysis of Sequencing Data. Acta Neuropathol (2019) 138:173–86. doi: 10.1007/s00401-019-01991-4
42. Rosenberg RN, Lambracht-Washington D, Yu G, Xia W. Genomics of Alzheimer Disease: A Review. JAMA Neurol (2016) 73:867–74. doi: 10.1001/jamaneurol.2016.0301
43. Hung C, Livesey FJ. Endolysosome and Autophagy Dysfunction in Alzheimer Disease. Autophagy (2021) 17(11):3882–3. doi: 10.1080/15548627.2021.1963630
Keywords: Ankylosing spondylitis, immune cell infiltration, immune cell correlation analysis, hypoxia, high-throughput sequencing, immunohistochemical analysis, BASDAI
Citation: Jiang J, Zhan X, Qu H, Liang T, Li H, Chen L, Huang S, Sun X, Jiang W, Chen J, Chen T, Yao Y, Wu S, Zhu J and Liu C (2022) Upregulated of ANXA3, SORL1, and Neutrophils May Be Key Factors in the Progressionof Ankylosing Spondylitis. Front. Immunol. 13:861459. doi: 10.3389/fimmu.2022.861459
Received: 24 January 2022; Accepted: 18 March 2022;
Published: 06 April 2022.
Edited by:
Giuseppe Murdaca, University of Genoa, ItalyReviewed by:
Pawan Krishan, Punjabi University, IndiaYutong Jiang, Third Affiliated Hospital of Sun Yat-sen University, China
Copyright © 2022 Jiang, Zhan, Qu, Liang, Li, Chen, Huang, Sun, Jiang, Chen, Chen, Yao, Wu, Zhu and Liu. This is an open-access article distributed under the terms of the Creative Commons Attribution License (CC BY). The use, distribution or reproduction in other forums is permitted, provided the original author(s) and the copyright owner(s) are credited and that the original publication in this journal is cited, in accordance with accepted academic practice. No use, distribution or reproduction is permitted which does not comply with these terms.
*Correspondence: Chong Liu, bGNneHlrZHhAMTYzLmNvbQ==