 Siran Tan
 Zhi Zheng2
- 1Engineering Research Center for Medicine, Ministry of Education, Harbin University of Commerce, Harbin, China
- 2Jiangxi Province People’s Hospital, First Affiliated Hospital of Nanchang Medical College, Nanchang, China
- 3Heilongjiang River Fisheries Research Institute, Chinese Academy of Fishery Sciences, Harbin, China
- 4Jiangxi Cancer Hospital, Jiangxi TCM Cancer Center, Nanchang, China
Schisandrin B (Sch B) is well-known for its antitumor effect; however, its underlying mechanism remains confusing. Our study aimed to investigate the role of selenoproteins in Sch B-induced autophagy and Th1/Th2 imbalance in Hepa1-6 cells. Hepa1-6 cells were chosen to explore the antitumor mechanism and were treated with 0, 25, 50, and 100 μM of Sch B for 24 h, respectively. We detected the inhibition rate of proliferation, transmission electron microscopy (TEM), monodansylcadaverine (MDC) staining, reactive oxygen species (ROS) level and oxidative stress-related indicators, autophagy-related genes, related Th1/Th2 cytokines, and selenoprotein mRNA expression. Moreover, the heat map, principal component analysis (PCA), and correlation analysis were used for further bioinformatics analysis. The results revealed that Sch B exhibited well-inhibited effects on Hepa1-6 cells. Subsequently, under Sch B treatment, typical autophagy characteristics were increasingly apparent, and the level of punctate MDC staining enhanced and regulated the autophagy-related genes. Overall, Sch B induced autophagy in Hepa1-6 cells. In addition, Sch B-promoted ROS accumulation eventually triggered autophagy initiation. Results of Th1 and Th2 cytokine mRNA expression indicated that Th1/Th2 immune imbalance was observed by Sch B treatment in Hepa1-6 cells. Intriguingly, Sch B downregulated the majority of selenoprotein expression. Also, the heat map results observed significant variation of autophagy-related genes, related Th1/Th2 cytokines, and selenoprotein expression in response to Sch B treatment. PCA outcome suggested the key role of Txnrd1, Txnrd3, Selp, GPX2, Dio3, and Selr with its potential interactions in ROS-mediated autophagy and Th1/Th2 imbalance of Hepa1-6 cells. In conclusion, Sch B induced ROS-mediated autophagy and Th1/Th2 imbalance in Hepa1-6 cells. More importantly, the majority of selenoproteins were intimately involved in the process of autophagy and Th1/Th2 imbalance, Txnrd3, Selp, GPX2, Dio3, and Selr had considerable impacts on the process.
Introduction
Tumor treatment and uncovering antineoplastic drug mechanisms have attracted intense research efforts. Extensive research has established that natural products extracted and isolated from plants combined with anticancer active substances can help reduce the dosage of anticancer agents and the occurrence of side effects, so these natural active ingredients can be used as cofactors for anticancer treatment (1). Schisandrin B (Sch B), extracted from the traditional Chinese medicinal herb Schisandra chinensis Baill., is one of the most active monomers of lignans (2). Existing research recognized the critical role of Sch B in anti-tumor, antioxidant and hepatoprotective effects (3, 4). The antitumor activity of Sch B included promoting apoptosis, inhibiting proliferation, and impairing tumor angiogenesis in various cancer cells (5). There has been little analysis, and systematic understanding of how Sch B exerts its anticancer action is still lacking.
Autophagy is an evolutionarily conserved mechanism for cellular self-digestion that can be involved in maintaining the stability of the internal environment and cellular viability (6). Autophagy is closely linked to tumor suppression and tumor survival. Under normal physiological conditions, autophagy facilitates cells to maintain a self-stable state (7). In case of stress, it can prevent the accumulation of toxic or oncogenic damaged proteins and organelles and inhibits cellular carcinogenesis. Whereas, once tumors are formed, autophagy provides richer nutrients for cancer cells and promotes tumor growth (8). Therefore, autophagy suppresses tumor initiation yet enhances tumor progression (9). Autophagy can be activated under multiple states of stress such as oxidative stress, growth factor deficiency, microbial infection, organelle damage, protein misfolding or aggregation, and DNA damage (10). High levels of reactive oxygen species (ROS) have been detected in the promotion and progression of multiple tumors (11); meanwhile, ROS accumulation is indispensable for the initiation of autophagy (12). Therefore, the mechanisms by which drugs exert anticancer effects by activating oxidative stress and thus inducing autophagy are of notable attention. The ginsenoside Rb1 metabolite K induced both autophagy and apoptosis in HCT-116 cells by producing ROS and activating the c-Jun N-terminal kinase (JNK) pathway (13). Saxifragifolin D increased the expression of LC3-II, Beclin-1 proteins in MCF-7 and MDA-MB-231 cells, and induced apoptosis and autophagy in breast cancer cells through the ROS-mediated endoplasmic reticulum (ER) stress pathway, therefore inhibiting cancer cell proliferation (14). The induction of ROS and activation of nuclear factor (NF)-κB by gemcitabine (GEM) are required for the effect of antiproliferative synergism in pancreatic cancer cells (15). There is mounting evidence that Th1/Th2 imbalance leads to cancer progression due to their essential role in immunomodulatory function (16, 17). Th1 and Th2 are two subgroups of CD4+ T cells with diverse cytokine production and regulating multiple mechanisms of action in tumor immunity (18, 19). Studies have shown that most tumor tissues are in a state of Th2 cytokine dominance, which is one of the mechanisms of tumor immune escape (20). Compared to healthy subjects, most melanoma patients revealed visibly lower expressions of interleukin (IL)-2 and interferon (IFN)-γ and elevated pathological levels of IL-4, IL-6, and IL-10 demonstrated that the disease was related to Th1/Th2 imbalance (21). Therefore, transferring the Th1/Th2 balance to Th1 to provide a novel protocol for tumor immunotherapy has become a current research hot spot. Saikosaponin A enhanced antitumor immunity by shifting the Th1/Th2 balance toward Th1 and significantly inhibited breast cancer tumor growth and tumor cell proliferation (22). The study aimed to investigate the impact of fire needle stimulation at Sihua acupoints combined with chemotherapy on Th1/Th2 imbalance in non-small cell lung cancer (NSCLC). The results indicated that the expressions of IL-2 and IFN-γ were elevated and of IL-4 and IL-10 were reduced in the treatment group, which illustrated that it can enhance the function of Th1 cells and decrease the function of Th2 cells, altering the imbalance of Th1 and Th2 (23).
Selenoproteins, the catalytic activity center is selenocysteine (Sec), are the main carriers of selenium for physiological functions (24). Sec is mainly located in the redox catalytic site and has a higher redox potential (25). Selenoproteins exist primarily in the form of redox enzymes and carry out very diverse functions such as regulation of cellular oxidative stress, immune function, ER stress, and autophagy, which are integrally related to the development of diverse tumors (26, 27). As mentioned, autophagy is activated under oxidative stress situations. Hence, extensive research suggested selenoproteins as potential molecular targets for anticancer agents that induce oxidative stress, autophagy, and immunity (28–30). Overexpression of Selh in HT22 cells reversed glutamate-induced increase in ROS production and autophagy imbalance (31). The inhibition effect of cyanidin on renal cell carcinoma was correlated with downregulation of early growth response gene 1 (EGR1) and Selw expression, while modulating the expression of autophagy-related proteins P62 and ATG4 (32). Txndr suppression increased the expression of IL-1β, IL-6, IL-8, and IL-10, which indicated autophagy occurred with a strong immune response in Txn-deficient cardiomyocytes (33).
This study set out to assess the effect of selenoproteins on Sch B inhibiting Hepa1-6 cell proliferation through increasing ROS production and subsequent activation of autophagy and shifting Th1/Th2 balance then regulating immunity. We cultured Hepa1-6 cells with 0-, 25-, 50-, and 100-μM Sch B treatment and then detected the proliferation, autophagy, Th1/Th2 imbalance, and oxidative stress levels in Hepa1-6 cells. Accordingly, to reveal the specific role of selenoproteins in regulating autophagy, oxidative stress, and Th1/Th2 imbalance, we examined the mRNA levels of 25 selenoproteins and performed bioinformatic analysis.
Materials and Methods
Cell Culture
Murine hepatocarcinoma cell line Hepa1-6 was gifted by Jiangxi TCM Cancer Center Laboratory. Cells were cultivated in Dulbecco’s modified Eagle’s medium (DMEM) with 10% Fetal Bovine Serum (FBS) and 1% penicillin/streptomycin and maintained at 37°C in a 5% CO2 incubator. Hepa1-6 cells incubated with culture medium were added with 25-, 50-, and 100-μM concentrations of Sch B dissolved in dimethyl sulfoxide (DMSO) for 24 h. The same volume of DMSO was substituted as a control.
Cell Proliferation Assay
The Cell Counting Kit-8 assay (Sant Biotechnology, Shanghai, China) was used to monitor cell proliferation. Here, 5 × 10³ cells/well were seeded into 96-well plates and cultivated with Sch B treatment at 0-, 25-, 50-, and 100-μM concentrations for 24 h. Then, 10-μl CCK8 solution was transferred into each well for 2 h, and the absorbance was measured at 450 nm.
Sections for Electron Microscopy
Hepa1-6 cells were treated with 0-, 25-, 50-, 100-μM concentrations of Sch B dissolved in DMSO for 24 h. The cells were collected into a tube and centrifuged at 250×g for 10 min, then the supernatant was discarded. Cell samples were fixed overnight in 2.5% glutaraldehyde at 4°C, rinsed 3 times with 0.1 M phosphate buffer, and then fixed with osmic acid for 1 h at 4°C. Immediately afterward, they were dehydrated with 50%, 70%, 90%, and 100% ethanol and 100% acetone, respectively, rinsed 3 times with 0.1 M phosphate-buffered saline (pH 7.2), and then fixed with 1% osmic acid for 1 h at 4°C. Afterward, samples were dehydrated with 50%, 70%, 90%, and 100% ethanol and 100% acetone, respectively. Next, the samples were macerated, embedded, aggregated, and then sectioned approximately 50–60 nm with an ultramicrotome. The microphotographs were taken with a transmission electron microscope (GEM-1200ES, Japan).
Monodansylcadaverine Staining
Monodansylcadaverine (MDC) is a fluorescent chrome that is commonly used to detect specific marker stains for autophagosome formation. The analysis of autophagy was undergone by MDC (Solarbio, Beijing, China). Hepa1-6 cells were treated with 0-, 25-, 50-, 100-μM concentrations of Sch B dissolved in DMSO for 24 h in 12-well plates. Cells were incubated with 0.05 mM MDC in PBS at room temperature away from light for 30 min. The fluorescent images were obtained with a fluorescence microscope with 355-nm excitation filter and 512-nm barrier filter (Leica, Wetzlar, Germany), and cell number was counted to normalize the measurement.
Detection of Intracellular Reactive Oxygen Species and Oxidative Stress-Related Indicators
Measurement of intracellular ROS used the ROS detection kit (Beyotime, Shanghai, China). After 24-h incubation with 0-, 25-, 50-, 100-μM concentrations of Sch B, cells were incubated with 10 μM 2,7-Dichlorodihydrofluorescein diacetate (DCFH-DA) for 30 min at 37°C. Then, cells were washed with serum-free medium 3 times and measured by fluorescence microscopy (Leica, Wetzlar, Germany). Oxidative stress-related factors superoxide dismutase (SOD), malondialdehyde (MDA), glutathione (GSH), and glutathione peroxidase (GSH-px) were explored according to the protocols of the corresponding kit (Nanjing Jiancheng Bioengineering Institute, China). The absorbance was estimated at 550, 532, 405, and 412 nm, respectively.
Determination of the mRNA Expression of Autophagy-Related Genes, Related Th1/Th2 Cytokines, and Selenoproteins
Total RNA was extracted from cultured cells by using TRIzol reagent (Invitrogen, Shanghai, China). cDNA was synthesized from 5 mg of the total RNA using oligo dT primers and Superscript II reverse transcriptase according to the manufacturer’s instructions (Promega, Beijing, China). Autophagy-related genes (LC3, P62, Beclin1, mTOR, ATG1, ATG4, ATG5, ATG7, ATG10, ATG12), related Th1/Th2 cytokines (IL-2, TNF-α, IFN-γ, IL-12, IL-4, IL-5, IL-6, IL-10), and selenoprotein primers (GPX1, GPX2, GPX3, GPX4, GPX6, Txnrd1, Txnrd2, Txnrd3, Dio1, Dio2, Dio3, Sep15, Selh, Selt, Selw, SPS2, Selm, Selp, Selv, Selo, Selr, Sels, Seli, Selk) were designed by Primer Premier Software (PREMIER Biosoft International, USA) and are listed in Table 1. qRT-PCR was performed to detect the target genes by using Fast Universal SYBR Green Master Mix (Roche, Basel, Switzerland) on the Light Cycler® 480 System (Roche, Basel, Switzerland). Reactions were performed in a 10-μl reaction mixture containing 5 μl of 2× SYBR Green I PCR Master Mix (Roche, Basel, Switzerland), 1 μl of cDNA, 0.2 μl of each primer (10 μM), 0.2 μl of 50× ROX reference Dye II, and 3.4 μl of PCR-grade water. The reaction mixture was then subjected to a thermal profile of denaturation as follows: 1 cycle at 95°C for 30 s and 40 cycles at 95°C for 15 s and 60°C for 30 s. mRNA expression was normalized to β-actin and calculated using the 2-ΔΔCT method.
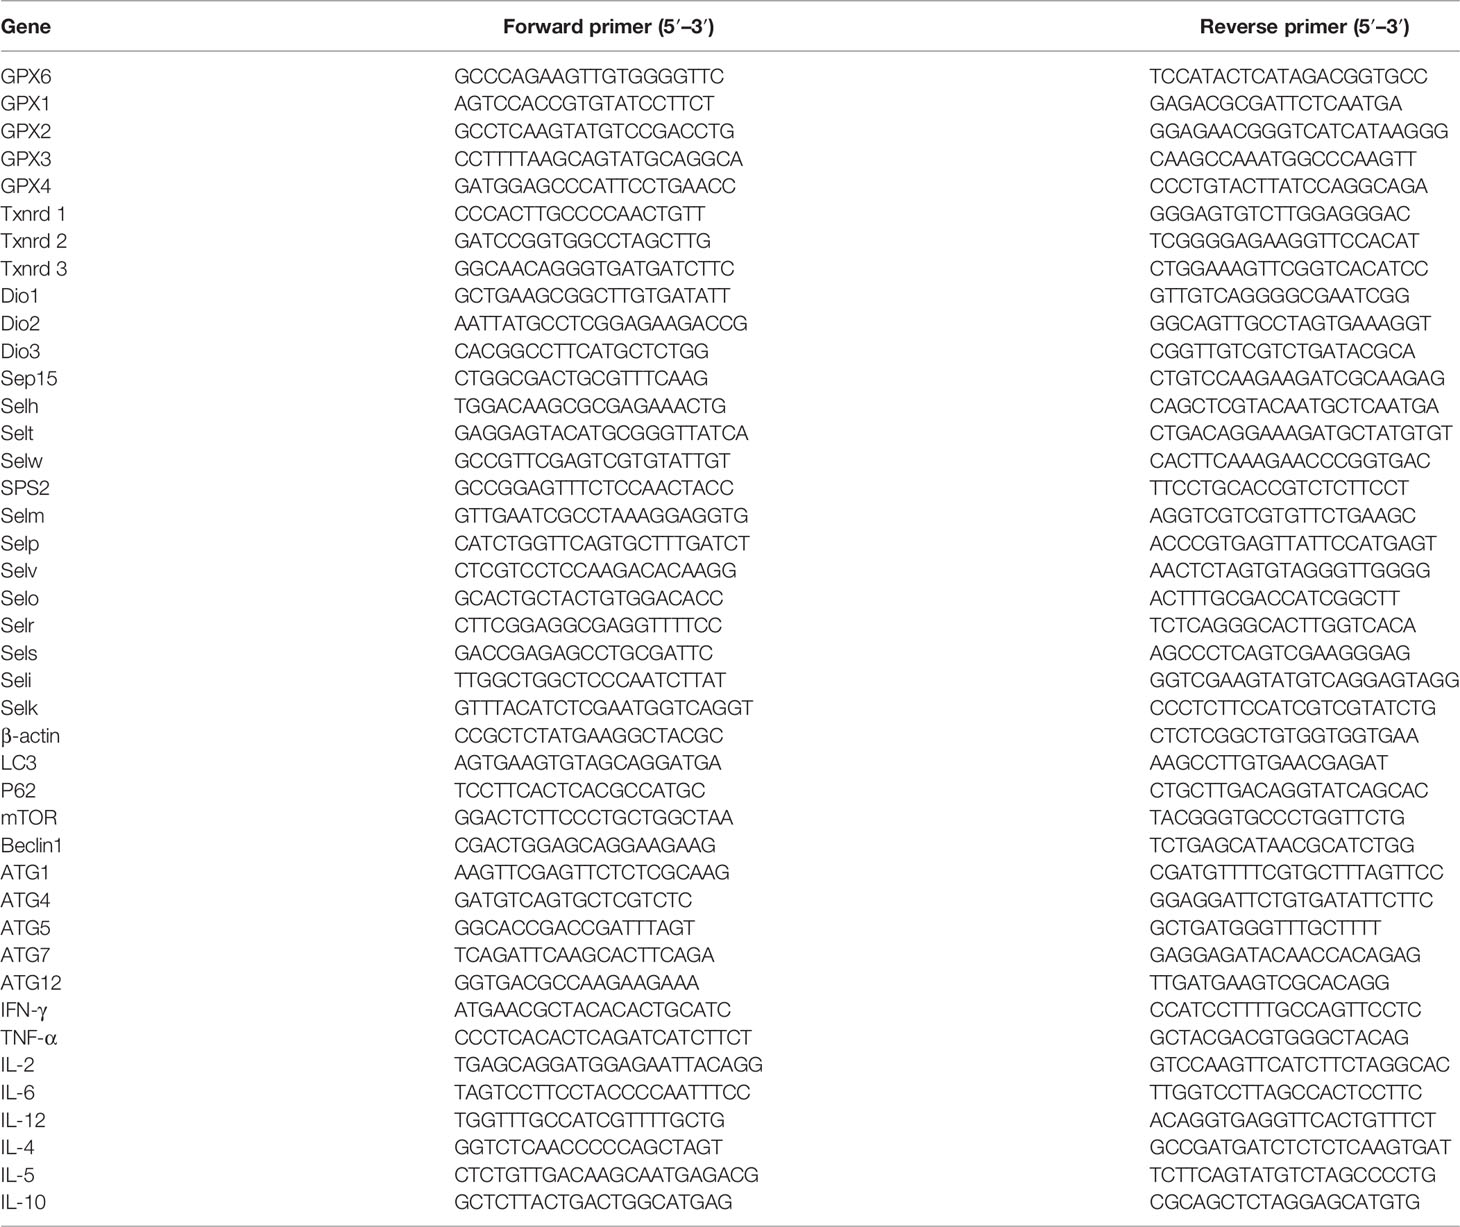
Table 1 The primers used in the present study.
Statistical Analyses
The heat map was generated by https://hiplot.com.cn/basic/heatmap and ranked genes by the degree of expression levels of autophagy-related genes, related Th1/Th2 cytokines, and selenoproteins. SPSS 13.0 program (SPSS, Chicago, IL, USA) was used to execute principal component analysis (PCA), and correlation analysis was performed by Pearson’s correlation coefficient analysis. All data were statistically analyzed by one-way ANOVA, showed a normal distribution, and passed equal variance testing using GraphPad Prism version 8.0 software and SPSS 13.0. The experimental data are expressed as the mean ± SD, and the differences were considered to be significant if P < 0.05; * means significantly different (P < 0.05) from the control group.
Results
Effect of Schisandrin B on the Proliferation of Hepa1-6 Cells
CCK8 proliferation assay aimed to examine the impact on proliferation rates with increased Sch B concentration in Hepa1-6 cells. As can be seen from Figure 1, the marked increase in cell inhibition rate was accompanied by increased Sch B treatment.
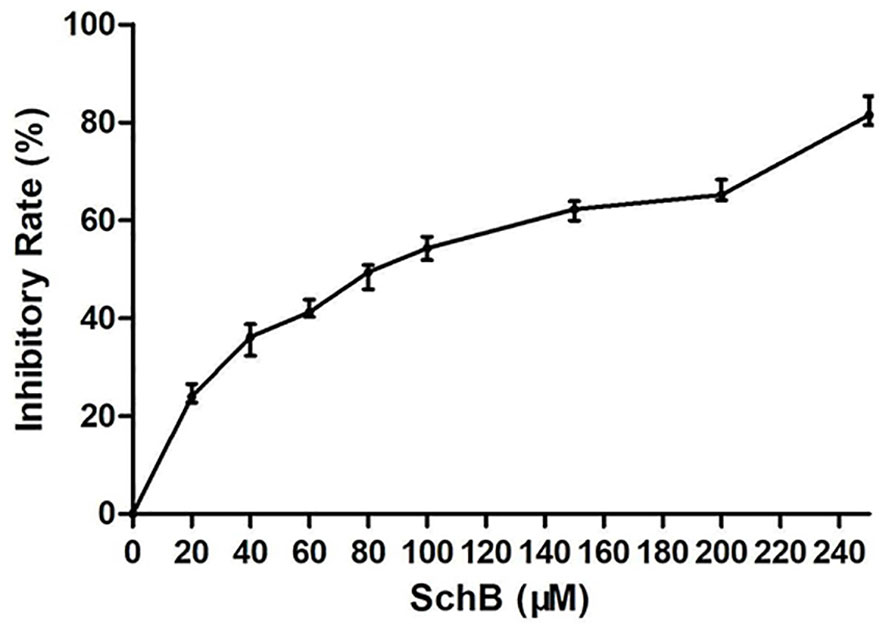
Figure 1 Sch B inhibits proliferation in Hepa1-6 cells. Proliferation curve of Hepa1-6 cells treated with Sch B.
Effect of Schisandrin B on Autophagy of Hepa1-6 Cells
Hepa1-6 cells were subjected to transmission electron microscopy (TEM) to reveal Sch B‐induced ultracellular structure. The control group exhibited normal cell morphology (Figure 2A). Here, 25-μM Sch B treatment caused cell shrinkage, nuclear condensation, and mitochondrial swelling, and a few autophagosomes were observed (Figure 2B). With growing Sch B treatment, typical autophagy characteristics were increasingly apparent, with an elevated number of the autolysosomes and autophagic vacuolization observed in the Hepa1-6 cells (Figures 2C, D).
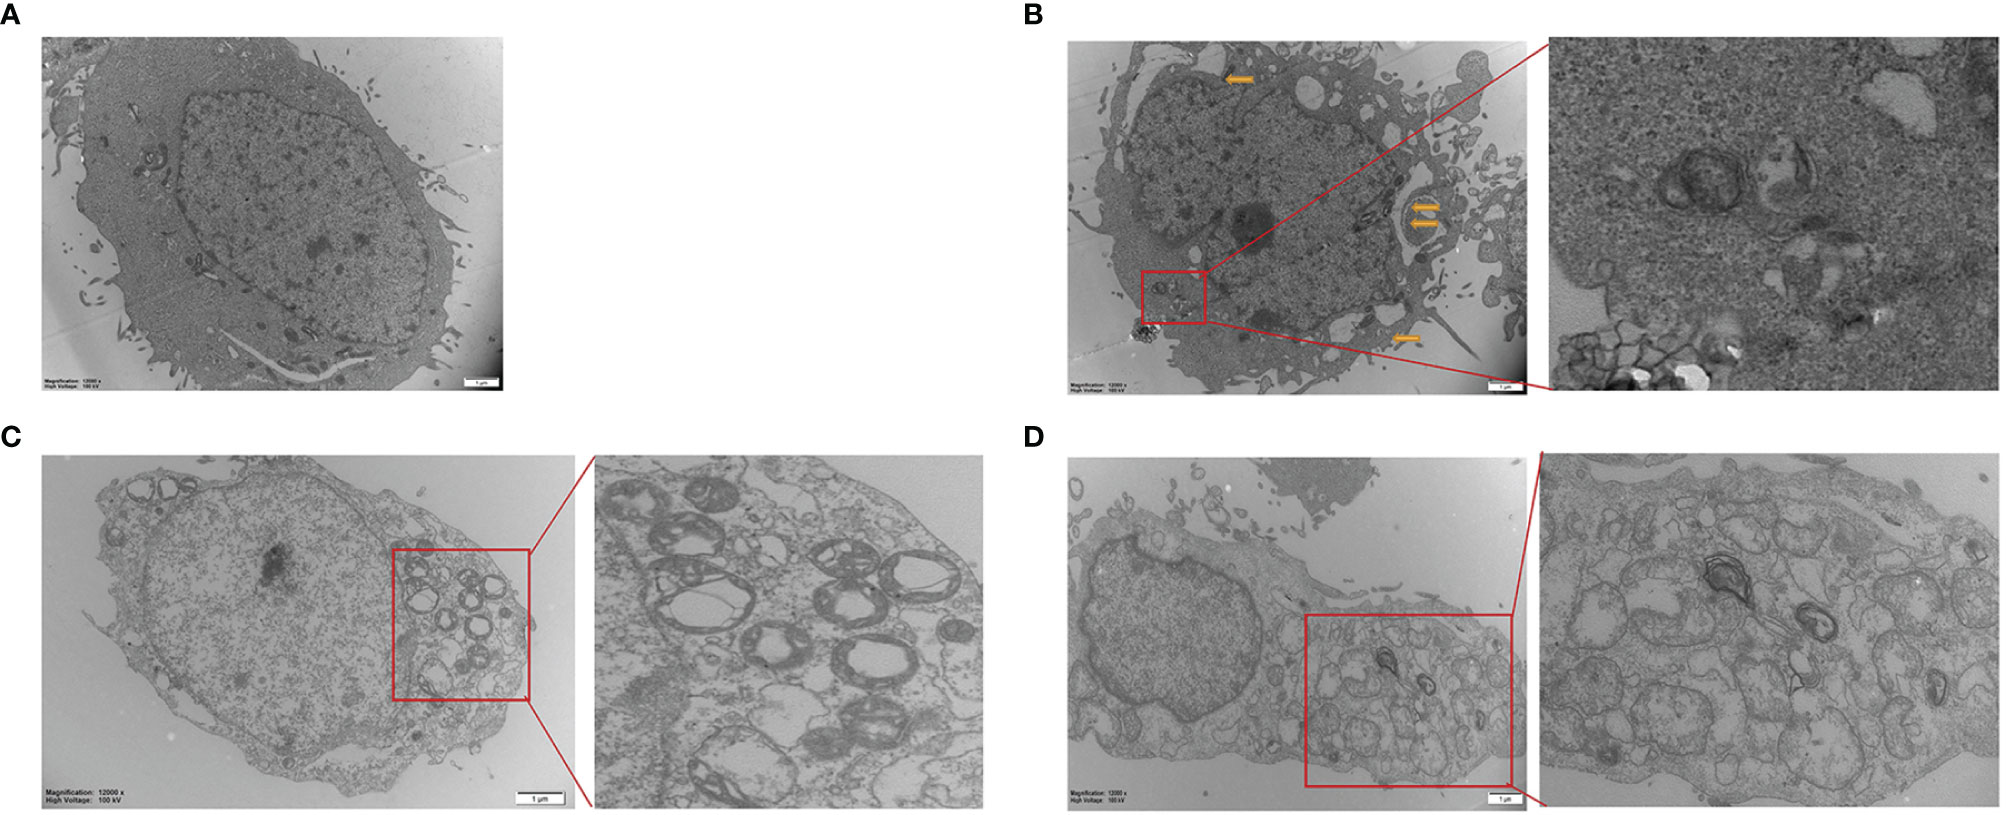
Figure 2 Transmission electron microscope images of Hepa1-6 cells treated with 0 (A), 25-μM (B), 50-μM (C), and 100-μM (D) Sch (B) The yellow arrows are pointing to the mitochondrial swelling, mitochondrial ridge breakage. An enlarged portion of the spectrogram (red box) is shown on the right showing vacuolar and cytoplasmic localized membrane-bound autophagosome.
The fluorescent dye MDC was used to monitor autophagic vacuoles in Hepa1-6 cells. Normal cells show yellow-green fluorescence; moreover, one hallmark of autophagy is the formation of vacuoles that stain with MDC, resulting in a punctate green fluorescence. As noticed in Figures 3A, B, the fluorescence intensity of MDC staining in Hepa1-6 cells was relatively exiguous and weak in the control group. In addition, the level of punctate MDC staining enhanced and outnumbered in a dose-dependent manner with increasing Sch B treatment.
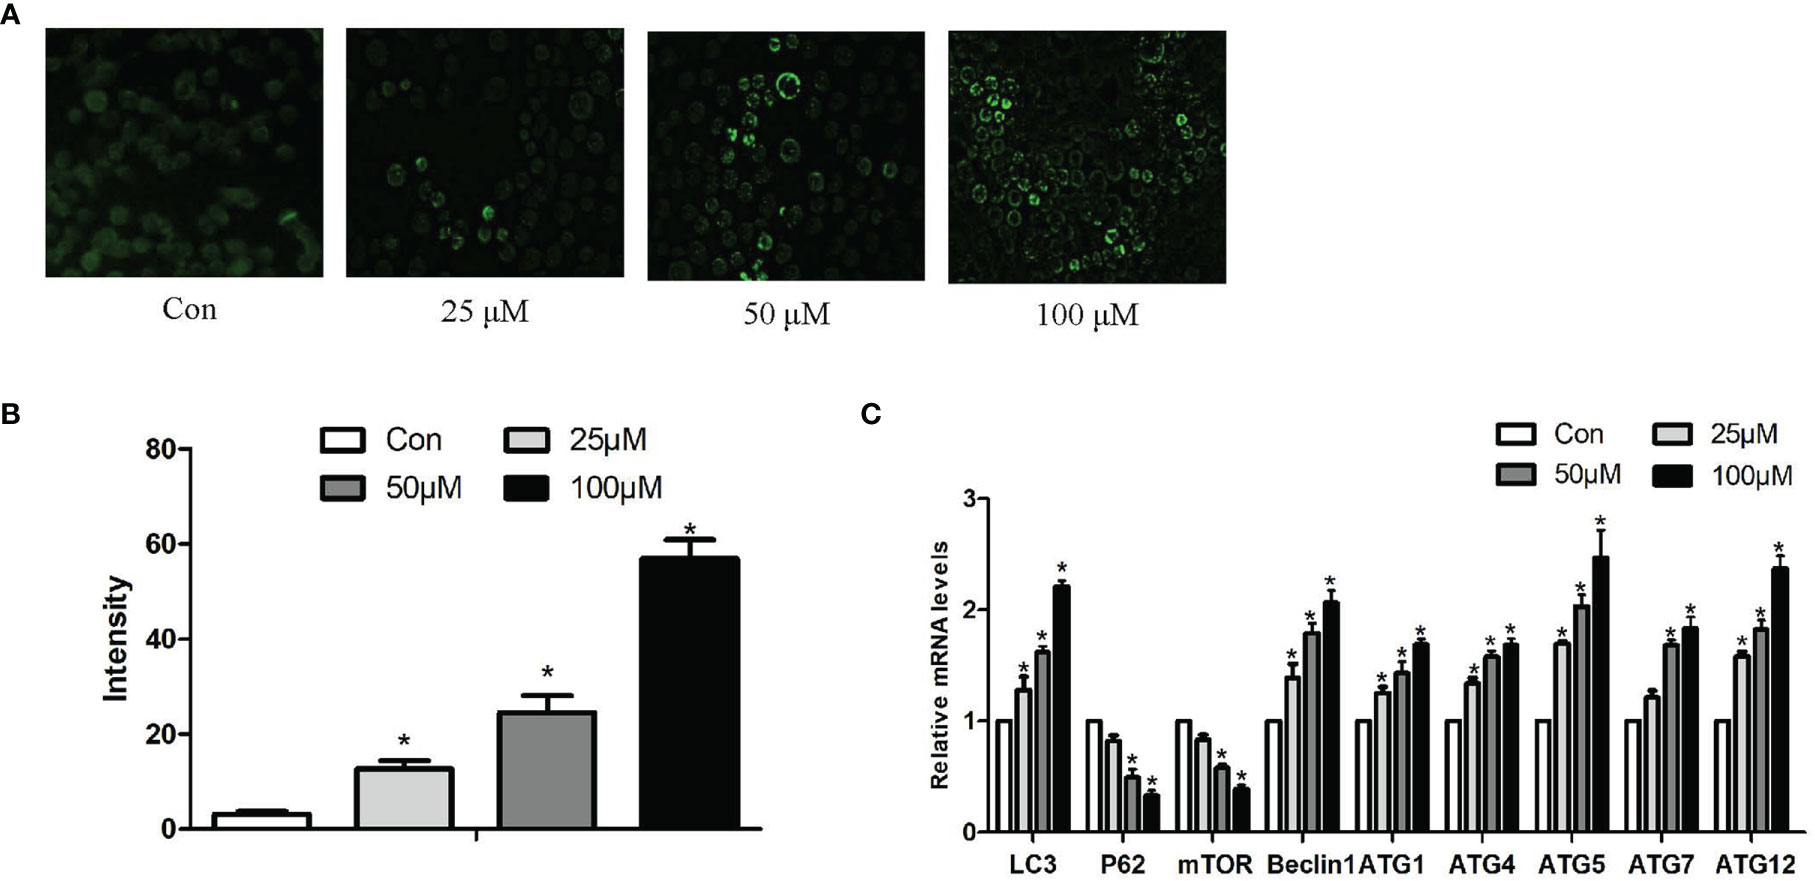
Figure 3 Effects of Sch B on autophagy in Hepa1-6 cells. (A) MDC staining was performed in Hepa1-6 cells with Sch B treatment at 0-, 25-, 50-, and 100-μM concentrations. Hepa1-6 cells were visualized using fluorescence microscopy. (B) The quantitative analysis of MDC staining. (C) Autophagy-related gene mRNA levels in Hepa1-6 cells with 0-, 25-, 50-, and 100-μM Sch B treatment. ∗ shows a significant difference from the corresponding control (P < 0.05). n = 3.
In order to further prove that Sch B induces autophagy of Hepa1-6 cells, we investigated the mRNA expression of autophagy-related genes. qRT-PCR analysis indicated, accompanying increased Sch B concentration, increased levels of LC3, Beclin1, ATG1, ATG4, ATG5, ATG7, ATG10, and ATG12, also, low-level expressions of P62 and mammalian target of rapamycin (mTOR) (Figure 3C).
Effect of Schisandrin B on Oxidative Stress of Hepa1-6 Cells
The production of ROS, the content of MDA, GSH and the activity of GSH-Px, SOD set out to determine whether Sch B induced oxidative stress in Hepa1-6 cells. Figure 4A illustrated that the increase in Sch B concentration was related to the ROS activities significantly increased. It can be seen from the data in Figure 4B that as the concentration of Sch B rises, there was an observed increase in the levels of MDA and a decline in the content of GSH and the activity of SOD and GSH-Px compared to those of the control group in Hepa1-6 cells.
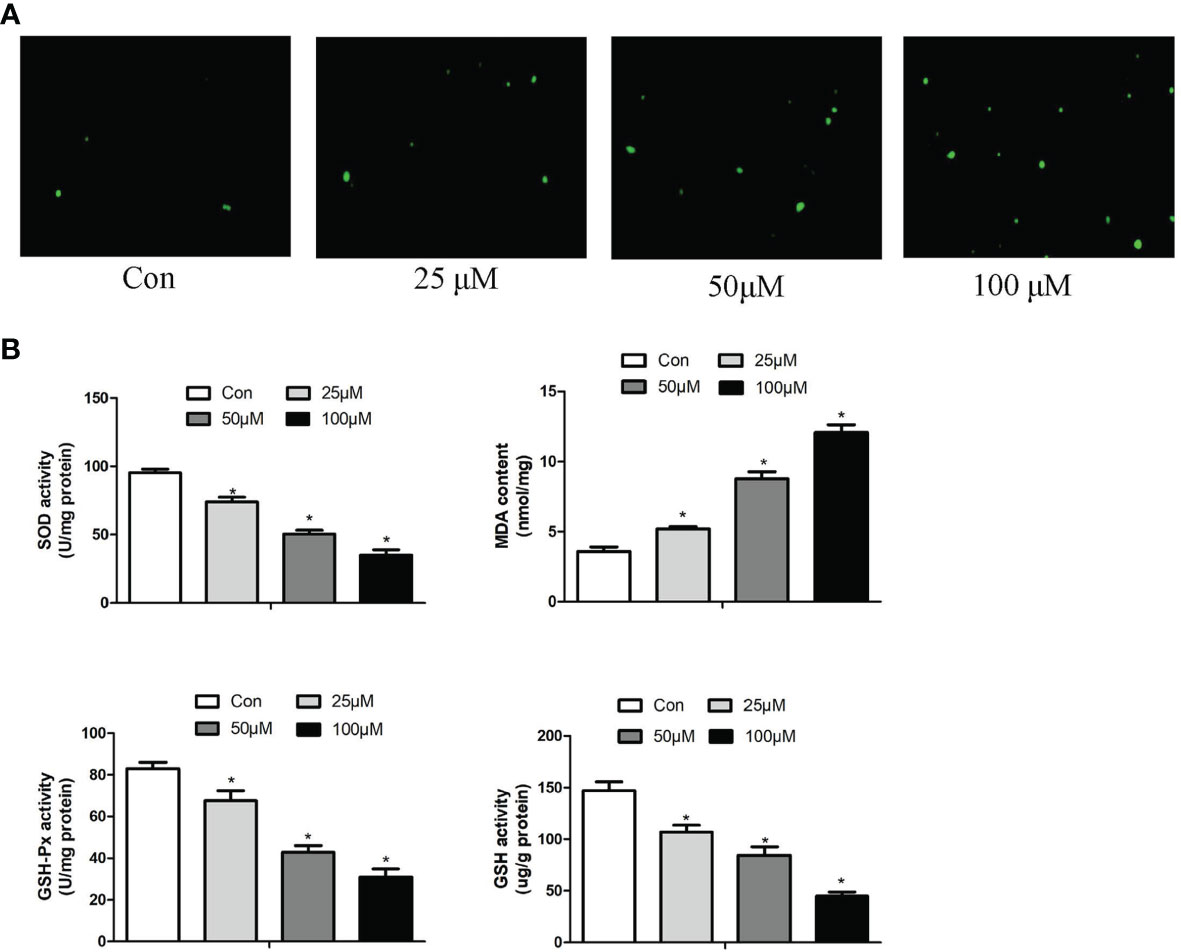
Figure 4 Effects of Sch B on oxidative stress in Hepa1-6 cells. (A) ROS generation was performed by immunofluorescence with 0-, 25-, 50-, and 100-μM Sch B treatment in Hepa1-6 cells. Hepa1-6 cells were visualized using fluorescence microscopy. (B) Oxidative stress markers of the SOD, MDA, GSH, and GSH-Px contents were measured in Hepa1-6 cells with 0-, 25-, 50-, and 100-μM Sch B treatment. ∗ shows a significant difference from the corresponding control (P < 0.05). n = 3.
Effect of Schisandrin B on Th1/Th2 Imbalance of Hepa1-6 Cells
In order to explore the effect of Sch B in regulating Th1/Th2 imbalance in Hepa1-6 cells, the mRNA expressions of related Th1/Th2 cytokines were detected. Th1 cytokine contains IL-2, TNF-α, IFN-γ, and IL-12. Th2 cytokine includes IL-4, IL-5, IL-6, and IL-10. As revealed in Figure 5, Sch B supplement enhanced the expression of IL-2, TNF-α, IFN-γ, and IL-12 and strikingly decreased the expression of IL-4, IL-5, IL-6, and IL-10 (P < 0.05). The results indicated the activation of Th1 and the inhibition of Th2 response with Sch B treatment in Hepa1-6 cells. After Sch B treatment, the abnormal expression of cytokines indicated the imbalance of Th1/Th2 occurring in Hepa1-6 cells.
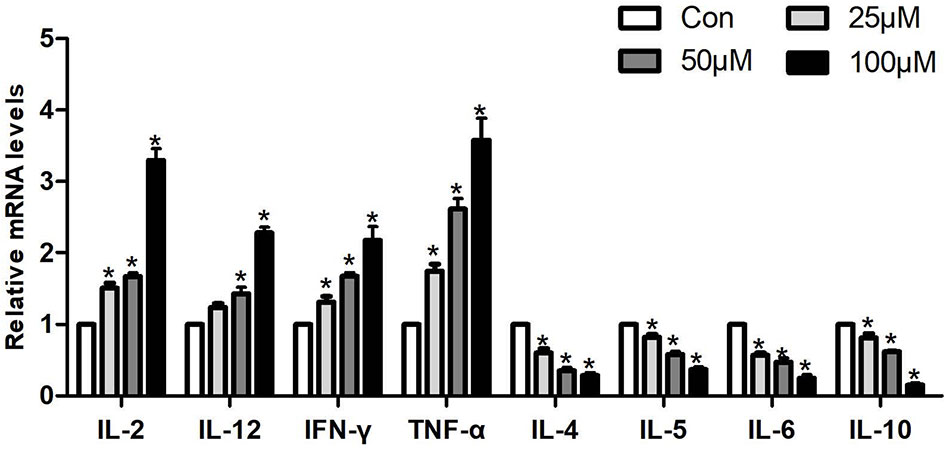
Figure 5 Effects of Sch B on Th1/Th2 imbalance in Hepa1-6 cells. Related Th1/Th2 cytokine mRNA levels with 0-, 25-, 50-, and 100-μM Sch B treatment in Hepa1-6 cells. ∗ shows a significant difference from the corresponding control (P < 0.05). n = 3.
Effect of Schisandrin B on the Expression of Selenoprotein mRNA Levels of Hepa1-6 Cells
We measured the mRNA expression of 25 selenoproteins in Hepa1-6 cells to explore the particular involvement of selenoproteins in Sch B producing oxidative stress hence initiating autophagy and Th1/Th2 imbalance. Figure 6 presented the results obtained from the expression of 25 selenoproteins on treatment of Sch B at 0, 25, 50, and 100 µM, respectively. Txnrd1, Txnrd2, Txnrd3, GPX1, GPX2, Dio1, Dio2, Dio3, GPX6, Selt, Selm, Selp, Selv, Selo, Sels, Selk expression statistically increased with growing Sch B concentration. There is no distinct trend variation of the expression of GPX3, GPX4, Selh, Seli, Seln, Selw, SPS2, and Sep15.
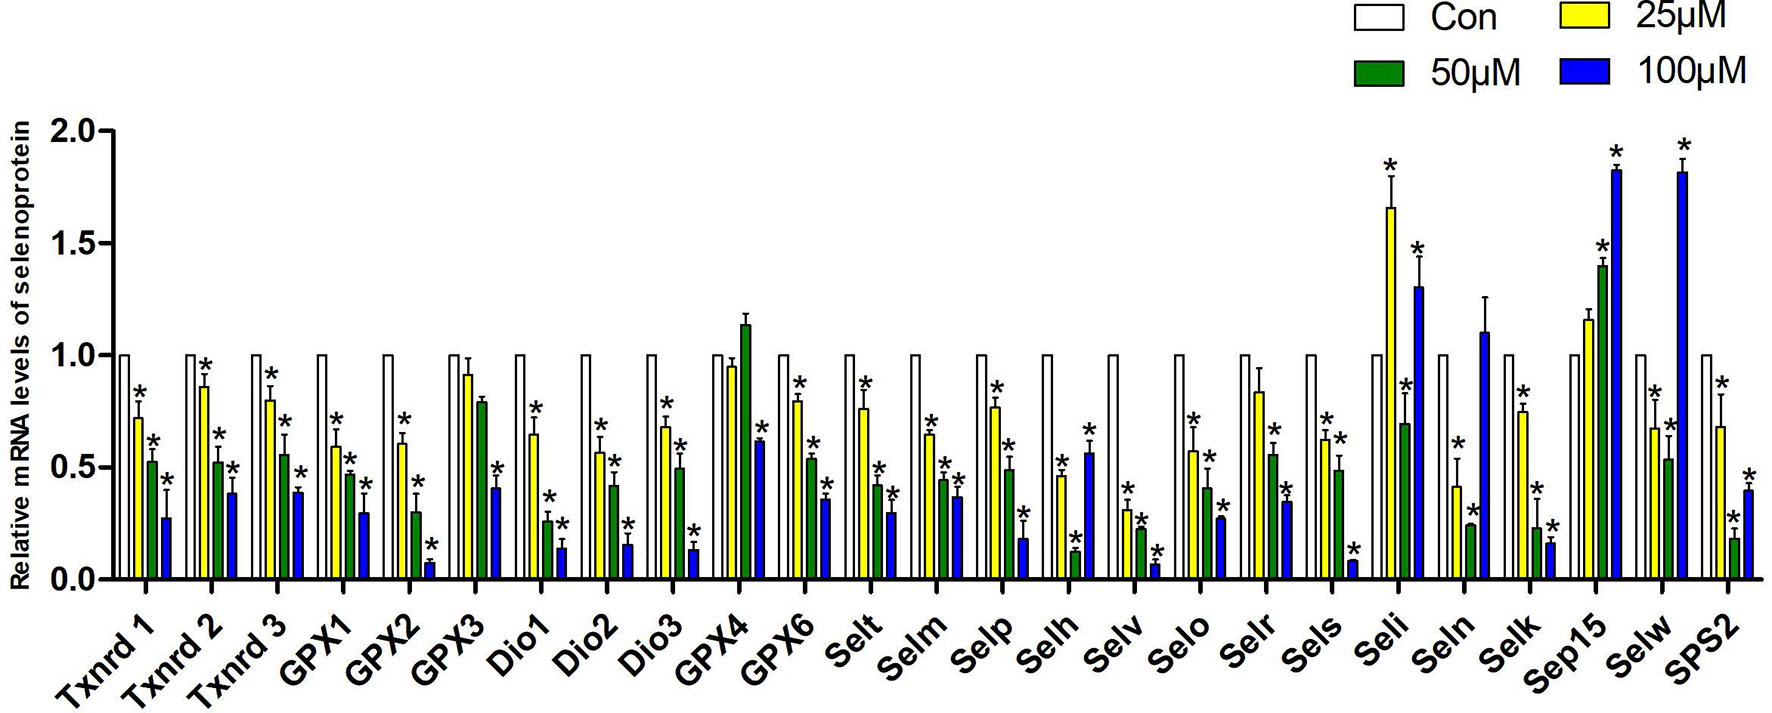
Figure 6 Effects of Sch B on the expression of selenoprotein mRNA levels in Hepa1-6 cells. The 25 selenoprotein mRNA levels with 0-, 25-, 50-, and 100-μM Sch B treatment in Hepa1-6 cells. ∗ shows a significant difference from the corresponding control (P < 0.05). n = 3.
Heat Map Analysis
The results of the heat map analysis were set out in Figure 7; selenoproteins, autophagy-related genes, and related Th1/Th2 cytokine expression were shown by blue to red (low to high) coloration within the heat map with the concentration of Sch B (below the heat map) correlating with mRNA expressions. The heat map colored in blue designates the 18 genes, encompassing Txnrd1, Txnrd2, Txnrd3, GPX1, GPX2, Dio1, Dio2, Dio3, GPX6, Selt, Selm, Selp, Selv, Selo, Sels, Selk, P62, mTOR, IL-4, IL-5, IL-6, IL-10, had negative levels of correlation between increasing Sch B treatment in Hepa1-6 cells. LC3, Beclin1, ATG1, ATG4, ATG5, ATG7, ATG10, ATG12, TNF-α, IFN-γ, IL-2, IL-12, colored in red, had positive level of Sch B growing treatment.
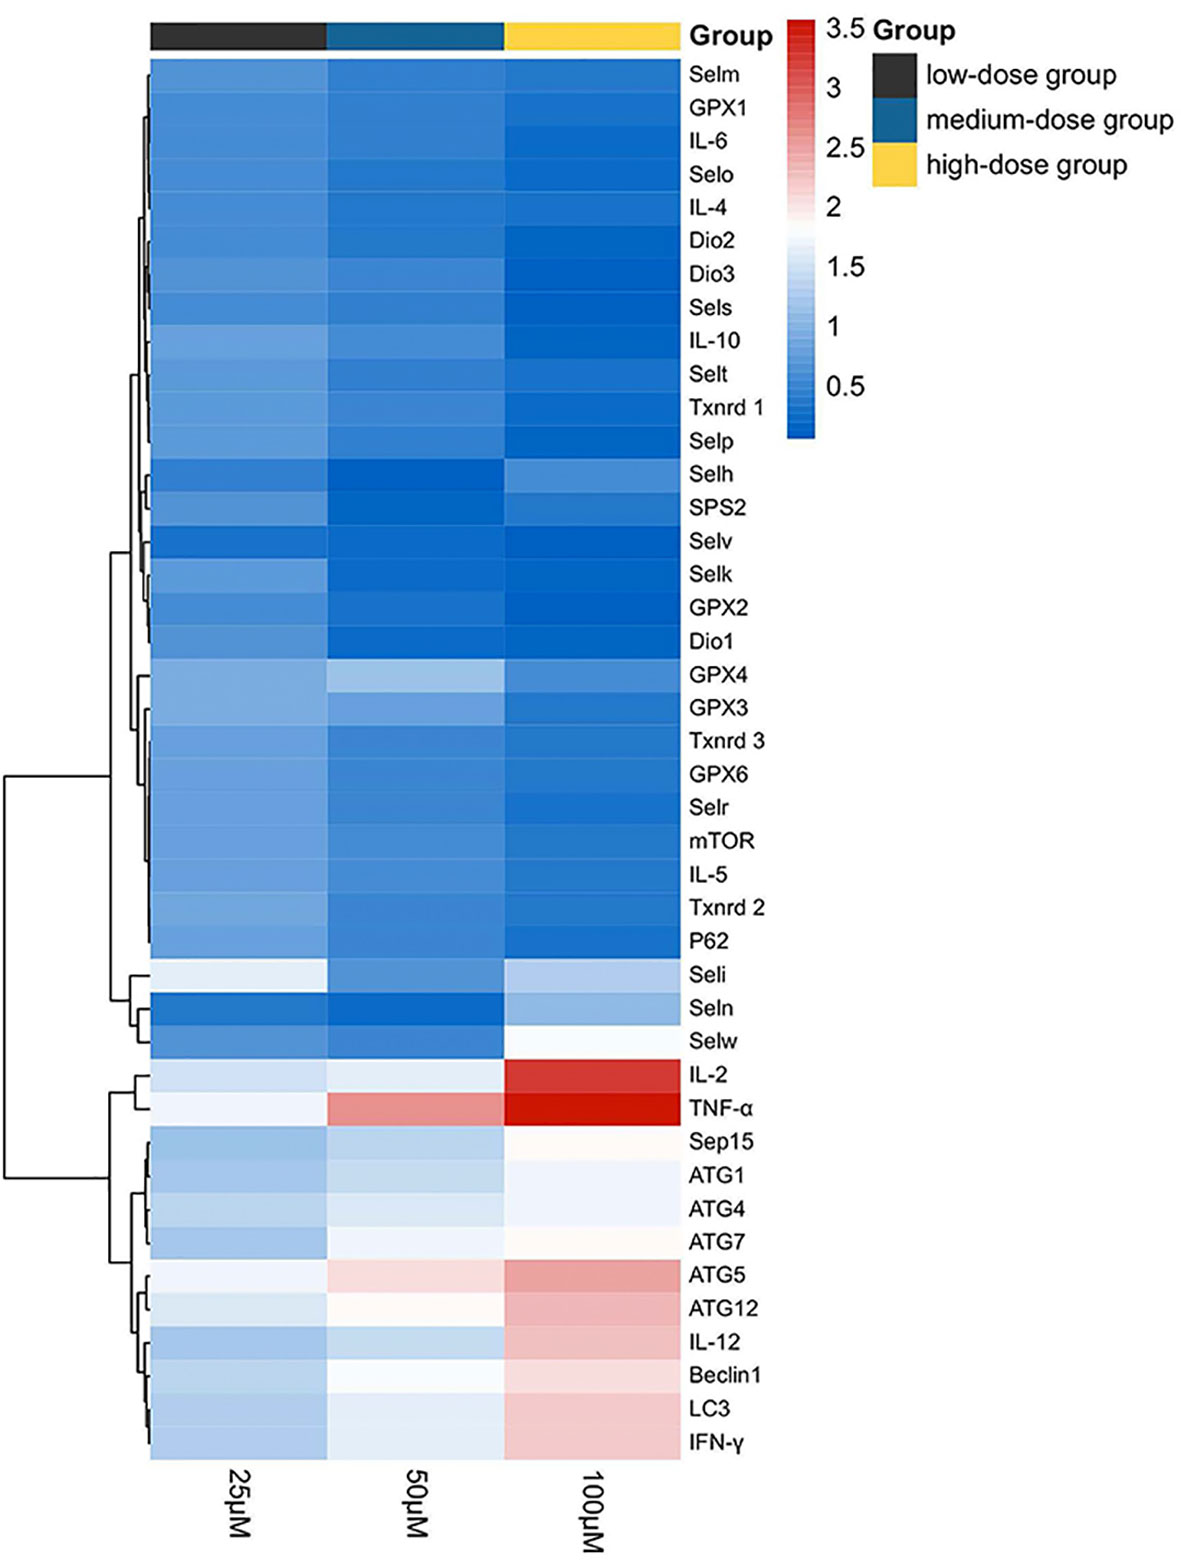
Figure 7 Heat map of autophagy-related genes, related Th1/Th2 cytokines, and selenoprotein mRNA expressions with 25-, 50-, and 100-μM Sch B treatment in Hepa1-6 cells. Rows represent the probe sets. Related genes expressions are shown using the indicated pseudo color scale from blue (0) to red (3.5) relative to values. Red squares represent increased significantly (P < 0.05); blue squares represent decreased significantly (P < 0.05). Data are presented as mean ± SD.
Principal Component Analysis and Correlation Analysis
For further factor analysis to explore the particular role of selenoproteins in Sch B inducing autophagy and inflammation in Hepa1-6 cells, the mRNA expression of 25 selenoproteins and autophagy-related genes and related Th1/Th2 cytokines was subjected to PCA (Figure 8A) and correlation analysis (Figure 8B and Supplementary Table 2). PCA revealed 2 major principal components, explaining 85.929% and 10.450% of the variation, respectively. Txnrd1, Txnrd3, Selp, IL-5, GPX2, Dio3, mTOR, and Selr were highly positively correlated with PC1. ATG1, Beclin1, TNF-α, ATG5, ATG12, and IFN-γ were highly negatively correlated with PC1. In addition, the correlation analysis exhibited high correlation among selenoproteins with autophagy-related genes and related Th1/Th2 cytokines. Most selenoproteins have a highly positive correlation with P62, mTOR, IL-4, IL-5, IL-6, and IL-10 and a negative correlation with LC3, Beclin1, ATG1, ATG4, ATG5, ATG7, ATG12, TNF-α, IFN-γ, IL-2, and IL-12.
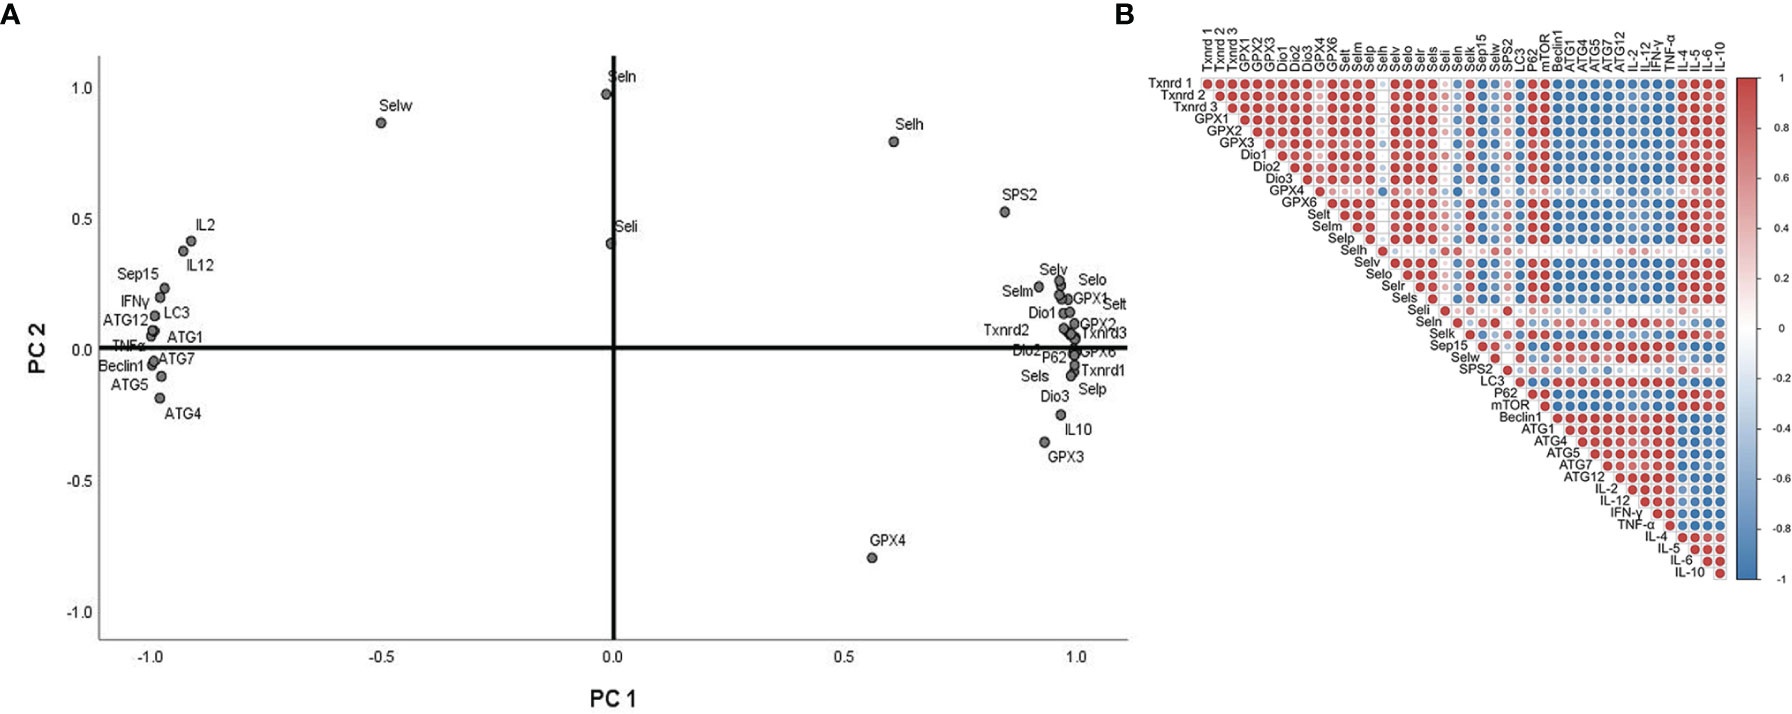
Figure 8 Principal component analysis (PCA) and correlation analysis of autophagy-related genes, related Th1/Th2 cytokines, and selenoprotein mRNA expressions with 0-, 25-, 50-, and 100-μM Sch B treatment in Hepa1-6 cells.
Discussion
Prior studies have noted that numerous traditional Chinese medicine and related active compounds have been reported to have potent anticancer properties (34). Sch B is the major anticancer monomer of lignans from the traditional Chinese medicinal herb S. chinensis Baill (35). Sch B has been confirmed to inhibit the proliferation of glioma, gastric cancer, and prostate cancer cells via induction of apoptosis and autophagy, promotion of antioxidant enzyme release, and inhibition of metastasis and invasion (36). While, some research has been carried out on Sch B, the mechanism by which the antineoplastic effect of Sch B on liver cancer has not been established explicitly. Hence, our data verified that Sch B exerted excellent inhibitory effects against Hepa1-6 cells; also, the suppression was dose-dependent (Figure 1). Consequently, to further investigate the mechanism by which Sch B inhibits the proliferation of Hepa1-6 cells, we explored whether Sch B induced oxidative stress that triggered autophagy and the specific role of selenoprotein and its possible biological mechanism.
The induction of autophagy in tumor cells leads to autophagic cell death, suggesting the possibility of utilizing autophagy activation for cancer therapy and providing a fundamentally new direction for the prevention and treatment of tumors (10). In the present study, to investigate whether Sch B induced autophagy in Hepa1-6 cells, three different methods were applied to explore autophagic flux. Firstly, TEM was used to intuitively diagnose morphological hallmarks of autophagy. Autophagosomes are double-membrane-bound vesicles characteristic of autophagy (37). As the concentration of Sch B increases, the typical autophagic ultrastructures were increasingly obvious, the number of autophagosomes was markedly increased in the TEM images (Figure 2). Secondly, MDC, an elective marker for autophagosome formation, was used to quantify the induction of autophagy. Normal cells were uniformly stained yellow-green, and autophagosomes were stained with densely packed green granules of varying sizes (38). As illustrated in Figures 3A, B, the control group showed weak fluorescence. The increased MDC positive staining strongly suggested that Sch B treatment induced vesicle acidification and rapidly increased the number of autophagosomes, thus enhancing the punctuate MDC staining. The analysis by ImageJ of fluorescence intensity revealed that the autophagy ratio was increased in a dose-dependent manner. Thirdly, we assessed the expression of autophagy-related mRNA expression (Figure 3C). LC3 is the most widely used marker of autophagy, which is involved in the formation of autophagosomes (39). Beclin-1 plays an essential function in early autophagosome formation by recruiting other autophagy-related proteins through a complex of Beclin-1 and Vps34 (10). P62, a hallmark protein of the autophagic flux downstream, attaches LC3 and ubiquitinated substrates and is degraded when autophagosome and autolysosome fuse (10). mTOR can block autophagy by inhibiting the ATG1 complex that is involved in the initiation of the autophagy activity (40). Afterward, the ATG-related protein further constructs autophagosomes. The ATG5-ATG12 covalent protein complex and the ATG8 coupling are crucial components of the autophagosome membrane (41). ATG4 mediates the initial lipidation of LC3 and the cleavage of LC3 from the autophagosome membrane during the later stages of autophagy (42). In this study, Sch B induced remarkable upregulation of LC3, Beclin1, ATG1, ATG4, ATG5, ATG7, and ATG12 and degradation of P62 and mTOR. These results corroborate the findings of previous work that growing concentration of Sch B induced autophagy; meanwhile, autophagy is one of the causes for the decrease in cell viability induced by Sch B in Hepa1-6 cells.
Evidence of former studies instructed that ROS participated in the regulation of autophagy, which are the switches of cell survival and death (43, 44). Oxidative stress-inducing drugs have preferential anticancer effects, involving the regulation of autophagy. Trichosanthin (TCS) significantly inhibited the growth of human gastric cancer MKN-45 cells by mediating ROS production and NF-κB/p53 pathway (45). Curcumin induced ROS accumulation in cervical cancer cells, thereby inducing apoptosis, autophagy, and cellular senescence, accompanied by upregulation of p53 and p21 proteins (46). These previous results confirmed the association between oxidative stress and autophagy. Therefore, here we further investigated whether Sch B overproduced ROS that could be responsible for the initiation of autophagy in Hepa1-6 cells. The production of ROS, the content of MDA and GSH, and the activity of GSH-Px and SOD were examined after treatment with Sch B in Hepa1-6 cells. SOD and GSH-px are both major antioxidant enzymes with efficient ROS-scavenging ability (47). Quantification of MDA is an indicator of lipid peroxidation and ROS-induced damage. GSH is the primary ROS scavenger, and its depletion is considered to contribute to ROS accumulation. In this essay, we investigated that increasing of Sch B concentration promoted ROS accumulation (Figure 4A), suppressed SOD activities, elevated the content of MDA, and reduced the activities of GSH and GSH-px (Figure 4B). Results demonstrated that increased ROS accumulation induced autophagy and may inhibit Hepa1-6 cell proliferation with increasing of Sch B concentration.
The development and spread of cancer were often accompanied by Th1/Th2 imbalance occurring (48). Th2 drift occurs in a variety of tumors, including non-small cell lung cancer, rectal cancer, ovarian cancer, choriocarcinoma, and melanoma, and it becomes more pronounced as the malignancy of the tumor increases (49). Th1 cells produce IL-2, TNF-α, and IFN-γ and mediate and participate in cellular immunity and local inflammatory responses. Th2 cells produce IL-4, IL-5, IL-6, and IL-10, mediate humoral immunity, and are closely associated with the development of hypersensitivity reactions (50). IL-4 and IFN-γ mediate macrophage activation and inhibit IL-1 and TNF-α production. IL-10 suppresses Th1 cell proliferation and cytokine production such as IFN and IL-2 and blocks the induction activity of IL-12. IL-10 has growth factor-like effects on tumor cells, and IFN has obvious cytotoxic effects. IL-5 synergizes with IL-2 and IL-4 to stimulate B-cell growth and differentiation (51). This study revealed that Sch B upregulated the expression of IL-2, TNF-α, IFN-γ, and IL-12 and reduced the expression of IL-4, IL-5, IL-6, and IL-10, which evidenced that Sch B triggered Th1/Th2 imbalance and shifted Th1/Th2 balance toward Th1 (Figure 5).
Selenoproteins were known for their antioxidant roles as ROS scavengers (52). Selenoprotein deficiencies led to excess cellular ROS and reduced antioxidant defense ability, thereby triggering autophagy. Selenoprotein U (Selu) deletion induced autophagy by inhibiting the phosphatidylinositol 3-kinase (PI3K)-Akt-mTOR signaling pathway in rooster Sertoli cells (29). Gpx3 suppression markedly increased ROS levels and promoted autophagy by downregulation of mTOR and increasing the expression of ATG7, ATG10, and ATG12 (53). The supplement of Se could alleviate the imbalance of Th1/Th2 caused by Pb. Meanwhile, the cytokines including IL-1β, IL-2, IL-8, IL-10, and IFN-γ had a positive correlation with selenoproteins containing Sepx1, Selo, Selu, Sepp, Sep15, Selw, and Selk. The results indicated that the altered expressions of selenoproteins influenced cytokines related to Th1/Th2 imbalance (54). In chicken dendritic cells, alterations of some selenoprotein expression were correlated with variations of Th1- and Th2-type cytokines such as IL-12, IFN-γ, and IL-10, thus inducing Th1/Th2 imbalance (55). Accordingly, to explore the specialized role of selenoproteins in ROS-mediated autophagy and Th1/Th2 imbalance in Hepa1-6 cells with growing Sch B treatment, we investigated the mRNA expression of 25 selenoproteins. Based on the results of Figure 6, downregulation of the majority of selenoprotein expressions encompassed Txnrd1, Txnrd2, Txnrd3, GPX1, GPX2, Dio1, Dio2, Dio3, GPX6, Selt, Selm, Selp, Selv, Selo, Sels, and Selk. For in-depth analysis, heat map with clustering analysis of the differentially expressed genes was adopted to assess the expression of 25 selenoproteins with 0-, 25-, 50-, 100-μM Sch B in Hepa1-6 cells. Figure 7 displayed the heat map results; significant suppression of a spectrum of selenoprotein expression in response to Sch B treatment was observed. Gpx family has prominent antioxidant effects, and its reduced activity resulted in a weakened ROS-scavenging capacity of cells, thus affecting the entire growth phase of cells (56). Txnrd family exerted an irreplaceable antioxidant role, in addition, bound to many proteins and involved in regulating cell growth such as inhibiting apoptosis and autophagy (57, 58). Sels, a widely expressed transmembrane protein located in the ER, is critical for ER stress by eliminating misfolding proteins and regulating oxidative stress, apoptosis, and autophagy (59). Together, the former researchers were in agreement with our findings that the majority of selenoprotein expression downregulation arguably is one of the factors most responsible for ROS-mediated autophagy and Th1/Th2 imbalance with Sch B treatment in Hepa1-6 cells. In addition, to identify the principal selenoproteins of Sch B that induced ROS-mediated autophagy and Th1/Th2 imbalance in Hepa1-6 cells, we performed PCA. Txnrd1, Txnrd3, Selp, IL-5, GPX2, Dio3, and Selr were highly positively correlated with PC1 (Figure 8A). Meanwhile, correlation analysis (Figure 8B) indicated that autophagy-related genes and related Th1/Th2 cytokines exhibited remarkable correlation with the expression of the majority of selenoproteins including Txnrd1, Txnrd2, Txnrd3, GPX1, GPX2, GPX3, GPX4, GPX6, Dio1, Dio2, Dio3, Selt, Selm, Selp, Selh, Selv, Selo, Selr, and Sels. The results demonstrated that selenoproteins had essential effects in the regulation of autophagy as well as Th1/Th2 imbalance by Sch B treatment in Hepa1-6 cells. The outcome suggested the key role of these selenoproteins with their potential interactors in ROS-mediated autophagy and Th1/Th2 imbalance of Hepa1-6 cells. Subsequently, we will undertake further in-depth study to investigate the specific mechanism of these selenoproteins in the inhibitory effect of Sch B in Hepa1-6 cells.
Conclusion
In summary, we found that Sch B treatment triggered the accumulation of ROS and induced the occurrence of cell autophagy, as well as causing Th1/Th2 imbalance and resulting in inhibiting proliferation of Hepa1-6 cells. Meanwhile, selenoproteins exerted irreplaceable roles in regulating autophagy and Th1/Th2 imbalance in Hepa1-6 cells, and Txnrd1, Txnrd3, Selp, GPX2, Dio3, and Selr had considerable impacts on the process. More importantly, these findings may help us discover selenoproteins with the specific role involved in Sch B’s remarkable antitumor activity and cell death mechanisms, which would be further exploited as a novel small-molecule candidate drug to improve the Sch B antitumor effect.
Data Availability Statement
The original contributions presented in the study are included in the article/Supplementary Material, further inquiries can be directed to the corresponding authors.
Author Contributions
All authors contributed to the study conception and design. Material preparation and data collection and analysis were performed by ST. The first draft of the article was written by ST. TL, ZZ, and XY carefully examined and revised the article and performed part of the data analysis. All authors read and approved the final article. Article revision was guided by MY and YJ.
Funding
This project was funded by the Outstanding Young Talents Project of the Central Government’s Reform and Development Fund for Local Universities (Grant No. 2020YQ12), Heilongjiang Provincial Natural Science Foundation of China (Grant No. YQ2020H024), and Supporting Certificate of Heilongjiang Postdoctoral Scientific Research Developmental Fund (Grant No. LBH-Q20027).
Conflict of Interest
The authors declare that the research was conducted in the absence of any commercial or financial relationships that could be construed as a potential conflict of interest.
Publisher’s Note
All claims expressed in this article are solely those of the authors and do not necessarily represent those of their affiliated organizations, or those of the publisher, the editors and the reviewers. Any product that may be evaluated in this article, or claim that may be made by its manufacturer, is not guaranteed or endorsed by the publisher.
Acknowledgments
This project was funded by the Outstanding Young Talents Project of the Central Government’s Reform and Development Fund for Local Universities (Grant No. 2020YQ12), Heilongjiang Provincial Natural Science Foundation of China (Grant No. YQ2020H024), and Supporting Certificate of Heilongjiang Postdoctoral Scientific Research Developmental Fund (Grant No. LBH-Q20027).
Supplementary Material
The Supplementary Material for this article can be found online at: https://www.frontiersin.org/articles/10.3389/fimmu.2022.857069/full#supplementary-material
Abbreviations
Sch B, schisandrin B; ROS, reactive oxygen species; SOD, superoxide dismutase; MDA, malondialdehyde; GSH, glutathione; GSH-px, glutathione peroxidase; Txnrd1, thioredoxin reductase 1; Txnrd2, thioredoxin reductase 2; Txnrd3, thioredoxin reductase 3; Gpx1, glutathione peroxidase 1; Gpx2, glutathione peroxidase 2; Gpx3, glutathione peroxidase 3; Gpx4, glutathione peroxidase 4; Gpx6, glutathione peroxidase 6; Dio1, deiodinase 1; Dio2, deiodinase 2; Dio3, deiodinase 3; Selt, selenoprotein t; Selw, selenoprotein w; Selk, selenoprotein k; Selm, selenoprotein m; Selh, selenoprotein h; Selu, selenoprotein u; Seli, selenoprotein i; Seln, selenoprotein n; Selo, selenoprotein o; Sels, selenoprotein s; Selp, selenoprotein p; Selp15, 15-kDa selenoprotein; Sps2, selenoprotein synthetase 2; Se, selenium; Sec, selenocysteine; LC3, microtubule-associated protein light chain 3; mTOR, mammalian target of rapamycin; ATG1, autophagy-related gene-1; ATG4, autophagy-related gene-4; ATG5, autophagy-related gene-5; ATG7, autophagy-related gene-7; ATG10, autophagy-related gene-10; TNF-α, tumor necrosis factor α; IL-2, interleukin-2; IL-4, interleukin-4; IL-5, interleukin-5; IL-6, interleukin-6; IL-10, interleukin-10; IL-12, interleukin-12; DMEM, Dulbecco’s modified Eagle’s medium; GAPDH, Glyceraldehyde-3-phosphate Dehydrogenase; qPCR, Quantitative real-time PCR.
References
1. Wang K, Chen Q, Shao Y, Yin S, Yu H. Anticancer Activities of TCM and Their Active Components Against Tumor Metastasis. Biomed Pharmacother (2021) 133:111044. doi: 10.1016/j.biopha.2020.111044
2. Hong M, Zhang Y, Li S, Tan H, Wang N, Mu S, et al. A Network Pharmacology-Based Study on the Hepatoprotective Effect of Fructus Schisandrae. Molecules (2017) 22(10):1617. doi: 10.3390/molecules22101617
3. Yan J, Zhang Q, Bao J, Du C, Chang L. Schisandrin B Inhibits the Proliferation and Invasion of Glioma Cells by Regulating the HOTAIR-micoRNA-125a-mTOR Pathway. Neuroreport (2016) 28(2):93–100. doi: 10.1097/wnr.0000000000000717
4. Zhen L, Zhang B, Liu K, Ding Z, Xun H. Schisandrin B Attenuates Cancer Invasion and Metastasis Via Inhibiting Epithelial-Mesenchymal Transition. PloS One (2012) 7(7):e40480. doi: 10.1371/journal.pone.0040480
5. Xiang S, Wang X, Li H, Shu Y, Bao R, Zhang F, et al. Schisandrin B Induces Apoptosis and Cell Cycle Arrest of Gallbladder Cancer Cells. Molecules (2014) 19:13235–50. doi: 10.3390/molecules190913235
6. Yang J, Shi G, Gong Y, Cai J, Zheng Y, Zhang Z. LncRNA 0003250 Accelerates Heart Autophagy and Binds to miR as a Competitive Endogenous RNA in Chicken Induced by Selenium Deficiency. J Cell Physiol (2021) 236(1):157–77. doi: 10.1002/jcp.29831
7. Zheng YY, Guan HY, Yang J, Cai JZ, Liu Q, ZW. Z, et al. Calcium Overload and Reactive Oxygen Species Accumulation Induced by Selenium Deficiency Promote Autophagy in Swine Small Intestine. Anim Nutr (2021) 7(4):997–1008. doi: 10.1016/j.aninu.2021.05.005
8. Guo JM, Xing HJ, Cai JZ, Zhang HF, Xu SW. H2S Exposure-Induced Oxidative Stress Promotes LPS-Mediated Hepatocyte Autophagy Through the PI3K/AKT/TOR Pathway. Ecotoxicol Environ Saf (2021) 209(1):111801. doi: 10.1016/j.ecoenv.2020.111801
9. Tan ML, Parkinson EK, Yap LF, Paterson IC. Autophagy is Deregulated in Cancer-Associated Fibroblasts From Oral Cancer and is Stimulated During the Induction of Fibroblast Senescence by TGF-β1. Sci Rep (2021) 11(1):179. doi: 10.1038/s41598-020-79789-8
10. Yun CW, Jeon J, Go G, Lee JH, Sang HL. The Dual Role of Autophagy in Cancer Development and a Therapeutic Strategy for Cancer by Targeting Autophagy. Int J Mol Sci (2020) 22(1):179. doi: 10.3390/ijms22010179
11. Wang SA, Liu JA, Yao YA, Wang YA, Xu S. Polystyrene Microplastics-Induced ROS Overproduction Disrupts the Skeletal Muscle Regeneration by Converting Myoblasts Into Adipocytes. J Hazard Mater (202) .417:125962. doi: 10.1016/j.jhazmat.2021.125962
12. Yan J, Dou X, Zhou J, Xiong Y, Lei Y. Tubeimoside-I Sensitizes Colorectal Cancer Cells to Chemotherapy by Inducing ROS-Mediated Impaired Autophagolysosomes Accumulation. J Exp Clin Cancer Res (2019) 38(1):353. doi: 10.1186/s13046-019-1355-0
13. Zhou P, Lu S, Luo Y, Shan W, Yang K, Zhai Y, et al. Attenuation of TNF-α-Induced Inflammatory Injury in Endothelial Cells by Ginsenoside Rb1 via Inhibiting NF-κb, JNK and P38 Signaling Pathways. Front Pharmacol (2017) 8:464. doi: 10.3389/fphar.2017.00464
14. Shi JM, Bai LL, Zhang DM, Yiu A, Yin ZQ, Han WL, et al. Saxifragifolin D Induces the Interplay Between Apoptosis and Autophagy in Breast Cancer Cells Through ROS-Dependent Endoplasmic Reticulum Stress. Biochem Pharmacol (2013) 85:913–26. doi: 10.1016/j.bcp.2013.01.009
15. Hering J, Garrean S, Dekoj TR, Razzak A, Saied A, Trevino J, et al. Inhibition of Proliferation by Omega-3 Fatty Acids in Chemoresistant Pancreatic Cancer Cells. Ann Surg Oncol (2007) 14(12):3620–8. doi: 10.1245/s10434-007-9556-8
16. Zhong R, Zhang Y, Chen D, Cao S, Zhong H. Single-Cell RNA Sequencing Reveals Cellular and Molecular Immune Profile in a Pembrolizumab-Responsive PD-L1-Negative Lung Cancer Patient. Cancer Immunol Immunother (2021) 70(8):2261–74. doi: 10.1007/s00262-021-02848-0
17. Ns A, Wei WA, Yue WA, Yg B, Sx A. Hydrogen Sulfide of Air Induces Macrophage Extracellular Traps to Aggravate Inflammatory Injury via the Regulation of miR-15b-5p on MAPK and Insulin Signals in Trachea of Chickens - ScienceDirect. Sci Total Environ (2021) 771:145407. doi: 10.1016/j.scitotenv.2021.145407
18. Chen X, Bi M, Yang J, Cai J, Zhang H, Zhu Y, et al. Cadmium Exposure Triggers Oxidative Stress, Necroptosis, Th1/Th2 Imbalance and Promotes Inflammation Through the TNF-Alpha/NF-kappaB Pathway in Swine Small Intestine. J Hazard Mater (2022) 421:126704. doi: 10.1016/j.jhazmat.2021.126704
19. Chen Y, Yang J, Huang Z, Jing H, Yin B, Guo S, et al. Exosomal lnc-AFTR as a Novel Translation Regulator of FAS Ameliorates Staphylococcus Aureus-Induced Mastitis. BioFactors (2022) 48:148–63. doi: 10.1002/biof.1806
20. Lorvik KB, Hammarstrm C, Fauskanger M, Audun O, Corthay A. Adoptive Transfer of Tumor-Specific Th2 Cells Eradicates Tumors by Triggering an In Situ Inflammatory Immune Response. Cancer Res (2016) 76(23):6864. doi: 10.1158/0008-5472.CAN-16-1219
21. Jiang X, Guan S, Qiao Y, Li X, Xu Y, Yang L, et al. Effects of Poly(I:C) and MF59 Co-Adjuvants on Immunogenicity and Efficacy of Survivin Polypeptide Immunogen Against Melanoma. J Cell Physiol (2018) 233(6):4926–34. doi: 10.1002/jcp.26317
22. Zhao X, Liu J, Ge S, Chen C, Cai D. Saikosaponin A Inhibits Breast Cancer by Regulating Th1/Th2 Balance. Front Pharmacol (2019) 10:624. doi: 10.3389/fphar.2019.00624
23. Lin GH, Lin LZ, Zhang Y, Pei WY, Zeng JC, Zhao WX. Influence of Fire Needle Stimulation at Sihua Acupoints on Performance Status and Th1/Th2 Balance in the Patients With Advanced Non-Small Cell Lung Cancer After Chemotherapy. Zhen ci yan jiu = Acupuncture Res / [Zhongguo yi xue ke xue yuan Yi xue qing bao yan jiu suo bian ji] (2019) 44(2):136–9. doi: 10.13702/j.1000-0607.170933
24. Zhang J, Wang S, Hao X, Sun G, Xu S. The Antagonistic Effect of Selenium on Lead-Induced Necroptosis via MAPK/NF-κb Pathway and HSPs Activation in the Chicken Spleen. Ecotoxicol Environ Saf (2020) 204(2):111049. doi: 10.1016/j.ecoenv.2020.111049
25. Zhang Z, Liu Q, Yang J, Yao H, Xu S. Proteomic Profiling of Multiple Tissue Damage in Chickens for Selenium Deficiency Biomarker Discovery. Food Funct (2020) 11(2):1312. doi: 10.1039/C9FO02861G
26. Chi Q, Zhang Q, Lu Y, Zhang Y, Xu S, Li S. Roles of Selenoprotein S in Reactive Oxygen Species-Dependent Neutrophil Extracellular Trap Formation Induced by Selenium-Deficient Arteritis. Redox Biol (2021) 44:102003. doi: 10.1016/j.redox.2021.102003
27. Zhang Y, Xu Y, Chen B, Zhao B, Gao XJ. Selenium Deficiency Promotes Oxidative Stress-Induced Mastitis via Activating the NF-κb and MAPK Pathways in Dairy Cow. Biol Trace Element Res (2021) 21:1–11. doi: 10.1007/s12011-021-02882-0
28. Fichman Y, Koncz Z, Reznik N, Miller G, Szabados L, Kramer K, et al. SELENOPROTEIN O Is a Chloroplast Protein Involved in ROS Scavenging and its Absence Increases Dehydration Tolerance in Arabidopsis Thaliana. Plant Sci (2018) 270:278–91. doi: 10.1016/j.plantsci.2018.02.023
29. Hamid S, Yang J, Zhao X, Cai J, Qi L, Muhammad I, et al. Selenoprotein-U (SelU) Knockdown Triggers Autophagy Through PI3K–Akt–mTOR Pathway Inhibition in Rooster Sertoli Cells. Metallomics (2018) 10:929–40. doi: 10.1039/C8MT00090E
30. Marciel MP, Hoffmann PR. Molecular Mechanisms by Which Selenoprotein K Regulates Immunity and Cancer. Biol Trace Element Res (2019) 193:60–8. doi: 10.1007/s12011-019-01774-8
31. Ma YM, Guo YZ, Gordon I, Wang LY, Dong JD, Wang J, et al. Overexpression of Selenoprotein H Prevents Mitochondrial Dynamic Imbalance Induced by Glutamate Exposure. Int J Biol Sci (2017) 13(11):1458–69. doi: 10.7150/ijbs.21300
32. Liu X, Zhang D, Hao Y, Liu Q, Wu Y, Liu X, et al. Cyanidin Curtails Renal Cell Carcinoma Tumorigenesis. Cell Physiol Biochem (2018) p:2517–31. doi: 10.1159/000489658
33. Yang J, et al. Dysfunction of Thioredoxin Triggers Inflammation Through Activation of Autophagy in Chicken Cardiomyocytes. BioFactors (2020) 46(4):579–90. doi: 10.1002/biof.1625
34. Liu J, Wang Y, Qiu Z, Lv G, Qu P. Impact of TCM on Tumor-Infiltrating Myeloid Precursors in the Tumor Microenvironment. Front Cell Dev Biol (2021) 9:635122. doi: 10.3389/fcell.2021.635122
35. Dai XX, Yin CT, Guo GL. Schisandrin B Exhibits Potent Anticancer Activity in Triple Negative Breast Cancer by Inhibiting Stat3. Toxicol Appl Pharmacol (2018) 358:110–9. doi: 10.1016/j.taap.2018.09.005
36. Zhou Y, Men L, Sun Y, Wei M, Fan X. Pharmacodynamic Effects and Molecular Mechanisms of Lignans From Schisandra Chinensis Turcz. (Baill.), a Current Review. Eur J Pharmacol (2021) 892:173796. doi: 10.1016/j.ejphar.2020.173796
37. Zhao YG, Zhang H. Autophagosome Maturation: An Epic Journey From the ER to Lysosomes. J Cell Biol (2018) 218(3):757–70. doi: 10.1083/jcb.201810099
38. Yuan B, Shen H, Li L, Su T, Zhao Y. Autophagy Promotes Microglia Activation Through Beclin-1-Atg5 Pathway in Intracerebral Hemorrhage. Mol Neurobiol (2017) 54(1):115–24. doi: 10.1007/s12035-015-9642-z
39. Real E, Rodrigues L, Cabal GG, Enguita FJ, Mancio-Silva L, Mello-Vieir J, et al. Plasmodium UIS3 Sequesters Host LC3 to Avoid Elimination by Autophagy in Hepatocytes. Nat Microbiol (2018) 3:17–25. doi: 10.1038/s41564-017-0054-x
40. Loos F, Xie W, Sica V, Pedro BS, Kroe Me RG. Artificial Tethering of LC3 or P62 to Organelles Is Not Sufficient to Trigger Autophagy. Cell Death Dis (2019) 10(10):771. doi: 10.1038/s41419-019-2011-5
41. Mauthe M, Langereis M, Jun J, Zho X, Jones A, Omta W, et al. An siRNA Screen for ATG Protein Depletion Reveals the Extent of the Unconventional Functions of the Autophagy Proteome in Virus Replication. J Cell Biol (2016) 214(5):619–35. doi: 10.1083/jcb.201602046
42. Agrotis A, Pengo N, Burden JJ, Ketteler R. Redundancy of Human ATG4 Protease Isoforms in Autophagy and LC3/GABARAP Processing Revealed in Cells. Autophagy (2019) 15:976–97. doi: 10.1080/15548627.2019.1569925
43. Chen YF, Liu H, Luo XJ, Zhao Z, Zou ZY, Li J, et al. The Roles of Reactive Oxygen Species (ROS) and Autophagy in the Survival and Death of Leukemia Cells. Crit Rev Oncol Hematol (2017) 112(Complete):21–30. doi: 10.1016/j.critrevonc.2017.02.004
44. Liu X-J, Wang YQ, Shang SQ, Xu S, Guo M. TMT Induces Apoptosis and Necroptosis in Mouse Kidneys Through Oxidative Stress-Induced Activation of the NLRP3 Inflammasome. Ecotoxicol Environ Saf (2022) 230:113167. doi: 10.1016/j.ecoenv.2022.113167
45. Wei B, Huang Q, Huang S, Mai W, Zhong X. Trichosanthin-Induced Autophagy in Gastric Cancer Cell MKN-45 Is Dependent on Reactive Oxygen Species (ROS) and NF-κb/P53 Pathway. J Pharmacol Sci (2016) 131(2):77–83. doi: 10.1016/j.jphs.2016.03.001
46. Yi LT, Dong SQ, Wang SS, Chen M, Cheng J. Curcumin Attenuates Cognitive Impairment by Enhancing Autophagy in Chemotherapy. Neurobiol Dis (2019) 136:104715. doi: 10.1016/j.nbd.2019.104715
47. Jing HY, Wang F, Gao X. Lithium Intoxication Induced Pyroptosis via ROS/NF-κb/NLRP3 Inflammasome Regulatory Networks in Kidney of Mice. Environ Toxicol (2022) 1:11. doi: 10.1002/tox.23446
48. Zhang W, Pan Y, Gou P, Zhou C, Ma L, Liu Q, et al. Effect of Xanthohumol on Th1/Th2 Balance in a Breast Cancer Mouse Model. Oncol Rep (2018) 39:280–8. doi: 10.3892/or.2017.6094
49. Benvenuto M, Focaccetti C, Ciuffa S, Fazi S, Bei R. Polyphenols Affect the Humoral Response in Cancer, Infectious and Allergic Diseases and Autoimmunity by Modulating the Activity of TH1 and TH2 Cells. Curr Opin Pharmacol (2021) 60:315–30. doi: 10.1016/j.coph.2021.08.005
50. Cheng YH, Lin YC, Chen IS, Liu SD, Wang CC. Immunomodulatory Effects of Taiwanese Neolitsea Species on Th1 and Th2 Functionality. J Immunol Res (2017) 1–13. doi: 10.1155/2017/3529859
51. Moverate R, Elfman L. Study of the Th1/Th2 Balance, Including IL-10 Production,in Cultures of Peripheral Blood Mononuclear Cells Frombirch-Pollen-Allergic Patients. Allergy (2000) 55:171–5. doi: 10.1034/j.1398-9995.2000.00244.x.
52. Leonardi A, Evke S, Lee M, Melendez JA, Begley TJ, Leonardi A, et al. Epitranscriptomic Systems Regulate the Translation of Reactive Oxygen Species Detoxifying and Disease Linked Selenoproteins. Free Radical Biol Med (2019) 143:573–93. doi: 10.1016/j.freeradbiomed.2019.08.030
53. Gong Y, Yang J, Cai J, Liu Q, Zhang JM, Zhang ZW. Effect of Gpx3 Gene Silencing by siRNA on Apoptosis and Autophagy in Chicken Cardiomyocytes. J Cell Physiol (2019) 234(6):7828–38. doi: 10.1002/jcp.27842
54. Fu JX, Yang TS, Xu SW. Effect of Selenium Antagonist Lead-Induced Damage on Th1/Th2 Imbalance in the Peripheral Blood Lymphocytes of Chickens. Ecotoxicol Environ Saf (2019) 175:74–82. doi: 10.1016/j.ecoenv.2019.03.036
55. Sun Z, Xu Z, Wang D, Yao H, Li S. Selenium Deficiency Inhibits Differentiation and Immune Function and Imbalances the Th1/Th2 of Dendritic Cells. Metallomics (2018) 759–67. doi: 10.1039/C8MT00039E
56. Yi Z, Jiang L, Zhao L, Zhou M, Ni Y, Yang Y, et al. Glutathione Peroxidase 3 (GPX3) Suppresses the Growth of Melanoma Cells Through Reactive Oxygen Species (ROS)-Dependent Stabilization of Hypoxia-Inducible Factor 1 and 2. J Cell Biochem (2019) 120(11):19124–36. doi: 10.1002/jcb.29240
57. Liu Q, Du P, Zhu Y, Zhang X, Cai J, Zhang Z. Thioredoxin Reductase 3 Suppression Promotes Colitis and Carcinogenesis via Activating Pyroptosis and Necrosis. Cell Mol Life Sci (2022) 79(2):106. doi: 10.1007/s00018-022-04155-y
58. Chen Y, Jing H, Chen M, Liang W, Guo M. Transcriptional Profiling of Exosomes Derived From Staphylococcus Aureus-Infected Bovine Mammary Epithelial Cell Line MAC-T by RNA-Seq Analysis. Oxid Med Cell Longev (2021) 8460355. doi: 10.1155/2021/8460355
Keywords: schisandrin B (Sch B), Hepa1-6, autophagy, oxidative stress, Th1/Th2 imbalance, selenoprotein
Citation: Tan S, Zheng Z, Liu T, Yao X, Yu M and Ji Y (2022) Schisandrin B Induced ROS-Mediated Autophagy and Th1/Th2 Imbalance via Selenoproteins in Hepa1-6 Cells. Front. Immunol. 13:857069. doi: 10.3389/fimmu.2022.857069
Received: 18 January 2022; Accepted: 14 February 2022;
Published: 28 March 2022.
Edited by:
Ziwei Zhang, Northeast Agricultural University, ChinaReviewed by:
Yunan Gao, Harbin Medical University, ChinaJian Huang, Harbin Medical University Cancer Hospital, China
Haidong Yao, Karolinska Institutet (KI), Sweden
Copyright © 2022 Tan, Zheng, Liu, Yao, Yu and Ji. This is an open-access article distributed under the terms of the Creative Commons Attribution License (CC BY). The use, distribution or reproduction in other forums is permitted, provided the original author(s) and the copyright owner(s) are credited and that the original publication in this journal is cited, in accordance with accepted academic practice. No use, distribution or reproduction is permitted which does not comply with these terms.
*Correspondence: Miao Yu, eXVtaWFvOTEzQDE2My5jb20=; Yubin Ji, anliQGhyYmN1LmVkdS5jbg==