
94% of researchers rate our articles as excellent or good
Learn more about the work of our research integrity team to safeguard the quality of each article we publish.
Find out more
ORIGINAL RESEARCH article
Front. Immunol. , 21 February 2022
Sec. Comparative Immunology
Volume 13 - 2022 | https://doi.org/10.3389/fimmu.2022.849922
 Emil Lagumdzic1
 Clara Pernold1Marta Viano2Simone Olgiati2
 Michael W. Schmitt3
 Kerstin H. Mair1,4
 Armin Saalmüller1*
The pig has the potential to become a leading research model for human diseases, pharmacological and transplantation studies. Since there are many similarities between humans and pigs, especially concerning anatomy, physiology and metabolism, there is necessity for a better understanding of the porcine immune system. In adaptive immunity, cytotoxic T lymphocytes (CTLs) are essential for host defense. However, most data on CTLs come from studies in mice, non-human primates and humans, while detailed information about porcine CD8+ CTLs is still sparse. Aim of this study was to analyze transcriptomes of three subsets of porcine CD8β+ T-cell subsets by using next-generation sequencing technology. Specifically, we described transcriptional profiles of subsets defined by their CD11a/CD27 expression pattern, postulated as naïve (CD8β+CD27+CD11alow), intermediate differentiated (CD8β+CD27dimCD11a+), and terminally differentiated cells (CD8β+CD27-CD11ahigh). Cells were analyzed in ex vivo condition as well as upon in vitro stimulation with concanavalin A (ConA) and PMA/ionomycin. Our analyses show that the highest number of differentially expressed genes was identified between naïve and terminally differentiated CD8+ T-cell subsets, underlining their difference in gene expression signature and respective differentiation stages. Moreover, genes related to early (IL7-R, CCR7, SELL, TCF7, LEF1, BACH2, SATB1, ZEB1 and BCL2) and late (KLRG1, TBX21, PRDM1, CX3CR1, ZEB2, ZNF683, BATF, EZH2 and ID2) stages of CD8+ T-cell differentiation were highly expressed in the naïve and terminally differentiated CD8+ T-cell subsets, respectively. Intermediate differentiated CD8+ T-cell subsets shared a more comparable gene expression profile associated with later stages of T-cell differentiation. Genes associated with cytolytic activity (GNLY, PRF1, GZMB, FASL, IFNG and TNF) were highly expressed in terminally and intermediate differentiated CD8+ T-cell subsets, while naïve CD8+ T cells lacked expression even after in vitro stimulation. Overall, PMA/ionomycin stimulation induced much stronger upregulation of genes compared to stimulation with ConA. Taken together, we provided comprehensive results showing transcriptional profiles of three differentiation stages of porcine CD8+ T-cell subsets. In addition, our study provides a powerful toolbox for the identification of candidate markers to characterize porcine immune cell subsets in more detail.
CD8+ T cells play a key role in immune responses against intracellular pathogens by killing infected cells. Previous studies also identified their involvement in the destruction of tumor cells whereby an increased number of CD8+ T cells in colorectal, ovarian and gastric cancer was associated with a better overall survival (1–3). Furthermore, activated CD8+ T cells are responsible for major histocompatibility complex class I (MHC I) mediated allograft rejection (4). CD8+ T cells recognize peptide antigens presented by MHC class I molecules with their T-cell receptors (TCRs) and due to their striking feature of killing infected cells they are designated as cytotoxic T lymphocytes (CTLs). Their cytolytic activity is mediated through the release of cytotoxic granules, containing perforin and granzymes or Fas/Fas-Ligand interaction, leading to apoptosis of the target cells. Second, CTLs also produce cytokines such as interferon-γ (IFN-γ) and tumor necrosis factor (TNF), which show antimicrobial and antitumor properties (5, 6). Conventionally, differentiation stages of CD8+ T cells in the murine immune system can be delineated by CD44 and CD62L surface markers. Naïve CD8+ T cells (Tn) are defined as CD44lowCD62Lhigh cells, whereas effector CD8+ T cells (Teff) show a CD44highCD62Llow phenotype. Based on CD127 and KLRG1 expression, effector CD8+ T cells can be further differentiated into short-lived effector cells (SLEC) and memory precursor effector cells (MPEC) showing CD127-KLRG1+ and CD127+KLRG1- phenotypes, respectively (7, 8). Moreover, low expression of CD11a and high expression of CD27 is associated with Tn, while Teff show high expression of CD11a and low expression of CD27. Expression levels of CD11a enable the identification of antigen-experienced CD8+ T cells and correlates positively with cytolytic activity and SLEC generation, whereas its absence favors formation of MPEC (9, 10). Different populations of CD8+ memory T-cells can be identified by using CD44, CD62L, CD69, CXCR1 and CD49d markers. Bach2 has been identified as being a transcription factor expressed on Tn, while T-bet, Id2 and Blimp-1 are found on more differentiated T cells such as Teff (11, 12). In the human immune system differentiation stages of CD8+ T cells are described based on the expression of four main surface markers, namely: CD45RA, CD27, CD28 and CCR7. With the combination of those markers, CD8+ T cells can be divided into Tn cells (CD27+CD28+CCR7+CD45RA+), early differentiated cells (CD27+CD28+CCR7-CD45RA-), early-like cells (CD27-CD28+CCR7-CD45RA-), intermediately differentiated cells (CD27+CD28-CCR7-CD45RA-), T-effector RA+ cells (CD27−CD28−CCR7−CD45RA+), T-effector RA- cells (CD27−CD28−CCR7−CD45RA-) and central memory T cells (CD27+CD28+CCR7+CD45RA-) (13–17). Although the human and murine immune systems share similarities with the porcine immune system, detailed information about the phenotype and the differentiation stages of porcine CD8+ T cells is still sparse (18). Over the years, one of the major drawbacks to further characterizing CD8+ T cells is the absence of specific monoclonal antibodies against the respective differentiation antigens. An initial study on cellular response of porcine virus-specific CTLs against classical swine fever virus (CSFV) infected cells described them as CD4-CD5+CD6+ MHC-I restricted T lymphocytes (19). In 1999 Saalmüller et al. described that CD4-CD5+CD6+ cells with high expression of CD8α represent porcine CTLs (20). A more recent study defined CD2+CD3+CD4−CD5highCD6+CD8αhighCD8β+ cells, which were also capable of perforin production, as porcine CTLs (21, 22). Previous studies by our group showed that naïve CD8+ T cells express CD27 and are negative for perforin, whereas the phenotype of more differentiated CD8+ T-cell subsets correlates with the increase of perforin and the decrease of CD27 expression (23). In this study we followed this hypothesis that the gradual change of CD27 expression, from intermediate to negative, indicates the transition from early to late effector or memory CD8+ T cells. Furthermore, we included CD11a for the discrimination of porcine CD8+ T-cell subsets, based on literature on CTL differentiation in mice (9, 10, 13). To confirm our hypothesis, we combined surface-antigen based cell sorting with transcriptome analysis of the respective subpopulations by using next-generation sequencing (NGS) technologies. We investigated three CD8+ T-cell subsets considered as the differentiation stages of naïve (CD8β+CD27+CD11alow), intermediate differentiated (CD8β+CD27dimCD11a+), and terminally differentiated cells (CD8β+CD27-CD11ahigh). So far, most of the transcriptomic studies in swine have addressed gene expression changes in peripheral blood mononuclear cells (PBMCs) only, i.e. upon vaccination or infection and our knowledge of the transcriptome profile of porcine CD8+ T-cells is largely based on limited data (24–26). To gain deeper insight into the differentiation of the CD8+ T cells we examined besides the direct ex vivo analyses the transcriptome changes after stimulation with different in vitro stimuli. Here, we include extensive gene ontology (GO) enrichment and pathway analysis, providing more detailed information about the immunological roles and functions of genes specific for the differentiation stages of porcine CD8+ T-cell subsets. Therefore, this study is an important contribution to the further characterization of the immune system in swine - a species with the potential to become a highly relevant preclinical model for human diseases and pharmacological questions as well as for transplantation studies.
Blood samples from swine were obtained from a local abattoir. Prior to blood sampling, animals were anesthetized electrically and sacrificed by exsanguination in accordance with Austrian Animal Welfare Slaughter Regulation. PBMCs were isolated from fresh heparinized blood of six animals of approximately six months of age by density gradient centrifugation (Pancoll human, density: 1.077 g/ml, PAN-Biotech, Aidenbach, Germany; 30 min at 920 x g).
CD8+ T cells were enriched by positive selection of CD8β-labeled PBMCs using magnetic-activated cell sorting (MACS, Miltenyi Biotec, Bergisch Gladbach, Germany). For enrichment of CD8β+ T cells, freshly isolated PBMCs (1 x 10⁹) were stained with an in-house produced primary monoclonal anti-CD8β antibody (clone PPT23, IgG1) for 20 min on ice. Subsequently, cells were washed once with MACS buffer [PBS w/o Ca/Mg + 2% (v/v) FCS (both Gibco™, Thermo Fisher Scientific) + 2mM EDTA (Carl Roth)], resuspended in 1,5 mL MACS buffer and incubated with magnetically labeled secondary antibody (rat-anti mouse IgG1, Miltenyi Biotec) for 30 min on ice. After a further washing step, cells were resuspended in 3 mL MACS buffer and loaded on pre-wetted LS columns (Miltenyi Biotec). The columns were applied to a magnetic field and unlabeled cells were removed by extensive washing. For final elution of the positive fraction, columns were removed from the magnetic field and CD8β+ T cells were eluted in 5 mL MACS buffer. Finally, sorted cells were resuspended in cold culture medium (RPMI 1640 + 100 IU/mL penicillin + 0.1 mg/mL streptomycin (all PAN Biotech) + 10% (v/v) FCS), centrifuged and counted with a Cell Counter (XP-300 Hematology Analyzer, Sysmex Europe GmbH, Norderstedt). Purity of the positively sorted cells was over 90% (FACSCanto™II, BD Biosciences, San Jose, CA, USA).
In order to further separate MACS-enriched CD8β+ cells into subpopulations, CD8β+ cells were FACS sorted based on surface expression of CD27 and CD11a (Supplementary Figure S1).
Upon magnetic-activated cell sorting, CD8β+ cells were washed once with FACS buffer (RPMI 1640 + 100 IU/mL penicillin + 0.1 mg/mL streptomycin + 5% FCS + 5% porcine plasma (in-house preparation) + 2 mM EDTA) and then labeled with a goat anti-mouse IgG1-PE secondary antibody to stain residual CD8β+ cells (Southern Biotech, Birmingham, AL, USA).
Free binding sites of the PE-labeled antibody were blocked with whole mouse IgG molecules (2 μg per sample, ChromPure, Jackson ImmunoResearch, West Grove, PA, USA). Afterwards, cells were incubated with directly labeled primary antibodies: CD27-Alexa647 (b30c7, mouse IgG1, in-house preparation and labeling with Alexa Fluor-647 Protein Labeling Kit, Thermo Fisher Scientific) and CD11a-FITC (BL1H8, mouse IgG2b, BioRad, Hercules, CA, USA).
Cell sorting was performed on a FACSAria (BD Biosciences) and CD8+ T-cell subsets were defined as follows: naïve (CD8β+CD27+CD11alow), intermediate differentiated (CD8β+CD27dimCD11a+), and terminally differentiated cells (CD8β+CD27-CD11ahigh). Subsets were sorted with an average purity greater than 96%.
To identify transcriptomic differences between the CD8+ T-cell subsets as well as between ex vivo and stimulated cells within the same CD8+ T-cell subset, cells from each sorted subpopulations with at least 5 x 10⁵ sorted cells were cultivated at 37°C and 5% CO2 under following conditions: (i) 16 hours, unstimulated in culture medium, (ii) cultivation in culture medium for 14 hours followed by stimulation for two hours with phorbol 12-myristate 13-acetate (PMA, 50 ng/mL, Sigma-Aldrich, Schnelldorf, Germany) and ionomycin (500 ng/mL, Sigma-Aldrich), (iii) stimulated with concanavalin A (ConA) (5 μg/mL, Amersham Biosciences, Uppsala, Sweden) for 16 hours. Both stimulation protocols are established in our laboratory and used as high controls for proliferation experiments and cytokine induction in ELISpot assays (ConA) and as positive control for intracellular cytokine staining in flow cytometry (PMA/ionomycin). Furthermore, each CD8+ T-cell subset with 5 x 10⁵ was used immediately after sorting for RNA isolation without any further cell culture (ex vivo). Altogether four different conditions for each CTL subset were applied: cultivation in medium, stimulation with PMA/ionomycin or ConA and ex vivo isolation. Therefore, 72 samples (3 subsets x 4 conditions x 6 animals) were generated.
Total RNA was isolated from the samples mentioned above using RNeasy Mini Kit with on-column DNase treatment using the RNAse-Free DNase Set (both Qiagen, Hilden, Germany), following manufacturer’s protocol. Quantification and quality control of isolated RNA were assessed with both Qubit 3.0 fluorometer (RNA HS assay kit, ThermoFisher, Massachusetts, MA, USA) and Agilent 2100 Bioanalyzer (Agilent RNA 6000 Pico Kit, Agilent Technologies, Palo Alto, CA, USA). Samples with both a final yield comprised between 0.03 – 1.25 ng/µl and a RIN of 9 were prepared for sequencing with the SMARTer Stranded Total RNA-Seq v2 – Pico Input Mammalian Kit (Takara Bio Inc., Shiga, Japan). Fully automated library preparation was performed on a Microlab Star Hamilton robotic station (Hamilton Company, Reno, NV, USA). Briefly, 8 µl per sample were used for the cDNA synthesis via the SMART® technology (SMART technology, Clontech, USA). Thereafter, each sample was amplified to generate Illumina-compatible libraries according to the manufacturer’s guidance. Libraries were validated using the Agilent 2100 Bioanalyzer (Agilent High Sensitivity DNA Kit, Agilent Technologies, Palo Alto, CA) and the Qubit 3.0 fluorometer (DNA HS assay kit, ThermoFisher, Massachusetts, MA, USA). Libraries were paired-end sequenced on two SP flow cell on NovaSeq 6000 system (Illumina Inc., San Diego, CA, USA).
Standard raw sequencing data in BCL format was converted to FASTQ files using the software bcl2fastq v2.19.1.403. After importing the FASTQ files into CLC Genomics Workbench 21.0.3 (Qiagen, Aarhus, Denmark), the reads were adapter- and quality trimmed. Prior to mapping, sequence reads were trimmed using quality score (Phred score ≤ 25) and with maximum number of 2 ambiguous nucleotides allowed. Next, the adapter sequences were trimmed off according to the Illumina Adapter List. Reads shorter than 35 and longer than 75 nucleotides were discarded.
The filtered reads were mapped to the Sus scrofa 11.1 reference genome from NCBI database (GCA_000003025.6) using default parameters of CLC Genomics RNA-Seq Analysis tool (mismatch cost = 2, insertion cost = 3, deletion cost = 3, length fraction = 0.8 and similarity fraction = 0.8). For principal component analysis (PCA), mapped reads were TMM normalized, log CPM values calculated and Z-normalization performed. For the ex vivo condition, differential gene expression test for differences between all pairs of CD8+ T-cell subsets using Wald test was performed. Therefore, three pairwise comparisons were made: (i) naïve vs. terminally differentiated, (ii) intermediate vs. terminally differentiated, and (iii) naïve vs. intermediate differentiated. To assess the effect of stimulation on gene expression profiles of CD8+ T-cell subsets, Wald test with medium condition as control group was used. Correspondingly, that yielded two pairwise comparisons for each CD8+ T-cell subset: (i) ConA stimulation vs. medium and (ii) PMA/ionomycin stimulation vs. medium. As criteria to define differentially expressed genes (DEGs), fold-change > |2|, maximum of the average reads per kilobase per million mapped reads (RPKM’s) > 2 and a false discovery rate corrected p-value < 0.01 (FDR) were used. Venn diagram and heat map visualization of DEGs were constructed using ggvenn and pheatmap packages in R software version 4.0.2 (R Core Team, GNU General Public License). Bar charts were visualized with Tableau Desktop 2020.3 (Tableau Software Inc.).
For DEGs, gene ontology (GO) and enrichment analysis for immune system processes were executed using the ClueGO v.2.5.8 plug-in in the bioinformatic software Cytoscape 3.8.2. version (https://cytoscape.org). The analysis was performed for upregulated genes between CD8+ T-cell subsets and based on GO data for Sus scrofa. Following cut-off thresholds were set: at least 3 genes per GO term, two-sided hypergeometric statistical testing corrected with the Bonferroni step-down method (p < 0.05) and a Kappa score of 0.4. Moreover, organism-specific pathway analysis of DEGs were constructed by using KEGG mapper based on Kyoto Encyclopedia of Genes and Genomes (KEGG) pathway database with KEGG Orthology (KO) assignment.
Based on our hypothesis that within the CD8β+ T-cell subpopulation three subsets with distinct differentiation stages can be defined, we analyzed the presumable naïve (Tn; CD8β+CD27+CD11alow), intermediate differentiated (Tinter; CD8β+CD27dimCD11a+), and terminally differentiated cells (Tterm; CD8β+CD27-CD11ahigh).
In total 3.59 billion paired-end reads were generated by sequencing 72 libraries. Overall, the percentage of mapping reads to the reference genome was between 90.44% and 94.87% (mean = 93.1%) with approximately 50 million paired-end reads per sample. PCA of gene expression data from all ex vivo CD8+ T-cell subsets revealed distinguishable differences between CTL subsets as PCA plot clustered data into three distinct groups (Figure 1A).
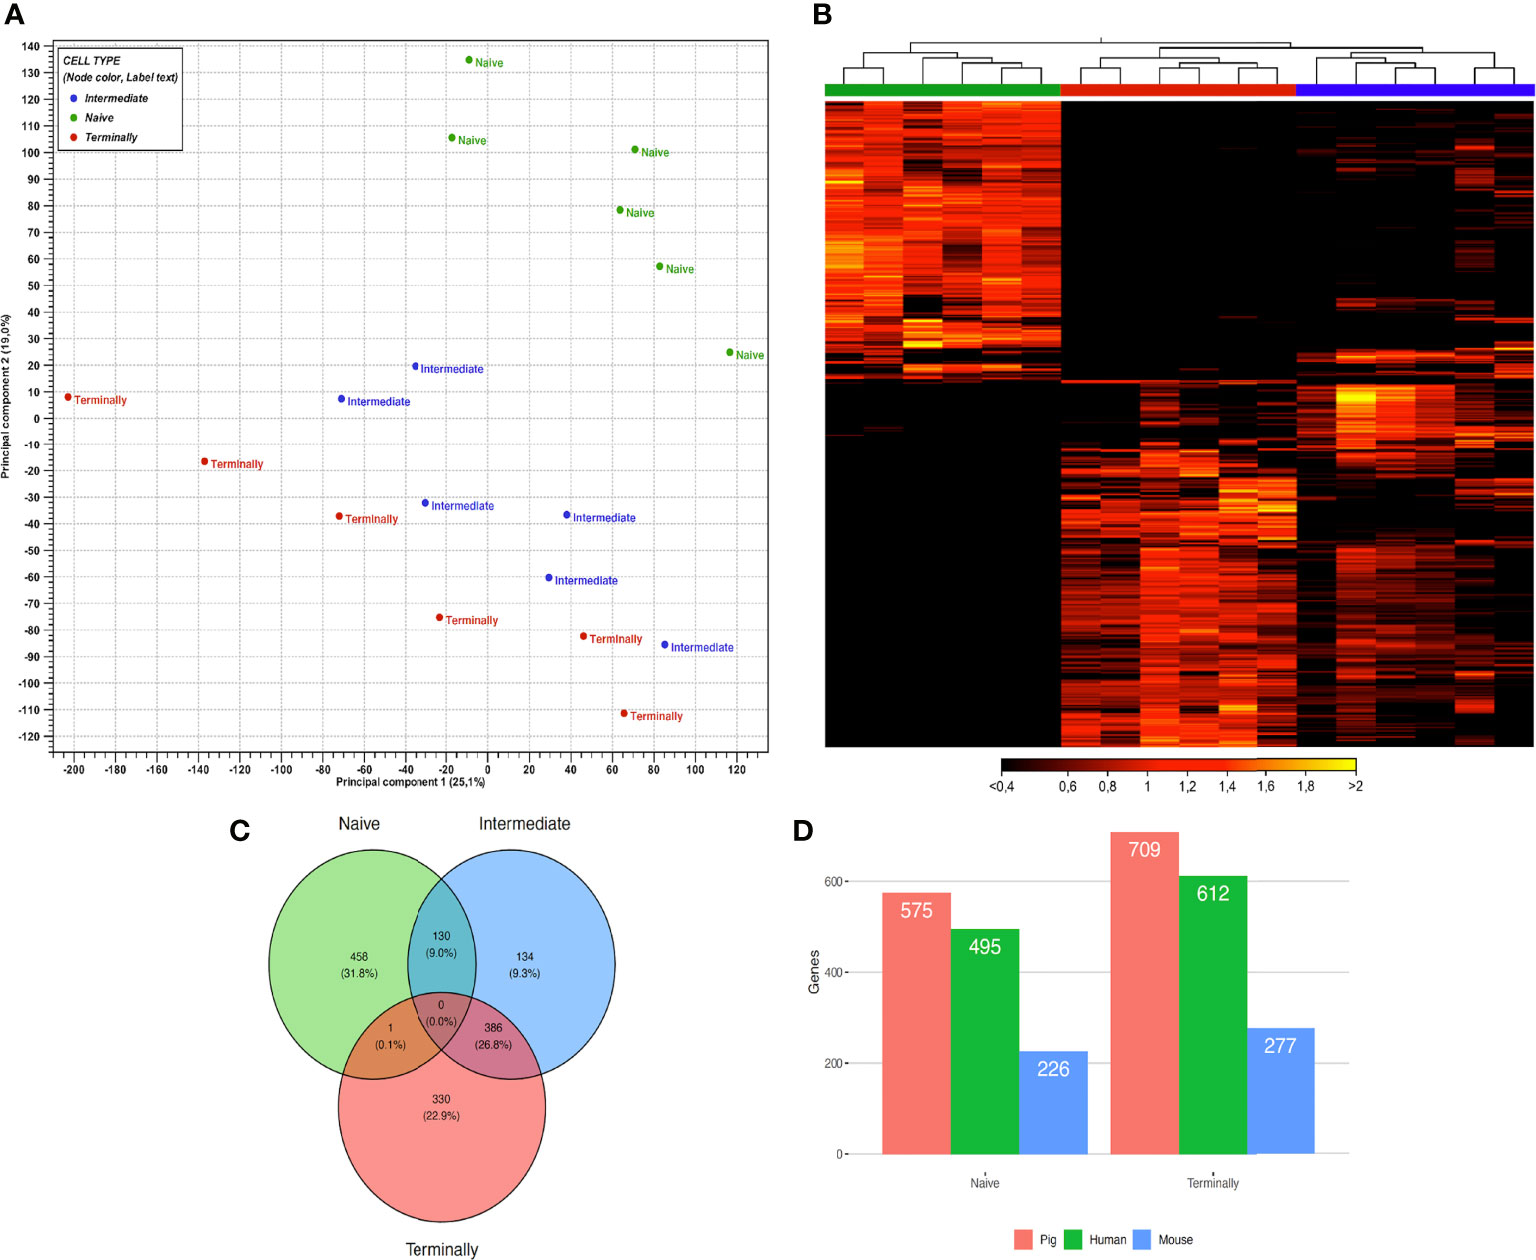
Figure 1 Gene expression profiles of ex vivo sorted CD8+ T-cell subsets. (A) PCA plot of expression data derived from 18 ex vivo CD8+ T-cell subsets of six animals. Colors indicate three CD8+ T-cell subsets: green, naïve CD8+ T cells; blue, intermediate differentiated CD8+ T cells; red, terminally differentiated CD8+ T cells. PC1 explains 25.1% and PC2 explains 19% of the observed variance in data. (B) Heat map with hierarchical clustering of 1439 selected genes between ex vivo CD8+ T-cell subsets. Figure illustrates clustering of three CD8+ T-cell subsets based on gene expression values. Rows represent genes and columns samples, with yellow indicating high and black low expression. The dendrogram on the top indicates the correlation between samples. Colors underneath the dendrogram represent three CD8+ T-cell subsets, namely: naïve (green), terminally (red) and intermediate (blue). (C) Venn diagram showing the overlap of 1439 DEGs between ex vivo CD8+ T-cell subsets. Colors indicate three main CD8+ T-cell subsets: green, naïve CD8+ T cells; blue, intermediate differentiated CD8+ T cells; red, terminally differentiated CD8+ T cells. (D) Orthologous genes from DEGs in porcine naïve and terminally differentiated CD8+ T-cell subsets compared to human and mouse.
For hierarchical cluster analysis, we selected 1439 genes, which were significantly expressed in at least one pairwise comparison between CD8+ T-cell subsets (as defined in the Methods section). Afterwards, a heat map based on their gene expression values was generated. Notably, the hierarchical clustering of selected genes identified three well-defined groups of samples. The first contained all Tn samples, the second all Tterm samples and the third all Tinter samples (Figure 1B). Genes highly expressed in Tn were downregulated in Tterm and vice versa. This clear separation regarding gene expression could indicate transcriptional switch that CD8+ T cells undergo while differentiating from naïve to terminally differentiated CD8+ T cells. In comparison to Tn and Tterm, Tinter showed upregulation of genes expressed in both groups. However, Venn diagram analysis showed that Tinter and Tterm share more DEGs (n=386) than Tinter and Tn (n=130) (Figure 1C). In contrast, only one upregulated DEGs was shared between the Tn and Tterm when compared to Tinter. Next, using Wald test for pairwise comparison, 575 and 709 DEGs were identified as upregulated in Tn and Tterm, respectively (Supplementary Table S1). The number of upregulated DEGs was smaller in Tinter vs. Tterm comparison than Tn vs. Tinter comparison. A higher number of upregulated DEGs (n = 492) was observed in Tinter compared to Tn (n = 215) CD8+ T cells. Also, higher numbers of upregulated DEGs were discovered in Tinter (n = 208) than in Tterm (n = 132). To obtain further information about each stage of CD8 T-cell differentiation, gene expression profiles were compared between Tn, Tinter and Tterm. We found that genes related to early stages of CD8 T-cell differentiation were highly expressed in the Tn (Table 1). Expression of several genes encoding transcription factors associated with naïve lymphocytes (27), including LEF1, BACH2, TCF7 (TCF1), SATB1, ZEB1 and BCL2 were markedly increased in the Tn. In contrast, genes encoding transcription factors associated with terminally differentiated effector cells, such as TBX21 (T-bet), PRDM1 (Blimp-1), ZEB2, ZNF683 (Hobit), BATF, EZH2 and ID2 were highly upregulated in the Tterm.
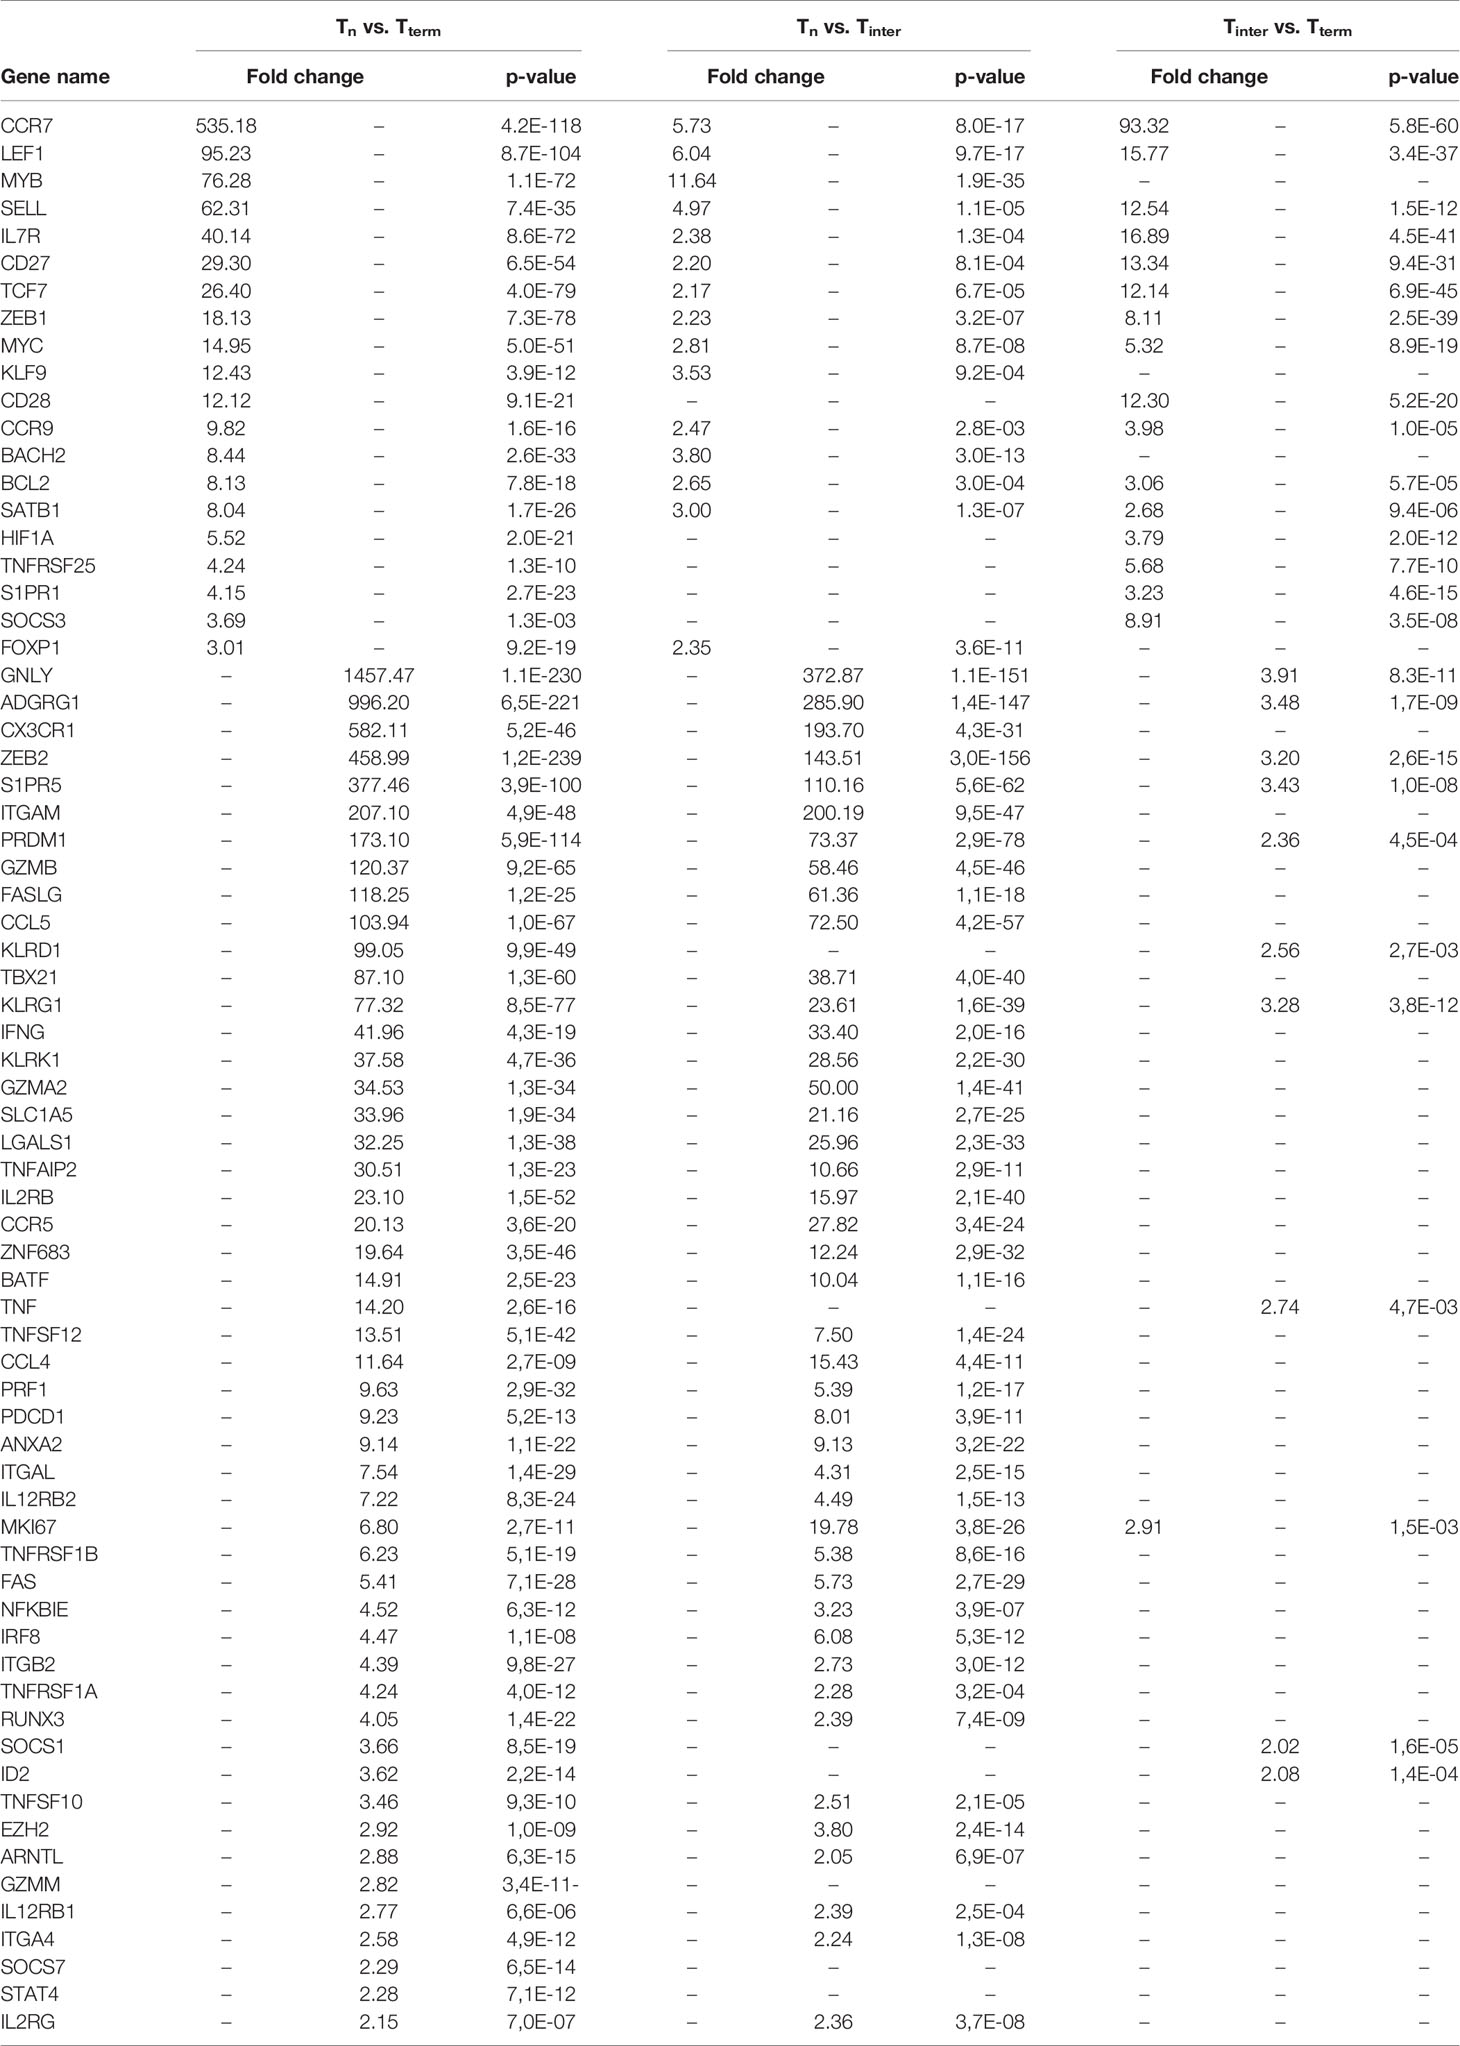
Table 1 Selected differentially expressed genes between ex vivo Tn, Tinter and Tterm.
Furthermore, Tterm showed high expression of several genes involved in cell adhesion and migration including CX3CR1, CCR5, CCL4 and CCL5. Moreover, higher expression of adhesion genes ITGAM (CD11b) and ITGAL (CD11a) (28) was observed among Tterm compared with Tn and Tinter. Expression of ITGA4 (CD49d), which together with CD44 is expressed in effector T cells and effector memory T cells (13), was upregulated in Tinter and Tterm. In addition, expression of CD44 was increased in both Tinter and Tterm but not in the Tn (Supplementary Table S1). Conversely, genes encoding lymph node homing receptor molecules such as CCR7, SELL (CD62L) and CCR9 were highly upregulated in the Tn. Sphingosine-1-Phosphate Receptor 1 (S1PR1), important for lymphocyte trafficking and upregulated in human naïve T cells (29), was also increased in the porcine Tn. Also, Tn showed high expression of genes encoding CD27 and CD28 molecules, the former in accordance with cell surface expression used for the sorting strategy.
We observed that several genes involved in T-cell effector functions and cytolytic killing, including GNLY (Granulysin), PRF1 (Perforin), GZMB (Granzyme B), FAS, FASL, IFNG and TNF, were highly increased in Tterm in comparison to Tn or Tinter. Notably, Tterm expressed the GNLY 1457-fold higher in comparison to Tn. Moreover, Tterm showed high expression of KLRG1, KLRD1 and KLRK1, whereas Tn displayed high mRNA levels of IL-7R (CD127). In mouse a selective expression of IL-7R (CD127) is used for the discrimination between MPEC and SLEC, with the high expression specific for MPEC (8). In addition to the high expression of IL-7R, human MPEC show low expression of KLRG1, while SLEC show upregulation of KLRG1 and low expression of IL7R (13).
We found higher expression of co-inhibitory molecule PDCD1 (PD-1) in Tinter and Tterm when compared to the Tn. Previous research suggests that high expression of PDCD1 (PD-1) is specific for SLEC formation, whereas low PDCD1 expression contributes to the T effector memory generation (30). Several genes encoding cytokine receptors associated with effector T cells were increased in the Tterm, including IL2RB (CD122), IL2RG (CD132), IL12RB1 and IL12RB2. In comparison to the Tn, Tinter and Tterm showed high expression of IRF8, which supports the transition from naïve to effector CD8+ T cells in independent matter to T-bet and Eomes (31). Furthermore, upregulation in transcript levels of ITGB2 (CD18) and ANXA2, known to be increased in CD8+ effector T cells (32), as well as LGALS1, which is expressed only on activated CD8+ effector T cells but not resting CD8+ T cells (33), were observed in Tinter and Tterm. Additionally, genes strongly linked to cytotoxic T cells such as S1PR5 and ADGRG1 were substantially upregulated in the Tterm. By contrast, Tn showed high expression of genes, which enforce quiescence state of naïve T cells (MYB, FOXP1, KLF9 and SOCS3). In comparison to Tn, we found other members of SOCS family, namely SOCS1 and SOCS7, highly expressed in Tterm. Furthermore, expression of MKI67, encoding proliferation marker Ki-67, was upregulated in Tinter and Tterm. Both TNFRSF1A (TNFR1) and TNFRSF1B (TNFR2) were upregulated in Tinter and Tterm. While transcripts of TNFSF12 (TWEAK) and TNFSF10 (TRAIL) were upregulated in Tinter and Tterm, expression of costimulatory TNFRSF25 (DR3) was highly induced in the Tn. Only Tterm expressed high levels of GZMM and STAT4, on the other hand Tinter showed upregulation of GZMA2. Notably, the expression of RUNX3, which is important for the acquisition and maintenance of cytolytic functions of CD8+ effector T cells (34), was upregulated in Tinter and Tterm. Furthermore, Tinter and Tterm showed increased levels of TNFAIP2 and NFKBIE. Regarding genes involved in metabolism, we observed high expression of ARNTL and SLC1A5 in more differentiated CTL subsets, whereas expression of HIF1A was upregulated in the Tn. Interestingly, when compared to Tn and Tterm, Tinter shared a more comparable gene expression profile associated with later stages of T-cell differentiation. In particular, most of genes highly expressed in Tterm were also upregulated in Tinter. However, the difference in expression of genes related to early stages of T-cell differentiation was substantially smaller between Tn and Tinter than Tn and Tterm. Also, those genes were higher expressed in Tinter than Tterm.
For better understanding of the relationship between porcine, human and mouse CD8+ T cells we assessed the orthology of their genes expressed in CD8+ T cells in corresponding subsets publicly available on GEO Data sets (NCBI) under GDS3834 and GDS592. Here, we have focused on the analysis of DEGs in Tn and Tterm, which cover the vast majority of DEGs generated from porcine CD8+ T-cell subsets. When compared to DEGs in porcine Tn, we found 495 (86.1%) orthologs in human and 226 (39.3%) in mouse data set. In case of Tterm, out of 709 DEGs, 612 (86.3%) were recorded in human, and 277 (39.1%) in mouse data set (Figure 1D).
In order to further highlight the heterogeneity in gene expression between CD8+ T-cell subsets, cells were analyzed upon stimulation with ConA and PMA/ionomycin and compared to cells cultured in medium control. Overall, a substantially higher number of upregulated DEGs in all three CD8+ T-cell subsets was observed in response to PMA/ionomycin compared to ConA stimulation. Additionally, gene expressions of all PMA/ionomycin-stimulated CD8+ T-cell subsets are clearly distinct from all other CD8+ T-cell subsets as showed in PCA plot (Figure 2A). Further investigation of CD8+ T-cell subsets stimulated with PMA/ionomycin revealed the highest number of upregulated DEGs in the Tterm (1717), followed by the Tinter (1667) and the Tn (1383). Conversely, in CD8+ T-cell subsets stimulated with ConA, the highest number of DEGs was found in the Tn (100), followed by the Tinter (35) and the Tterm (36) (Supplementary Table S1). In order to obtain a more detailed view upon PMA/ionomycin stimulation, PCA was performed additionally only on PMA/ionomycin-stimulated CD8+ T-cell subsets (Figure 2B). Interestingly, CD8+ T-cell subsets clustering is unaltered to PMA/ionomycin stimulation, resulting again in the three distinct groups of Tn, Tinter and Tterm. Despite this separate clustering, Venn diagram analysis revealed high number of DEGs shared between PMA/ionomycin-stimulated CD8+ T-cell subsets (903), indicating that all three subsets acquire more similar cell properties following PMA/ionomycin stimulation. In case of ConA-stimulated CD8+ T-cell subsets, we found much smaller number of shared DEGs (Figure 2C, D).
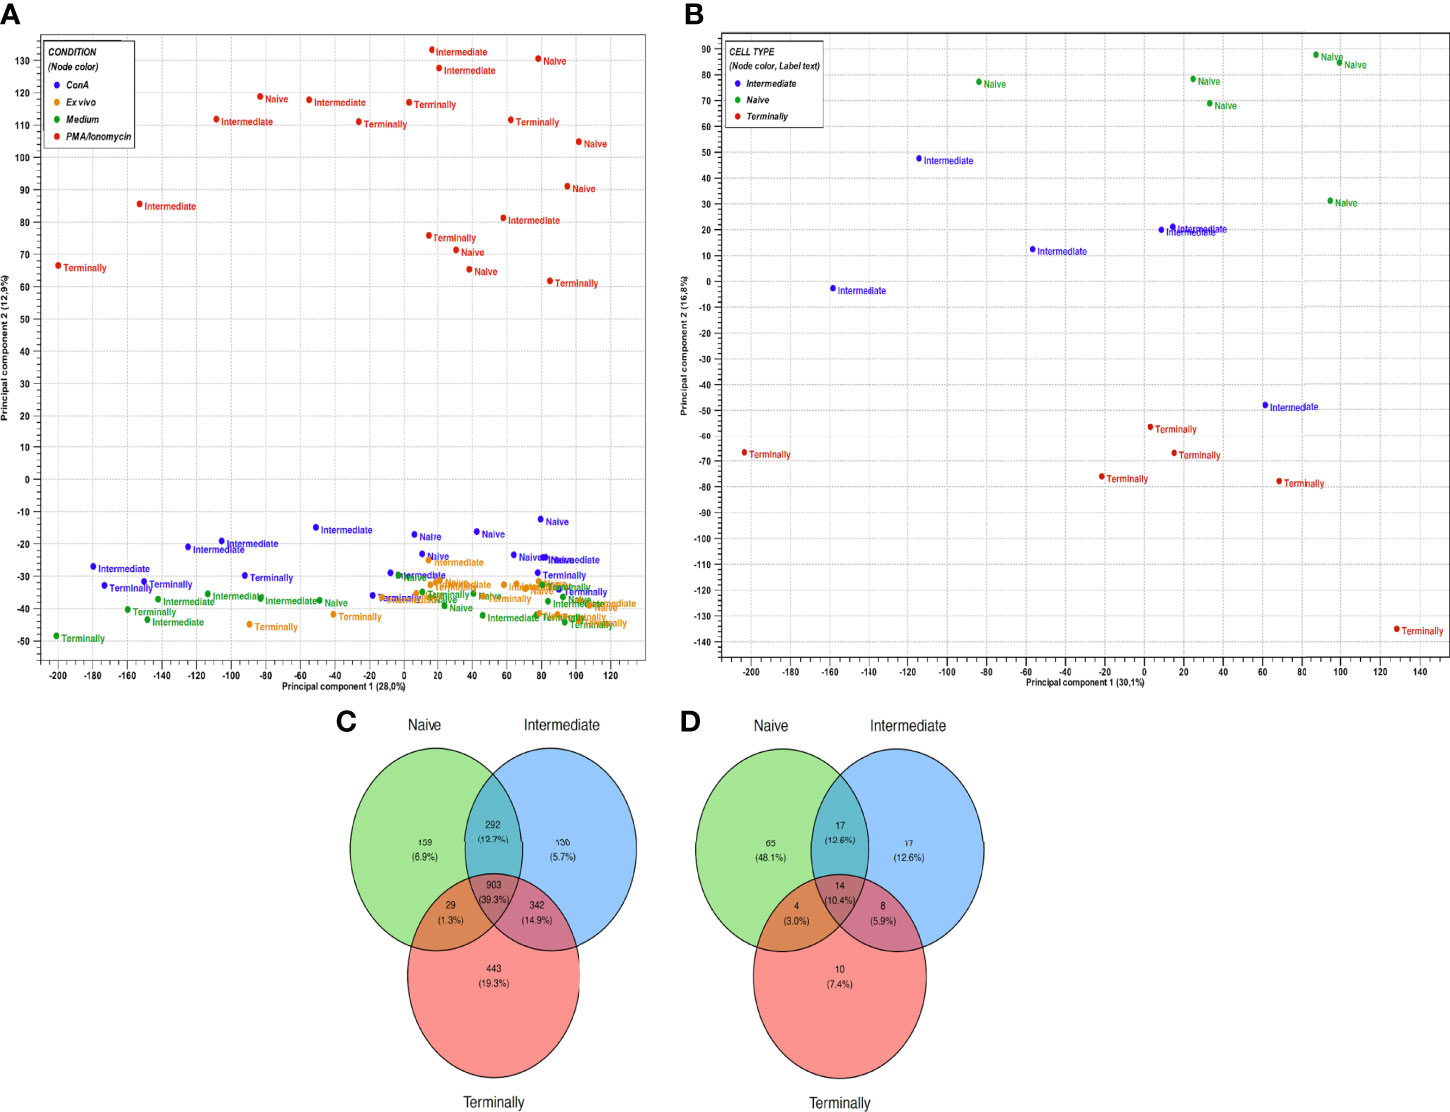
Figure 2 Gene expression profiles of in vitro stimulated CD8+ T-cell subsets. (A) PCA plot of expression data derived from 72 CD8+ T-cell subsets of six animals. Colors indicate four conditions: blue, ConA stimulation; orange, ex vivo condition; green, medium control; red, PMA/ionomycin stimulation. Cross, X symbol and square shape represent naïve, intermediate and terminally differentiated CD8+ T-cell subsets, respectively. PC1 explains 28% and PC2 explains 12.9% of the observed variance in data. (B) PCA plot of expression data derived from 18 PMA/ionomycin-stimulated CD8+ T-cell subsets of six animals. Colors indicate three CD8+ T-cell subsets: green, naïve CD8+ T cells; blue, intermediate differentiated CD8+ T cells; red, terminally differentiated CD8+ T cells. PC1 explains 30.1% and PC2 explains 16.8% of the observed variance in data. (C) Venn diagram showing the overlap of DEGs between PMA/ionomycin-stimulated CD8+ T-cell subsets. (D) Venn diagram showing the overlap of DEGs between ConA-stimulated CD8+ T-cell subsets.
Several genes encoding cytokines involved in T-cell response were differentially expressed between CD8+ T-cell subsets (Figure 3A). Looking at the expression of IFNG (IFN-γ) and TNF, we observed overexpression in all three CD8+ T-cell subsets following PMA/ionomycin stimulation, but only moderate expression in Tinter with ConA stimulation. Porcine Tn and Tinter showed high expression of IL2 and its receptor chains IL2RA (CD25) and IL2RG (CD132) as well as IRF7 when stimulated with PMA/ionomycin. It was reported that IL2 and its receptor chains IL2RA (CD25) and IL2RG (CD132) are involved in terminal effector differentiation but also in memory development of CD8+ T cells (37). Moreover, expression of IL4, IL17A, IL18RAP and IL22 was induced only in the Tinter stimulated with PMA/ionomycin. In contrary, IL12RB1, IL27RA and ILF3 were only expressed by the Tterm. Nevertheless, both CD8+ T-cell subsets showed high expression of IL10 and IRF2BP2 after PMA/ionomycin stimulation. Although the expression of IRF4 was upregulated in all three CD8+ T-cell subsets following PMA/ionomycin and ConA stimulations, the highest expression was induced by PMA/ionomycin-stimulated Tn followed by Tinter and Tterm. Consistently, studies in mice showed that IRF4 contributes to expansion and maintenance of effector functions of CTL as well as to memory formation of CTL (36). In case of IRF8 transcript, we found similar expression between CD8+ T-cell subsets stimulated with PMA/ionomycin. In comparison, ConA stimulation induced a much smaller extent expression of IRF8 in Tinter and Tterm. Expression of both genes, IL6ST and ILF2 were similarly increased in all three CD8+ T-cell subsets upon PMA/ionomycin stimulation. Remarkably, the highest expression of IL4R, IL15RA and IRF1 was recorded in the Tn followed by Tinter and Tterm. Of interest, we found three genes of TNF-induced proteins, namely TNFAIP2, TNFAIP3 and TNFAIP8 highly expressed in CD8+ T-cell subsets following PMA/ionomycin stimulation. Moreover, expression of TNFAIP2 and TNFAIP3, both inhibiting canonical NF-kB signaling pathway and thus negatively effecting cytokine production, was highest in the Tn (38, 39). Apart from its aforementioned functions, TNFAIP3, also highly expressed on naïve T cells, restricts MAP kinases and CD8+ T cell proliferation (40).
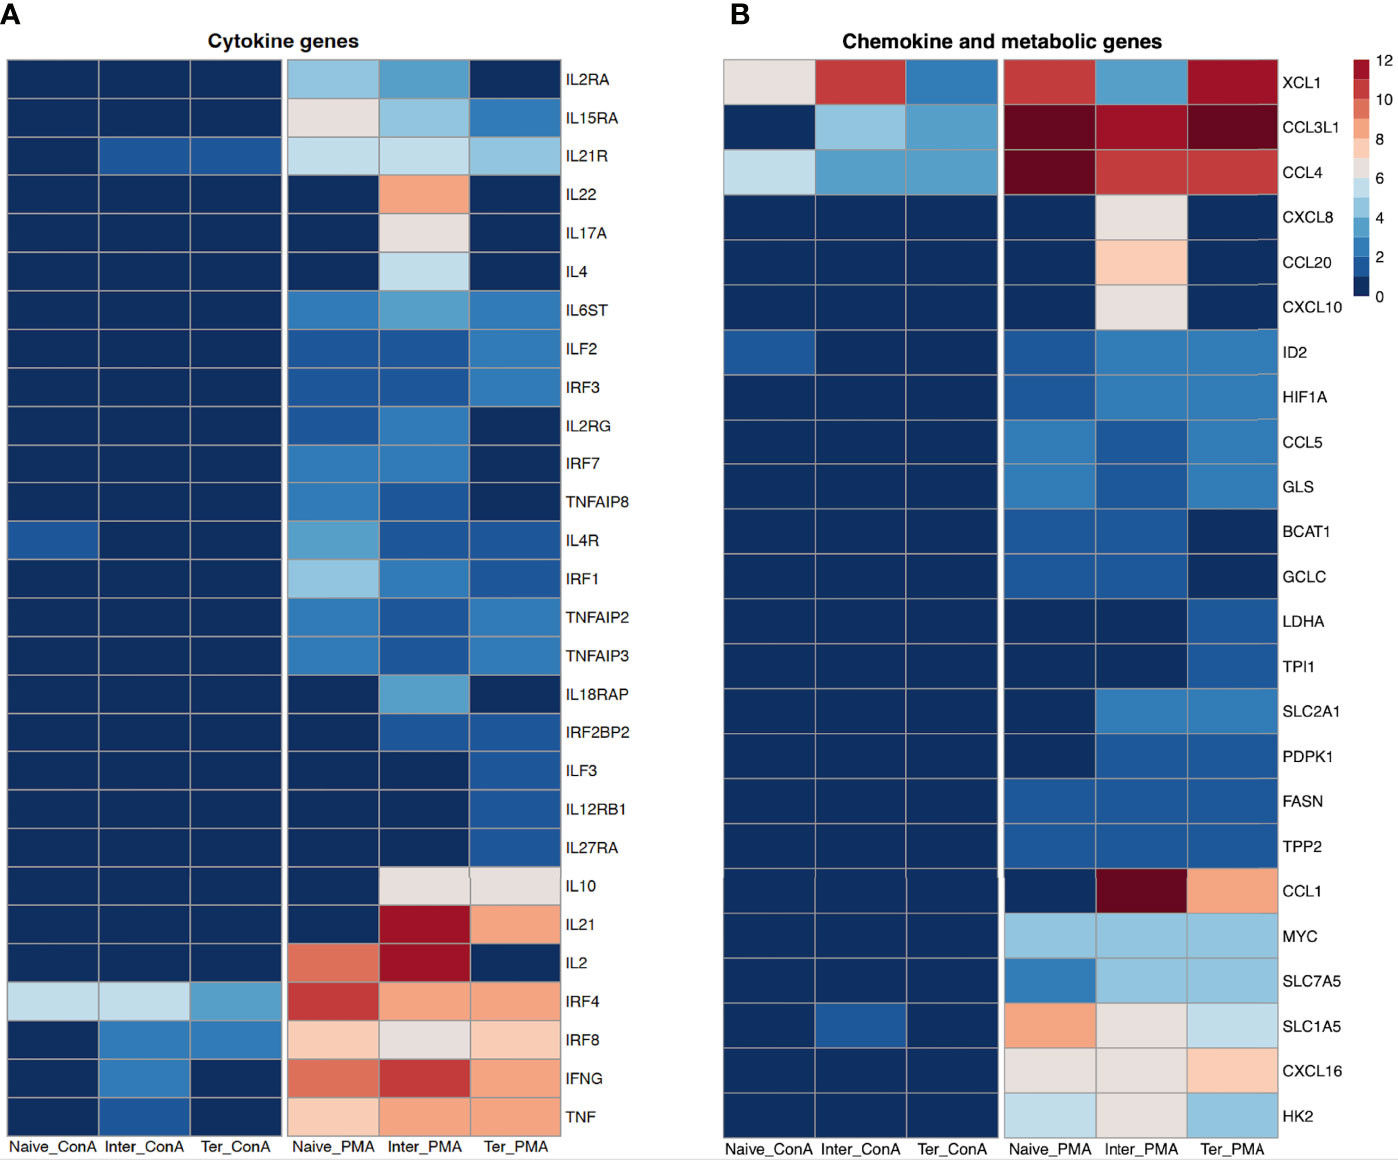
Figure 3 Transcription profiles of naïve, intermediate and terminally differentiated CD8+ T-cell subsets. Data derived from 18 ConA and 18 PMA/ionomycin-stimulated CD8+ T-cell subsetsof six animals. As criteria to define DEGs, fold-change > |2| compared to medium control, maximum of the average RPKM’s > 2 and a false discovery rate corrected p-value < 0.01 (FDR) were used. (A) Expression of cytokine genes as log2 fold-change between ConA- and PMA/ionomycin-stimulated CD8+ T-cell subsets and their unstimulated control. (B) Expression of chemokine and metabolic genes as log2 fold-change between ConA- and PMA/ionomycin-stimulated CD8+ T-cell subsets and their unstimulated control.
Chemokines and chemokine receptors play a pivotal role in attracting and guiding the naïve and effector T cells to lymph nodes and sites of inflammation, respectively (41). Overall, in all three CD8+ T-cell subsets the PMA/ionomycin stimulation induced stronger expression of genes associated with chemokines than after ConA stimulation (Figure 3B). Expression of CCL4 (MIP-1ß) and XCL1 (ATAC/lymphotactin), the inflammatory chemokines secreted by activated CD8+ T cell (42), was induced in all three CD8+ T-cell subsets upon both stimulations, although with significantly higher increase in PMA/ionomycin-stimulated CD8+ T-cell subsets. All three PMA/ionomycin-stimulated CTL subsets showed similar expression of CCL3L1, while following ConA stimulation it was increased in Tinter and Tterm. Interestingly, only Tinter stimulated with PMA/ionomycin showed significant increase in CCL20, CXCL8 and CXCL10 expression, later known as one of interferon-inducible ligands of CXCR3 (43). The PMA/ionomycin stimulation induced also transcriptional upregulation of CCL5 (RANTES) and CXCL16 in all three CD8+ T-cell subsets. Furthermore, transcription of CCL1 was increased in Tinter and Tterm upon PMA/ionomycin stimulation.
Transition from naïve T cell to activated effector T cell is accompanied by metabolic adjustment necessary for specific cellular functions (44). Overall, the PMA/ionomycin stimulation induced stronger expression of genes linked to T-cell metabolism in comparison to the ConA stimulation. Tn and Tinter upregulated BCAT1 and GCLC upon PMA/ionomycin stimulation, while Tterm were enriched in transcripts for LDHA and TPI1 gene. Both Tinter and Tterm induced high expression of PDPK1 and SLC2A1, whereas FASN, GLS and TPP2 were similarly expressed by all three CD8+ T-cell subsets following PMA/ionomycin stimulation. In comparison to Tn, we recorded higher expression of HIF1A and SLC7A5 in Tinter and Tterm. Upon PMA/ionomycin stimulation, the highest levels of SLC1A5, HK2 and MYC were expressed in Tn, Tinter and Tterm, respectively. The ConA stimulation induced upregulation of ID2 expression in Tn and SLC1A5 in Tinter only. Contrary, the PMA/ionomycin stimulation induced upregulation of ID2 in all three CD8+ T-cell subsets (Figure 3B).
Next, we examined the impact of stimulation with PMA/ionomycin and ConA on expression of transcription factor genes in CD8+ T-cell subsets (Figure 4A). Several genes encoding transcription factors associated with terminally differentiated effector cells, including BATF, BATF3, EZH2, MYC and TBX21 were upregulated in all three CD8+ T-cell subsets upon PMA/ionomycin stimulation but not after ConA stimulation. While the highest expression of BATF3, EZH2 and MYC was observed in the Tterm, highest upregulation of TBX21 which encodes the T-bet, the master regulator of cytotoxic T-cell development (45), was observed in the Tn compared to Tinter and Tterm. Interestingly, upregulation of EOMES and ID3 was limited only to the ConA-stimulated Tn. Tinter and Tterm displayed upregulation of FOXO1, FOXP1, PRDM1 (Blimp-1), SATB1 and SREBF2 following PMA/ionomycin stimulation. Recent studies in mice and human have shown that Blimp-1, encoded by PRDM1, enhances formation of SLECs, production of IL-10 and cytotoxic functions of CD8+ T cells (46). Along the PMA/ionomycin-stimulated differentiation subsets, we observed a gradual increase of expression of EGR family of zinc-finger transcription factors, including EGR1, EGR2 and EGR3, which are upregulated upon TCR activation. Similar expression was recorded in case of NAB2, a coactivator and corepressor of T-cell function (47). Also, transcriptions of NR4A2 and NR4A3, two members of the Nuclear receptor 4A (NR4A) family known for their important role during acute and chronic CD8+ T cell response (48), were highly expressed along the differentiation subsets. Moreover, stimulation with PMA/ionomycin induced the highest expression of both genes in Tterm, followed by Tinter and Tn. In contrary, the highest expression of NR4A2 and NR4A3 in ConA-stimulated subsets was recorded in Tn. Recently it has been reported that NR4A3 increases early expression of transcription factors involved in the SLEC differentiation and its absence favors differentiation of MPEC and central memory CD8+ T cells (49). Notably, Tn and Tinter but not Tterm expressed high levels of BCL2 upon PMA/ionomycin and ConA stimulation. These results are in accordance with the recent findings which show that naïve T cells highly express BCL2 and are more dependent on it for survival than effector and memory T cells (50). The transcription factor MYB promotes formation of stem-like memory cell and restrains terminal effector differentiation by inducing expression of BCL-2 and TCF7 as well as inhibition of ZEB2 (51). While Tn strongly expressed MYB following PMA/ionomycin and ConA stimulation, no upregulation was induced by Tinter or Tterm. Also, expression of BACH2, described as transcriptional repressor of terminal differentiation that restrains formation of short-lived effector cells (52, 53), was upregulated in Tn and Tinter but not Tterm after PMA/ionomycin stimulation. Furthermore, the PMA/ionomycin stimulation induced the expression of ZEB1 and TCF3 in Tinter and Tterm, respectively. Studies in mice showed that STAT1 and STAT4 are important transcription factors for the clonal expansion and promotion of antigen-activated CD8+ T cells. Whereas STAT1 effects type I IFN-dependent clonal expansion of CD8+ T cells, STAT4 contributes to proliferation and effector maturation of CD8+ T cells triggered by IL-12-mediated signaling (54, 55). In fact, the PMA/ionomycin stimulation induced high expression of STAT1 in all three CD8+ T-cell subsets, while the ConA stimulation induced the upregulation only in the Tinter. In case of STAT4 expression, we observed upregulation in the Tinter stimulated with ConA and Tterm stimulated with PMA/ionomycin. Notably, while BCL6 was highly expressed in Tn and Tterm following PMA/ionomycin stimulation, expression of ID2, a transcriptional regulator upregulated by activated CD8+ T cells late in effector phase which can also influence their differentiation into memory cells (56), was upregulated in all three CD8+ T-cell subsets stimulated with PMA/ionomycin. Moreover, expression of ID2 was also increased in the Tn following ConA stimulation. Transcription of KLF9 in the Tn was increased with ConA and PMA/ionomycin stimulation as well as in PMA/ionomycin-stimulated Tinter.
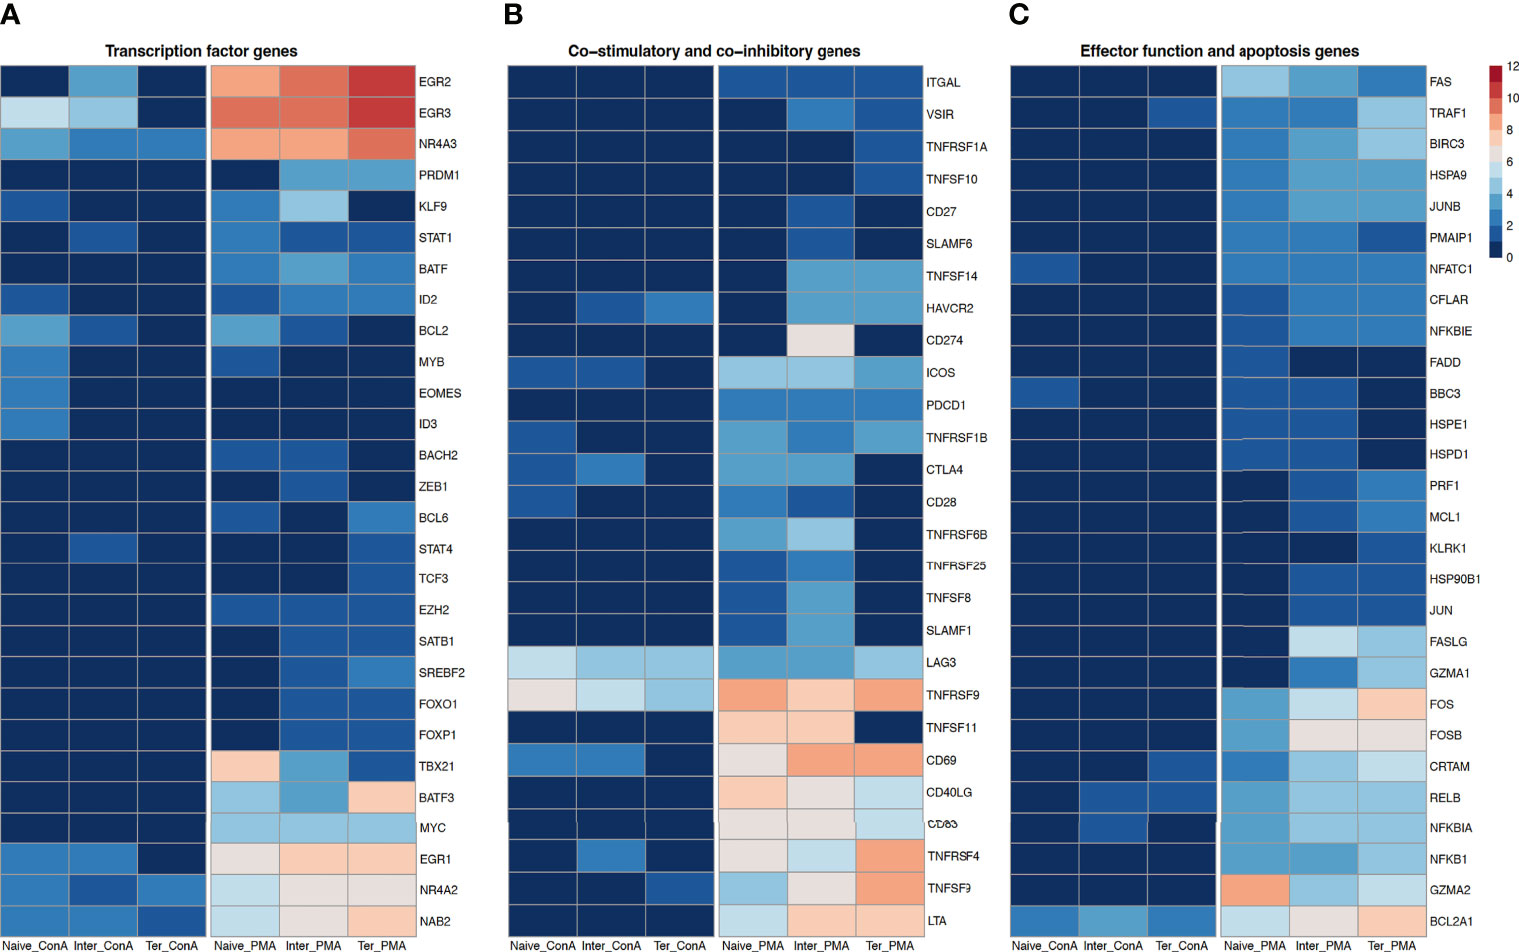
Figure 4 Transcription profiles of naïve, intermediate and terminally differentiated CD8+ T-cell subsets. Data derived from 18 ConA and 18 PMA/ionomycin-stimulated CD8+ T-cell subsets of six animals. As criteria to define DEGs, fold-change > |2| compared to medium control, maximum of the average RPKM’s > 2 and a false discovery rate corrected p-value < 0.01 (FDR) were used. (A) Expression of transcription factor genes as log2 fold-change between ConA- and PMA/ionomycin-stimulated CD8+ T-cell subsets and their unstimulated control. (B) Expression of co-stimulatory and co-inhibitory genes as log2 fold-change between ConA- and PMA/ionomycin-stimulated CD8+ T-cell subsets and their unstimulated control and (C) Expression of genes associated with effector functions and apoptosis as log2 fold-change between ConA- and PMA/ionomycin-stimulated CD8+ T-cell subsets and their unstimulated control.
Looking at co-stimulatory genes, we found that expression of CD27 (TNFRSF7), expressed mostly on naïve T cells and also required for T-cell memory in mice (35), was upregulated only in Tinter stimulated with PMA/ionomycin (Figure 4B). Also, another co-stimulatory gene CD28, which is absent from human effector CTLs (14), was upregulated in Tn and Tinter stimulated with PMA/ionomycin as well as in Tn stimulated with ConA. Furthermore, upon PMA/ionomycin stimulation all three CD8+ T-cell subsets expressed ITGAL (CD11a), a β2 integrin reported to be important for homing of T cells and generation of antigen-specific T cells (9). In all three CD8+ T-cell subsets PMA/ionomycin stimulation induced high expression of CD40LG, a member of the tumor necrosis factor superfamily transiently expressed on activated CD8+ T cells that promotes expansion and differentiation in a cell-extrinsic manner (57), and CD83, a member of the immunoglobulin superfamily. Expression of CD69, an early activation marker, was highly expressed in all three CD8+ T-cell subsets stimulated with PMA/ionomycin, and to a much smaller extent in Tn and Tinter upon ConA stimulation. These differences in transcripts of CD69 concerning different stimulations can be explained with the fact that the CD69 expression is upregulated already after 30 to 60 minutes after activation and declines promptly after 4-6 hours (58). Furthermore, transcription of the inducible T cell co-stimulator (ICOS), a member of the immunoglobulin family structurally close to CD28 and rapidly expressed on activated T cells (59), was highly increased in all three CD8+ T-cell subsets following PMA/ionomycin and to a lesser extent in Tn and Tinter after ConA stimulation. In addition, all three CTL subsets stimulated with PMA/ionomycin showed high increase of the lymphotoxin alpha (LTA), described to positively affect antigen-specific T-cell response during an acute LCMV infection through increase of IFN-γ production (60). Two members of the signaling lymphocytic activation molecule family (SLAMF), namely, SLAMF1 and SLAMF6, were induced in Tn and Tinter after PMA/ionomycin stimulation. Highest expression of SLAMF1 and SLAMF6 has been reported on central memory and effector memory subsets of CD8+ T cells (61).
In case of co-inhibitory genes, known to inhibit T-cell activation, cytolytic function and cytokine production (62), we observed that expression of PDCD1 (PD-1) was induced in all three CD8+ T-cell subsets stimulated with PMA/ionomycin, whereas its ligand CD274 (PD-L1) was only expressed on Tinter. Moreover, both Tn and Tinter showed upregulation of cytotoxic T lymphocyte antigen-4 (CTLA4) upon stimulations, with PMA/ionomycin stimulation inducing stronger expression. It has been shown that CTLA4 is closely related to CD28, binds to the same ligands (CD80 and CD86) and inhibits T cell response (63). Next, we found that expression of lymphocyte activation gene-3 (LAG3) was induced in all three CD8+ T-cell subsets after both stimulations. This is in accordance with previous research in mice suggesting that naïve CD8+ T cell show low expression of LAG3, but increase its expression in response to stimulation (64). Notably, expression of HAVCR2, which encodes T-cell immunoglobulin and mucin domain-3 (Tim-3) inhibitory molecule, was upregulated only in Tinter and Tterm. The tumor necrosis factor superfamily (TNFSF) and its corresponding receptor superfamily (TNFRSF) were differently expressed among porcine CD8+ T-cell subsets.
In case of TNFSFs, PMA/ionomycin stimulation induced expression of TNFSF8 (CD30L) and TNFSF11 (RANKL) in Tn and Tinter, whereas transcript of TNFSF14 (LIGHT) was upregulated in Tinter and Tterm. The highest expression of TNFSF9 (4-1BBL) could be observed in Tterm, followed by Tinter and Tn. In addition, the ConA stimulation induced its expression only in Tterm. Also, only Tterm showed increased upregulation of TNFSF10 (TRAIL) upon PMA/ionomycin stimulation. Regarding TNFRSFs, transcript of TNFRSF1A (TNFR1) was enriched in Tterm, while TNFRSF1B (TNFR2) was expressed in all three CD8+ T-cell subsets following PMA/ionomycin stimulation. Both Tn and Tinter expressed TNFRSF6B (DCR3) and TNFRSF25 (DR3) after PMA/ionomycin stimulations. Notably, expression of TNFRSF9 (4-1BB) was strongly induced in all CD8+ T-cell subsets upon both stimulations. Similarly, the PMA/ionomycin stimulation induced high expression of TNFRSF18 (GITR) and TNFRSF4 (OX40), an intermediate activation marker, in all CD8+ T-cell subsets, while stimulation with ConA induced the upregulation of these two genes in Tinter but only TNFRSF18 in Tterm.
Genes associated with effector functions of CTLs were primarily highly expressed by Tterm, followed by Tinter and in just few cases by Tn following PMA/ionomycin stimulation (Figure 4C). Moreover, the ConA stimulation had almost no effect on upregulation of those genes in CD8+ T-cell subsets. Several genes linked to cytolytic activity, including GZMA1, PRF1 (Perforin), FASLG, JUN, MCL1 and HSP90B1, were upregulated only in Tinter and Tterm following PMA/ionomycin stimulation. Also, the highest expression of genes belonging to Jun (JUN, JUNB) and Fos (FOS, FOSB) families was detected in the Tterm, followed by Tinter and Tn. Similarly, expression of several other genes involved in effector function and apoptosis, including BIRC3, CFLAR, CRTAM, HSPA9, NFATC1, NFKB1 and NFKBIE was induced among CD8+ T-cell subsets. Notably, only Tn and Tinter showed upregulation of BBC3, HSPD1 and HSPE1. While killer cell lectin like receptor k1 (KLRK1) gene was upregulated in the Tterm, transcript of FADD was induced only in Tn. Compared to Tinter and Tterm, we found higher expression of GZMA2 and PMAIP in Tn stimulated with PMA/ionomycin. Interestingly, both ConA and PMA/ionomycin stimulation induced upregulation of BCL2A1 in all CD8+ T-cell subsets, although with markedly stronger expression after PMA/ionomycin stimulation and in Tterm. What is more, the highest expression of TRAF1 and RELB was observed in the Tterm, followed by Tinter and Tn. In case of Tterm, expression of TRAF1 and RELB was also induced by the ConA stimulation, whereas Tinter showed only the upregulation of RELB transcript. Expression of another IkB family gene linked to apoptosis (65), namely the NFKBIA, was highest in the Tinter stimulated with PMA/ionomycin.
To extend the understanding of the immunological roles and functions of genes across different ex vivo CD8+ T-cell subsets, we performed GO term enrichment analysis. For GO terms related to immune system, most of the upregulated DEGs in the Tterm were assigned to lymphocyte activation involved in immune response (42.39%) (Figure 5A). In contrast, upregulated DEGs in the Tn were mostly associated with T-cell differentiation (42.31%), T-cell receptor signaling pathway (23.08%) and V(D)J recombination (11.54%). The majority of upregulated DEGs in the Tinter compared to naïve subsets were related to T-cell differentiation involved in immune response (27.69%), T-cell cytokine production (27.69%) and alpha-beta T-cell differentiation (23.08%). On the other side, upregulated DEGs in the Tinter compared to Tterm were mainly linked to the regulation of T-cell differentiation (90.0%). When compared to Tinter, most of the upregulated DEGs in Tn were enriched for V(D)J recombination (55.17%), regulation of T-cell receptor signaling pathway (17.24%) and T-cell differentiation (17.24%), whereas within the Tterm they were associated with regulation of lymphocyte differentiation (70.0%) (Supplementary Table S2, and Figure S2).
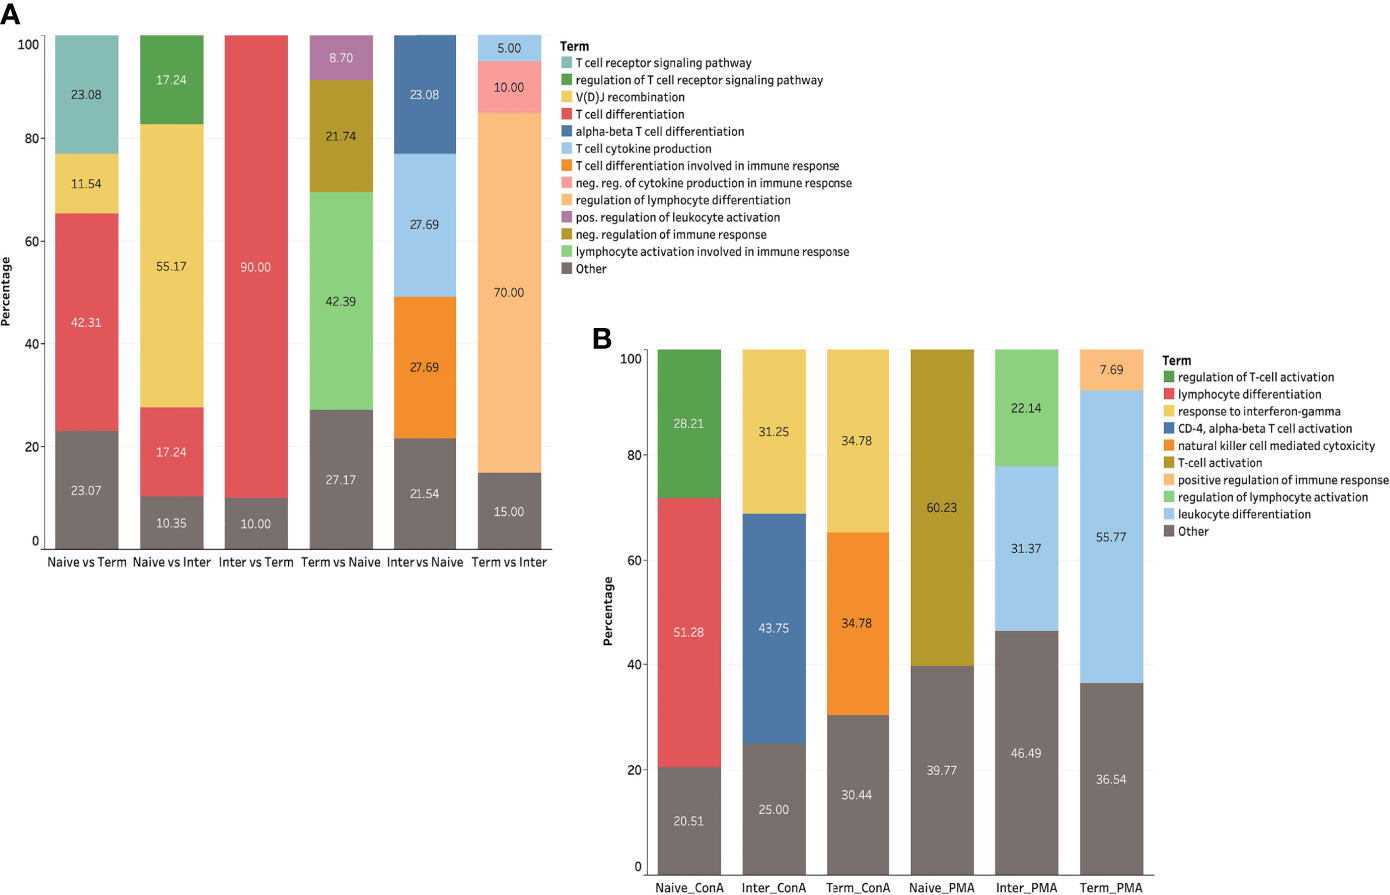
Figure 5 GO term analysis of ex vivo and in vitro stimulated CD8+ T-cell subsets (A) GO terms related to immune system of DEGs in ex vivo CD8+ T-cell subsets. (B) GO terms related to immune system of DEGs in CD8+ T-cell subsets upon ConA and PMA/ionomycin stimulation.
KEGG pathway analysis revealed that upregulated DEGs in the Tterm compared to Tn were assigned to 272 pathways, including 21 pathways related to the immune system. Within immune-related pathways, the highest number of upregulated DEGs were enriched in chemokine signaling and T-cell receptor signaling pathways. Additionally, upregulated DEGs were linked to metabolic, MAPK signaling and cytokine-cytokine receptor interaction pathways. Compared to Tterm, DEGs within Tn were associated with 278 pathways, with 20 immune-related pathways, as well as metabolic and MAPK signaling pathways. When compared to Tinter, DEGs of Tn and Tterm were enriched in 192 and 167 pathways, respectively. Furthermore, DEGs of both Tn and Tterm were enriched in 15 immune-related pathways. In comparison to Tn and Tterm, DEGs within Tinter were enriched in 268 and 235 pathways, respectively. All pathways including corresponding genes retrieved through KEGG pathway analysis were listed in Supplementary Table S3.
To further explore DEGs of in vitro stimulated CD8+ T-cell subsets, we conducted GO term enrichment analysis for immune system processes using previously mentioned bioinformatic software and plug-in package. The results demonstrated that the DEGs of PMA/ionomycin-stimulated Tn compared to medium control were mostly associated with the regulation of T-cell activation (60.23%) (Figure 5B). In contrast, the DEGs in PMA/ionomycin-stimulated Tterm were differently linked to the leukocyte differentiation (55.77%). For the DEGs of PMA/ionomycin-stimulated Tinter, we found enrichment in GO terms associated with the leukocyte differentiation (31.37%) and the regulation of lymphocyte activation (22.14%). Next, we investigated GO terms for immune processes in different CD8+ T-cell subsets stimulated with ConA, showing that the lymphocyte differentiation and the regulation of T-cell activation were more related with the Tn upon stimulation, while response to interferon-gamma term was typically associated with Tinter and Tterm (Supplementary Table S2 and Supplementary Figure S2).
We next performed KEGG pathway analysis of each CD8+ T-cell subset upon PMA/ionomycin and ConA stimulation as described above. Upregulated DEGs within PMA/ionomycin-stimulated Tn were assigned to 302 pathways in KEGG pathway database. Similar observations were made with Tinter (318 pathways) and Tterm (305 pathways) CD8+ T-cell subsets. Although similar number of pathways related to immune system were observed among PMA/ionomycin-stimulated CD8+ T-cell subsets, a much higher number of DEGs was found from Tinter and Tterm than Tn. Furthermore, Tinter showed the highest number of DEGs enriched in T-cell receptor signaling pathway (36), followed by Tterm (33) and Tn (25). Looking at the chemokine signaling pathway, Tinter and Tterm showed same number of DEGs enriched in the pathway (26), whereas Tn had only 18 DEGs involved. Besides immune-related pathways, DEGs from all PMA/ionomycin-stimulated CD8+ T-cell subsets were highly enriched in metabolic, MAPK-signaling and cytokine-cytokine receptor interaction pathways. Interestingly, number of DEGs enriched in MAPK-signaling pathway was gradually increased along the CD8+ T-cell subsets. Based on upregulated DEGs upon ConA stimulation, we recorded 175 pathways in case of Tn, 120 pathways for Tinter and only 43 pathways for Tterm. Also, upregulated DEGs within the Tn showed the highest number of immune-related pathways. In contrast to PMA/ionomycin-stimulated CD8+ T-cell subsets, ConA stimulation induced a limited number of genes associated with metabolic and MAPK-signaling pathways. Moreover, in all CD8+ T-cell subsets only few DEGs were enriched in T-cell receptor signaling, chemokine signaling and cytokine-cytokine receptor interaction pathways after ConA stimulation (Supplementary Table S3).
In the present study we assessed the transcriptome of three subsets within the CD8β+ T-cell population we hypothesize to represent distinct differentiation stages through RNA-Seq analysis. We aimed to identify differences in gene expression profiles between subsets as well as upon in vitro stimulation with ConA and PMA/ionomycin. Based on surface expression of CD11a and CD27, we defined differentiation stages of CD8β+ T-cells as follows: naïve (Tn; CD8β+CD27+CD11alow), intermediate differentiated (Tinter; CD8β+CD27dimCD11a+), and terminally differentiated cells (Tterm; CD8β+CD27-CD11ahigh). To the best of our knowledge, this is the first study which comprehensively describes the transcriptomes of porcine CD8+ T-cell subsets.
Differential gene expression analysis of ex vivo CD8+ T-cell subsets revealed significant differences between subsets regarding expression of genes associated with early and late stages of differentiation. By comparing Tn and Tterm ex vivo, we found 575 and 709 DEGs upregulated, respectively. In particular, Tn highly expressed a set of genes encoding transcription factors, such as LEF1, BACH2, TCF7 (TCF1), SATB1, ZEB1 and BCL2, which maintain quiescence state (11, 12). In contrast, Tinter and Tterm showed upregulation of transcription genes that drive terminally effector cell differentiation including TBX21 (T-bet), PRDM1 (Blimp-1), ZEB2, ZNF683 (Hobit), ID2 and STAT4 (12, 30, 66). Moreover, we observed upregulation of genes related to effector function, cytokines and chemokines along the differentiation gradient. For example, expression of CX3CR1, receptor of Fractalkine/CX3C ligand 1 which expression correlates with the grade of effector CD8+ T differentiation (67), was highly induced on Tterm and Tinter. In previous studies in human and mice, Gerlach et al. identified three distinct effector subpopulations based on expression of CX3CR1, namely CX3CR1-, CX3CR1int and CX3CR1hi. CX3CR1hi CD8+ T effector cells were characterized as CD27-, CD127-, KLRG+, produced the smallest amount of IL2 and showed at least 50% higher expression of T-bet in comparison to CX3CR1- and CX3CR1int cells (68). Moreover, these values have been found to be typical for terminally differentiated T effector cells (7, 67) and are consistent with our findings of porcine Tterm.
In adult mice, naïve CD8+ T cell subpopulations are phenotypically characterized as CD11alowCD44lowCD27+KLRG-CD62L+CD122-, while terminally differentiated effector cells (TTDE) are defined as CD11ahighCD44highCD27-KLRG+CD62L-CD122- (13). Besides expression of CD122 (IL2RB) in Tterm, this fits well with our findings on porcine Tn and Tterm. In addition, naïve CD8+ T cell subpopulations in mice show absence of ITGA4 (CD49d), while it is highly expressed in more differentiated subpopulation such as CD8+ effector T cells, central and effector memory CD8+ T cells. Our values for ITGA4 (CD49d) expression in Tinter and Tterm correlate favorably with these previous reports and further support the idea of high ITGA4 expression in more differentiated CD8+ T-cell subsets. In addition to the CD49d, mice antigen-experienced CTLs following LMCV infection express also CD11a (ITGAL) and Ki67 (MKI67) markers (10). Likewise, our data demonstrate high upregulation of ITGAL (CD11a) and MKI67 (Ki67) in Tinter and Tterm but not in the Tn. A possible explanation for the differential expression of MKI67 among porcine subsets is that Tinter and Tterm are in the expansion phase of activated CD8+ T cells, which is accompanied by induced expression of the proliferation gene MKI67. Following expansion, antigen-experienced CD8+ T cells differentiate into SLEC (CD127- KLRG1+) or MPEC (CD127+KLRG1-) exhibiting distinct functional profiles (7, 8). Whereas Tn showed high expression of IL7R (CD127) and low of KLRG1, we found the exact opposite expression of these genes in porcine Tinter and Tterm. Thus, between Tinter and Tterm, the expression of KLRG1 was more than three times higher in Tterm, suggesting their more differentiated state. On the other hand, the expression of IL7R (CD127) was significantly higher in Tinter than Tterm. It can thus be reasonably assumed that Tinter and Tterm may represent porcine MPEC and SLEC, respectively.
Our findings on high expression of CD27, CCR7 and CD28 in the Tn fit well with the four-dimensional model to address T-cell differentiation stages in human (13). In contrast, we found all three genes downregulated in the Tterm. Compared to Tterm, Tinter expressed CD27 and CD28, but no CCR7, and based on this 4D model in humans they could represent in swine early-differentiated CD8+ T cells.
CTLs perform their main killing function through the release of granzymes and perforin as well as Fas ligand expression which induces apoptosis on the target cells (69). As expected, our analysis showed high expression of genes associated with cytolytic activity in the Tterm and to lesser extent in Tinter. Further analyses showed the highest upregulation of GNLY, PRF1 (Perforin), GZMB, FASL, INFG and TNF in the Tterm followed by the Tinter. Moreover, our data confirmed an absence of these genes in ex vivo Tn. Taken together, these results offer crucial evidences for different gene signatures of distinct CD8+ T-cell subsets.
As indicated by previous comparative studies on porcine, mice and human genome and transcriptome concerning immune system (70, 71), we also found higher numbers of orthologous genes shared between pig and human than shared by pig and mouse. In particular, from DEGs in Tn and Tterm we found around 86% orthologs in human and 39% in mouse data sets of CD8+ T cells. These differences can be explained in part by the fact that pig and human share more orthologs, while mice show the highest number of unique immune response genes that are not present in human and pig (71–73). Therefore, our results provide additional support for the similarity between human and pig genome on immune level, highlighting the pig as an appropriate model for human immunology research.
In a parallel approach, we showed gene expression changes in CD8+ T-cell subsets upon stimulation with ConA and PMA/ionomycin. Generally, PMA/ionomycin stimulation induced much stronger upregulation of genes compared to stimulation with ConA. These additional results demonstrate two things. First, following PMA/ionomycin stimulation, CD8+ T-cell subsets acquired more similar gene expression profiles as indicated by high number of DEGs shared between CD8+ T-cell subsets. It is very likely that upon stimulation all three CD8+ T-cell subsets switch to an activated state and this is accompanied by functional changes in gene expression. Second evidence, although all three CD8+ T-cell subsets upregulated several genes associated with CD8+ T-cell activation and differentiation upon stimulation, the differences in gene expression profiles remained and they clustered into three distinct subsets again. Even though stimulated Tn expressed some genes associated with the T-cell activation and differentiation, including TBX21, ID2, BATF and EZH2, they still showed no expression of GNLY, PRF1, GZMB and FASL even after PMA/ionomycin stimulation. In some cases, they even induced upregulation of several genes linked to early stages of differentiation e.g. BACH2 and BCL6, which negatively correlates with granzyme B expression in effector CD8+ T cells (74). Contrary to the findings on in vitro stimulated Tn, we found even higher expression of late-stage differentiation genes in Tterm and Tinter following in vitro stimulation. It may be assumed that Tn require more time to reach full cytotoxic potential, whereas Tinter and Tterm promptly show cytotoxic activity and effectively produce cytokines upon in vitro stimulation.
GO term enrichment analysis of ex vivo CD8+ T-cell subsets revealed that most of DEGs were involved in immunological processes associated with T-cell differentiation. Once stimulated, Tinter and Tterm were mostly enriched in same GO terms, whereas Tn were linked to other GO terms related to the immune system. Nevertheless, DEGs of Tn stimulated with ConA and PMA/ionomycin were enriched in differentiation and T-cell activation, respectively. This GO term enrichment analysis implies that Tinter and Tterm share more comparable gene expression profile and functions compared to Tn.
Furthermore, KEGG pathway analysis of DEGs in the ex vivo Tn and Tterm were assigned to 278 and 272 pathways, respectively. Although DEGs of Tn and Tterm were involved in similar number of immune-related pathways, we found higher number of DEGs of Tterm represented in those pathways, including T-cell receptor and chemokine signaling pathways. In contrast, the lowest number of KEGG pathways obtained from DEGs between two subsets were found in case of Tinter and Tterm. In our view the results emphasize the differences in gene expression profiles among ex vivo CD8+ T-cell subsets, with biggest difference between Tn and Tterm and smallest between Tinter and Tterm. As anticipated, PMA/ionomycin-stimulated CD8+ T-cell subsets were involved in much higher number of pathways than after ConA stimulation. Interestingly, for the Tterm, over seven times more KEGG pathways were obtained after PMA/ionomycin stimulation in comparison to ConA stimulation. In addition, a higher number of DEGs from Tinter and Tterm were enriched in immune-related pathways than Tn, which confirmed our initial findings on ex vivo CD8+ T-cell subsets. On the other hand, following ConA stimulation, the highest number of KEGG pathways was recorded in the Tn, followed by Tinter. Whereas CD8+ T-cell subsets showed high enrichment in T-cell receptor, chemokine signaling and cytokine-cytokine receptor interaction pathways upon PMA/ionomycin stimulation, the number of those pathways was substantially smaller once CD8+ T-cell subsets were stimulated with ConA. Thus, our findings show clearly that PMA/ionomycin stimulation of CD8+ T-cell subsets induces much stronger cytolytic T-cell response than ConA stimulation and that the response was earlier and stronger in more differentiated than naïve CD8+ T cells.
In the present study we investigated transcriptomes of ex vivo CD8+ T-cell subsets and after in vitro stimulation. We obtained comprehensive results showing that substantial gene expression differences exist among phenotypically defined porcine CD8+ T-cell subsets. Therefore, this work can serve as valuable reference for gene expression profiling of differentiation stages of porcine CD8+ T-cell subsets. The findings will support future in vivo gene expression studies in healthy as well as in infected or vaccinated animals in order to get a more complete picture of differentiation stages of porcine CD8+ T-cell subsets, especially after antigen-specific activation. We are aware of the limitation of this study since only gene expression was analyzed without validation of protein expression data. This is due to the lack of specific monoclonal antibodies. Nevertheless, the present findings identified specific targets and thus help to solve the problem of non-existing monoclonal antibodies against the respective differentiation antigens.
The datasets presented in this study can be found in online repositories. The names of the repository/repositories and accession number(s) can be found below: https://www.ncbi.nlm.nih.gov/, PRJNA761916.
Ethical review and approval was not required for the animal study because porcine blood was collected from abattoir in accordance with Austrian Animal Welfare Slaughter Regulation.
EL, MS, KM, and AS designed the project. EL performed lymphocyte isolation, in vitro stimulation, magnetic-activated cell sorting and RNA isolation. KM organized fluorescence-activated cell sorting. MV and SO prepared library and sequenced the samples. EL performed in-depth bioinformatic analysis. EL and AS analyzed the experiments and wrote the manuscript. CP assisted with interpretation of the data. All authors contributed to the article and approved the submitted version.
This work was financially supported by intramural funds of the University of Veterinary Medicine Vienna.
MV and SO are employed by Istituto di Ricerche Biomediche “A. Marxer” RBM S.p.A. MS is employed by Merck Healthcare KGaA.
The remaining authors declare that the research was conducted in the absence of any commercial or financial relationships that could be construed as a potential conflict of interest.
All claims expressed in this article are solely those of the authors and do not necessarily represent those of their affiliated organizations, or those of the publisher, the editors and the reviewers. Any product that may be evaluated in this article, or claim that may be made by its manufacturer, is not guaranteed or endorsed by the publisher.
We thank Maria Stadler for the PBMC isolation as well as Anna Hoog for the assistance with the FACS.
The Supplementary Material for this article can be found online at: https://www.frontiersin.org/articles/10.3389/fimmu.2022.849922/full#supplementary-material
1. Pagès F, Berger A, Camus M, Sanchez-Cabo F, Costes A, Molidor R, et al. Effector Memory T Cells, Early Metastasis, and Survival in Colorectal Cancer. N Engl J Med (2005) 353:2654–66. doi: 10.1056/NEJMoa051424
2. Zhang L, Conejo-Garcia JR, Katsaros D, Gimotty PA, Massobrio M, Regnani G, et al. Intratumoral T Cells, Recurrence, and Survival in Epithelial Ovarian Cancer. N Engl J Med (2003) 348:203–13. doi: 10.1056/NEJMoa020177
3. Kim K-J, Lee KS, Cho HJ, Kim YH, Yang HK, Kim WH, et al. Prognostic Implications of Tumor-Infiltrating FoxP3+ Regulatory T Cells and CD8+ Cytotoxic T Cells in Microsatellite-Unstable Gastric Cancers. Hum Pathol (2014) 45:285–93. doi: 10.1016/j.humpath.2013.09.004
4. Le Moine A, Goldman M, Abramowicz D. Multiple Pathways to Allograft Rejection. Transplantation (2002) 73:1373–81. doi: 10.1097/00007890-200205150-00001
5. Actor JK. T Lymphocytes: Ringleaders of Adaptive Immune Function. In: Introductory Immunology, 2nd ed. London: Academic Press (2019). p. 45–62.
6. Badovinac VP, Tvinnereim AR, Harty JT. Regulation of Antigen-Specific CD8 + T Cell Homeostasis by Perforin and Interferon-γ. Science (2000) 290:1354–7. doi: 10.1126/science.290.5495.1354
7. Joshi NS, Cui W, Chandele A, Lee HK, Urso DR, Hagman J, et al. Inflammation Directs Memory Precursor and Short-Lived Effector CD8+ T Cell Fates via the Graded Expression of T-Bet Transcription Factor. Immunity (2007) 27:281–95. doi: 10.1016/j.immuni.2007.07.010
8. Kaech SM, Tan JT, Wherry EJ, Konieczny BT, Surh CD, Ahmed R. Selective Expression of the Interleukin 7 Receptor Identifies Effector CD8 T Cells That Give Rise to Long-Lived Memory Cells. Nat Immunol (2003) 4:1191–8. doi: 10.1038/ni1009
9. Bose TO, Pham Q-M, Jellison ER, Mouries J, Ballantyne CM, Lefrançois L. CD11a Regulates Effector CD8 T Cell Differentiation and Central Memory Development in Response to Infection With Listeria Monocytogenes. Infect Immun (2013) 81:1140–51. doi: 10.1128/IAI.00749-12
10. Masopust D, Murali-Krishna K, Ahmed R. Quantitating the Magnitude of the Lymphocytic Choriomeningitis Virus-Specific CD8 T-Cell Response: It Is Even Bigger Than We Thought. J Virol (2007) 81:2002–11. doi: 10.1128/JVI.01459-06
11. Tsukumo S-I, Unno M, Muto A, Takeuchi A, Kometani K, Kurosaki T, et al. Bach2 Maintains T Cells in a Naive State by Suppressing Effector Memory-Related Genes. Proc Natl Acad Sci (2013) 110:10735–40. doi: 10.1073/pnas.1306691110
12. Kaech SM, Cui W. Transcriptional Control of Effector and Memory CD8+ T Cell Differentiation. Nat Rev Immunol (2012) 12:749–61. doi: 10.1038/nri3307
13. Cossarizza A, Chang H, Radbruch A, Acs A, Adam D, Adam-Klages S, et al. Guidelines for the Use of Flow Cytometry and Cell Sorting in Immunological Studies (Second Edition). Eur J Immunol (2019) 49:1457–973. doi: 10.1002/eji.201970107
14. Hamann D, Baars PA, Rep MHG, Hooibrink B, Kerkhof-Garde SR, Klein MR, et al. Phenotypic and Functional Separation of Memory and Effector Human CD8+ T Cells. J Exp Med (1997) 186:1407–18. doi: 10.1084/jem.186.9.1407
15. Appay V, Dunbar PR, Callan M, Klenerman P, Gillespie GMA, Papagno L, et al. Memory CD8+ T Cells Vary in Differentiation Phenotype in Different Persistent Virus Infections. Nat Med (2002) 8:379–85. doi: 10.1038/nm0402-379
16. Sallusto F, Lenig D, Förster R, Lipp M, Lanzavecchia A. Two Subsets of Memory T Lymphocytes With Distinct Homing Potentials and Effector Functions. Nature (1999) 401:708–12. doi: 10.1038/44385
17. van Aalderen MC, Remmerswaal EBM, Verstegen NJM, Hombrink P, ten Brinke A, Pircher H, et al. Infection History Determines the Differentiation State of Human CD8 + T Cells. J Virol (2015) 89:5110–23. doi: 10.1128/JVI.03478-14
18. Overgaard NH, Fan TM, Schachtschneider KM, Principe DR, Schook LB, Jungersen G. Of Mice, Dogs, Pigs, and Men: Choosing the Appropriate Model for Immuno-Oncology Research. ILAR J (2018) 59:247–62. doi: 10.1093/ilar/ily014
19. Pauly T, Elbers K, König M, Lengsfeld T, Saalmüller A, Thiel H-J. Classical Swine Fever Virus-Specific Cytotoxic T Lymphocytes and Identification of a T Cell Epitope. J Gen Virol (1995) 76:3039–49. doi: 10.1099/0022-1317-76-12-3039
20. Saalmüller A, Pauly T, Höhlich B-J, Pfaff E. Characterization of Porcine T Lymphocytes and Their Immune Response Against Viral Antigens. J Biotechnol (1999) 73:223–33. doi: 10.1016/S0168-1656(99)00140-6
21. Denyer MS, Wileman TE, Stirling CMA, Zuber B, Takamatsu H-H. Perforin Expression Can Define CD8 Positive Lymphocyte Subsets in Pigs Allowing Phenotypic and Functional Analysis of Natural Killer, Cytotoxic T, Natural Killer T and MHC Un-Restricted Cytotoxic T-Cells. Vet Immunol Immunopathol (2006) 110:279–92. doi: 10.1016/j.vetimm.2005.10.005
22. Pauly T, Weiland E, Hirt W, Dreyer-Bux C, Maurer S, Summerfield A, et al. Differentiation Between MHC-Restricted and Non-MHC-Restricted Porcine Cytolytic T Lymphocytes. Immunology (1996) 88:238–46. doi: 10.1111/j.1365-2567.1996.tb00010.x
23. Talker SC, Käser T, Reutner K, Sedlak C, Mair KH, Koinig H, et al. Phenotypic Maturation of Porcine NK- and T-Cell Subsets. Dev Comp Immunol (2013) 40:51–68. doi: 10.1016/j.dci.2013.01.003
24. Zhao F-R, Xie Y-L, Liu Z-Z, Shao J-J, Li S-F, Zhang Y-G, et al. Transcriptomic Analysis of Porcine PBMCs in Response to FMDV Infection. Acta Trop (2017) 173:69–75. doi: 10.1016/j.actatropica.2017.05.009
25. Yang T, Zhang F, Zhai L, He W, Tan Z, Sun Y, et al. Transcriptome of Porcine PBMCs Over Two Generations Reveals Key Genes and Pathways Associated With Variable Antibody Responses Post PRRSV Vaccination. Sci Rep (2018) 8:2460. doi: 10.1038/s41598-018-20701-w
26. Zhang J, Zheng Y, Xia X-Q, Chen Q, Bade SA, Yoon K-J, et al. High-Throughput Whole Genome Sequencing of Porcine Reproductive and Respiratory Syndrome Virus From Cell Culture Materials and Clinical Specimens Using Next-Generation Sequencing Technology. J Vet Diagn Investig (2017) 29:41–50. doi: 10.1177/1040638716673404
27. Bennett TJ, Udupa VAV, Turner SJ. Running to Stand Still: Naive CD8+ T Cells Actively Maintain a Program of Quiescence. Int J Mol Sci (2020) 21:9773. doi: 10.3390/ijms21249773
28. Shukla AK, McIntyre LL, Marsh SE, Schneider CA, Hoover EM, Walsh CM, et al. CD11a Expression Distinguishes Infiltrating Myeloid Cells From Plaque-Associated Microglia in Alzheimer’s Disease. Glia (2019) 67:844–56. doi: 10.1002/glia.23575
29. Drouillard A, Neyra A, Mathieu A-L, Marçais A, Wencker M, Marvel J, et al. Human Naive and Memory T Cells Display Opposite Migratory Responses to Sphingosine-1 Phosphate. J Immunol (2018) 200:551–7. doi: 10.4049/jimmunol.1701278
30. Chen Y, Zander R, Khatun A, Schauder DM, Cui W. Transcriptional and Epigenetic Regulation of Effector and Memory CD8 T Cell Differentiation. Front Immunol (2018) 9:2826. doi: 10.3389/fimmu.2018.02826
31. Miyagawa F, Zhang H, Terunuma A, Ozato K, Tagaya Y, Katz SI. Interferon Regulatory Factor 8 Integrates T-Cell Receptor and Cytokine-Signaling Pathways and Drives Effector Differentiation of CD8 T Cells. Proc Natl Acad Sci (2012) 109:12123–8. doi: 10.1073/pnas.1201453109
32. Kaech SM, Hemby S, Kersh E, Ahmed R. Molecular and Functional Profiling of Memory CD8 T Cell Differentiation. Cell (2002) 111:837–51. doi: 10.1016/S0092-8674(02)01139-X
33. Blaser C, Kaufmann M, Müller C, Zimmermann C, Wells V, Mallucci L, et al. β-Galactoside-Binding Protein Secreted by Activated T Cells Inhibits Antigen-Induced Proliferation of T Cells. Eur J Immunol (1998) 28:2311–9. doi: 10.1002/(SICI)1521-4141(199808)28:08<2311::AID-IMMU2311>3.0.CO;2-G
34. Shan Q, Zeng Z, Xing S, Li F, Hartwig SM, Gullicksrud JA, et al. The Transcription Factor Runx3 Guards Cytotoxic CD8 + Effector T Cells Against Deviation Towards Follicular Helper T Cell Lineage. Nat Immunol (2017) 18:931–9. doi: 10.1038/ni.3773
35. Hendriks J, Gravestein LA, Tesselaar K, van Lier RAW, Schumacher TNM, Borst J. CD27 Is Required for Generation and Long-Term Maintenance of T Cell Immunity. Nat Immunol (2000) 1:433–40. doi: 10.1038/80877
36. Huber M, Lohoff M. IRF4 at the Crossroads of Effector T-Cell Fate Decision. Eur J Immunol (2014) 44:1886–95. doi: 10.1002/eji.201344279
37. Kalia V, Sarkar S. Regulation of Effector and Memory CD8 T Cell Differentiation by IL-2—A Balancing Act. Front Immunol (2018) 9:2987. doi: 10.3389/fimmu.2018.02987
38. Jia L, Shi Y, Wen Y, Li W, Feng J, Chen C. The Roles of TNFAIP2 in Cancers and Infectious Diseases. J Cell Mol Med (2018) 22:5188–95. doi: 10.1111/jcmm.13822
39. Das T, Chen Z, Hendriks RW, Kool M. A20/Tumor Necrosis Factor α-Induced Protein 3 in Immune Cells Controls Development of Autoinflammation and Autoimmunity: Lessons From Mouse Models. Front Immunol (2018) 9:104. doi: 10.3389/fimmu.2018.00104
40. Just S, Nishanth G, Buchbinder JH, Wang X, Naumann M, Lavrik I, et al. A20 Curtails Primary But Augments Secondary CD8+ T Cell Responses in Intracellular Bacterial Infection. Sci Rep (2016) 6:39796. doi: 10.1038/srep39796
41. Stein JV, Nombela-Arrieta C. Chemokine Control of Lymphocyte Trafficking: A General Overview. Immunology (2005) 116:1–12. doi: 10.1111/j.1365-2567.2005.02183.x
42. Dorner BG, Scheffold A, Rolph MS, Huser MB, Kaufmann SHE, Radbruch A, et al. MIP-1, MIP-1, RANTES, and ATAC/lymphotactin Function Together With IFN- as Type 1 Cytokines. Proc Natl Acad Sci (2002) 99:6181–6. doi: 10.1073/pnas.092141999
43. Groom JR, Luster AD. CXCR3 in T Cell Function. Exp Cell Res (2011) 317:620–31. doi: 10.1016/j.yexcr.2010.12.017
44. Buck MD, O’Sullivan D, Pearce EL. T Cell Metabolism Drives Immunity. J Exp Med (2015) 212:1345–60. doi: 10.1084/jem.20151159
45. Kallies A, Good-Jacobson KL. Transcription Factor T-Bet Orchestrates Lineage Development and Function in the Immune System. Trends Immunol (2017) 38:287–97. doi: 10.1016/j.it.2017.02.003
46. Fu S-H, Yeh L-T, Chu C-C, Yen BL-J, Sytwu H-K. New Insights Into Blimp-1 in T Lymphocytes: A Divergent Regulator of Cell Destiny and Effector Function. J BioMed Sci (2017) 24:49. doi: 10.1186/s12929-017-0354-8
47. Collins S, Wolfraim LA, Drake CG, Horton MR, Powell JD. Cutting Edge: TCR-Induced NAB2 Enhances T Cell Function by Coactivating IL-2 Transcription. J Immunol (2006) 177:8301–5. doi: 10.4049/jimmunol.177.12.8301
48. Odagiu L, May J, Boulet S, Baldwin TA, Labrecque N. Role of the Orphan Nuclear Receptor NR4A Family in T-Cell Biology. Front Endocrinol (2021) 11:624122. doi: 10.3389/fendo.2020.624122
49. Odagiu L, Boulet S, Maurice De Sousa D, Daudelin J-F, Nicolas S, Labrecque N. Early Programming of CD8 + T Cell Response by the Orphan Nuclear Receptor NR4A3. Proc Natl Acad Sci (2020) 117:24392–402. doi: 10.1073/pnas.2007224117
50. Zhan Y, Carrington EM, Zhang Y, Heinzel S, Lew AM. Life and Death of Activated T Cells: How Are They Different From Naïve T Cells? Front Immunol (2017) 8:1809. doi: 10.3389/fimmu.2017.01809
51. Gautam S, Fioravanti J, Zhu W, Le Gall JB, Brohawn P, Lacey NE, et al. The Transcription Factor C-Myb Regulates CD8+ T Cell Stemness and Antitumor Immunity. Nat Immunol (2019) 20:337–49. doi: 10.1038/s41590-018-0311-z
52. Yao C, Lou G, Sun H-W, Zhu Z, Sun Y, Chen Z, et al. BACH2 Enforces the Transcriptional and Epigenetic Programs of Stem-Like CD8+ T Cells. Nat Immunol (2021) 22:370–80. doi: 10.1038/s41590-021-00868-7
53. Roychoudhuri R, Clever D, Li P, Wakabayashi Y, Quinn KM, Klebanoff CA, et al. BACH2 Regulates CD8+ T Cell Differentiation by Controlling Access of AP-1 Factors to Enhancers. Nat Immunol (2016) 17:851–60. doi: 10.1038/ni.3441
54. Li Q, Eppolito C, Odunsi K, Shrikant PA. IL-12-Programmed Long-Term CD8 + T Cell Responses Require Stat4. J Immunol (2006) 177:7618–25. doi: 10.4049/jimmunol.177.11.7618
55. Quigley M, Huang X, Yang Y. STAT1 Signaling in CD8 T Cells Is Required for Their Clonal Expansion and Memory Formation Following Viral Infection In Vivo. J Immunol (2008) 180:2158–64. doi: 10.4049/jimmunol.180.4.2158
56. Cannarile MA, Lind NA, Rivera R, Sheridan AD, Camfield KA, Wu BB, et al. Transcriptional Regulator Id2 Mediates CD8+ T Cell Immunity. Nat Immunol (2006) 7:1317–25. doi: 10.1038/ni1403
57. Tay NQ, Lee DCP, Chua YL, Prabhu N, Gascoigne NRJ, Kemeny DM. CD40L Expression Allows CD8+ T Cells to Promote Their Own Expansion and Differentiation Through Dendritic Cells. Front Immunol (2017) 8:1484. doi: 10.3389/fimmu.2017.01484
58. Cibrián D, Sánchez-Madrid F. CD69: From Activation Marker to Metabolic Gatekeeper. Eur J Immunol (2017) 47:946–53. doi: 10.1002/eji.201646837
59. Wikenheiser DJ, Stumhofer JS. ICOS Co-Stimulation: Friend or Foe? Front Immunol (2016) 7:304. doi: 10.3389/fimmu.2016.00304
60. Suresh M, Lanier G, Large MK, Whitmire JK, Altman JD, Ruddle NH, et al. Role of Lymphotoxin α in T-Cell Responses During an Acute Viral Infection. J Virol (2002) 76:3943–51. doi: 10.1128/JVI.76.8.3943-3951.2002
61. Karampetsou MP, Comte D, Kis-Toth K, Kyttaris VC, Tsokos GC. Expression Patterns of Signaling Lymphocytic Activation Molecule Family Members in Peripheral Blood Mononuclear Cell Subsets in Patients With Systemic Lupus Erythematosus. PloS One (2017) 12:e0186073. doi: 10.1371/journal.pone.0186073
62. Riley JL. PD-1 Signaling in Primary T Cells. Immunol Rev (2009) 229:114–25. doi: 10.1111/j.1600-065X.2009.00767.x
63. McCoy KD, Le Gros G. The Role of CTLA-4 in the Regulation of T Cell Immune Responses. Immunol Cell Biol (1999) 77:1–10. doi: 10.1046/j.1440-1711.1999.00795.x
64. Grosso JF, Kelleher CC, Harris TJ, Maris CH, Hipkiss EL, De Marzo A, et al. LAG-3 Regulates CD8+ T Cell Accumulation and Effector Function in Murine Self- and Tumor-Tolerance Systems. J Clin Invest (2007) 117:3383–92. doi: 10.1172/JCI31184
65. Wang M, Windgassen D, Papoutsakis ET. A Global Transcriptional View of Apoptosis in Human T-Cell Activation. BMC Med Genomics (2008) 1:53. doi: 10.1186/1755-8794-1-53
66. Rutishauser RL, Kaech SM. Generating Diversity: Transcriptional Regulation of Effector and Memory CD8 + T-Cell Differentiation. Immunol Rev (2010) 235:219–33. doi: 10.1111/j.0105-2896.2010.00901.x
67. Sarkar S, Kalia V, Haining WN, Konieczny BT, Subramaniam S, Ahmed R. Functional and Genomic Profiling of Effector CD8 T Cell Subsets With Distinct Memory Fates. J Exp Med (2008) 205:625–40. doi: 10.1084/jem.20071641
68. Gerlach C, Moseman EA, Loughhead SM, Alvarez D, Zwijnenburg AJ, Waanders L, et al. The Chemokine Receptor CX3CR1 Defines Three Antigen-Experienced CD8 T Cell Subsets With Distinct Roles in Immune Surveillance and Homeostasis. Immunity (2016) 45:1270–84. doi: 10.1016/j.immuni.2016.10.018
69. Andersen MH, Schrama D, Thor Straten P, Becker JC. Cytotoxic T Cells. J Invest Dermatol (2006) 126:32–41. doi: 10.1038/sj.jid.5700001
70. Dawson HD, Reece JJ, Urban JF. A Comparative Analysis of the Porcine, Murine, and Human Immune Systems. Vet Immunol Immunopathol (2009) 128:309. doi: 10.1016/j.vetimm.2008.10.211
71. Dawson HD, Smith AD, Chen C, Urban JF. An in-Depth Comparison of the Porcine, Murine and Human Inflammasomes; Lessons From the Porcine Genome and Transcriptome. Vet Microbiol (2017) 202:2–15. doi: 10.1016/j.vetmic.2016.05.013
72. Dawson HD, Loveland JE, Pascal G, Gilbert JG, Uenishi H, Mann KM, et al. Structural and Functional Annotation of the Porcine Immunome. BMC Genomics (2013) 14:332. doi: 10.1186/1471-2164-14-332
73. Pabst R. The Pig as a Model for Immunology Research. Cell Tissue Res (2020) 380(2):287–304. doi: 10.1007/s00441-020-03206-9
Keywords: CD8+ T cells, RNA-Seq, transcriptome, swine, T-cell differentiation
Citation: Lagumdzic E, Pernold C, Viano M, Olgiati S, Schmitt MW, Mair KH and Saalmüller A (2022) Transcriptome Profiling of Porcine Naïve, Intermediate and Terminally Differentiated CD8+ T Cells. Front. Immunol. 13:849922. doi: 10.3389/fimmu.2022.849922
Received: 06 January 2022; Accepted: 02 February 2022;
Published: 21 February 2022.
Edited by:
Enric M. Mateu, Universitat Autònoma de Barcelona, SpainReviewed by:
Simon Paul Graham, The Pirbright Institute, United KingdomCopyright © 2022 Lagumdzic, Pernold, Viano, Olgiati, Schmitt, Mair and Saalmüller. This is an open-access article distributed under the terms of the Creative Commons Attribution License (CC BY). The use, distribution or reproduction in other forums is permitted, provided the original author(s) and the copyright owner(s) are credited and that the original publication in this journal is cited, in accordance with accepted academic practice. No use, distribution or reproduction is permitted which does not comply with these terms.
*Correspondence: Armin Saalmüller, YXJtaW4uc2FhbG11ZWxsZXJAdmV0bWVkdW5pLmFjLmF0
Disclaimer: All claims expressed in this article are solely those of the authors and do not necessarily represent those of their affiliated organizations, or those of the publisher, the editors and the reviewers. Any product that may be evaluated in this article or claim that may be made by its manufacturer is not guaranteed or endorsed by the publisher.
Research integrity at Frontiers
Learn more about the work of our research integrity team to safeguard the quality of each article we publish.