
94% of researchers rate our articles as excellent or good
Learn more about the work of our research integrity team to safeguard the quality of each article we publish.
Find out more
ORIGINAL RESEARCH article
Front. Immunol., 22 June 2022
Sec. Mucosal Immunity
Volume 13 - 2022 | https://doi.org/10.3389/fimmu.2022.841065
This article is part of the Research TopicInterplay Between Diets, Microbiota, Bacterial Metabolites and Host for Intestinal Health and DiseaseView all 17 articles
 Hussein Hamade1
 Jasmine T. Stamps1
 Dalton T. Stamps1
 Shyam K. More1Lisa S. Thomas1
 Anna Y. Blackwood1
 Nawele L. Lahcene1Sofi L. Castanon1
 Brenda C. Salumbides1
 Yosuke Shimodaira1†Helen S. Goodridge2,3Stephan R. Targan1
 Kathrin S. Michelsen1,2*
The intestinal immune system and microbiota are emerging as important contributors to the development of metabolic syndrome, but the role of intestinal dendritic cells (DCs) in this context is incompletely understood. BATF3 is a transcription factor essential in the development of mucosal conventional DCs type 1 (cDC1). We show that Batf3-/- mice developed metabolic syndrome and have altered localization of tight junction proteins in intestinal epithelial cells leading to increased intestinal permeability. Treatment with the glycolysis inhibitor 2-deoxy-D-glucose reduced intestinal inflammation and restored barrier function in obese Batf3-/- mice. High-fat diet further enhanced the metabolic phenotype and susceptibility to dextran sulfate sodium colitis in Batf3-/- mice. Antibiotic treatment of Batf3-/- mice prevented metabolic syndrome and impaired intestinal barrier function. Batf3-/- mice have altered IgA-coating of fecal bacteria and displayed microbial dysbiosis marked by decreased obesity protective Akkermansia muciniphila, and Bifidobacterium. Thus, BATF3 protects against metabolic syndrome and preserves intestinal epithelial barrier by maintaining beneficial microbiota.
The prevalence of obesity has been increasing over the past few decades and has been recognized as a major public health challenge. Worldwide, an estimated 2.1 billion adults are overweight of which 600 million are obese (1, 2). Obesity is often associated with the development of metabolic syndrome and increased risk of a variety of chronic diseases including type 2 diabetes, cardiovascular diseases, cancer, and non-alcoholic fatty liver disease (3–8). Metabolic syndrome is a cluster of conditions that includes central obesity, insulin resistance, dyslipidemia, and hypertension (3, 9). While an imbalance of energy intake and expenditure (i.e., diet and lack of exercise) is the major driver of obesity, additional factors contribute to the development of obesity: genetic predisposition, gut microbiota, and host immunity (10–15). The precise mechanisms leading to the development of metabolic syndrome and particularly the involvement of the mucosal immune system are incompletely understood. Growing evidence implicates the intestinal microbiota as an important driver in the development of metabolic syndrome (12, 16, 17). One of the early events in this process has been attributed to a high-fat diet-induced impaired mucosal barrier function, also referred to as “leaky gut” (18–21). As a consequence, intestinal luminal bacteria and their products enter the systemic circulation leading to chronic low-grade inflammation that has been shown to have a profound effect on normal insulin sensitivity (12, 17, 20). Recently, obesity-associated hyperglycemia has also been demonstrated to disturb intestinal epithelial tight-junctions resulting in impaired barrier function (22). That the intestinal microbiota itself are a driver of the development of metabolic syndrome has been supported by the observation that mice raised under germ-free conditions are resistant to the development of obesity and insulin resistance (15, 23, 24). In contrast, transfer of intestinal bacteria from obese to lean mice or reconstitution of germ-free mice induced metabolic syndrome in recipient mice (25). Interestingly, IgA is the most abundant antibody secreted into the intestinal lumen and has been proven to be a key regulator of commensal microbial communities (26). High IgA coating preferentially identifies colitogenic members of the microbiota, that confer susceptibility to the development of colitis, and result in the development of obesity (27, 28). Early recognition of intestinal bacteria crossing from the lumen to the lamina propria is crucial in preventing systemic inflammation and its metabolic consequences and is accomplished by cells of the innate immune system. Toll-like receptors (TLRs) that recognize different bacterial components or downstream signaling molecules, including the inflammasome, have been associated with an increased risk in the development of metabolic syndrome in humans and mice demonstrating the importance of these pathways in the development of metabolic syndrome (14, 15, 29–31). While these studies clearly demonstrate a relationship between diet, intestinal microbiota, immune responses, chronic inflammation, and metabolic syndrome, the exact mechanisms linking the host immune system and intestinal microbiome leading to the development of metabolic syndrome are not well understood.
Intestinal lamina propria conventional dendritic cells (cDCs) play an essential role in mucosal homeostasis, sensing of invading microorganisms, initiation of adaptive immune response, and development of oral tolerance to dietary antigens (32–35). Intestinal cDCs are highly heterogenous and can be subdivided based on the expression of CD103 and CD11b into three major subsets CD103+CD11b- (cDC1), CD103+CD11b+ (cDC2), CD103-CD11b+, and one minor CD103- CD11b- cDC subset (33, 36–40). While the development of all these subsets is dependent on the transcription factors Zbtb46 and FLT3L, each subset is also dependent on specific transcription factors. Developmentally, cDC type 1 (cDC1) are dependent on the expression of the transcription factors BATF3, IRF8, and ID2 while cDC type 2 (cDC2) are dependent on IRF4, KLF4, and Notch-2 (38, 41, 42). Accordingly, Batf3-/- mice lack CD8α+ DCs in lymphoid organs and CD103+ cDC1s in non-lymphoid organs, particularly in the intestine (43–45). Intestinal CD103+ cDC1 are important for the development of oral tolerance to dietary antigens and the induction of FoxP3+ regulatory T cells (Tregs). However, Batf3-/- mice do not develop spontaneous intestinal inflammation and maintain a normal population of Tregs in the lamina propria and mesenteric lymph nodes (MLN), suggesting a redundant role of DC subsets in maintaining intestinal homeostasis (43). The mechanisms by which intestinal DC subsets influence intestinal barrier function and homeostasis in the context of the development of metabolic syndrome remain unclear.
In this study, we investigated the role of BATF3 in maintaining intestinal barrier and development of metabolic syndrome. Here, we demonstrate that BATF3-deficiency leads to the development of metabolic syndrome as characterized by insulin resistance, blood glucose and serum insulin levels, increased body weight and white adipocyte size, and development of hepatosteatosis. Hyperinsulinemia and hypercholesteremia were the first metabolic changes observed in lean Batf3-/- mice and were associated with a decrease of IgAhigh coated fecal bacteria and intestinal dysbiosis. 16S ribosomal RNA (rRNA) sequencing revealed a significant decrease in the abundance of Akkermansia muciniphila, Mucispirillum schaedleri, and Bifidobacterium and an increased abundance of Bacteroides sp. in non-obese Batf3-/- mice. Mechanistically, we observed altered cellular localization of the tight-junction proteins occludin-1, ZO-1, and claudin-2 in intestinal epithelial cells leading to increased intestinal permeability in obese Batf3-/- mice. Moreover, intestinal enteroids generated from Batf3-/- mice had reduced regenerative potential compared to WT mice. Impaired intestinal barrier function was associated with an increase in the percentage of lamina propria cDC2 and CD11c+ mononuclear phagocytes (MNPs) and increased expression of IL-1β, IL-18, and TNFα. Treatment of obese Batf3-/- mice with the glycolysis inhibitor 2-deoxy-D-glucose (2-DG) improved intestinal barrier function and reversed the intestinal inflammatory phenotype to WT levels. In addition, treatment with broad-spectrum antibiotics prevented the development of metabolic syndrome, low-grade intestinal inflammation, impaired intestinal barrier function, and normalized insulin tolerance in Batf3-/- mice suggesting that intestinal microbiota are essential in the development of metabolic syndrome and the pro-inflammatory phenotype in Batf3-/- mice. Our data suggest that deficiency of the transcription factor BATF3 results in phenotypical changes of IgA-coating of bacteria, microbial dysbiosis, and impairs intestinal epithelial barrier function, leading to low-grade inflammation that contributes to the development of metabolic syndrome.
C57BL/6J, Batf3-/- (B6.129S(C)-Batf3tm1kmm/J; stock # 013755), and Irf8-/- (B6(Cg)-Irf8tm1.2Hm/J; stock # 018298) mice were purchased from the Jackson Laboratory. Batf3-/- were backcrossed to C57BL/6J mice to establish WT and Batf3-/- colonies from the heterozygote littermates. Mice were maintained under SPF conditions. All animal studies were approved by the Cedars-Sinai Medical Center Animal Care and Use Committee (IACUC protocol # 5487).
ITT was performed on 8- or 16-week-old mice. After overnight fasting, blood glucose levels were measured via tail puncture using a glucose monitoring system (Easy touch). Mice were injected intraperitoneal (i.p.) with human insulin (1 U/kg) (Millipore Sigma). Blood glucose concentrations were recorded at 0, 15, 30, 60, and 120 min. after i.p. injection. Homeostatic Model Assessment for Insulin Resistance (HOMA-IR) was calculated using fasting blood glucose and serum insulin values in the following equation: HOMA-IR = [(fasting insulin) x (fasting glucose)/405] (46).
Mice received antibiotic treatment from the time of weaning until 16 weeks of age. A combination of four antibiotics (1 g/l ampicillin, 500 mg/l vancomycin, 1 g/l neomycin sulfate, 1 g/l metronidazole) was added to the drinking water and changed once per week (47, 48).
Sixteen-week-old mice were treated twice daily with i.p. injection of 2-DG (5 mg/mouse; Sigma-Aldrich) for 10 days as previously described (49).
Food consumption was measured over a 24 h time period twice a week and normalized to the number of mice in the cages per day. A minimum of five cages by genotype were measured every week from 8 to 16 weeks of age.
Eight- or 16-week-old mice were fasted overnight, and blood was collected by retro-orbital bleeding. Serum was stored at -80°C until use. Serum insulin concentrations were measured by ELISA according to the manufacturer’s instructions (Crystal Chem, Elk Grove Village, IL, USA). Serum total cholesterol concentrations were measured using cholesterol fluorometric assay according to the manufacturer’s instructions (Cayman Chemical, Ann Arbor, MI, USA).
In vivo colonic epithelial barrier permeability was measured using FITC-Dextran (average MW 3000-5000; Sigma-Aldrich). Briefly, mice were fasted overnight and gavaged with FITC-Dextran (50 mg/100 g), and serum was collected 3 hours after gavage. Fluorescence was measured at an excitation wavelength of 485 nm and emission wavelength of 538 nm on a SpectraMax i3 spectrometer (Molecular Devices).
Lamina propria mononuclear cells (LPMC) were isolated from the large intestine as previously described (50). Single cell suspensions were stained with antibodies or corresponding isotype controls. All antibodies were purchased from Thermo Fisher Scientific: anti-CD11c (N418), anti-MHC-II (M5/114.15.2), anti-CD11b (M1/70), anti-CD103 (2E7), and anti-F4/80 (BM8). Cells were acquired by flow cytometry using an LSR II analyzer (BD Biosciences). Samples were analyzed using FlowJo software (TreeStar Inc.). The following gating strategy was used to analyze LPMC: immune cells were gated based on forward and side scatter excluding cell aggregates. Then DC subsets were gated on MHCII+CD11c+ and cDC1 and cDC2 identified as CD103+CD11b- and CD103+ CD11b+, respectively. CD11c+ MNPs were gated on CD11b+CD11c+ and identified as F4/80+.
Small intestinal IEC were isolated from WT or Batf3-/- mice as described (50). Briefly, after cleaning, small intestines were cut in small pieces and incubated in HBSS/5 mM EDTA/1 mM DTT/5% FCS in a shaking water bath for 20 min at 37°C. Tissue pieces were then vortexed and filtered through cell strainers. IEC were stained with EpCam (Invitrogen; clone: G8.8) and CD45 (eBioscience; clone: 104) antibodies and sorted as CD45-EpCam+ on a FACSAria III cell sorter. RNA was isolated and mRNA expression of Batf3, Irf8, and Muc2 was analyzed by qPCR as described below.
Adipocyte sizes were quantified as described (51). One hundred adipocytes were analyzed per mouse using ImageJ software.
Colitis was induced in female mice with 2.6% DSS drinking water ad libitum for 7 days followed by one day of regular drinking water before being euthanized. Body weights were recorded daily during colitis induction and recovery phases of the experiment. H & E sections of cecum, colon, and rectum were scored by a trained observer blinded to the genotypes and treatments as described (52).
Female and male WT and Batf3-/- mice were either maintained on normal chow diet (25% kcal from fat; LabDiet, 5LJ5) or HFD (60% kcal from fat; Envigo, TD.06414) starting at 8 weeks of age to 16 weeks of age.
Intestines were excised from 8-week-old mice and immediately fixed in 10% neutral buffered formalin followed by paraffin-embedding. Tissue sections were deparaffinized, boiled in citrate buffer (10 mM Sodium Citrate, 0.05% Tween-20; pH 6.0) for antigen-retrieval, blocked with hydrogen peroxide, and incubated with primary antibodies against Occludin (Thermo Fisher Scientific, 40-4700), ZO-1 (Thermo Fisher Scientific, 61-7300), or Claudin-2 (Abcam, ab53032) overnight. Fluorophore-conjugated secondary antibodies were incubated for 1 h. Images were captured with TCS SP5 X confocal microscope (Leica). Whole mount enteroid staining was performed as previously described (53). Briefly, enteroids were fixed in 4% paraformaldehyde, blocked with PBS/0.1% Triton-x-100/0.2% BSA (enteroid wash buffer), and incubated either with rabbit anti-ZO-1 (1:100), rabbit anti-Claudin-2 (1:200), or rabbit anti-occludin (1:50) in combination with goat anti-E-cadherin (R&D Systems, AF648, 1:200) antibodies overnight at 4°C. The enteroids were incubated overnight with donkey anti-goat AF 594 (Life technology, A11058, 1:500) and Donkey anti-rabbit Dylight 650 (Abcam, ab96922, 1:500) followed by nuclei staining with Hoechst 33342 dye (Thermo Fisher Scientific, 62249). The enteroids were mounted on glass slides using fructose-glycerol solution. Images were acquired using Leica Stellaris 8 confocal microscope and fluorescence intensity was analyzed using Fiji ImageJ software.
For colonic secreted cytokines, excised colons were flushed with ice-cold PBS and 5-10 mm tissue sections were cultured in RPMI-1640 medium supplemented with 10% FBS, 50 μg/ml gentamicin, 0.25 μg/ml amphotericin B, 100 U/ml Penicillin G, 0.1 mg/ml Streptomycin, and 50 μM β-mercaptoethanol. Supernatants from 24 h cultures were removed, cleared of debris by centrifugation, and stored at -80°C until analysis. Cytokine concentration in culture supernatants were assayed by ELISA for murine IL-1β (eBioscience), and IL-18 (RayBiotech) according to the manufacturer’s instructions. Concentrations of secreted cytokines were normalized to the dry weight of the tissue sections.
Total RNA was isolated using RNeasy kits and reverse transcribed into cDNA with Omniscript RT kit (both Qiagen). QPCR was performed using the Mastercycler® ep realplex2 System (Eppendorf). Platimum® Quantitative PCR SuperMix-UDG (Invitrogen) and TaqMan probes and primers were used for Actb, Il1b, Tnfa, Il6, and SsoAdvanced Universal SYBR® Green Supermix (Bio-Rad) was used for Batf3, Muc2, Irf8, 16S rRNA, A. muciniphila, M. schaedleri, Bifidobacterium spp., and Bacteroides sp. (Supplemental Table). mRNA expression of target genes was normalized to the expression of Actb. The relative gene expression was calculated by the 2-ΔΔCt method.
Fecal samples were collected from female and male 8-week-old WT and Batf3-/- mice, snap-frozen, and stored at -80°C. DNA was isolated using the DNeasy PowerSoil DNA Isolation Kit (Qiagen) following the manufacturer’s protocol. The V4 region of the 16S gene was amplified and barcoded using 515f/806r primers and 250x2 bp sequencing was performed on an Illumina MiSeq system. Raw data were processed using DADA2 scripts in R platform and quality-filtered reads (~50,862 reads per sample) were used to identify amplicon sequence variants (ASV) by closed reference picking against the Silva database (54). Abundance of selected bacterial strains were confirmed by qPCR using 25 ng of fecal bacterial DNA and specific 16S rRNA primers for Mucispirillum schaedleri (ASF457), Akkermansia muciniphila, Bifidobacterium, Bacteroides sp. (ASF519) (primer sequences are listed in Supplemental Table). qPCRs were performed in duplicate using SsoAdvanced Universal SYBR® Green Supermix. Relative abundance for each strain was quantified by normalizing the quantity of each specific 16S rRNA gene to the total amount of 16S bacterial DNA. 16S rRNA sequences generated in this study are publicly available. This data can be found here: ENA, accession number PRJEB50182 (https://www.ebi.ac.uk/ena/browser/home).
Enteroid cultures were performed using ileal crypts isolated from WT, Batf3-/-, and Irf8-/- mice as described previously (55). Briefly, ileum was collected, washed in ice-cold PBS without Ca2+ and Mg2+, cut longitudinally, luminal content was washed out with ice-cold PBS, and tissues were cut into 2-3 mm pieces. Pieces were washed in PBS with intermittent mixing to remove villi. Next, tissue pieces were agitated in PBS containing 2 mM EDTA for 20 min at room temperature. Next, tissue pieces were placed in PBS containing 0.1% BSA, gently vortexed for 30-60 s, and filtered through a 70 µm cell strainer to remove tissue pieces. This step was repeated for a total of three times and fractions 2 and 3 were collected and pooled. The filtrates containing crypts were centrifuged, washed with PBS containing 0.1% BSA, and resuspended in Advanced Dulbecco’s modified eagle medium (DMEM)/F12 medium. Matrigel® (Corning, 50% vol/vol) was added to the crypts and seeded into 48-well plates. After polymerization of Matrigel®, Intesticult organoid growth media (Stem cell Technologies) was added. Medium was replaced every 2-3 days. Images were acquired using Zeiss Axio Observer.Z1 inverted microscope on days 1, 4, and 6. Sixty to 100 enteroids were used for quantification of enteroid surface area and de novo bud formation on day 6. Enteroid surface area was calculated using ZEN2 software. For enteroid formation potential, live, intact, and viable enteroids were counted on day 6 and normalized to counted enteroids on day 1 of the same well. On day 6, RNA was extracted by using RNeasy Micro kit according to the manufacturer’s instructions (Qiagen).
Fecal pellets were collected from 8-week-old WT and Batf3-/- mice and reconstituted in 1 ml PBS containing 1% BSA (w/v) overnight at 4°C. Samples were processed as described (27). In brief, fecal bacteria were used for IgA staining and cell-free supernatants of fecal matter were used for IgA ELISA. Secreted IgA concentrations were normalized to the total weight of fecal pellets. For flow cytometry analysis of IgA-coated bacteria, bacterial suspensions were stained with PE-anti-IgA (eBioscience) or corresponding isotype control followed by staining with Sytox Green. Samples were acquired by flow cytometry using an LSR II analyzer (BD Biosciences) and analyzed using FlowJo software (TreeStar Inc.). The following gating strategy was used: bacteria were gated based on forward and side scatter excluding cell aggregates followed by gating on Sytox Green+ IgAlow or Sytox Green+ IgAhigh.
The data are represented as mean ± standard error of the mean (SEM), or standard deviation (SD) as indicated with the number of mice (n) specified in the figure legends. Data were pooled from at least two independent experiments. The unpaired two-tailed Student t-test or Mann-Whitney-U test was applied as indicated. Differences were considered significant at p < 0.05. For microbiome analysis, alpha diversity metrics included Faith’s phylogenetic diversity (Faith’s PD) metric, Chao1, and Shannon index. The significance of differences in alpha diversity was calculated by t-tests and non-parametric Wilcoxon signed rank tests. Beta diversity was calculated using square root Jensen-Shannon divergence and visualized by principal coordinates analysis. Association of microbial genera with Batf3-/- mice were evaluated using DESeq2 in R, which employs an empirical Bayesian approach to shrink dispersion and fit non-rarified count data to a negative binomial model (56). P-values for differential abundance were converted to q-values to correct for multiple hypothesis testing (< 0.05 for significance) (57).
To evaluate the role of BATF3 in the development of metabolic syndrome, we first administered standard chow and measured the percentage of weight gain of WT and Batf3-/- mice from the age of 8 to 16 weeks (Figure S1A). We observed that Batf3-/- mice had greater weight gain over time compared to WT mice (Figures 1A, B). The difference in weight gain between WT and Batf3-/- mice was significant as early as 11 weeks of age and observed in both female and male mice (Figure S1B). Interestingly, the increased body weight in Batf3-/- mice was not associated with increased food intake (Figure S1C). Furthermore, we observed an increase in the size of abdominal fat deposits and a trend toward greater weight of gonadal fat tissue but no change in the weight of livers in Batf3-/- compared to WT mice (Figures 1C, S1D, E). Increased body weight in Batf3-/- mice was associated with increased abdominal white adipocyte size (Figures 1D, E), and spontaneous development of hepatosteatosis (Figures S1E, F). In addition to the development of obesity in Batf3-/- mice, we also observed symptoms of metabolic syndrome in Batf3-/- mice. We observed an increase in serum total cholesterol (Figure 1F), and fasting insulin levels (Figure 1G) in Batf3-/- mice as early as 8 weeks of age, which preceded the development of obesity, and increased fasting blood glucose levels in Batf3-/- mice compared to WT mice at 16 weeks of age (Figure 1H). Next, we determined the homeostatic model assessment for insulin resistance (HOMA-IR) score, which takes into consideration the fasting blood glucose and serum insulin concentrations and gives a score for early insulin resistance (HOMA-IR > 1.9, early insulin resistance; > 2.9, significant insulin resistance) (46). At 8 weeks of age Batf3-/- mice had a significantly higher HOMA-IR score than WT mice but it did not reach the threshold for insulin resistance of 1.9 (Figure 1I). However, at 16 weeks of age Batf3-/- mice had a HOMA-IR score of 4.6, while WT mice had a HOMA-IR score of 0.8, indicating insulin resistance in Batf3-/- mice (Figure 1I). To confirm our findings, we performed insulin tolerance tests in 8- and 16-week-old mice. Batf3-/- mice had significantly higher blood glucose concentration after i.p. injection of insulin compared to WT mice at 16 weeks, indicating insulin resistance in these mice (Figures 1J, K). These findings suggest that an early increase in total cholesterol and serum insulin concentration in Batf3-/- mice might contribute to the development of insulin resistance and metabolic syndrome.
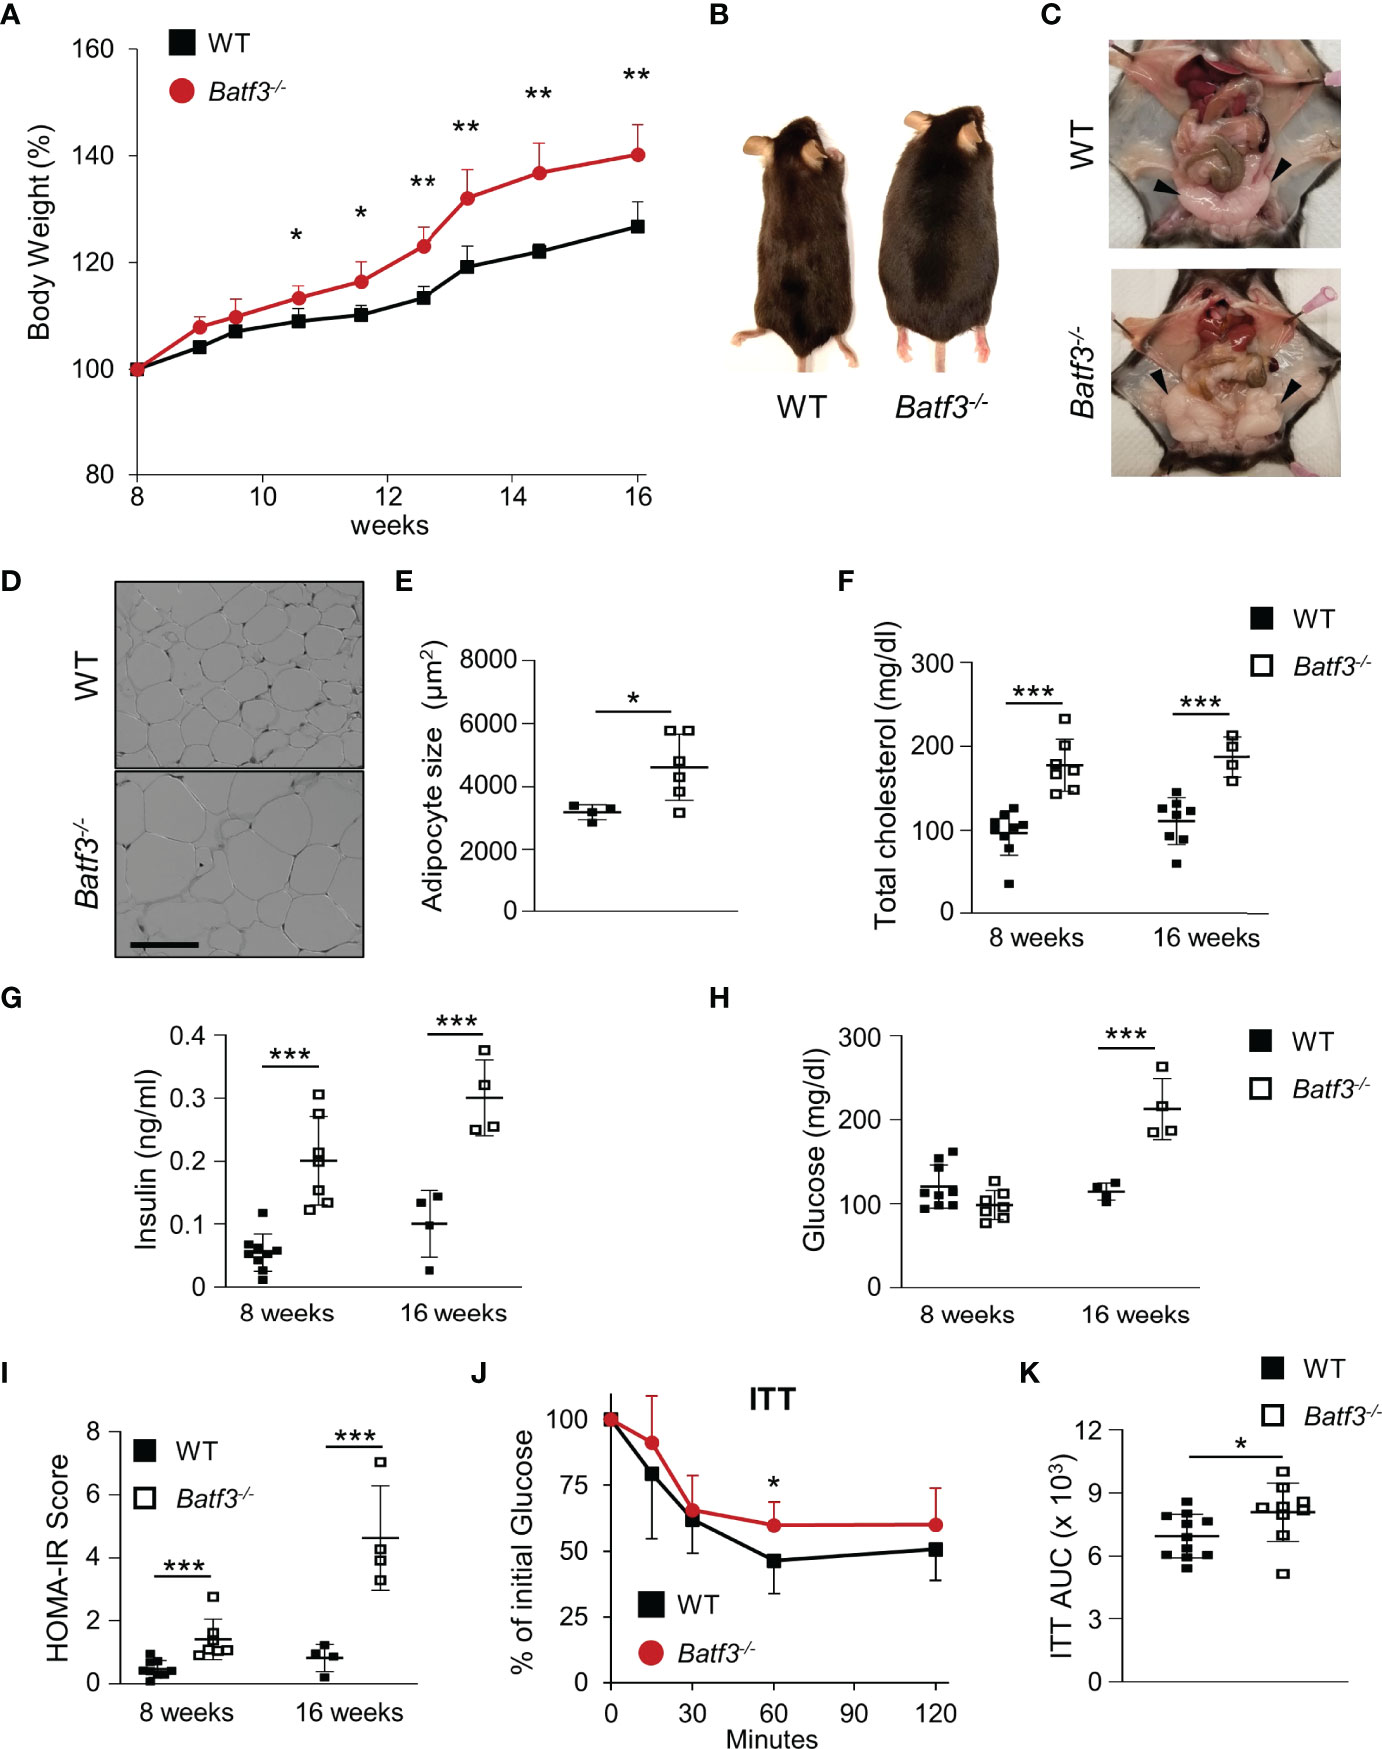
Figure 1 Batf3-/- mice develop metabolic syndrome. (A) Body weight gain as percentage of the initial weight at 8 weeks (n = 4/group). (B, C) Representative images of WT and Batf3-/- mice (B) and abdominal cavity (C) indicating gonadal white adipose tissue (GWAT; black arrow heads) at 6 months of age. (D) Representative H&E staining of GWAT at 16 weeks of age (Scale bar, 100 μm). (E) Quantification of adipocyte sizes (100 adipocytes/mouse; n = 4-6/genotype). (F) Serum total cholesterol concentrations after overnight fasting (8 weeks, n = 7-9/genotype; 16 weeks, n = 4-8/genotype). (G–I) Serum insulin concentrations (G), fasting blood glucose concentrations (H), and homeostatic model assessment for insulin resistance (HOMA-IR) score (I) at 8 and 16 weeks of age (8 weeks, n = 7-9/genotype; 16 weeks, n = 4-8/genotype). (J, K) Insulin tolerance test (ITT) (J) and area under the curve (AUC) analysis of ITT (K) in WT and Batf3-/- mice at 16 weeks of age (n = 9-11/genotype). Data are represented as means ± SD. Statistical significance was determined by Student’s t-test. *p < 0.05, **p < 0.01, ***p < 0.005.
Leaky gut has been associated with inflammatory bowel diseases (IBD) and development of metabolic syndrome. Several studies have suggested that loss of the intestinal barrier could lead to translocation of bacteria and an increase of bacterial metabolites in the blood (16). To assess the role of BATF3 in maintaining intestinal barrier, we quantified intestinal permeability in vivo by gavaging WT and Batf3-/- mice with FITC-dextran and measuring FITC-dextran levels in the serum (Figure 2A). At 16 weeks of age, Batf3-/- mice had significantly higher serum FITC-dextran concentrations than WT mice, indicating that intestinal permeability was significantly increased in Batf3-/- mice. However, at 8 weeks of age, Batf3-/- and WT mice had similar serum FITC-dextran concentrations (Figure 2A). Tight junctions are multiprotein complexes that regulate intestinal permeability. Several studies suggest that obesity and hyperglycemia could lead to alterations of tight junctions (20, 22, 58). To examine if such alterations occurred in Batf3-/- mice, we analyzed the localization of several tight junction proteins by immunofluorescence staining of cecal sections from 16-week-old Batf3-/- and WT mice (Figure 2B). Interestingly, the tight junction protein Occludin is localized mainly at the cell membrane in WT mice, however, in Batf3-/- mice, Occludin is localized predominantly in the cytoplasm. Furthermore, the membrane expression of ZO-1 is reduced in Batf3-/- mice compared to WT mice. Finally, Claudin-2 is localized at the membrane surface and the cytoplasm in Batf3-/- mice while it is only present at the cell surface in WT mice (Figure 2B). Next, we assessed the regenerative potential of intestinal epithelial cells ex vivo using intestinal enteroid cultures (59). Crypts were isolated from the ileum of 4-month-old WT and Batf3-/- mice and cultured for 6 days. We observed a smaller size of the spherical crypts (spheroids) on days 1 and 4 in Batf3-/- mice compared to WT mice (Figure 2C). Furthermore, surface area was significantly reduced for enteroids developed from Batf3-/- mice compared to WT mice (Figure 2D) suggesting regenerative defects. Moreover, we observed that the enteroid formation potential was significantly reduced in Batf3-/- compared to WT enteroids (Figure 2E). Lastly, enteroids that developed from Batf3-/- mice have significantly fewer numbers of crypts per enteroid (Figure S2A) and the percentage of enteroids with zero or one bud were significantly higher compared to enteroids from WT mice (Figure 2F). Conversely, the percentages of enteroids with four or more buds were significantly higher in WT compared to Batf3-/- mice (Figure 2F). Collectively, these data indicate regenerative defects in ex vivo enteroid cultures from Batf3-/- mice. To determine if these defects might be due to a cell-intrinsic role of BATF3 in intestinal epithelial cells (IEC), we measured Batf3 mRNA expression of whole ileal tissue, isolated primary IEC, and enteroids from WT and Batf3-/- mice. Batf3 was undetectable in IEC or enteroids developed from WT or Batf3-/- mice at steady state, while we were able to detect Batf3 in whole ileal tissue from WT but not Batf3-/- mice (Figures S2B, C). Muc2 was readily expressed in WT and Batf3-/- primary IEC demonstrating the successful isolation of IEC. To assess if enteroids developed from Batf3-/- mice had similar defects in tight-junction proteins compared to cecal tissues from Batf3-/- mice in vivo, we used immunofluorescent stainings for tight junction proteins ZO-1, Occludin, and Claudin-2 and quantified fluorescent intensities in enteroids. Fluorescent intensity was significantly reduced for ZO-1 and Occuldin in enteroids from Batf3-/- mice compared to WT enteroids, while Claudin-2 fluorescent intensities are similar in WT and Batf3-/- mice (Figures S2D, E). To better understand the role of cDC1 in maintaining intestinal homeostasis, we used mice deficient in the transcription factor IRF8 which interacts with BATF3 in cDC1 development. Consistent with previous publications, Irf8-/- mice lack lamina propria cDC1 similar to Batf3-/- mice (Figure S2F) (60). We observed that IRF8 was also expressed in whole ileal tissue, but in contrast to BATF3, IRF8 was expressed in intestinal organoids, and isolated IEC (Figure S2G). However, lack of IRF8 did not affect enteroid surface area, enteroid formation potential, or the numbers of crypts per enteroid compared to enteroids derived from WT mice (Figures S2H-J). Furthermore, percentages of buds per crypt were similar between enteroids from Irf8-/- mice and WT mice (Figure S2K). Taken together, our results demonstrate an important role for BATF3 in maintaining intestinal homeostasis and suggests that this role is independent of its expression in epithelial cells at least under homeostatic conditions.
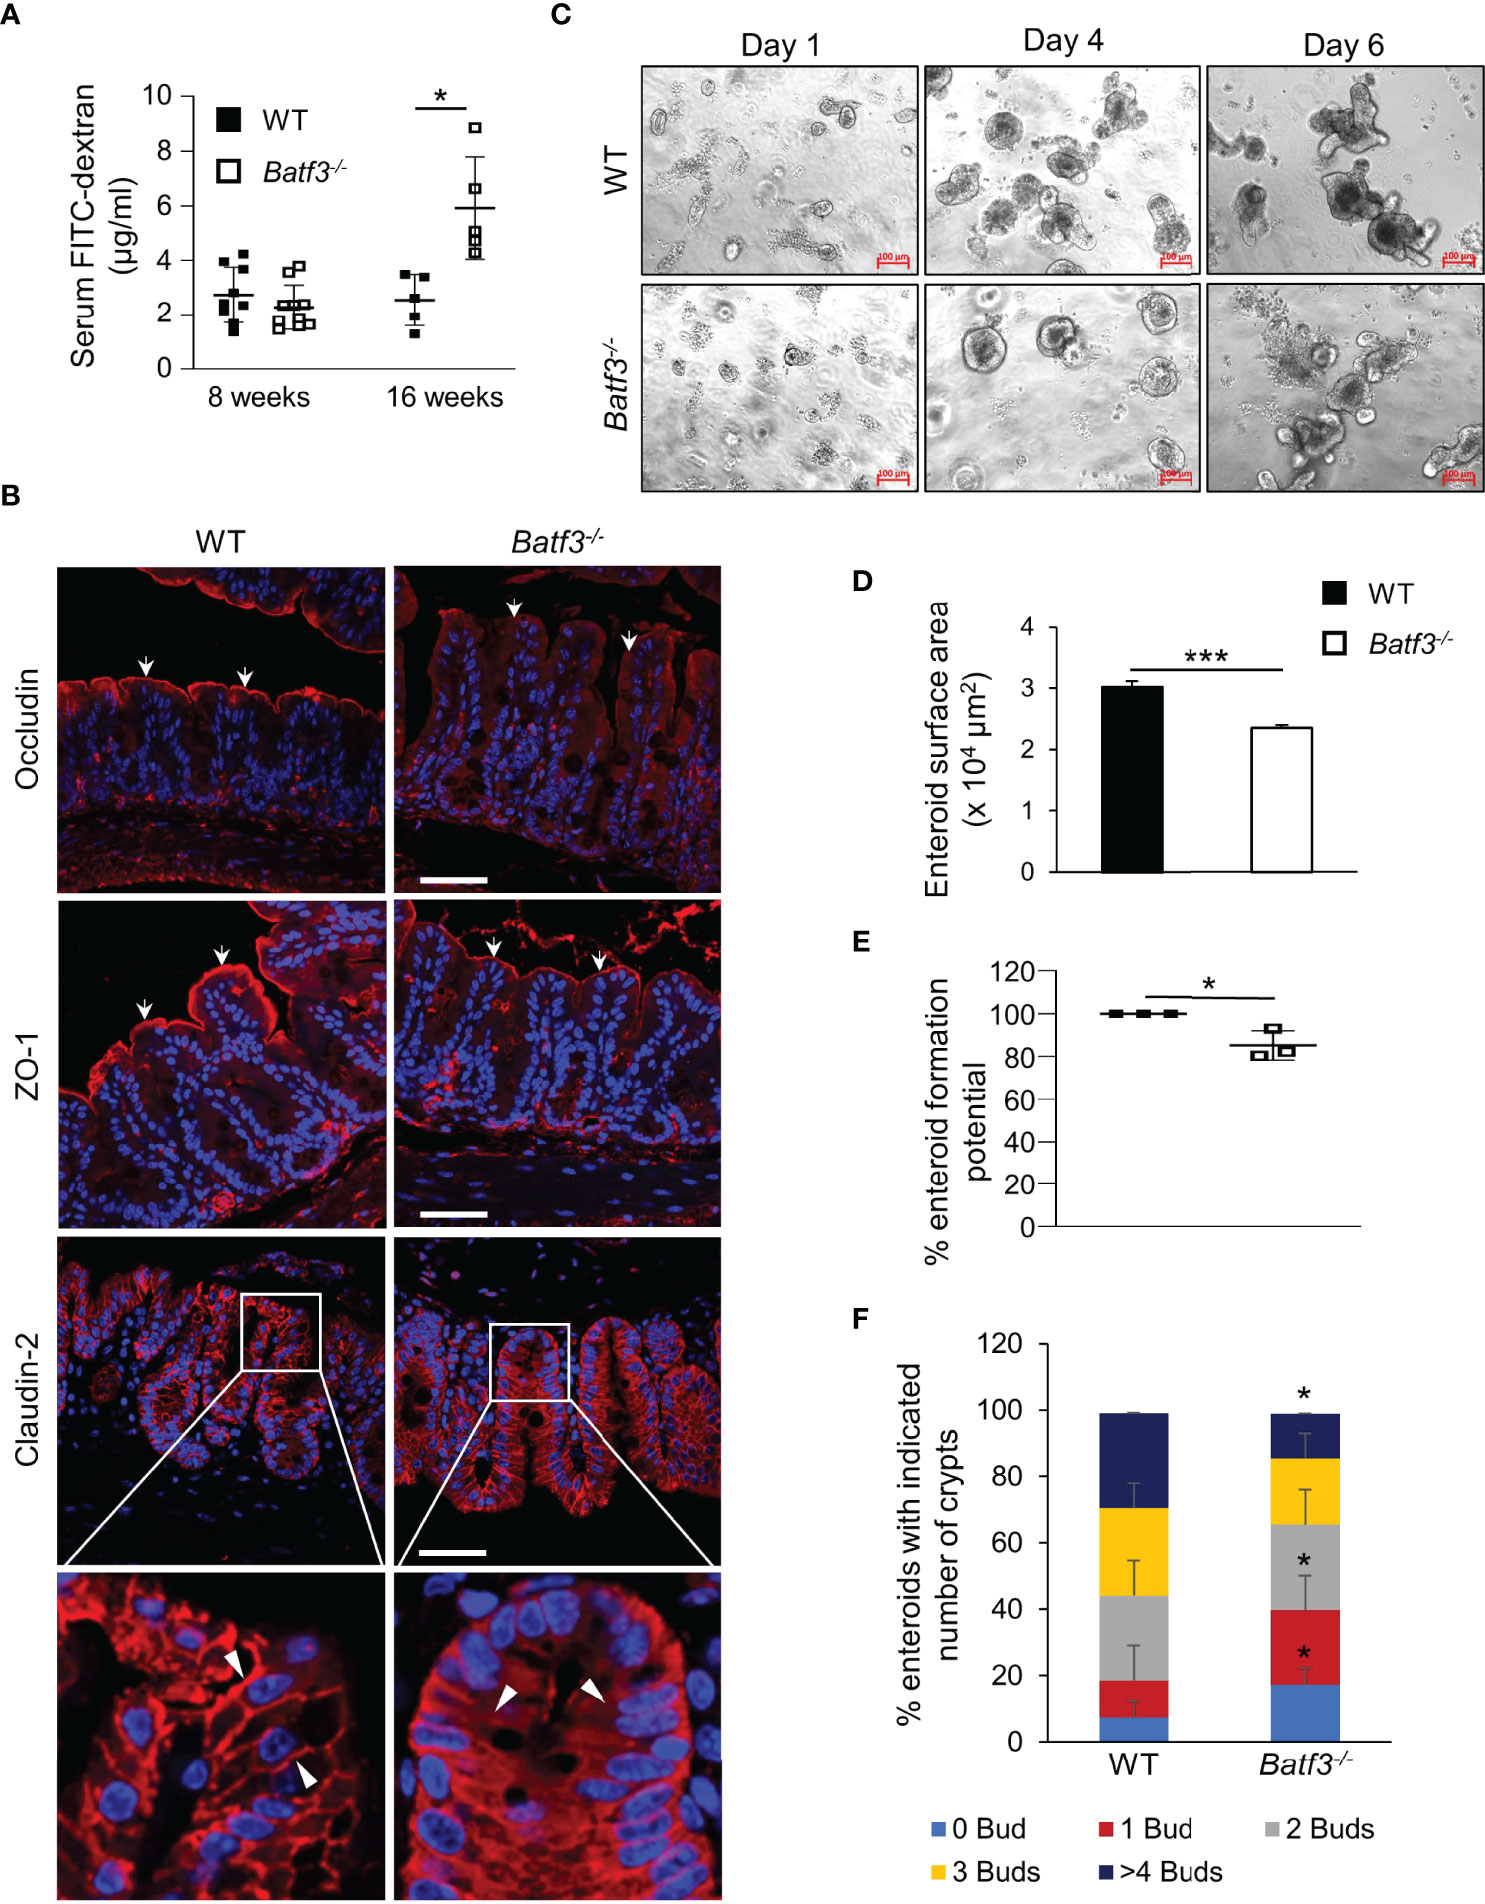
Figure 2 BATF3-deficiency leads to a loss of intestinal barrier integrity. (A) Intestinal permeability assay measuring serum concentration of FITC-labeled dextran in WT and Batf3-/- mice 3 h post FITC-dextran gavage at 8 and 16 weeks of age (8 weeks, n = 9-10/genotype; 16 weeks, n = 5/genotype). (B) Representative cecal immunofluorescence images of Occludin, ZO-1, Claudin-2 (all red), counterstained with DAPI (blue) at 16 weeks of age (Scale bar, 50 μm). White arrows indicate apical expression of Occludin, and ZO-1 on the intestinal epithelial layer. White arrow heads indicate membrane expression of Claudin-2 in WT (left panel), and cytosolic expression in Batf3-/- mice (right panel). (C) Representative phase contrast images of the ileal enteroids developed from WT and Batf3-/- mice captured on days 1, 4, and 6 using inverted microscope. Three independent experiments were performed (n=3/group) (Scale bar, 100 µm). (D–F) Characterization of enteroids on day 6 for (D) enteroid surface area, (E) enteroid formation potential, and (F) de novo crypt formation (budding). Three independent experiments were performed (n = 60-100 enteroids/genotype/experiments). Data are represented as means ± SD (A) or ± SEM (D, E). Statistical significance was determined by unpaired t-test (for analyzing enteroid surface area, and % enteroid formation potential) or by Mann-Whitney-U test (for de novo crypt formation, and FITC-dextran assay). *p < 0.05, ***p < 0.005.
Next, we characterized the innate immune cells composition within the large intestinal lamina propria (LP) of WT and Batf3-/- mice at 8 and 16 weeks of age. At 8 weeks of age, we observed an almost complete loss of cDC1, as expected, but no significant changes in the percentages of cDC2 or pro-inflammatory CD11c+ MNPs in Batf3-/- compared to WT mice (Figures S3A, B). Lack of cDC1 was not associated with spontaneous intestinal inflammation as shown by H&E stainings of the cecum of WT and Batf3-/- mice at 8 and 16 weeks of age (Figures S3C, D). However, at 16 weeks we observed reduction of cDC1, and a concomitant significant increase in the percentages of cDC2 and CD11c+ MNPs in Batf3-/- mice compared to WT mice in the LP (Figures 3A, B, S3E, F). The partial recovery of cDC1 abundance in 16-week-old Batf3-/- mice might be due to the inflammatory milieu in the LP as has been shown during infections in Batf3-/- mice (61). As an increase of CD11c+ MNPs is often associated with low-grade inflammation, we next analyzed the expression level of pro-inflammatory cytokines by qPCR in cecal tissue. Batf3-/- mice had increased expression of the pro-inflammatory cytokines Tnfa and Il1b, but not Il6 (Figure 3C). Next, we analyzed secretion of IL-1β and IL-18 in ex-vivo colonic explants. Batf3-/- explants had a significant increase in secretion of IL-1β and IL-18 compared to WT explants (Figure 3D). Taken together, these findings demonstrate that the lack of BATF3 leads to an increase in pro-inflammatory innate immune cells and increased expression of pro-inflammatory cytokines in the large intestinal LP.
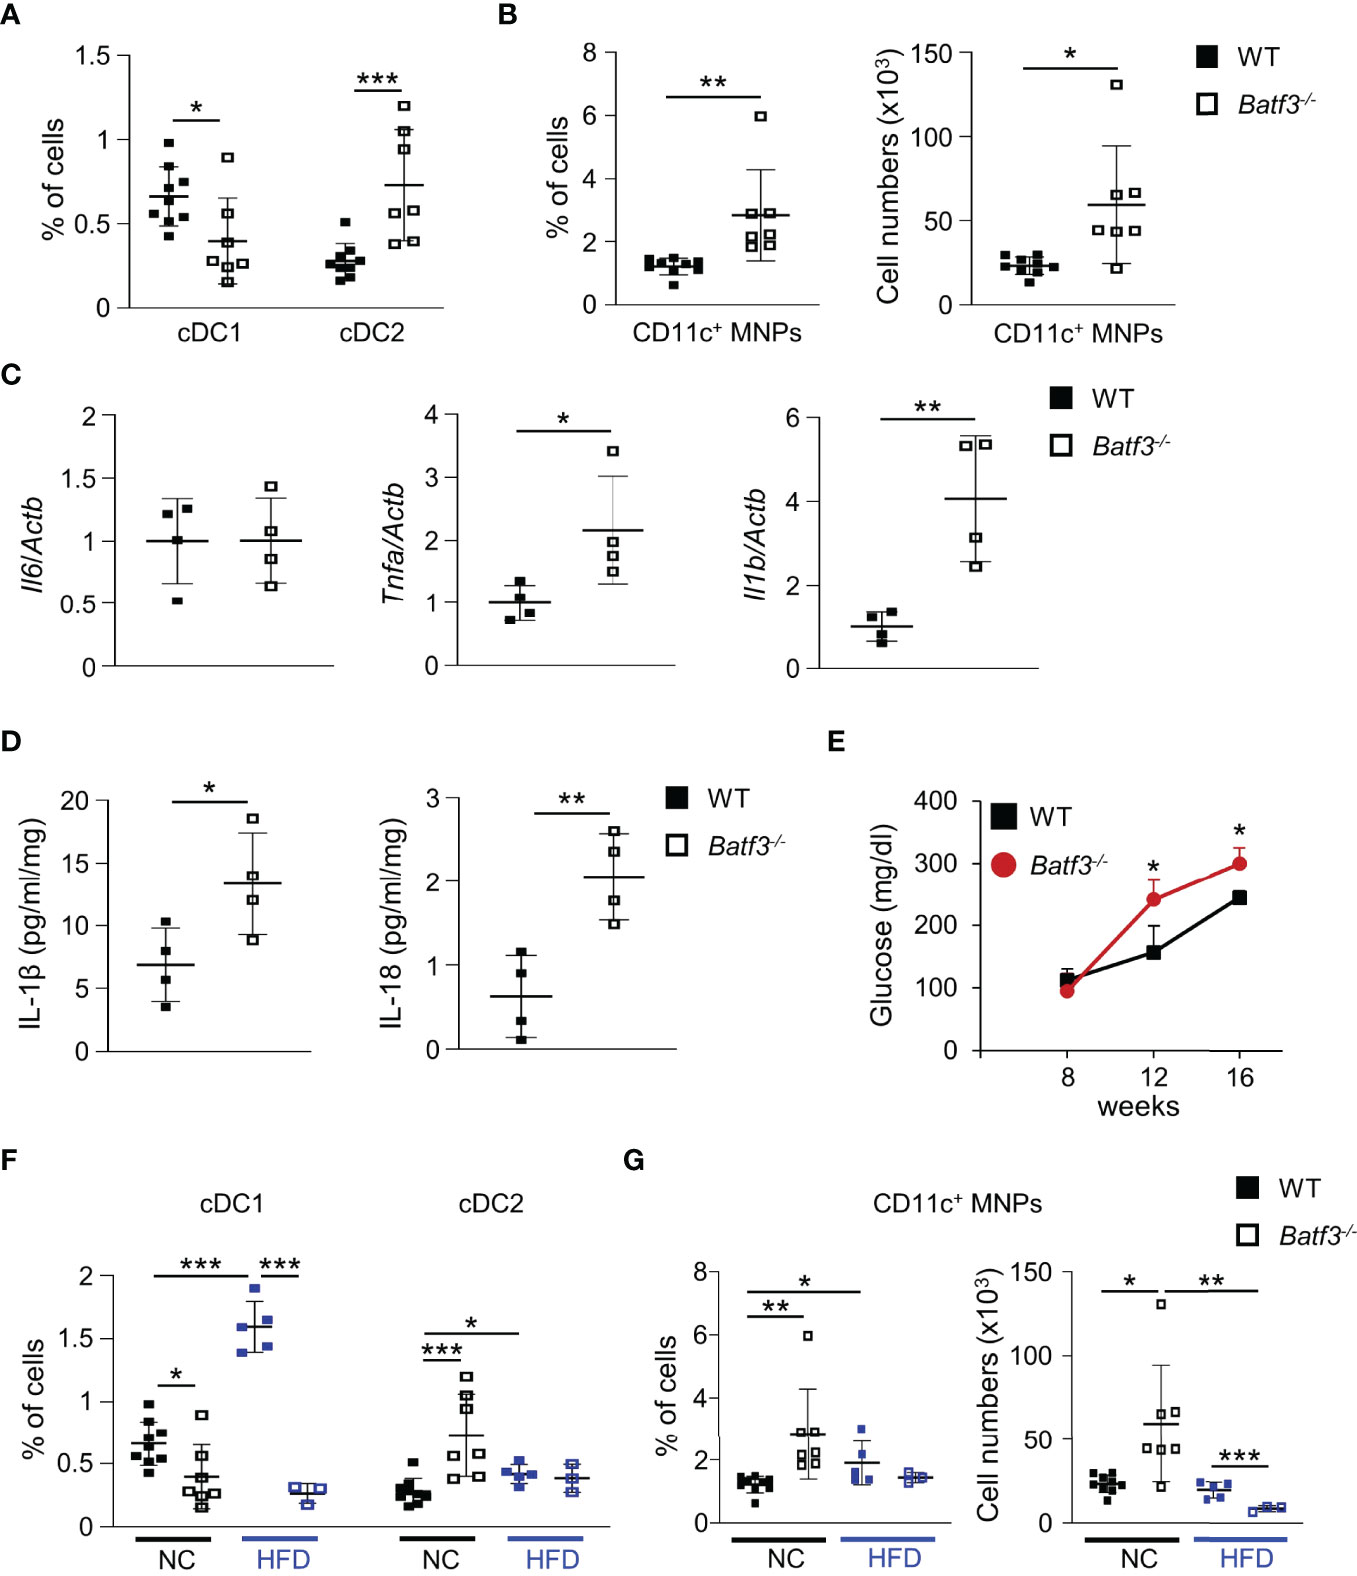
Figure 3 BATF3-deficiency leads to a shift toward a pro-inflammatory phenotype in the lamina propria. (A, B) Quantification of colonic lamina propria cDC1, and cDC2 (A), and CD11c+ MNPs, percentage of cells (left panel), total number of cells per large intestine (right panel) (B) of WT and Batf3-/- mice at 16 weeks (WT, n = 9; Batf3-/-, n = 7). (C) mRNA expression of indicated genes in the cecum of 16-week-old mice measured by qPCR. All data were normalized to expression of Actb and represented as fold changes compared to WT mice (n = 4/group). (D) IL-1β and IL-18 secretion from colon explants of WT and Batf3-/- mice at 16 weeks measured by ELISA (n = 4/group). (E–G) WT and Batf3-/- mice were fed a HFD from 8 to 16 weeks of age. (E) Fasting blood glucose levels during HFD. (F, G) Quantification of cDC1, and cDC2 (F), and CD11c+ MNPs, percentage of cells (left panel), total number of cells per large intestine (right panel) (G) of 16-week-old WT and Batf3-/- mice on normal chow or HFD (NC: n = 7-9/group; HFD: n = 3-5/group). Data are represented as means ± SD. Statistical significance was determined by Student’s t-test. *p < 0.05, **p < 0.01, ***p < 0.005.
Next, we determined if BATF3-deficiency also impacts diet-induced obesity. We administered a high-fat diet (HFD, 60% of total calories from fat) to WT and Batf3-/- mice from 8 to 16 weeks of age (Figure S4A). HFD resulted in comparable total body weights at 16 weeks in WT and Batf3-/- mice (Figure S4B). However, we observed an increased fasting glucose, increased liver weight, and hepatosteatosis in Batf3-/- mice (Figures 3E, S4C, D). In contrast to normal chow, the size of white adipocytes was not significantly different between WT and Batf3-/- mice on HFD (Figures S4E, F). Interestingly, HFD feeding led to a significant increase in the percentage of cDC1, and CD11c+ MNPs in WT, but a decrease of CD11c+ MNPs in Batf3-/- mice compared to normal chow (Figures 3F, G). Furthermore, we observed significantly reduced percentage of cDC1 in Batf3-/- mice on normal chow, as expected, and on HFD, but did not observe any differences in cDC2 between Batf3-/- mice and WT mice on HFD (Figure 3F). To elucidate the impact that metabolic syndrome and barrier dysfunction in Batf3-/- mice might have on susceptibility to DSS colitis, we administered an HFD to WT and Batf3-/- mice from 8 to 16 weeks of age followed by 7 days of DSS drinking water (Figures S5A). Acute DSS colitis in mice that were fed a HFD did not lead to significant differences in body weight, but resulted in more proximal inflammation in Batf3-/- compared to WT mice with rectal sparing, a phenotype that is reminiscent of human Crohn’s disease (Figures 4A, B, S5B). Batf3-/- mice have significantly higher histological scores in the cecum and lower scores in the rectum compared to WT mice (Figure 4B). Similar to what we observed under normal chow, Batf3-/- mice have an increased percentage of cDC2 and CD11c+ MNPs compared to WT mice in the LP (Figures 4C, D), increased levels of IL-1β and IL-6 (Figures 4E, F), and increased size of white adipocytes (Figures S5C, D). TNFα is not significantly different between WT and Batf3-/- mice under HFD with acute DSS colitis (Figure S5E). HFD alone also increased the expression of IL-1β and TNFα in WT and Batf3-/- mice, respectively (Figures 4E, S5E). However, we only observed significant differences in the expression of TNFα, but neither IL-1β, nor IL-6 between WT and Batf3-/- mice on HFD alone (Figures 4E, F, S5E). These data support our hypothesis, that metabolic syndrome and the shift to a pro-inflammatory LP phenotype observed in Batf3-/- mice contribute to the increased susceptibility of injury induced colitis in Batf3-/- mice.
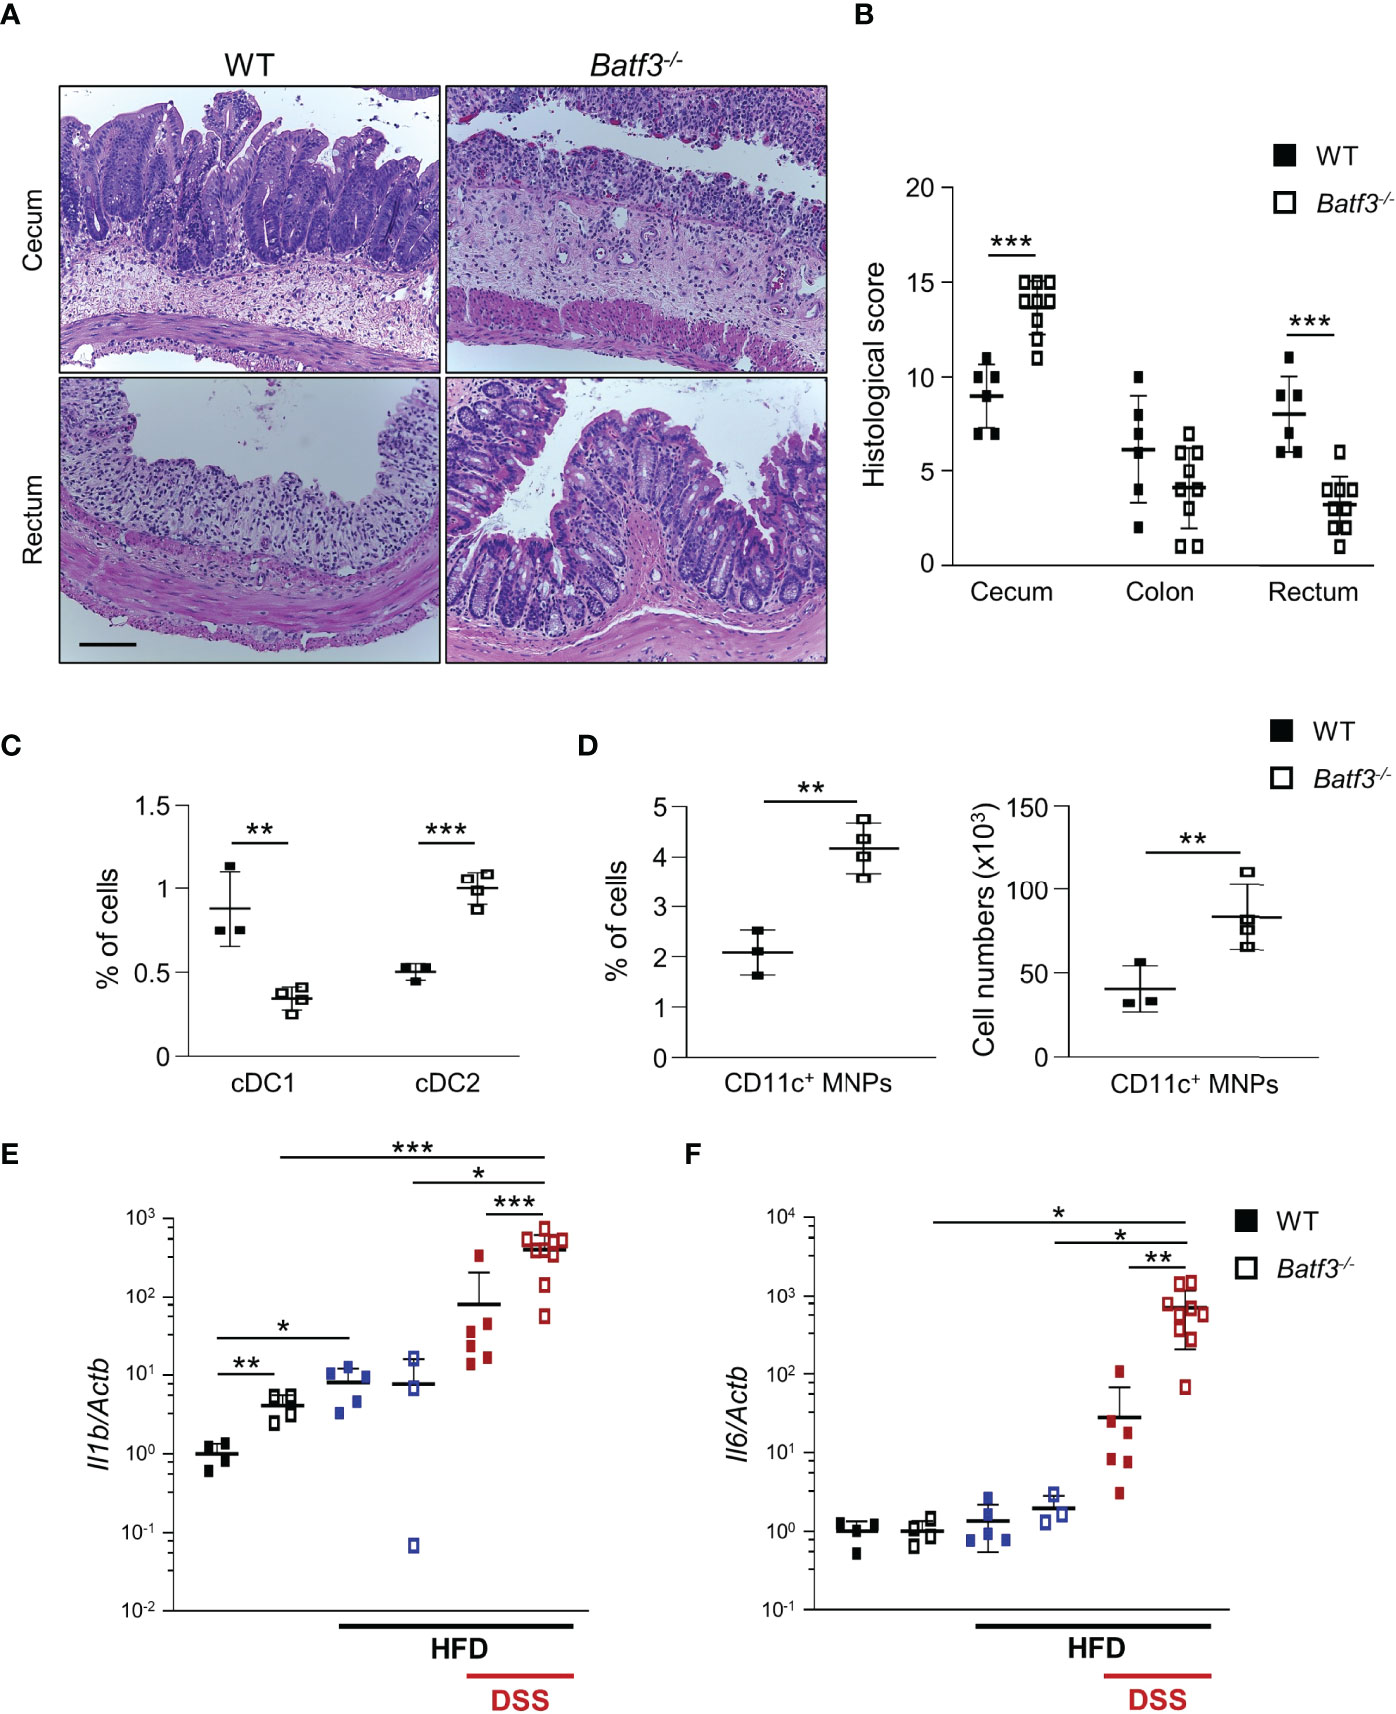
Figure 4 High-fat diet exacerbates DSS-induced acute colitis in Batf3-/- mice. (A) Representative H&E staining of cecum and rectum from WT and Batf3-/- mice receiving high fat diet (HFD) for 8 weeks followed by 7 days of DSS drinking water (Scale bar, 100 μm). (B) Histological scores for cecum, colon, and rectum (n = 6-9/genotype). (C, D) Percentages of lamina propria cDC1, cDC2 (C), and CD11c+ MNPs, percentage of cells (left panel), total number of cells per large intestine (right panel) (D) measured by flow cytometry (n = 3-4/genotype). One representative experiment out of two independent experiments is shown. (E, F) mRNA expression of Il1b (E) and Il6 (F) in the cecum of 16-week-old mice on normal chow, receiving HFD, and receiving HFD and 7 days of DSS as measured by qPCR. All data were normalized to expression of Actb and represented as fold changes compared to WT mice (NC: n = 4/genotype; HFD: n = 3-5/genotype; HFD + DSS: n = 6-9/genotype). Data are represented as means ± SD. Statistical significance was determined by Student’s t-test. *, p < 0.05, **, p < 0.01, ***, p < 0.005.
The gut microbiota are a known contributor to metabolic function and has been linked to the development of human metabolic syndrome (12, 62). The interplay between intestinal microbiota and immune responses has been shown to be critical in preventing dysbiosis and subsequently metabolic syndrome. To investigate the role of intestinal bacteria in the development of metabolic syndrome in Batf3-/-, we treated WT and Batf3-/- mice with broad-spectrum antibiotics (Abx) from the time of weaning until 16 weeks of age (Figure S6A). WT mice showed no differences in weight gain with Abx treatment (Figure 5A). In contrast, in Batf3-/- mice treated with Abx, weight gain was completely reduced to weight gain seen in WT mice treated with or without Abx (Figure 5A). This was accompanied by a reduction of fasting glucose, insulin, and total cholesterol levels in Batf3-/- mice to WT levels (Figures 5B, S6B, C). Furthermore, insulin tolerance of Batf3-/- mice treated with Abx was similar to WT mice treated with Abx (Figure 5C). Treatment with Abx also restored impaired intestinal permeability of Batf3-/- mice to WT level as measured by serum FITC-dextran (Figure 5D). Furthermore, treatment with Abx significantly reduced the percentage of LP cDC2 and CD11c+ MNPs in Batf3-/- mice to percentages comparable to WT mice (Figures 5E, F). The reduced percentages of cDC2 and CD11c+ MNPs in Abx treated Batf3-/- mice was accompanied by a significant reduction in expression of IL-1β, and TNFα in the cecum of Batf3-/- mice (Figure 5G). In summary, these data show an important role of the intestinal microbiota in the development of metabolic syndrome and pro-inflammatory LP phenotype observed in Batf3-/- mice.
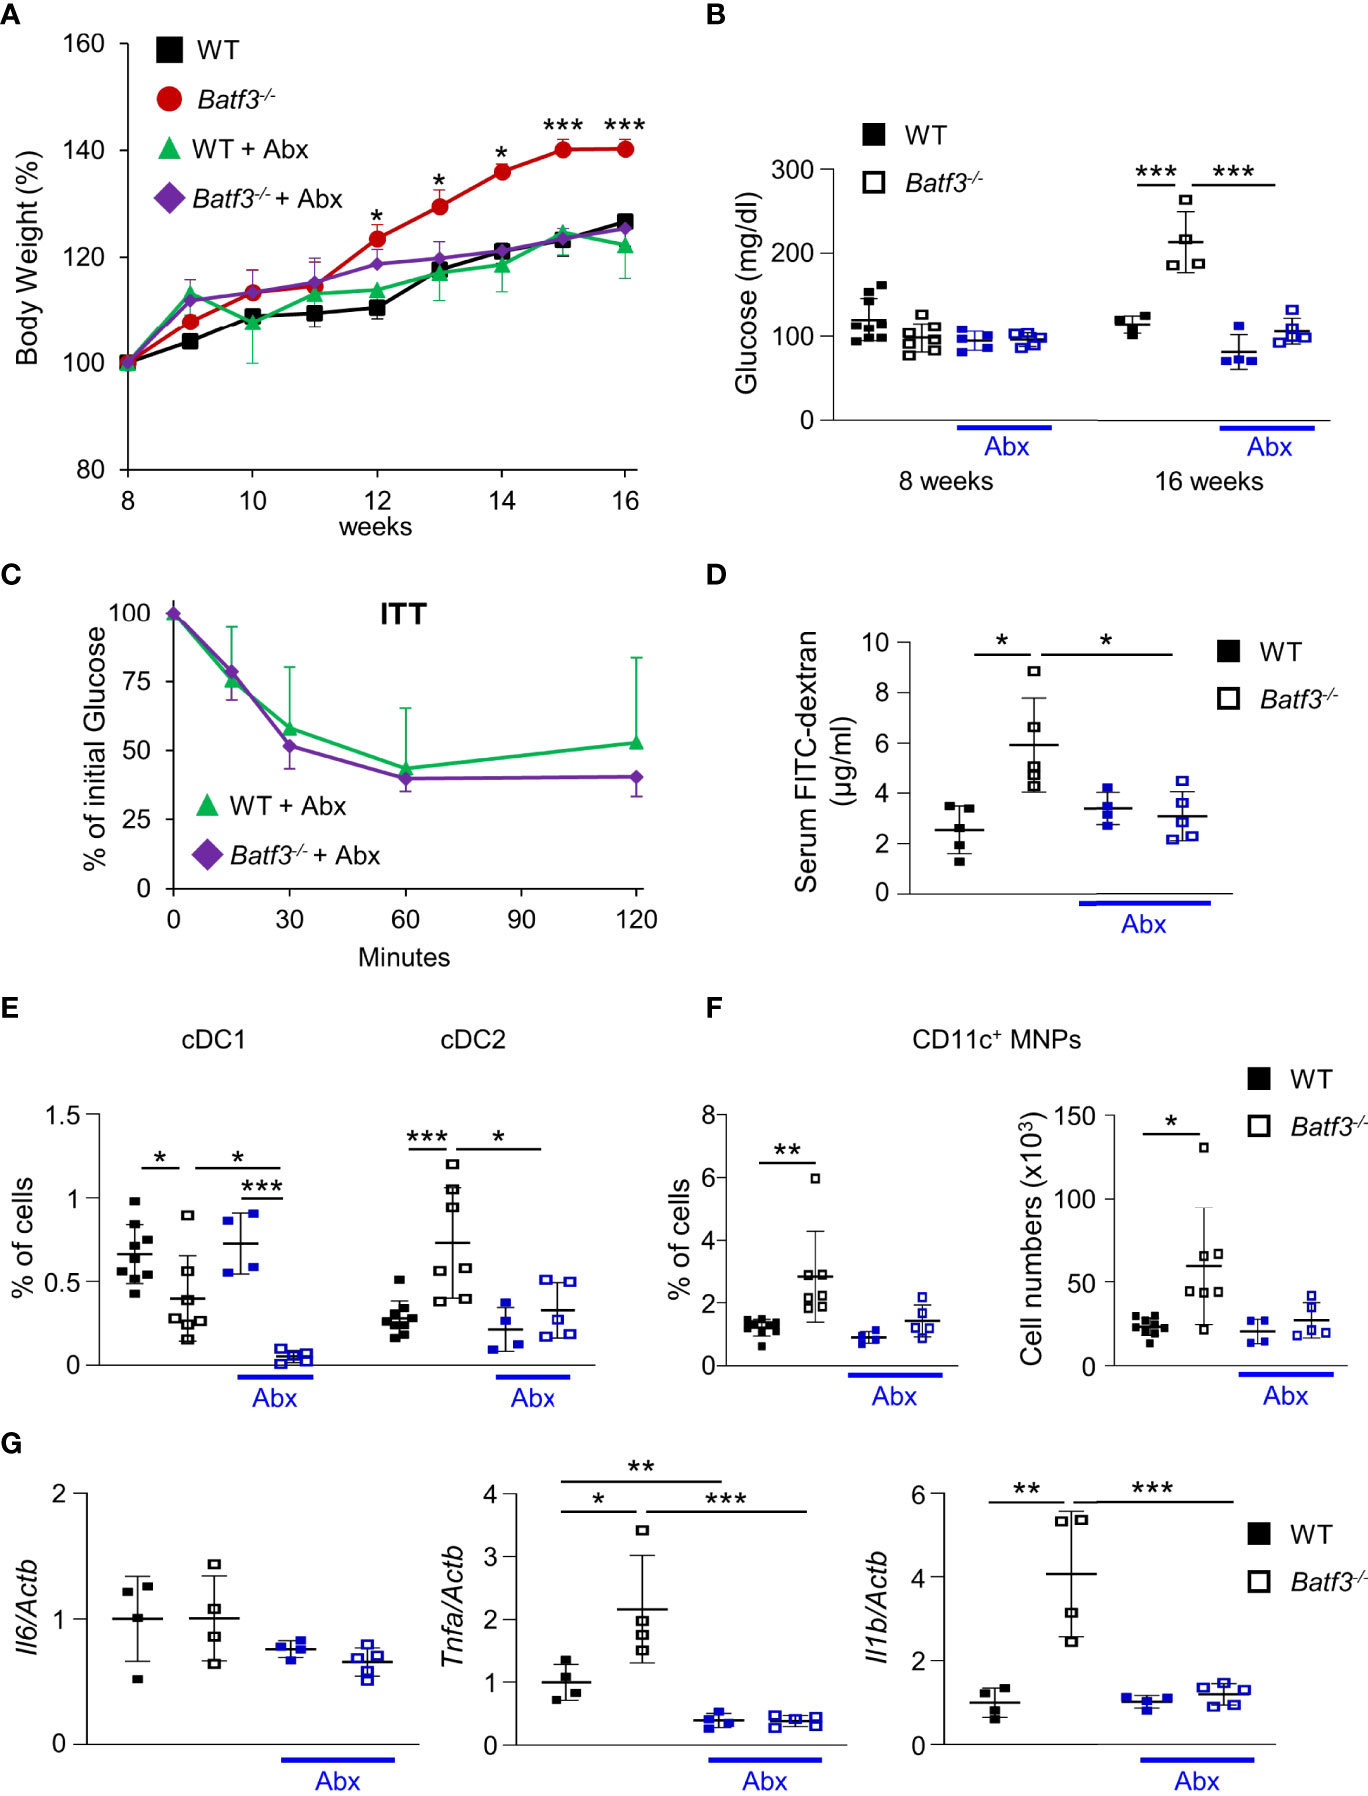
Figure 5 Commensal bacteria contribute to the development of metabolic syndrome in Batf3-/- mice. (A) Body weight gain as percentage of the initial weight at week 8 (NC: n = 4/genotype; Abx: n = 4-5/genotype). (B) Fasting blood glucose concentrations (NC: n = 4/genotype; Abx: n = 4-5/genotype). (C) Insulin tolerance test (ITT) in WT and Batf3-/- mice at 16 weeks of age treated with Abx (NC: n = 4/genotype; Abx: n = 4-5/genotype). (D) FITC-dextran serum concentration at 16 weeks of age (NC: n = 4/genotype; Abx: n = 4-5/genotype). (E, F) Percentage of colonic lamina propria cDC1, cDC2 (E), and CD11c+ MNPs, percentage of cells (left panel), total number of cells per large intestine (right panel) (F) measured by flow cytometry (NC: n = 4/genotype; Abx: n = 4-5/genotype). (G) mRNA expression of Il1b, Tnfa, and Il6 in the cecum of 16-week-old mice on normal chow, with or without Abx as measured by qPCR. All data were normalized to expression of Actb and represented as fold changes compared to WT mice (NC: n = 4/genotype; Abx: n = 4-5/genotype). Data are represented as means ± SD. Statistical significance was determined by Student’s t-test (A-C, E-G), or Mann-Whitney-U test (D). *p < 0.05, **p < 0.01, ***p < 0.005.
To further investigate the role of intestinal microbiota in the development of metabolic syndrome in Batf3-/- mice, we performed 16S rRNA gene sequencing on 8-week-old WT and Batf3-/- mice before the onset of metabolic syndrome. We observed significantly altered microbiome composition in fecal samples of Batf3-/- compared to WT mice using principal coordinates analysis (PCoA) with significant separation of WT and Batf3-/- clusters independently of the sexes of the mice (Figure 6A). Furthermore, alpha diversity was significantly reduced in Batf3-/- compared to WT mice as analyzed by Chao1 and Shannon alpha diversity indices (Figures 6B, C). Decreased intestinal bacterial diversity has been associated with increased inflammation and obesity (29, 30, 63). At the phylum level, Batf3-/- mice had a lower abundance of Firmicutes, Verrucomicrobia, Actinobacteria, and a higher abundance of Bacteroidetes compared to WT mice (Figure S7A). At the genus level, Batf3-/- mice have a higher abundance of Prevotellacea, Bacteroides, Lactobacillus, and a lower abundance of Akkermansia and Bifidobacterium (Figure S7B). Next, we used a negative binomial model to identify differentially abundant microbial genera. Akkermansia muciniphila, Mucispirillum schaedleri, Angelakisella, and Bifidobacterium were most differentially abundant with a high abundance in WT mice while Parabacteroides, Prevotellaceae, and Lactobacillus were more abundant in Batf3-/- mice (Figure S7C). The abundance of A. muciniphila, a mucolytic bacterial species, has been negatively correlated with obesity and metabolic syndrome in animal models and humans (64–68). We confirmed our 16S rRNA data in a larger cohort by qPCR. At 8 weeks of age Batf3-/- mice had a significantly increased abundance of Bacteroides sp. and decreased abundance of A. muciniphila, M. schaedleri, and Bifidobacterium (Figure 6D). We next investigated mechanisms that could contribute to microbial dysbiosis. We isolated intestinal fecal contents from WT and Batf3-/- mice to determine the percentage of total IgA-coated, IgAhigh/low-coated bacteria, and fecal secretory IgA (sIgA). Batf3-/- mice had a significantly lower percentage of total IgA and IgAhigh-coated bacteria compared to WT mice, while the percentage of IgAlow-coated bacteria was similar (Figures 6E, F, S7D). Furthermore, fecal secreted IgA was significantly reduced in Batf3-/- mice compared to WT mice (Figure 6G). Our data suggest that BATF3-deficiency leads to altered IgA-coating of bacteria, and intestinal dysbiosis that could contribute to the development of metabolic syndrome.
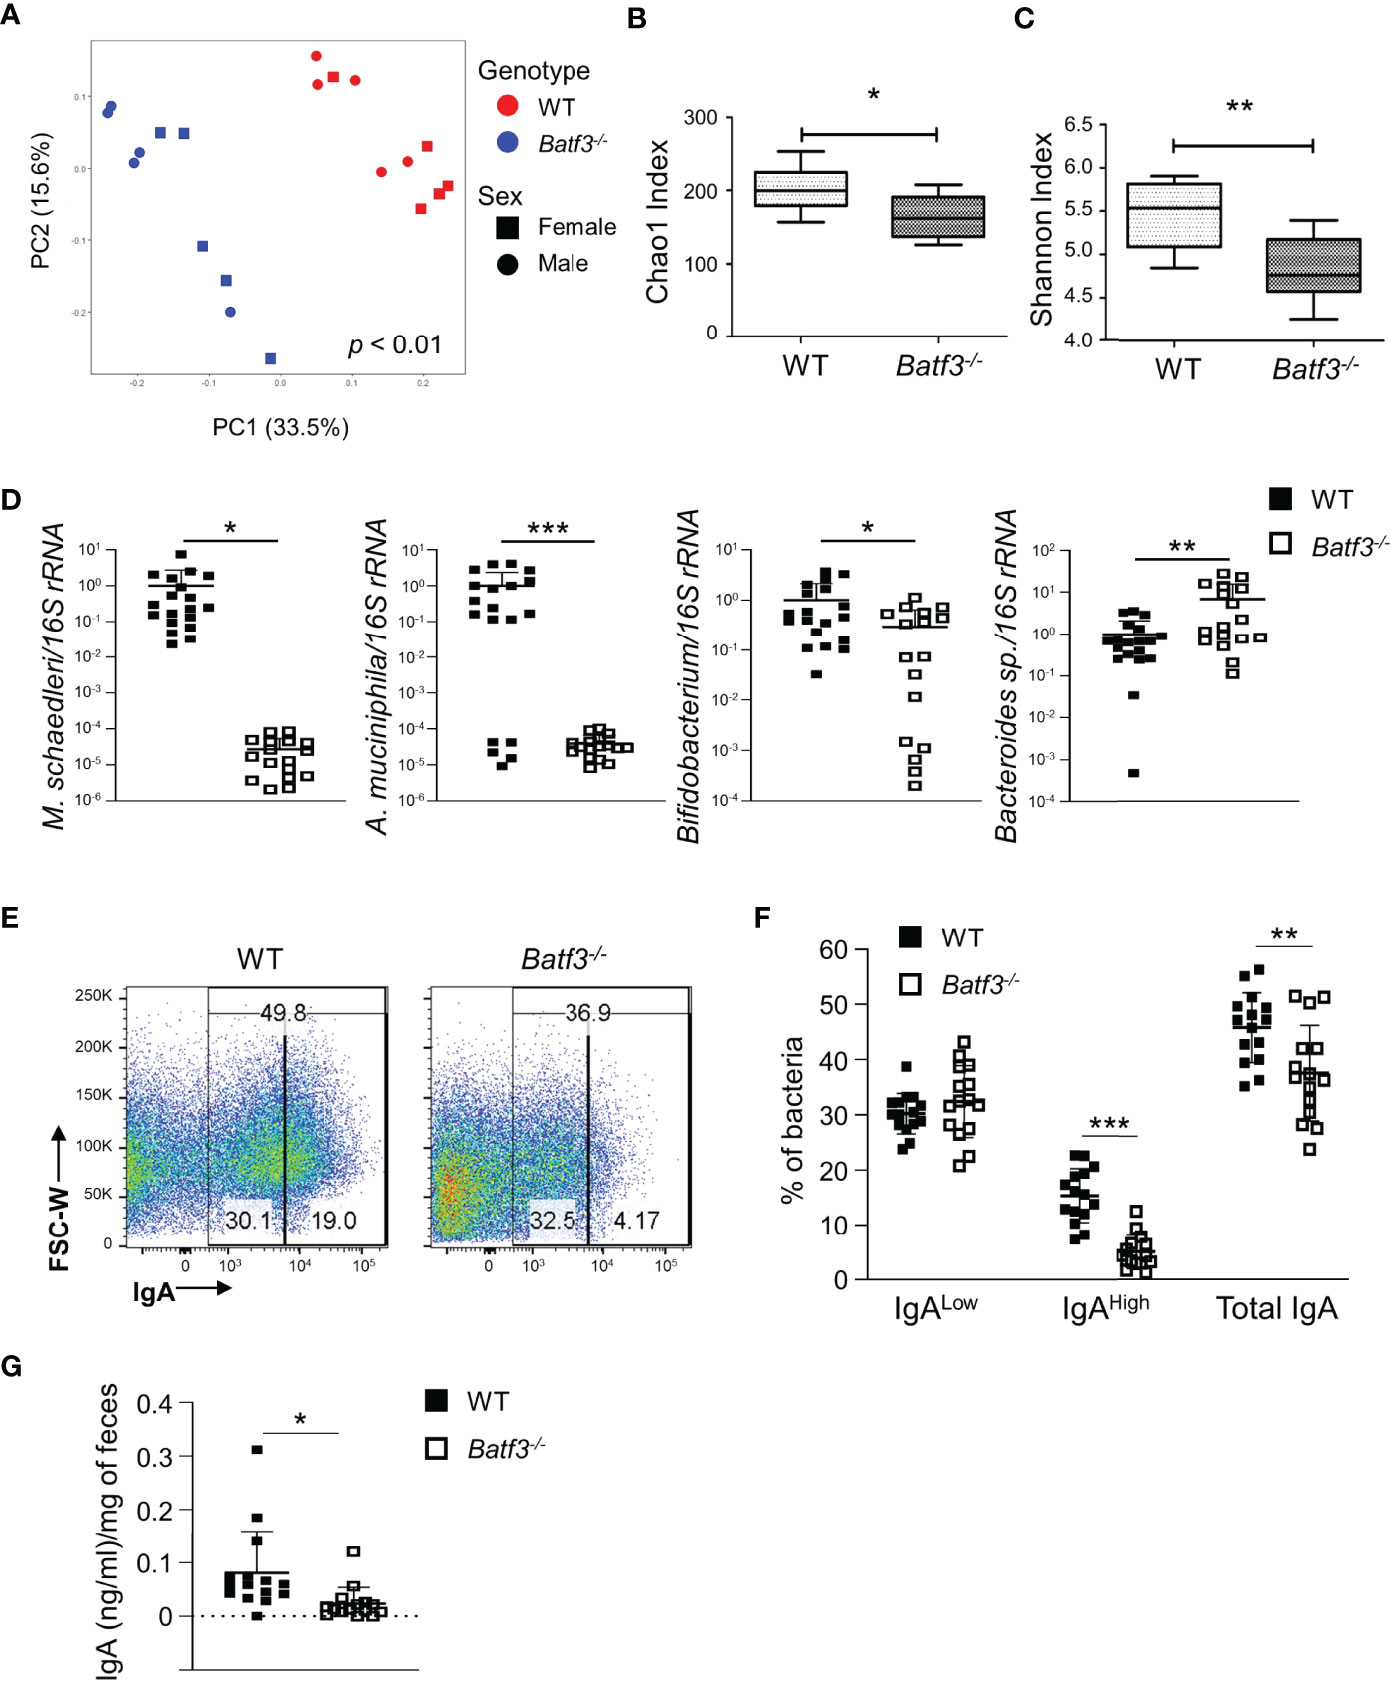
Figure 6 BATF3-deficiency leads to intestinal dysbiosis preceding the development of metabolic syndrome. (A) Principal Coordinates Analysis (PCoA) of fecal microbiota of 8-week-old WT and Batf3-/- mice fed standard chow with consideration for genotype and sex of mice (n = 10/genotype). (B, C) Chao1 index (B) and Shannon index (C) of fecal microbiota of 8-week-old WT and Batf3-/- mice (n = 10/genotype). (D) Quantification of relative abundance of Mucispirillum schaedleri, Akkermansia muciniphila, Bifidobacterium, Bacteroides sp. in fecal samples of 8-week-old WT and Batf3-/- mice by qPCR (n = 17-19/genotype). (E) Representative flow cytometry plots of IgA coated fecal bacteria isolated from WT and Batf3-/- mice. (F) Quantification of IgAlow, IgAhigh and total IgA coated bacteria in feces of WT and Batf3-/- mice at 8 weeks of age (n =15/genotype). (G) Secreted IgA from fecal samples of WT and Batf3-/- mice at 8 weeks of age measured by ELISA (n = 15/genotype). Data are represented as means ± SD (A, D, F, G) or median (bar), interquartile range (box), and range (whisker) (B, C). Statistical significance was determined by Adonis test (A), or Student’s t-test (B–D, F, G). *p < 0.05, **p < 0.01, ***p < 0.005.
To assess whether the hyperglycemia that we observed in Batf3-/- mice contributes to the impaired intestinal barrier and subsequent pro-inflammatory phenotype in Batf3-/- mice, we treated 16-week-old WT and Batf3-/- mice with 2-DG, an inhibitor of glucose metabolism, for 10 days (Figure 7A). Treatment with 2-DG reduced serum concentration of FITC-Dextran in Batf3-/- mice to levels similar of WT mice (Figure 7B), suggesting an improvement in intestinal epithelial barrier function. Moreover, treatment with 2-DG restored the percentage of cDC2 and CD11c+ MNPs of Batf3-/- mice to levels seen in WT mice without a major impact on cDC1 (Figures 7C, D). Treatment of Batf3-/- mice with 2-DG significantly reduced the expression level of TNFα and IL-6 in Batf3-/- mice comparable to WT expression levels (Figure 7E). These findings suggest a key role of epithelial glucose metabolism in the impairment of the intestinal barrier in Batf3-/- mice contributing to the development of metabolic syndrome in these mice.
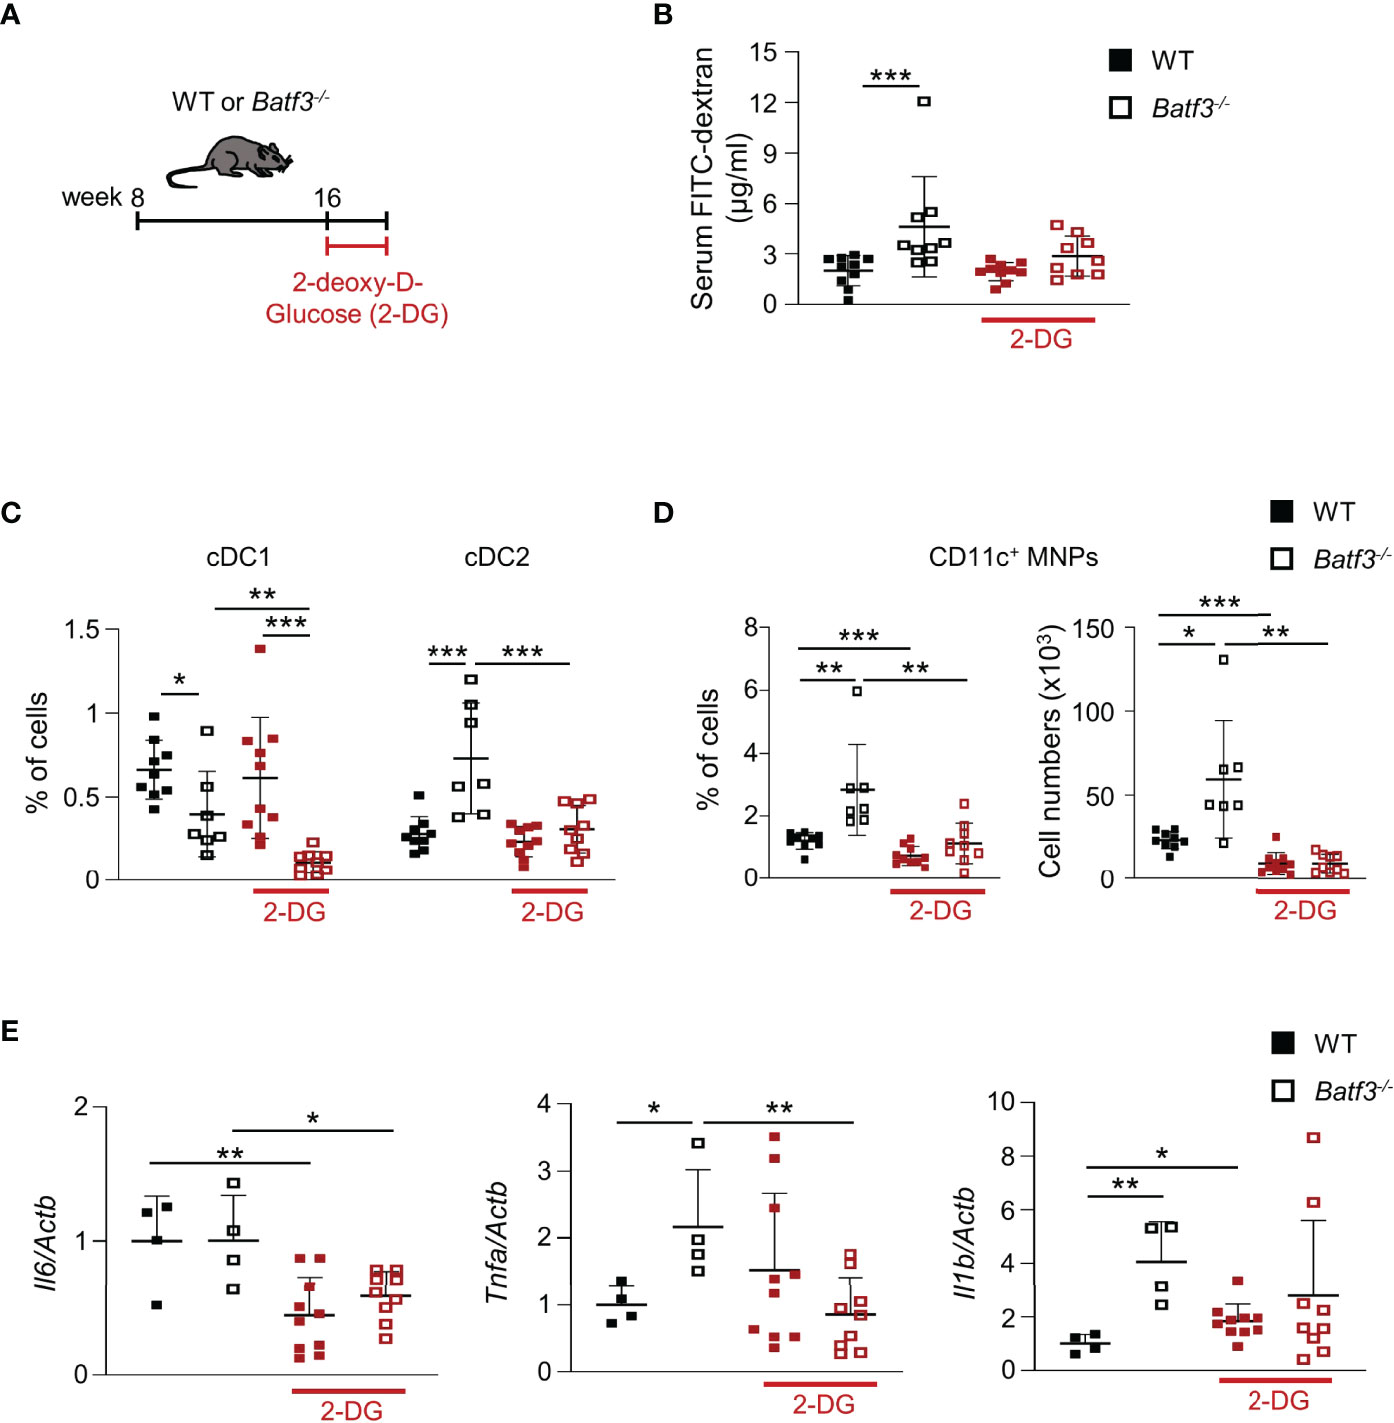
Figure 7 Treatment with 2-DG restores intestinal barrier integrity and reverses the inflammatory phenotype in Batf3-/- mice. (A) Schematic of 2-DG treatment of 16-week-old WT and Batf3-/- mice. (B) FITC-dextran serum concentration of WT and Batf3-/- mice before and after treatment with 2-DG (n = 9-10/genotype). (C, D) Percentages of lamina propria cDC1, cDC2 (C), and CD11c+ MNPs, percentage of cells (left panel), total number of cells per large intestine (right panel) (D) measured by flow cytometry (n = 9-10/genotype). (E) mRNA expression of Il6, Tnfa, and Il1b in the cecum of mice treated with 2-DG for 10 days as measured by qPCR. All data were normalized to expression of Actb and represented as fold changes compared to WT mice (n = 9-10/genotype). Data are represented as means ± SD. Statistical significance was determined by Student’s t-test (C–E), or Mann-Whitney-U test (B). *p < 0.05, **p < 0.01, ***p < 0.005.
The intestinal immune system and its interaction with intestinal microbiota has emerged as an important player in the development of metabolic syndrome (12, 16, 69). Multiple factors contributing to the development of metabolic syndrome converge at the site of the intestinal barrier: absorption of nutrients from diet, gut microbiota, and the intestinal immune system (17, 69). While changes in the composition of the intestinal immune system under high fat diets have been observed and associated to the development of an impaired intestinal barrier, the exact mechanisms of specific intestinal DC subsets contributing to metabolic changes that lead to a leaky barrier and associated low-grade inflammation and metabolic syndrome are largely unknown. Here, we identified the transcription factor BATF3 as an important contributor to the complex interactions between mucosal cDCs, intestinal microbiota, epithelial cells, host immune responses, and metabolism. Our study identified BATF3 to be important in orchestrating intestinal epithelial barrier function and an anti-inflammatory milieu during homeostasis. BATF3-deficiency leads to early changes in IgA-coating of bacteria, intestinal microbiota composition, hyperinsulinemia, and hypercholesterolemia under normal caloric intake. The metabolic changes lead progressively to the development of obesity, hyperglycemia, and metabolic syndrome. Hyperglycemia fragilized the large intestinal epithelial barrier by disturbing the localization of several tight-junction proteins leading to increased intestinal permeability. We also observed a significant shift in the population of lamina propria DC subsets and macrophages toward a pro-inflammatory phenotype leading to low-grade inflammation. Previous observations of BATF3-dependent cDC1s being most abundant in the colon is consistent with our findings of impaired colonic permeability, tight junction alterations, and pro-inflammatory milieu (70). Our findings demonstrate that BATF3 is required to maintain a healthy intestinal barrier and prevent the development of intestinal dysbiosis and chronic low-grade inflammation that contributes to the development of metabolic syndrome.
The earliest metabolic changes that we observed in Batf3-/- mice were increased serum insulin and total cholesterol, which preceded impaired intestinal barrier function, obesity, and changes in lamina propria immune composition. Serum lipids and free fatty acids can induce insulin resistance and impaired glucose metabolism, and can also activate inflammatory pathways in innate immune cells via TLR4 recognition of these lipids (71). At later time-points, we observed impaired intestinal barrier integrity and a concomitant shift toward a pro-inflammatory milieu in the lamina propria that included an increase in CD11c+ MNPs. While adipose tissue M1 macrophages are associated with obesity and insulin resistance, the overall numbers of small intestinal macrophages are increased in human obesity but their contribution to disease development and progression is less clear (72, 73). Moreover, a previous study investigating the role of DCs in obesity and insulin resistance used CD11c depletion strategy, which depletes the majority of intestinal cDC subsets with different functions (74). Using Batf3-/- mice with a specific depletion of lamina propria CD103+ cDC1 suggests a role for this subset in the development of metabolic syndrome and the pro-inflammatory phenotype.
Hyperglycemia has been demonstrated to markedly interfere with homeostatic intestinal epithelial barrier function by altering the expression and localization of adherence and tight junction proteins (22). We demonstrate that Batf3-/- mice present with impaired intestinal barrier function at 16 weeks of age, which is associated with the development of insulin resistance and hepatosteatosis. Mechanistically, treatment of obese Batf3-/- mice with the glycolysis inhibitor 2-DG for 10 days restored intestinal barrier integrity, significantly decreased the low-grade inflammation, and reversed the shift in DC subsets and macrophages in the lamina propria of these mice. Although the treatment with 2-DG for 10 days may not be sufficient to reverse the metabolic syndrome in these mice, it demonstrates the central role of glucose metabolism in intestinal epithelial cells to the loss of barrier integrity and pro-inflammatory phenotype in the gut of Batf3-/- mice. 2-DG is a non-specific glycolysis inhibitor and treatment will impact many biological processes in addition to its effect on IEC. A previous publication has demonstrated that hyperglycemia can directly impact IEC function in vitro and in vivo and that 2-DG blocks this effect in vivo. Our data demonstrate a decrease in epithelial barrier permeability and a shift of inflammatory DC/Macrophages in Batf3-/- mice toward a WT phenotype, but there may be other contributing factors in our model.
Alteration in intestinal microbiota have been associated with the development of obesity and metabolic syndrome (25). Several mechanisms have been proposed for how microbiota induce the development of obesity and metabolic syndrome, including digestion of nutrients, storage of body fat, and efficiency of energy harvesting from the diet (23–25). Obesity-associated dysbiosis of microbiota has also been linked to increased permeability and gut inflammation (18–20). Alterations in IgA-coating of luminal bacteria are associated with changes of microbial composition leading to the development of obesity (27, 75). The sensing of dysbiosis and bacterial products by innate immune cells via TLRs and down-stream signaling pathways will trigger chronic inflammation and metabolic syndrome. Although several TLRs and down-stream signaling molecules including MyD88, and NLRPs have been implicated in the development of obesity, these proteins are broadly expressed on intestinal DCs, macrophages, and T cells (15, 30, 76–78). However, the role of specific lamina propria cell types that potentially lead to and/or detect dysbiosis, and breach of the intestinal barrier in the context of obesity are not clearly defined. Here, we show that Batf3-/- mice display microbial dysbiosis characterized by an increased abundance of Bacteroides sp. and decreased abundance of A. muciniphila, M. schaedleri, and Bifidobacterium. The abundance of A. muciniphila is inversely correlated with obesity, type 2 diabetes, and metabolic syndrome, and supplementation with A. muciniphila improved several metabolic parameters in obese human volunteers (65, 79–81). In HFD-induced obesity in mice, oral administration of A. muciniphila could reverse metabolic syndrome including fat-mass gain, metabolic endotoxemia, adipose tissue inflammation, and insulin resistance without influencing food intake (65, 82). Moreover, A. muciniphila-derived extracellular vesicles could regulate the expression of tight-junction proteins and decrease intestinal permeability in vivo and in Caco-2 cells (83, 84). Protective effects against devolvement of obesity have been attributed to Bifidobacterium animalis ssp. in mouse models of HFD-induced obesity by the production of short chain fatty acids and their effects on adipocyte metabolism and host energy expenditure (85–87). Lachnospiraceae and their metabolites, short chain fatty acids, also mitigate HFD-induced obesity, insulin resistance, and intestinal inflammation (30). Interestingly, while a direct link to metabolic function has not been established for M. schaedleri, colonization protects against salmonella infection by competing for anaerobic respiration substrates and down-regulating the type 3 secretion system of S. enterica serovar Typhimurium (88). Taken together, these studies and our findings suggest that changes in the abundance of specific bacteria in Batf3-/- mice may trigger or contribute to the development of metabolic syndrome. This hypothesis is supported by our data, demonstrating that antibiotic treatment of Batf3-/- mice prevented the development of metabolic syndrome and low-grade inflammation. Thus, BATF3 plays an important role in preventing the development of metabolic syndrome through a microbiome-dependent mechanism.
Previous studies using Batf3-/- mice did not observe any spontaneous development of intestinal inflammation or increased susceptibly to DSS colitis which is consistent with our findings in 8- and 16-week-old Batf3-/- mice (43) (Figures S3C, D). However, we hypothesized that in the context of obesity, BATF3-deficiency may increase susceptibly to acute DSS colitis. To exclude any confounding effects of obesity on its own, we administrated HFD to WT and Batf3-/- mice. On HFD, Batf3-/- mice had a higher susceptibly to cecal inflammation during acute DSS colitis compared to WT mice. Our data suggest that BATF3 plays a protective role in the development of intestinal inflammation under conditions of metabolic syndrome. Interestingly, a sizable subgroup of patients with IBD are obese and visceral adiposity has been associated with an increased risk of IBD-related complications and poor response to medical therapy suggesting an integrated relationship between obesity and the pathogenesis of IBD (89).
A recent study demonstrated that BATF3 is expressed by intestinal epithelial cells in a model of colitis-associated colon cancer and in human cancer cell lines (90). We did not detect Batf3 mRNA expression in ex vivo cultures of enteroids generated from WT mice which is consistent with a previous publication (90). Our data suggest, that in WT mice BATF3 was mainly expressed by lamina propria immune cells rather than IEC under steady state conditions. Although enteroids did not express BATF3, enteroid formation potential was significantly reduced in Batf3-/- mice compared to WT mice, which could be explained by either cell-intrinsic defects of tight junction proteins or the cell-extrinsic microenvironment imprinting on the regenerative potential of Batf3-/- enteroids. Previous publications have demonstrated that enteroids derived from patients with IBD recapitulated histological and functional features of the primary tissues, including the absence of acidic mucus secretion and aberrant adherens junctions in the epithelial barrier by mechanisms involving epigenetic modifications such as DNA methylation in intestinal stem cells (91–93). We observed changes in the expression and localization of tight junction proteins ZO-1 and Occludin in enteroids derived from Batf3-/- mice that recapitulate our in vivo findings.
BATF3-dependent DCs are mainly present as tissue–resident and migratory DCs characterized as CD103+CD11b− in the lamina propria while in lymphoid organs BATF3-dependent DCs express CD8α (43). Although our study focused on the consequences of deficiency in BATF3-dependent cDC1s in the lamina propria, a role of BATF3-dependent DCs in other organs that contribute to metabolic syndrome can’t be excluded. Batf3-/- mice have been recently shown to be more susceptible to the development of steatohepatitis after administration of high sucrose diet by mechanisms that include BATF3-dependent hepatic cDC1 regulation of inflammatory cell influx and lipid metabolism (94). Furthermore, BATF3 expression has been reported in other cell types, including regulatory T cells, CD4+ TH9, and CD8+ T cells (95–98). In addition to Batf3-/- mice, we also examined Irf8-/- mice as a genetic model lacking cDC1. Irf8-/- mice did not develop metabolic syndrome and we did not observe any deficiency in enteroid formation, most likely because the defects in enteroid formations in Batf3-/- mice are driven by metabolic changes including hyperglycemia. The additional lack of monocytes/macrophages in Irf8-/- mice most likely contributes to a different microbiota compared to Batf3-/- mice which only lack cDC1.
A recent study investigated the role of BATF3 and cDC1s in the regulation of adipose tissue homeostasis (99). The authors demonstrate that the abundance of cDC1s in visceral fat tissue is reduced in HFD fed mice and that BATF3-deficiency and the loss of cDC1 results in the development of obesity during ageing. Mechanistically, BATF3-deficiency caused adipose tissue inflammation characterized by an increase in M1-like adipose tissue macrophages and TNFα expression and a decrease of invariant NKT (iNKT) cells that precedes the development of obesity. Treatment with FLT3L, which leads to the expansion of cDC1 but also to a lesser degree of cDC2 in adipose tissue, reduced weight gain, hyperlipidemia, and increased the abundance of iNKT cells. Depletion of iNKT cells in the context of FLT3L treatment resulted in a loss of the protective effects. These data suggest, that the cDC1-iNKT cell axis controls adipose tissue homeostasis.
In summary, we demonstrate that BATF3 plays a protective role in the development of metabolic syndrome by mechanisms involving the intestinal microbiome, regulation of intestinal epithelial cell homeostasis, and prevention of low-grade intestinal inflammation.
The original contributions presented in the study are publicly available. This data can be found here: ENA, PRJEB50182.
The animal study was reviewed and approved by Cedars-Sinai Medical Center Animal Care and Use Committee.
Conceptualization, HH and KM; Methodology, HH and KM; Investigation, HH, JS, DS, SM, LT, AB, NL, SC, BS, YS, and HG; Writing – Original Draft, HH and KM; Writing – Review & Editing, HH, ST, and KM; Funding Acquisition, ST and KM. All authors contributed to the article and approved the submitted version.
This work was supported by the F. Widjaja Foundation (ST and KM) and the UCSD/UCLA DRC Pilot grant to KM (P30 DK063491). DS received a Student Research Award by the Crohn’s and Colitis Foundation of America. NL received funding from Sorbonne University Paris (Master Integrative Biology and Physiology), Direction des Relations Internationales and from the “CROUS”.
The authors declare that the research was conducted in the absence of any commercial or financial relationships that could be construed as a potential conflict of interest.
All claims expressed in this article are solely those of the authors and do not necessarily represent those of their affiliated organizations, or those of the publisher, the editors and the reviewers. Any product that may be evaluated in this article, or claim that may be made by its manufacturer, is not guaranteed or endorsed by the publisher.
The authors would like to thank the Cedars-Sinai Medical Center Flow Cytometry Core, the Light Microscopy and Image Analytics Division within the Cedars-Sinai Cancer Biobank and Translational Research Core, and the UCLA Microbiome core.
The Supplementary Material for this article can be found online at: https://www.frontiersin.org/articles/10.3389/fimmu.2022.841065/full#supplementary-material
1. Hales CM, Carroll MD, Fryar CD, Ogden CL. Prevalence of Obesity Among Adults and Youth: United States, 2015-2016. NCHS Data Brief (2017) (288):1–8.
2. Ng M, Fleming T, Robinson M, Thomson B, Graetz N, Margono C, et al. Global, Regional, and National Prevalence of Overweight and Obesity in Children and Adults During 1980-2013: A Systematic Analysis for the Global Burden of Disease Study 2013. Lancet (2014) 384:766–81. doi: 10.1016/S0140-6736(14)60460-8
3. Fabbrini E, Sullivan S, Klein S. Obesity and Nonalcoholic Fatty Liver Disease: Biochemical, Metabolic, and Clinical Implications. Hepatology (2010) 51:679–89. doi: 10.1002/hep.23280
4. Kahn CR, Wang G, Lee KY. Altered Adipose Tissue and Adipocyte Function in the Pathogenesis of Metabolic Syndrome. J Clin Invest (2019) 129:3990–4000. doi: 10.1172/JCI129187
5. Lega IC, Lipscombe LL. Review: Diabetes, Obesity and Cancer - Pathophysiology and Clinical Implications. Endocr Rev (2019) 41:33–52. doi: 10.1210/endrev/bnz014
6. Molendijk J, Robinson H, Djuric Z, Hill MM. Lipid Mechanisms in Hallmarks of Cancer. Mol Omics (2019) 16:6–18. doi: 10.1039/C9MO00128J
7. Mongraw-Chaffin M, Foster MC, Anderson CAM, Burke GL, Haq N, Kalyani RR, et al. Metabolically Healthy Obesity, Transition to Metabolic Syndrome, and Cardiovascular Risk. J Am Coll Cardiol (2018) 71:1857–65. doi: 10.1016/j.jacc.2018.02.055
8. Stefan N, Schick F, Haring HU. Causes, Characteristics, and Consequences of Metabolically Unhealthy Normal Weight in Humans. Cell Metab (2017) 26:292–300. doi: 10.1016/j.cmet.2017.07.008
9. Saklayen MG. The Global Epidemic of the Metabolic Syndrome. Curr Hypertens Rep (2018) 20:12. doi: 10.1007/s11906-018-0812-z
10. Brestoff JR, Artis D. Immune Regulation of Metabolic Homeostasis in Health and Disease. Cell (2015) 161:146–60. doi: 10.1016/j.cell.2015.02.022
11. Brown AE, Walker M. Genetics of Insulin Resistance and the Metabolic Syndrome. Curr Cardiol Rep (2016) 18:75. doi: 10.1007/s11886-016-0755-4
12. Dabke K, Hendrick G, Devkota S. The Gut Microbiome and Metabolic Syndrome. J Clin Invest (2019) 129:4050–7. doi: 10.1172/JCI129194
13. Lazar V, Ditu LM, Pircalabioru GG, Picu A, Petcu L, Cucu N, et al. Host Organism, and Diet Trialogue in Diabetes and Obesity. Front Nutr (2019) 6:21. doi: 10.3389/fnut.2019.00021
14. Lu P, Sodhi CP, Yamaguchi Y, Jia H, Prindle T Jr., Fulton WB, et al. Intestinal Epithelial Toll-Like Receptor 4 Prevents Metabolic Syndrome by Regulating Interactions Between Microbes and Intestinal Epithelial Cells in Mice. Mucosal Immunol (2018) 11:727–40. doi: 10.1038/mi.2017.114
15. Vijay-Kumar M, Aitken JD, Carvalho FA, Cullender TC, Mwangi S, Srinivasan S, et al. Metabolic Syndrome and Altered Gut Microbiota in Mice Lacking Toll-Like Receptor 5. Science (2010) 328:228–31. doi: 10.1126/science.1179721
16. Winer DA, Luck H, Tsai S, Winer S. The Intestinal Immune System in Obesity and Insulin Resistance. Cell Metab (2016) 23:413–26. doi: 10.1016/j.cmet.2016.01.003
17. Sonnenburg JL, Backhed F. Diet-Microbiota Interactions as Moderators of Human Metabolism. Nature (2016) 535:56–64. doi: 10.1038/nature18846
18. Amar J, Chabo C, Waget A, Klopp P, Vachoux C, Bermudez-Humaran LG, et al. Intestinal Mucosal Adherence and Translocation of Commensal Bacteria at the Early Onset of Type 2 Diabetes: Molecular Mechanisms and Probiotic Treatment. EMBO Mol Med (2011) 3:559–72. doi: 10.1002/emmm.201100159
19. Cani PD, Amar J, Iglesias MA, Poggi M, Knauf C, Bastelica D, et al. Metabolic Endotoxemia Initiates Obesity and Insulin Resistance. Diabetes (2007) 56:1761–72. doi: 10.2337/db06-1491
20. Cani PD, Bibiloni R, Knauf C, Waget A, Neyrinck AM, Delzenne NM, et al. Changes in Gut Microbiota Control Metabolic Endotoxemia-Induced Inflammation in High-Fat Diet-Induced Obesity and Diabetes in Mice. Diabetes (2008) 57:1470–81. doi: 10.2337/db07-1403
21. Ding S, Chi MM, Scull BP, Rigby R, Schwerbrock NM, Magness S, et al. High-Fat Diet: Bacteria Interactions Promote Intestinal Inflammation Which Precedes and Correlates With Obesity and Insulin Resistance in Mouse. PloS One (2010) 5:e12191. doi: 10.1371/journal.pone.0012191
22. Thaiss CA, Levy M, Grosheva I, Zheng D, Soffer E, Blacher E, et al. Hyperglycemia Drives Intestinal Barrier Dysfunction and Risk for Enteric Infection. Science (2018) 359:1376–83. doi: 10.1126/science.aar3318
23. Backhed F, Ding H, Wang T, Hooper LV, Koh GY, Nagy A, et al. The Gut Microbiota as an Environmental Factor That Regulates Fat Storage. Proc Natl Acad Sci USA (2004) 101:15718–23. doi: 10.1073/pnas.0407076101
24. Backhed F, Manchester JK, Semenkovich CF, Gordon JI. Mechanisms Underlying the Resistance to Diet-Induced Obesity in Germ-Free Mice. Proc Natl Acad Sci USA (2007) 104:979–84. doi: 10.1073/pnas.0605374104
25. Turnbaugh PJ, Ley RE, Mahowald MA, Magrini V, Mardis ER, Gordon JI. An Obesity-Associated Gut Microbiome With Increased Capacity for Energy Harvest. Nature (2006) 444:1027–31. doi: 10.1038/nature05414
26. Huus KE, Petersen C, Finlay BB. Diversity and Dynamism of IgA-Microbiota Interactions. Nat Rev Immunol (2021) 21:514–25. doi: 10.1038/s41577-021-00506-1
27. Kubinak JL, Petersen C, Stephens WZ, Soto R, Bake E, O'Connell RM, et al. MyD88 Signaling in T Cells Directs IgA-Mediated Control of the Microbiota to Promote Health. Cell Host Microbe (2015) 17:153–63. doi: 10.1016/j.chom.2014.12.009
28. Palm NW, de Zoete MR, Cullen TW, Barry NA, Stefanowski J, Hao L, et al. Immunoglobulin A Coating Identifies Colitogenic Bacteria in Inflammatory Bowel Disease. Cell (2014) 158:1000–10. doi: 10.1016/j.cell.2014.08.006
29. Petersen C, Bell R, Klag KA, Lee SH, Soto R, Ghazaryan A, et al. T Cell-Mediated Regulation of the Microbiota Protects Against Obesity. Science (2019) 365:340. doi: 10.1126/science.aat9351
30. Truax AD, Chen L, Tam JW, Cheng N, Guo H, Koblansky AA, et al. The Inhibitory Innate Immune Sensor NLRP12 Maintains a Threshold Against Obesity by Regulating Gut Microbiota Homeostasis. Cell Host Microbe (2018) 24:364–378 e6. doi: 10.1016/j.chom.2018.08.009
31. Chassaing B, Ley RE, Gewirtz AT. Intestinal Epithelial Cell Toll-Like Receptor 5 Regulates the Intestinal Microbiota to Prevent Low-Grade Inflammation and Metabolic Syndrome in Mice. Gastroenterology (2014) 147:1363–77 e17. doi: 10.1053/j.gastro.2014.08.033
32. Esterhazy D, Loschko J, London M, Jove V, Oliveira TY, Mucida D. Classical Dendritic Cells are Required for Dietary Antigen-Mediated Induction of Peripheral T(reg) Cells and Tolerance. Nat Immunol (2016) 17:545–55. doi: 10.1038/ni.3408
33. Joeris T, Muller-Luda K, Agace WW, Mowat AM. Diversity and Functions of Intestinal Mononuclear Phagocytes. Mucosal Immunol (2017) 10:845–64. doi: 10.1038/mi.2017.22
34. Scott CL, Aumeunier AM, Mowat AM. Intestinal CD103+ Dendritic Cells: Master Regulators of Tolerance? Trends Immunol (2011) 32:412–9. doi: 10.1016/j.it.2011.06.003
35. Steimle A, Frick JS. Molecular Mechanisms of Induction of Tolerant and Tolerogenic Intestinal Dendritic Cells in Mice. J Immunol Res (2016) 2016:1958650. doi: 10.1155/2016/1958650
36. Cerovic V, Bain CC, Mowat AM, Milling SW. Intestinal Macrophages and Dendritic Cells: What's the Difference? Trends Immunol (2014) 35:270–7. doi: 10.1016/j.it.2014.04.003
37. Cerovic V, Houston SA, Scott CL, Aumeunier A, Yrlid U, Mowat AM, et al. Intestinal CD103(-) Dendritic Cells Migrate in Lymph and Prime Effector T Cells. Mucosal Immunol (2013) 6:104–13. doi: 10.1038/mi.2012.53
38. Murphy TL, Grajales-Reyes GE, Wu X, Tussiwand R, Briseno CG, Iwata A, et al. Transcriptional Control of Dendritic Cell Development. Annu Rev Immunol (2016) 34:93–119. doi: 10.1146/annurev-immunol-032713-120204
39. Satpathy AT, Briseno CG, Lee JS, Ng D, Manieri NA, Kc W, et al. Notch2-Dependent Classical Dendritic Cells Orchestrate Intestinal Immunity to Attaching-and-Effacing Bacterial Pathogens. Nat Immunol (2013) 14:937–48. doi: 10.1038/ni.2679
40. Scott CL, Bain CC, Wright PB, Sichien D, Kotarsky K, Persson EK, et al. CCR2(+)CD103(-) Intestinal Dendritic Cells Develop From DC-Committed Precursors and Induce Interleukin-17 Production by T Cells. Mucosal Immunol (2015) 8:327–39. doi: 10.1038/mi.2014.70
41. Jackson JT, Hu Y, Liu R, Masson F, D'Amico A, Carotta S, et al. Id2 Expression Delineates Differential Checkpoints in the Genetic Program of CD8alpha+ and CD103+ Dendritic Cell Lineages. EMBO J (2011) 30:2690–704. doi: 10.1038/emboj.2011.163
42. Watowich SS, Liu YJ. Mechanisms Regulating Dendritic Cell Specification and Development. Immunol Rev (2010) 238:76–92. doi: 10.1111/j.1600-065X.2010.00949.x
43. Edelson BT, Kc W, Juang R, Kohyama M, Benoit LA, Klekotka PA, et al. Peripheral CD103+ Dendritic Cells Form a Unified Subset Developmentally Related to CD8alpha+ Conventional Dendritic Cells. J Exp Med (2010) 207:823–36. doi: 10.1084/jem.20091627
44. Ginhoux F, Liu K, Helft J, Bogunovic M, Greter M, Hashimoto D, et al. The Origin and Development of Nonlymphoid Tissue CD103+ DCs. J Exp Med (2009) 206:3115–30. doi: 10.1084/jem.20091756
45. Hildner K, Edelson BT, Purtha WE, Diamond M, Matsushita H, Kohyama M, et al. Batf3 Deficiency Reveals a Critical Role for CD8alpha+ Dendritic Cells in Cytotoxic T Cell Immunity. Science (2008) 322:1097–100. doi: 10.1126/science.1164206
46. Matthews DR, Hosker JP, Rudenski AS, Naylor BA, Treacher DF, Turner RC. Homeostasis Model Assessment: Insulin Resistance and Beta-Cell Function From Fasting Plasma Glucose and Insulin Concentrations in Man. Diabetologia (1985) 28:412–9. doi: 10.1007/BF00280883
47. Rakoff-Nahoum S, Paglino J, Eslami-Varzaneh F, Edberg S, Medzhitov R. Recognition of Commensal Microflora by Toll-Like Receptors is Required for Intestinal Homeostasis. Cell (2004) 118:229–41. doi: 10.1016/j.cell.2004.07.002
48. Xiao H, Gulen MF, Qin J, Yao J, Bulek K, Kish D, et al. The Toll-Interleukin-1 Receptor Member SIGIRR Regulates Colonic Epithelial Homeostasis, Inflammation, and Tumorigenesis. Immunity (2007) 26:461–75. doi: 10.1016/j.immuni.2007.02.012
49. Wang A, Huen SC, Luan HH, Yu S, Zhang C, Gallezot JD, et al. Opposing Effects of Fasting Metabolism on Tissue Tolerance in Bacterial and Viral Inflammation. Cell (2016) 166:1512–1525 e12. doi: 10.1016/j.cell.2016.07.026
50. Weigmann B, Tubbe I, Seidel D, Nicolaev A, Becker C, Neurath MF. Isolation and Subsequent Analysis of Murine Lamina Propria Mononuclear Cells From Colonic Tissue. Nat Protoc (2007) 2:2307–11. doi: 10.1038/nprot.2007.315
51. Parlee SD, Lentz SI, Mori H, MacDougald OA. Quantifying Size and Number of Adipocytes in Adipose Tissue. Methods Enzymol (2014) 537:93–122. doi: 10.1016/B978-0-12-411619-1.00006-9
52. Ungaro R, Fukata M, Hsu D, Hernandez Y, Breglio K, Chen A, et al. A Novel Toll-Like Receptor 4 Antagonist Antibody Ameliorates Inflammation But Impairs Mucosal Healing in Murine Colitis. Am J Physiol Gastrointest Liver Physiol (2009) 296:G1167–79. doi: 10.1152/ajpgi.90496.2008
53. Dekkers JF, Alieva M, Wellens LM, Ariese HCR, Jamieson PR, Vonk AM, et al. High-Resolution 3D Imaging of Fixed and Cleared Organoids. Nat Protoc (2019) 14:1756–71. doi: 10.1038/s41596-019-0160-8
54. Callahan BJ, McMurdie PJ, Rosen MJ, Han AW, Johnson AJ, Holmes SP. DADA2: High-Resolution Sample Inference From Illumina Amplicon Data. Nat Methods (2016) 13:581–3. doi: 10.1038/nmeth.3869
55. Sato T, Vries RG, Snippert HJ, van de Wetering M, Barker N, Stange DE, et al. Single Lgr5 Stem Cells Build Crypt-Villus Structures In Vitro Without a Mesenchymal Niche. Nature (2009) 459:262–5. doi: 10.1038/nature07935
56. Love MI, Huber W, Anders S. Moderated Estimation of Fold Change and Dispersion for RNA-Seq Data With Deseq2. Genome Biol (2014) 15:550. doi: 10.1186/s13059-014-0550-8
57. Storey JD, Tibshirani R. Statistical Significance for Genomewide Studies. Proc Natl Acad Sci USA (2003) 100:9440–5. doi: 10.1073/pnas.1530509100
58. Ahmad R, Rah B, Bastola D, Dhawan P, Singh AB. Obesity-Induces Organ and Tissue Specific Tight Junction Restructuring and Barrier Deregulation by Claudin Switching. Sci Rep (2017) 7:5125. doi: 10.1038/s41598-017-04989-8
59. Almeqdadi M, Mana MD, Roper J, Yilmaz OH. Gut Organoids: Mini-Tissues in Culture to Study Intestinal Physiology and Disease. Am J Physiol Cell Physiol (2019) 317:C405–19. doi: 10.1152/ajpcell.00300.2017
60. Schiavoni G, Mattei F, Sestili P, Borghi P, Venditti M, Morse HC 3rd., et al. ICSBP is Essential for the Development of Mouse Type I Interferon-Producing Cells and for the Generation and Activation of CD8alpha(+) Dendritic Cells. J Exp Med (2002) 196:1415–25. doi: 10.1084/jem.20021263
61. Tussiwand R, Lee WL, Murphy TL, Mashayekhi M, Kc W, Albring JC, et al. Compensatory Dendritic Cell Development Mediated by BATF-IRF Interactions. Nature (2012) 490:502–7. doi: 10.1038/nature11531
62. Ussar S, Griffin NW, Bezy O, Fujisaka S, Vienberg S, Softic S, et al. Interactions Between Gut Microbiota, Host Genetics and Diet Modulate the Predisposition to Obesity and Metabolic Syndrome. Cell Metab (2015) 22:516–30. doi: 10.1016/j.cmet.2015.07.007
63. Le Chatelier E, Nielsen T, Qin J, Prifti E, Hildebrand F, Falony G, et al. Richness of Human Gut Microbiome Correlates With Metabolic Markers. Nature (2013) 500:541–6. doi: 10.1038/nature12506
64. Cox LM, Yamanishi S, Sohn J, Alekseyenko AV, Leung JM, Cho I, et al. Altering the Intestinal Microbiota During a Critical Developmental Window has Lasting Metabolic Consequences. Cell (2014) 158:705–21. doi: 10.1016/j.cell.2014.05.052
65. Everard A, Belzer C, Geurts L, Ouwerkerk JP, Druart C, Bindels LB, et al. Cross-Talk Between Akkermansia Muciniphila and Intestinal Epithelium Controls Diet-Induced Obesity. Proc Natl Acad Sci USA (2013) 110:9066–71. doi: 10.1073/pnas.1219451110
66. Karlsson CL, Onnerfalt J, Xu J, Molin G, Ahrne S, Thorngren-Jerneck K. The Microbiota of the Gut in Preschool Children With Normal and Excessive Body Weight. Obes (Silver Spring) (2012) 20:2257–61. doi: 10.1038/oby.2012.110
67. Remely M, Tesar I, Hippe B, Gnauer S, Rust P, Haslberger AG. Gut Microbiota Composition Correlates With Changes in Body Fat Content Due to Weight Loss. Benef Microbes (2015) 6:431–9. doi: 10.3920/BM2014.0104
68. Santacruz A, Collado MC, Garcia-Valdes L, Segura MT, Martin-Lagos JA, Anjos T, et al. Gut Microbiota Composition is Associated With Body Weight, Weight Gain and Biochemical Parameters in Pregnant Women. Br J Nutr (2010) 104:83–92. doi: 10.1017/S0007114510000176
69. Tremaroli V, Backhed F. Functional Interactions Between the Gut Microbiota and Host Metabolism. Nature (2012) 489:242–9. doi: 10.1038/nature11552
70. Denning TL, Norris BA, Medina-Contreras O, Manicassamy S, Geem D, Madan R, et al. Functional Specializations of Intestinal Dendritic Cell and Macrophage Subsets That Control Th17 and Regulatory T Cell Responses are Dependent on the T Cell/APC Ratio, Source of Mouse Strain, and Regional Localization. J Immunol (2011) 187:733–47. doi: 10.4049/jimmunol.1002701
71. Glass CK, Olefsky JM. Inflammation and Lipid Signaling in the Etiology of Insulin Resistance. Cell Metab (2012) 15:635–45. doi: 10.1016/j.cmet.2012.04.001
72. Castoldi A, Naffah de Souza C, Camara NO, Moraes-Vieira PM. The Macrophage Switch in Obesity Development. Front Immunol (2015) 6:637. doi: 10.3389/fimmu.2015.00637
73. Monteiro-Sepulveda M, Touch S, Mendes-Sa C, Andre S, Poitou C, Allatif O, et al. Jejunal T Cell Inflammation in Human Obesity Correlates With Decreased Enterocyte Insulin Signaling. Cell Metab (2015) 22:113–24. doi: 10.1016/j.cmet.2015.05.020
74. Patsouris D, Li PP, Thapar D, Chapman J, Olefsky JM, Neels JG. Ablation of CD11c-Positive Cells Normalizes Insulin Sensitivity in Obese Insulin Resistant Animals. Cell Metab (2008) 8:301–9. doi: 10.1016/j.cmet.2008.08.015
75. Luck H, Khan S, Kim JH, Copeland JK, Revelo XS, Tsai S, et al. Gut-Associated IgA(+) Immune Cells Regulate Obesity-Related Insulin Resistance. Nat Commun (2019) 10:3650. doi: 10.1038/s41467-019-11370-y
76. Bouter KE, van Raalte DH, Groen AK, Nieuwdorp M. Role of the Gut Microbiome in the Pathogenesis of Obesity and Obesity-Related Metabolic Dysfunction. Gastroenterology (2017) 152:1671–8. doi: 10.1053/j.gastro.2016.12.048
77. Stienstra R, Joosten LA, Koenen T, van Tits B, van Diepen JA, van den Berg SA, et al. The Inflammasome-Mediated Caspase-1 Activation Controls Adipocyte Differentiation and Insulin Sensitivity. Cell Metab (2010) 12:593–605. doi: 10.1016/j.cmet.2010.11.011
78. Stienstra R, van Diepen JA, Tack CJ, Zaki MH, van de Veerdonk FL, Perera D, et al. Inflammasome Is a Central Player in the Induction of Obesity and Insulin Resistance. Proc Natl Acad Sci USA (2011) 108:15324–9. doi: 10.1073/pnas.1100255108
79. Thingholm LB, Ruhlemann MC, Koch M, Fuqua B, Laucke G, Boehm R, et al. Obese Individuals With and Without Type 2 Diabetes Show Different Gut Microbial Functional Capacity and Composition. Cell Host Microbe (2019) 26:252–264 e10. doi: 10.1016/j.chom.2019.07.004
80. Dao MC, Everard A, Aron-Wisnewsky J, Sokolovska N, Prifti E, Verger EO, et al. Akkermansia Muciniphila and Improved Metabolic Health During a Dietary Intervention in Obesity: Relationship With Gut Microbiome Richness and Ecology. Gut (2016) 65:426–36. doi: 10.1136/gutjnl-2014-308778
81. Depommier C, Everard A, Druart C, Plovier H, Van Hul M, Vieira-Silva S, et al. Supplementation With Akkermansia Muciniphila in Overweight and Obese Human Volunteers: A Proof-of-Concept Exploratory Study. Nat Med (2019) 25:1096–103. doi: 10.1038/s41591-019-0495-2
82. Shin NR, Lee JC, Lee HY, Kim MS, Whon TW, Lee MS, et al. An Increase in the Akkermansia Spp. Population Induced by Metformin Treatment Improves Glucose Homeostasis in Diet-Induced Obese Mice. Gut (2014) 63:727–35. doi: 10.1136/gutjnl-2012-303839
83. Ashrafian F, Behrouzi A, Shahriary A, Ahmadi Badi S, Davari M, Khatami S, et al. Comparative Study of Effect of Akkermansia Muciniphila and its Extracellular Vesicles on Toll-Like Receptors and Tight Junction. Gastroenterol Hepatol Bed Bench (2019) 12:163–8.
84. Chelakkot C, Choi Y, Kim DK, Park HT, Ghim J, Kwon Y, et al. Akkermansia Muciniphila-Derived Extracellular Vesicles Influence Gut Permeability Through the Regulation of Tight Junctions. Exp Mol Med (2018) 50:e450. doi: 10.1038/emm.2017.282
85. Horiuchi H, Kamikado K, Aoki R, Suganuma N, Nishijima T, Nakatani A, et al. Bifidobacterium Animalis Subsp. Lactis GCL2505 Modulates Host Energy Metabolism via the Short-Chain Fatty Acid Receptor GPR43. Sci Rep (2020) 10:4158. doi: 10.1038/s41598-020-60984-6
86. Huo Y, Lu X, Wang X, Wang X, Chen L, Guo H, et al. Bifidobacterium Animalis Subsp. Lactis A6 Alleviates Obesity Associated With Promoting Mitochondrial Biogenesis and Function of Adipose Tissue in Mice. Molecules (2020) 25:1–18. doi: 10.3390/molecules25071490
87. Stenman LK, Waget A, Garret C, Klopp P, Burcelin R, Lahtinen S. Potential Probiotic Bifidobacterium Animalis Ssp. Lactis 420 Prevents Weight Gain and Glucose Intolerance in Diet-Induced Obese Mice. Benef Microbes (2014) 5:437–45. doi: 10.3920/BM2014.0014
88. Herp S, Brugiroux S, Garzetti D, Ring D, Jochum LM, Beutler M, et al. Mucispirillum Schaedleri Antagonizes Salmonella Virulence to Protect Mice Against Colitis. Cell Host Microbe (2019) 25:681–694 e8. doi: 10.1016/j.chom.2019.03.004
89. Singh S, Dulai PS, Zarrinpar A, Ramamoorthy S, Sandborn WJ. Obesity in IBD: Epidemiology, Pathogenesis, Disease Course and Treatment Outcomes. Nat Rev Gastroenterol Hepatol (2017) 14:110–21. doi: 10.1038/nrgastro.2016.181
90. Lin Y, Cheng L, Liu Y, Wang Y, Wang Q, Wang HL, et al. Intestinal Epithelium-Derived BATF3 Promotes Colitis-Associated Colon Cancer Through Facilitating CXCL5-Mediated Neutrophils Recruitment. Mucosal Immunol (2021) 14:187–98. doi: 10.1038/s41385-020-0297-3
91. Kraiczy J, Nayak KM, Howell KJ, Ross A, Forbester J, Salvestrini C, et al. DNA Methylation Defines Regional Identity of Human Intestinal Epithelial Organoids and Undergoes Dynamic Changes During Development. Gut (2019) 68:49–61. doi: 10.1136/gutjnl-2017-314817
92. Sarvestani SK, Signs S, Hu B, Yeu Y, Feng H, Ni Y, et al. Induced Organoids Derived From Patients With Ulcerative Colitis Recapitulate Colitic Reactivity. Nat Commun (2021) 12:262. doi: 10.1038/s41467-020-20351-5
93. Zachos NC, Kovbasnjuk O, Foulke-Abel J, In J, Blutt SE, de Jonge HR, et al. Human Enteroids/Colonoids and Intestinal Organoids Functionally Recapitulate Normal Intestinal Physiology and Pathophysiology. J Biol Chem (2016) 291:3759–66. doi: 10.1074/jbc.R114.635995
94. Heier EC, Meier A, Julich-Haertel H, Djudjaj S, Rau M, Tschernig T, et al. Murine CD103(+) Dendritic Cells Protect Against Steatosis Progression Towards Steatohepatitis. J Hepatol (2017) 66:1241–50. doi: 10.1016/j.jhep.2017.01.008
95. Ataide MA, Komander K, Knopper K, Peters AE, Wu H, Eickhoff S, et al. BATF3 Programs CD8(+) T Cell Memory. Nat Immunol (2020) 21:1397–407. doi: 10.1038/s41590-020-0786-2
96. Lee W, Kim HS, Hwang SS, Lee GR. The Transcription Factor Batf3 Inhibits the Differentiation of Regulatory T Cells in the Periphery. Exp Mol Med (2017) 49:e393. doi: 10.1038/emm.2017.157
97. Qiu Z, Khairallah C, Romanov G, Sheridan BS. Cutting Edge: Batf3 Expression by CD8 T Cells Critically Regulates the Development of Memory Populations. J Immunol (2020) 205:901–6. doi: 10.4049/jimmunol.2000228
98. Tsuda M, Hamade H, Thomas LS, Salumbides BC, Potdar AA, Wong MH, et al. A Role for BATF3 in TH9 Differentiation and T-Cell-Driven Mucosal Pathologies. Mucosal Immunol (2019) 12:644–55. doi: 10.1038/s41385-018-0122-4
Keywords: Metabolic syndrome, intestinal dendritic cells, intestinal permeability, mucosal immunity, BATF3, colitis, hyperglycemia, microbiota
Citation: Hamade H, Stamps JT, Stamps DT, More SK, Thomas LS, Blackwood AY, Lahcene NL, Castanon SL, Salumbides BC, Shimodaira Y, Goodridge HS, Targan SR and Michelsen KS (2022) BATF3 Protects Against Metabolic Syndrome and Maintains Intestinal Epithelial Homeostasis. Front. Immunol. 13:841065. doi: 10.3389/fimmu.2022.841065
Received: 21 December 2021; Accepted: 23 May 2022;
Published: 22 June 2022.
Edited by:
Silvia Melgar, University College Cork, IrelandReviewed by:
Graham J. Britton, Icahn School of Medicine at Mount Sinai, United StatesCopyright © 2022 Hamade, Stamps, Stamps, More, Thomas, Blackwood, Lahcene, Castanon, Salumbides, Shimodaira, Goodridge, Targan and Michelsen. This is an open-access article distributed under the terms of the Creative Commons Attribution License (CC BY). The use, distribution or reproduction in other forums is permitted, provided the original author(s) and the copyright owner(s) are credited and that the original publication in this journal is cited, in accordance with accepted academic practice. No use, distribution or reproduction is permitted which does not comply with these terms.
*Correspondence: Kathrin S. Michelsen, a2F0aHJpbi5taWNoZWxzZW5AY3Nocy5vcmc=
†Present address: Yosuke Shimodaira, Akita University School of Medicine, Division of Gastroenterology, Akita, Japan
Disclaimer: All claims expressed in this article are solely those of the authors and do not necessarily represent those of their affiliated organizations, or those of the publisher, the editors and the reviewers. Any product that may be evaluated in this article or claim that may be made by its manufacturer is not guaranteed or endorsed by the publisher.
Research integrity at Frontiers
Learn more about the work of our research integrity team to safeguard the quality of each article we publish.