
94% of researchers rate our articles as excellent or good
Learn more about the work of our research integrity team to safeguard the quality of each article we publish.
Find out more
ORIGINAL RESEARCH article
Front. Immunol. , 28 January 2022
Sec. Autoimmune and Autoinflammatory Disorders
Volume 13 - 2022 | https://doi.org/10.3389/fimmu.2022.833636
 Gloria Yiu1,2
 Tue Kruse Rasmussen1,3,4Brandon L. Tsai5Vivian K. Diep1David J. Haddon1Jennifer Tsoi6Gopika D. Miller1
 Begoña Comin-Anduix6,7,8
 Bent Deleuran3,4
 Gay M. Crooks7,9,10,11
 Paul J. Utz1,12*
The establishment of an “interferon (IFN) signature” to subset SLE patients on disease severity has led to therapeutics targeting IFNα. Here, we investigate IFN signaling in SLE using multiplexed protein arrays and single cell cytometry by time of flight (CyTOF). First, the IFN signature for SLE patients (n=81) from the Stanford Lupus Registry is determined using fluidigm qPCR measuring 44 previously determined IFN-inducible transcripts. IFN-high (IFN-H) patients have increased SLE criteria and renal/CNS/immunologic involvement, and increased autoantibody reactivity against spliceosome-associated antigens. CyTOF analysis is performed on non-stimulated and stimulated (IFNα, IFNγ, IL-21) PBMCs from SLE patients (n=25) and HCs (n=9) in a panel identifying changes in phosphorylation of intracellular signaling proteins (pTOF). Another panel is utilized to detect changes in intracellular cytokine (ICTOF) production in non-stimulated and stimulated (PMA/ionomycin) PBMCs from SLE patients (n=31) and HCs (n=17). Bioinformatic analysis by MetaCyto and OMIQ reveal phenotypic changes in immune cell subsets between IFN-H and IFN-low (IFN-L) patients. Most notably, IFN-H patients exhibit increased STAT1/3/5 phosphorylation downstream of cytokine stimulation and increased phosphorylation of non-canonical STAT proteins. These results suggest that IFN signaling in SLE modulates STAT phosphorylation, potentially uncovering possible targets for future therapeutic approaches.
Systemic Lupus Erythematosus (SLE) is a chronic autoimmune disease that carries significant clinical burden for patients including organ damage and death (1–3). The disease is clinically characterized by periods of remission or flare involving inflammation in multiple organs, including skin, kidney, vasculature, and others. A hallmark of SLE is the production of antibodies against self-associated antigens, or autoantibodies. Elucidation of SLE pathogenesis and development of effective therapies is limited by both the clinical and biological heterogeneity seen in patients (4).
Multiple studies support a role for type I interferons, and IFNα, specifically, in SLE. Transcript profiling of peripheral blood mononuclear cells (PBMCs) (5) and immune cell subsets (6) from SLE patients demonstrate the presence of an IFNα-inducible gene expression signature in a subset of patients that correlates with clinical SLE criteria and autoantibody production (7). Recent single cell RNA-seq analysis of kidney biopsies from lupus nephritis (LN) patients reveals an IFN response signature in infiltrating immune cells that correlates with the same signature in the peripheral blood (8, 9). These studies establish the IFN signature as pathogenic in SLE and support its use to subset patients as IFN-high (IFN-H) or IFN-low (IFN-L). Because IFN-H patients demonstrate more severe disease manifestations, IFNα has become a therapeutic target in SLE. Consequently, fully humanized monoclonal antibodies against subunit 1 of the type I interferon receptor (IFNAR1), and its administration is associated with significantly reduced overall disease activity (BICLA) and corticosteroid use, and improved dermatitis (10). In August 2021, the Food and Drug Administration approved this class of treatment for moderate to severe SLE, marking only the third approved for SLE in the last 50 years (11, 12). How IFN signaling interacts with other immune pathways in SLE remains unclear.
In addition to IFNα, numerous other cytokines are dysregulated in SLE. Elevated levels of Type II IFN, IFNγ, have been reported in both murine and human SLE and is associated with more severe disease (13–15). Murine models of SLE, genetically modified to overexpress IFNγ (16) or receiving endogenous IFNγ (17) exhibit more severe organ specific disease that is reversible with IFNγ targeting. Urine proteomic profiling of LN patients have also demonstrated that patients with more severe kidney disease display chemokine profiles induced by IFNγ (18). Notably, type I IFNs like IFNα can activate natural killer (NK) cells cytotoxicity and IFNγ production, and 25% of IFNγ-inducible genes overlap with IFNα-inducible genes (19). Recent work has established the role of follicular helper T cells (Tfhs) in autoimmune diseases including SLE due to Tfh function in germinal centers (GC) (20) – a key site for antibody maturation and autoantibody production (21). Tfh cells produce high levels of IL-21, which is necessary for GC formation and Tfh differentiation (22). PBMCs isolated from SLE patients express higher levels of IL-21 compared to HCs (23), and peripheral follicular T helper cells are reportedly expanded in SLE patients and induce B cell differentiation into plasmablasts via IL-21 (24).
Many cytokines dysregulated in SLE including IFNα, IFNγ, and IL-21 signal via shared pathways involving the phosphorylation of Signal Transduction and Activators of Transcription (STAT) family members. Downstream of receptor ligation, Janus family tyrosine kinases (JAKs) proteins phosphorylate STATs leading to translocation to the nucleus and induction of gene programs crucial to immune function. STAT phosphorylation downstream of IFNα, IFNγ, or IL-21 receptor engagement is well described, where IFNα most frequently signals via pSTAT1/pSTAT2 (and to lesser degrees pSTAT3, pSTAT4, pSTAT5), IFNγ signals via a pSTAT1 homodimer, and IL-21 signals most frequently via pSTAT1/pSTAT3 (and to lesser degrees pSTAT5) (25–27). Phospho-specific flow cytometry is a well-established technique that can simultaneously quantify activation of multiple STAT proteins, in response to multiple cytokines and in various cell types. However, its flow cytometry foundations and consequent restrictions of fluorescence-based spectral overlap limit the multiplexing ability of phosphoflow. Technological advances have allowed scientists to design highly multiplexed panels to simultaneously measure more than 40 markers by using single cell mass cytometry by time-of-flight (CyTOF) (28). CyTOF is a hybrid mass spectrometer-flow cytometer that employs transition metal isotope reporters – not found in biological samples. This approach permits for the unprecedented single-cell analysis of surface markers and intracellularly functional proteins including STAT proteins. CyTOF’s capacity for high-resolution immunophenotyping makes it the ideal tool for understanding a complex disease like SLE, characterized by global dysregulation of numerous immune cell subsets, and signaling pathways.
Here we present a single-cell proteomic study of IFNα, IFNγ, and IL-21 signaling pathways in SLE patients stratified by the IFN signature. We find that IFN-H patients have more severe disease and increased levels of autoantibodies against spliceosome associated antigens compared to IFN-L patients. CyTOF analysis using established bioinformatic approaches identifies single cell differences in cellular phenotype, cytokine signaling and immune function between IFN-H and IFN-L patients. Utilizing this technology, we report increased phosphorylation of both common and less-common STAT proteins associated with IFN signature in SLE. This work sheds light on interactions between IFN signaling and other immunologically crucial pathways that signal via STAT proteins. These insights could hold implications on how IFNα inhibition could modulate other signaling pathways, thereby uncovering possible targets for future therapies.
Sourcing across five established studies (5, 6, 29–31), we have designed a consensus panel of 44 IFN-inducible transcripts (Supplementary Table 1) for profiling RNA from patients (n=81) in the Stanford SLE Registry (Table 1) and HCs (n=26). Each gene is normalized to the maximum value across all samples. A combined score is calculated by adding the values of all genes for each sample (Figure 1).
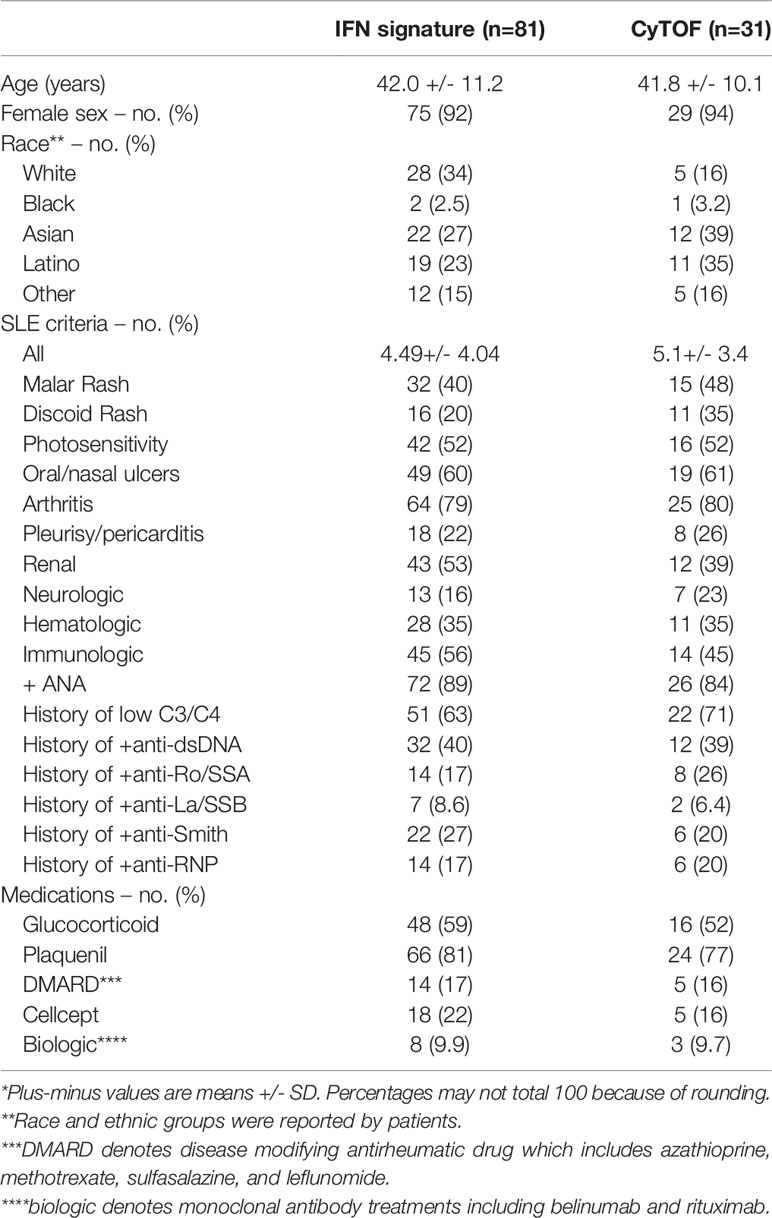
Table 1 Demographic and Patient characteristics of the patients*.
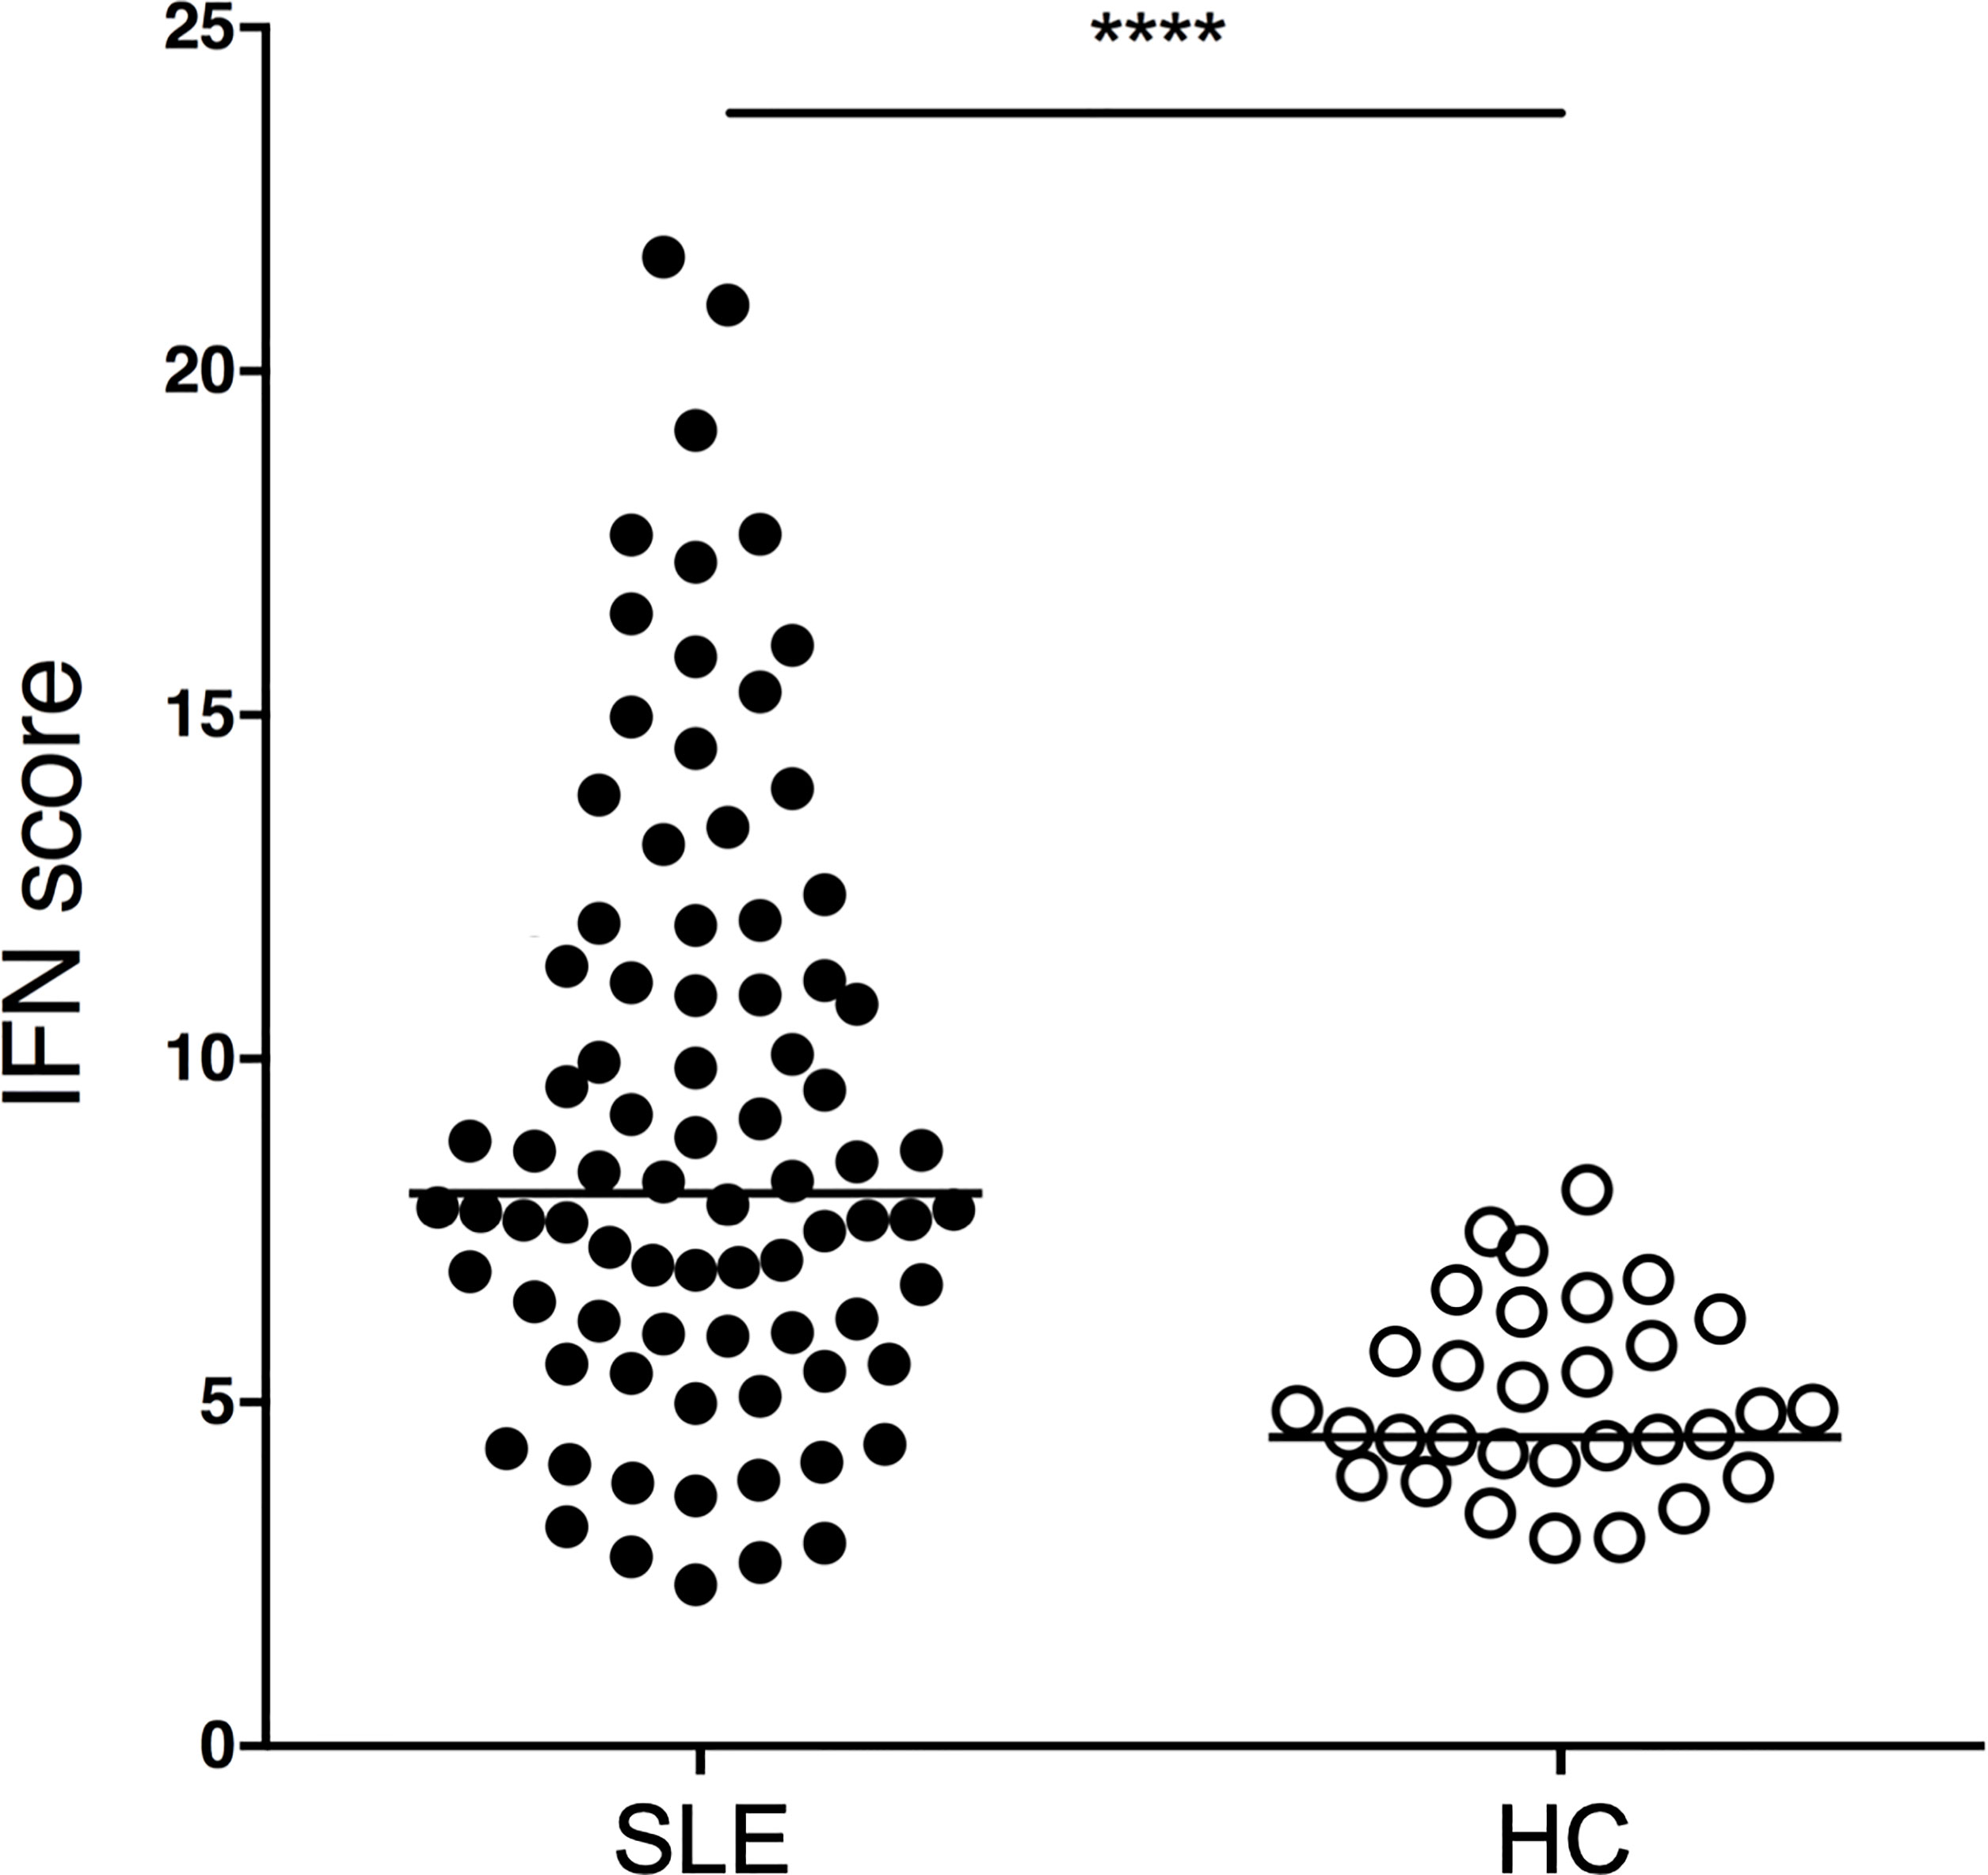
Figure 1 IFN scores of SLE patients and HCs. SLE patients (n=81) and HCs (n=31) were profiled for an IFN signature using the transcripts shown in Supplementary Table 1. p<0.0001. P value was determined by Mann-Whitney test. SLE patients had a median IFN biosignature of 8.0 (IQR 5.9-11.5) while HCs had a median of 4.5 (IQR 4.0-5.5).
SLE patients exhibit significantly higher IFN scores as compared to HCs. (p<0.0001, Mann-Whitney). SLE patients have a median IFN signature of 8.0 (IQR 5.9-11.5) while HCs have a median of 4.5 (IQR 4.0-5.5). The IFN signature is calculated using our consensus panel and shows excellent correlation to two other published interferon signature scores (rho=0.98, p<0.0001 and rho=0.92, p<0.0001, respectively) (Supplementary Figure 1). Using our consensus IFN signature, SLE patients are subsetted as IFN-H (upper quartile) and IFN-L (lower quartile).
To determine the relevance of interferon signature to clinical manifestations in the Stanford SLE cohort, a retrospective chart review is performed on unique patients (n=42) by a senior rheumatology fellow (GDM) who is blinded to the IFN signature status of each patient. The review extracts 52 clinical parameters and medication regimens for patients for up to 5 years of clinical care.
IFN-H as compared to IFN-L patients exhibit significantly increased SLE disease manifestations as characterized by the SLE criteria (p=0.01) at the time of PBMC collection. IFN-H patients have a median of six SLE criteria and IFN-L patients have a median of four SLE criteria (Figure 2A). Increasing SLE score is also significantly and positively associated with SLE criteria, p=0.049 (Figure 2B). Furthermore, IFN-H patients have significantly increased frequency of organ and/or hematologic disease. These disease manifestations include increased frequency of renal, neurological or immunologic involvement (Figure 2C). Renal disease is defined as 24 hr urine protein representing >= 500 mg of protein/24-hour, red blood cell casts, or biopsy proven LN. Neurological disease is defined as psychosis, seizure or cerebritis. Immunologic involvement is defined as dsDNA+ or Sm+.
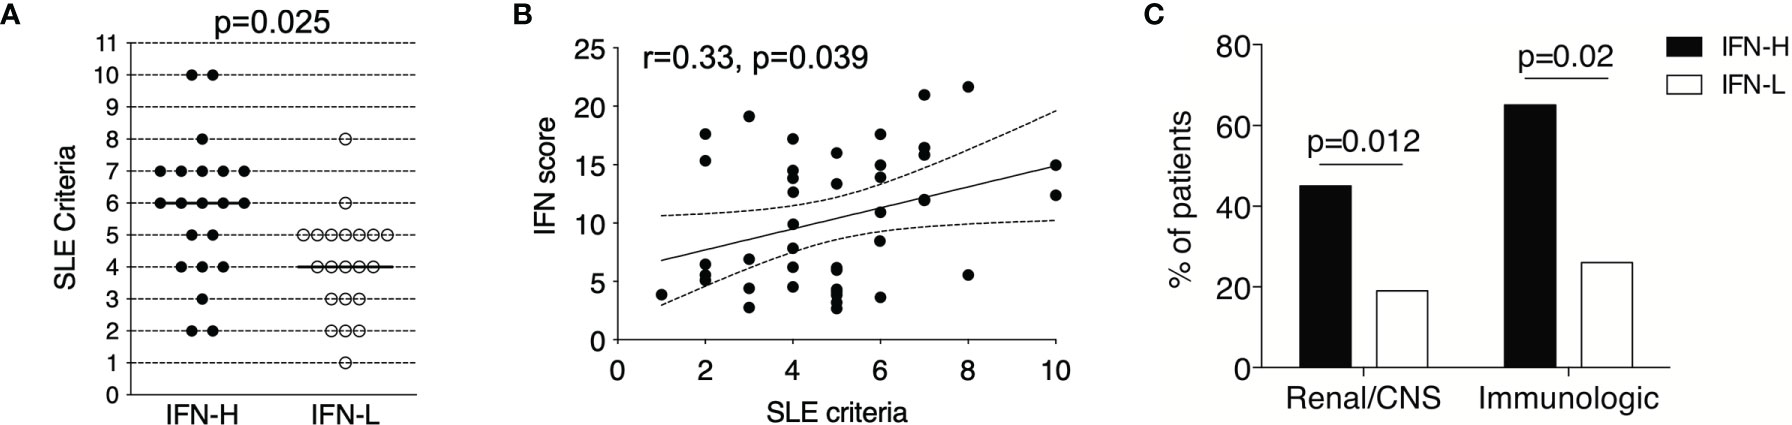
Figure 2 (A-C) IFN signature in SLE patients is associated with more severe clinical manifestations. (A) IFN-H (n=21) patients exhibited significantly increased SLE criteria as compared to IFN- L (n=21) patients (p=0.025), where IFN-H patients had a median of 6 SLE criteria and IFN-L patients had a median of 4 SLE criteria. Criteria used followed the 1982 American College of Rheumatology SLE revision. P values determined by Mann-Whitney test. (B) IFN score and SLE criteria are significantly positively associated by Spearman regression analysis (r=0.33, p=0.049). 95% confidence interval is indicated by dashed lines. (C) IFN-H patients exhibit significantly higher percentage of renal (proteinuria and/or biopsy-proven LN) or central nervous system (CNS=central nervous system as defined as seizure, psychosis, and/or cerebritis), p=0.012; and immunologic (immunologic as defined as dsDNA+ or Sm+) p=0.02, manifestations as compared to IFN-L patients. P values determined by Chi-Square test.
We employ protein microarrays to profile autoantibodies in HCs (n=20) and SLE patients (n=73) stratified by IFN signature. This method has been well-established by our lab for studying human (32–34) and murine SLE (35–37). The arrays contained 24 unique features that are known or putative autoantigens in SLE. Significance Analysis of Microarrays (SAM) algorithm determines antigens with statistically significant differences between groups of mice and a hierarchical clustering program groups individual subjects based on similar autoantibody profiles (38).
As expected, IgM and IgG autoantibody reactivity against SLE-associated autoantigens is increased in SLE patients as compared to HCs (Figure 3A). SAM identified 12 of these autoantibodies as significantly increased in SLE patients as compared to HCs. These include Ro/SSA, ssDNA, EBNA-1, spliceosome components U1-A, U1-C, U1-70 and Sm/RNP, Smith, dsDNA (plasmid) and histones.
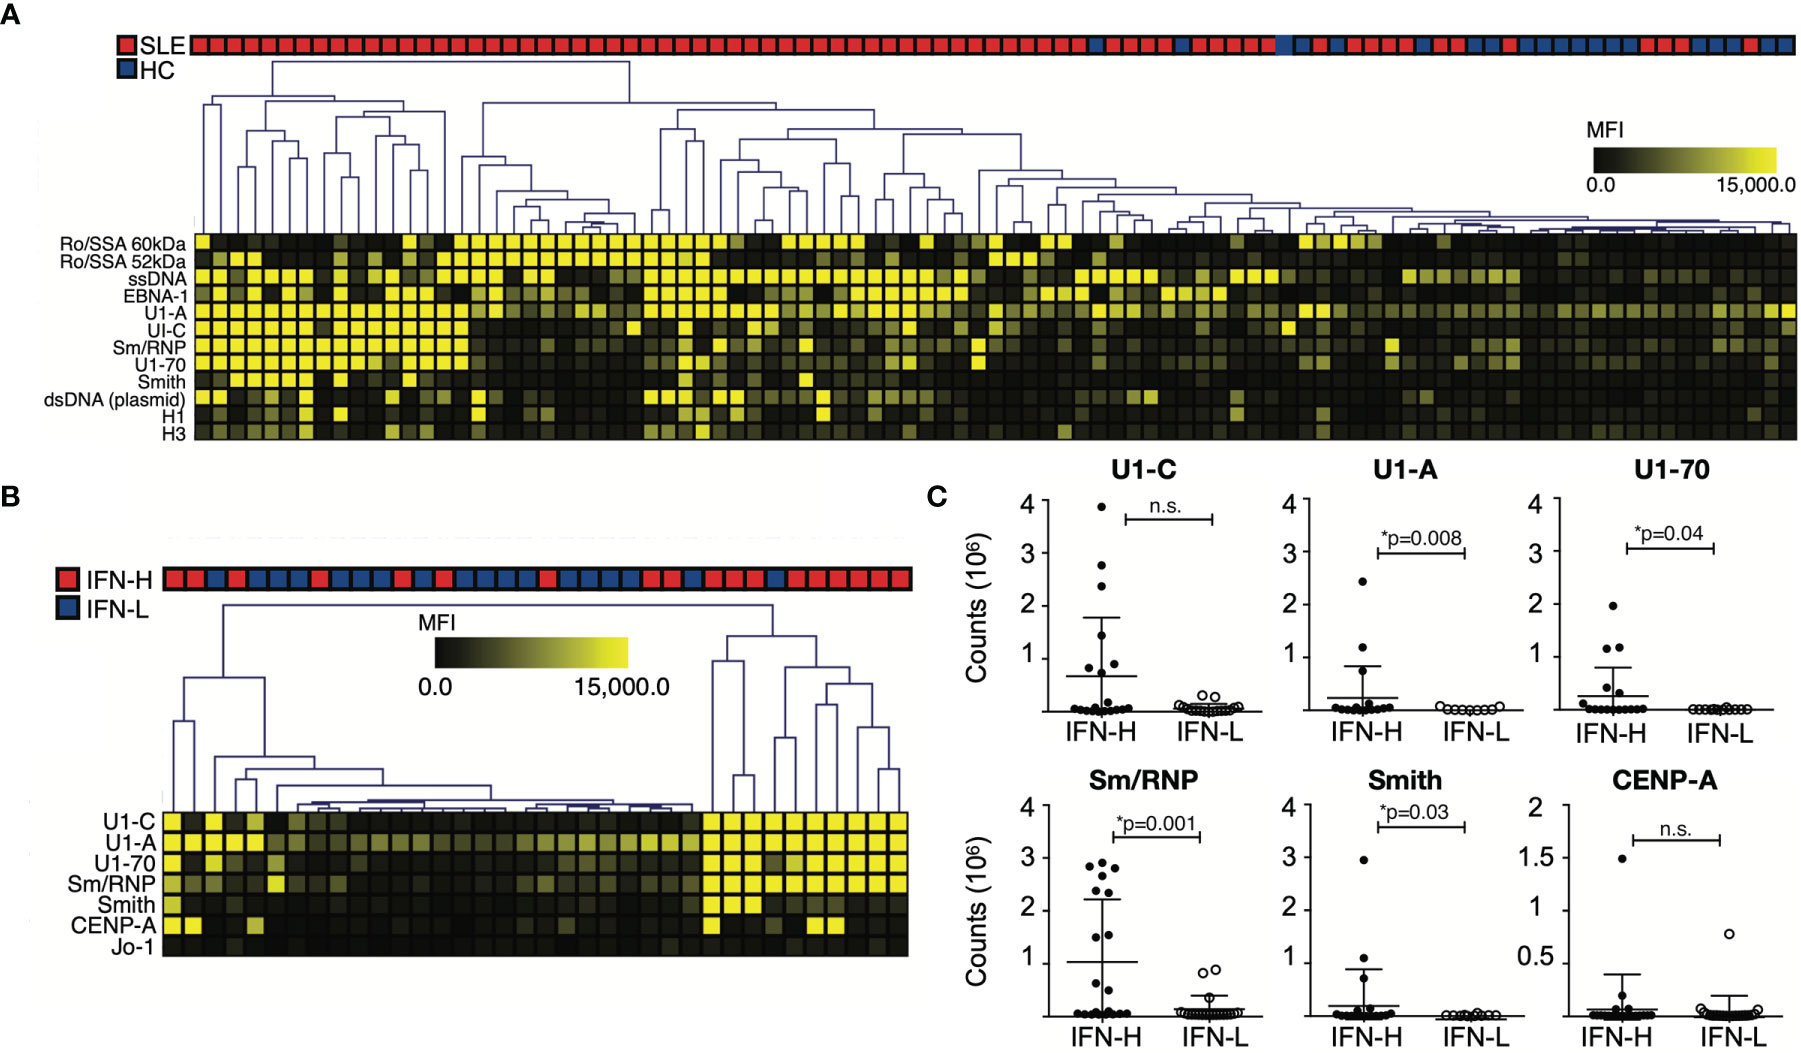
Figure 3 (A-C) IFN signature associated with increased autoantibody reactivity against known SLE-associated associated antigens. (A) Autoantibody profiling of SLE patients versus HCs. SLE patients exhibit increased autoantibody production against SLE-associated antigens. (B) SLE patients are stratified based on IFN signature. IFN-H patients exhibit increased autoantibody reactivity against spliceosome-associated antigens. (A, B) Individual autoantigen arrays were incubated with serum obtained from SLE patients or HCs. Color intensity of each grid in heatmap reflects mean fluorescence intensity (MFI). The SAM algorithm was used to determine antigen features with statistically significant differences in reactivity between sera derived from two groups. Hierarchical clustering of samples based on reactivity to antigens with statistically significant differences is displayed as a heatmap and dendrogram. (C) ELISA confirmation of SAM identified autoantibodies against antigens with statistically significant differences between IFN-H and IFN-L groups. Counts are calculated by subtracting BSA from average. U1-A, p=0.008; U1-70, p=0.04; Sm/RNP, p=0.001; Smith, p=0.03. IFN-H patients have increased autoantibody production against U1-C, though not statistically significant p=0.55. P values were determined by Mann-Whitney test. ns, not significant.
When comparing IFN-H to IFN-L patients, IFN-H patients exhibit increased autoantibody production predominantly against spliceosome components: U1-C, U1-A, U1-70, Sm/RNP in addition to, Smith, CENP-A and Jo-1 (Figure 3B). These significant array findings are validated using enzyme-linked immunosorbent assay (ELISA) (Figure 3C). Jo-1 is not validated because of low reactivity across both groups. Of the remaining six antigens, four are identified by ELISA to have significant differences between IFN-H (n=20) and IFN-L (n=20) patients (U1-A, p=0.008; U1-70, p=0.04; Sm/RNP, p=0.001; Smith, p=0.03). IFN-H patients have increased autoantibody production against U1-C, though not significant (p=0.55). Data for HC (n=3) not shown.
To understand global differences in immune cells and signaling between IFN-H and IFN-L patients, we have utilized two mass cytometry panels – one panel designed to detect changes in phosphorylation of intracellular signaling proteins (pTOF) and another panel to detect changes in intracellular cytokine (ICTOF) production (see Supplementary Table 2 for specific markers and panel design). For pTOF analysis, PBMCs from IFN-H (n=13), IFN-L (n=12) and HC (n=9) patients are stimulated with IFNα, IFNγ, IL-21 or unstimulated for 15 minutes then analyzed by mass cytometry. For ICTOF, PBMCs from IFN-H (n=15), IFN-L (n=16), and HC (n=17) patients are stimulated with phorbol myristate acetate (PMA) and ionomycin (ION) for 4 hours then analyzed by mass cytometry.
To evaluate immune cell subsets, unsupervised uniform manifold approximation and projection (UMAP) (39) and FlowSOM (40) algorithms are utilized in OMIQ (41). Our cluster analysis identified major immune cell subsets in both pTOF (Figure 4A) and ICTOF (Supplementary Figure 2B) panels. Clusters for pTOF panel identify T cells, B cells, NK cells, NKT cells, myeloid cells, and monocytes. As expected, cell subsets cluster analysis remains unchanged after 15-minute PBMCs stimulation with IFNα, IFNγ, or IL-21 (Supplementary Figure 2A). The abundance of B cells in IFN-H patients is higher as compared to IFN-L patients and HCs (Figure 4B). This finding is also replicated in analysis of the ICTOF panel (Supplementary Figure 2D). IFN-H patients also demonstrates lower NK cell abundance as compared to IFN-L and HCs. This result is not prominently seen in the ICTOF panel analysis. Differences in major cell populations between the two panels can be attributed to dissimilar surface markers utilized in pTOF and ICTOF panels that are necessary to accommodate functional markers available on different metals. Because our panels include more surface markers to distinguish T cell subsets, additional analysis is performed on only T cells for both pTOF (Figure 4C) and ICTOF (Supplementary Figure 2C) panels. Due to rarity of T regulatory (Tregs: CD25+CD127-), T follicular helper (Tfh: CXCR5+PD1+), and T helper 17 (CD45RA-IL17+) cell subsets, these subsets are manually gated in OMIQ. Analysis of pTOF T cells reveal a decreased abundance of Tregs in SLE patients as compared to HCs (Figure 4D), with no notable difference between IFN-H and IFN-L patients. This finding is also demonstrated in analysis of the ICTOF panel, which also reveals decreased abundance of Tfh cells in IFN-H patients as compared to IFN-L patients and HCs (Supplementary Figure 2E).
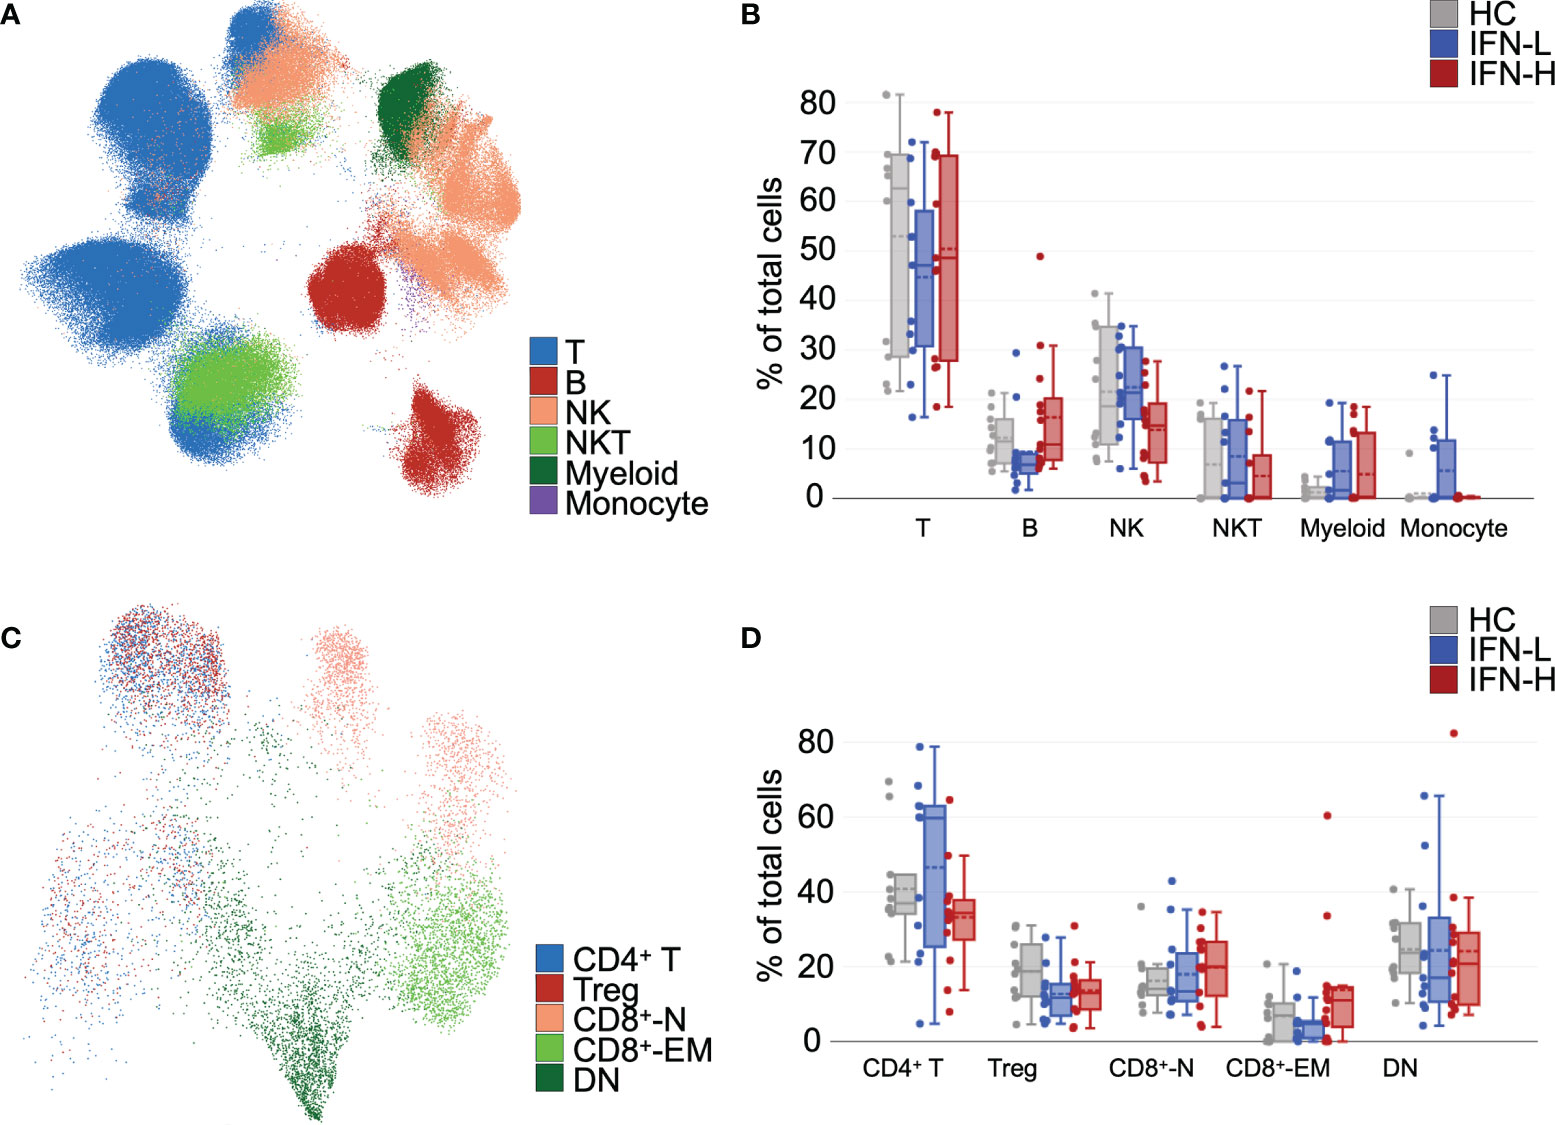
Figure 4 (A-D) Unsupervised analysis of mass cytometry identifies differences in abundances of immune cell and T cell subsets in SLE patients subsetted on high or low IFN signature. (A) Unsupervised uniform manifold approximation and projection (UMAP) and FlowSOM algorithms were utilized in OMIQ, which yielded distinct clusters in pTOF panel identified T cells, B cells, NK cells, NKT cells, myeloid cells, and monocytes. (B) Abundances of immune cell subsets identified in (A) from unstimulated samples. (C) UMAP analysis of T cells identifies multiple T cell subsets (CD4+ T cells, Tregs, CD8+-N = naïve CD8+ T cells, CD8+-EM = effector memory CD8+ T cells, and DN = double negative T cells). (D) Abundances of T cell subsets identified in (C) from unstimulated samples. Tregs were manually gated in OMIQ on CD25+CD127-.
To identify statistically significant differences between groups in our pTOF and ICTOF analysis, we independently analyze both panels with MetaCyto (42), an automated meta-analysis pipeline of cytometry datasets. MetaCyto accurately identifies cell populations across studies and applies hierarchical models to determine the effects of factors of interest on cell populations. This analysis requires “supervision,” where cell populations are pre-defined by panel markers (Supplementary Table 3). MetaCyto analysis of our pTOF panel demonstrates significant positive effect size of IFN signature (IFN-H v. IFN-L) on STAT1/3/5 phosphorylation across multiple cell subsets when comparing IFN-H to IFN-L patient samples (Figures 5A–C and Supplementary Figure 3D). Particularly notable are the pronounced positive effect sizes of IFN signature on phosphorylation of expected STAT proteins downstream of individual cytokine stimulations: IFNα/pSTAT1, IFNγ/pSTAT1, and IL-21/pSTAT3. Our results also demonstrate significant effect sizes of IFN signature (IFN-H v. IFN-L) on STAT proteins that are less frequently phosphorylated downstream of individual cytokine signaling: IFNα/pSTAT3, IFNα/pSTAT5, IFNγ/pSTAT3, and IL-21/pSTAT5. Together, these results suggest that the presence of a high IFN signature significantly effects the phosphorylation of frequently and less frequently used STAT proteins downstream of IFNα, IFNγ, and IL-21 signaling. Effect sizes of IFN signature (IFN-H v. IFN-L) on surface markers used in the pTOF analysis, and the effect size of SLE on expression of both surface and signaling markers are shown in Supplementary Figure 3A-B, respectively.
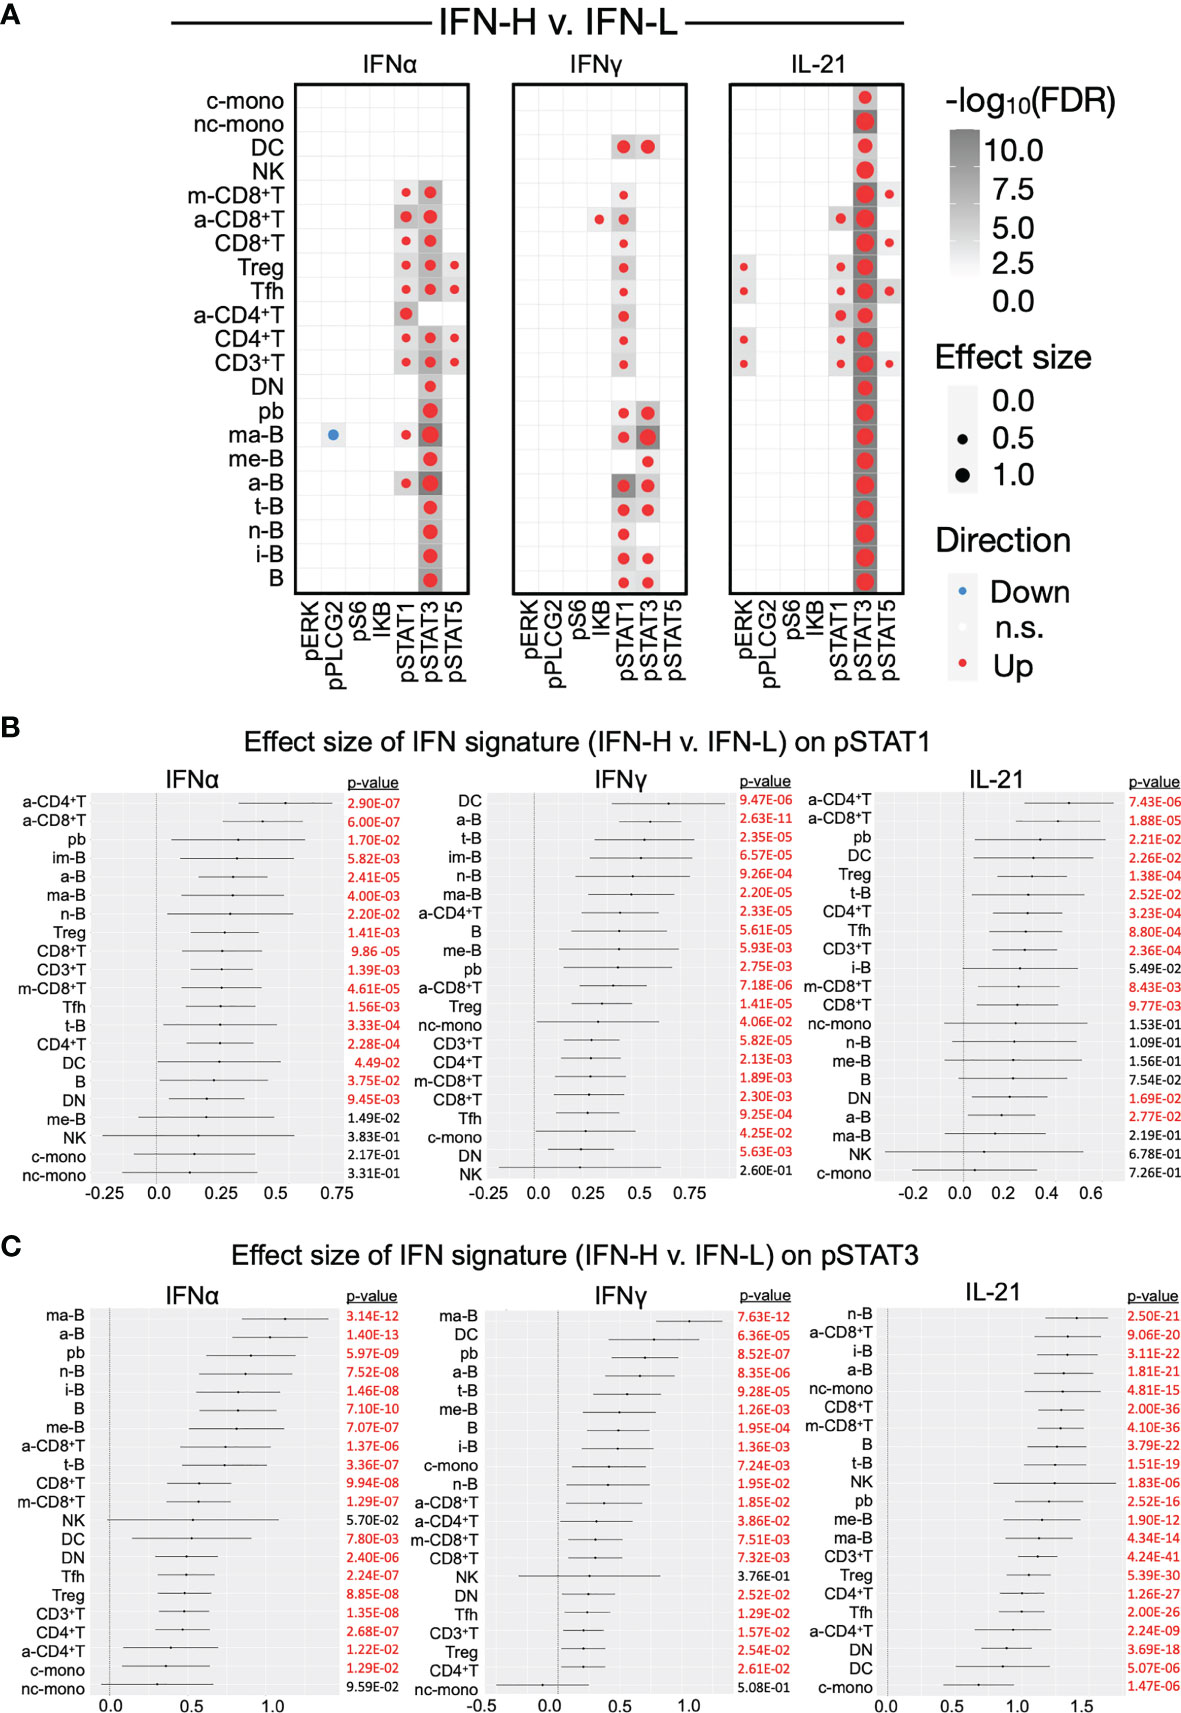
Figure 5 (A-C) Effect sizes of IFN signature on phosphorylated signaling in SLE PBMCs. (A) Dotmap represents effect size of IFN signature (IFN-H v. IFN-L patients) on signaling protein (columns) across cell subsets (rows) after stimulation with IFNα (left), IFNγ (middle), or IL-21 (right). Dot size depicts effect size, larger dots have greater effect sizes. Color depicts direction of effect size, red indicates positive effect size and blue indicates negative effect size. Shading of each box depicts statistical significance by -log10(FDR), darker boxes indicate greater statistical significance. Only cell populations with FDR < 0.05 are displayed in the dotmaps. Cell subsets (rows) are pre-defined by marker intensity (Supplementary Table 3). (B, C) Forest plots representing the effect size of IFN signature (IFN-H v. IFN-L) on phosphorylation of pSTAT1 (B) and pSTAT3 (C) in cell subsets downstream of IFNα (left), IFNγ (middle), or IL-21 (right) stimulation. See Supplementary Figure 3D for forest plots for pSTAT5. Significant (p<0.05) effect sizes in red and not significant effect sizes in black. P values were adjusted using Benjamini-Hochberg false discovery rate (FDR).
MetaCyto analysis of our ICTOF panel demonstrates a significant positive effect size of IFN signature (IFN-H v. IFN-L) on TNF-α and IFNγ production across all immune subsets, GM-CSF and perforin in a subset of B and T cells, IL-2 in T cells, IL17 in Tregs, Tfhs, and central memory CD4+ T cells, and IL-22 in multiple T cell subsets. Our analysis also reveals significantly negative effect size of IFN signature on IL-4 production in T-cells and IL-21 in both T and B cell subsets (Supplementary Figure 3C, right).
UMAP display of OMIQ analysis demonstrates an increased intensity of pSTAT1 downstream of IFNγ stimulation in HCs, which is absent in SLE patients regardless of IFN signature. T cells isolated from IFN-H patients show marked pSTAT1 intensity downstream of IFNα and IL-21 (Figure 6A) as compared to T cells isolated from IFN-L patients and HCs. These findings suggest a more prominent role of IFNα and IL-21 signaling in T cells as compared to IFNγ in SLE, and increased IFNα and IL-21 signaling associated with IFN signature. Similar analysis of pSTAT3 shows expected increased intensity of pSTAT3 downstream of IL-21 (as opposed to downstream of US, IFNα or IFNγ) in T cells isolated from HCs, IFN-L and IFN-H patients; with the most notable intensity in IFN-H T cells. While IFNα does not primarily signal through pSTAT3, stimulation of IFN-H T cells with IFNα displays increased STAT3 phosphorylation in IFN-H patients (Figure 6B).
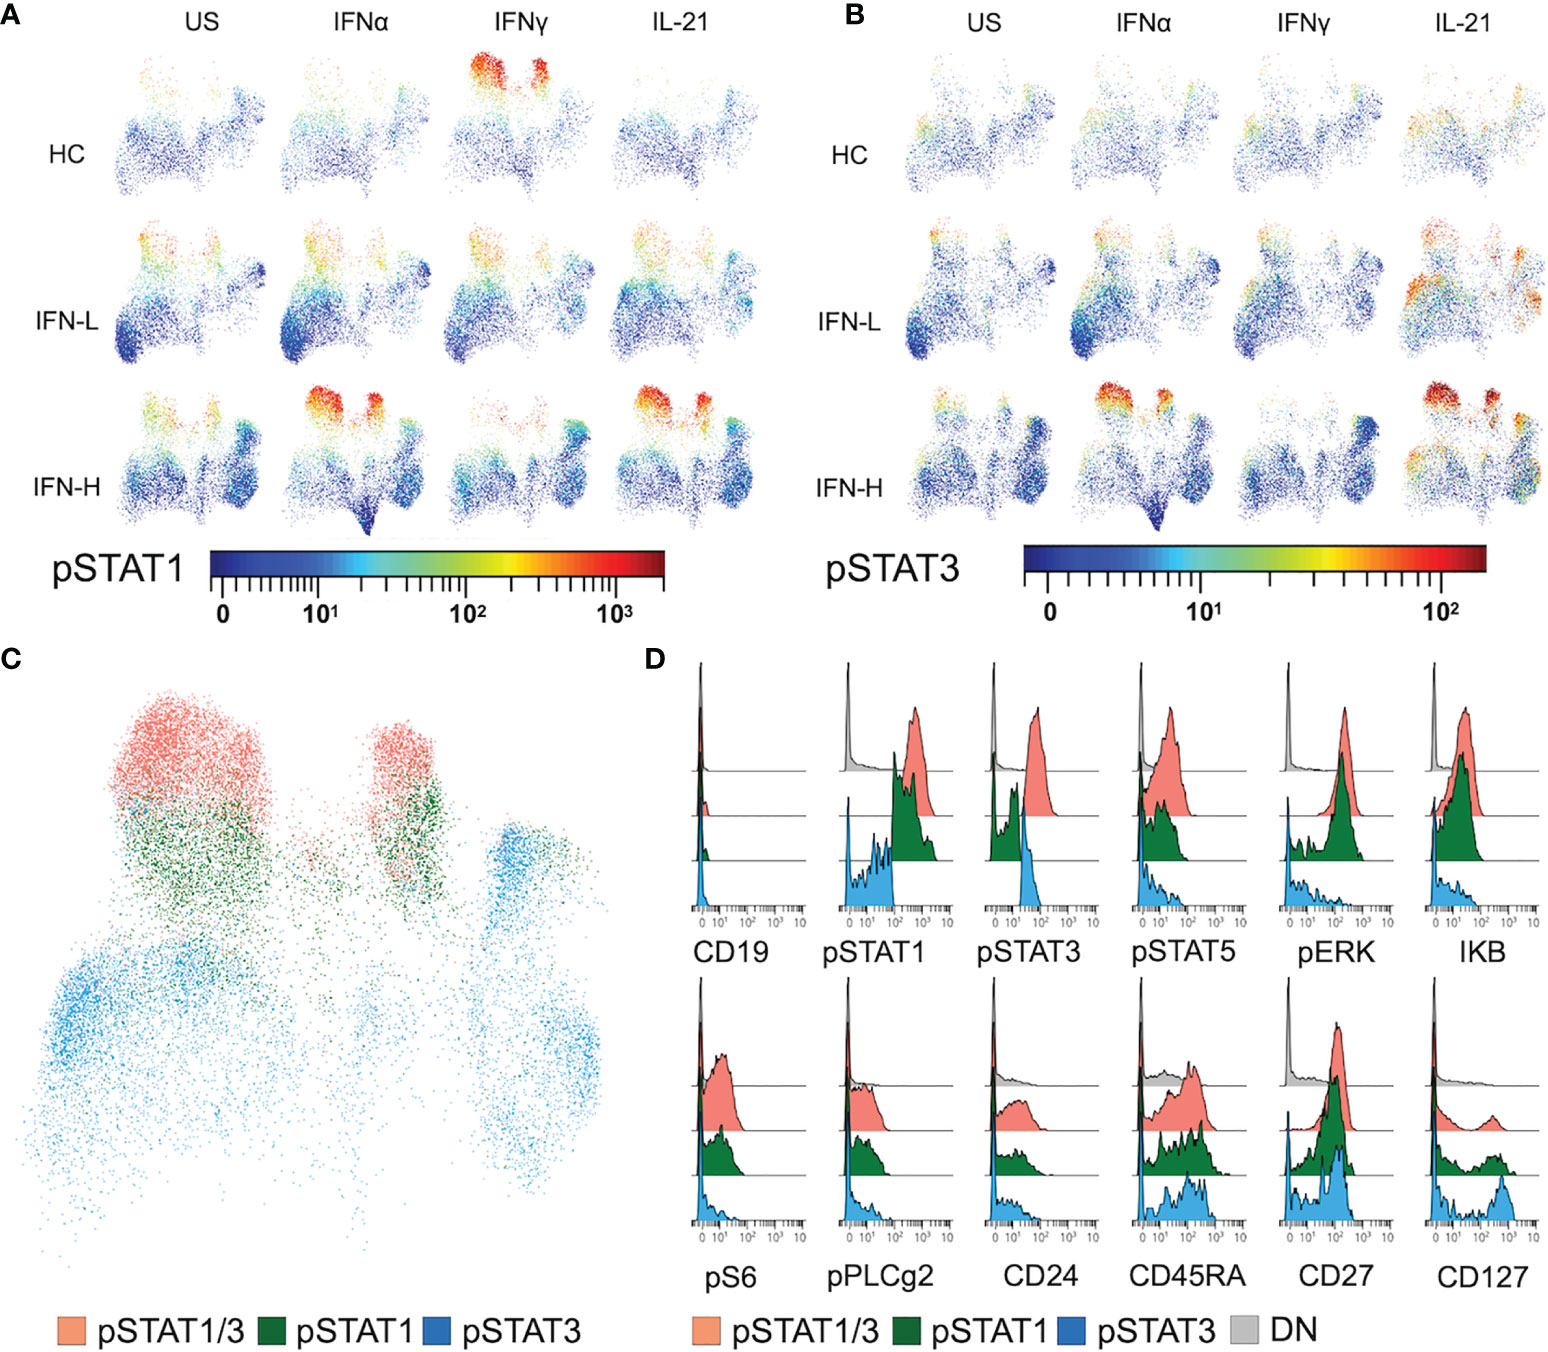
Figure 6 (A-D) IFN signature associated with increased STAT1/3 phosphorylation in T cells expressing stress, proliferation, and co-stimulation proteins. (A, B) UMAP plots of T cells isolated from HC, IFN-L and IFN-H patients stimulated with IFNα, IFNγ, IL-21 or unstimulated (US) colored by pSTAT1 (A) or pSTAT3 (B) intensity. (C) UMAP plot of T cells expressing pSTAT1 and 3 (orange), pSTAT1 (green), or pSTAT3 (blue). Plot of T cells from IFN-H samples stimulated with IFNα is representative of T cells from HC and IFN-L samples in all pTOF conditions. (D) Histograms displaying expression of both surface (CD19, CD24, CD27, and CD127) and intracellular signaling (pSTAT1, pSTAT3, pSTAT5, pERK, IKB, pS6, and pPLCg2) proteins of manually gated T cells expressing pSTAT1 and 3, pSTAT1, pSTAT3, or DN = double negative T cells, from IFN-H PBMCs stimulated with IFNα.
Utilizing manual-gating of bi-axial plots in OMIQ, cells expressing high intensity of pSTAT1 (green), pSTAT3 (blue), or pSTAT1 and pSTAT3 (orange) are identified (Figure 6C) spanning multiple T cell subsets (Figure 4C). To further characterize T cells with high levels of STAT phosphorylation in response to IFNα, IFNγ, IL-21, we interrogate the expression of other pTOF panel markers (Figure 6D). Expression of stress and proliferation proteins pERK, IKB, pS6, pPLCg2, and CD24 is associated with T cells with high expression of pSTAT1 in IFN-H patients. Expression of CD45RA, CD27 and CD127 is associated with T cells with high expression of either pSTAT1 or pSTAT3 in IFN-H patients. Expression patterns of pTOF markers are not specific to IFN-H patients or stimulation condition (Supplementary Figure 4).
The recent FDA approval of anifrolumab for the treatment of SLE, represents an important advancement in the field. Despite this milestone, the mechanisms by which IFN signaling perturbs other cytokine pathways in the setting of a highly dysregulated SLE immune system, remains unclear. Here we apply highly multiplex single cell mass cytometry to elucidate the effects of the IFN signature on critical SLE-associated cytokines across multiple immune cell subsets. We report a robust IFN signature in SLE patients that is strongly associated with more severe disease, renal and CNS involvement and autoantibody production. Furthermore, our CyTOF analysis reveals increased STAT1/3/5 phosphorylation in IFN-H patients and phosphorylation of STAT proteins not typically utilized downstream of IFNα, IFNγ, and IL-21 signaling. Together our results, support a pathogenic role of IFN signature that is associated with increased phosphorylation of both common and uncommon STAT proteins.
Increased autoantibody production in IFN-H patients has been previously described (29), but differences in reactivity between IFN-H and IFN-L patients have been reported against histone-associated antigens. In contrast, autoantibody profiling of the Stanford SLE cohort displays significantly different levels of autoantibodies against spliceosome components between IFN-H and IFN-L patients. The U1-snRNP immune complex can stimulate macrophage migration inhibitory factor (MIF) production from monocytes and macrophages (43), and elevated MIF levels have been associated with more severe SLE disease (44). Because our mass cytometry panels skew towards lymphoid rather than myeloid lineages, we are unable to interrogate the relationship between autoantibody production against spliceosome complements and myeloid cell signaling.
The discrepancy between histone-associated and spliceosome-associated antigens across studies is likely cohort specific and possibly driven by the vastly different ethnic makeup of each cohort. Previous studies investigated cohorts with larger representation of African American patients as compared to higher representation of Asian (27%) and Latino (23%) patients in the Stanford SLE cohort. Genetic factors play a role in SLE development (45, 46), and we hypothesize that pathogenic epigenetic modifications and or allelic polymorphisms differ among ethnic groups. Our results do support a higher percentage of patients with the IFN signature in ethnic minority groups - Asian or Latino in the Stanford cohort (Table 1) and African American in previous studies.
Our phenotypic profiling of SLE patient PBMCs with single cell mass cytometry using our pTOF and ICTOF panels, demonstrate differences in the abundance of immune cell subsets. IFN-H patients have higher percentages of B cells and lower percentages of NK cells as compared to IFN-L patients. The increased percentage of B cells supports our finding that IFN-H patients display increased autoantibody production and an established finding of increased B cell subsets (including class-switched memory B cells and plasmablasts) in SLE PBMCs compared to HCs (47). Type I IFN can also activate and promote proliferation of multiple B cell subsets (48, 49). The frequency and role of NK cells in SLE is less well-studied, in large part due to NK cell diversity and divergent roles of peripheral versus organ- or tissue- trafficked NK cells. Studies of both murine models of SLE and SLE patients report decreased frequency of circulating NK cells in more severe disease (50, 51) and therefore a protective role in SLE. However, kidney-infiltrating NK cells have also been reported in SLE mice with more severe kidney disease (52), suggesting a deleterious role in SLE. Our study of PBMCs supports previous reports of lower NK cell numbers correlating with more severe disease.
Various T cell subsets have been implicated in playing a role in SLE pathogenesis. These include Tregs, Th17 and Tfhs. Our ICTOF panel analysis allows for identification of these subsets. While previous studies have shown both decreased (53, 54) or unchanged (55) frequencies of Tregs in SLE patients compared to HCs, here we report decreased abundance of Tregs in PBMCs of SLE patients as compared to HCs, but no notable difference between IFN-H and IFN-L patients (pTOF and ICTOF panels). Our analysis of peripheral Tfhs shows an increased abundance in IFN-L patients as compared to HCs, and a decreased abundance in IFN-H patients as compared to HCs. While the relationship between IFN signature and Tfh biology has not been thoroughly investigated, current dogma is that Tfhs are expanded in SLE as compared to HCs (56). While no major differences are seen in the abundance of Th17s across groups, it is worth noting that the frequencies of T cell subsets are exceedingly low in our study and our sampling represents patients with well controlled disease (patients receiving the equivalent of more than 10mg of prednisone daily or biologic therapies were excluded from CyTOF analysis).
Our MetaCyto and OMIQ analysis of phosphorylated intracellular signaling molecules (pTOF) demonstrates a significant effect of IFN signature on STAT phosphorylation. Phosphorylated STAT1, 3, and 5 are included in this study and all have been reported to play pathogenic roles in SLE (57). JAK/STAT inhibitor baricitnib (targeting STAT1/3) has shown clinical efficacy in the treatment of SLE (58) and others are currently being studied. As expected, our study reports increased phosphorylation of canonical STAT1 protein downstream of IFNα in IFN-H versus IFN-L patients. These results further establish the pathogenic role of IFN signaling in SLE.
Unexpectedly, IFN-H patients also show increased expression of pSTAT3 (Y705 – phosphorylation of tyrosine at position 705) and pSTAT5 (Y694 – phosphorylation of tyrosine at position 694) downstream of IFNα. As mentioned, IFNα-induced STAT3 and STAT5 phosphorylation in less frequent, and neither are involved in the formation of the ISGF3 complex (comprised of STAT1, STAT2, and IRF9) that is responsible for transactivation of IFN-mediated genes. Previous work has suggested distinct function of mechanism of activation for both STAT3 and STAT5 in IFNα signaling (59). STAT3 has been reported to negatively regulate type I IFN signaling by sequestering STAT1 and suppressing the formation of DNA-binding STAT1 homodimers (60) and in vitro STAT3 knockout leads to increased expression of a distinct subset of IFN-mediated genes (61). Additionally, STAT3 activation can be regulated by microRNAs like mir-155 (62, 63) and mir-221 (64). Abrogation of STAT1 leads to increased STAT3 phosphorylation in macrophages and in mouse models of SLE (37, 65), however the conditions leading to STAT3 phosphorylation with intact STAT1 remains unknown. IFNα-mediated STAT5 phosphorylation has also been reported via both serine and tyrosine phosphorylation, in addition to forming a complex with CrkL – an adaptor protein responsible for linking proteins in various signaling cascades (66).
While our study measures the primary mechanism of STAT activation through tyrosine phosphorylation, other mechanisms including acetylation, methylation and SUMOlyation are not represented. Furthermore, unphosphorylated STAT proteins are not included in our pTOF panel and future studies interrogating the ratio of unphosphorylated to phosphorylated STAT proteins along with inhibitory SOCs proteins could provide more insight into signaling dynamics. How and under what conditions less common STAT proteins are phosphorylated in SLE remains unknown and is ripe for investigation.
Our study confirms the critical role of IFN signaling and IFN signature in the pathogenesis of SLE. It also suggests that IFN signaling in SLE leads to increased and aberrant STAT phosphorylation. Of note, recent work utilizing CyTOF in mycophenolate mofetil (MMF)-treated SLE patients, suggests its efficacy is mediated through inhibition of pSTAT3 (67). Taken together with our current study, these results could support a combinatorial therapeutic approach targeting both IFN signature and STAT phosphorylation. Lastly, our study holds crucial implications for therapeutic approaches with JAK/STAT inhibitors currently under study in addition to elucidating the mechanisms by which STAT activation is regulated in SLE.
All SLE patients were diagnosed by the American College of Rheumatology SLE updated 1997 criteria (68). Samples were collected at the outpatient clinics at Department of Rheumatology, Stanford University Hospital. At the initial visit patients were screened for dsDNA, anti-Smith antibodies, and anti-nuclear antibodies (ANA). The SLEDAI was calculated at the time of sampling. EDTA stabilized serum samples from SLE patients and healthy controls were stored at -80°C until use. For interferon alpha profiling, RNA was collected from SLE patients (n=81) and healthy controls (HC) (n=31) in Tempus tubes (Applied Biosystems), processed and stored at -80 until use. For CyTOF studies, peripheral blood mononuclear cells (PBMCs) from selected SLE patients (n=31) and HC (n=17) were purified using Ficoll-Paque (GE Healthcare) and density centrifugation and frozen in RPMI-1640 with 20% FCS, and 10% DMSO at -150°C until use. Patients receiving any biologics (e.g. Belimumab or similar), prednisone (>10mg/day), MMF, or azathioprine were excluded from CyTOF analysis. Demographics of patients included in IFN profiling or CyTOF analysis are shown in Table 1. Demographics of HCs are unknown as HCs were anonymous.
Interferon alpha profiles were measured using a panel of IFN alpha target genes. These genes were selected from 5 previously validated IFN profile panels (5, 6, 29–31). Genes were selected based on appearances in 2 or more of these panels yielding a panel of 44 transcripts (Supplementary Table 1). The interferon score was calculated as previously described by Baechler et al. In brief, the individual transcripts were normalized to the highest values across all samples and a cumulative score of the normalized value for each transcript was calculated for all patients. Multiple alternative approaches to calculating this score were attempted and they all yield slightly different distributions but were very consistent in the ranking of the individual patients. For 10-50 ng total RNA of each sample, reverse transcription of the RNA to cDNA was performed at 50°C for 15 minutes using the High-Capacity Reverse Transcription kit (ABI). RT was performed directly on a 96-well PCR plate (ABI). PreAmp was performed on a thermocycler using the TaqMan PreAmp Master Mix Kit (Invitrogen) added to cDNA and pooled Taqman assays. RT enzyme was inactivated and the Taq polymerase reaction was started by bringing the sample to 95°C for 2 minutes. The cDNA was preamplified by denaturing for 10 cycles at 95°C for 15 seconds, annealing at 60°C for 4 minutes. The resulting cDNA product was diluted 1:2 with 1X TE buffer (Invitrogen). 2X Applied Biosystems Taqman Master Mix, Fluidigm Sample Loading Reagent, and preamplified cDNA were mixed and loaded into the 48.48 Dynamic Array (Fluidigm) sample inlets, followed by loading 10X assays into the assay inlets. Manufacturer’s instructions for chip priming, pipetting, mixing, and loading onto the BioMark system were followed. Real-time PCR was carried out with the following conditions: 10 min at 95°C, followed by 50 cycles of 15 sec at 95°C and 1 min at 60°C. Data was analyzed using Fluidigm software. All reactions were performed in duplicate, and Ct values were normalized to the geomean of GAPDH, ACTB, and B2M. Repeat positive controls were included across all chips.
Detailed autoantibody profiling protocols and a list of arrayed antigens have been previously published (34). Briefly, 24 SLE-associated autoantigens and controls were printed at 0.2 mg/ml in ordered arrays on nitrocellulose-coated FAST slides (Whatman, Piscataway, New Jersey) using a VersArray ChipWriter Pro Robotic Arrayer (Bio-Rad). Individual arrays were blocked with PBS containing 3% FCS and 0.05% Tween 20 (Sigma-Aldrich) for 1.5 hrs on a rocking platform at room temperature. Arrays were probed with 400 μl human serum diluted 1:250 in 1X PBST with 5% FCS for 1.5 hrs on a rocking platform at 4°C, followed by washing and incubation with a 1:2000 dilution of cyanine-3-conjugated goat anti-human IgM or IgG secondary antibody (Jackson ImmunoResearch Laboratories). Arrays were scanned using a GenePix 4000B scanner (Molecular Devices) at constant PMT power for all arrays. The net mean pixel intensities of each feature were determined using GenePix Pro 6.1 software (Molecular Devices, Sunnyvale, California). Array data will be uploaded to the GEO database upon publication of the manuscript.
96 well plates (NUNC MaxiSorp) were incubated at 4°C overnight with 100 µL/well protein solution at 2µg/ml (Ro/SSA, ssDNA, EBV, U1-A, U1-C, U170, Sm/RNP, smith, dsDNA(plasmid) and histones). Plates were then washed 3X with phosphate buffered saline with 0.05% Tween 20 (PBST) and blocked with 200µL/well PBST with 5% FCS for 2 hrs at room temperature. After washing, plates were incubated with 100 µL/well of sample at dilutions 1:400 or 1:800 at 4°C overnight, followed by washing and development using Europium labeled anti-human IgG and DELFIA Enhancement solution (PerkinElmer). IFN-H, n=20; IFN-L, n=20, HC, n=3. Detection limit was calculated as 2X the standard deviation of the blanks.
Cytometry Time-of-Flight (CyTOF) analyses were performed at the Human Immune Monitoring Center at Stanford University. Detailed protocol is available electronically: iti.stanford.edu/himc/protocols.html. In brief, PBMCs were thawed and viable cells were counted by Vicell. Cells were added to a V-bottom microtiter plate at 1.5 million viable cells/well and washed once in fresh CyFACS buffer. Appropriate stimulations were added and cultured at 37°C (ICS stimulation: PMA (phorbol 12-myristate 13-acetate; 50 ng/ml), ionomycin (Sigma, 750 ng/ml), brefeldin-A (Sigma, 20 ug/ml for 4 hours; phospho-specific stimulation: IFNα, IFNγ, IL-21 for 20 minutes). The cells were stained for 60 min on ice with 50 uL of antibody-polymer conjugate surface marker cocktail. After staining the cells were washed and resuspended in 100 uL 2% PFA in PBS and placed at 4°C overnight. The next day, the cells are permeabilized in 100 uL eBiosciences permeabilization buffer and placed on ice for 45 min before staining with intracellular cocktail for 1 hour on ice. The cells were washed twice and resuspended in 100 uL iridium-containing DNA intercalator (1:2000 dilution in PBS; Fluidigm) and incubated at room temperature for 20 min then resuspended in MilliQ water and injected into the CyTOF (Fluidigm). Mass cytometry antibodies can be found in Supplementary Table 2.
Cytometry data files were normalized using the bead-bead Fluidigm normalization algorithm. Files were then manually gated in FlowJo for stability of time (191+/Time), cells with no beads (Ir193+/Ce140-), cleanup (double positive for DNA), and singlets (Ir193+). Total single cells or T cells (ICTOF: CD33-/CD56-/C20-/CD19-/CD3+, and for pTOF: CD14-/CD56-/C20-/CD19-/CD3+) were exported for analysis utilizing the OMIQ platform (www.omiq.ai). Data was Arcsinh transformed with a coefficient of 5 was used inside OMIQ platform. For lineage populations analysis, total single cells were downsampled between 30,000 (ICTOF) and 35,000 (pTOF) events, followed by unsupervised uniform manifold approximation and projection (UMAP) and FlowSOM algorithms. Results were plotted using OMIQ platform. For analysis of the T regulatory (Tregs: CD25+CD127-), T follicular (Tfh: CXCR5+PD1+), and Th17 (CD45RA-IL17+) cell subsets, manual gating of CD4 T cells individual samples was performed using OMIQ.
We used the MetaCyto guided analysis pipeline (42) to evaluate cell populations using pre-defined marker definitions (Supplementary Table 3). Statistical analysis was performed using a fixed-effects multiple regression model (Marker ~ Group + Treatment + Study ID). Default parameters were used. Transformed marker values less than a 0.125 threshold were set to 0. Effect size was calculated by dividing the regression coefficient by the standard deviation of Marker. P values were adjusted using Benjamini-Hochberg false discovery rate (FDR).
Microarray data were expressed as mean net fluorescence intensity (MFI) units, representing the mean values from six replicate antigen features on each array. Non-reactive samples were defined as having a maximum normalized IgG MFI of less than 1,000 for a given antigen. Significance Analysis of Microarrays (SAM) (38) was applied to the dataset (with the MFI value of undetected array features set to 1) using the Wilcoxon signed-rank test statistic to identify antigens or cytokines/chemokines with statistically significant differences in array reactivity between different groups of mice at FDR of 0 (q<0.001). Binding reactivity heatmaps were generated using MultiExperiment Viewer (MEV TM4 Microarray Software Suite version 10.2, Dana-Farber Cancer Institute, Boston, MA) using k-nearest neighbor replacement and average linkage using Euclidean distance hierarchical clustering.
Statistical analyses for clinical data were performed using GraphPad Prism 9.2.0 for Mac (GraphPad Software). All data in text or graphs are expressed as medians with interquartile ranges unless otherwise specified. Non-paired, non-parametric data was analyzed by Mann-Whitney test. Correlation of non-parametric paired data was tested using Spearman’s Rho. In all tests the level of significance was a two-sided p value of less than 0.05.
The datasets presented in this study can be found in online repositories. The names of the repository/repositories and accession number(s) can be found below: GEO, GSE193174.
The studies involving human participants were reviewed and approved by IRB# 17374: Stanford University Immunological and Rheumatic Disease Database: Disease Activity and Biomarker Study. The patients/participants provided their written informed consent to participate in this study.
Conceptualization, GY, TR, and PU. Methodology, GY and TR. Formal analysis, GY, TR, BT, BC-A, and GD. Investigation, GY, TR, BT, BC-A, JT, DH, VD, and GD. Data Curation, GY, TR, BT, BC-A, and JT. Writing – Original Draft, GY and PU. Writing – Review and Editing, GY, TR, BT, BC-A, BD, GC, and PU. Supervision, PU. Funding acquisition, P.J.U. All authors contributed to the article and approved the submitted version.
PU was supported by NIH U19-AI110491 and R01 AI125197-01; the Donald E. and Delia B. Baxter Foundation; and the Henry Gustav Floren Trust. The contents are solely the responsibility of the authors and do not necessarily represent the official views of the NIH or one of its institutes. BT acknowledges the support of the University of California, Los Angeles, Caltech Medical Scientist Training Program. GY acknowledges the support of the Stanford Immunology Graduate Program and Stanford Medical Scientist Training Program.
The authors declare that the research was conducted in the absence of any commercial or financial relationships that could be construed as a potential conflict of interest.
All claims expressed in this article are solely those of the authors and do not necessarily represent those of their affiliated organizations, or those of the publisher, the editors and the reviewers. Any product that may be evaluated in this article, or claim that may be made by its manufacturer, is not guaranteed or endorsed by the publisher.
We would like to thank the Stanford Human Immune Monitoring Center (HIMC) for executing the CyTOF phenotyping assays, and Chris Ciccolella for his guidance on OMIQ usage.
The Supplementary Material for this article can be found online at: https://www.frontiersin.org/articles/10.3389/fimmu.2022.833636/full#supplementary-material
Supplementary Table 1 | (related to Figure 1): IFN profiling. IFN biosignature profiling. Fluidigm multiplex qPCR measured 44 transcripts. Transcripts were chosen based on a literature query for transcript profiling of bulk PBMCs or magnetically sorted immune subsets from SLE patients.
Supplementary Table 2 | (related to Figure 4–6): Mass cytometry antibodies. Antibodies used for mass cytometry panels. Intracellular cytokine CyTOF panel (ICTOF) and phosphorylation of signaling protein CyTOF panel (pTOF). FLUIDIGM = FLUIDIGM Sciences, In house = antibody was conjugated and titrated in house. Grey box indicates use in panel.
Supplementary Table 3 | (related to Figure 5): MetaCyto cell marker definitions. Marker definition of cell subsets for MetaCyto analysis – pTOF and ICTOF.
Supplementary Figure 1 | (related to Figure 1): The IFN biosignature was calculated using our consensus 44 transcript panel showed significant correlation to the Baechler transcripts (rho=0.98, p<0.0001, left) and the Behrens (rho=0.92, p<0.0001, right) transcripts.
Supplementary Figure 2 | (related to Figure 4): (A–E) Immune cell subsets identified by unsupervised OMIQ reveal differences in abundance between IFN-H and IFN-L patients. (A) Unsupervised UMAP pTOF analysis identifies multiple immune cell subsets (T cells, B cells, NK cells, NKT cells, myeloid cells, monocytes) across stimulation conditions (US = unstimulated, IFNα, IFNγ, and IL-21). (B) Unsupervised UMAP ICTOF analysis identifies multiple immune cell subsets (T cells, B cells, NK cells, γδ T cells, and myeloid cell) across stimulation conditions (US = unstimulated and PMA and ION = ionomycin. (C) Unsupervised UMAP ICTOF analysis of T cells, identifies multiple T cell subsets (CD4+ T cells, DP = double positive, and DN = double negative T cells) across conditions in (C). (D) Abundance of immune cell subsets in (B) shows decreased T cells and increased B cells in IFN-H PBMCs stimulated with PMA+ION compared to HC and IFN-L PBMCs. (E) Abundance of T cell subsets in (C). reveal decreased Treg and Tfh populations in IFN-H PBNCs stimulated with PMA+ION compared to HC and IFN-L PBMCs. All T regulatory (Tregs: CD25+CD127-), T follicular (Tfh: CXCR5+PD1+), and Th17 (CD45RA-IL17+) populations above were hand-gated within OMIQ. Treg, Tfh and Th17 populations were omitted from T cell UMAP in C due to rarity of populations.
Supplementary Figure 3 | (related to Figure 5): (A–D) MetaCyto analysis of pTOF and ICTOF panels. (A) Dotmap represents effect size of IFN signature (IFN-H v. IFN-L patients) or (B) SLE, on signaling protein (columns) across cell subsets (rows) after stimulation with IFNα (left), IFNγ (middle), or IL-21 (right). (C) Dotmap represents effect size of IFN signature (IFN-H v. IFN-L patients, right) or (B) SLE (left), on intraceullar protein production (columns) across cell subsets (rows) after stimulation with PMA and ionomycin. Dot size depicts effect size, larger dots have greater effect sizes. Color depicts direction of effect size, red indicates positive effect size and blue indicates negative effect size. Shading of each box depicts statistical significance by -log10(FDR), darker boxes indicate greater statistical significance. Only cell populations with FDR < 0.05 are displayed in the dotmaps. (D) Forest plots representing the effect size of IFN signature (IFN-H v. IFN-L) on phosphylation of pSTAT5 downstream of IFNα (left), IFNγ (middle), or IL-21 (right) stimulation. Significant (p<0.05) effect sizes in red and not significant effect sizes in black. P values were adjusted using Benjamini-Hochberg false discovery rate (FDR).
Supplementary Figure 4 | (related to Figure 6): Histograms displaying expression of both surface (CD19, CD24, CD27, and CD127) and intracellular signaling (pSTAT1, pSTAT3, pSTAT5, pERK, IKB, pS6, and pPLCg2) proteins of manually gated T cells expressing pSTAT1 and 3, pSTAT1, pSTAT3, or DN = double negative T cells, from HC, IFN-L or IFN-H PBMCs stimulated with IFNα, IFNγ, IL-21 or unstimulated (US).
IFN, interferon; SLE, Systemic Lupus Erythematosus; HC, healthy control; PBMC, peripheral blood mononuclear cell; IFN-H, interferon-high; IFN-L, interferon-low; IFNAR, subunit 1 of the type I interferon receptor (IFNAR1); BICLA, British Isles Lupus Assessment Group-based Composite Lupus Assessment; STAT, signal transduction and activators of transcription; JAK, janus family tyrosine kinase; LN, lupus nephritis; ANA, anti-nuclear antibody; ELISA, enzyme-linked immunosorbent assay; PMA, phorbol 12-myristate 13-acetate; ION, ionomycin; CyTOF, cytometry by time of flight; pTOF, phosphorylation of intracellular signaling proteins TOF; ICTOF, intracellular cytokine TOF; Th17, T helper 17; Tfh, T follicular helper; Treg, regulatory T; NK, natural killer; SAM, significance analysis of microarrays; FDR, false discovery rate; MFI, mean fluorescence intensity; UMAP, unsupervised uniform manifold approximation and projection; US, unstimulated.
1. Murimi-Worstell IB, Lin DH, Nab H, Kan HJ, Onasanya O, Tierce JC, et al. Association Between Organ Damage and Mortality in Systemic Lupus Erythematosus: A Systematic Review and Meta-Analysis. BMJ Open (2020) 10(5):e031850. doi: 10.1136/bmjopen-2019-031850
2. Tsokos GC. Autoimmunity and Organ Damage in Systemic Lupus Erythematosus. Nat Immunol (2020) 21(6):605–14. doi: 10.1038/s41590-020-0677-6
3. Bruce IN, O’keeffe AG, Farewell V, Hanly JG, Manzi S, Su L, et al. Factors Associated With Damage Accrual in Patients With Systemic Lupus Erythematosus: Results From the Systemic Lupus International Collaborating Clinics (SLICC) Inception Cohort. Ann Rheum Dis (2015) 74(9):1706–13. doi: 10.1136/annrheumdis-2013-205171
4. Dörner T, Furie R. Novel Paradigms in Systemic Lupus Erythematosus. Lancet (2019) 393:2344–58. doi: 10.1016/S0140-6736(19)30546-X
5. Baechler EC, Batliwalla FM, Karypis G, Gaffney PM, Ortmann WA, Espe KJ, et al. Interferon-Inducible Gene Expression Signature in Peripheral Blood Cells of Patients With Severe Lupus. Proc Natl Acad Sci USA (2003) 100:2610–5. doi: 10.1073/pnas.0337679100
6. Lyons PA, McKinney EF, Rayner TF, Hatton A, Woffendin HB, Koukoulaki M, et al. Novel Expression Signatures Identified by Transcriptional Analysis of Separated Leucocyte Subsets in Systemic Lupus Erythematosus and Vasculitis. Ann Rheum Dis (2010) 69:1208–13. doi: 10.1136/ard.2009.108043
7. Bauer JW, Petri M, Batliwalla FM, Koeuth T, Wilson J, Slattery C, et al. Interferon-Regulated Chemokines as Biomarkers of Systemic Lupus Erythematosus Disease Activity: A Validation Study. Arthritis Rheum (2009) 60:3098–107. doi: 10.1002/art.24803
8. Der E, Suryawanshi H, Morozov P, Kustagi M, Goilav B, Ranabothu S, et al. Tubular Cell and Keratinocyte Single-Cell Transcriptomics Applied to Lupus Nephritis Reveal Type I IFN and Fibrosis Relevant Pathways. Nat Immunol (2019) 20(7):915–27. doi: 10.1038/s41590-019-0386-1
9. Arazi A, Rao DA, Berthier CC, Davidson A, Liu Y, Hoover PJ, et al. The Immune Cell Landscape in Kidneys of Patients With Lupus Nephritis. Nat Immunol (2019) 20(7):902–14. doi: 10.1038/s41590-019-0398-x
10. A Phase 3 Randomized Controlled Trial of Anifrolumab in Patients With Moderate to Severe Systemic Lupus Erythematosus - ACR Meeting Abstracts. Available at: https://acrabstracts.org/abstract/a-phase-3-randomized-controlled-trial-of-anifrolumab-in-patients-with-moderate-to-severe-systemic-lupus-erythematosus/ (Accessed January 5, 2020).
11. Furie R, Petri M, Zamani O, Cervera R, Wallace DJ, Tegzová D, et al. A Phase III, Randomized, Placebo-Controlled Study of Belimumab, a Monoclonal Antibody That Inhibits B Lymphocyte Stimulator, in Patients With Systemic Lupus Erythematosus. Arthritis Rheum (2011) 63:3918–30. doi: 10.1002/art.30613
12. Rovin BH, Solomons N, Pendergraft WF, Dooley MA, Tumlin J, Romero-Diaz J, et al. A Randomized, Controlled Double-Blind Study Comparing the Efficacy and Safety of Dose-Ranging Voclosporin With Placebo in Achieving Remission in Patients With Active Lupus Nephritis. Kidney Int (2019) 95:219–31. doi: 10.1016/j.kint.2018.08.025
13. Balomenos D, Rumold R. Theofilopoulos a N. Interferon-Gamma is Required for Lupus-Like Disease and Lymphoaccumulation in MRL-Lpr Mice. J Clin Invest (1998) 101:364–71. doi: 10.1172/JCI750
14. Theofilopoulos AN, Koundouris S, Kono DH, Lawson BR. The Role of IFN-Gamma in Systemic Lupus Erythematosus: A Challenge to the Th1/Th2 Paradigm in Autoimmunity. Arthritis Res Ther 2001 3:3 (2001) 3:1–6. doi: 10.1186/AR290
15. Talaat RM, Mohamed SF, Bassyouni IH, Raouf AA. Th1/Th2/Th17/Treg Cytokine Imbalance in Systemic Lupus Erythematosus (SLE) Patients: Correlation With Disease Activity. Cytokine (2015) 72:146–53. doi: 10.1016/J.CYTO.2014.12.027
16. Seery JP, Carroll JM, Cattell V, Watt FM. Antinuclear Autoantibodies and Lupus Nephritis in Transgenic Mice Expressing Interferon Gamma in the Epidermis. J Exp Med (1997) 186:1451–9. doi: 10.1084/JEM.186.9.1451
17. Jacob CO, van der Meide PH, Mcdevitt HO. In Vivo Treatment of (NZB X NZW)F1 Lupus-Like Nephritis With Monoclonal Antibody to Gamma Interferon. J Exp Med (1987) 166:798–803. doi: 10.1084/JEM.166.3.798
18. Fava A, Buyon J, Mohan C, Zhang T, Belmont HM, Izmirly P, et al. Integrated Urine Proteomics and Renal Single-Cell Genomics Identify an IFN-γ Response Gradient in Lupus Nephritis. JCI Insight (2020) 5(12):e138345. doi: 10.1172/JCI.INSIGHT.138345
19. Hall JC, Casciola-Rosen L, Berger AE, Kapsogeorgou EK, Cheadle C, Tziufas AG, et al. Precise Probes of Type II Interferon Activity Define the Origin of Interferon Signatures in Target Tissues in Rheumatic Diseases. Proc Natl Acad Sci USA (2012) 109:17609–14. doi: 10.1073/PNAS.1209724109
20. Vinuesa CG, Sanz I, Cook MC. Dysregulation of Germinal Centres in Autoimmune Disease. Nat Rev Immunol 2009 9:12 (2009) 9:845–57. doi: 10.1038/nri2637
21. Hostman A, Jacobi AM, Mei H, Hiepe F, Dorner T. Peripheral B Cell Abnormalities and Disease Activity in Systemic Lupus Erythematosus. Lupus (2008) 17:1064–9. doi: 10.1177/0961203308095138
22. Nurieva RI, Chung Y, Hwang D, Yang XO, Kang HS, Ma L, et al. Generation of Follicular Helper T Cells is Mediated by IL-21 But Independent of TH1, TH2 or TH17 Lineages. Immunity (2008) 29:138. doi: 10.1016/J.IMMUNI.2008.05.009
23. Wang L, Zhao P, Ma L, Shan Y, Jiang Z, Wang J, et al. Increased Interleukin 21 and Follicular Helper T-Like Cells and Reduced Interleukin 10+ B Cells in Patients With New-Onset Systemic Lupus Erythematosus. J Rheumatol (2014) 41:1781–92. doi: 10.3899/JRHEUM.131025
24. Bocharnikov Av, Keegan J, Wacleche VS, Cao Y, Fonseka CY, Wang G, et al. PD-1 Hi CXCR5-T Peripheral Helper Cells Promote B Cell Responses in Lupus via MAF and IL-21, Accelerating Medicines Partnership (AMP) RA/SLE Network. JCI Insight (2019) 4(20):e130062. doi: 10.1172/jci.insight.130062
25. Sadzak I, Schiff M, Gattermeier I, Glinitzer R, Sauer I, Saalmü Ller A, et al. Recruitment of Stat1 to Chromatin Is Required for Interferon-Induced Serine Phosphorylation of Stat1 Transactivation Domain (2008). Available at: www.pnas.org/cgi/content/full/.
26. Wan C-K, Andraski AB, Spolski R, Li P, Kazemian M, Oh J, et al. Opposing Roles of STAT1 and STAT3 in IL-21 Function in CD4 + T Cells. Proc Natl Acad Sci USA (2015) 112:9394–9. doi: 10.1073/pnas.1511711112
27. Zeng R, Spolski R, Casas E, Zhu W, Levy DE, Leonard WJ. The Molecular Basis of IL-21–Mediated Proliferation. Blood (2007) 109:4135. doi: 10.1182/BLOOD-2006-10-054973
28. Bendall SC, Simonds EF, Qiu P, Amir E -a. D, Krutzik PO, Finck R, et al. Single-Cell Mass Cytometry of Differential Immune and Drug Responses Across a Human Hematopoietic Continuum. Science (2011) 332:687–96. doi: 10.1126/science.1198704
29. Becker AM, Dao KH, Han BK, Kornu R, Lakhanpal S. SLE Peripheral Blood B Cell, T Cell and Myeloid Cell Transcriptomes Display Unique Profiles and Each Subset Contributes to the Interferon Signature. PloS One (2013) 8:67003. doi: 10.1371/journal.pone.0067003
30. Bennett L, Palucka AK, Arce E, Cantrell V, Borvak J, Banchereau J, et al. Interferon and Granulopoiesis Signatures in Systemic Lupus Erythematosus Blood. J Exp Med J Exp Med (2003) 197:711–23. doi: 10.1084/jem.20021553
31. Morimoto AM, Thibault Flesher D, Yang J, Wolslegel K, Wang X, Brady A, et al. Association of Endogenous Anti-Interferon-Autoantibodies With Decreased Interferon-Pathway and Disease Activity in Patients With Systemic Lupus Erythematosus. Arthritis RHEUM (2011) 63:2407–15. doi: 10.1002/art.30399
32. Price JV, Tangsombatvisit S, Xu G, Yu J, Levy D, Baechler EC, et al. On Silico Peptide Microarrays for High-Resolution Mapping of Antibody Epitopes and Diverse Protein-Protein Interactions. Nat Med (2012) 18(9):1434–40. doi: 10.1038/nm.2913
33. Liu CL, Tangsombatvisit S, Rosenberg JM, Mandelbaum G, Gillespie EC, Gozani OP, et al. Specific Post-Translational Histone Modifications of Neutrophil Extracellular Traps as Immunogens and Potential Targets of Lupus Autoantibodies. Arthritis Res Ther 2012 14:1 (2012) 14:1–14. doi: 10.1186/AR3707
34. Robinson W, DiGennaro C, Hueber W, Haab BB, Kamachi M, Dean EJ, et al. Autoantigen Microarrays for Multiplex Characterization of Autoantibody Responses. Nat Med (2002) 8:295–301. doi: 10.1038/NM0302-295
35. Thibault DL, Graham KL, Lee LY, Balboni I, Hertzog PJ, Utz PJ. Type I Interferon Receptor Controls B-Cell Expression of Nucleic Acid-Sensing Toll-Like Receptors and Autoantibody Production in a Murine Model of Lupus. Arthritis Res Ther (2009) 11:R112. doi: 10.1186/ar2771
36. Thibault DL, Chu AD, Graham KL, Balboni I, Lee LY, Kohlmoos C, et al. IRF9 and STAT1 are Required for IgG Autoantibody Production and B Cell Expression of TLR7 in Mice. J Clin Invest (2008) 118:1417–26. doi: 10.1172/JCI30065
37. Yiu G, Rasmussen TK, Ajami B, Haddon DJ, Chu AD, Tangsombatvisit S, et al. Development of Th17-Associated Interstitial Kidney Inflammation in Lupus-Prone Mice Lacking the Gene Encoding STAT-1. Arthritis Rheumatol (2016) 68:1233–44. doi: 10.1002/art.39535
38. Goss Tusher V, Tibshirani R, Chu G. Significance Analysis of Microarrays Applied to the Ionizing Radiation Response. Available at: www.pnas.orgcgidoi10.1073pnas.091062498.
39. Mcinnes L, Healy J, Melville J. UMAP: Uniform Manifold Approximation and Projection for Dimension Reduction. Journal of Open Source Software (2020) 3(29):861. doi: 10.21105/joss.00861
40. van Gassen S, Callebaut B, van Helden MJ, Lambrecht BN, Demeester P, Dhaene T, et al. FlowSOM: Using Self-Organizing Maps for Visualization and Interpretation of Cytometry Data. Cytometry A (2015) 87(7):636–45. doi: 10.1002/cyto.a.22625
41. Belkina AC, Ciccolella CO, Anno R, Halpert R, Spidlen J, Snyder-Cappione JE. Automated Optimized Parameters for T-Distributed Stochastic Neighbor Embedding Improve Visualization and Analysis of Large Datasets. Nat Commun (2019) 10(1):5415. doi: 10.1038/s41467-019-13055-y
42. Hu Z, Jujjavarapu C, Hughey JJ, Andorf S, Lee HC, Gherardini PF, et al. MetaCyto: A Tool for Automated Meta-Analysis of Mass and Flow Cytometry Data. Cell Rep (2018) 24:1377–88. doi: 10.1016/j.celrep.2018.07.003
43. Shin MS, Kang Y, Wahl ER, Park H-J, Lazova R, Leng L, et al. Macrophage Migration Inhibitory Factor Regulates U1-snRNP Immune Complex Mediated Activation of the NLRP3 Inflammasome. Arthritis Rheumatol (Hoboken NJ) (2019) 71:109. doi: 10.1002/ART.40672
44. Ayoub S, Hickey MJ, Morand EF. Mechanisms of Disease: Macrophage Migration Inhibitory Factor in SLE, RA and Atherosclerosis. Review (2008) 4(2):98–105. doi: 10.1038/ncprheum0701
45. Langefeld CD, Graham RR, Gaffney PM, Vyse TJ. GG-08 Transancestral Mapping and Genetic Load in Systemic Lupus Erythematosus. Lupus Sci Med (2016) 3:A31–A31. doi: 10.1136/LUPUS-2016-000179.60
46. Lanata CM, Paranjpe I, Nititham J, Taylor KE, Gianfrancesco M, Paranjpe M, et al. A Phenotypic and Genomics Approach in a Multi-Ethnic Cohort to Subtype Systemic Lupus Erythematosus. Nat Commun (2019) 10(1):3902. doi: 10.1038/s41467-019-11845-y
47. Odendahl M, Jacobi A, Hansen A, Feist E, Hiepe F, Burmester GR, et al. Disturbed Peripheral B Lymphocyte Homeostasis in Systemic Lupus Erythematosus. J Immunol (2000) 165:5970–9. doi: 10.4049/JIMMUNOL.165.10.5970
48. Soni C, Perez OA, Voss WN, Pucella JN, Serpas L, Mehl J, et al. Plasmacytoid Dendritic Cells and Type I Interferon Promote Extrafollicular B Cell Responses to Extracellular Self-DNA. Immunity (2020) 52:1022–1038.e7. doi: 10.1016/J.IMMUNI.2020.04.015
49. Wahren-Herlenius M, Dörner T. Immunopathogenic Mechanisms of Systemic Autoimmune Disease. Lancet (2013) 382:819–31. doi: 10.1016/S0140-6736(13)60954-X
50. Takeda K, Dennert G. The Development of Autoimmunity in C57BL/6 Lpr Mice Correlates With the Disappearance of Natural Killer Type 1-Positive Cells: Evidence for Their Suppressive Action on Bone Marrow Stem Cell Proliferation, B Cell Immunoglobulin Secretion, and Autoimmune Symptoms. Available at: http://rupress.org/jem/article-pdf/177/1/155/1103356/155.pdf (Accessed September 18, 2021).
51. Liu M, Liu J, Zhang X, Xiao Y, Jiang G, Huang X. Activation Status of CD56 Dim Natural Killer Cells Is Associated With Disease Activity of Patients With Systemic Lupus Erythematosus. Clin Rheumatol (2021) 40(3):1103–12. doi: 10.1007/s10067-020-05306-x
52. Huang Z, Fu B, Zheng SG, Li X, Sun R, Tian Z, et al. Involvement of CD226+ NK Cells in Immunopathogenesis of Systemic Lupus Erythematosus. J Immunol (2011) 186:3421–31. doi: 10.4049/JIMMUNOL.1000569
53. Crispin JC, Martínez A, Alcocer-Varela J. Quantification of Regulatory T Cells in Patients With Systemic Lupus Erythematosus. J Autoimmun (Acad Press) (2003) 21(3):273–6. doi: 10.1016/S0896-8411(03)00121-5
54. Liu MF, Wang CR, Fung LL, Wu CR. Decreased CD4+CD25+ T Cells in Peripheral Blood of Patients With Systemic Lupus Erythematosus. Scand J Immunol (2004) 59:198–202. doi: 10.1111/j.0300-9475.2004.01370.x
55. Vargas-Rojas MI, Crispín JC, Richaud-Patin Y, Alcocer-Varela J. Quantitative and Qualitative Normal Regulatory T Cells Are Not Capable of Inducing Suppression in SLE Patients Due to T-Cell Resistance. Lupus (2008) 17:289–94. doi: 10.1177/0961203307088307
56. Simpson N, Gatenby PA, Wilson A, Malik S, Fulcher DA, Tangye SG, et al. Expansion of Circulating T Cells Resembling Follicular Helper T Cells Is a Fixed Phenotype That Identifies a Subset of Severe Systemic Lupus Erythematosus. Arthritis Rheum (2010) 62:234–44. doi: 10.1002/ART.25032
57. Goropevšek A, Holcar M, Avčin T. The Role of STAT Signaling Pathways in the Pathogenesis of Systemic Lupus Erythematosus. Clin Rev Allergy Immunol (2016) 52(2):164–81. doi: 10.1007/s12016-016-8550-y
58. Wallace DJ, Furie RA, Tanaka Y, Kalunian KC, Mosca M, Petri MA, et al. Baricitinib for Systemic Lupus Erythematosus: A Double-Blind, Randomised, Placebo-Controlled, Phase 2 Trial. Lancet (2018) 392:222–31. doi: 10.1016/S0140-6736(18)31363-1
59. Platanias LC. Mechanisms of Type-I- and Type-II-Interferon-Mediated Signalling. Nat Rev Immunol (2005) 5:375–86. doi: 10.1038/NRI1604
60. Ho HH, Ivashkiv LB. Role of STAT3 in Type I Interferon Responses NEGATIVE REGULATION OF STAT1-DEPENDENT INFLAMMATORY GENE ACTIVATION *. THE J OF Biol Chem (2006) 281:14111–8. doi: 10.1074/jbc.M511797200
61. Wang W-B, Levy DE, Lee C-K. STAT3 Negatively Regulates Type I IFN-Mediated Antiviral Response. J Immunol (2011) 187:2578–85. doi: 10.4049/JIMMUNOL.1004128
62. Rasmussen TK, Andersen T, Bak RO, Yiu G, Sørensen CM, Stengaard-Pedersen K, et al. Overexpression of microRNA-155 Increases IL-21 Mediated STAT3 Signaling and IL-21 Production in Systemic Lupus Erythematosus. Arthritis Res Ther 2015 17:1 (2015) 17:1–12. doi: 10.1186/S13075-015-0660-Z
63. Jiang S, Zhang HW, Lu MH, He XH, Li Y, Gu H, et al. MicroRNA-155 Functions as an OncomiR in Breast Cancer by Targeting the Suppressor of Cytokine Signaling 1 Gene. Cancer Res (2010) 70:3119–27. doi: 10.1158/0008-5472.CAN-09-4250
64. Du H, Cui S, Li Y, Yang G, Wang P, Fikrig E, et al. MiR-221 Negatively Regulates Innate Anti-Viral Response. PloS One (2018) 13:e0200385. doi: 10.1371/JOURNAL.PONE.0200385
65. Kim HS, Kim DC, Kim H-M, Kwon H-J, Kwon SJ, Kang S-J, et al. STAT1 Deficiency Redirects IFN Signalling Toward Suppression of TLR Response Through a Feedback Activation of STAT3 OPEN. Nat Publishing Group (2015) 5:13414. doi: 10.1038/srep13414
66. Fish EN, Uddin S, Korkmaz M, Majchrzak B, Druker BJ, Platanias LC. Activation of a CrkL-Stat5 Signaling Complex by Type I Interferons. J Biol Chem (1999) 274:571–3. doi: 10.1074/JBC.274.2.571
67. Slight-Webb S, Guthridge JM, Chakravarty EF, Chen H, Lu R, Macwana S, et al. Mycophenolate Mofetil Reduces STAT3 Phosphorylation in Systemic Lupus Erythematosus Patients. JCI Insight (2019) 4(2):e124575. doi: 10.1172/jci.insight.124575
Keywords: interferon, lupus (SLE), CyTOF mass cytometry, STAT3 (signal transducer and activator of transcription 3), STAT1, autoantibodies, interferon signature
Citation: Yiu G, Rasmussen TK, Tsai BL, Diep VK, Haddon DJ, Tsoi J, Miller GD, Comin-Anduix B, Deleuran B, Crooks GM and Utz PJ (2022) High Interferon Signature Leads to Increased STAT1/3/5 Phosphorylation in PBMCs From SLE Patients by Single Cell Mass Cytometry. Front. Immunol. 13:833636. doi: 10.3389/fimmu.2022.833636
Received: 11 December 2021; Accepted: 11 January 2022;
Published: 28 January 2022.
Edited by:
José Carlos Crispín, Instituto Nacional de Ciencias Médicas y Nutrición Salvador Zubirán (INCMNSZ), MexicoReviewed by:
Kerry A. Casey, Regeneron Pharmaceuticals, Inc., United StatesCopyright © 2022 Yiu, Rasmussen, Tsai, Diep, Haddon, Tsoi, Miller, Comin-Anduix, Deleuran, Crooks and Utz. This is an open-access article distributed under the terms of the Creative Commons Attribution License (CC BY). The use, distribution or reproduction in other forums is permitted, provided the original author(s) and the copyright owner(s) are credited and that the original publication in this journal is cited, in accordance with accepted academic practice. No use, distribution or reproduction is permitted which does not comply with these terms.
*Correspondence: Paul J. Utz, cGp1dHpAc3RhbmZvcmQuZWR1
Disclaimer: All claims expressed in this article are solely those of the authors and do not necessarily represent those of their affiliated organizations, or those of the publisher, the editors and the reviewers. Any product that may be evaluated in this article or claim that may be made by its manufacturer is not guaranteed or endorsed by the publisher.
Research integrity at Frontiers
Learn more about the work of our research integrity team to safeguard the quality of each article we publish.