
95% of researchers rate our articles as excellent or good
Learn more about the work of our research integrity team to safeguard the quality of each article we publish.
Find out more
ORIGINAL RESEARCH article
Front. Immunol. , 03 February 2022
Sec. Cancer Immunity and Immunotherapy
Volume 13 - 2022 | https://doi.org/10.3389/fimmu.2022.809872
This article is part of the Research Topic Signaling Pathways Behind Immune Evasion And Therapy Resistance View all 5 articles
 Junjun Chen1,2†
 Tianzhu Lu1,2,3†
 Fangyan Zhong1,3†Qiaoli Lv1,2Min Fang1,3
 Ziwei Tu1,2,3Yulong Ji1,2
 Jingao Li1,2,3Xiaochang Gong1,2,3*
This study aimed to construct a signature of N6-methyladenosine (m6A) regulator-related genes that could be used for the prognosis of head and neck squamous cell carcinoma (HNSCC) and to clarify the molecular and immune characteristics and benefits of immune checkpoint inhibitor (ICI) therapy using the prognostic signature to define the subgroups of HNSCC. This study showed that eighteen m6A regulators were abnormally expressed in the Cancer Genome Atlas (TCGA) HNSCC tissues compared with those in normal tissues. We constructed a signature of 12 m6A regulator-related genes using the Cox risk model, combined with the least absolute shrinkage and selection operator (Lasso) variable screening algorithm. Based on the median of the signature risk score, the patients were divided into high- and low-risk groups. The Kaplan–Meier survival analyses showed that patients with high-risk scores demonstrated poorer overall survival (OS) than those with low-risk scores based on TCGA-HNSCC data (p <0.001). The OS of high-risk patients was significantly worse than that of low-risk patients in the GSE65858 (p <0.001) and International Cancer Genome Consortium (ICGC) oral cancer cohorts (p = 0.0089). Furthermore, immune infiltration analyses showed that 8 types of immune cell infiltration showed highly significant differences between the two risk groups (p <0.001). In the Imvigor210CoreBiologies dataset of patients who received ICIs, the objective response rate (ORR) of the low-risk group (32%) was significantly higher than that of the high-risk group (13%). Additionally, patients in the high-risk group presented with a more significant adverse OS than that of the low-risk group (p = 0.00032). GSE78220 also showed that the ORR of the low-risk group (64%) was higher than that of the high-risk group (43%) and the OS of low-risk patients was better than that of high-risk patients (p = 0.0064). The constructed prognostic signature, based on m6A regulator-related genes, could be used to effectively distinguish between prognoses for HNSCC patients. The prognostic signature was found to be related to the immune cell infiltration of HNSCC; it might help predict the responses and prognoses of ICIs during treatment.
Head and neck squamous cell carcinoma (HNSCC) is a commonly occurring malignancy reported in humans worldwide (1, 2). Presently, most patients are diagnosed in the later stages, which often leads to a high risk of recurrence and metastatic disease development; the 5-year survival rates remain at 40%–50% (3, 4). The current standard management for HNSCC includes the assessment of patients’ prognoses based on the size, location, and invasion of their tumors using the Tumor, Nodes, and Metastases (TNM) classification system; strategies are formulated on this basis (5). However, patients within the same TNM stage continue to demonstrate different responses to treatment (6). Therefore, it is imperative to discover stable and reliable molecular signatures to evaluate the prognoses of patients and to propose more effective treatments.
N6-methyladenosine (m6A) is the most common post-transcriptional RNA modification documented in eukaryotic cells; these modifications mostly occur near mRNA stop codons in the 5′- and 3′-untranslated regions (UTRs), as well as in internal long exons (7, 8). The m6A methylation level is coordinated by the action of methyltransferases (“writers”) such as the enzymes methyltransferase (METTL)3, METTL14, Wilms tumor 1-associated protein (WTAP), and VIRMA; by the action of demethylases (“erasers”) such as fat mass- and obesity-associated protein (FTO) and α-ketoglutarate-dependent dioxygenase AlkB homolog 5 (ALKBH5); and by the action of binding protein “readers” such as YTH domain-containing 1 (YTHDC1), YTH domain-containing 2 (YTHDC2), YTH N6-methyl-adenosine RNA binding protein 1 (YTHDF1), YTH N6-methyladenosine RNA binding protein 2 (YTHDF2), and heterogeneous nuclear ribonucleoprotein C (HNRNPC) (9–11). M6A methylation plays an essential role in many physiological and pathological processes, including immune response generation, microRNA editing, and the progression of various cancers (12–14).
The epigenetic modification of m6A methylation results in the regulation of tumor progression by affecting the expression of oncogenes or suppressor genes. For example, METTL3 expression is significantly upregulated in bladder cancer and is closely related to poor prognoses in patients (15). Moreover, many studies have shown that m6A methylation is closely related to anti-tumor immune response generation. Han et al. have demonstrated that YTHDF1 is an essential mediator of tumor immune evasion; their findings suggest that it may be a potential target for improving the efficacy of immunotherapy (16). Previously, Yi found that the signature based on m6A regulators can distinguish the prognosis of HNSCC patients (17). Simultaneously, the study found that some m6A regulators were correlated with the expression of PD-L1 in HNSCC. This means that m6A methylation played a vital role in the tumor immune microenvironment of HNSCC. However, due to the limited number of m6A regulators, the accuracy of this model for evaluating the prognosis of HNSCC is not ideal. The m6A regulators can extensively regulate the expression of downstream genes through m6A methylation. Therefore, constructing a prognostic risk model based on m6A regulator-related genes may better evaluate prognosis and immunotherapy response.
Here, first, m6A regulators related to genes were identified using TCGA database. Next, 12 genes were screened through univariate Cox analysis and the least absolute shrinkage and selection operator (Lasso) regression. A risk prognosis signature was then established through multivariate Cox regression analysis. Finally, the accuracy of the signature was verified in both the training and validation sets, and the relationship between the prognostic signature and immunotherapy responses was explored. In conclusion, it is anticipated that this study will provide insights for the development of a stable tool regarding prognosis and immunotherapy predictions that will be valuable for HNSCC patients.
The data on genome copy number variation, gene mutation, gene expression, and methylation levels were downloaded from the TCGA-HNSCC database (https://xenabrowser.net/datapages/). For transcriptome data, 546 TCGA-HNSCC samples were used, including 500 tumor tissue samples, 44 normal tissue samples, and two metastatic cancer tissue samples. After removing the two metastatic cancer samples, 544 samples were used for gene expression correlation analysis. The clinical information of HNSCC patients in TCGA is provided in Table 1. All 522 copy number variation samples from the Gistic2 database were used for correlation analysis. For acquiring TCGA-HNSCC methylation data, the methylation beta value was directly used for correlation analysis; it was downloaded from TCGA-HNSCC database UCSC Xena (https://xenabrowser.net/datapages/). Additionally, the immune infiltration data of TCGA-HNSCC samples were obtained from http://timer.comp-genomics.org. M6A methylation modification sites were predicted according to the data and software provided by http://www.cuilab.cn/sramp. GSE65858 and GSE78220 datasets were acquired from Gene Expression Omnibus (GEO) and International Cancer Genome Consortium (ICGC) oral cancer from India (ORCA-IN) data. The immune response data were obtained using the R package “IMvigor210CoreBiologies” (v.1.0.0) (18). Data information used in this study is shown in Supplementary Table 1.

Table 1 Clinical information of HNSCC patients in The Cancer Genome Atlas.
The data on 21 m6A regulators were collected from the document (14). TCGA-HNSCC dataset included data on 500 HNSCC and 44 normal tissues. After performing logarithmic transformation and normalization of the expression data of all samples, the differences in expression of m6A regulators in tumor tissues versus normal tissues were illustrated via heatmaps.
The R package “maftool” was used for SNV analysis, with default settings used for all parameters (19). For the TCGA dataset, SNV and CNV amplifications and deletions were determined and summarized for each gene in all samples and each cancer type; the R package “ComplexHeatmap” was then used to generate SNV mutation heatmaps for each cancer type (20). In the visual display of the Cancer Cell Line Encyclopedia (CCLE) and Genomics of Drug Sensitivity in Cancer (GDSC) datasets, CNV data included gene-level circular binary segmentation (CBS) copy number data and was not processed using the Gistic2 number algorithm.
The R package “clusterProfiler” was used to conduct KEGG pathway and GO enrichment analyses (21). The parameters used were pAdjustMethod = “BH” and p-value cutoff = 0.05. Then, Cytoscape cluGo was used to visualize KEGG channels and GO networks.
The selection of candidate risk m6A regulators related to genes was performed via univariate Cox regression and Lasso analyses. Multivariate Cox regression analysis was used to establish a profile of independent prognostic genes. The risk score calculation was conducted according to the following formula: where Ri represents the risk rate of the first sample; I = 1, 2,…, 500; βj denotes the regression coefficient of the gene j in the Cox model; j = 1, 2,…, 12; and xij indicates the expression value of the gene j in sample i. The patients were divided into high-risk and low-risk groups, based on the mean value of the risk score.
The m6A modification sites were predicted using the sequence-based RNA adenosine methylation site predictor (SRAMP) software. As a public prediction server, SRAMP combines three random forest classifiers that exploit the positional nucleotide sequence pattern, the K-nearest neighbor information, and the position independent nucleotide pair spectrum features to accurate identification of RNA m6A sites. SRAMP uses either genomic sequences or cDNA sequences as its input, achieving competitive performance in cross-validation tests and rigorous independent benchmarking tests (22). The gene symbols of significantly enriched genes were converted into gene bank Accession Number IDs by utilizing the “bitr” function of the R package “Clusterprofiler.” Then, the R package “rentrez” was used to download the transcript sequence of each gene from the gene bank (2021.3.6 download) in the same gene selection database. The longest transcript in the database of the same gene was selected.
Tumor immune infiltration analysis was based on the proportion of immune cells predicted by using the Cibersort software. First, the death risk of each TCGA-HNSCC sample was calculated according to the 12-gene multivariate Cox model screened via Lasso analysis. Then, 500 HNSCC cancer tissue samples were divided into high- and low-risk groups, based on the median value of the death risk of all samples. Cibersort was used to estimate the infiltration ratios of 22 immune cells in 500 HNSCC cancer tissue samples. A visualization method (bar chart) was used to show differences in immune cell infiltration in the high- and low-risk groups, and the Wilcoxon test was further used to perform statistical tests for the differences in immune cell infiltration between these groups. For immune cells with significant differences between the high- and low-risk groups, all samples were divided into high- or low-infiltration groups using median or tertile values; the survival difference between the two groups of patients was then analyzed using the R package “survival” (23).
The ESTIMATE algorithm (Estimation of STromal and Immunecells in MAlignant Tumor tissues using Expression data) (24) was used to value stromal and immune microenvironment infiltration based on gene transcriptome data. The analysis method is integrated with the R package “ESTIMATE.” TMB is a measure of the total number of mutations per megabyte of tumor tissue. It represents the mutation density of tumor genes and defined as the average number of mutations in the tumor genome including the total number of gene coding errors, base substitution insertions, or deletions (25).
The IMvigor210CoreBiologies and GSE78220 datasets were used to analyze the correlation between prognostic signature and the treatment response to ICIs, including differences in effectiveness and survival prognosis. The ICI efficacy was evaluated according to the response evaluation criteria in solid tumors (RECIST) v.1.1 standards. Responders are referred to as patients with objective response rate (ORR), complete remission (CR), or partial remission (PR), whereas non-responders are defined as those with stable disease (SD) or progressive disease (PD).
A flow chart for the m6A regulator-related genes signature development and subsequent analyses has been provided in Figure 1. Pearson’s correlation coefficients and the corresponding p values were calculated between m6A regulatory factors and other genes at three levels, namely transcription level, methylation level, and CNV mutation number. Pearson’s correlation coefficients of >0.5 or <-0.5 and a p-value of <0.05 were used as thresholds to perform screening of correlations at the three levels of gene expression, methylation, and CNV, respectively. Genes with significant correlations at all three levels were selected for the next step of the analysis.
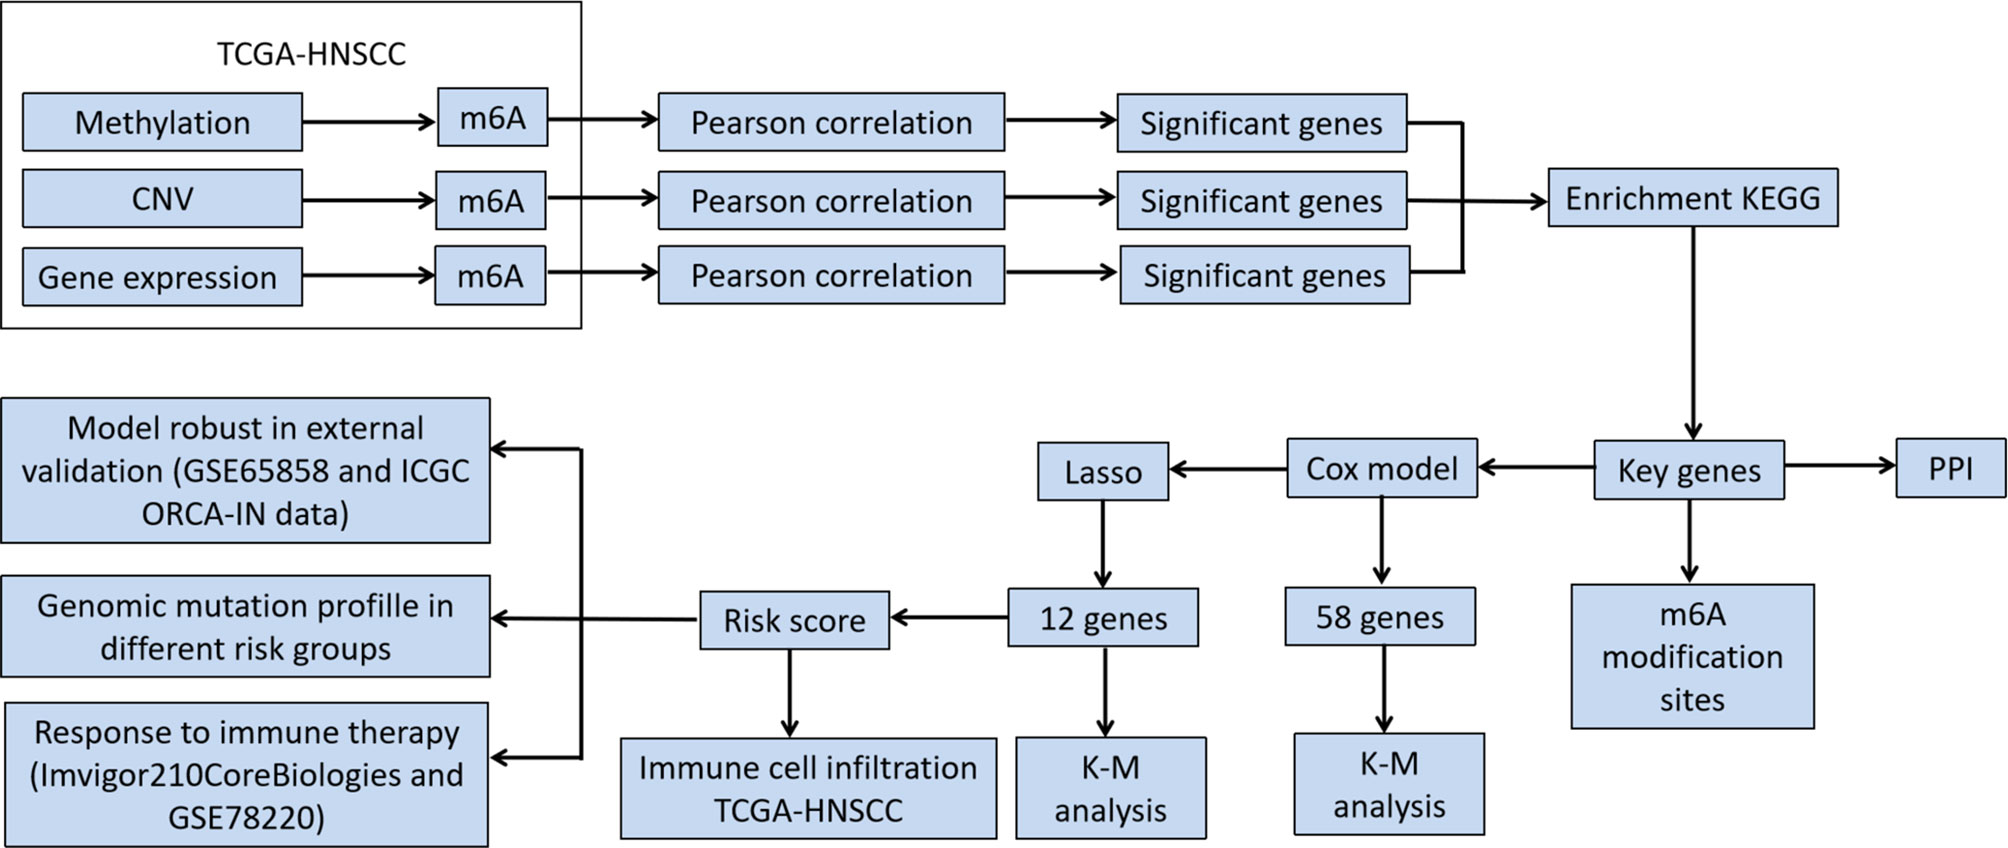
Figure 1 Flowchart of the study.
Univariate and multivariate Cox regression analyses were performed to analyze the correlations between the genes and the overall survival (OS) in HNSCC patients. First, significant m6A regulator-related genes were screened according to the univariate Cox regression results; they were then further screened using Lasso regression analysis. The significantly different genes screened in the above-mentioned step were used to establish a multivariate Cox model. This was combined with Lasso regularization to conduct variable screening. The Lasso screening parameters were α = 1, nλ = 100, and λ=λ.min. Those genes whose multivariate Cox regression coefficients were not equal to zero under Lasso regularization were selected as target genes to conduct the next step of the analysis. Kaplan–Meier (K-M) and log-rank analyses were used to evaluate the survival differences between patient groups. Results were considered statistically significant if a two-sided p-value <0.05.
In total, 544 cases based on TCGA-HNSCC transcriptomic data were analyzed, including 500 tumor tissues and 44 normal tissue samples, revealing that the expression of 18 m6A regulator genes was higher in tumor tissues than that in normal tissues, including 7 m6A writer genes (VIRMA, RBM15, METTL3, WTAP, CBLL1, METTL14, and LRPPRC), 9 reader genes (IGF2BP1, HNRNPC, HNRNPA2B1, YTHDF1, ELAVL1, FMR1, YTHDF3, YTHDF2, and YTHDC1) and 2 erasers genes (ALKBH5 and FTO) (Figures 2A, B). These results indicate that m6A modification is related to the occurrence of HNSCC.
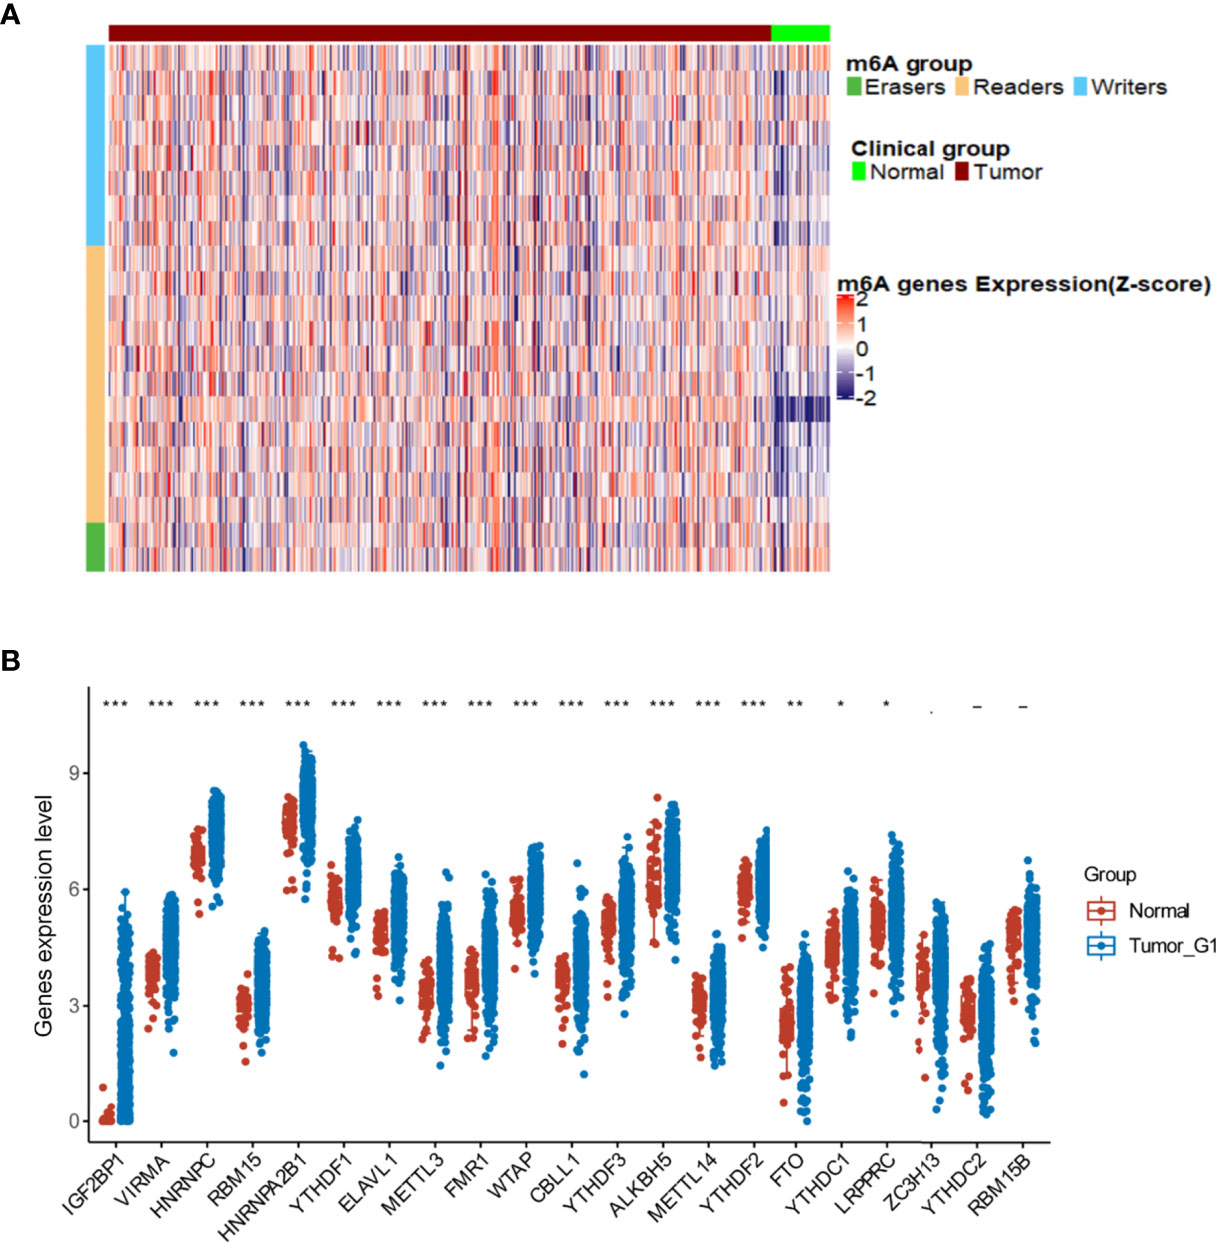
Figure 2 Alterations in m6A regulators in The Cancer Genome Atlas- head and neck squamous cell carcinoma (HNSCC) patients. (A) Heatmap showing the expression of m6A regulators in tumor and normal tissues. (B) Differences illustrated in expression levels between HNSCC (blue box) and normal (red box) tissues for 21 m6A regulators. For t-test: ns, p ≥ 0.05; *p < 0.05; **p < 0.01; ***p < 0.001.
Pearson correlation analysis was used to perform screening of m6A regulator-related genes with significant correlations at the CNV, mutation, and transcription levels (|Pearson’s R| > 0.5 and p < 0.05). As a result, 9176 genes were detected and found to be significantly correlated with m6A regulatory genes at the CNV level (Table 2); 17,309 genes were significantly correlated at the methylation level (Table 3), and 8504 genes were significantly correlated at the transcription level (Table 4). The Venn diagram presented in Figure 3A shows that the expression of 1598 genes at the transcription, CNV, and methylation levels were related to the expression of m6A regulators. The specific 1598 genes are shown in Supplementary Table 2. Among them, 192 genes were significantly correlated with YTHDC2 at the methylation level, 146 genes were correlated with YTHDC2 at the CNV level, and 796 genes were significantly correlated with YTHDC2 at the transcription level. Thirty-three genes were significantly correlated with YTHDC2 at the methylation, CNV, and transcription levels. The parts of genes that are highly correlated with m6A regulatory factors are summarized in Supplementary Figure 1.
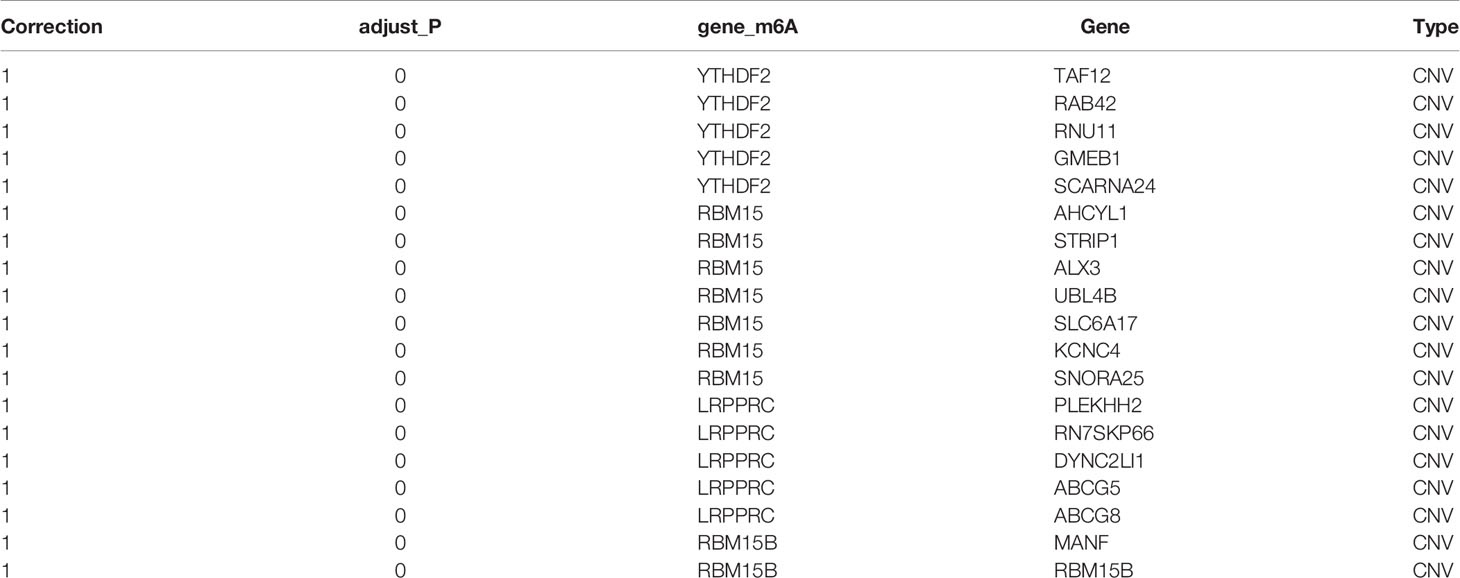
Table 2 Genes were significantly correlated with m6A regulators at the level of copy number variation (top 20).
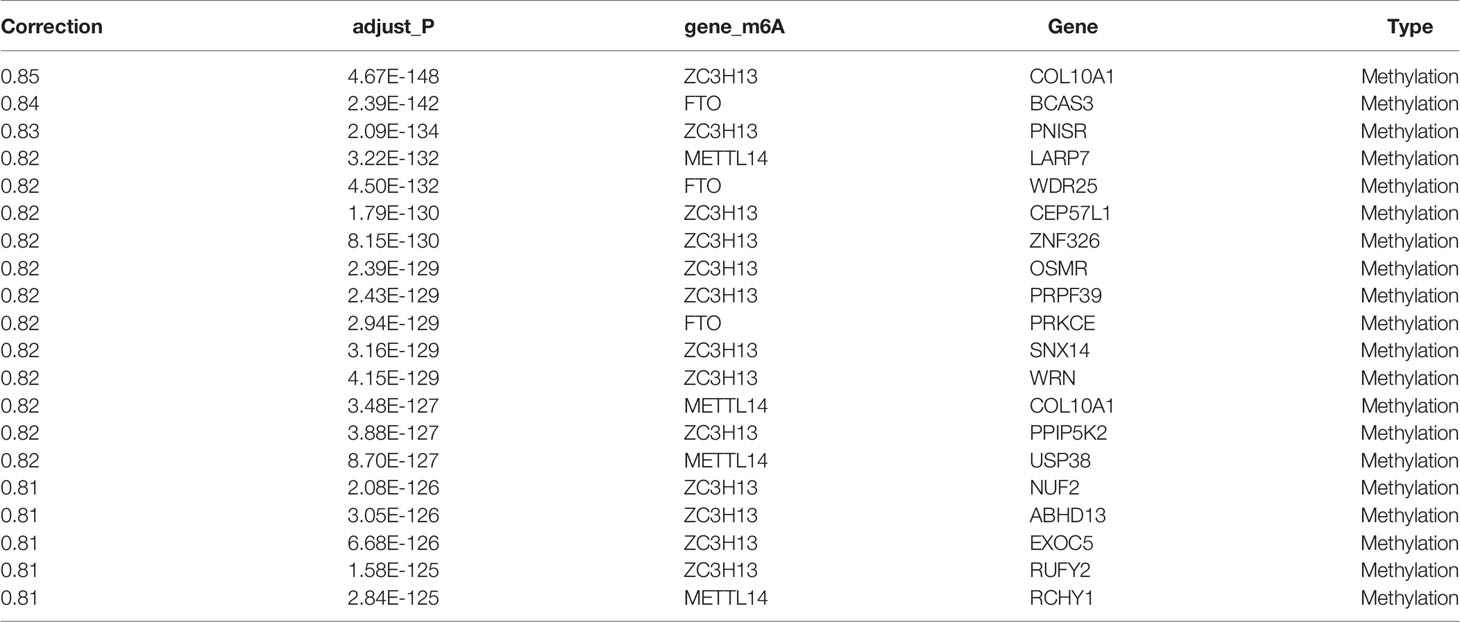
Table 3 Genes were significantly correlated at the methylation level (top 20).
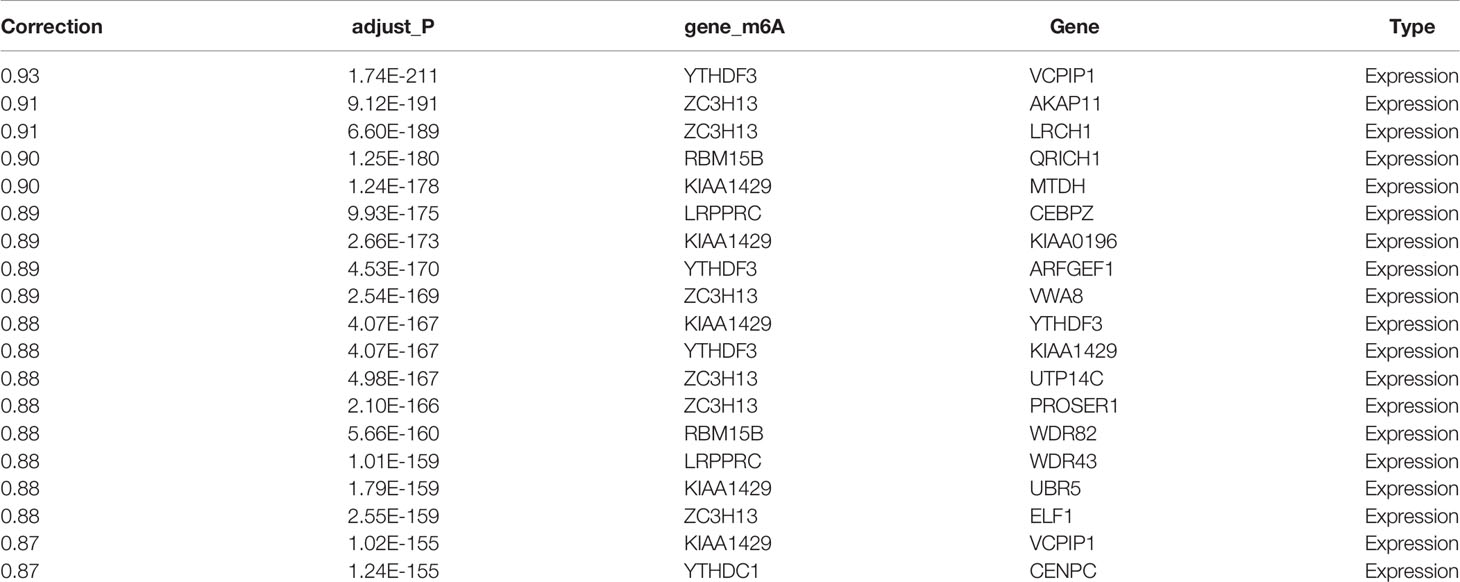
Table 4 Genes were significantly correlated with m6A regulators at the transcription level (top 20).
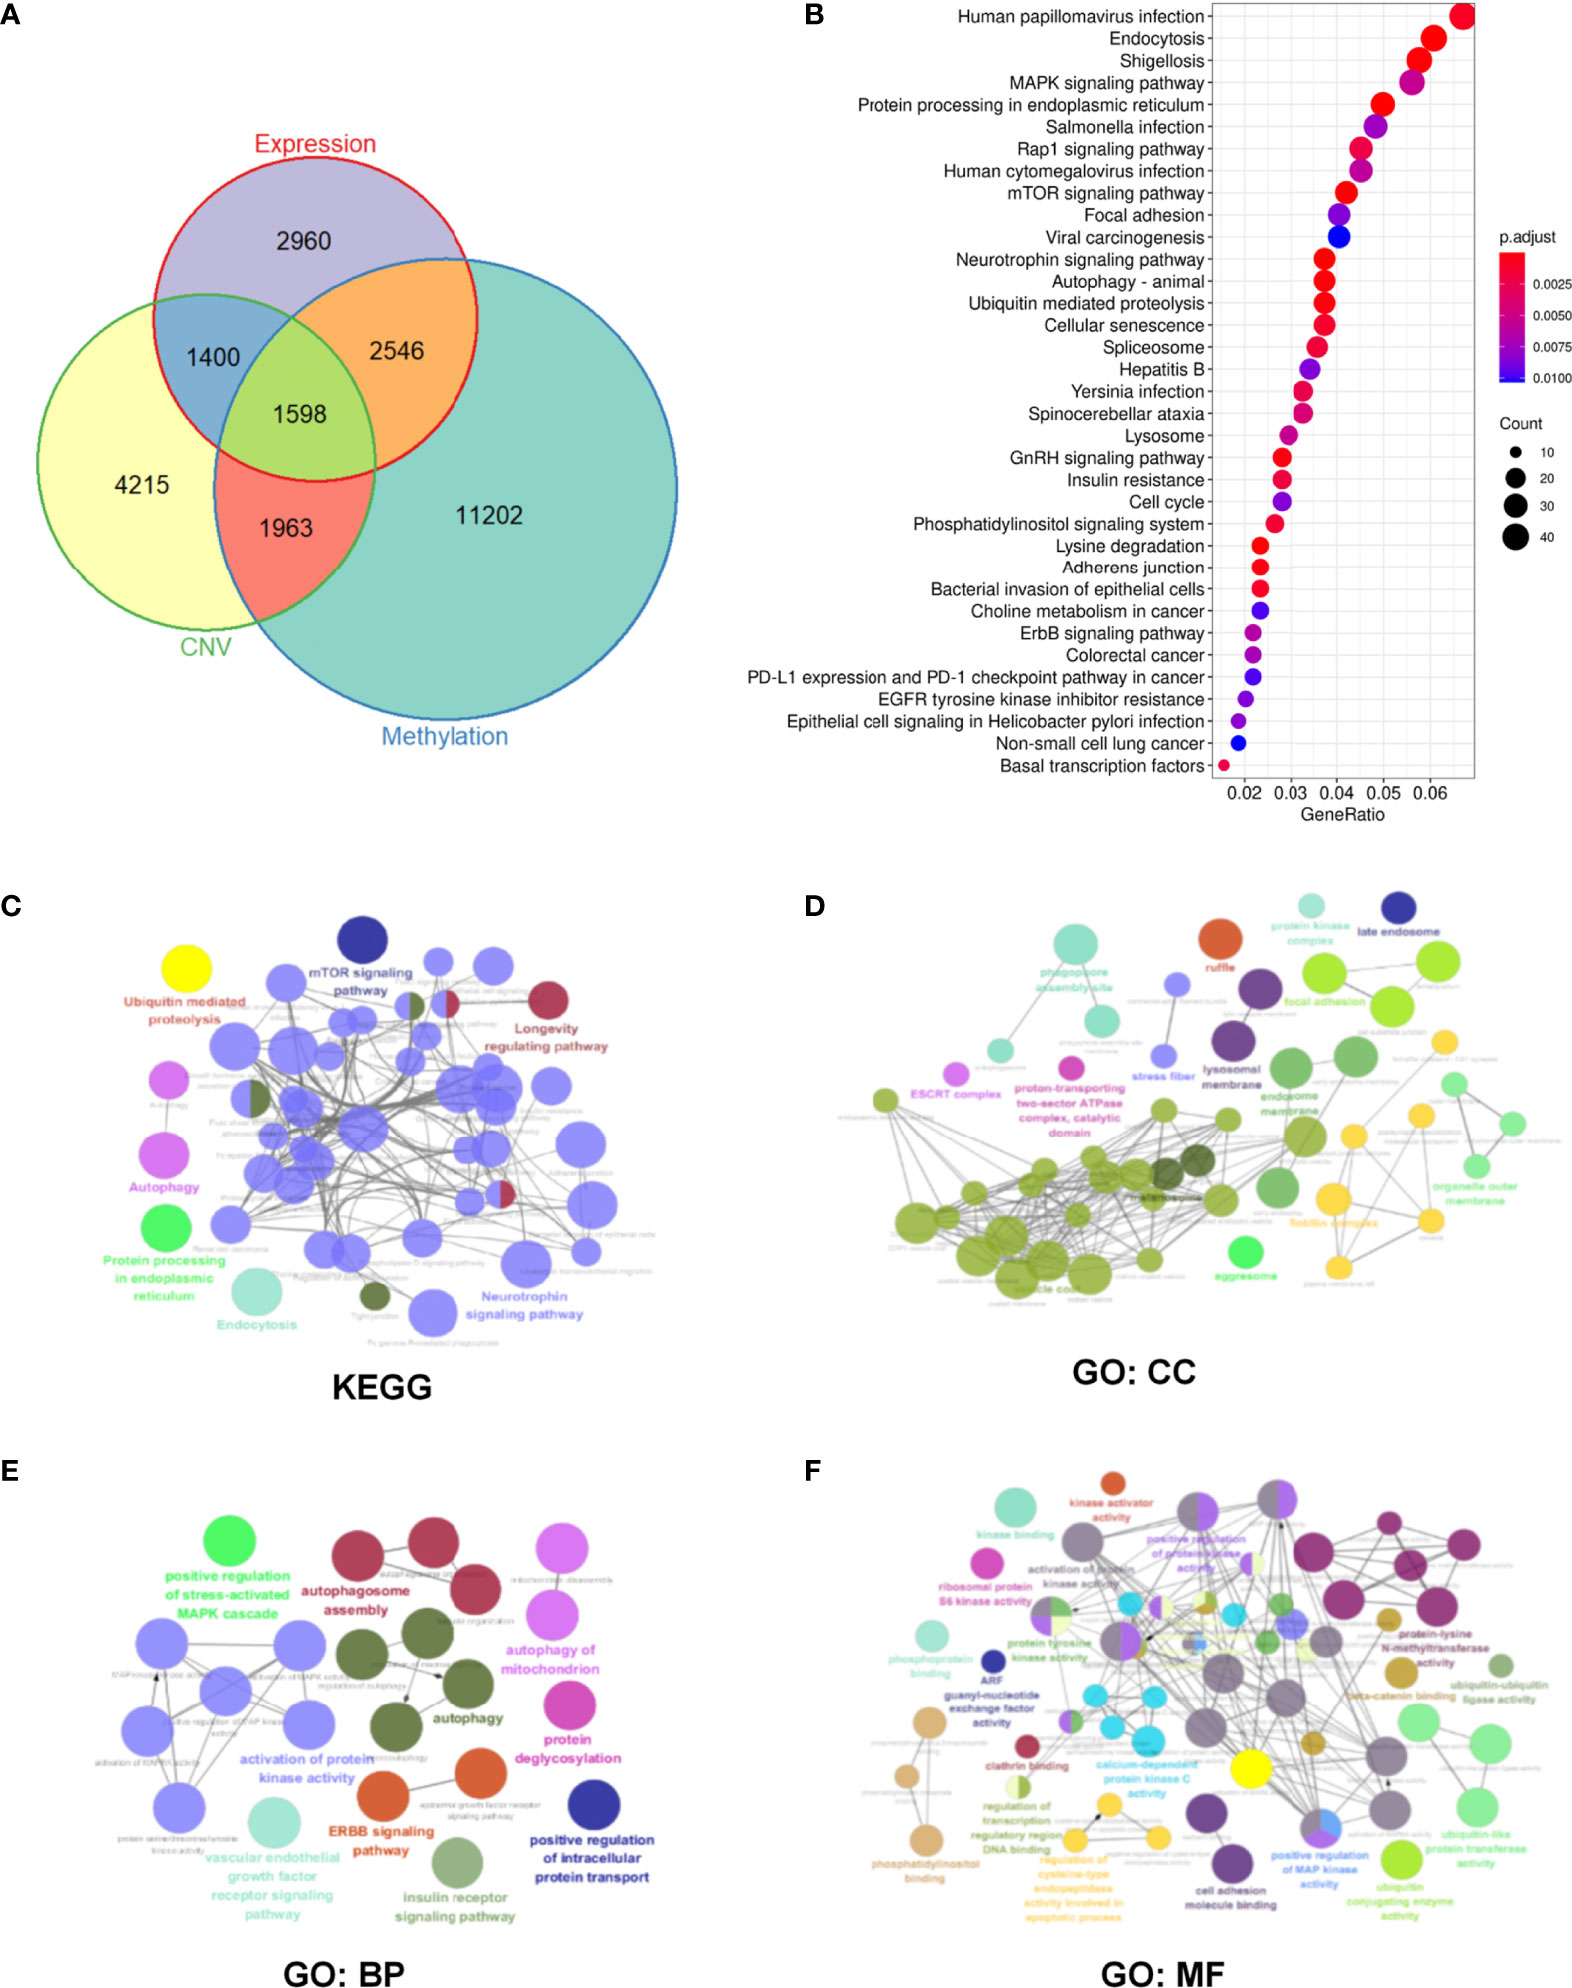
Figure 3 Identification and enrichment pathway analysis of m6A regulator-related mRNAs in head and neck squamous cell carcinoma (HNSCC) patients. (A) Overlapped differentially expressed genes at CNV, methylation, and transcription levels. (B) Enrichment analysis of 1598 m6A regulator-related genes via the Kyoto Encyclopedia of Genes and Genomes (KEGG) pathway. (C–F) Significantly enriched KEGG and Gene Ontology (GO) pathways. Objects with the same color belong to the same group and have been depicted using the same color label on the side. GO analysis helped classify regulators into the biological process (BP), cellular component (CC), and molecular function (MF) groups.
Based on 1598 m6A regulator-related genes, KEGG pathway enrichment analysis was conducted and revealed that 65 pathways were significantly enriched (p <0.05) (Supplementary Table 3). The top 35 enrichment KEGG pathways have been shown in Figure 3B. Furthermore, 187 m6A regulator-related genes in the top ten pathways were selected for subsequent analysis (Supplementary Tables 4 and 5). The Cytoscape plug-in “ClueGO” was used to perform network analysis using the KEGG pathway and GO results of these 187 m6A regulator-related genes. In terms of KEGG pathways, mTOR, autophagy, and the ubiquitin-mediated proteolysis signaling pathway were found to be significantly enriched (Figure 3C). In the cellular component (CC), focal adhesion and the protein kinase complex were found to be significantly enriched (Figure 3D). For the biological process (BP), significantly enriched pathways included protein kinase-related processes, autophagy, and the stress-activated mitogen-activated protein kinase (MAPK) cascade (Figure 3E). For molecular function (MF), protein kinase activity and cell adhesion were found to be significantly enriched (Figure 3F).
Moreover, analysis of the SNV and CNV mutations of these 187 m6A regulator-related genes in head and neck cancer, ovarian cancer, cervical cancer, endometrial cancer, colorectal cancer, and breast cancer showed that endometrial cancer presented with the most considerable mutation burden for SNV, whereas the mutation burden in HNSCC was relatively low (Supplementary Figure 2).
Univariate Cox regression analysis showed that 58 m6A regulator-related genes were associated with the survival of HNSCC patients (Figure 4A). The K-M survival curve of patients with high- and low-expression groups of certain key m6A regulator-related genes is presented in Supplementary Figure 3. Subsequently, HNSCC patients were divided into low- and high-expression groups according to the median expression of each m6A regulator-related gene. Lasso-Cox regression results indicated that 12 genes could be considered as prognostic factors of OS in HNSCC patients (Figure 4B). The lasso-Cox regression coefficients for these 12 genes have been shown in Figure 4C. Construction of a protein–protein interaction (PPI) network of 58 genes using the string protein interaction database and revelation of the top 12 genes indicated that PRKCA, MAP2K7, VDAC1, FZD6, SQSTM1, and CYCS were located at key positions (Figure 4D). Moreover, the 12 key m6A regulator-related genes revealed by using the SRAMP software were considered to be potential m6A methylation modification sites (Figure 5).
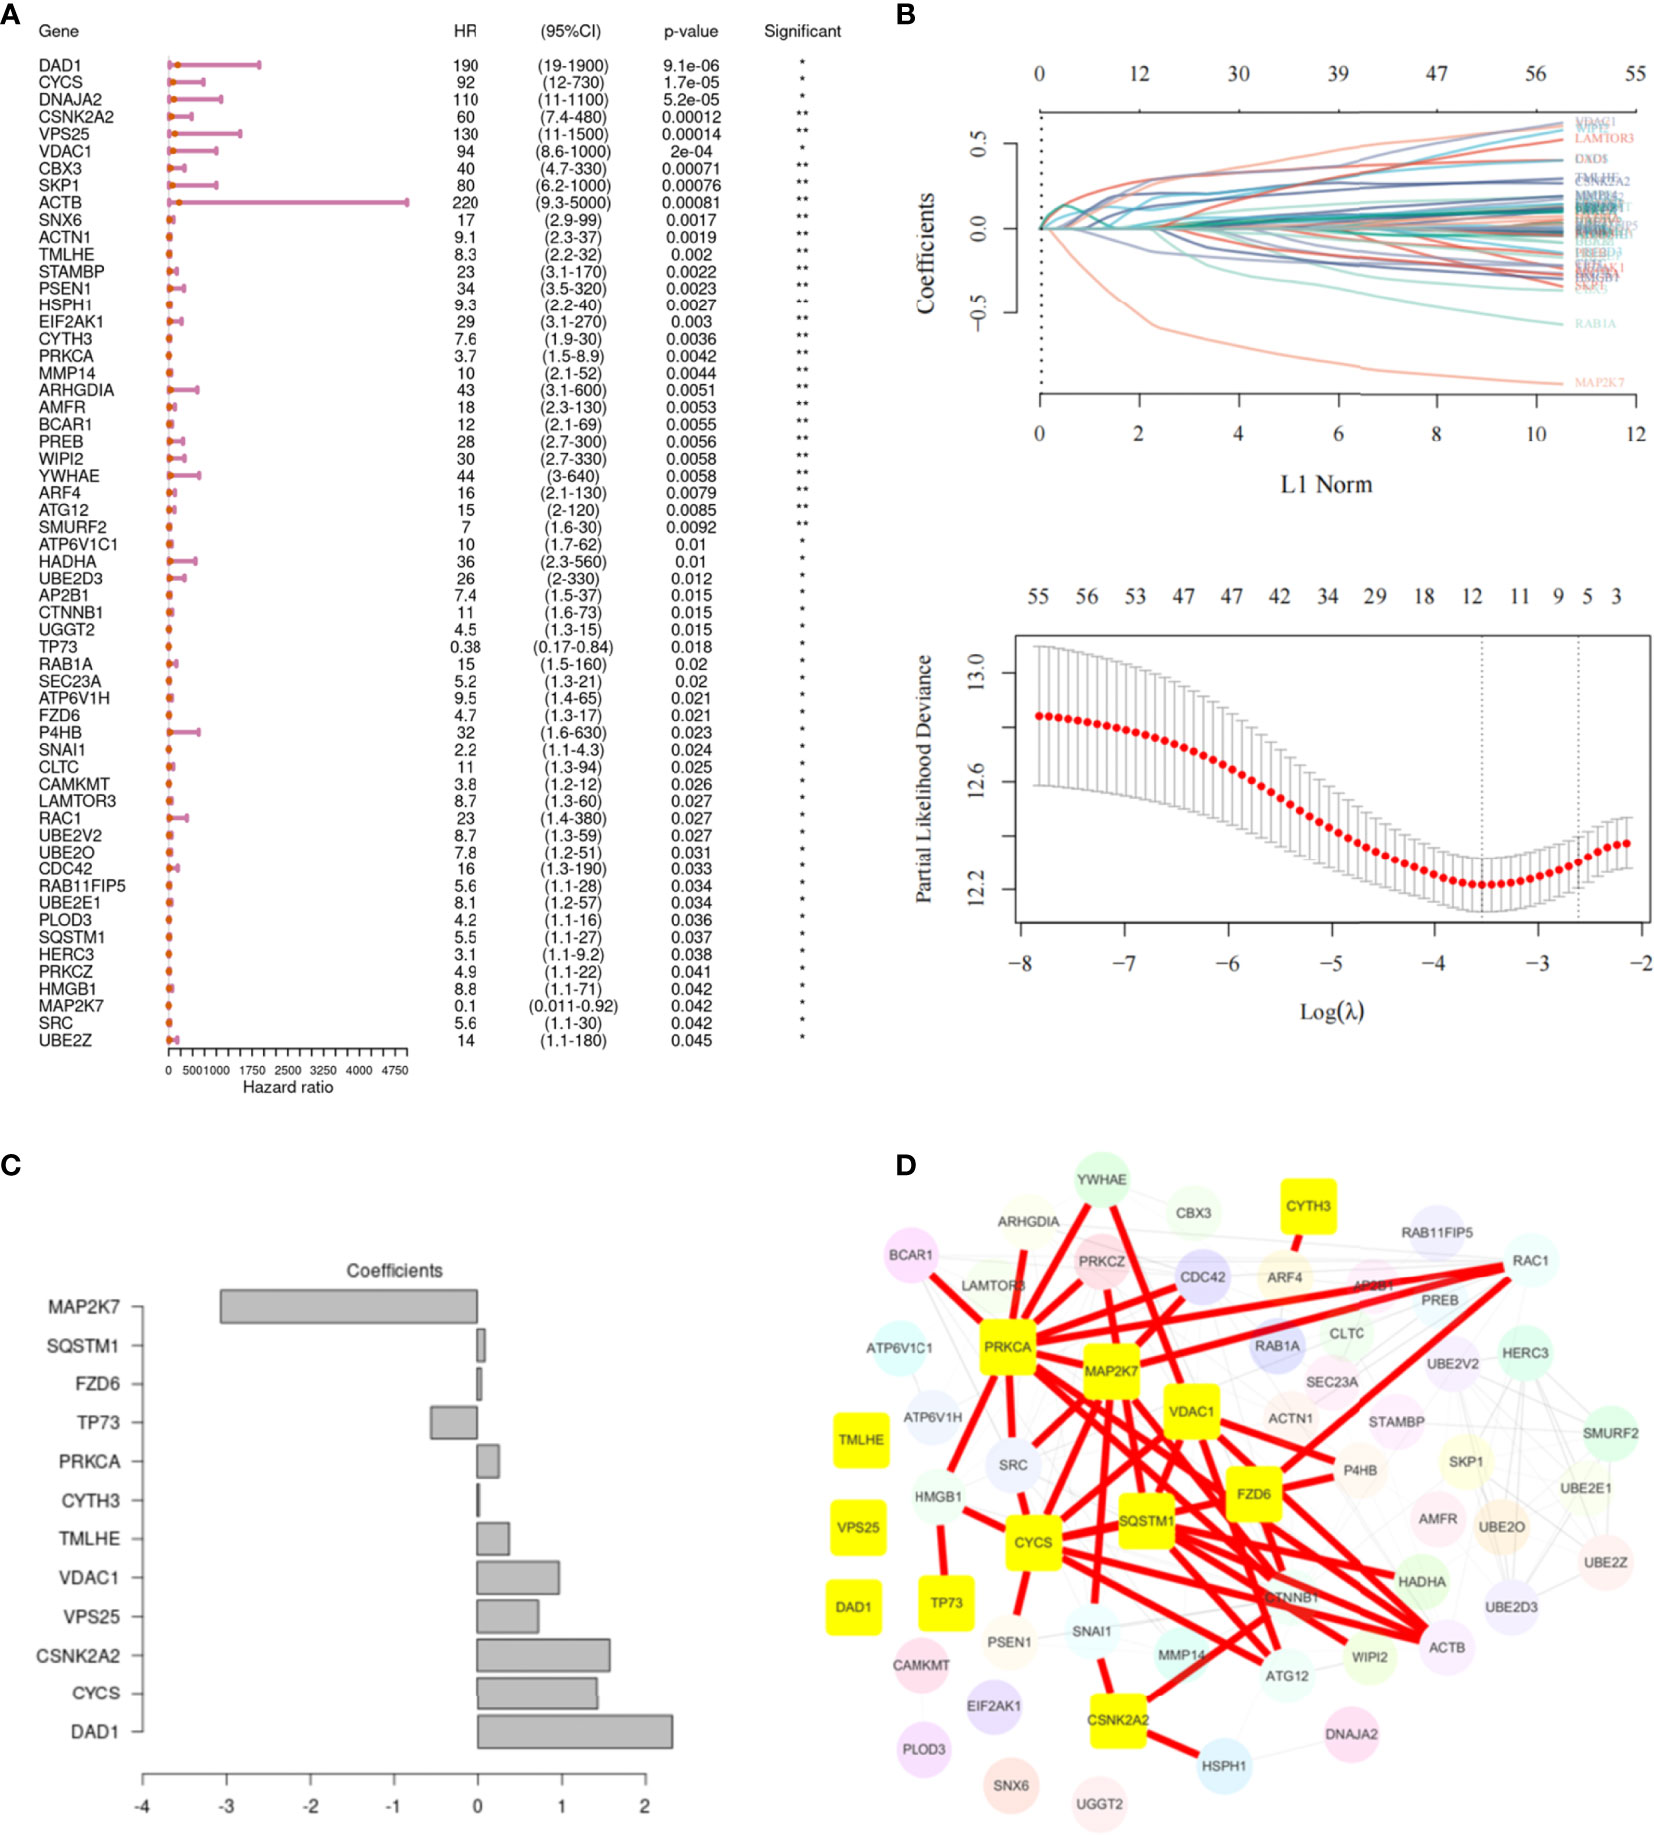
Figure 4 Screening of the key genes related to m6A in head and neck squamous cell carcinoma (HNSCC). (A) Univariate Cox regression analysis, showing 58 m6A regulator-related genes associated with the survival of patients with HNSCC. (B) The 12 m6A regulator-related genes are most relevant to the survival status, as identified by screening with the Lasso–Cox regression. The partial likelihood deviance is shown against log (Lambda). A vertical line is drawn at the value fitting the tenfold cross-validation. (C) The Lasso–Cox regression coefficients for the 12 identified genes. (D) PPI network of 58 genes, highlighting the top 12 genes.
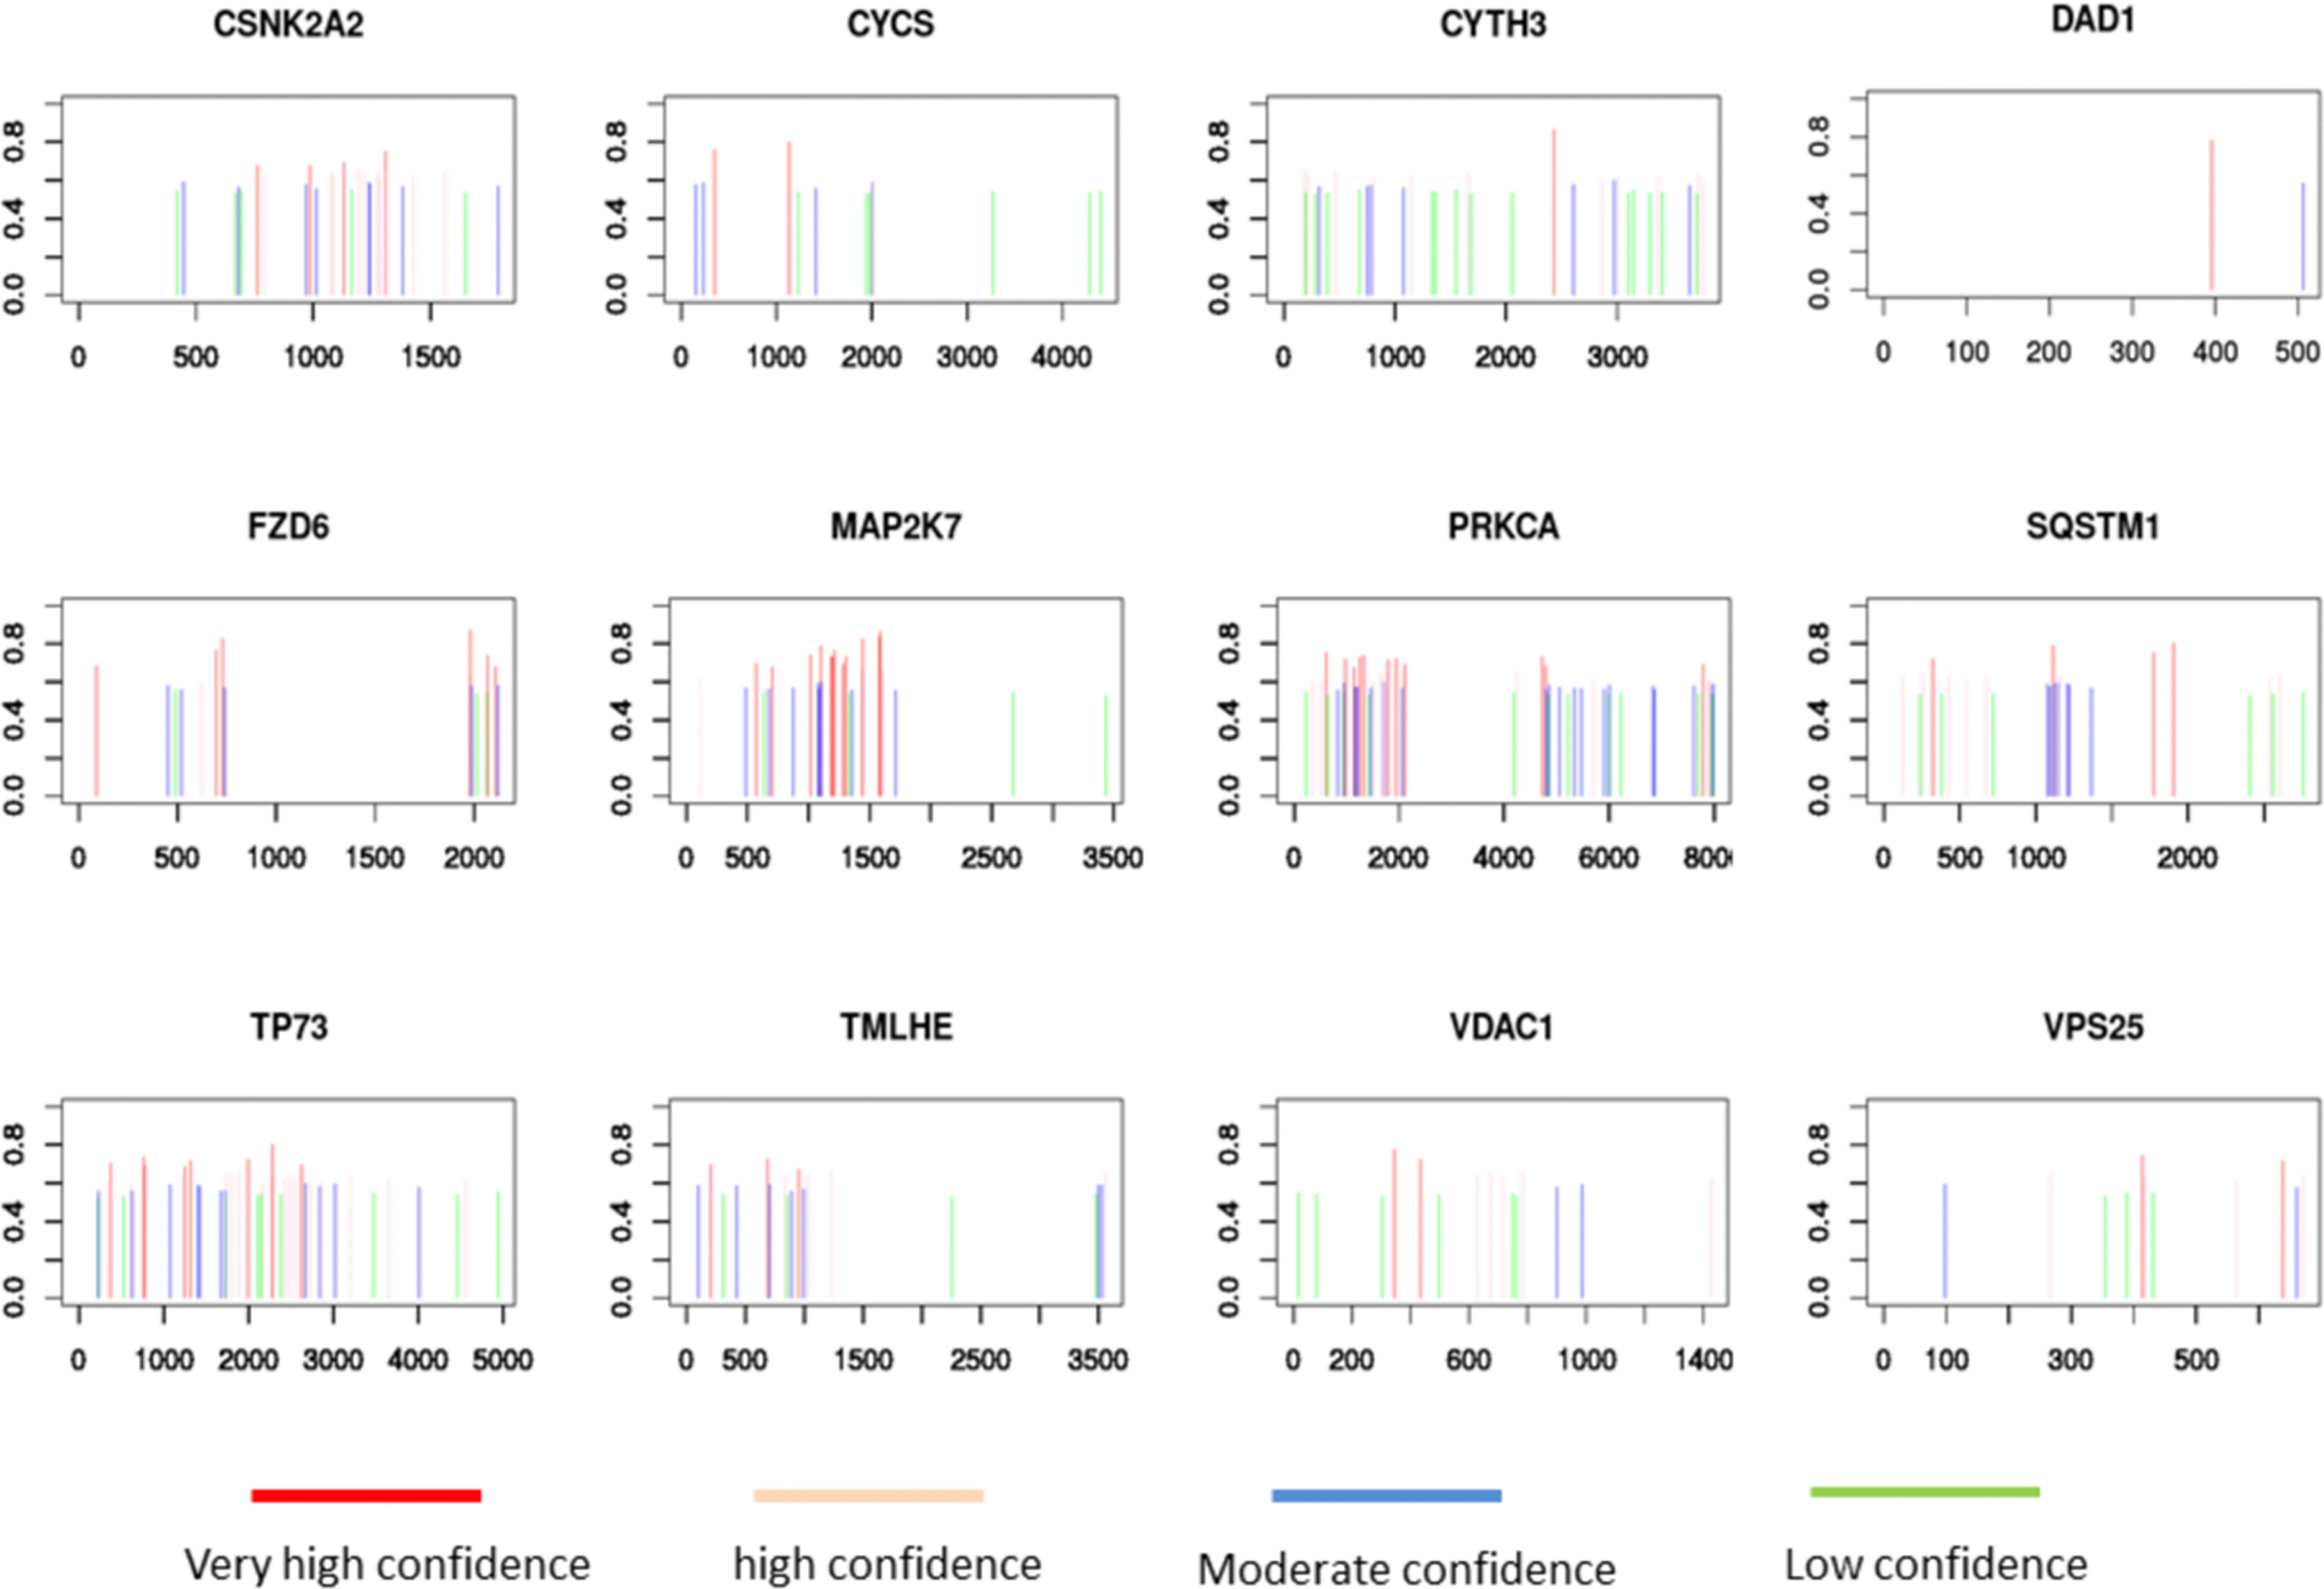
Figure 5 SRAMP analysis of potential m6A methylation modification sites on 12 m6A regulator-related genes.
The 12 genes selected via Lasso regression analysis were used for multivariate Cox regression analysis to obtain the survival risk score of each sample in TCGA-HNSCC (Figure 6A). Then, risk scores were calculated for every cancer sample calculated by using the following formula: Riskraw = DAD1*2.316+CYCS*1.426+CSNK2A2*1.576+VPS25*0.728+VDAC1*0.976+TMLHE*0.381+CYTH3*0.024+PRKCA*0.260-TP73*0.567+FZD6*0.047+SQSTM1*0.094-MAP2K7*3.070. It is normalized while visualizing the risk score using the following formula: Risk score = Riskraw-median of all Riskraw. Based on the median signature risk score, the patients were divided into high- and low-risk groups. The K-M survival curve showed that high-risk patients exhibited poorer OS than low-risk patients based on TCGA-HNSCC data (p <0.001; Figure 6B). Patients’ 3-, 5-, and 10-year survival statuses were assessed using the risk rate; the prediction accuracy was evaluated using the area under the curve (AUC). The predicted AUC values for survival at 3, 5, and 10 years were 0.70, 0.72, and 0.75, respectively (Figure 6C). Multivariate analyses confirmed that the high-risk group was an independent inferior factor for OS (HR=3.00, 95% CI: 2.00–4.60, p < 0.001), after adjusting gender, age, clinical stage, and histology grade (Table 5).
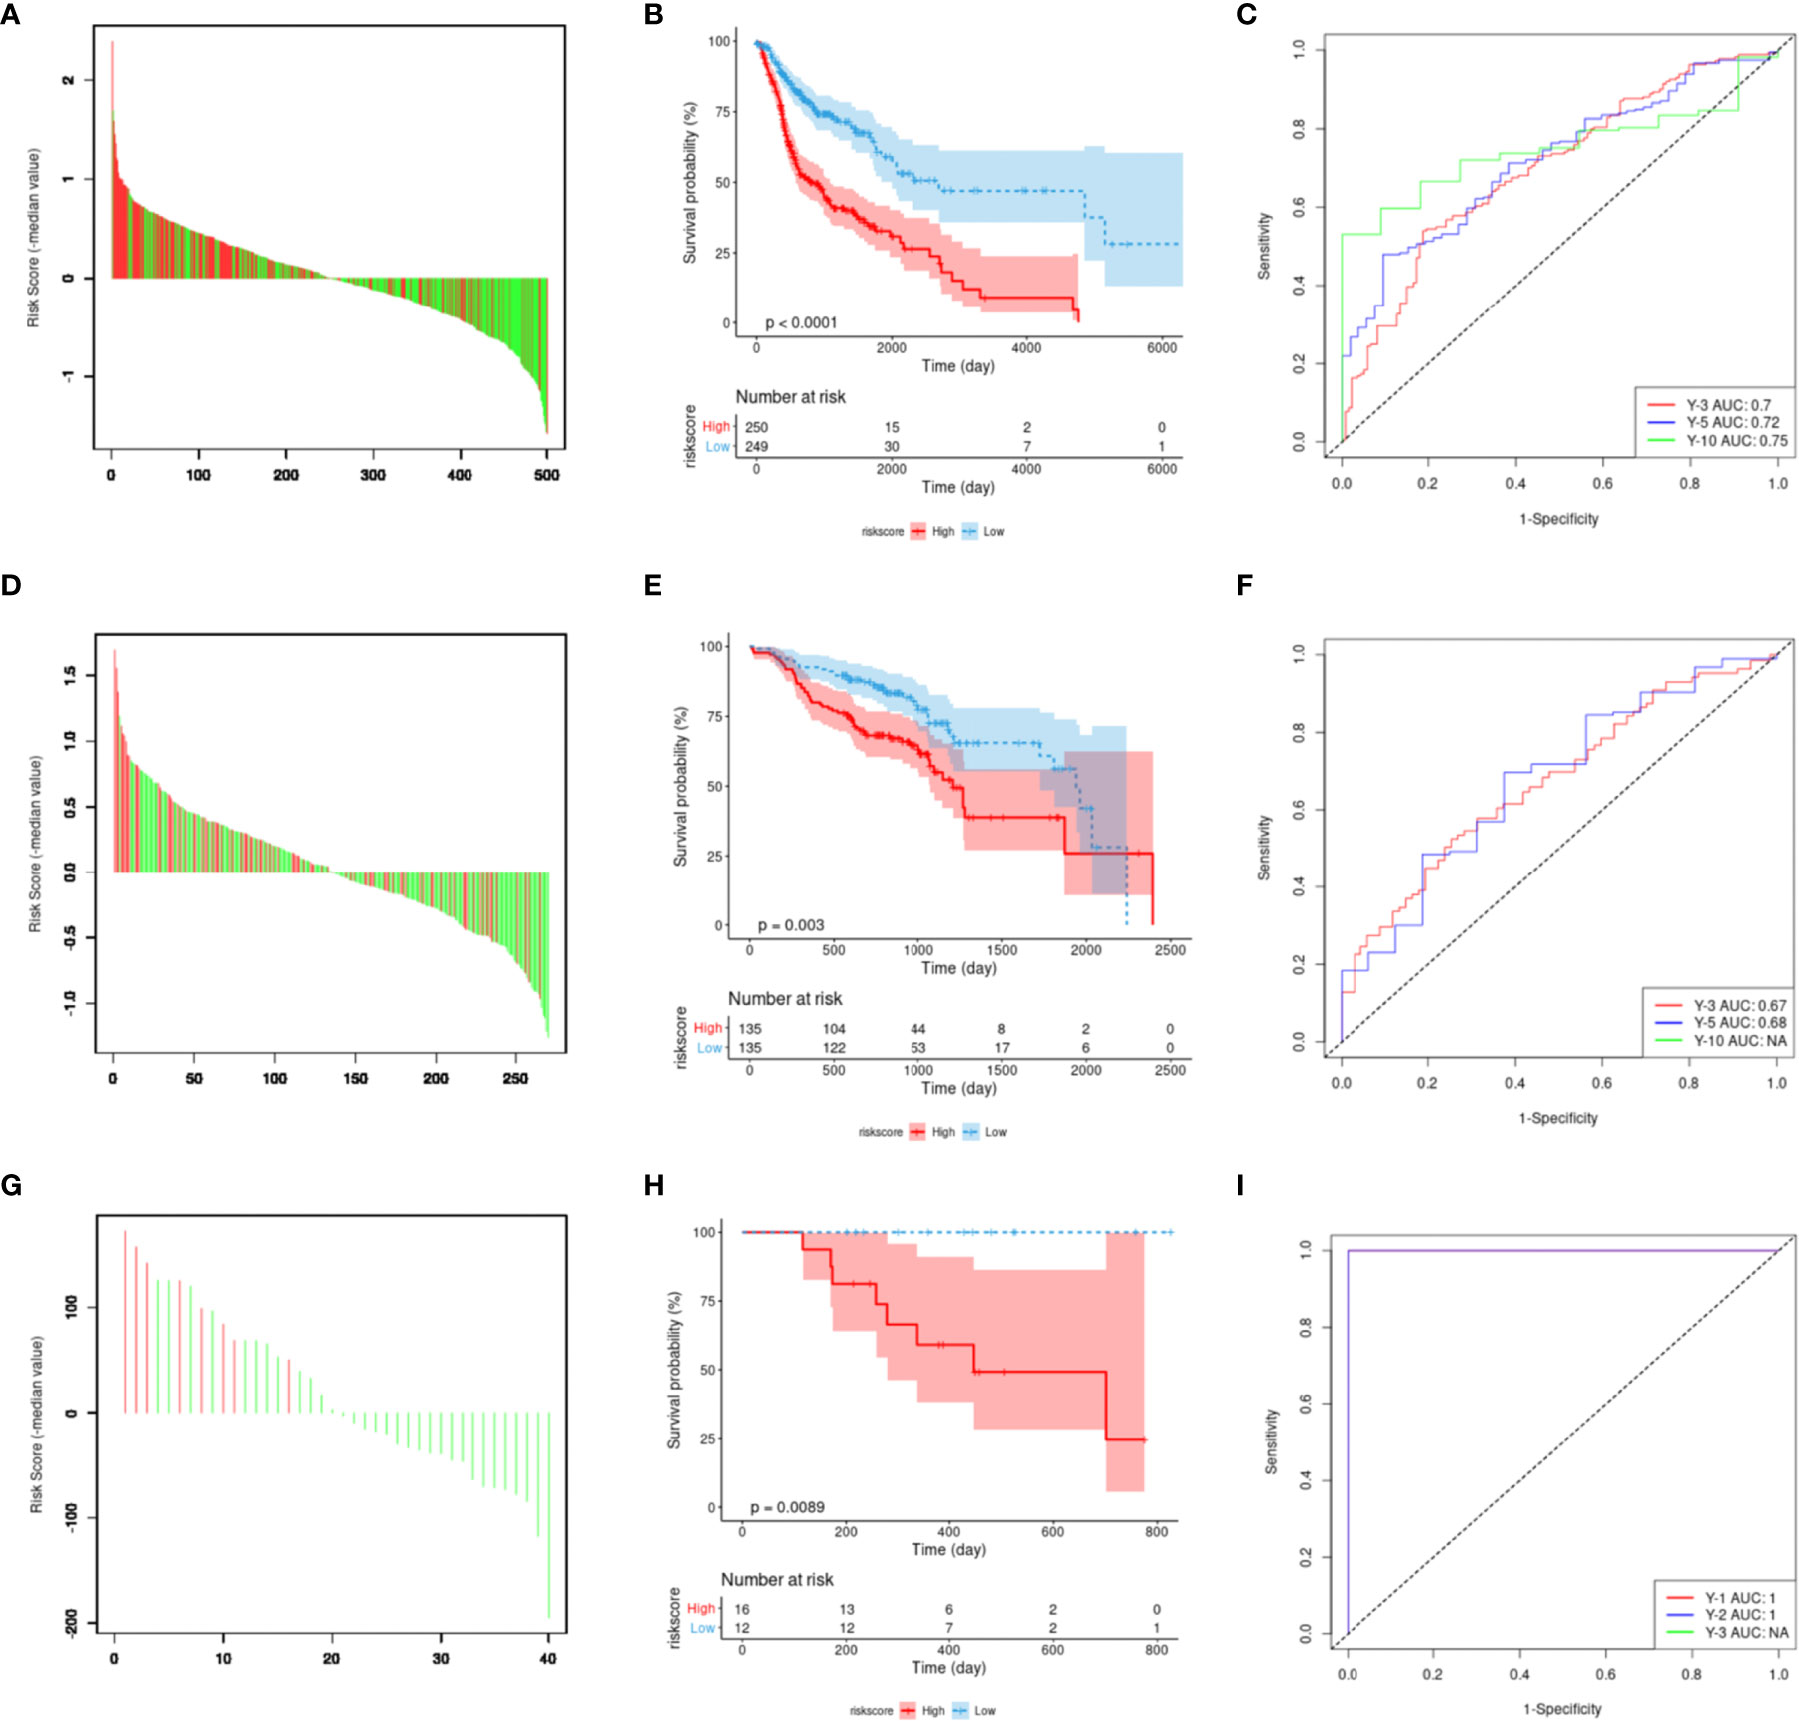
Figure 6 Construction and evaluation of m6A regulator-related mRNA signature. (A) The risk score of the 12-gene model in the Cancer Genome Atlas dataset. Red represents the time to death, green represents survival status, and the ordinate represents the difference between risk and median scores. (B) Model risk score prognostic analysis of patient survival. (C) The receiver operating characteristic (ROC) curve is predicted by using the model. (D–F) External verification using the GSE65858 dataset. (G–I) Verification result for the ICGC ORCN-IN dataset.
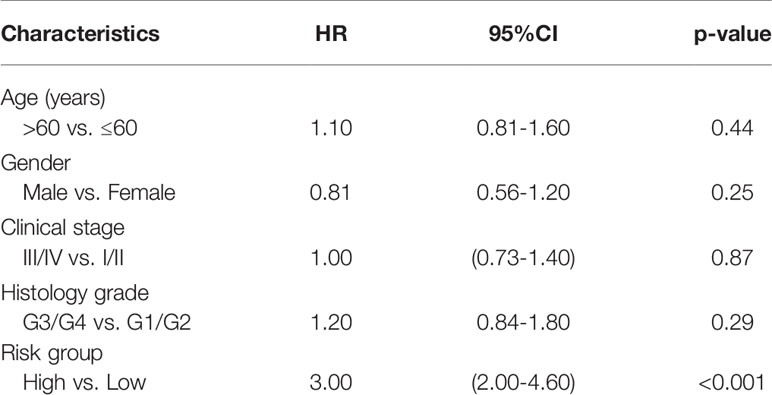
Table 5 The multivariate analyses of overall survival according to risk group, after adjusting for other potential predictors in TCGA.
The prognostic values of the signature scores were externally verified using the GSE65858 dataset, which revealed that there was a significant difference in OS between the high- and low-risk groups (p <0.001; Figures 6D, E). The predicted AUC values for 3- and 5-year survival based on the signature score were 0.67 and 0.68, respectively (Figure 6F). These values were slightly lower than the predicted performance values based on the training set. This risk factor could not predict the 10-year survival status for the GSE65858 dataset, mainly because the follow-up times of the cases in the GSE65858 data were lower than 10 years (Figure 6F).
During the external verification of the ICGC ORCA-IN dataset, the OS of high-risk patients was significantly worse than low-risk patients (p = 0.0089; Figures 6G, H). Additionally, the predicted AUC values of the 1- and 2-year survival statuses were both estimated to be 1. The follow-up time of cases in this dataset was not sufficient to predict survival rates >3 years (Figure 6I).
Gene mutations are considered the main driving factors for the occurrence and development of cancer. To better understand the underlying mechanism by which the signature of the risk score could be used to effectively assess the prognoses of patients, the gene mutations of patients in the high- and low-risk groups were investigated. As shown in Figure 7, using the model, it was predicted that the overall mutation rate of the low-risk group was ~5% lower than that of the high-risk group (89.44% vs. 98.39%, respectively). Additionally, the two groups of high-frequency mutation genes and mutation rates also showed significant differences. In the low-risk group, the five genes with the highest mutation rates were TP53 (59%), TTN (39%), PIK3CA (23%), MUC16 (18%), and CSMD3 (18%), while the five genes with the highest mutation rates in the high-risk group were TP53 (83%), TTN (47%), FAT1 (27%), CDKN2A (24%), and CSMD3 (20%). In addition, weak associations between the risk score and TMB (r = 0.11, p = 0.007) are shown in Supplementary Figure 4A.
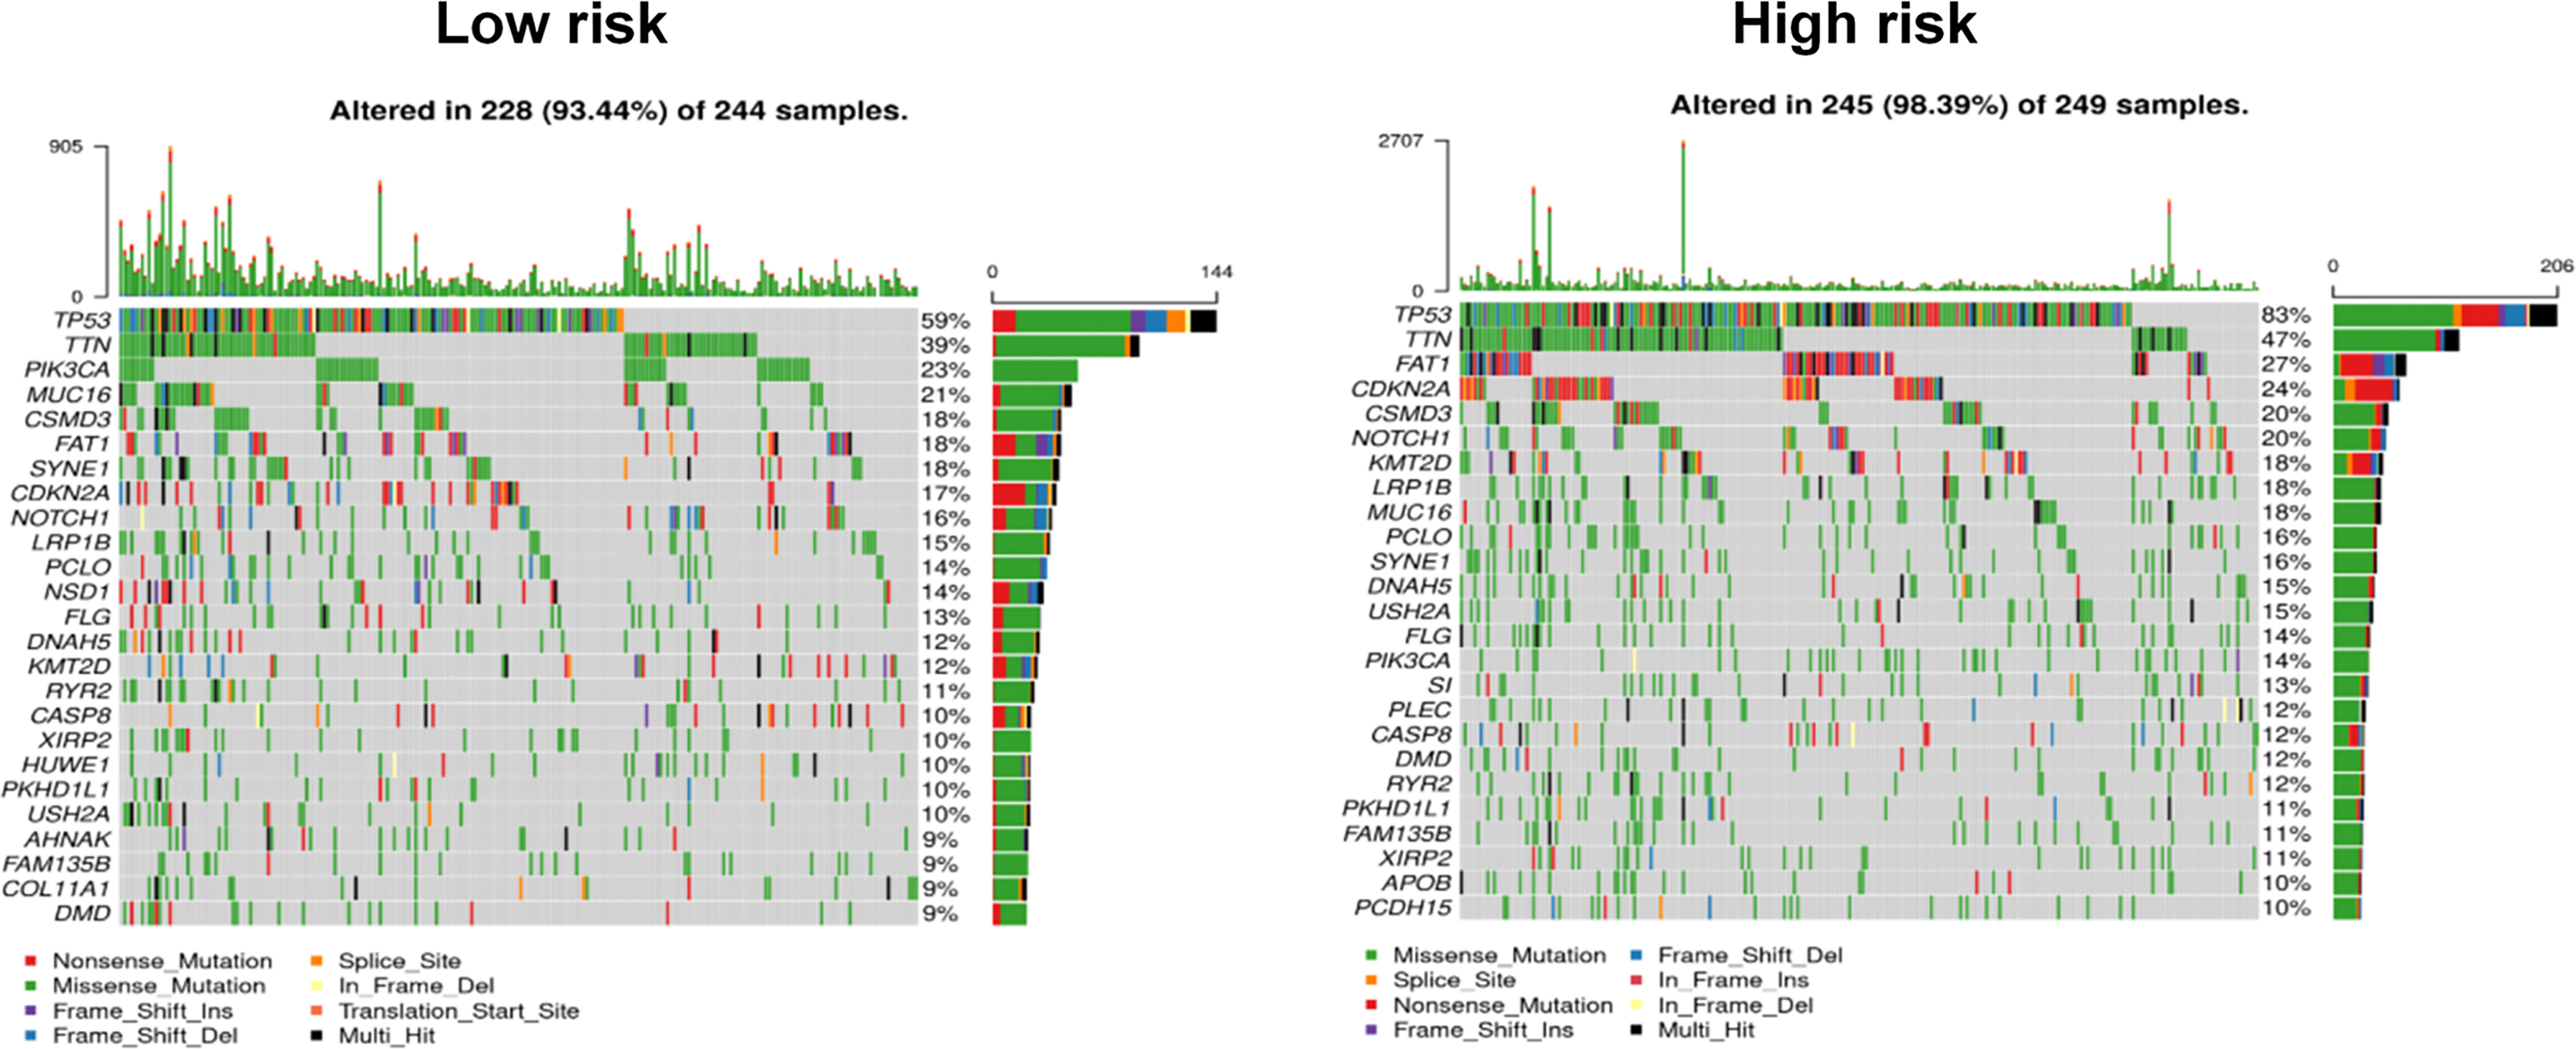
Figure 7 Comparison of mutational differences between high- and low-risk groups.
Considering that patients in the different risk groups demonstrated different prognoses and molecular variation patterns, it could be suggested that the risk score might also be related to the infiltration of immune cells in the tumor microenvironment. First, we found that the risk score was weakly associated with the immune score (r = -0.15, p = 0.0008) and stromal score (r = 0.12, p = 0.01) (Supplementary Figures 4B, C). Then, immune cell infiltration was compared between the high- and low-risk groups using Cibersort, with findings revealing that eight types of immune cell infiltration showed highly significant differences between the two groups (p <0.001) among the 22 types of immune cell infiltration, including macrophage M0, B cell memory, natural killer (NK) cell activated, NK cell resting, T cell CD8, T cell regulatory (Tregs), T cell follicular helper, and myeloid dendritic cell resting (Figures 8A, B). Among these, the proportions of T cell CD8+, T cell regulatory, and T cell follicular helper cells were significantly higher in the low-risk group than those observed in the high-risk group. Macrophage M0 cell infiltration was significantly higher in the high-risk group than that in the low-risk group (Figure 8C).
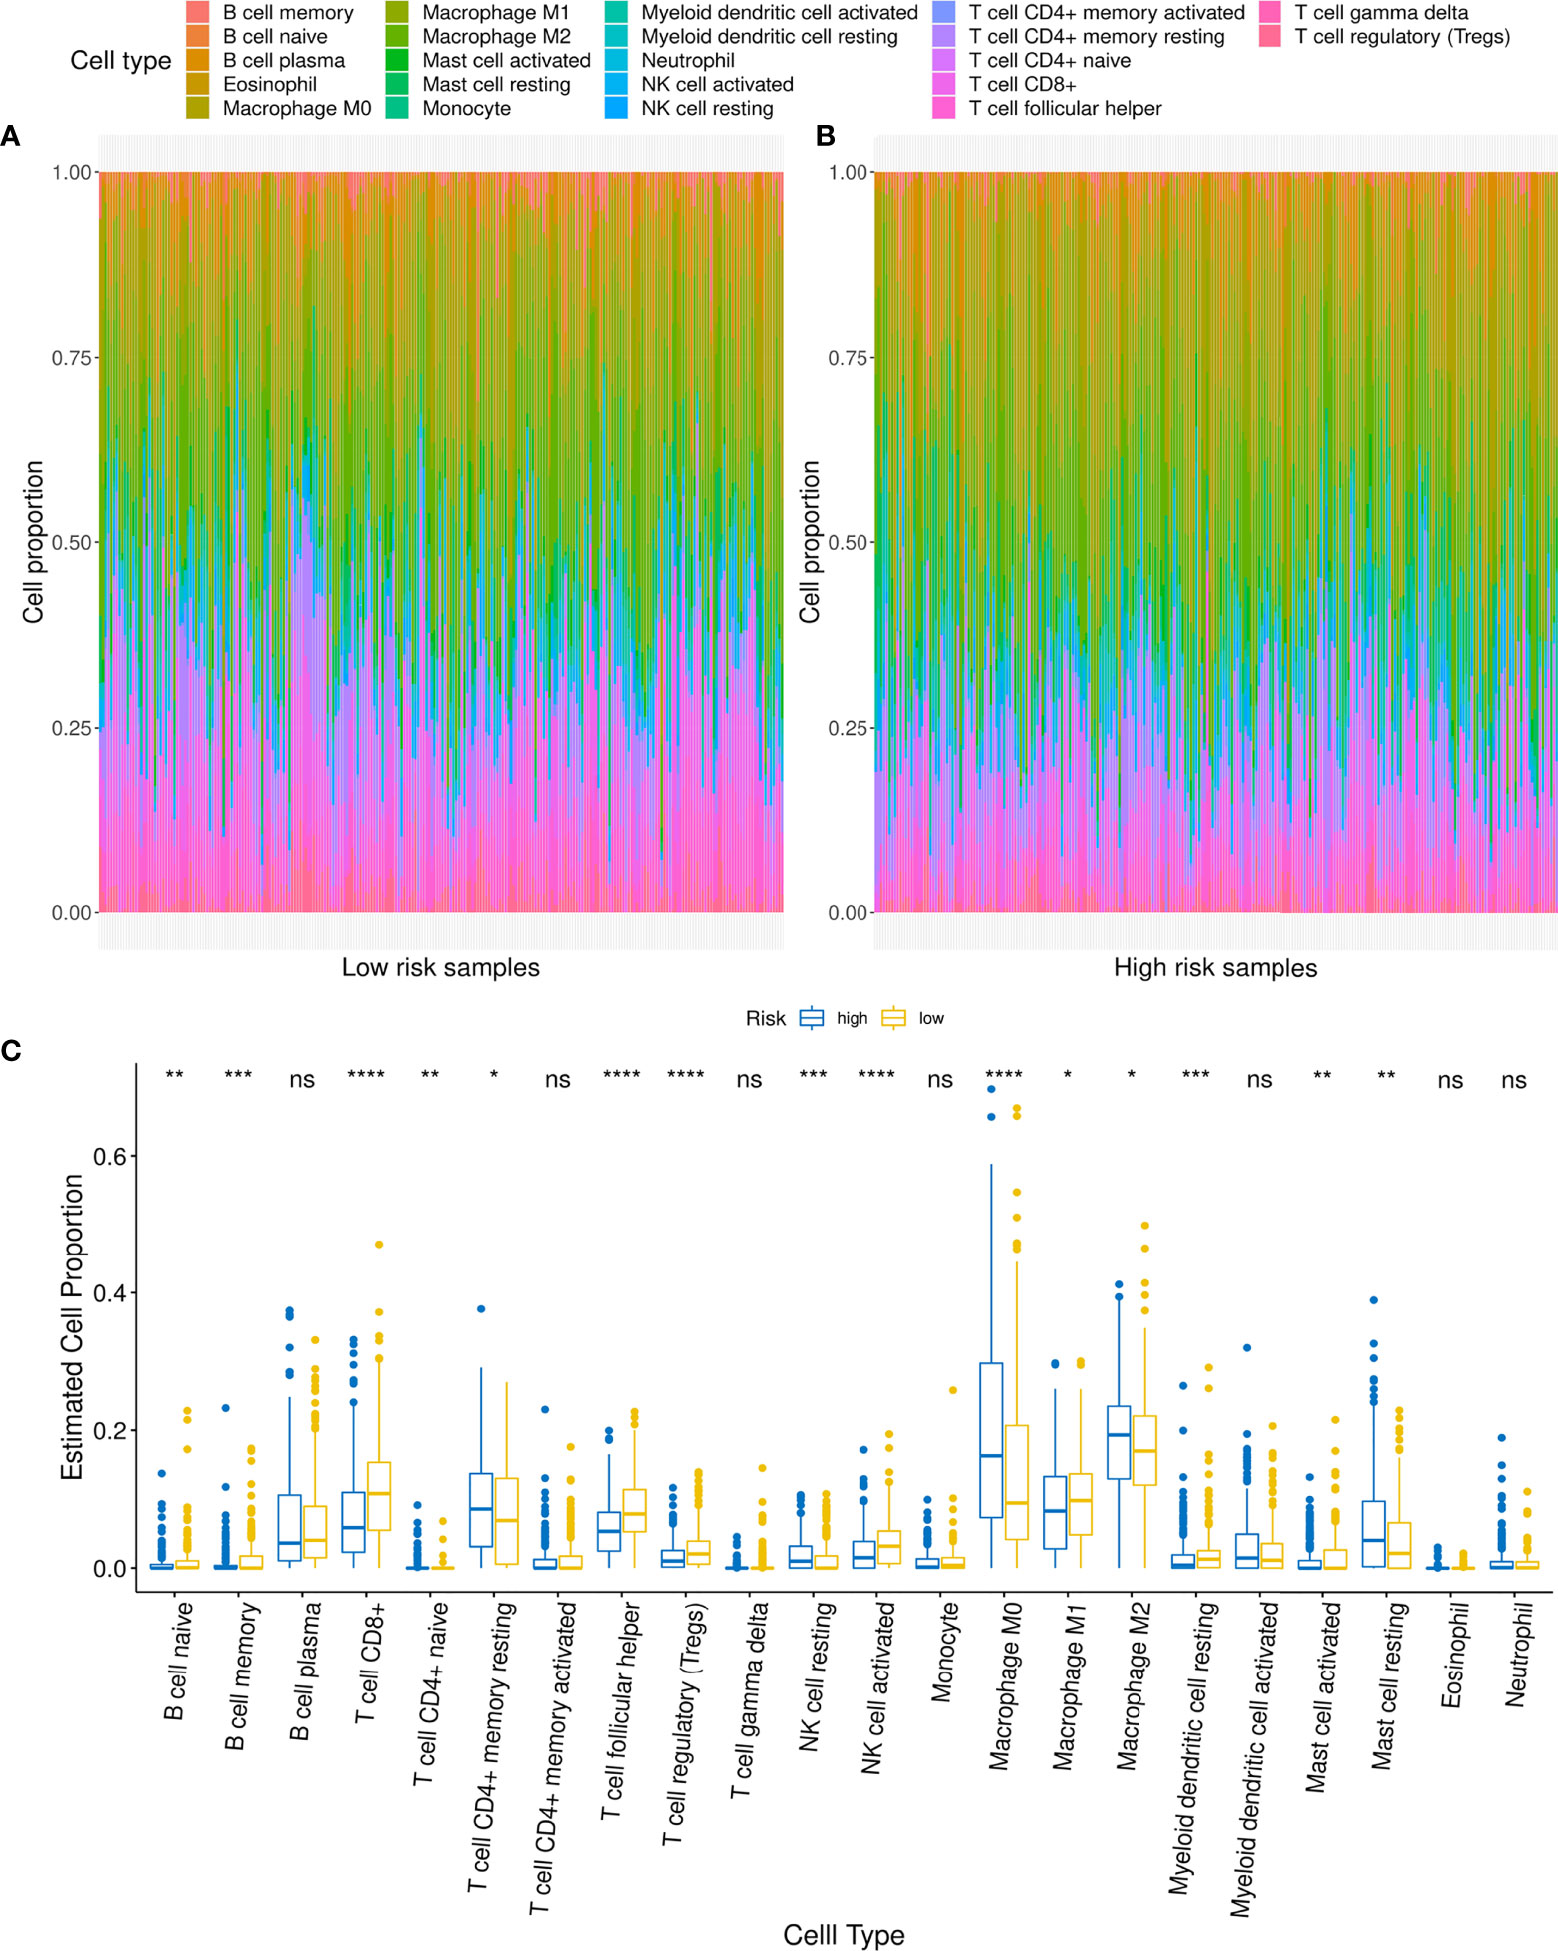
Figure 8 Relationship between low- and high-risk groups and immune cell infiltration. (A, B) Comparison of distribution of immune cell infiltration types in low- and high-risk groups. (C) Difference in infiltration of various immune cells between low- and high-risk groups. For t-test: ns, p ≥0.05; *p < 0.05; **p < 0.01; ***p < 0.001; ****p < 0.0001.
Considering the characteristics of m6A-related genes and immune cell TCGA-related data, we analyzed the correlation between the expression of m6A regulators and the expression of PD-L1. The results showed that 19 m6A regulator expression were related to PD-L1 expression. Among them, three genes with the strongest correlation coefficients with PD-L1 expression were YTHDC2 (R=0.388), YTHDF3 (R=0. 0.273) and METTL14 (R=0.271) (Supplementary Figures 5A–C), and the correlation between other m6A methylation regulators and PD-L1 is shown in the Supplementary Table 6. Furthermore, analyzed the expression of PD-L1 in the high- and low-risk groups of patients, and the results showed that there was no significant difference in the expression of PD-L1 between the two groups (Supplementary Figure 5D).
Considering that patients in the high- and low-risk groups exhibited different levels of immune cell infiltration, it could be suggested that these groups might demonstrate an impression of the efficacy of ICIs. As there is currently no transcriptome data available for patients receiving ICIs in HNSCC, data reported for other cancers were used to verify this speculation. The results based on the use of the Imvigor210CoreBiologies dataset showed that non-responders to ICIs (SD + PD) presented with higher risk scores than responders (CR + PR; p <0.001; Figure 9A). Concurrently, the ORR was significantly higher in the low-risk group than that in the high-risk group (32% vs. 13%, respectively; Figure 9B). Additionally, patients in the high-risk group exhibited significantly adverse OS compared to those in the low-risk group (p = 0.00032; Figure 9C). This finding indicates that the risk score can be used as a prognostic marker of the immune response.
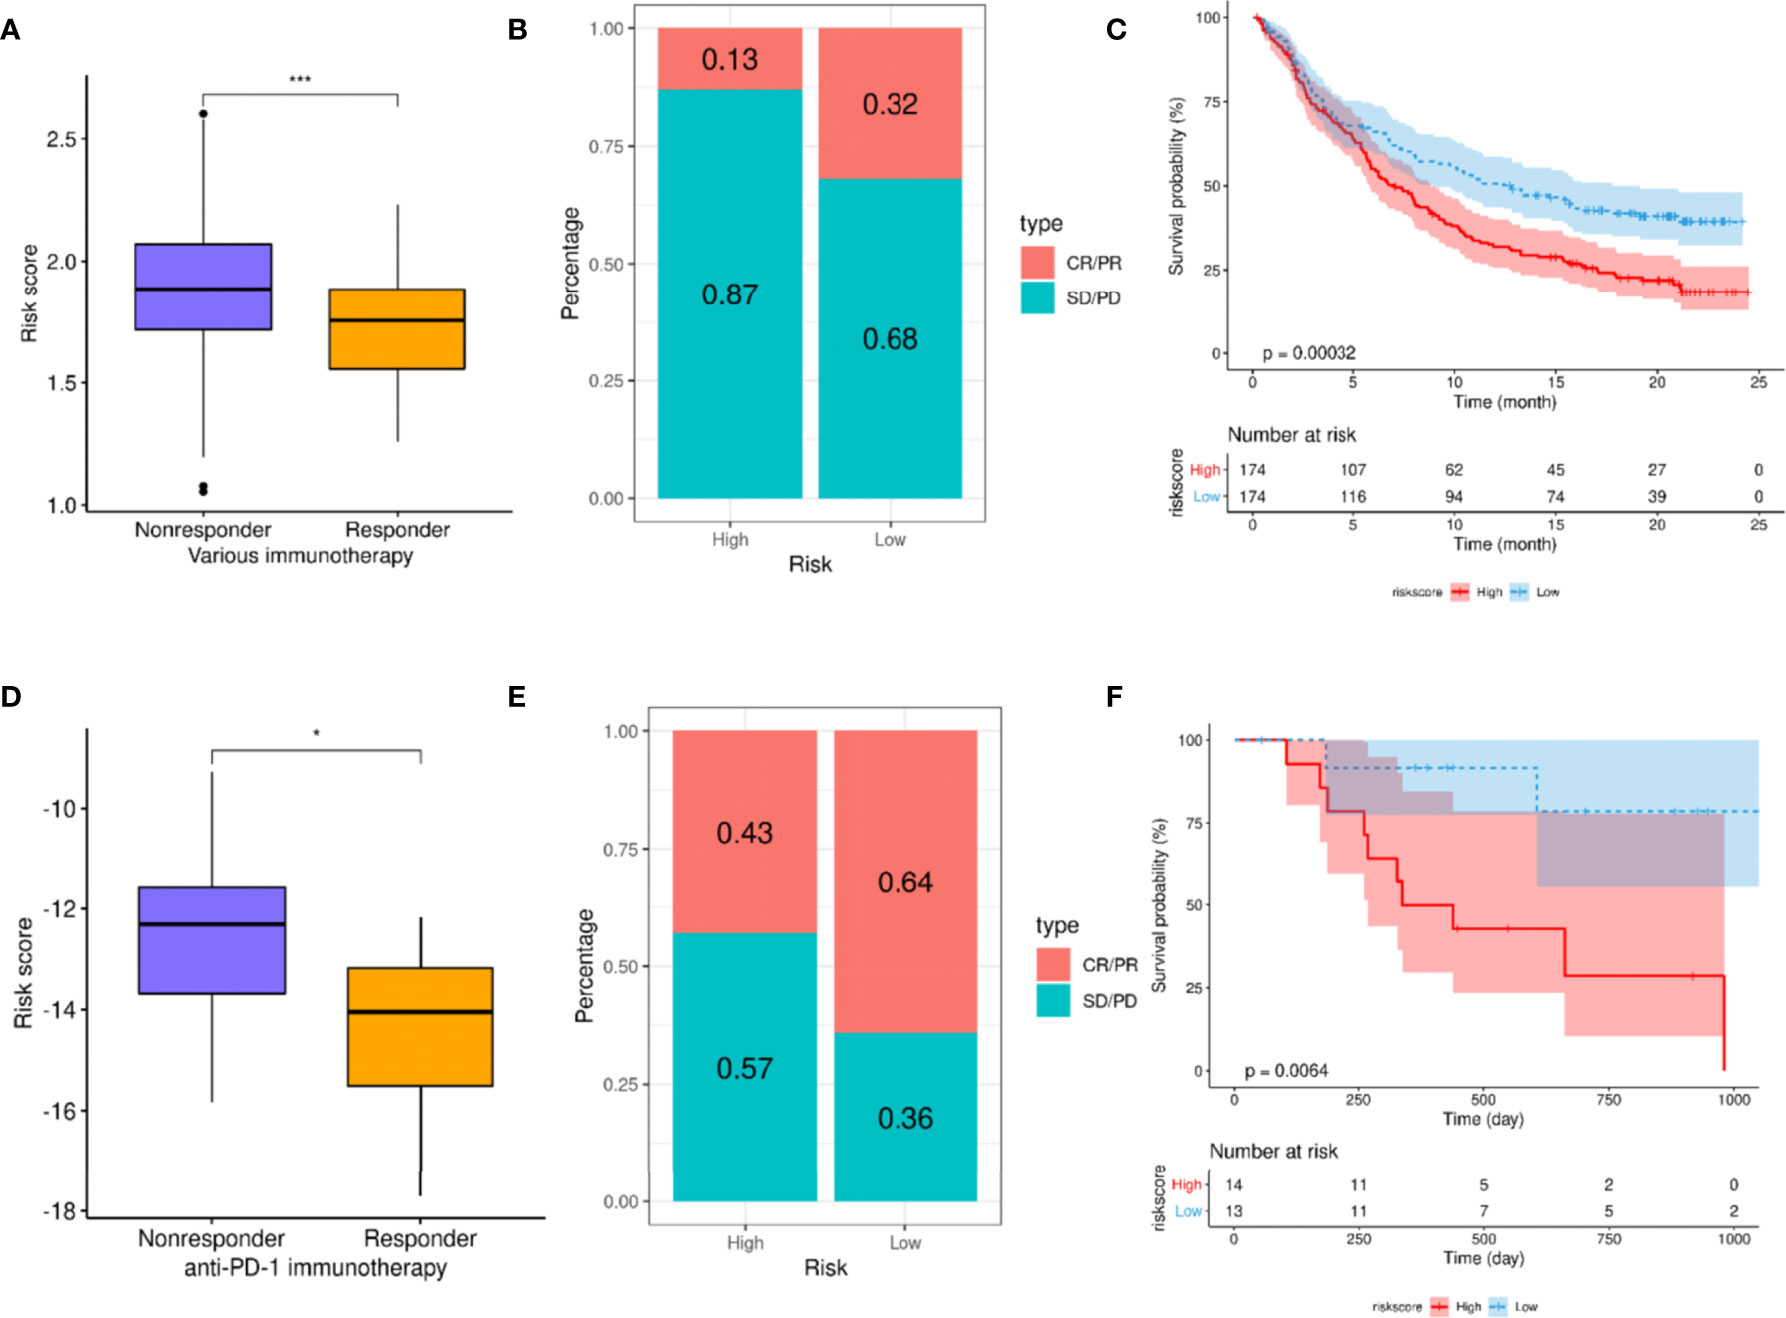
Figure 9 A high-risk score predicts poor response to immune checkpoint inhibitors (ICIs). (A–C) Exploration of the utility of risk scores as prognostic markers for ICIs using the Imvigor210CoreBiologies dataset. (A) Comparison of risk scores between different immune response states. (B) Comparison of immune response ratio between high- and low-risk groups. (C) Overall survival (OS) analysis of high- and low-risk groups. (D, E) Verification of relationship between risk score and immune response using the GSE78220 dataset. (D) Comparison of risk scores between different immune response groups. (E) Comparison of immune response rates between high- and low-risk groups. (F) Analysis of the OS of patients in high- and low-risk groups. For t-test: *p < 0.05; ***p < 0.001.
Finally, the GSE78220 dataset was used to verify the relationship between risk score and immune response, revealing that the risk scores of the non-responders were significantly higher than those of the responders (p <0.001; Figure 9D). Moreover, the ORR in the low-risk group was significantly higher than that in the high-risk group (64% vs. 43%, respectively; Figure 9E). Simultaneously, the OS of the low-risk group was significantly better than that of the high-risk group (p = 0.0064; Figure 9F).
Owing to the heterogeneity of HNSCC and the unsatisfactory therapeutic effects encountered, it is necessary to determine an accurate prognosis for HNSCC patients to explore and establish proper individualized treatments (26). Previous studies have indicated that the abnormal expression of m6A regulators may be related to the occurrence and development of various cancers, including breast cancer, bladder cancer, glioma, and colorectal cancer (9, 15). However, recent research into the pathological role of m6A regulatory factors in HNSCC progression remains limited, and few studies have addressed prognostic and predictive evaluation biomarkers for immunotherapy using m6A-related genes. The findings of this study showed that the expression of certain m6A regulators was upregulated in HNSCC tissues compared to normal tissues. This study also identified 1598 m6A regulator-related genes that were significantly related to CNV, methylation, and transcription levels. KEGG pathway enrichment analysis based on m6A regulator-related genes helped identify 187 genes in the top ten pathways; 12 genes were identified as prognostic factors via Lasso regression analyses. Subsequently, a prognostic signature constructed using these 12 m6A regulator-related genes was used to better distinguish between outcomes in HNSCC. Interestingly, this signature was associated with immune cell infiltration and with the responses and outcomes pertaining to therapy with ICIs.
Here, the expression of various m6A RNA methylation regulators was different in tumor and normal tissues within the TCGA-HNSCC database; this was consistent with the findings of previous reports (27, 28). M6A is known to demonstrate complex functions and is widely involved in regulating mRNA splicing, translation, decay, 3’-end processing, and non-coding RNA processing (29, 30). Through these processes, it demonstrates the biological function of methylation modification. Previous studies have demonstrated that m6A regulators related to mRNA signatures can exhibit an independent prognostic value, such as those of pancreatic and bladder cancer (31, 32). Here, 1598 m6A regulator-related genes were found to be significantly correlated to CNV, methylation, and transcription levels. A prognostic signature for HNSCC patients was then developed based on 12 m6A regulator-related genes via Lasso regression analyses. SRAMP software analysis showed that the 12 genes in this prognostic signature possessed m6A methylation modification sites, indicating that m6A methylation might affect the expression of these 12 genes. Furthermore, the findings of this study showed that the developed signature could be used to effectively distinguish between the prognoses for TCGA-HNSCC patients; the prognostic evaluation value of the signature was also verified in two other datasets (GSE65858 and ICGC ORCA-IN). Notably, the AUC of the developed prognostic signature demonstrated high accuracy for the training set and the two validation sets (GSE65858 and ICGC ORCA-IN). These results indicate that the signature demonstrates marked clinical availability.
Previous reports have shown that key genes within this prognostic signature are related to the occurrence and development of tumors. For example, the following six genes are located at the center of the key protein interaction network: PRKCA, MAP2K7, VDAC1, FZD6, SQSTM1, and CYCS. PRKCA is overexpressed in oral tongue squamous cell carcinoma and has been associated with poor prognosis (33). MAP2K7A has been used as a candidate tumor suppressor in gastric cancer (34) and T-cell acute lymphoblastic leukemia (35, 36), and has demonstrated the potential to be used as a prognostic biomarker for prostate cancer (37). The deletion of VDAC1 has been shown to cause glioblastoma (GBM) metabolism rewiring, which can, in turn, affect epigenetic modification and inhibit tumor development and progression (38). It has also been revealed that the FZD6-fibronectin actin axis can be exploited in drug development for highly metastatic forms of breast cancer (39). The pleiotropic protein p62/SQSTM1 is subjected to degradation during autophagy, and its expression has been demonstrated to increase in primary HNSCC tumors. CYCS encodes the core component protein of the mitochondrial electron transport chain, which is also involved in the initiation of apoptosis and various tumor processes (40, 41). Although the mechanisms of some of these genes in HNSCC were not clear in the present study, studies have also confirmed that they could be involved in the occurrence and development of tumors in other cancers. The biological functions of these key genes in HNSCC are worthy of comprehensive in vivo and in vitro studies.
The tumor microenvironment plays a vital role in the occurrence and development of tumors, especially in the immune infiltration of tumor cells (42, 43). This not only affects the development of tumors but also affects the efficacy of ICIs (44). Here, a significant difference was found in the level of immune cell infiltration between the high- and low-risk groups; patients in the high-risk group exhibited greater infiltration of macrophages and less extensive infiltration of CD8+ T cells. The degree of CD8+ T cell infiltration has been established to be positively associated with better prognoses and immunotherapy effects for patients (45, 46). Considering that immune cell infiltration is an important factor in predicting the treatment effect of ICIs, the original aim of this study was to analyze the predictive value of risk score in HNSCC patients using ICI treatments. Although RNA sequencing or gene expression microarray data for ICI treatments were lacking regarding HNSCC, public transcription data from urothelial carcinoma and melanoma patients were used to confirm that high-risk patients demonstrated worse treatment responses to ICIs and OS. This suggested that the scoring of the signature constructed herein could be used to predict the treatment responses to ICIs and OS. Although in our research we found that the expression of many m6A regulators was weakly correlated with PD-L1 expression, the signature of the m6A regulator related genes has no obvious correlation with PD-L1 expression. In immunotherapy, immune cell infiltration was the key to the effectiveness of ICI, and the expression level of PD-L1 was not an effective biomarker for ICI. The constructed signature can predict the efficacy of ICIs may be attributed to the fact that the signature was related to immune cells rather than PD-L1 expression.
Additionally, the high- and low-risk groups were found to present with different genetic mutation characteristics. The frequency of gene mutations in the high-risk group was higher than that in the low-risk group. A weak positive correlation was also observed between risk score and mutation load. Furthermore, the risk score was also weakly correlated with the tumor stemness index, immune score, and stroma score. These relationships might partly explain the underlying reasons as to why the risk scoring model constructed could be used to predict the prognosis of HNSCC.
In summary, this study has presented the following contributions to HNSCC research. First, it established a prognostic signature based on m6A regulator-related genes and validated its applicability via several methods. This signature can be used to effectively evaluate the prognoses of HNSCC patients and may also potentially predict responses to ICI treatments. Second, a few genes within this signature may be involved in the progression of HNSCC and may serve as potential therapeutic targets. Certain shortcomings and deficiencies in this study remain. First, this research was based on bioinformatics analysis, and the accuracy of the signature was not verified using clinical samples. Moreover, the role and regulation mechanism of these m6A regulator-related genes in HNSCC are still unclear, and follow-up research will further analyze the biological functions of these key genes in the occurrence and development of HNSCC.
Our findings suggest that the developed prognostic signature, based on m6A regulator-related genes, can be used to effectively distinguish between the prognoses of HNSCC. This prognostic signature was shown to be related to the immune cell infiltration of HNSCC and might help predict the response and prognosis of ICI treatments. These findings suggested that the developed signature could be considered a broad-spectrum biomarker for prognosis in HNSCC and that it could be used to predict patients’ responses to ICIs.
The datasets presented in this study can be found in online repositories. The names of the repository/repositories and accession number(s) can be found in the article/Supplementary Material.
JC, TL, FZ, and XG designed the study. QL, MF, ZT, and YJ collected and analyzed data. JC and TL wrote the manuscript. JL and XG participated in the revision of the manuscript. All authors read and approved the manuscript.
This work was supported by the National Natural Science Foundation of China (nos. 82160710, 82103478) and the National Cancer Center Climbing Fund (NCC201814B044, and NCC201814B040). This work was supported by the NHC Key Laboratory of Personalized Diagnosis and Treatment of Nasopharyngeal Carcinoma.
The authors declare that the research was conducted in the absence of any commercial or financial relationships that could be construed as a potential conflict of interest.
All claims expressed in this article are solely those of the authors and do not necessarily represent those of their affiliated organizations, or those of the publisher, the editors and the reviewers. Any product that may be evaluated in this article, or claim that may be made by its manufacturer, is not guaranteed or endorsed by the publisher.
We thank Editage (https://www.editage.cn) for editing this manuscript.
The Supplementary Material for this article can be found online at: https://www.frontiersin.org/articles/10.3389/fimmu.2022.809872/full#supplementary-material
Supplementary Table 1 | Data information used in this study.
Supplementary Table 2 | 1598 genes that are significantly correlated at all three levels.
Supplementary Table 3 | 65 enriched Kyoto Encyclopedia of Genes and Genomes signaling pathways.
Supplementary Table 4 | 187 genes in the top 10 enriched Kyoto Encyclopedia of Genes and Genomes pathways.
Supplementary Table 5 | Top 10 enriched Kyoto Encyclopedia of Genes and Genomes pathways.
Supplementary Table 6 | The correlation of m6A regulator expression and PD-L1 expression.
Supplementary Figure 1 | Parts of genes that are highly correlated with m6A regulatory factors.
Supplementary Figure 2 | Copy number variant and single nucleotide variant mutations of m6A regulator-related genes in key enriched pathways in head and neck, ovarian, cervical, endometrial, colorectal, and breast cancers.
Supplementary Figure 3 | K-M survival curve of patients with high- and low-expression groups of certain key m6A regulator-related genes.
Supplementary Figure 4 | Weak associations between tumor mutational burden (r = 0.11, p = 0.01), immune score (r = -0.15, p = 0.0008) and stromal score (r = 0.12, p = 0.01).
Supplementary Figure 5 | The correlation of m6A regulator expression and PD-L1 expression. (A) YTHDC2, (B) YTHDF3 and (C) METTL14.
Supplementary Figure 6 | The expression of PD-L1 between the two groups.
1. Ferlay J, Colombet M, Soerjomataram I, Mathers C, Parkin DM, Piñeros M, et al. Estimating the Global Cancer Incidence and Mortality in 2018: GLOBOCAN Sources and Methods. Int J Cancer (2019) 144(8):1941–53. doi: 10.1002/ijc.31937
2. Alsahafi E, Begg K, Amelio I, Raulf N, Lucarelli P, Sauter T, et al. Clinical Update on Head and Neck Cancer: Molecular Biology and Ongoing Challenges. Cell Death Dis (2019) 10(8):540. doi: 10.1038/s41419-019-1769-9
3. Cramer JD, Burtness B, Ferris RL. Immunotherapy for Head and Neck Cancer: Recent Advances and Future Directions. Oral Oncol (2019) 99:104460. doi: 10.1016/j.oraloncology.2019.104460
4. Alterio D, Marvaso G, Ferrari A, Volpe S, Orecchia R, Jereczek-Fossa BA. Modern Radiotherapy for Head and Neck Cancer. Semin Oncol (2019) 46(3):233–45. doi: 10.1053/j.seminoncol.2019.07.002
5. Lydiatt WM, Patel SG, O'Sullivan B, Brandwein MS, Ridge JA, Migliacci JC, et al. Head and Neck Cancers-Major Changes in the American Joint Committee on Cancer Eighth Edition Cancer Staging Manual. CA Cancer J Clin (2017) 67(2):122–37. doi: 10.3322/caac.21389
6. Budach V, Tinhofer I. Novel Prognostic Clinical Factors and Biomarkers for Outcome Prediction in Head and Neck Cancer: A Systematic Review. Lancet Oncol (2019) 20(6):e313–26. doi: 10.1016/s1470-2045(19)30177-9
7. Chen M, Wong CM. The Emerging Roles of N6-Methyladenosine (M6a) Deregulation in Liver Carcinogenesis. Mol Cancer (2020) 19(1):44. doi: 10.1186/s12943-020-01172-y
8. Ke S, Alemu EA, Mertens C, Gantman EC, Fak JJ, Mele A, et al. A Majority of M6a Residues are in the Last Exons, Allowing the Potential for 3' UTR Regulation. Genes Dev (2015) 29(19):2037–53. doi: 10.1101/gad.269415.115
9. He L, Li H, Wu A, Peng Y, Shu G, Yin G. Functions of N6-Methyladenosine and Its Role in Cancer. Mol Cancer (2019) 18(1):176. doi: 10.1186/s12943-019-1109-9
10. Luo J, Liu H, Luan S, He C, Li Z. Aberrant Regulation of mRNA M⁶A Modification in Cancer Development. Int J Mol Sci (2018) 19(9):2515. doi: 10.3390/ijms19092515
11. Liu Z, Zhang J. Most M6a RNA Modifications in Protein-Coding Regions Are Evolutionarily Unconserved and Likely Nonfunctional. Mol Biol Evol (2018) 35(3):666–75. doi: 10.1093/molbev/msx320
12. Li N, Kang Y, Wang L, Huff S, Tang R, Hui H, et al. ALKBH5 Regulates Anti-PD-1 Therapy Response by Modulating Lactate and Suppressive Immune Cell Accumulation in Tumor Microenvironment. Proc Natl Acad Sci USA (2020) 117(33):20159–70. doi: 10.1073/pnas.1918986117
13. Winkler R, Gillis E, Lasman L, Safra M, Geula S, Soyris C, et al. M(6)A Modification Controls the Innate Immune Response to Infection by Targeting Type I Interferons. Nat Immunol (2019) 20(2):173–82. doi: 10.1038/s41590-018-0275-z
14. Zhang B, Wu Q, Li B, Wang D, Wang L, Zhou YL. M(6)A Regulator-Mediated Methylation Modification Patterns and Tumor Microenvironment Infiltration Characterization in Gastric Cancer. Mol Cancer (2020) 19(1):53. doi: 10.1186/s12943-020-01170-0
15. Han J, Wang JZ, Yang X, Yu H, Zhou R, Lu HC, et al. METTL3 Promote Tumor Proliferation of Bladder Cancer by Accelerating Pri-Mir221/222 Maturation in M6a-Dependent Manner. Mol Cancer (2019) 18(1):110. doi: 10.1186/s12943-019-1036-9
16. Han D, Liu J, Chen C, Dong L, Liu Y, Chang R, et al. Anti-Tumour Immunity Controlled Through mRNA M(6)A Methylation and YTHDF1 in Dendritic Cells. Nature (2019) 566(7743):270–4. doi: 10.1038/s41586-019-0916-x
17. Yi L, Wu G, Guo L, Zou X, Huang P. Comprehensive Analysis of the PD-L1 and Immune Infiltrates of M(6)A RNA Methylation Regulators in Head and Neck Squamous Cell Carcinoma. Mol Ther Nucleic Acids (2020) 21:299–314. doi: 10.1016/j.omtn.2020.06.001
18. Mariathasan S, Turley SJ, Nickles D, Castiglioni A, Yuen K, Wang Y, et al. TGFβ Attenuates Tumour Response to PD-L1 Blockade by Contributing to Exclusion of T Cells. Nature (2018) 554(7693):544–8. doi: 10.1038/nature25501
19. Mayakonda A, Lin DC, Assenov Y, Plass C, Koeffler HP. Maftools: Efficient and Comprehensive Analysis of Somatic Variants in Cancer. Genome Res (2018) 28(11):1747–56. doi: 10.1101/gr.239244.118
20. Gu Z, Eils R, Schlesner M. Complex Heatmaps Reveal Patterns and Correlations in Multidimensional Genomic Data. Bioinformatics (Oxford England) (2016) 32(18):2847–9. doi: 10.1093/bioinformatics/btw313
21. Yu G, Wang LG, Han Y, He QY. Clusterprofiler: An R Package for Comparing Biological Themes Among Gene Clusters. Omics (2012) 16(5):284–7. doi: 10.1089/omi.2011.0118
22. Zhou Y, Zeng P, Li YH, Zhang Z, Cui Q. SRAMP: Prediction of Mammalian N6-Methyladenosine (M6a) Sites Based on Sequence-Derived Features. Nucleic Acids Res (2016) 44(10):e91. doi: 10.1093/nar/gkw104
23. Therneau T. A Package for Survival Analysis in R. R package version 3.2-13 (2021). Available at: https://CRAN.R-project.org/package=survival.
24. Yoshihara K, Shahmoradgoli M, Martínez E, Vegesna R, Kim H, Torres-Garcia W, et al. Inferring Tumour Purity and Stromal and Immune Cell Admixture From Expression Data. Nat Commun (2013) 4:2612. doi: 10.1038/ncomms3612
25. Schumacher TN, Kesmir C, van Buuren MM. Biomarkers in Cancer Immunotherapy. Cancer Cell (2015) 27(1):12–4. doi: 10.1016/j.ccell.2014.12.004
26. Leemans CR, Snijders PJF, Brakenhoff RH. Publisher Correction: The Molecular Landscape of Head and Neck Cancer. Nat Rev Cancer (2018) 18(10):662. doi: 10.1038/s41568-018-0057-9
27. Deng X, Jiang Q, Liu Z, Chen W. Clinical Significance of an M6a Reader Gene, IGF2BP2, in Head and Neck Squamous Cell Carcinoma. Front Mol Biosci (2020) 7:68. doi: 10.3389/fmolb.2020.00068
28. Zhou X, Han J, Zhen X, Liu Y, Cui Z, Yue Z, et al. Analysis of Genetic Alteration Signatures and Prognostic Values of M6a Regulatory Genes in Head and Neck Squamous Cell Carcinoma. Front Oncol (2020) 10:718:718. doi: 10.3389/fonc.2020.00718
29. Yu J, Chen M, Huang H, Zhu J, Song H, Zhu J, et al. Dynamic M6a Modification Regulates Local Translation of mRNA in Axons. Nucleic Acids Res (2018) 46(3):1412–23. doi: 10.1093/nar/gkx1182
30. Ma S, Chen C, Ji X, Liu J, Zhou Q, Wang G, et al. The Interplay Between M6a RNA Methylation and Noncoding RNA in Cancer. J Hematol Oncol (2019) 12(1):121. doi: 10.1186/s13045-019-0805-7
31. Meng Z, Yuan Q, Zhao J, Wang B, Li S, Offringa R, et al. The M(6)A-Related mRNA Signature Predicts the Prognosis of Pancreatic Cancer Patients. Mol Ther Oncolytics (2020) 17:460–70. doi: 10.1016/j.omto.2020.04.011
32. Lin G, Zhang J, Wu Y, Zhu S, Li G. Signatures and Prognostic Values of N6-Methyladenosine (M6a) - Related Immune Genes in Bladder Cancer. Bioengineered (2021) 12(1):2649–63. doi: 10.1080/21655979.2021.1937910
33. Parzefall T, Schnoell J, Monschein L, Foki E, Liu DT, Frohne A, et al. PRKCA Overexpression Is Frequent in Young Oral Tongue Squamous Cell Carcinoma Patients and Is Associated With Poor Prognosis. Cancers (2021) 13(9):2082. doi: 10.3390/cancers13092082
34. Hudson AM, Stephenson NL, Li C, Trotter E, Fletcher AJ, Katona G, et al. Truncation- and Motif-Based Pan-Cancer Analysis Reveals Tumor-Suppressing Kinases. Sci Signal (2018) 11(526):eaan6776. doi: 10.1126/scisignal.aan6776
35. Shen Y, Chen TJ, Lacorazza HD. Novel Tumor-Suppressor Function of KLF4 in Pediatric T-Cell Acute Lymphoblastic Leukemia. Exp Hematol (2017) 53:16–25. doi: 10.1016/j.exphem.2017.04.009
36. Shen Y, Park CS, Suppipat K, Mistretta TA, Puppi M, Horton TM, et al. Inactivation of KLF4 Promotes T-Cell Acute Lymphoblastic Leukemia and Activates the MAP2K7 Pathway. Leukemia (2017) 31(6):1314–24. doi: 10.1038/leu.2016.339
37. Hu D, Jiang L, Luo S, Zhao X, Hu H, Zhao G, et al. Development of an Autophagy-Related Gene Expression Signature for Prognosis Prediction in Prostate Cancer Patients. J Transl Med (2020) 18(1):160. doi: 10.1186/s12967-020-02323-x
38. Amsalem Z, Arif T, Shteinfer-Kuzmine A, Chalifa-Caspi V, Shoshan-Barmatz V. The Mitochondrial Protein VDAC1 at the Crossroads of Cancer Cell Metabolism: The Epigenetic Link. Cancers (2020) 12(4):1031. doi: 10.3390/cancers12041031
39. Corda G, Sala G, Lattanzio R, Iezzi M, Sallese M, Fragassi G, et al. Functional and Prognostic Significance of the Genomic Amplification of Frizzled 6 (FZD6) in Breast Cancer. J Pathol (2017) 241(3):350–61. doi: 10.1002/path.4841
40. Zhao S, Shen W, Du R, Luo X, Yu J, Zhou W, et al. Three Inflammation-Related Genes Could Predict Risk in Prognosis and Metastasis of Patients With Breast Cancer. Cancer Med (2019) 8(2):593–605. doi: 10.1002/cam4.1962
41. Ha JH, Jayaraman M, Yan M, Dhanasekaran P, Isidoro C, Song YS, et al. GNAi2/gip2-Regulated Transcriptome and Its Therapeutic Significance in Ovarian Cancer. Biomolecules (2021) 11(8):1211. doi: 10.3390/biom11081211
42. Quail DF, Joyce JA. Microenvironmental Regulation of Tumor Progression and Metastasis. Nat Med (2013) 19(11):1423–37. doi: 10.1038/nm.3394
43. Duan Q, Zhang H, Zheng J, Zhang L. Turning Cold Into Hot: Firing Up the Tumor Microenvironment. Trends Cancer (2020) 6(7):605–18. doi: 10.1016/j.trecan.2020.02.022
44. Bader JE, Voss K, Rathmell JC. Targeting Metabolism to Improve the Tumor Microenvironment for Cancer Immunotherapy. Mol Cell (2020) 78(6):1019–33. doi: 10.1016/j.molcel.2020.05.034
45. Miller BC, Sen DR, Al Abosy R, Bi K, Virkud YV, LaFleur MW, et al. Subsets of Exhausted CD8(+) T Cells Differentially Mediate Tumor Control and Respond to Checkpoint Blockade. Nat Immunol (2019) 20(3):326–36. doi: 10.1038/s41590-019-0312-6
Keywords: signature, m6A regulators related genes, prognosis, immune responses, head and neck squamous cell carcinoma
Citation: Chen J, Lu T, Zhong F, Lv Q, Fang M, Tu Z, Ji Y, Li J and Gong X (2022) A Signature of N6-methyladenosine Regulator-Related Genes Predicts Prognoses and Immune Responses for Head and Neck Squamous Cell Carcinoma. Front. Immunol. 13:809872. doi: 10.3389/fimmu.2022.809872
Received: 05 November 2021; Accepted: 14 January 2022;
Published: 03 February 2022.
Edited by:
Brent A. Hanks, Duke University, United StatesReviewed by:
Lilan Yi, Meizhou People’s Hospital, ChinaCopyright © 2022 Chen, Lu, Zhong, Lv, Fang, Tu, Ji, Li and Gong. This is an open-access article distributed under the terms of the Creative Commons Attribution License (CC BY). The use, distribution or reproduction in other forums is permitted, provided the original author(s) and the copyright owner(s) are credited and that the original publication in this journal is cited, in accordance with accepted academic practice. No use, distribution or reproduction is permitted which does not comply with these terms.
*Correspondence: Xiaochang Gong, Z3hjYW5kZHdAMTYzLmNvbQ==
†These authors have contributed equally to this work
Disclaimer: All claims expressed in this article are solely those of the authors and do not necessarily represent those of their affiliated organizations, or those of the publisher, the editors and the reviewers. Any product that may be evaluated in this article or claim that may be made by its manufacturer is not guaranteed or endorsed by the publisher.
Research integrity at Frontiers
Learn more about the work of our research integrity team to safeguard the quality of each article we publish.