
94% of researchers rate our articles as excellent or good
Learn more about the work of our research integrity team to safeguard the quality of each article we publish.
Find out more
ORIGINAL RESEARCH article
Front. Immunol. , 18 January 2023
Sec. Inflammation
Volume 13 - 2022 | https://doi.org/10.3389/fimmu.2022.1062479
 Tao Wang1,2†
 Yubin Long1,2†Lijie Ma1,2†Qi Dong1,2
 Yiran Li1,2
 Junfei Guo1,2Lin Jin1,2Luqin Di1,2Yingze Zhang1,2,3
 Ling Wang1,2,4*
 Zhiyong Hou1,2,3*
Introduction: High stress in the compartment surrounded by the deep fascia can cause acute compartment syndrome (ACS) that may result in necrosis of the limbs. The study aims to investigate the cellular heterogeneity of the deep fascia in ACS patients by single-cell RNA sequencing (scRNA-seq).
Methods: We collected deep fascia samples from patients with ACS (high-stress group, HG, n=3) and patients receiving thigh amputation due to osteosarcoma (normal-stress group, NG, n=3). We utilized ultrasound and scanning electron microscopy to observe the morphologic change of the deep fascia, used multiplex staining and multispectral imaging to explore immune cell infiltration, and applied scRNA-seq to investigate the cellular heterogeneity of the deep fascia and to identify differentially expressed genes.
Results: Notably, we identified GZMK+interferon-act CD4 central memory T cells as a specific high-stress compartment subcluster expressing interferon-related genes. Additionally, the changes in the proportions of inflammation-related subclusters, such as the increased proportion of M2 macrophages and decreased proportion of M1 macrophages, may play crucial roles in the balance of pro-inflammatory and anti-inflammatory in the development of ACS. Furthermore, we found that heat shock protein genes were highly expressed but metal ion-related genes (S100 family and metallothionein family) were down-regulated in various subpopulations under high stress.
Conclusions: We identified a high stress-specific subcluster and variations in immune cells and fibroblast subclusters, as well as their differentially expressed genes, in ACS patients. Our findings reveal the functions of the deep fascia in the pathophysiology of ACS, providing new approaches for its treatment and prevention.
Acute compartment syndrome (ACS), commonly caused by tibiofibular fractures (1), influences 3.1 per 100 000 people per year, with a strong male predominance of 7.3 per 100 000 men compared with 0.7 per 100 000 women (2). It is associated with local pain, paralysis, ischemia, or even necrosis of the lower limbs (3). These clinical symptoms are thought to be attributable to prolonged high stress in the compartment surrounded by the deep fascia (4). Our previous work demonstrated that scattered blisters surrounding fracture sections could significantly reduce the incidence of ACS. Additionally, inflammation has been reported as a major driving factor in the development of ACS (5, 6). Based on these findings, we hypothesize that the presence of blisters may relieve intracompartmental stress via immunologic mechanisms (7–9).
Fascia, broadly termed the “fascial system” (10, 11), is an uninterrupted, viscoelastic connective tissue that extends and interconnects between tissues and organs throughout the body (12). Fascia mainly consists of numerous fibers (13) that make it elastic to withstand tension (14), and fibroblasts that are involved in the production of collagen, tissue repair, and remodeling (15). Fibroblasts have been reported to contribute to the regulation of immune cells in the process of wound healing and scarring (16–19). Recent studies have mainly focused on the histochemical and mechanographic investigation on the lumbar or thoracolumbar fascia and found B cells, fasciacytes, myofibroblasts, telocytes, and fibroblasts (20–25). However, to our knowledge, the related research on deep fascia remains completely understood. We propose cellular subtypes, including fibroblasts and immune cells, gene expression, and signaling pathways in the deep fascia are inevitably altered under high stress in the compartment.
To verify these hypotheses, we applied single-cell RNA sequencing (scRNA-seq) to interrogate the cellular heterogeneity, gene expression, and cell-to-cell interactions of the deep fascia in patients with ACS. Our study identified subclusters of fibroblasts and immune cells from the deep fascia as exhibiting variations in response to high stress in the compartment, implying physiological specialization. To date, there is limited knowledge of the cellular heterogeneity of the deep fascia in ACS patients. We present molecular information to improve our understanding of the deep fascia and elucidate its functions in the development of ACS.
We collected deep fascia from patients with ACS after tibiofibular fractures, which were considered as the high-stress group (HG, n=3), and those with osteosarcoma who underwent thigh amputation, which were regarded as the normal-stress group (NG, n=3) in our hospital (Figure 1A). Due to a lack of fascia from healthy people, we selected patients receiving thigh amputations due to osteosarcoma who were not sensitive to targeted chemotherapy drugs to diminish the effect of osteosarcoma on the deep fascia. Basic patient information, such as age and sex, was recorded and presented in Supplementary Table 1. We obtained informed consent from six human subjects, and our study was approved by the Third Hospital of Hebei Medical University Ethics Committee (No. JS-1940).
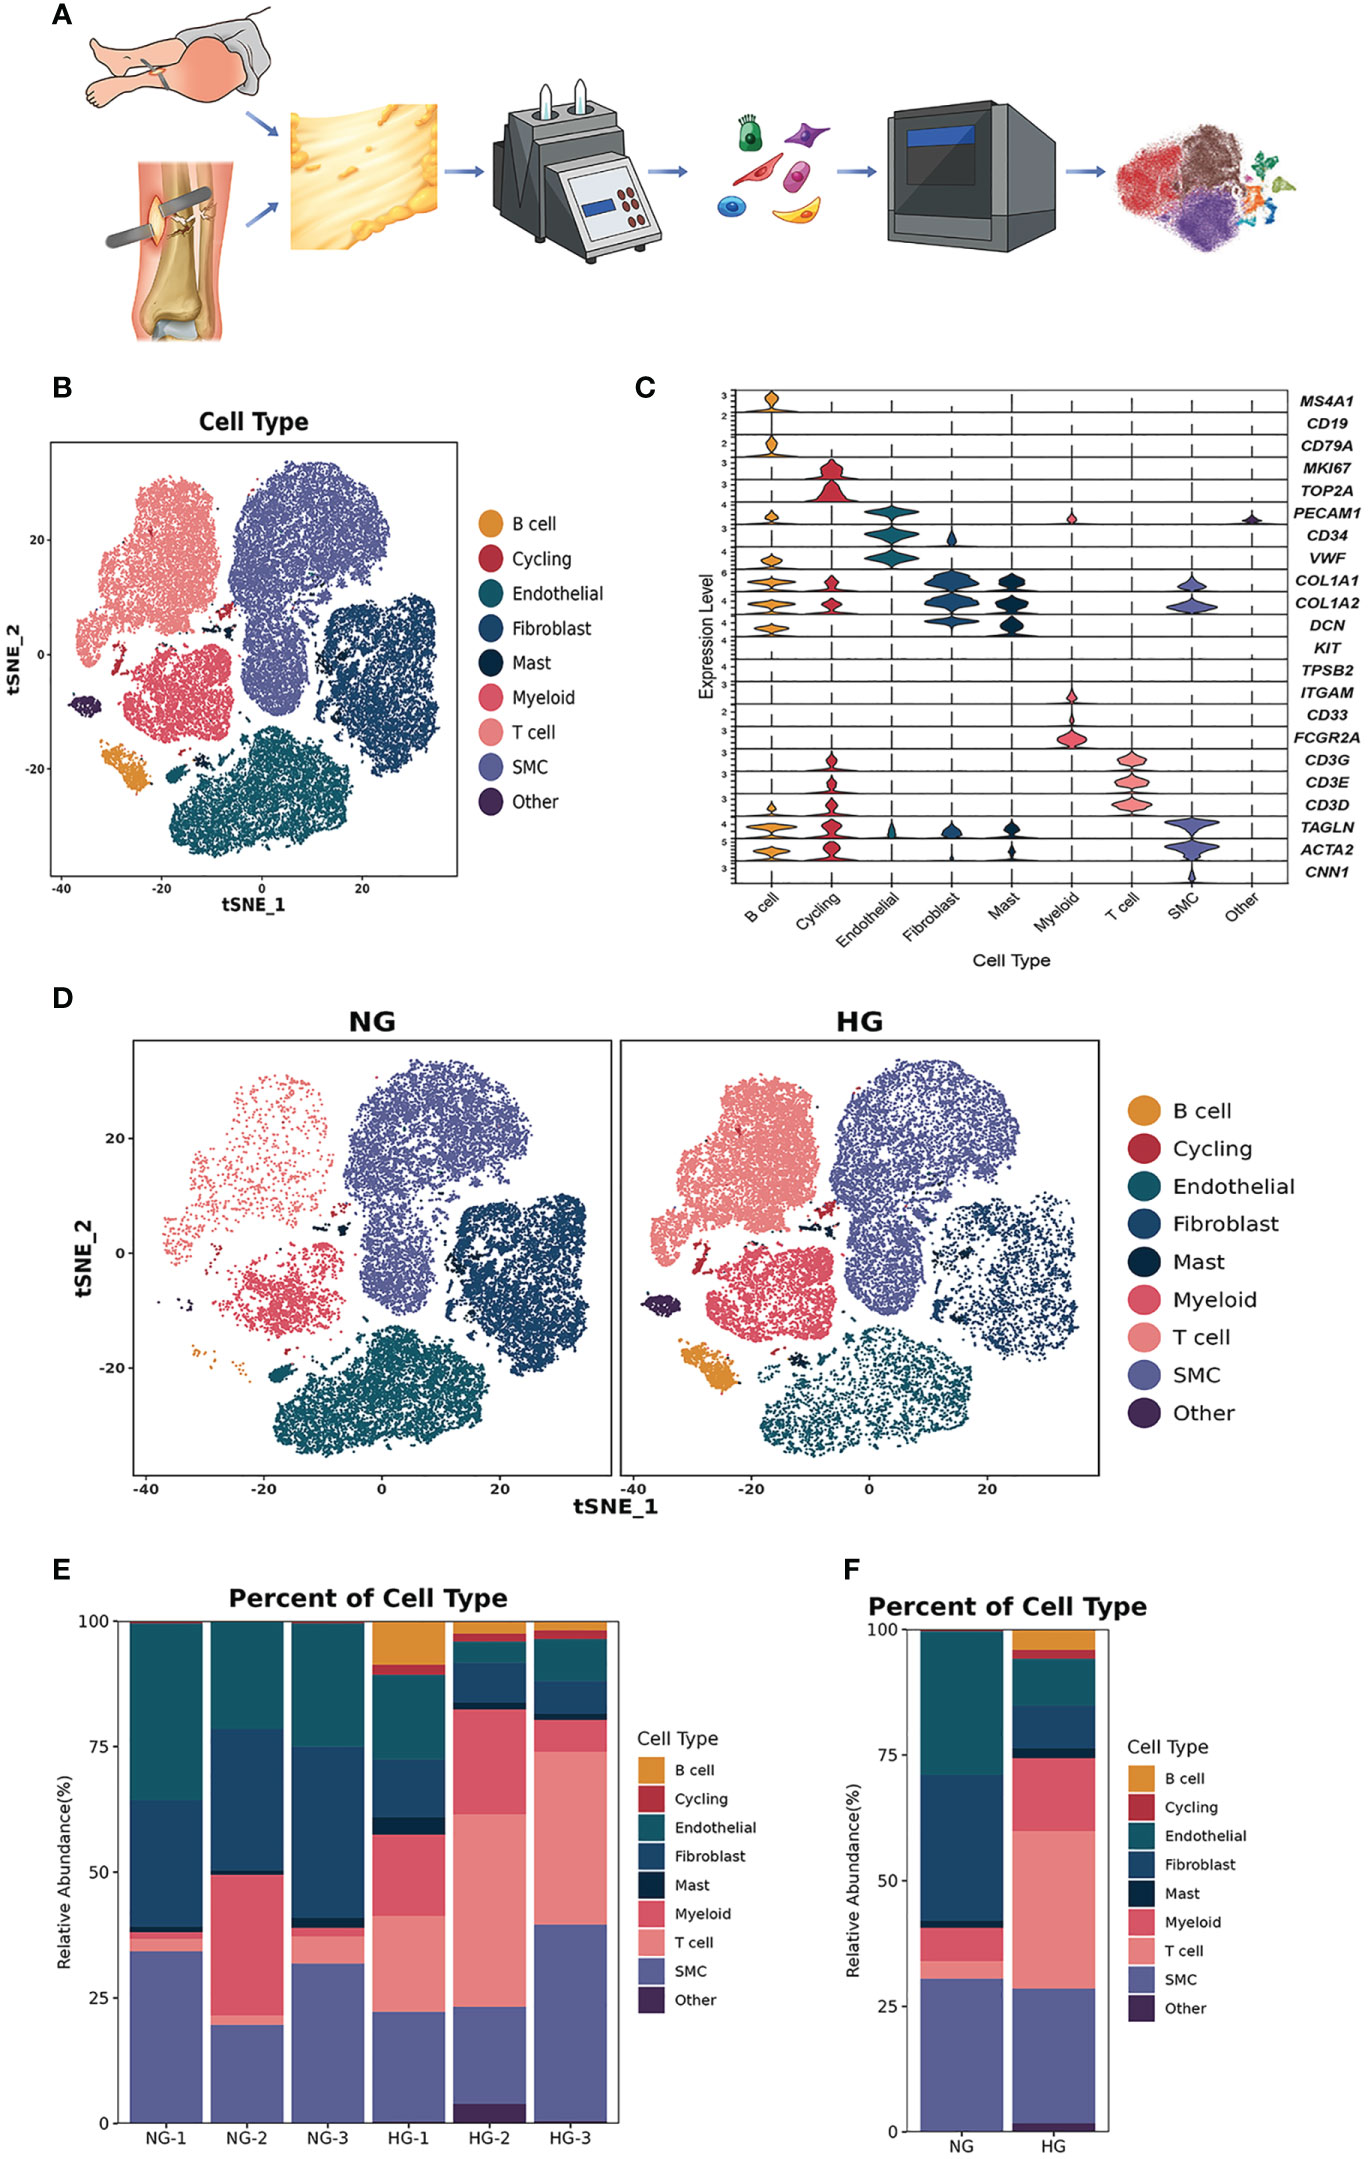
Figure 1 Clustering and classification of the cellular landscape of deep fascia tissue. (A) Overview of the experimental workflow. (B) tSNE visualization of cell cluster from deep fascia tissue. (C) Violin plots showing marker genes across cell clusters. (D) tSNE visualization of cell cluster from deep fascia tissue in HG and NG. (E) Bar plots showing the relative percentage of cell cluster for each sample as in (A). (F) Bar plots showing the relative percentage of cell cluster in HG and NG. scRNA-seq, single-cell RNA sequencing; HG, high stress group; NG, normal stress group.
A sterile RNase-free culture dish was placed on ice with PBS. The deep fascia samples were obtained from the medial shank of all participants. We cleaned blood spots and adipose tissue with 1×PBS and trimmed them into 0.5 mm2 fragments. Tissues were dissociated into single cells in a 37°C water bath with shaking at 100 rpm for 20 minutes in a dissociation solution (0.35% collagenase IV5, 2 mg/ml papain, 120 units/ml DNase I). Decomposition was stopped by pipetting 5-10 times with a Pasteur pipette in 1× PBS containing 10% fetal bovine serum (FBS, V/V). The cell suspension was then filtered using a 70-30 µm stacked cell strainer before being centrifuged at 300 × g for 5 minutes at 4°C. Single-cell suspensions were counted using a hemocytometer/Countess II Automated Cell Counter, and the concentration was adjusted to 700-1200 cells/μl. Overall cell viability was validated by trypan blue exclusion, which was required to be above 85%.
According to the manufacturer’s instructions for the 10X Genomics Chromium Single-Cell 3’ Kit (V3), single-cell suspensions were placed into 10x Chromium to capture 8000 single cells. The processes for cDNA amplification and library creation were carried out according to the conventional procedure. LC-Bio Technology Co., Ltd. (Hangzhou, China) sequenced libraries using an Illumina NovaSeq 6000 sequencing system (paired-end multiplexing run, 150 bp) at a minimum depth of 20,000 reads per cell (Figure 1A).
Illumina bcl2fastq software (version 2.20) was applied to demultiplex the sequencing data and converted it to FASTQ format. The Cell Ranger pipeline (version 6.1.1) was used to demultiplex samples, process barcodes, and count single-cell 3’ genes, and scRNA-seq data were aligned to the GRCh38 reference genome in Ensembl. A total of 64222 single cells were processed using 10X Genomics Chromium Single Cell 3’ Solution from three patients with blisters after tibiofibular fractures and three patients with thigh amputation (Figure 1A). The Cell Ranger output was loaded into Seurat (version 3.1.1) and used for dimensionality reduction, clustering, and analysis of scRNA-seq data. Then, to filter the environmental RNA contamination caused by these techniques, we used CellBender (version 0.2.0) to assess and adjust the results. Ultimately, 53116 cells passed the quality control threshold. These cells were kept if they met the following criteria: (1) they expressed genes in more than one cells; (2) they expressed more than 500 genes per cell; and (3) the percentage of mitochondrial DNA-derived gene expression was less than 25%. Doublets were removed using DoubletFinder.
We utilized Seurat to reduce the dimensionality of all 53116 cells and tSNE to project the cells into 2D space to display the data. The procedure is as follows: First, we calculated the expression value of genes using the LogNormalize technique of the Seurat software’s “Normalization” function; second, the normalized expression value was used to perform principal component analysis (R harmony), and the top 20 PCs were utilized for clustering and tSNE analysis; third, to locate clusters, the weighted Shared Nearest Neighbor graph-based clustering approach was applied. “bimod”: A likelihood-ratio test was used to find marker genes for each cluster using the FindAllMarkers function in Seurat. This method chooses marker genes that are expressed in more than 10% of the cells in a cluster and have an average log (fold change) larger than 0.26.
The number of unique molecular identifiers, percentage of mitochondrial genes, and genes were scaled to unit variance. Principal component analysis was performed. Clusters were then identified using tSNE. Cell identity was assigned using known markers.
The differentially expressed genes (DEGs) between two groups comparing the same cell types were identified using the defalut parameters via the FindMarkers function in Seurat. These genes were categorized by average log2 (fold change) after being processed with a minimum log2 (fold change) of 0.26 and a maximum adjusted p value of 0.01. Gene Ontology (GO) terms and Kyoto Encyclopedia of Genes and Genomes (KEGG) pathways were used to create the gene sets.
CellPhoneDB (v3) was utilized to investigate cell-cell interactions between cells in depth. According to the concept of receptor expression by one cell subpopulation and ligand expression by another, we calculated possible ligand-receptor interactions. The normalized counts of cells in the two groups were independently downloaded and used as input for the CellPhoneDB method.
We performed an ultrasound to observe the differences in the morphology of the deep fascia between the HG and NG.
We observed changes in the morphology of the deep fascia in the HG and NG using scanning electron microscopy (HITACHI, SU8100). To avoid pulling and clamping of the fascia during sample selection, samples were collected within 1–3 minutes, washed in PBS (gently during washing), and subjected to the removal of surface impurities and blood stains. Then, a razor blade was used in an electron microscope fixator to repair blocks (while fixing blocks), and the tissue blocks were rectangular as often as possible, with a size of approximately 5 mm*3 mm. The surface was cut in the top right corner (to distinguish the surface). When collecting materials, we were careful to avoid mechanical damage, such as forceps extrusion, and the blade was sharpened to prevent tissue bruising. The scanning surface was handled with extreme care. The tissue was immediately fixed under an electron microscope after it was removed.
The diverse cell subsets in the fascia were identified by multiplex staining and multispectral imaging using a PANO 5-plex IHC kit (cat 0004100100) (Panovue, Beijing, China). CD3, α-SMA, and CD14 were applied sequentially and incubated with a secondary antibody conjugated to horseradish peroxidase and a tyramide signal amplification reagent. Each slide was heat-treated using a microwave after TSA conjugation. DAPI was applied to label the location of nuclei after all the other antigens had been stained. To obtain high-quality images, all stained slides were scanned under the Mantra System (PerkinElmer, Waltham, Massachusetts, US). The fluorescence spectra were set at 20-nm wavelength intervals from 420 to 720 nm with identical exposure times.
After data preprocessing and quality control, we obtained single-cell transcriptomes of 53116 cells in two groups, including 27166 cells from the HG and 25950 cells from the NG. We applied unsupervised graph-based clustering to identify 9 clusters, which mainly consisted of B cells (CD79, CD19, and MS4A1), cycling cells (TOP2A and MKI67), endothelial cells (VWF, PECAM1, and CD34), fibroblasts (COL1A1, COL1A2, and DCN), mast cells (KIT and TPSB2), myeloid cells (FCGR2A, CD33, and ITGAM), T cells (CD3G, CD3E, and CD3D), smooth muscle cells (CNN1, ACTA2, and TAGLN), and other cells, by evaluating the expression of canonical markers (Figures 1B–D). Figure 1E showed the proportions of each cluster in different individuals, and we observed significantly higher proportions of B cells, T cells, cycling, mast cells, and myeloid cells but markedly lower proportions of fibroblasts, endothelial cells, and smooth muscle cells in the HG than in the NG (Figure 1F, Supplementary Table 2). This was consistent with the results of multiplex staining and multispectral imaging, which showed variations of fibroblasts and immune cells, including T cells and myeloid cells, in the HG compared with the NG (Figure 2A). Ultrasound showed a low-echo region surrounding the deep fascia in the HG but not in the NG (Figure 2B). Chaotic organization of collagen fiber bundles and broken collagen fibers could be observed in the HG compared with the NG (Figure 2C).
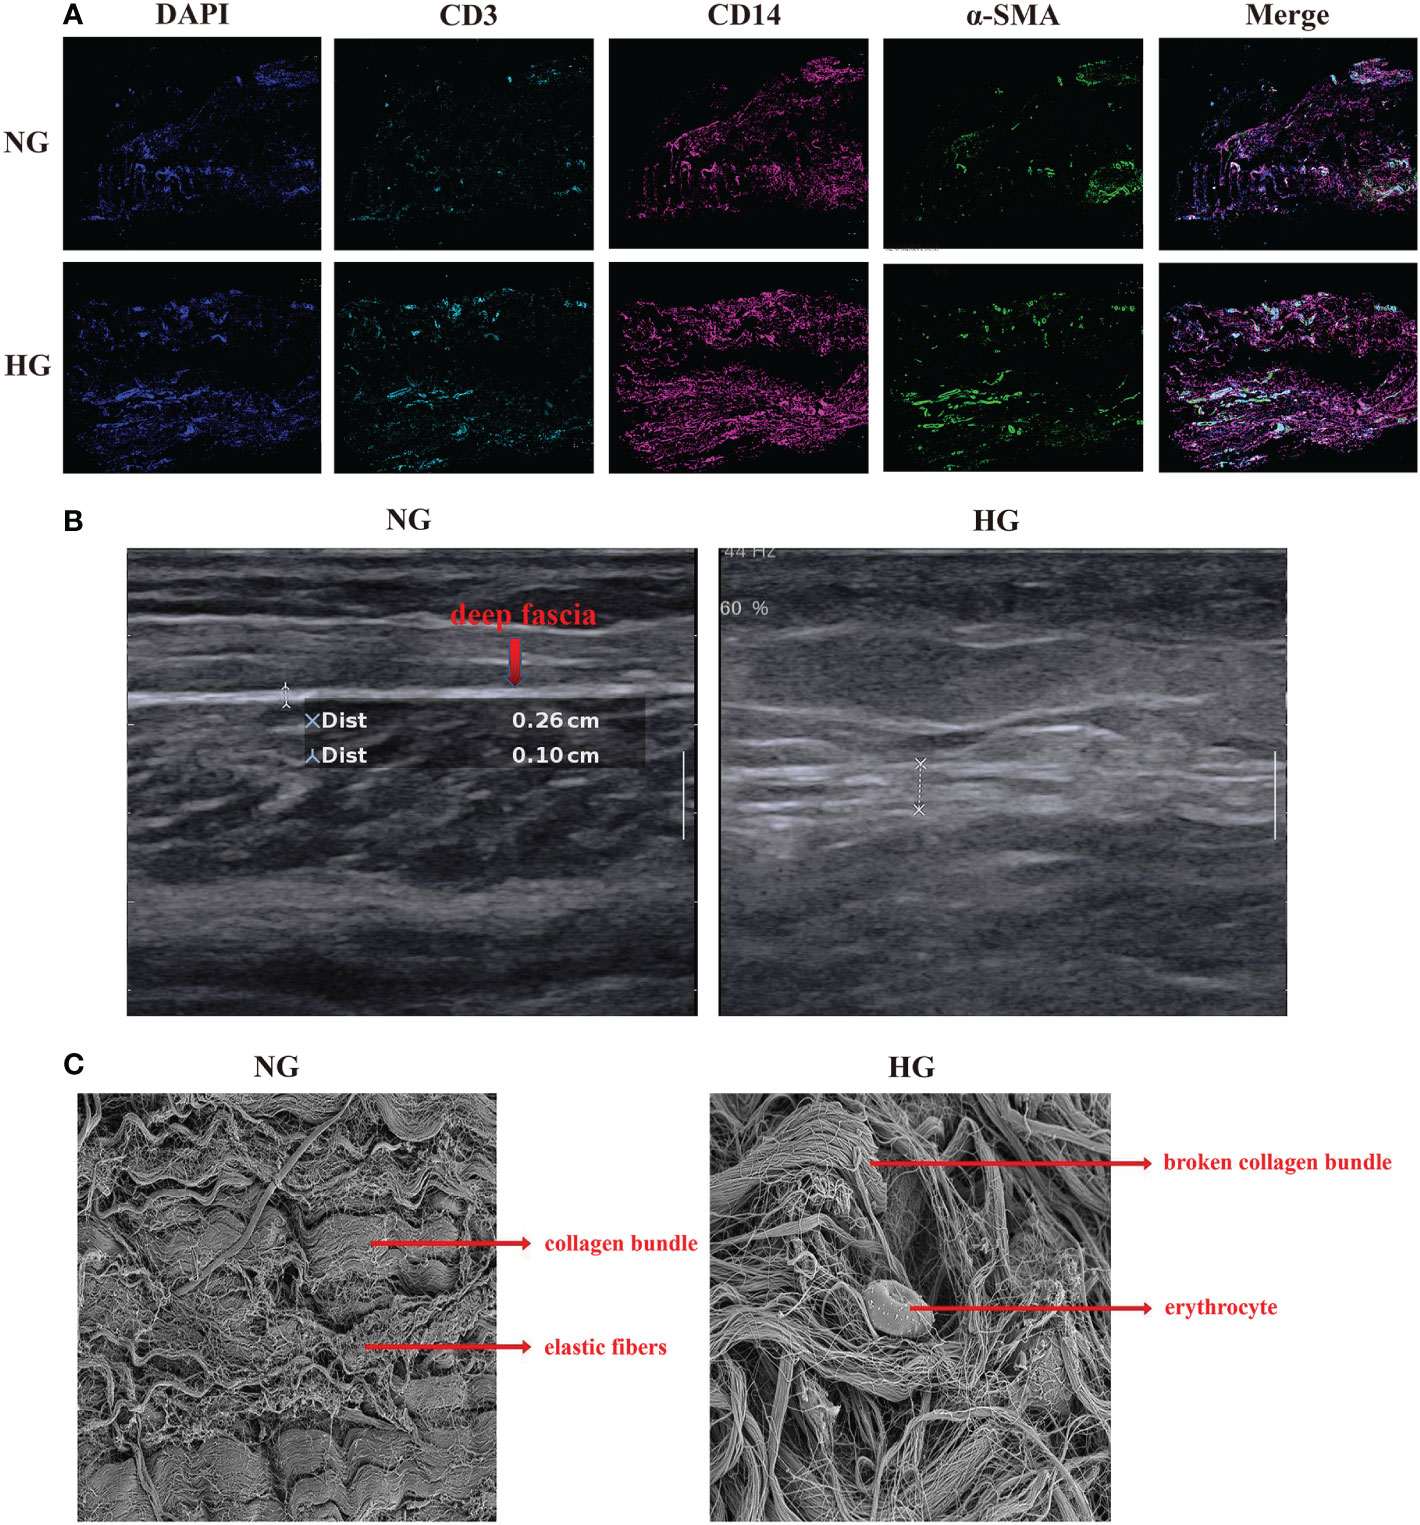
Figure 2 Multiplex staining and multispectral imaging, ultrasound and Scanning Electron Microscope for deep fascia in two groups. (A) Multiplex staining and multispectral imaging showing fibroblasts and immune cell infiltration, including T cells and myeloid cells in HG compared with NG. *green (α-SMA): fibroblast; pink (CD14): myeloid cells; blue (CD3): T cell. (B) ultrasound in patients with in HG (right side) compared with the NG (left side) in ultrasound. (C) Scanning Electron Microscope in HG and NG. Left: parallel arrangement of collagen fiber bundles in NG; right: chaotic overall arrangement of collagen fiber bundles in HG. HG, high stress group; NG, normal stress group.
To further explore the specific signatures of T cells in two groups, we subgrouped T cells into eleven cell subtypes: the Naive T-cell (CD3D, CD3E, TCF7, and IL7R), CD4 central memory T-cell (TCM; CD4, TCF7, SELL, CCR7, GPR183, IL7R), GZMK+ effector CD4 T-cell (Teff; CD4, GZMK, GATA3, and ISG15), GATA3+ CD4 TCM (GATA3, TCF7, SELL, CCR7, GPR183, IL7R), GZMK+interferon(INF)-act CD4 TCM (IFI6, ISG15, CD4, TCF7, GZMK, GPR183, CCR7, SELL, IL7R), regulatory T-cell (Treg; FOXP3, CD4), cytotoxic CD8 T-cell (GNLY, FCGR3A, NKG7, TRDCCD8A), GZMK+ CD8 Teff (NKG7, GZMK, CD8A), GATA3+ CD8 TCM (GATA3, SELL, CCR7, IL7R, GPR183, TCF7, CD8A), nature killer T-cell (NKT, GNLY, TRDC, TRGC1 CD3D), and innate lymphoid cell (ILC, RORC, IL23R, IF16) subtypes (Figures 3A–C) (26). Next, we compared the proportions of T-cell subsets in the two groups. We observed higher proportions of CD4 TCM, GATA3+ CD4 TCM, GATA3+ CD8 TCM, GZMK+IFN-act CD4 TCM, and Treg cells, as well as lower proportions of cytotoxic CD8 T cells, GZMK+ CD8 Teff cells, and ILCs, in HG than in NG (Figures 3C–E, Supplementary Table 2). Notably, the GZMK+ IFN-act CD4 TCM subtype was almost absent in the NG but almost occurred in the HG.
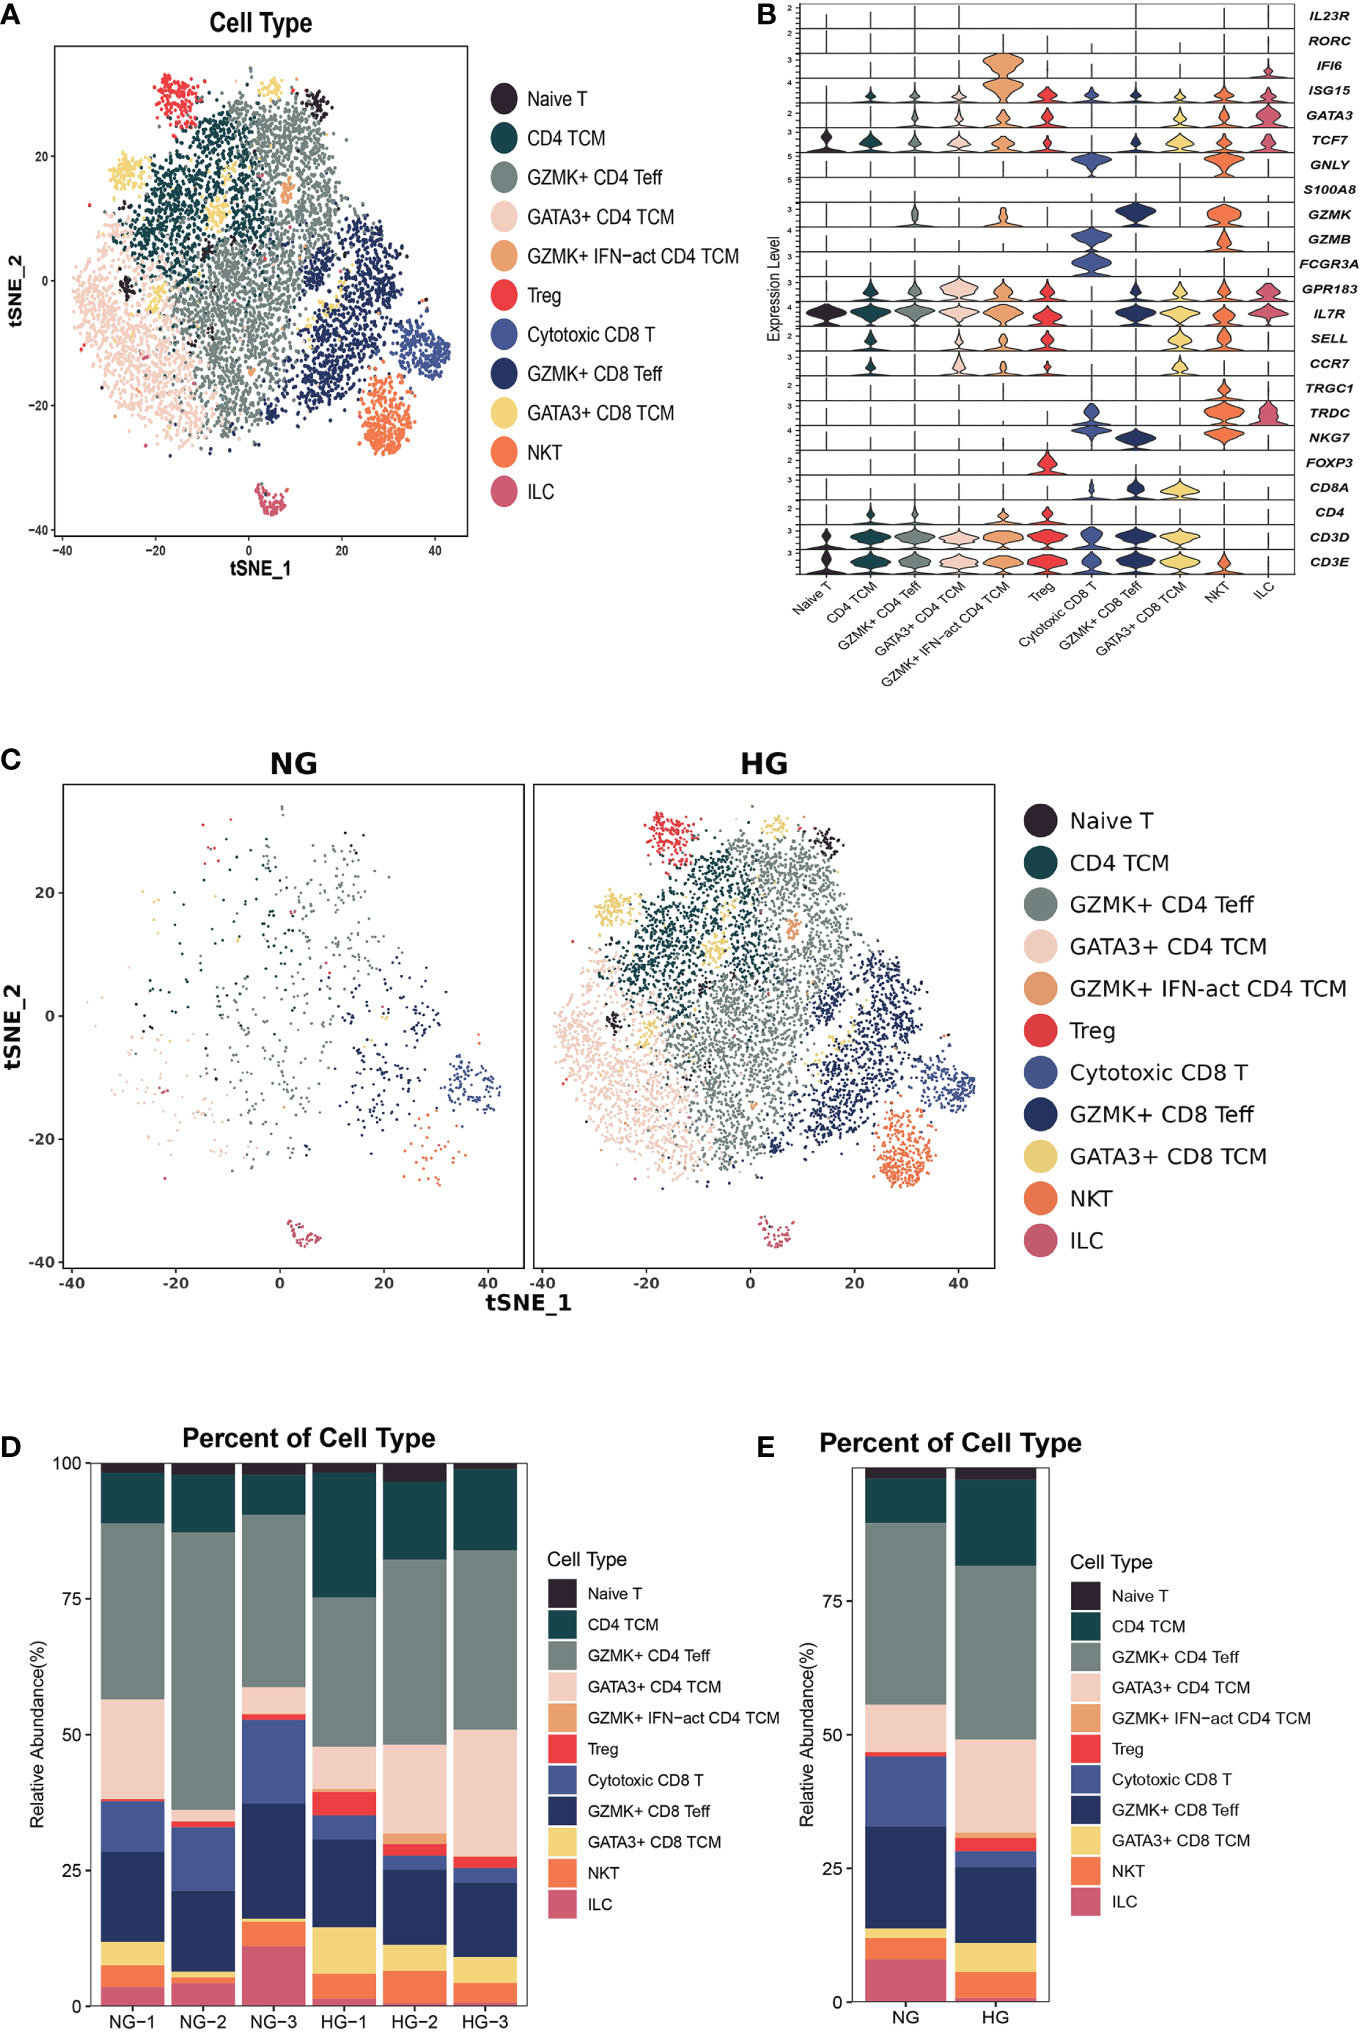
Figure 3 Clustering and classification of the T cell subclusters of deep fascia tissue. (A) tSNE visualization of T cell subclusters from deep fascia tissue. (B) Violin plots showing marker genes across T cell subclusters. (C) tSNE visualization of T cell subclusters from deep fascia tissue in HG and NG. (D) Bar plots showing the relative percentage of T cell subclusters for each sample. (E) Bar plots showing the relative percentage of T cell subclusters in HG and NG. HG, high stress group; NG, normal stress group; TCM, central memory T cell; Teff, effector T cell; Treg, regulator T cell; ILC=innate lymphoid cells; NKT=nature killer T cell.
Next, we compared the top 10 differentially expressed genes (DEGs) of T-cell subtypes in the two groups. In HG, heat shock protein (HSP) genes, such as HSPH1 (HSP110), HSP90AA1 (HSP90), HSPA1A (HSP70), HSPA1B (HSP70), HSPD1 (HSP60), DNAJA1 (HSP40), and HSPE1 (HSP10), were up-regulated in nine subsets, except for GZMK+IFN-act CD4 TCM and naive T cells (Figure 4). As we know, HSP genes were associated with stress and the inflammatory response (27, 28). Additionally, metal ion-related genes, including metallothionein (MT) family genes (MT2A, MT1E, MT1X, MT-CO1, MT-CO3, and MT-CYB), TIMP1, FTH1, FTL, CRIP1, MGP, and ANXA1 were down-regulated in these nine subclusters (Figure 4). In addition, we found the GZMK+IFN-act CD4 TCM subset nearly in the HG, with high expression of IFN-related genes (ISG15, IFI6), GATA3, and GZMK (Figures 3B–E). We also found Treg had a higher expression of CD69 and GATA3+CD4 TCM had a higher expression of KLF2 in HG.
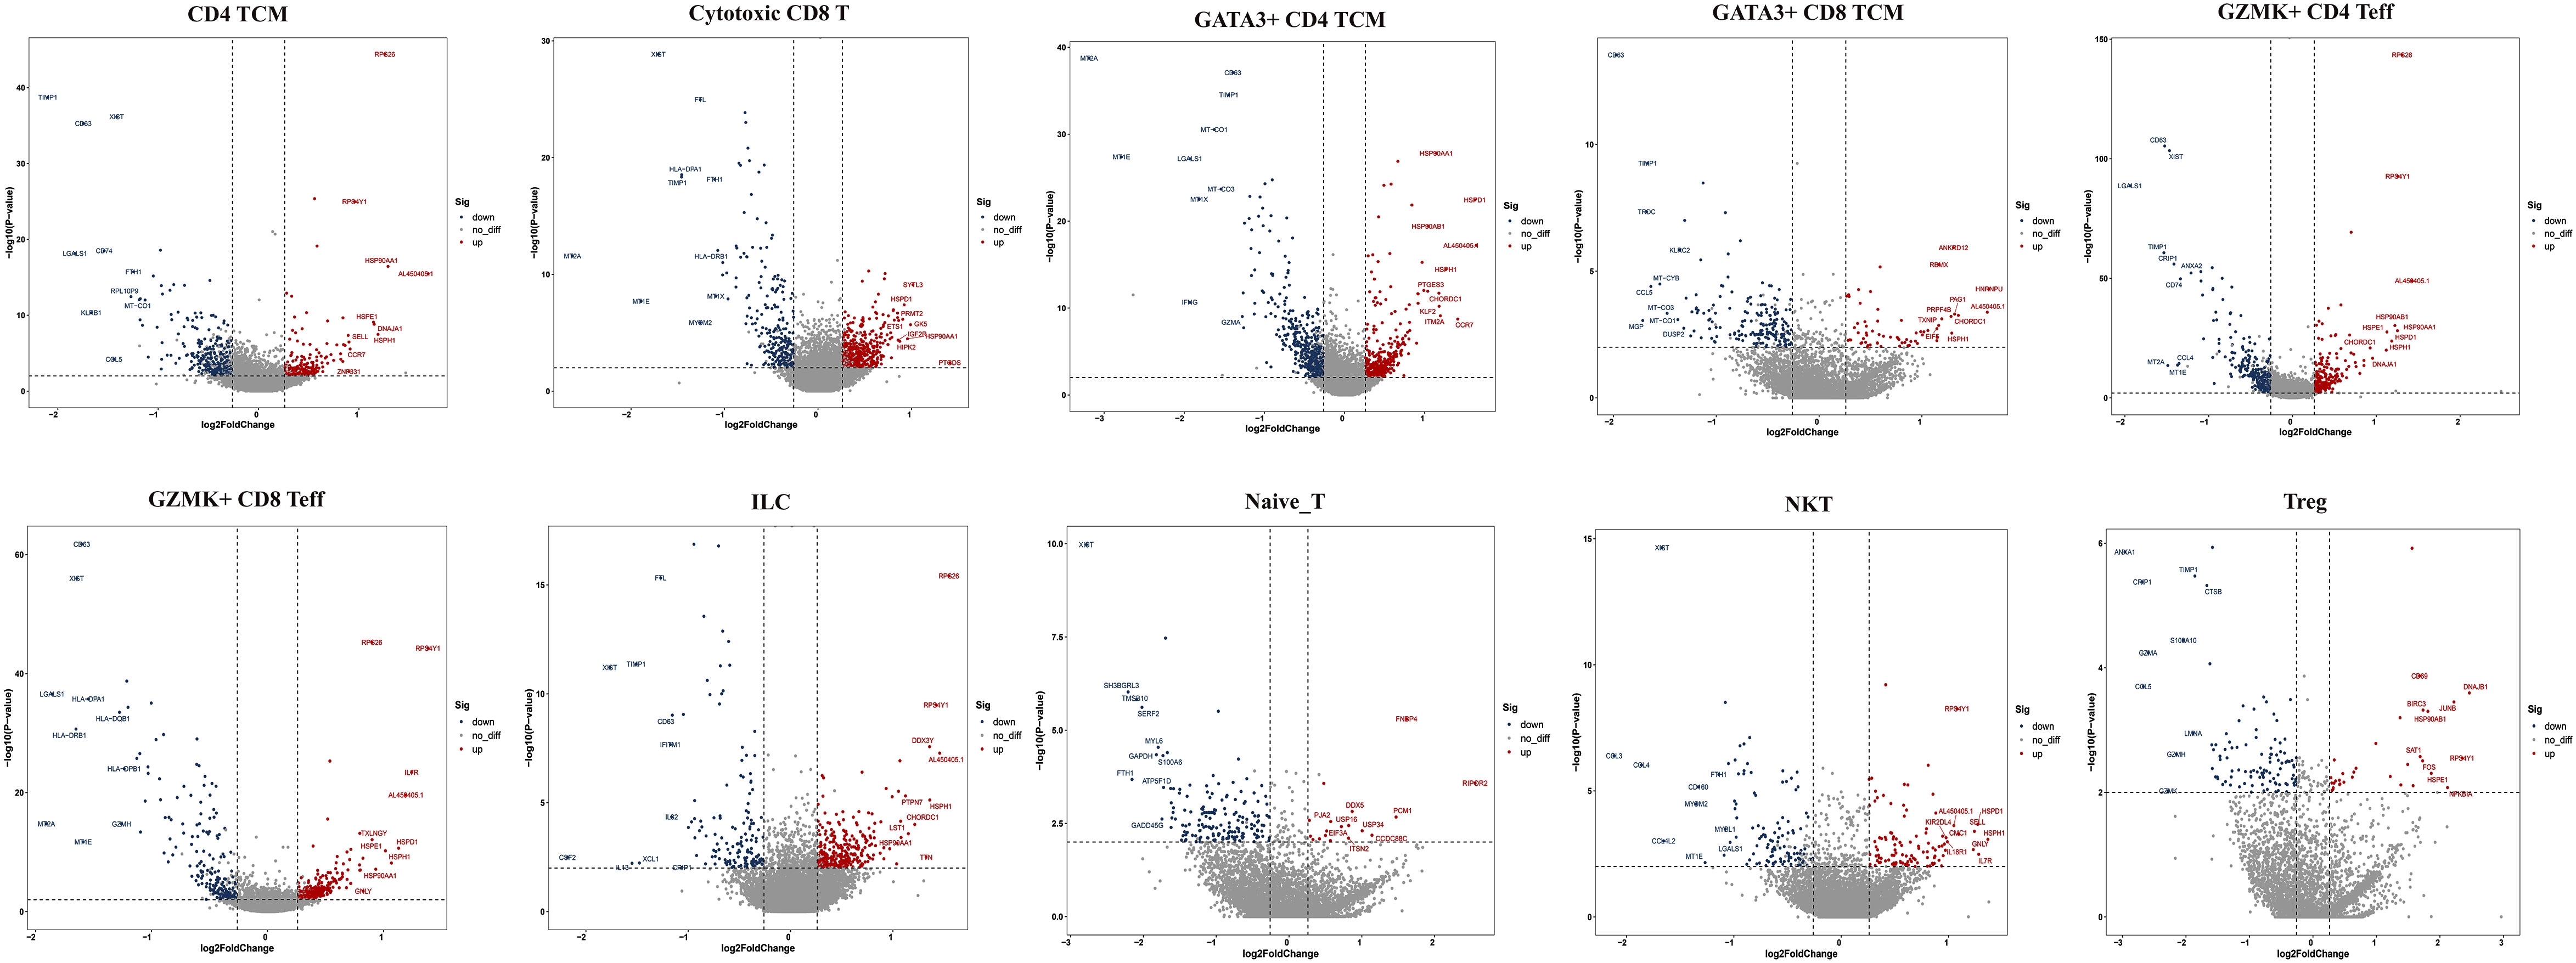
Figure 4 Top 10 differentially expressed genes (DEGs) of T cell subclusters. TCM, central memory T cell; Teff, effector T cell; Treg, regulator T cell; ILC, innate lymphoid cells; NKT, nature killer T cell.
Then, we performed GO and KEGG pathway analyses in the two groups. The CD4 TCM, cytotoxic CD8 T, GATA3+CD4 TCM, GATA3+CD8 TCM, and GZMK+CD4 Teff subtypes were mainly involved in “extracellular exosome”, “antigen processing and presentation” and “oxidative phosphorylation“ (Supplementary Figures 1, 2). Cytotoxic CD8 T, GATA3+CD4 TCM, GATA3+CD8 TCM, and GZMK+CD4 Teff cells were mostly engaged in “Th1, Th2, and Th17-cell differentiation” (Supplementary Figures 1, 2). GZMK+CD8 Teffs and GZMK+CD4 Teffs were related to the “MHC class II protein complex” (Supplementary Figures 1, 2). The GZMK+IFN-act CD4 TCM subtype was linked to “response to type I interferon, interferon-gamma, interferon-beta, and interferon-alpha”. Moreover, some subpopulations played crucial roles in signaling pathways. For example, the GATA3+CD8 TCM was related to “HIF signaling pathway”, NKT cells were involved in “Chemokine signaling pathway” and “CCR chemokine receptor binding”, Treg cells were associated with “IL-17 signaling pathway”, “NF-kappa B signaling pathway”, “TNF signaling pathway”, and “Ferroptosis”, and the GZMK+IFN-act CD4 TCM was linked to “NF-kappa B signaling pathway”, “type I interferon signaling pathway”, “TNF mediated signaling pathway” and “interferon-gamma mediated signaling pathway” (Supplementary Figures 1, 2).
Overall, we identified a specific subcluster in the HG, GZMK+IFN-act CD4 TCM, with high expression of IFN-related genes, which was almost absent in the NG but was almost present in the HG. Furthermore, we found that HSP genes were highly expressed in nine of eleven T-cell subclusters under high stress. Additionally, some signaling pathways may be important regulators of molecular mechanisms under high stress in the deep fascia.
To further explore the specific signatures of macrophages (Mac) in the two groups, we identified four subclusters: SPP1+Mac0 (SPP1, VCAN, NUPR1), IL1B+ Mac1 (VCAN, FCN1, CD14, IL1B, IF16, CD68), C1QA+ Mac2 (VCAN, C1QA, CD68, CD163) and IFN-act Mac2 (IF16, C1QA, CD68, CD163) (26, 29) (Figures 5A–C). We observed higher proportions of SPP1+ Mac0, C1QA+ Mac2, and IFN-act Mac2, as well as lower proportions of IL1B+ Mac1, in HG than in NG (Figures 5D, E; Supplementary Table 2). In terms of the top 10 DEGs, APOE was up-regulated, but the S100 family (S100A6, S100A8, S100A9, S100A10, or S100A12) was down-regulated in four subclusters (Figure 6A). Additionally, SPP1 was up-regulated in SPP1+Mac0 and IL1B+Mac1 under high stress, while APOC1 was up-regulated in SPP1+Mac0.
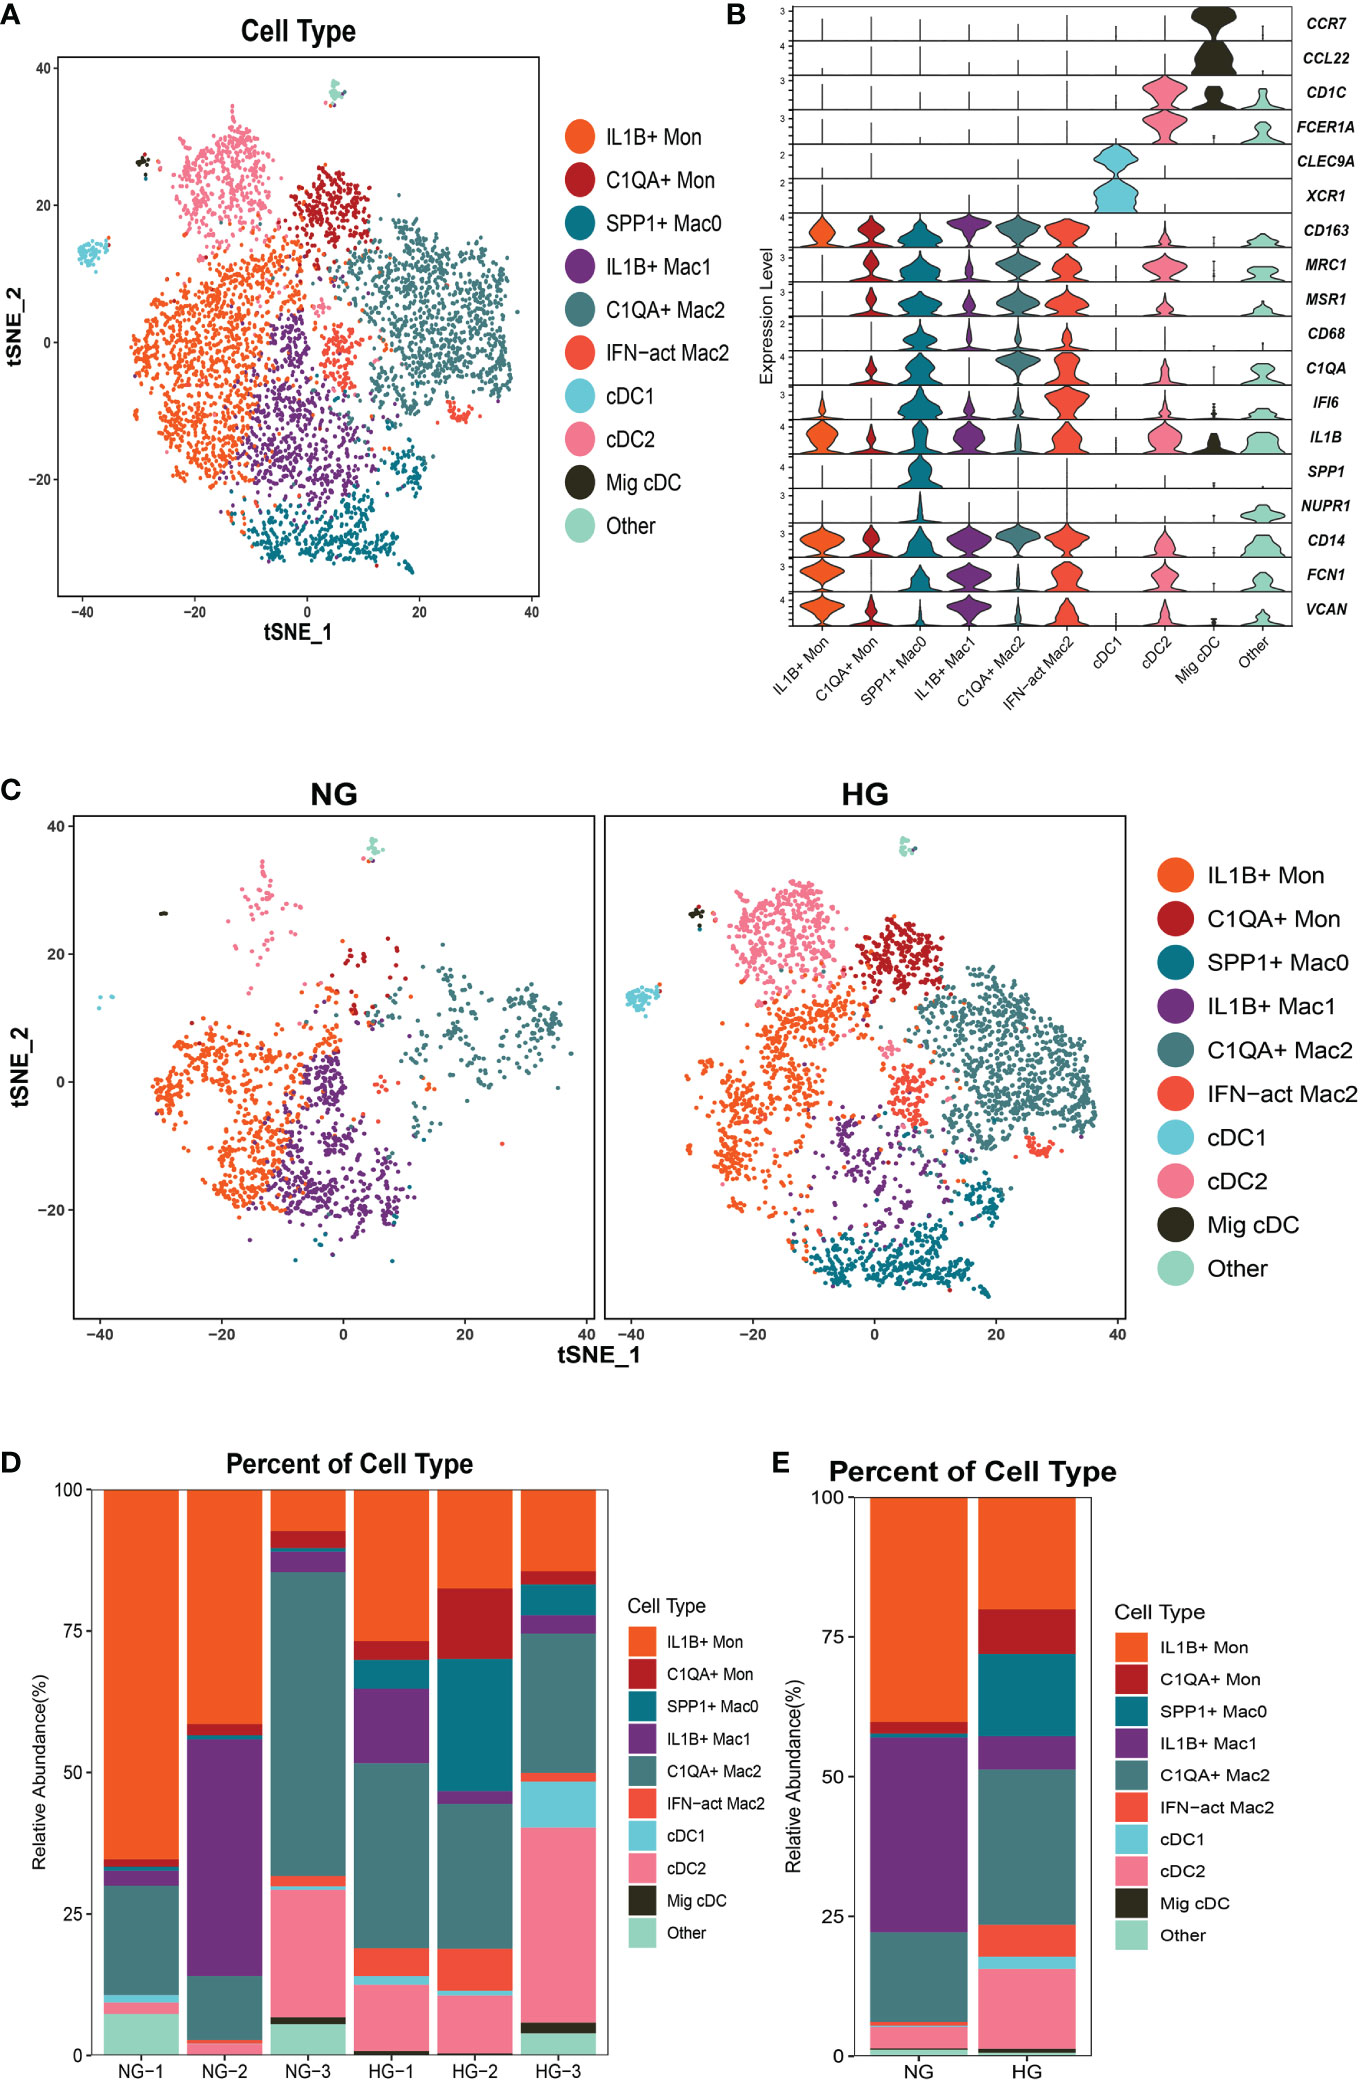
Figure 5 Clustering and classification of the myeloid cell subclusters from deep fascia tissue (A) tSNE visualization of myeloid cell subclusters from deep fascia tissue. (B) Violin plots showing marker genes across myeloid cell subclusters. (C) tSNE visualization of myeloid cell subclusters from deep fascia tissue in HG and NG. (D) Bar plots showing the relative percentage of myeloid cell subclusters for each sample. (E) Bar plots showing the relative percentage of myeloid cell subclusters in HG and NG. HG, high stress group; NG, normal stress group; Mac, macrophage; DCs, dendritic cells; Mon, monocyte.
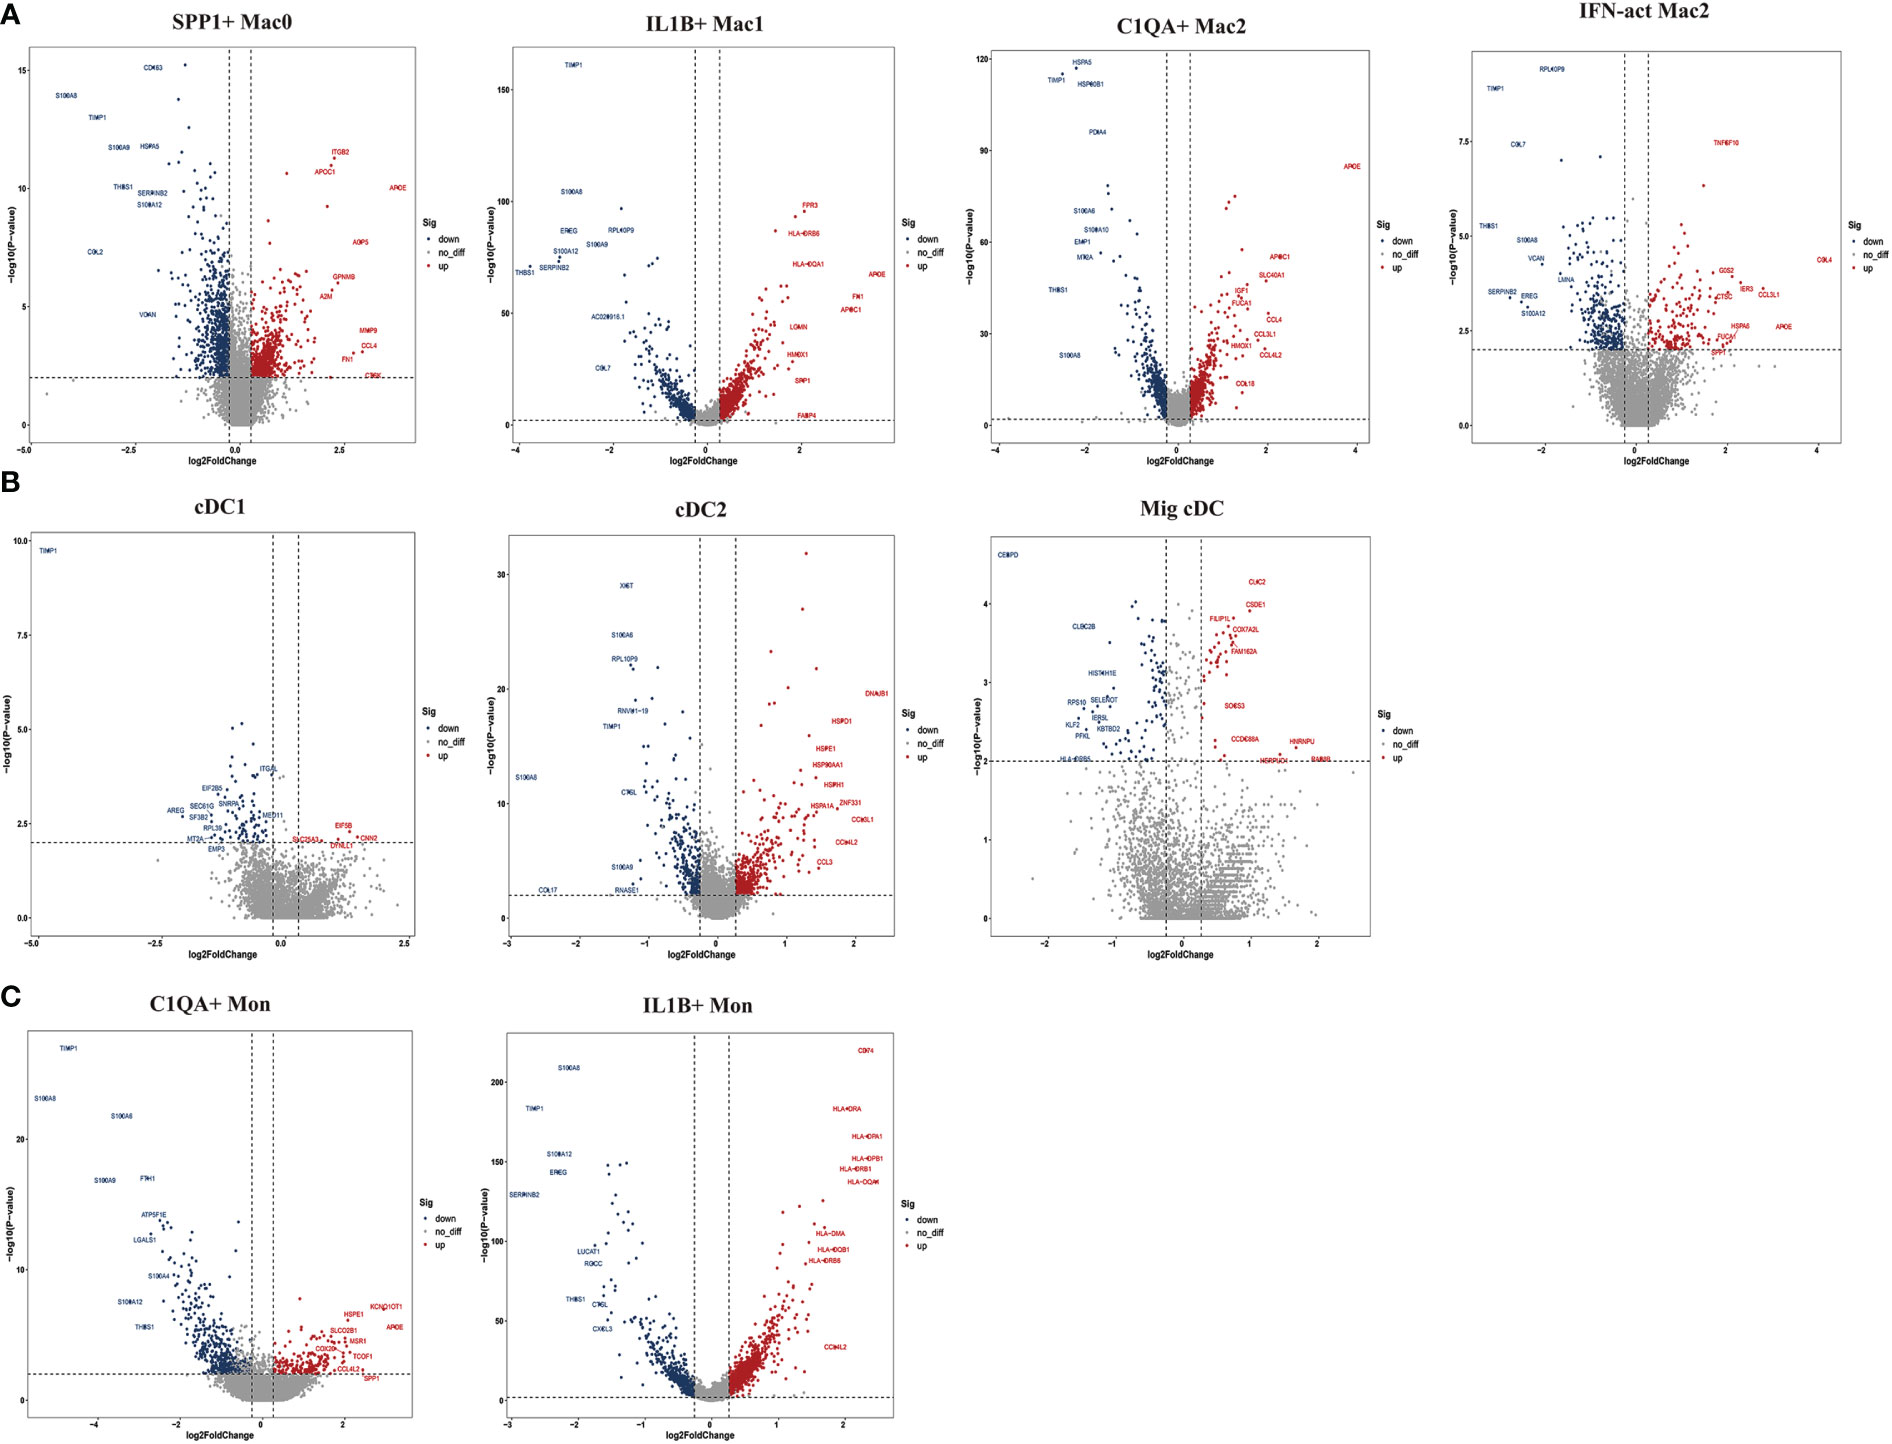
Figure 6 Top 10 differentially expressed genes (DEGs) of myeloid cell subclusters in HG and NG. (A) DEGs of macrophage (Mac) subclusters in HG and NG. (B) DEGs of dendritic cells (DCs) subclusters in HG and NG. (C) DEGs of monocyte (Mon) subclusters in HG and NG. HG, high stress group; NG, normal stress group.
The GO term and KEGG pathway data showed that SPP1+ Mac0 was involved in “antigen processing and presentation” and “oxidative phosphorylation”. IL1B+Mac1 participated in “antigen processing and presentation”, “oxidative phosphorylation”, “NF-kappa B signaling pathway”, and “ferroptosis”. C1QA+Mac2 was involved in the “cytokine-mediated signaling pathway”, “NF-kappa B signaling pathway”, and “ferroptosis”. IFN-act Mac2 was related to “inflammatory response”, “cellular response to interferon-gamma”, and “NOD-like receptor signaling pathway” (Supplementary Figures 3, 4).
Taken together, these data revealed significant variation in the proportions of four Mac subclusters from deep fascia under high stress. Furthermore, a few signaling pathways may be activated in molecular mechanisms following fascia injury.
To further explore the specific signatures of dendritic cells (DCs) in the two groups, we identified three DC subtypes (cDC1s (XCR1, CLEC9A), cDC2s (FCN1, CD14, IL1B, C1QA, MSR1, MRC1, CD163, FCER1A, CD1C), and Migratory cDCs (Mig cDCs, IL1B, CD1C, CCL12, CCR7)) (26, 29), and all three DC subtypes had significantly higher proportions in HG (Figures 5A–E; Supplementary Table 2). In terms of the top 10 DEGs, HSP genes (HSPA1A, HSP90AA1, HSPD1, and HSPH1) and chemokine genes (CCL3L1 and CCL4L2) were up-regulated in cDC2s under high stress. Notably, metal ion-related genes were down-regulated in three DC subpopulations in HG. For example, TIMP1 and MT2A were down-regulated in cDC1s. TIMP1, S100A6, S100A8, and S100A9 were down-regulated in cDC2s, as well as PFKL in Mig cDCs (Figure 6B). The GO term and KEGG pathway data showed that cDC1 cells were associated with the “homeostasis process”, as well as the HIF signaling pathway, p53 signaling pathway, and Notch signaling pathway. cDC2s were involved in the “inflammatory response” and “extracellular exosome”, as well as the IL-17 signaling pathway, chemokine signaling pathway, and NF-kappa B signaling pathway. Mig cDCs participated in the FoxO signaling pathway (Supplementary Figures 5, 6).
Taken together, these data revealed significant variations in the proportions of three cDC subclusters in the deep fascia under high stress. Additionally, some signaling pathways may be engaged in molecular mechanisms after fascia injury.
To further explore the specific signatures of monocytes (Mon) in the two groups, we identified two Mon subtypes C1QA+ Mon (VCAN, CD14, IL1B, C1QA, MSR1, MRC1, CD163) and IL1B+ Mon (VCAN, FCN1, CD14, IL1B, IF16, CD163)) (26, 29) and found higher proportions of C1QA+ Mon and lower proportions of IL1B+ Mon in HG than in NG (Figure 5A–E; Supplementary Table 2). Regarding the two Mon subclusters, CCL4L2 was up-regulated, while S100 family members, TIMP1 and THBS1 were down-regulated in HG (Figure 6C). Furthermore, HLA family members (HLA-DRA, HLA-DPB1, HLA-DQA1, HLA-DPA1, HLA-DRB1, and HLA-DRB6) were up-regulated in IL1B+ Mon in HG (Figure 6C). The data for GO terms and KEGG pathways showed that IL1B+ Mon was involved in “inflammatory response”, “extracellular exosome”, and “NOD-like receptor signaling pathway” (Supplementary Figure 7).
Taken together, these data revealed significant variation in the proportions of two Mon subclusters in deep fascia under high stress. Furthermore, a few signaling pathways may be activated in molecular mechanisms following fascia injury.
To further explore the specific signatures of fibroblasts (Fib) in the two groups, we subdivided fibroblasts into five cell subtypes: the mesenchymal Fib (POSTN, COMP, ASPN), myoFib (RGS5, ACTA2), proinflammatory Fib (CCL19, CXCL12, APOE), secretory papillary Fib (COL13A1, COL18A1, APCDD1) and secretory reticular Fib (MFAP5, ANGPTL1, CCN5) subtypes (30) (Figures 7A–C). Next, we compared the proportions of fibroblast subsets in the two groups. Interestingly, the proportions of the mesenchymal Fib, myoFib, pro-inflammatory Fib, and secretory papillary Fib subtypes dramatically increased, and a lower proportion of the secretory reticular Fib subtype was observed in the HG (Figures 7D, E, Supplementary Table 2). Next, we compared the top 10 DEGs of fibroblasts in the two groups. Regarding all fibroblast subclusters, fibrillar collagen genes, such as COL1A1 and COL3A1 were up-regulated in HG (Figure 8). Notably, COL1A2 and COL5A2 were up-regulated in myoFib and pro-inflammatory Fib (Figure 8). Additionally, POSTN and SPARC were up-regulated in myoFib, pro-inflammatory Fib, and secretory reticular Fib. Genes that were engaged in metal ion binding, such as MYOC, GSN, and IGFBP6, were down-regulated in four subclusters (Figure 8). The GO term data showed that the five subpopulations were involved in “collagen fibril organization”, “collagen-containing extracellular matrix”, and “extracellular space” (Supplementary Figure 8). KEGG pathway analysis showed that the PI3K-Akt signaling pathway and TGF-beta signaling pathway may be involved in the regulation of pressure in the compartment (Supplementary Figure 9). Additionally, the mesenchymal Fib, myoFib, proinflammatory Fib, and secretory papillary Fib subtypes were engaged in “protein digestion and absorption”.
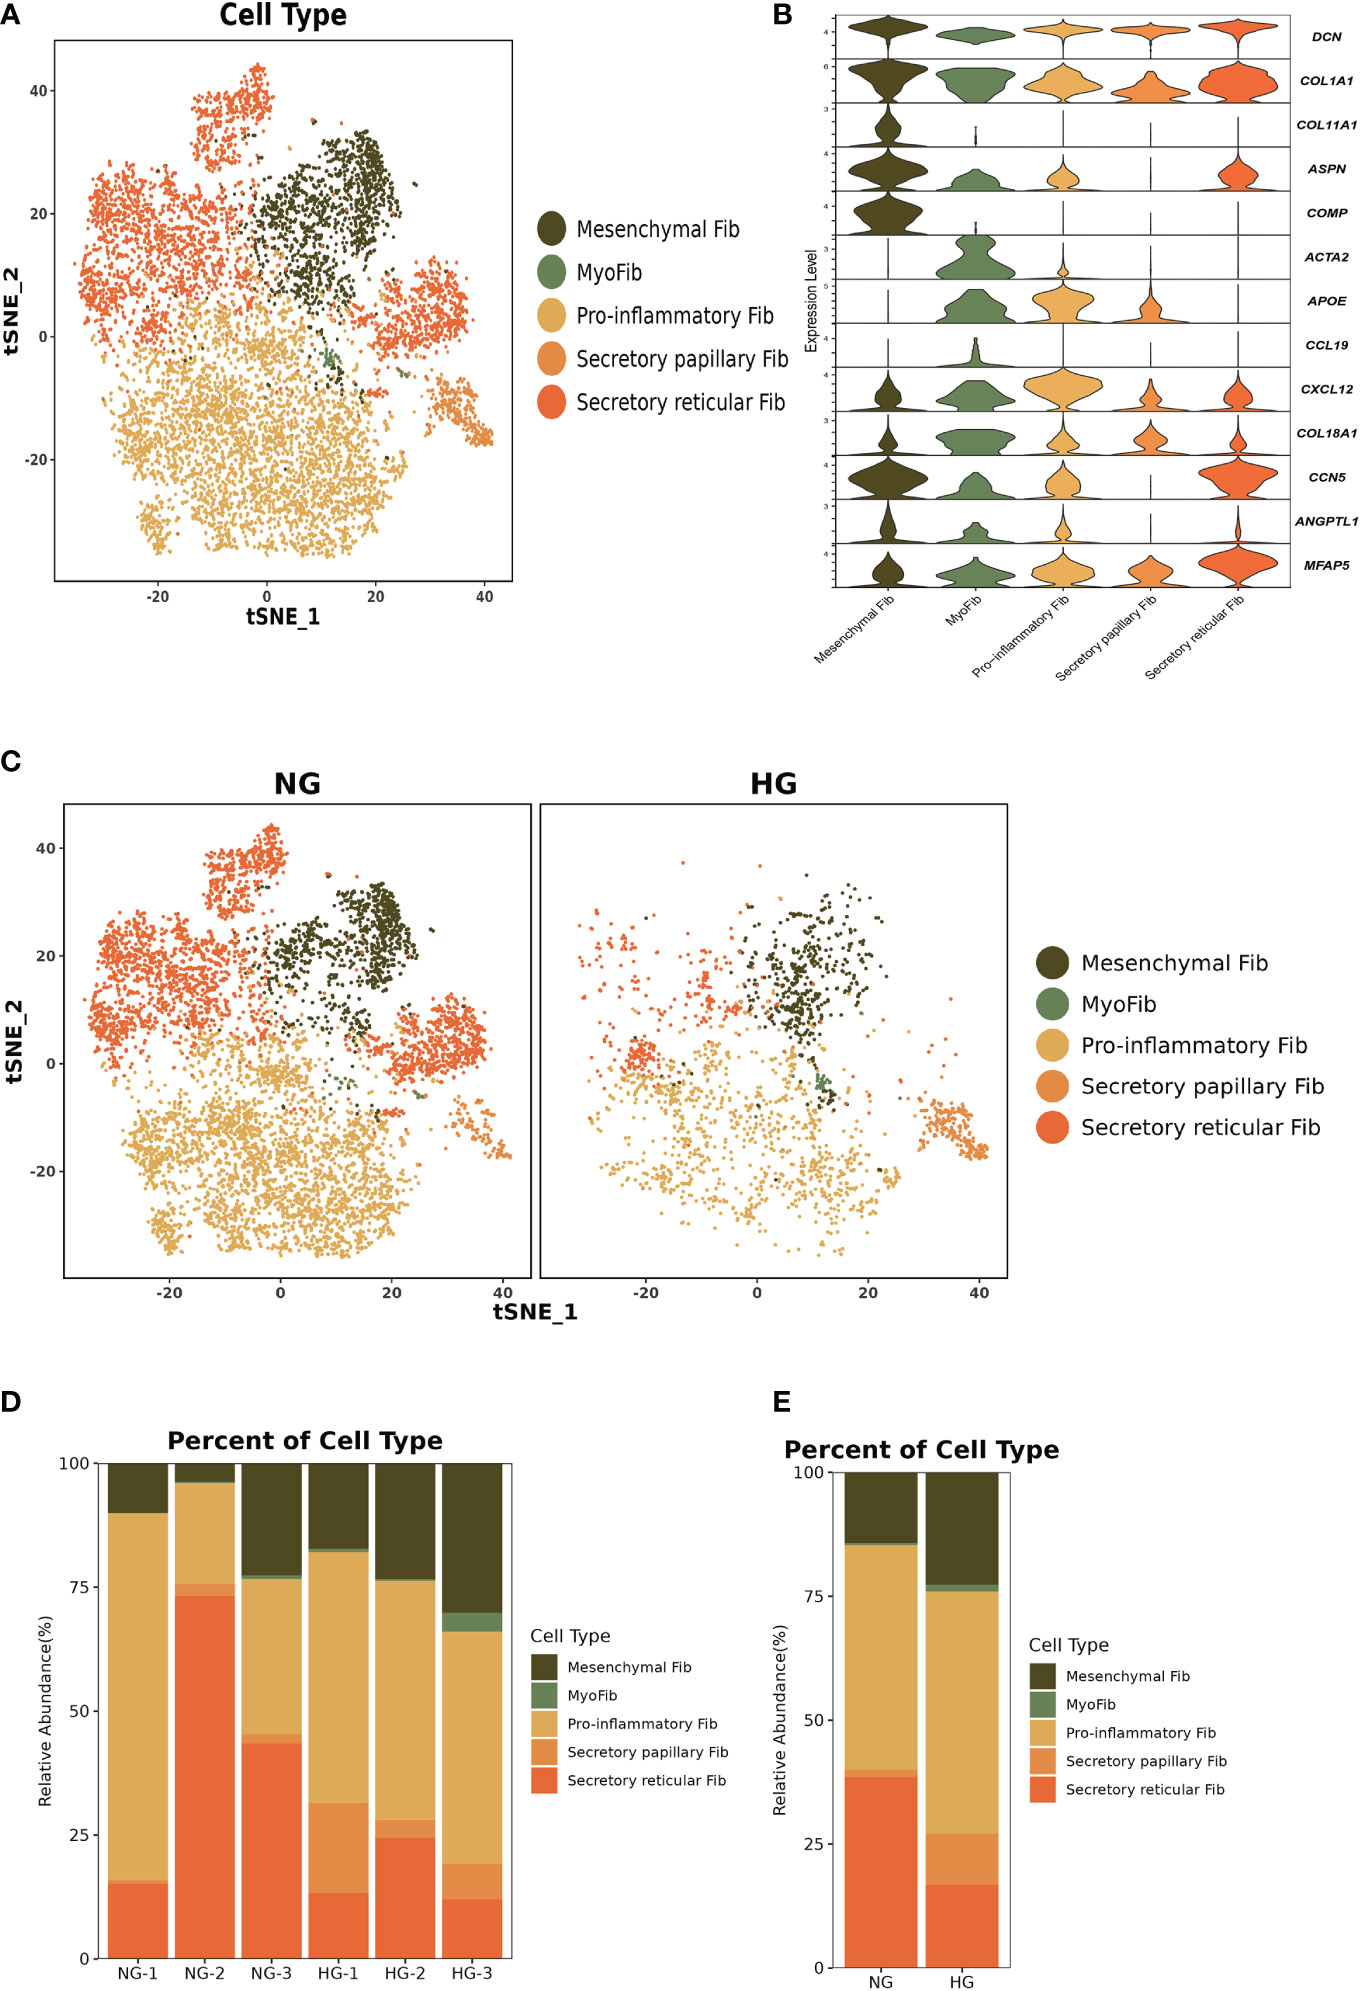
Figure 7 Clustering and classification of the fibroblasts (Fib) subclusters of deep fascia tissue (A) tSNE visualization of fibroblasts subclusters from deep fascia tissue. (B) Violin plots showing marker genes across fibroblasts subclusters. (C) tSNE visualization of fibroblasts subclusters from deep fascia tissue in HG and NG. (D) Bar plots showing the relative percentage of fibroblasts subclusters for each sample. (E) Bar plots showing the relative percentage of fibroblasts subclusters in HG and NG. HG, high stress group; NG, normal stress group.
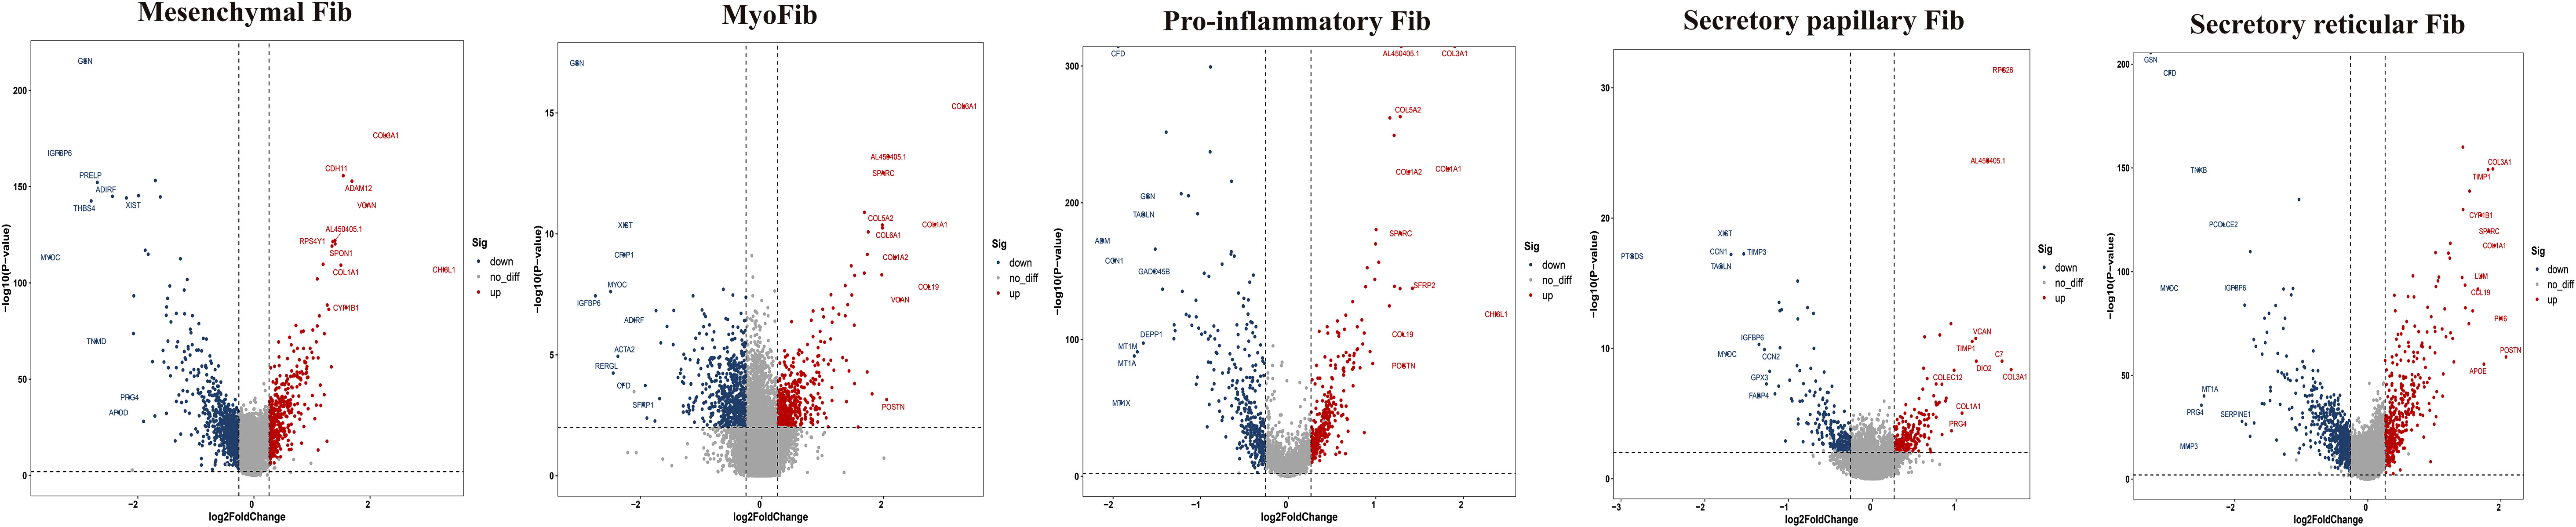
Figure 8 Top 10 differentially expressed genes (DEGs) of fibroblasts (Fib) subclusters in HG and NG. HG, high stress group; NG, normal stress group.
Taken together, these data revealed significant variation in the proportions of five Fib subclusters in the deep fascia under high stress. Additionally, some signaling pathways may be engaged in molecular mechanisms after fascia injury.
We used CellPhoneDB to evaluate the interactions among fibroblast subclusters, myeloid cell subclusters, and T-cell subclusters. We found that each subcluster exhibited interactions with other subsets (Figures 9A–C). Then, a series of immune-related ligand-receptor pairs were applied to investigate the L-R pairs involved in these cell-cell interactions. GZMK+IFN-act CD4 TCM subsets mainly interacted with myeloid cell subsets via TNFRSF10B-TNFSF10 and TNFSF12-TNFRSF25 (Figure 9D), while NKT were more likely to use CCL3-CCR1, CCL3L1-CCR1, and TNFRSF10B-TNFSF10 (Figure 9D). GZMK+IFN-act CD4 TCM and NKT interacted primarily with fibroblast subsets via the TNFRSF10B-TNFSF10 and TNFSF11B-TNFRSF10 pathways (Figure 9E). Notably, myofib interacted with IFN-act Mac2 via TNF-TNFRSF1B, CCL2-CCR2, CCL3-CCR1, CCL5-CCR1, TNFRSF10B-TNFSF10, TNFSF14-TNFRSF14, and TNFSF10-TNFRSF10D, while myofib interacted with SPP1+ Mac0 via TNF-TNFRSF10D. Proinflammatory Fib interacted with IFN-act Mac2 via CCL2-CCR2, TNFRSF10B-TNFSF10, TNFSF14-TNFRSF14, and TNFSF10-TNFRSF10D (Figure 9F).
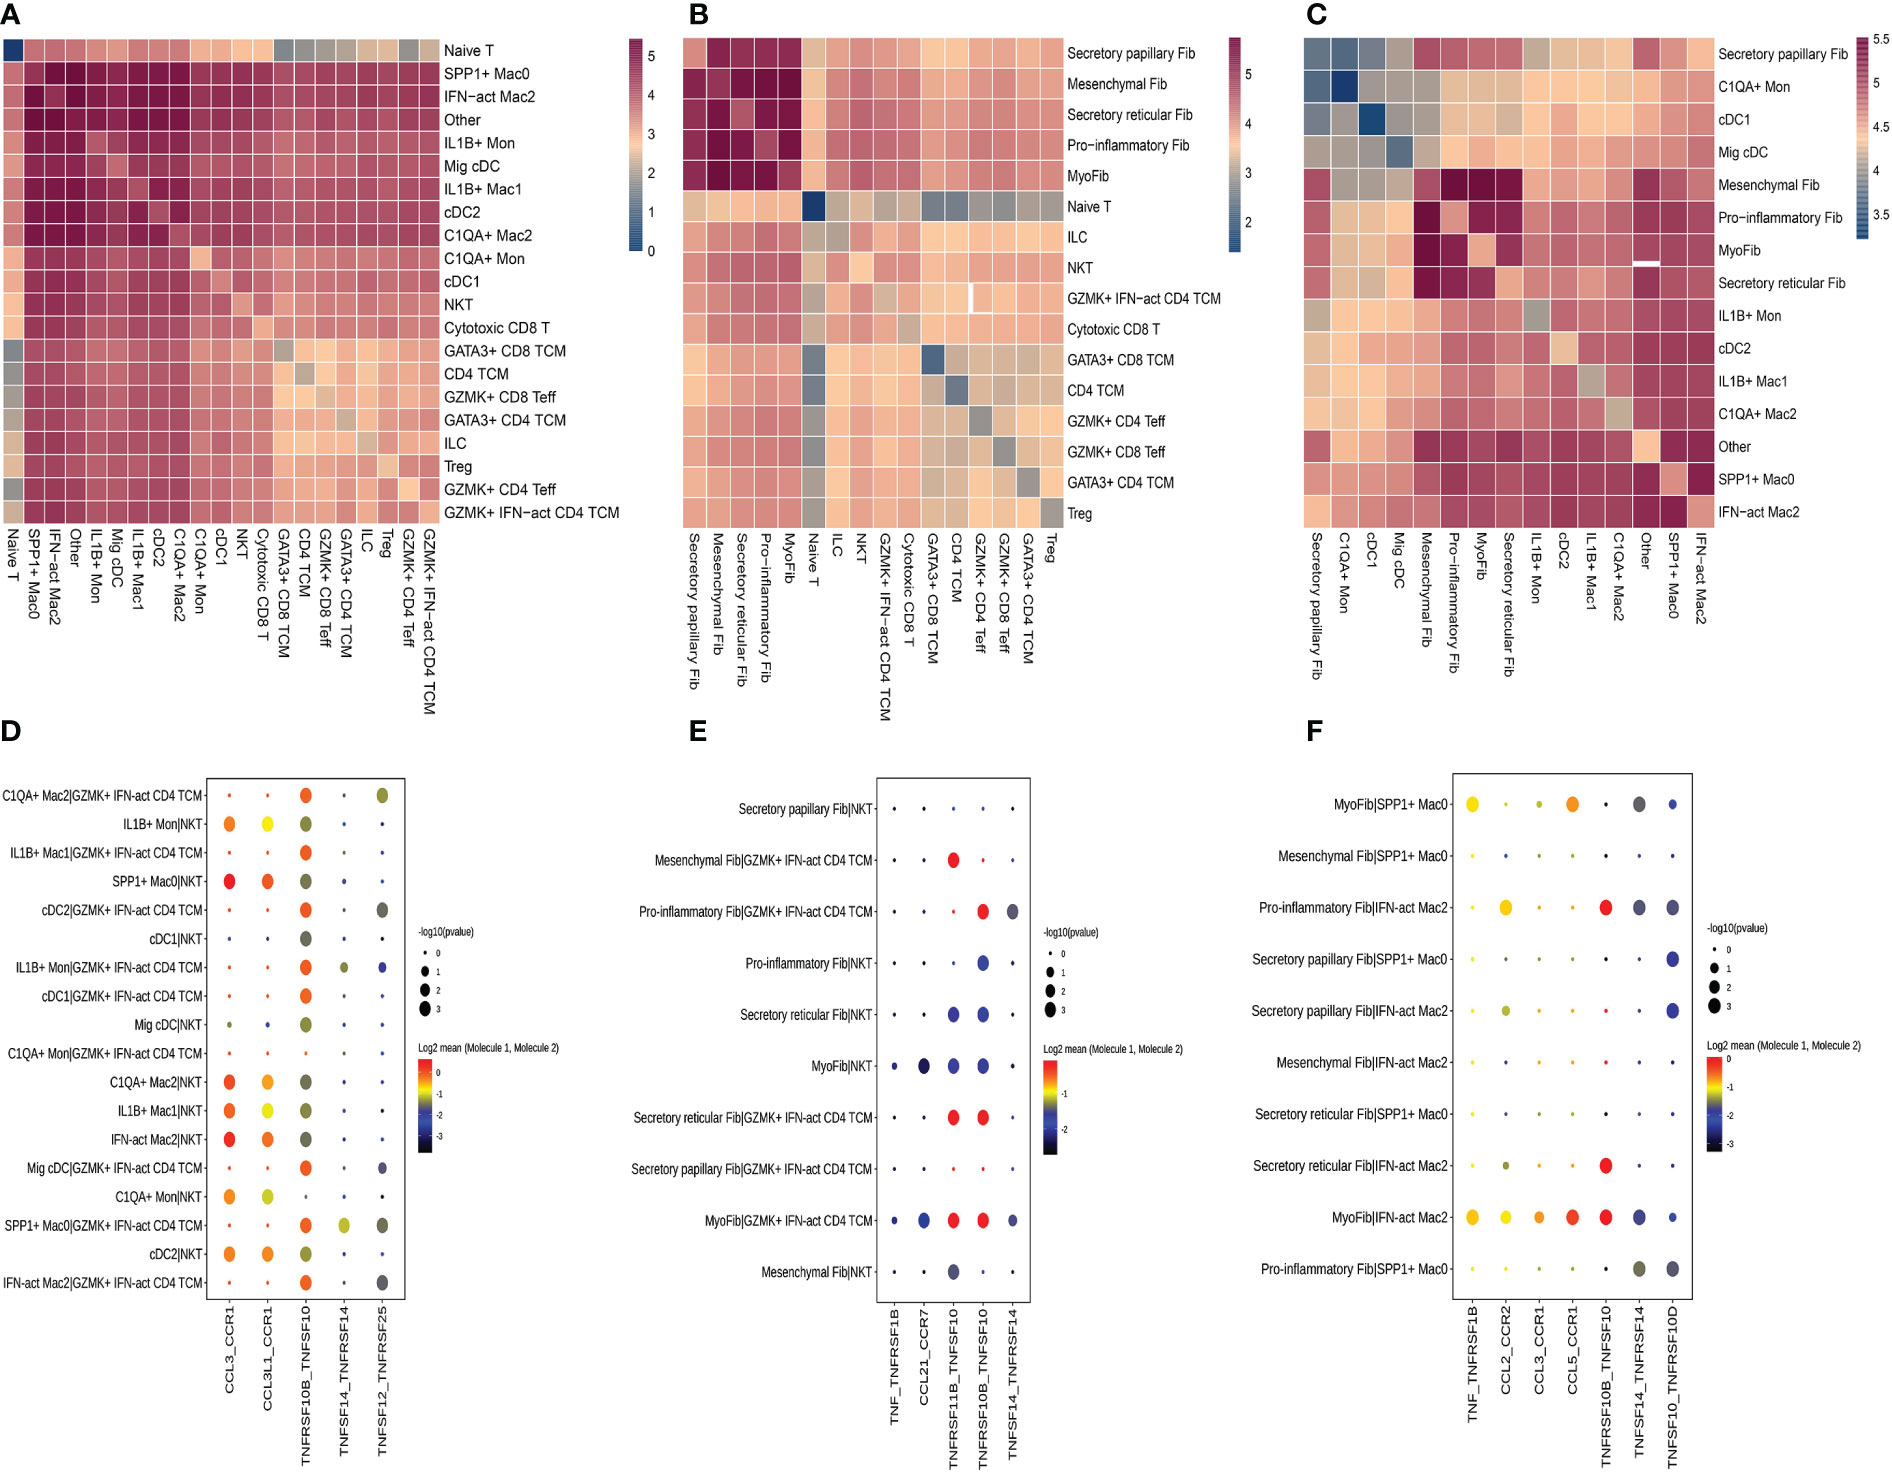
Figure 9 Crosstalk among T cell, fibroblasts and myeloid cell. (A) Heatmap presents the key cellular interaction between T cell and myeloid cell. (B) Heatmap presents the key cellular interaction between T cell and fibroblasts. (C) Heatmap presents the key cellular interaction between fibroblasts and myeloid cell. (D) Dot plot shows the significant ligand-receptor pairs between T cell subsubsets and myeloid cell subsubsets. (E) Dot plot shows the significant ligand-receptor pairs between T cell subsubsets and fibroblasts subsubsets. (F) Dot plot shows the significant ligand-receptor pairs between myeloid cell subsubsets and fibroblasts subsubsets.
ACS, one of the devastating complications after tibiofibular fractures, is caused by high stress in the compartment surrounded by deep fascia (31). ACS may cause some serious complications, such as ischemia of the contained tissues, muscle necrosis, neurologic deficits, or even necrosis (31–34). Given the limitations of surgical treatment, effective new therapies for ACS are urgently required. Traditional evidence considers deep fascia as the fibrous connective tissue surrounding the skeletal muscles (35), yet recent ongoing research has focused on physiological and metabolic homeostasis, as well as healing and repair mechanisms (20–22). Prior research indicated that the stress response can alter the fascia and related tissues (36). To our knowledge, no study has used scRNA-seq to investigate the relationship between the stress response and deep fascia. To further investigate how the stress response affects the immune system of the deep fascia, we first utilized scRNA-seq to explore the cellular heterogeneity and molecular mechanism of the deep fascia in patients with ACS, which can help us better recognize the deep fascia and may provide more effective therapeutic strategies for ACS.
It is well known that the pressure in the compartment grows along with the swelling of muscles after injury. Once the pressure rises to some level, the surrounding tissues reach the hypoxic and ischemic microenvironment, resulting in aseptic inflammation (37–40). Our findings showed that various T cell subclusters infiltration under high stress, and the proportions of CD4 TCM, GATA3+CD4 TCM, GATA3+CD8 TCM, GZMK+IFN-act CD4 TCM, and Treg significantly increased in HG. This constellation of abnormally distributed immune cells suggests that the local response was substantially distinct under high stress. The proportion of Tregs rose from 0.79% in NG to 2.48% in HG, and they highly expressed the level of CD69. As we know, CD69+Tregs play a critical role in the maintenance of immunologic tolerance and suppression of innate immune responses (41). We also found higher proportions of two subclusters (CD4 TCM and CD8 TCM) with high expression of GATA3 that contributed to the maintenance of immune activity (42) under high stress. Moreover, GATA3+CD4 TCM with a high expression of KLF2 that was associated with the production of Treg (43) implied that GATA3+CD4 TCM may be a regulator of Treg.
Furthermore, we found that HSP genes, including HSP110, HSP90, HSP70, HSP60, and HSP10, highly expressed in nine of the eleven T cell subsets, in addition to GZMK+IFN-act CD4 TCM and Naive T cell. HSP genes are known to respond to different stressors such as ischemia and hypoxia (44) and their functions are involved in protection against apoptotic exchanges (45) and suppression of proinflammatory cytokines (46). Recent evidence has demonstrated their protective roles in oxidative stress and ischemia/reperfusion injury of some organs, such as the liver (47), brain (48), spinal cord (49), and heart (50). T cells that react to self-HSPs and act as suppressor cells have subsequently been described, and they are regarded as playing critical roles in maintaining peripheral tolerance or suppressing inflammation in animal models of rheumatoid arthritis, type 1 diabetes mellitus, or atherosclerosis (51–54). Some studies have found that children with HSP60-reactive T cells in their peripheral blood have a better prognosis than those who do not, and that a lack of HSP-responsive Tregs is linked to a variety of autoimmune disorders (55, 56). According to Kim et al. (57), the renoprotective effect of HSP70 may be partially mediated by a direct immunomodulatory action via Tregs. These nine subpopulations of T cells, especially Tregs, may be involved in protecting apoptosis and suppressing proinflammatory cytokines under high stress, which provides a novel insight into the treatment of ACS. In contrast, the MT family, which was found to have a role in the reduction of oxidative damage and apoptosis in animal models and was involved in the binding of a large number of heavy metal ions such as zinc ions, copper ions, or cadmium ions (58, 59), was down-regulated in nine subsets (60–62). We suppose that HSP, MT, or the ratio of HSP to MT may be an important disease biomarker in the diagnosis of ACS, or maybe a potential key factor of ACS that is worthy of study at the protein level.
Another important finding in our study was a rare T cell subpopulation, GZMK+IFN-act CD4 TCM, which was almost exclusively identified in HG. It highly expressed INF-related genes, including ISG15 and IFI6. ISG15 has been reported to rarely express under normal conditions (63, 64), and their potential as biomarkers, drug targets, or immunotherapy choices for some diseases because they are substantially up-regulated in cancer (65), neurodegenerative diseases (66), or inflammatory disease (67). Similar to these findings, upregulation of ISG15 in the present study in HG suggested that it may be a suitable biomarker for detecting pressure variation in the compartment. GATA3, highly expressed in GZMK+IFN-act CD4 TCM, played a crucial role in regulating the homeostatic survival, proliferation, and differentiation of T-cell subsets (68, 69), suggesting that GZMK+IFN-act CD4 TCM may be a key regulator in the development of T cells. GZMK, a pro-inflammatory granzyme family member, was previously thought to be cytotoxic proteases, but recent research found that GZMK could regulate the inflammatory response rather than inducing cell death (70), implying that GZMK+IFN-act CD4 TCM may play an important role in the regulation of the inflammatory response. However, it still needs to be further investigated. Taken together, our findings first identified a specific-disease T cell subcluster with high expression of ISG15, IFI6, GATA3, and GZMK. Additionally, up-regulation of HSP genes and down-regulation of MT genes in T cell subclusters were found in HG. These findings might facilitate the discovery of new preventive strategies for high-pressure-derived diseases of the deep fascia, such as ACS.
The S100 proteins are evolved in multiple cellular processes such as cell apoptosis, proliferation, differentiation, migration, energy metabolism, calcium balance, protein phosphorylation, and inflammation (71, 72), as well as contributing to the development of various diseases, such as autoimmune diseases (73) and chronic inflammatory disorders (74). They have been used as diagnostic markers to aid in differential diagnosis (75) and therapeutic targets in some diseases (76). Down-regulation of S100A8 and S100A9 was shown to inhibit the differentiation of myeloid cells toward DCs and Mac (pro-inflammatory M1 or anti-inflammatory M2) (77). In the current study, the S100 family was down-regulated in two Mon subclusters (C1QA+Mon, IL1B+Mon) and four Mac subpopulations (SPP1+Mac0, IL1B+Mac1, C1QA+Mac2, and IFN-act Mac2). M1 macrophages are related to pro-inflammatory factors and M2 macrophages are linked to anti-inflammatory factors (78). Notably, our findings showed a decreased proportion of M1 cells and an increased proportion of M2 cells under high stress, which was consistent with other evidence of anti-inflammatory effects that decreased the expression of chemokine genes in six subsets of T cells. We also found SPP1+Mac0 with high expression of APOC1 which promoted M2 polarization of macrophages (79), indicating that SPP1+Mac0 was involved in the polarization of macrophages. We infer that the balance of M1 and M2 macrophages may play a crucial role in the development of ACS and even maybe a therapeutic target for ACS. We also found that APOE which was associated with lipid homeostasis and muscle regeneration according to previous studies was up-regulated in four Mac subclusters (80, 81), implying that Mac may play an important role in muscle injury for patients with ACS. Additionally, SPP1 which has been reported to be related to fibrosis in renal cardiac and bone marrow was up-regulated in SPP1+Mac0 and IL1B+Mac1 (82–85), suggesting that these subclusters may have a general role in promoting fibrosis in patients with ACS. Our future study will observe the dynamics of the immune system with pressure alteration within the compartment. The lack of widely accepted animal models limits our investigation of the deep fascia under high stress, so there is an urgent need to establish an animal model to mimic the development of ACS.
Fibroblasts, a major cluster of deep fascia, have different secretory capabilities due to highly heterogeneous and distinct organs (86–89). Fibroblast heterogeneity and function have been well described in multiple fibrotic diseases, such as lung fibrosis, systemic sclerosis, Dupuytren’s disease, and keloid (90–92). However, to our knowledge, a study of scRNA-seq application for exploring fibroblast heterogeneity in deep fascia under high pressure is still absent. Our findings showed dramatically lower proportions of fibroblast subsets in HG, which may be associated with immune cell infiltration. We found proportions of mesenchymal Fib, myoFib, pro-inflammatory Fib, and secretory papillary Fib dramatically increased and a lower proportion of secretory reticular Fib under high stress. Interestingly, we found the proportions of secretory papillary Fib rose 5.88-fold under high stress in the compartment. Five subclusters highly expressed fibrillar collagen genes, such as COL1A1 and COL3A1, which were involved in the synthesis and repair of collagen that mainly contributed to the structural integrity of extracellular matrix, tissues, and organs (93, 94). Traction force generated by myoFib has been reported to greatly contribute to collagen formation and modulates the activities of stromal cells after injury (95, 96), which was consistent with our findings that myoFib in patients with ACS highly expressed COL1A2, COL5A2, POSTN, and SPARC that were associated with fibrosis (97, 98). Additionally, pro-inflammatory Fib and secretory reticular Fib in HG also expressed these genes, implying that these subclusters may be involved in the fibrosis of deep fascia after injury. Five subpopulations were involved in the “extracellular space”, indicating a change in the extracellular space in the deep fascia in response to high stress. Regarding the skin, the papillary Fib subtype contributes to the attachment between the epidermis and the dermis to maintain skin elasticity, while the reticular Fib subtype produces large amounts of collagen and elastin fibers (99). We can infer that the ratio of reticular Fib to papillary Fib was related to elasticity, which may determine the occurrence of ACS.
We concentrated on the higher proportions of subclusters in HG or on these subclusters that interacted more with others due to a large amount of data on cell-cell interactions. GZMK+IFN-act CD4 TCM subsets mainly interacted with myeloid cell subsets or fibroblast subsets via the TNF-TNFRSF axis, while NKT were more likely to use the CCL-CCR axis and the TNF-TNFRSF axis. Regarding the cell-cell interactions between fibroblast subsets and macrophage subclusters, they are mainly mediated by the CCL-CCR axis and the TNF-TNFRSF axis. These results indicated that there were complicated relationships among these distinct cell types and described the cellular crosstalk network that regulates the homeostasis of the deep fascia after injury. Previous studies have reported the role of fibroblasts in immunological functions by influencing the differentiation, movement, and activation of immune cells (16, 100, 101), which is consistent with our findings that fibroblasts closely interact with immune cells via chemokines and cytokines. Given the lack of a widely accepted animal model for ACS, we failed to directly validate our findings in an animal model, including potential functions and interactions between immune cells and fibroblast populations. Meanwhile, we were unable to perform cellular experiments due to a lack of fascia-derived fibroblasts.
There are still some limitations. First, dynamic variations in immune cells and fibroblasts cannot be observed due to the small size of the samples. Second, individual differences may have biased the interpretation of the results. Additionally, the lack of deep fascia from healthy patients may impact the accuracy of results. Third, we failed to sort out subclusters of major cells, such as B cells, cycling cells, endothelial cells or smooth muscle cells according to biomarkers from published studies. In this study, we paid more attention to variations of fibroblasts and immune subclusters in patients with ACS. However, to our knowledge, this is the first study to identify the variations in cellular heterogeneity and the molecular mechanism of the deep fascia in patients with ACS by the scRNA-seq technique.
Our study provides the first landscape of cellular subclusters from the deep fascia in patients with ACS at the single-cell level. We identified variations in immune cells and fibroblast subclusters, as well as their differentially expressed genes. Notably, we identified a GZMK+IFN-act CD4 TCM subtype expressing IFN-related genes in ACS patients. Furthermore, the variations in M1/M2 polarization and the ratio of reticular Fib to papillary Fib may play crucial roles in the development of ACS. Additionally, HSP genes were up-regulated in various T-cell subclusters, and S100 family genes and MT family genes were down-regulated in numerous immune cell subclusters under high stress. Our work provides a solid foundation and offers novel insights for further research on the deep fascia, which helps us recognize the function of the deep fascia and may provide effective treatments for ACS.
The data presented in the study are deposited in the The National Center for Biotechnology Information repository, accession number PRJNA890689.
The study was approved by the Institutional Review Board of the third hospital of Hebei Medical University before data collection and analysis. The patients/participants provided their written informed consent to participate in this study. Written informed consent was obtained from the individual(s) for the publication of any potentially identifiable images or data included in this article.
Conceptualization: TW; data curation: TW and YBL; formal analysis: LJM; Investigation: QD and YRL; methodology: JFG; Project Administration:LJ; Resources: TW and YBL; Software: QD; Supervision: YZZ; Visualization: LQD; Writing-original draft: TW writing-review and editing: ZYH and LW. All authors contributed to the article and approved the submitted version.
The research was supported by the Science and Technology Project of the Hebei Education Department (SLRC2019046); the Government-funded Clinical Medicine Outstanding Talent Training Project (2019); the Natural Science Foundation of Hebei (H2020206193 and H2021206054). The funder had no role in study design, data collection and analysis, decision to publish, or preparation of the manuscript.
We thank Weishuai Zheng and Zhenhao Ye in LC-Bio Technology co.,ltd. for their technical support.
The authors declare that the research was conducted in the absence of any commercial or financial relationships that could be construed as a potential conflict of interest.
All claims expressed in this article are solely those of the authors and do not necessarily represent those of their affiliated organizations, or those of the publisher, the editors and the reviewers. Any product that may be evaluated in this article, or claim that may be made by its manufacturer, is not guaranteed or endorsed by the publisher.
The Supplementary Material for this article can be found online at: https://www.frontiersin.org/articles/10.3389/fimmu.2022.1062479/full#supplementary-material
Supplementary Figure 1 | Gene Ontology (GO) terms of T cell subtypes. (TCM=central memory T cell; Teff=effector T cell; Treg=regulator T cell; ILC=innate lymphoid cells; NKT=nature killer T cell)
Supplementary Figure 2 | Kyoto Encyclopedia of Genes and Genomes (KEGG) pathways of T cell subtypes. (TCM=central memory T cell; Teff=effector T cell; Treg=regulator T cell; ILC=innate lymphoid cells; NKT=nature killer T cell)
Supplementary Figure 3 | Gene Ontology (GO) terms of macrophage (Mac) subtypes.
Supplementary Figure 4 | Kyoto Encyclopedia of Genes and Genomes (KEGG) pathways of macrophage (Mac) subtypes.
Supplementary Figure 5 | Gene Ontology (GO) terms of dendritic cells (DCs) subtypes.
Supplementary Figure 6 | Kyoto Encyclopedia of Genes and Genomes (KEGG) pathways of dendritic cells (DCs) subtypes.
Supplementary Figure 7 | Gene Ontology (GO) terms and Kyoto Encyclopedia of Genes and Genomes (KEGG) pathways of monocyte (Mon) subtypes. (A) GO terms of Mon subtypes. (B) KEGG pathways of Mon subtypes.
Supplementary Figure 8 | Gene Ontology (GO) terms of fibroblast (Fib) subtypes.
Supplementary Figure 9 | Kyoto Encyclopedia of Genes and Genomes (KEGG) pathways of fibroblast (Fib) subtypes.
ACS, acute compartment syndrome; scRNA-seq, single-cell RNA sequencing; HG, high-stress group; NG, normal-stress group; DEGs, differentially expressed genes; GO, Gene Ontology; KEGG, Kyoto Encyclopedia of Genes and Genomes; TCM, central memory T-cell; Teff, effector T-cell; Treg, regulatory T-cell; NKT, nature killer T-cell; ILC, innate lymphoid cell; HSP, heat shock protein; MT,metallothionein; Mac, macrophages; DCs, dendritic cells; Mon, monocytes; Fib, fibroblasts.
1. Larsen P, Elsoe R, Hansen SH, Graven-Nielsen T, Laessoe U, Rasmussen S, et al. Incidence and epidemiology of tibial shaft fractures. Injury (2015) 46(4):746–50. doi: 10.1016/j.injury.2014.12.027
2. McQueen MM, Gaston P, Court-Brown CM. Acute compartment syndrome: who is at risk? J Bone Joint Surg Br (2000) 82(2):200–3. doi: 10.1302/0301-620X.82B2.0820200
3. McMillan TE, Gardner WT, Schmidt AH, Johnstone AJ. Diagnosing acute compartment syndrome-where have we got to? Int Orthop (2019) 43(11):2429–35. doi: 10.1007/s00264-019-04386-y
4. Schmidt AH. Acute compartment syndrome. Injury (2017) 48(1):S22–5. doi: 10.1016/j.injury.2017.04.024
5. Lawendy AR, Bihari A, Sanders DW, Badhwar A, Cepinskas G. Compartment syndrome causes systemic inflammation in a rat. Bone Joint J (2016) 98-B(8):1132–7. doi: 10.1302/0301-620X.98B8.36325
6. Jiang X, Yang J, Liu F, Tao J, Xu J, Zhang M. Embryonic stem cell-derived mesenchymal stem cells alleviate skeletal muscle injury induced by acute compartment syndrome. Stem Cell Res Ther (2022) 13(1):313. doi: 10.1186/s13287-022-03000-0
7. Guo J, Yin Y, Jin L, Zhang R, Hou Z, Zhang Y. Acute compartment syndrome: Cause, diagnosis, and new viewpoint. Med (Baltimore). (2019) 98(27):e16260. doi: 10.1097/MD.0000000000016260
8. Hou ZY, Wang XG, Yin YC, Zhang RP, Wang L, Feng C, et al. Myofascial self-release law. Chin J Trauma. (2019) 35:83–6. doi: 10.3760/cma.j.issn.1001-8050.2019.01.015
9. Guo J, Gao Z, Wang L, Feng C, Hou Z, Zhang Y. The blister occurring in severe tibial plateau fractures (Schatzker V-VI) decreases the risk of acute compartment syndrome. Int Orthop (2021) 45(3):743–9. doi: 10.1007/s00264-020-04925-y
10. Adstrum S, Hedley G, Schleip R, Stecco C, Yucesoy CA. Defining the fascial system. J Bodyw Mov Ther (2017) 21(1):173–7. doi: 10.1016/j.jbmt.2016.11.003
11. Willard FH, Vleeming A, Schuenke MD, Danneels L, Schleip R. The thoracolumbar fascia: anatomy, function and clinical considerations. J Anat. (2012) 221(6):507–36. doi: 10.1111/j.1469-7580.2012.01511.x
12. Stecco C, Schleip R. A fascia and the fascial system. J Bodyw Mov Ther (2016) 20:139–40. doi: 10.1016/j.jbmt.2015.11.012
13. Kumka M, Bonar J. Fascia: a morphological description and classifification system based on a literature review. J Can Chiropr Assoc (2012) 56(3):179–91.
14. Stecco C, Pirri C, Fede C, Yucesoy CA, De Caro R, Stecco A. Fascial or muscle stretching? a narrative review. Appl Sci (2021) 11:307. doi: 10.3390/app11010307
15. Shockett S, Findley T. Findings from the frontiers of fascia research: Insights into ‘inner space’ and implications for health. J Bodyw Mov Ther (2019) 23(1):101–7. doi: 10.1016/j.jbmt.2018.12.001
16. Correa-Gallegos D, Jiang D, Rinkevich Y. Fibroblasts as confederates of the immune system. Immunol Rev (2021) 302(1):147–62. doi: 10.1111/imr.12972
17. Nguyen AV, Soulika AM. The dynamics of the skin’s immune system. Int J Mol Sci (2019) 20(8):1811. doi: 10.3390/ijms20081811
18. Jiang D, Christ S, Correa-Gallegos D, Ramesh P, Kalgudde Gopal S, Wannemacher J, et al. Injury triggers fascia fibroblast collective cell migration to drive scar formation through n-cadherin. Nat Commun (2020) 11(1):5653. doi: 10.1038/s41467-020-19425-1
19. Ghetti M, Topouzi H, Theocharidis G, Papa V, Williams G, Bondioli E, et al. Subpopulations of dermal skin fibroblasts secrete distinct extracellular matrix: implications for using skin substitutes in the clinic. Br J Dermatol (2018) 179(2):381–93. doi: 10.1111/bjd.16255
20. Fede C, Pirri C, Fan C, Petrelli L, Guidolin D, De Caro R. A closer look at the cellular and molecular components of the deep/muscular fasciae. Int J Mol Sci (2021) 22(3):1411. doi: 10.3390/ijms22031411
21. Hoheisel U, Rosner J, Mense S. Innervation changes induced by inflammation of the rat thoracolumbar fascia. Neuroscience (2015) 300:351–9. doi: 10.1016/j.neuroscience.2015.05.034
22. Schleip R, Gabbiani G, Wilke J, Naylor I, Hinz B, Zorn A. Fascia is able to actively contract and may thereby influence musculoskeletal dynamics: A histochemical and mechanographic investigation. Front Physiol (2019) 10:336. doi: 10.3389/fphys.2019.00336
23. Iwanaga T, Shikichi M, Kitamura H, Yanase H, Nozawa-Inoue K. Morphology and functional roles of synoviocytes in the joint. Arch Histol. Cytol. (2000) 63:17–31. doi: 10.1679/aohc.63.17
24. Schleip R, Klingler W, Lehmann-Horn F. Active fascial contractility: Fascia may be able to contract in a smooth muscle-like manner and thereby influence musculoskeletal dynamics. Med Hypotheses (2005) 65(2):273–7. doi: 10.1016/j.mehy.2005.03.005
25. Follonier L, Schaub S, Meister JJ, Hinz B. Myofifibroblast communication is controlled by intercellular mechanical coupling. J Cell Sci (2008) 121:3305–16. doi: 10.1242/jcs.024521
26. Wu X, Liu Y, Jin S, Wang M, Jiao Y, Yang B. Single-cell sequencing of immune cells from anticitrullinated peptide antibody positive and negative rheumatoid arthritis. Nat Commun (2021) 12(1):4977. doi: 10.1038/s41467-021-25246-7
27. Zininga T, Ramatsui L, Shonhai A. Heat shock proteins as immunomodulants. Molecules (2018) 23(11):2846. doi: 10.3390/molecules23112846
29. Zhang F, Wei K, Slowikowski K, Fonseka CY, Rao DA, Kelly S. Defining inflammatory cell states in rheumatoid arthritis joint synovial tissues by integrating single-cell transcriptomics and mass cytometry. Nat Immunol (2019) 20(7):928–42. doi: 10.1038/s41590-019-0378-1
30. Deng CC, Hu YF, Zhu DH, Cheng Q, Gu JJ, Feng QL. Single-cell RNA-seq reveals fibroblast heterogeneity and increased mesenchymal fibroblasts in human fibrotic skin diseases. Nat Commun (2021) 12(1):3709. doi: 10.1038/s41467-021-24110-y
31. Mithofer K, Lhowe DW, Vrahas MS, Altman DT, Altman GT. Clinical spectrum of acute compartment syndrome of the thigh and its relation to associated injuries. Clin Orthop Relat Res (2004) 425:223–9. doi: 10.1097/00003086-200408000-00032
32. McQueen MM. Acute compartment syndrome. In: Bucholz RW, CourtBrown CM, Heckman JD, editors. Rockwood and green’s fractures in adults. Philadelphia, PA: Lippincott Williams & Wilkins (2010). p. 689–708.
33. Kalyani BS, Fisher BE, Roberts CS, Giannoudis PV. Compartment syndrome of the forearm: a systematic review. J Handb Surg Am (2011) 36:535–43. doi: 10.1016/j.jhsa.2010.12.007
34. Hines EM, Dowling S, Hegerty F, Pelecanos A, Tetsworth K. Bacterial infection of fasciotomy wounds following decompression for acute compartment syndrome. Injury (2021) 52(10):2914–9. doi: 10.1016/j.injury.2021.06.018
35. van der Wal J. The architecture of the connective tissue in the musculoskeletal system-an often overlooked functional parameter as to proprioception in the locomotor apparatus. Int J Ther Massage Bodywork (2009) 2:9–23. doi: 10.3822/ijtmb.v2i4.62
36. Melzack R. Pain and the neuromatrix in the brain. J Dent Educ (2001) 65:1378–82. doi: 10.1002/j.0022-0337.2001.65.12.tb03497.x
37. Labbe R, Lindsay T, Walker PM. The extent and distribution of skeletal muscle necrosis after graded periods of complete ischemia. J Vasc Surg (1987) 6:152–7. doi: 10.1067/mva.1987.avs0060152
38. Petrasek PF, Homer-Vanniasinkam S, Walker PM. Determinants of ischemic injury to skeletal muscle. J Vasc Surg (1994) 19:623–31. doi: 10.1016/S0741-5214(94)70035-4
39. Sheridan GW, Matsen FA III, Krugmire RB Jr. Further investigations on the pathophysiology of the compartmental syndrome. Clin Orthop Relat Res (1977) 123:266–70. doi: 10.1097/00003086-197703000-00070
40. Matsen FA 3rd, King RV, Krugmire Jr Mowery RB CA, Roche T. Physiological effects of increased tissue pressure. Int Orthop (1979) 3:237–44. doi: 10.1007/BF00265718
41. Mendoza-Pérez A, Vitales-Noyola M, González-Baranda L, Álvarez-Quiroga C, Hernández-Castro B, Monsiváis-Urenda A. Increased levels of pathogenic Th17 cells and diminished function of CD69+ treg lymphocytes in patients with overweight. Clin Exp Immunol (2022) 209(1):115–25. doi: 10.1093/cei/uxac051
42. Hawkshaw NJ, Pilkington SM, Murphy SA, Al-Gazaq N, Farrar MD, Watson RE. UV Radiation recruits CD4+GATA3+ and CD8+GATA3+ T cells while altering the lipid microenvironment following inflammatory resolution in human skin. vivo. Clin Transl Immunol (2020) 9(4):e01104. doi: 10.1002/cti2.1104
43. Pabbisetty SK, Rabacal W, Maseda D, Cendron D, Collins PL, Hoek KL, et al. KLF2 is a rate-limiting transcription factor that can be targeted to enhance regulatory T-cell production. Proc Natl Acad Sci USA (2014) 111(26):9579–84. doi: 10.1073/pnas.1323493111
44. Verghese J, Abrams J, Wang Y, Morano KA. Biology of the heat shock response and protein chaperones: budding yeast (Saccharomyces cerevisiae) as a model system. Microbiol Mol Biol Rev (2012) 76(2):115–58. doi: 10.1128/MMBR.05018-11
45. Hightower LE. Heat shock, stress proteins, chaperones, and proteotoxicity. Cell (1991) 66(2):191–7. doi: 10.1016/0092-8674(91)90611-2
46. Beere HM. The stress of dying: the role of heat shock proteins in the regulation of apoptosis. J Cell Science. (2004) 117(13):2641–51. doi: 10.1242/jcs.01284
47. Liu Y, Yu M, Cui J, Du Y, Teng X, Zhang Z. Heat shock proteins took part in oxidative stress-mediated inflammatory injury via NF-κB pathway in excess manganese-treated chicken livers. Ecotoxicol Environ Saf. (2021) 226:112833. doi: 10.1016/j.ecoenv.2021.112833
48. Kim JY, Yenari MA. The immune modulating properties of the heat shock proteins after brain injury. Anat Cell Biol (2013) 46(1):1–7. doi: 10.5115/acb.2013.46.1.1
49. Nasouti R, Khaksari M, Mirzaee M, Nazari-Robati M. Trehalose protects against spinal cord injury through regulating heat shock proteins 27 and 70 and caspase-3 genes expression. J Basic Clin Physiol Pharmacol (2019) 31(1):20180225. doi: 10.1515/jbcpp-2018-0225
50. Martin JL, Mestril R, Hilal-Dandan R, Brunton LL, Dillmann WH. Small heat shock proteins and protection against ischemic injury in cardiac myocytes. Circulation (1997) 96:4343–8. doi: 10.1161/01.CIR.96.12.4343
51. Nishikawa H, Kato T, Tawara I, Saito K, Ikeda H, Kuribayashi K, et al. Definition of target antigens for naturally occurring CD4(þ) CD25(þ) regulatory T cells. J Exp Med (2005) 201:681–6. doi: 10.1084/jem.20041959
52. Hauet-Broere F, Wieten L, Guichelaar T, Berlo S, van der Zee R, Van Eden W, et al. Heat shock proteins induce T cell regulation of chronic inflammation. Ann Rheum Dis (2006) 65(3):65–8. doi: 10.1136/ard.2006.058495
53. Tanaka S, Kimura Y, Mitani A, Yamamoto G, Nishimura H, Spallek R, et al. Activation of T cells recognizing an epitope of heat-shock protein 70 can protect against rat adjuvant arthritis. J Immunol (1999) 163:5560–5. doi: 10.4049/jimmunol.163.10.5560
54. Fischer B, Elias D, Bretzel RG, Linn T. Immunomodulation with heat shock protein DiaPep277 to preserve beta cell function in type 1 diabetes - an update. Expert Opin Biol Ther (2010) 10:265–72. doi: 10.1517/14712590903555176
55. Kamphuis S, Kuis W, de Jager W, Teklenburg G, Massa M, Gordon G, et al. Tolerogenic immune responses to novel T-cell epitopes from heat-shock protein 60 in juvenile idiopathic arthritis. Lancet (2005) 366:50–6. doi: 10.1016/S0140-6736(05)66827-4
56. Prakken BJ, Roord S, Ronaghy A, Wauben M, Albani S, van Eden W, et al. Heat shock protein 60 and adjuvant arthritis: a model for T cell regulation in human arthritis. Springer Semin Immunopathol (2003) 25:47–63. doi: 10.1007/s00281-003-0128-7
57. Kim MG, Jung Cho E, Won Lee J, Sook Ko Y, Young Lee H, Jo SK, et al. The heat-shock protein-70-induced renoprotective effect is partially mediated by CD4+CD25+Foxp3+regulatory T cells in ischemia/reperfusion-induced acute kidney injury. Kidney Int (2014) 85(1):62–71. doi: 10.1038/ki.2013.277
58. Lynes MA, Hidalgo J, Manso Y, Devisscher L, Laukens D, Lawrence DA, et al. Metallothionein and stress combine to affect multiple organ systems. Cell Stress Chaperones. (2014) 19(5):605–11. doi: 10.1007/s12192-014-0501-z
59. Takahashi. Positive S. And negative regulators of the metallothionein gene. Mol Med Rep (2015) 12(1):795–9. doi: 10.3892/mmr.2015.3459
60. Tang W, Chai W, Du D, Xia Y, Wu Y, Jiang L, et al. The lncRNA-AK046375 upregulates metallothionein-2 by sequestering miR-491-5p to relieve the brain oxidative stress burden after traumatic brain injury. Oxid Med Cell Longev (2022) 2022:8188404. doi: 10.1155/2022/8188404
61. Rios C, Santander I, Méndez-Armenta M, Nava-Ruiz C, Orozco-Suárez S, Islas M, et al. Metallothionein-I + II reduces oxidative damage and apoptosis after traumatic spinal cord injury in rats. Oxid Med Cell Longev (2018) 2018:3265918. doi: 10.1155/2018/3265918
62. Su W, Feng M, Liu Y, Cao R, Liu Y, Tang J, et al. ZnT8 deficiency protects from APAP-induced acute liver injury by reducing oxidative stress through upregulating hepatic zinc and metallothioneins. Front Pharmacol (2021) 12:721471. doi: 10.3389/fphar.2021.721471
63. Mirzalieva O, Juncker M, Schwartzenburg J, Desai S. ISG15 and ISGylation in human diseases. Cells (2022) 11(3):538. doi: 10.3390/cells11030538
64. Zheng Z, Wang L, Pan J. Interferon-stimulated gene 20-kDa protein (ISG20) in infection and disease: Review and outlook. Intractable Rare Dis Res (2017) 6(1):35–40. doi: 10.5582/irdr.2017.01004
65. Desai SD, Haas AL, Wood LM, Tsai YC, Pestka S, Rubin EH. Elevated expression of ISG15 in tumor cells interferes with the ubiquitin/26S proteasome pathway. Cancer Res (2006) 66:921–8. doi: 10.1158/0008-5472.CAN-05-1123
66. Wood LM, Sankar S, Reed RE, Haas AL, Liu LF, McKinnon P, et al. A novel role for ATM in regulating proteasome-mediated protein degradation through suppression of the ISG15 conjugation pathway. PloS One (2011) 6:e16422. doi: 10.1371/journal.pone.0016422
67. Zhao Y, Wang L, Pan J. The development of research about microRNAs in rheumatoid arthritis. Chin Bull Life Sci (2015), 1140–5.
68. Yagi R, Zhong C, Northrup DL, Yu F, Bouladoux N, Spencer S, et al. The transcription factor GATA3 is critical for the development of all IL-7Ralphaexpressing innate lymphoid cells. Immunity (2014) 40:378–88. doi: 10.1016/j.immuni.2014.01.012
69. Ting CN, Olson MC, Barton KP, Leiden JM. Transcription factor GATA-3 is required for development of the T-cell lineage. Nature (1996) 384:474–8. doi: 10.1038/384474a0
70. Garzón-Tituaña M, Arias MA, Sierra-Monzón JL, Morte-Romea E, Santiago L, Ramirez-Labrada A, et al. The multifaceted function of granzymes in sepsis: Some facts and a lot to discover. Front Immunol (2020) 11:1054. doi: 10.3389/fimmu.2020.01054
71. Donato R, Cannon BR, Sorci G, Riuzzi F, Hsu K, Weber DJ, et al. Functions of S100 proteins. Curr Mol Med (2013) 13:24–57. doi: 10.2174/156652413804486214
72. Gross SR, Sin CG, Barraclough R, Rudland PS. Joining S100 proteins and migration: for better or for worse, in sickness and in health. Cell Mol Life Sci (2014) 71:1551–79. doi: 10.1007/s00018-013-1400-7
73. Abildtrup M, Kingsley GH, Scott DL. Calprotectin as a biomarker for rheumatoid arthritis: a systematic review. J Rheumatol (2015) 42:760–70. doi: 10.3899/jrheum.140628
74. Dmytriyeva O, Pankratova S, Owczarek S, Sonn K, Soroka V, Ridley CM. The metastasis-promoting S100A4 protein confers neuroprotection in brain injury. Nat Commun (2012) 3:1197. doi: 10.1038/ncomms2202
75. Dapunt U, Giese T, Maurer S, Stegmaier S, Prior B, Hänsch GM. Neutrophil-derived MRP-14 is up-regulated in infectious osteomyelitis and stimulates osteoclast generation. J Leukoc Biol (2015) 98:575–82. doi: 10.1189/jlb.3VMA1014-482R
76. Ritterhoff J, Most P. Targeting S100A1 in heart failure. Gene Ther (2012) 19:613–21. doi: 10.1038/gt.2012.8
77. Cheng P, Corzo CA, Luetteke N, Yu B, Nagaraj S, Bui MM, et al. Inhibition of dendritic cell differentiation and accumulation of myeloid-derived suppressor cells in cancer is regulated by S100A9 protein. J Exp Med (2008) 205:2235–49. doi: 10.1084/jem.20080132
78. Nahrendorf M, Swirski FK. Abandoning M1/M2 for a network model of macrophage function. Circ Res (2016) 119(3):414–7. doi: 10.1161/CIRCRESAHA.116.309194
79. Ren L, Yi J, Yang Y, Li W, Zheng X, Liu J. Systematic pan-cancer analysis identifies APOC1 as an immunological biomarker which regulates macrophage polarization and promotes tumor metastasis. Pharmacol Res (2022) 183:106376. doi: 10.1016/j.phrs.2022.106376
80. Arnold L, Perrin H, de Chanville CB, Saclier M, Hermand P, Poupel L. CX3CR1 deficiency promotes muscle repair and regeneration by enhancing macrophage ApoE production. Nat Commun (2015) 6:8972. doi: 10.1038/ncomms9972
81. Huebbe P, Rimbach G. Evolution of human apolipoprotein e (APOE) isoforms: Gene structure, protein function and interaction with dietary factors. Ageing Res Rev (2017) 37:146–61. doi: 10.1016/j.arr.2017.06.002
82. Collins AR, Schnee J, Wang W, Kim S, Fishbein MC, Bruemmer D, et al. Osteopontin modulates angiotensin II-induced fibrosis in the intact murine heart. J Am Coll Cardiol (2004) 43(9):1698–705. doi: 10.1016/j.jacc.2003.11.058
83. Merszei J, Wu J, Torres L, Hicks JM, Bartkowiak T, Tan F, et al. Osteopontin overproduction is associated with progression of glomerular fibrosis in a rat model of antiglomerular basement membrane glomerulonephritis. Am J nephrol (2010) 32(3):262–71. doi: 10.1159/000319238
84. Ruberti S. Involvement of MAF/SPP1 axis in the development of bone marrow fibrosis in PMF patients. Leukemia (2018) 32(2):438–49. doi: 10.1038/leu.2017.220
85. Zahradka P. Novel role for osteopontin in cardiac fibrosis. Circ Res (2008) 102(3):270–2. doi: 10.1161/CIRCRESAHA.107.170555
86. Tracy LE, Minasian RA, Caterson. Extracellular Matrix EJ. And dermal fibroblast function in the healing wound. Adv Wound Care (2016) 5:119–36. doi: 10.1089/wound.2014.0561
87. Camelliti P, Borg T, Kohl. P. Structural and functional characterisation of cardiac fibroblasts. Cardiovasc Res (2005) 65:40–51. doi: 10.1016/j.cardiores.2004.08.020
88. Souders CA, Bowers SLK, Baudino. TA. Cardiac fibroblast: The renaissance cell. Circ Res (2009) 105:1164–1176. doi: 10.1161/CIRCRESAHA.109.209809
89. Travers JG, Kamal FA, Robbins J, Yutzey KE, Blaxall BC. Blaxall: Cardiac fibrosis: The fibroblast awakens. Circ Res (2016) 118:1021–40. doi: 10.1161/CIRCRESAHA.115.306565
90. Layton TB, Williams L, McCann F, Zhang M, Fritzsche M, Colin-York H. Cellular census of human fibrosis defines functionally distinct stromal cell types and states. Nat Commun (2020) 11:2768. doi: 10.1038/s41467-020-16264-y
91. Valenzi E, Bulik M, Tabib T, Morse C, Sembrat J, Trejo Bittar H. Single-cell analysis reveals fibroblast heterogeneity and myofibroblasts in systemic sclerosis-associated interstitial lung disease. Ann Rheumatol Dis (2019) 78:1379–87. doi: 10.1136/annrheumdis-2018-214865
92. Adams TS, Schupp JC, Poli S, Ayaub EA, Neumark N, Ahangari F. Single-cell RNA-seq reveals ectopic and aberrant lungresident cell populations in idiopathic pulmonary fibrosis. Sci Adv (2020) 6:eaba1983. doi: 10.1126/sciadv.aba1983
93. Gelse K, Poschl E, Aigner T. Collagens: structure, function, and biosynthesis. Adv Drug Delivery Rev (2003) 55:1531–46. doi: 10.1016/j.addr.2003.08.002
94. Peterszegi G, Andrès E, Molinari J, Ravelojaona V, Robert L. Effect of cellular aging on collagen biosynthesis: I. methodological considerations and pharmacological applications. Arch Gerontol Geriatr. (2008) 47:356–67. doi: 10.1016/j.archger.2007.08.019
95. Xie T, Wang Y, Deng N, Huang G, Taghavifar F, Geng Y. Single-cell deconvolution of fibroblast heterogeneity in mouse pulmonary fibrosis. Cell Rep (2018) 22:3625–40. doi: 10.1016/j.celrep.2018.03.010
96. Nanchahal J, Hinz B. Strategies to overcome the hurdles to treat fibrosis, a major unmet clinical need. Proc Natl Acad Sci (2016) 113:7291–3. doi: 10.1073/pnas.1607896113
97. Zhang Z, Nie F, Kang C, Chen B, Qin Z, Ma J. Increased periostin expression affects the proliferation, collagen synthesis, migration and invasion of keloid fifibroblasts under hypoxic conditions. Int J Mol Med (2014) 34:253–61. doi: 10.3892/ijmm.2014.1760
98. Naitoh M, Kubota H, Ikeda M, Tanaka T, Shirane H, Suzuki S. Gene expression in human keloids is altered from dermal to chondrocytic and osteogenic lineage. Genes Cells (2005) 10:1081–91. doi: 10.1111/j.1365-2443.2005.00902.x
99. Tan PC, Zhou SB, Ou MY, He JZ, Zhang PQ, Zhang XJ. Mechanical stretching can modify the papillary dermis pattern and papillary fibroblast characteristics during skin regeneration. J Invest Dermatol (2022) 142(9):2384–2394.e8. doi: 10.1016/j.jid.2021.11.043
100. Bednarczyk M, Stege H, Grabbe S, Bros M. β2 integrins-multifunctional leukocyte receptors in health and disease. Int J Mol Sci (2020) 21(4):1402. doi: 10.3390/ijms21041402
Keywords: acute compartment syndrome, single cell RNA seq, immune cell, fibroblast, heat shock protein
Citation: Wang T, Long Y, Ma L, Dong Q, Li Y, Guo J, Jin L, Di L, Zhang Y, Wang L and Hou Z (2023) Single-cell RNA-seq reveals cellular heterogeneity from deep fascia in patients with acute compartment syndrome. Front. Immunol. 13:1062479. doi: 10.3389/fimmu.2022.1062479
Received: 06 October 2022; Accepted: 28 December 2022;
Published: 18 January 2023.
Edited by:
Frank Alexander Schildberg, University Hospital Bonn, GermanyReviewed by:
Jianping Liu, Karolinska Institutet (KI), SwedenCopyright © 2023 Wang, Long, Ma, Dong, Li, Guo, Jin, Di, Zhang, Wang and Hou. This is an open-access article distributed under the terms of the Creative Commons Attribution License (CC BY). The use, distribution or reproduction in other forums is permitted, provided the original author(s) and the copyright owner(s) are credited and that the original publication in this journal is cited, in accordance with accepted academic practice. No use, distribution or reproduction is permitted which does not comply with these terms.
*Correspondence: Zhiyong Hou, ZHJ6eWhvdUBnbWFpbC5jb20=; Ling Wang, d2FuZ2xpbmcyMDE2dXdAMTI2LmNvbQ==
†These authors have contributed equally to this work
Disclaimer: All claims expressed in this article are solely those of the authors and do not necessarily represent those of their affiliated organizations, or those of the publisher, the editors and the reviewers. Any product that may be evaluated in this article or claim that may be made by its manufacturer is not guaranteed or endorsed by the publisher.
Research integrity at Frontiers
Learn more about the work of our research integrity team to safeguard the quality of each article we publish.