- 1Department of Pathology and Forensic Medicine, College of Basic Medical Sciences, Dalian Medical University, Dalian, Liaoning, China
- 2Department of Pathology, First Affiliated Hospital, Dalian, China
Background: TMEM59L is a newly discovered transmembrane protein; its functions in cancer remain unknown. This study was designed to reveal the prognostic value and the functional role of TMEM59L in cancer.
Methods: The gene expression profiles, methylation data, and corresponding clinical data of TMEM59L were retrieved from The Cancer Genome Atlas (TCGA) and the Genotype-Tissue Expression database. Survival analysis was employed to calculate the pan-cancer prognostic value of TMEM59L. The correlation between TMEM59L expression and tumor immune microenvironment, as well as DNA methylation dynamics and genomic heterogeneity across cancers were assessed based on data from TCGA.
Results: Our findings revealed that distinct differences of TMEM59L mRNA expression were observed in different cancer types and that higher TMEM59L expression was observed in the advanced pathological stage and associated with worse prognosis in kidney renal papillary cell carcinoma, bladder urothelial carcinoma, colon adenocarcinoma, and kidney renal clear cell carcinoma. Pathway analysis indicated that TMEM59L exerted a key influence in cancer development and in immune- and cancer-associated pathways such as epithelial–mesenchymal transition and TGF-β signaling. Moreover, correlation analysis hinted at a negative correlation of TMEM59L expression with CD8 T cells, activated CD4 T cells, and several immunomodulators, including IDO1, TIGIT, PD-L1, CTLA-4, and BTLA in various cancers. Survival analysis indicated that the hypermethylation of TMEM59L gene was associated with longer survival times. A significant correlation was also observed between TMEM59L expression and immunophenoscore, homologous recombination deficiency, loss of heterozygosity, tumor stemness score, and neoantigens in various cancers. Importantly, we also identified numerous potential agents that may target TMEM59L.
Conclusion: Our study revealed the prognostic value as well as the genomic and immunological characteristics of TMEM59L in cancers, highlighting the promising potential for TMEM59L as a prognostic cancer biomarker and a therapeutic target.
1. Introduction
The global incidence and mortality of cancer remain on the rise, with breast cancer, lung cancer, and colorectal cancer being the most common types of cancer with the highest mortality rates worldwide (1, 2). Cancer is a major cause of global mortality and a significant impediment to increasing life expectancy in the global population (3). Despite research efforts to improve cancer diagnosis and treatment, the associated clinical outcome and 5-year survival rate generally remain unfavorable, largely due to the complexity of this disease (4–8).
A large body of evidence has confirmed that the tumor microenvironment (TME) can determine abnormal tissue functions, alter the malignant behavior of tumor cells, and play vital roles in the consecutive evolution of malignant cancers and tumor resistance to anticancer drugs (9–11). The TME, characterized by hypoxia, oxidative stress, and abnormal levels of multiple cytokines and growth factors, induces dysplasia, which is defined as the emergence of heterogeneous tumor cell populations with distinct genetic and phenotypic characteristics (8, 12, 13). During cancer progression, tumor heterogeneity is exacerbated by the maturation of both cellular and acellular components of the TME (14, 15), enabling cancer stem cells (CSCs) to survive and proliferate – a principal attribute that underlies therapeutic resistance as well as tumor maintenance and recurrence (16–20). Multiple studies have indicated that genomic, epigenomic, and transcriptomic features are causally linked to the regulation of cancer pathways that support tumor cell growth and proliferation, and the phenomenon of cancer stemness (21–23). For these reasons, the outcome of current cancer chemotherapy, radiotherapy, and immunotherapy is far from satisfactory, and treatment regimens require further optimization.
DNA methylation signatures that are highly sensitive, specific, and analyzable have an enormous potential as clinical cancer biomarkers that play a non-negligible role in cancer diagnosis and prognosis, providing new technical means for early detection of different cancer types (24–27). Nevertheless, there is a need to explore new potential targets or cancer biomarkers to ensure that novel treatment regimens and appropriate combination therapy strategies can be specifically tailored to individual patients.
Transmembrane protein 59–like (TMEM59L), also known as brain-specific membrane-anchored protein BSMAP, was first discovered in 1999 (28). In 2006, using reverse transfection cell array technology, Mannherz et al. found that TMEM59L produced pro-apoptotic effects through an unknown mechanism (29). TMEM59L can regulate the N- and O-glycosylation steps that occur during Golgi maturation and is associated with glycosylation modifications of the amyloid precursor protein APP by inhibiting APP maturation, trafficking, and shedding (30). Recent studies have demonstrated that the downregulation of TMEM59L can protect neurons from oxidative stress, and that TMEM59L interacts with ATG5 and ATG16L1, partially activating LC3 and triggering autophagy (31, 32). Moreover, the homologue of TMEM59L, transmembrane protein 59 (TMEM59), is hypomethylated in late-onset Alzheimer’s disease, and methylation is involved in the transcriptional regulation and thus protein expression of TMEM59 (33). However, there is currently a lack of in-depth reports on the functional mechanism of TMEM59L, especially in the context of cancer research.
In this study, we comprehensively explored TMEM59L gene expression signature, its prognostic value, as well as its association with immune cell infiltration and cancer-associated pathways in various cancer types. Moreover, our study underscores the importance of TMEM59L as a prognostic biomarker and a treatment target and identified in TMEM59L a molecule to be further explored.
2. Materials and methods
2.1. Datasets
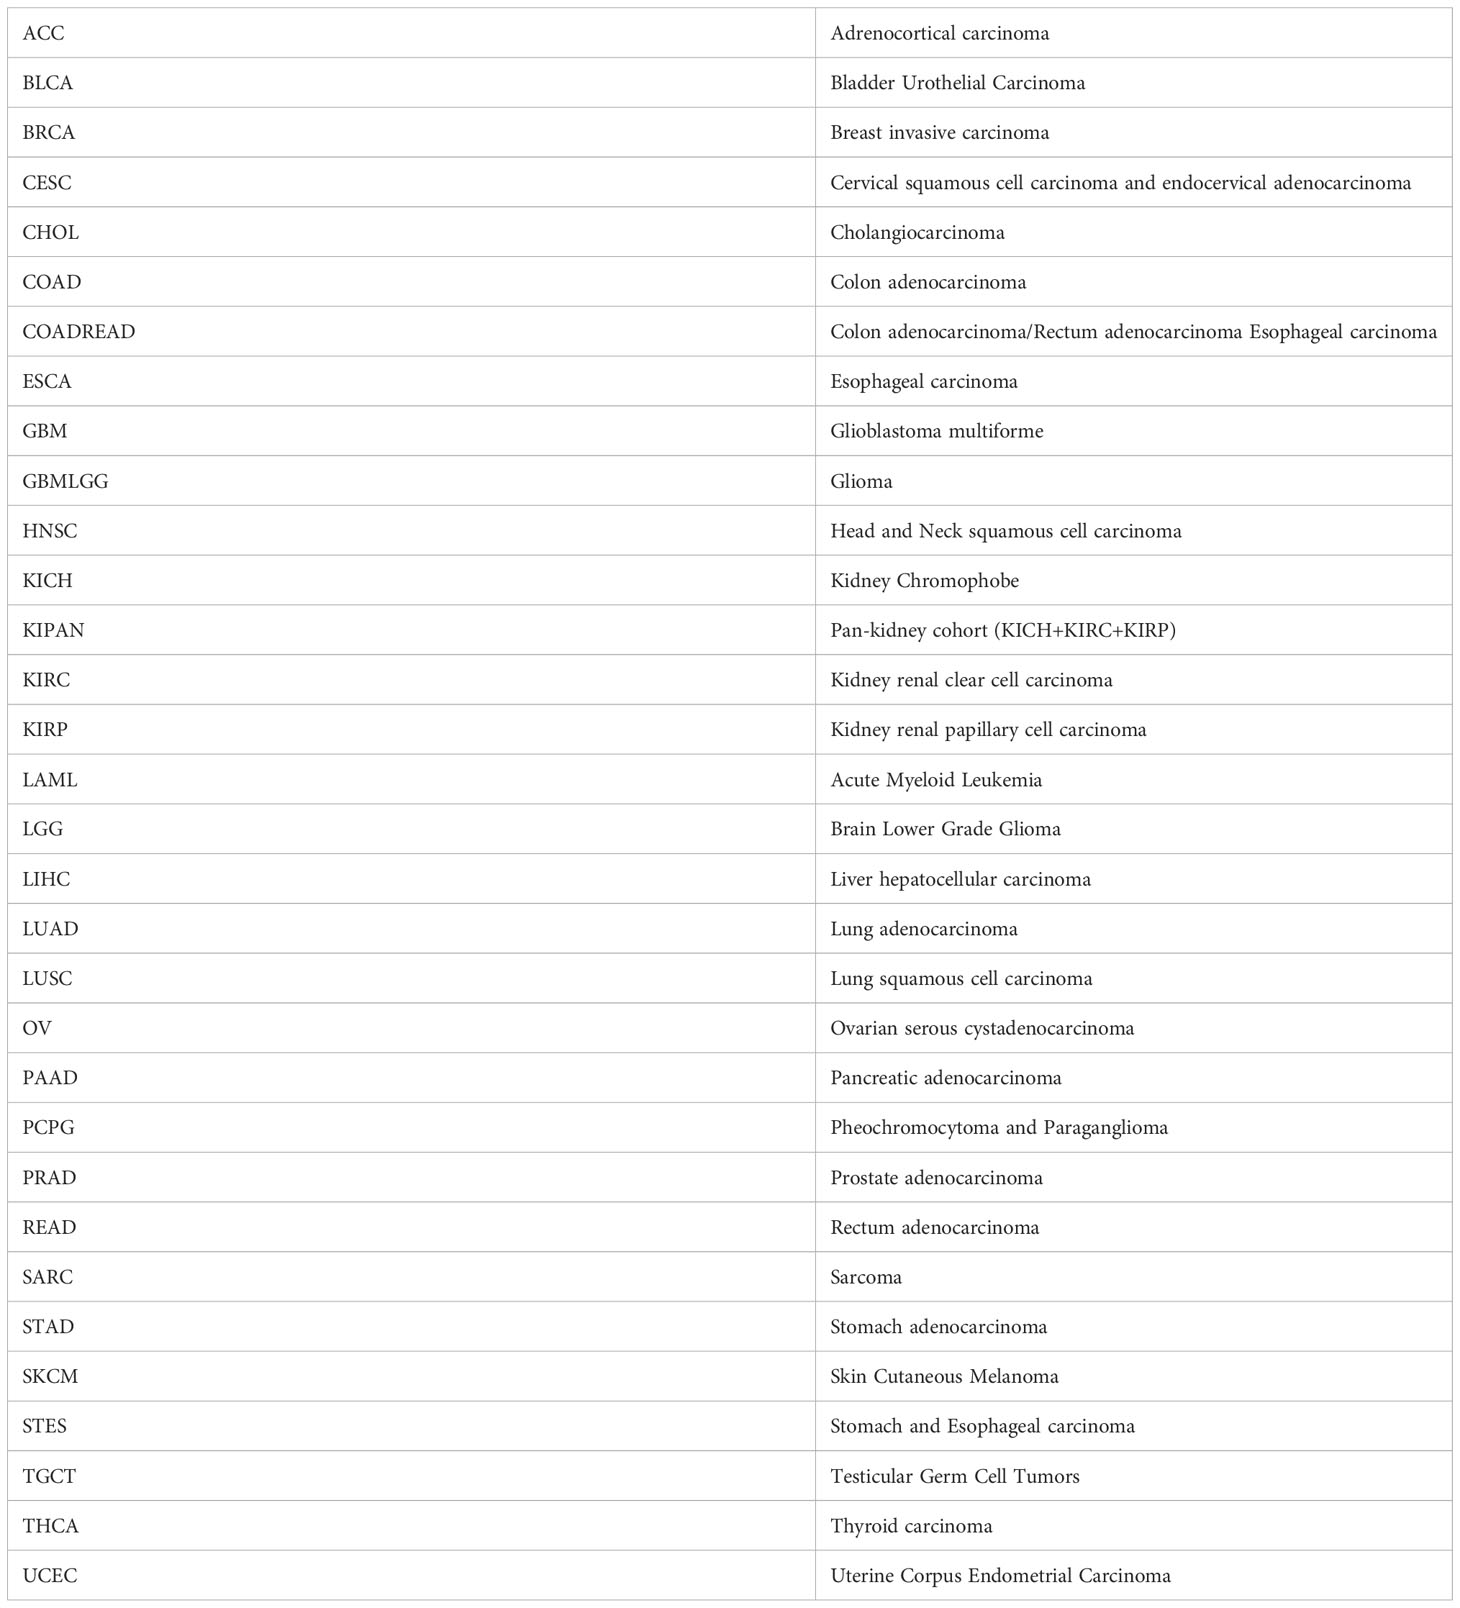
The gene expression profiles, methylation data, and corresponding pan-cancer clinical data were downloaded from The Cancer Genome Atlas (TCGA) database (https://portal.gdc.cancer.gov/), the Genotype-Tissue Expression (GTEx) dataset was downloaded from UCSC-hosted genomics platform (https://xenabrowser.net/). The cancer type abbreviations are listed in Table 1.
2.2. Integrated network and enrichment analysis
Each patient was divided into a high-expression or a low-expression group based on the median of TMEM59L expression. We used the GSVA R package to conduct the gene set enrichment analysis (GSEA) to evaluate pathway enrichment for high- and low-TMEM59L expression groups (34). Hallmark gene sets (h.all.v7.2.symbols) were collected from GSEA database (http://www.gsea-msigdb.org/gsea/downloads.jsp). Reverse phase protein array (RPPA) data from TCPA database (https://www.tcpaportal.org/tcpa/index.html) were also used to assess pathway activity score (PAS). The evaluated pathways included apoptosis, cell cycle, DNA damage response, epithelial–mesenchymal transition (EMT), as well as hormone androgen receptor (AR), hormone estrogen receptor (ER), tuberous sclerosis complex–mammalian target of rapamycin (TSC–mTOR), receptor tyrosine kinase (RTK), Ras/MAPK (mitogen-activated protein kinase), and PI3K/AKT signaling pathways, all of which are notably associated with cancer. The difference of PAS was evaluated using Student’s t-test, and the resulting p-value was adjusted for false discovery rate (FDR), with FDR ≤ 0.05 being considered significant. When PAS (TMEM59L High expression) > PAS (TMEM59L Low expression), we considered TMEM59L to have an activating effect on a specific pathway; in the opposite case TMEM59L was considered to have an inhibitory effect on a pathway.
2.3. Estimation of immune cell infiltration
The correlation of TMEM59L expression with the immune infiltration level was assessed using the CIBERSORT algorithm (https://cibersort.stanford.edu) (35). The stromal, immune, and ESTIMATE scores for each patient were calculated using the ESTIMATE algorithm (36). The immunophenoscore (IPS) for each patient was calculated according to the method reported by Charoentong (37). We also extracted the expression data of 155 immunomodulators including chemokines, receptors, MHC, immune-inhibitors, and immune-stimulators from each patient based on the study of Charoentong et al. (37) as well, and correlation analyses were subsequently conducted to assess the association between immunological characteristics and TMEM59L across cancer types.
2.4. Methylation analysis
We downloaded the methylation data from TCGA database. In total, 14 cancer types were selected and analyzed including Colon adenocarcinoma (COAD), Colorectal carcinoma (COADREAD), Thyroid carcinoma (THCA), Cholangiocarcinoma (CHOL), Liver hepatocellular carcinoma (LIHC), Kidney renal papillary cell carcinoma (KIRP), Pan-kidney cohort (KIPAN), Adrenocortical carcinoma (ACC), Ovarian serous cystadenocarcinoma (OV), Uterine Corpus Endometrial Carcinoma (UCEC), Rectum adenocarcinoma (READ), Stomach and Esophageal carcinoma (STES), Breast invasive carcinoma (BRCA), Bladder Urothelial Carcinoma (BLCA), Kidney renal clear cell carcinoma (KIRC), Prostate adenocarcinoma (PRAD), Stomach adenocarcinoma (STAD), Lung squamous cell carcinoma (LUSC), Lung adenocarcinoma (LUAD), Pancreatic adenocarcinoma (PAAD), Glioma (GBMLGG), Esophageal carcinoma (ESCA), Kidney Chromophobe (KICH), and Head and Neck squamous cell carcinoma (HNSC). The cohort included more than 10 paired cancer and adjacent non-cancer samples. Spearman correlation analyses were performed to identify whether TMEM59L expression was associated with methylation levels.
2.5. Drug analysis
We recorded the drug sensitivity data from Genomics of Drug Sensitivity in Cancer (GDSC) database (38) and the Genomics of Therapeutics Response Portal (CTRP) database (39). Spearman correlation analysis was carried out to identify the association between gene mRNA expression and drug response.
2.6. Statistical analysis
We computed the statistical analyses in the R (version 4.1.1). Hazard analyses were carried out using Cox regression. Survival curves were analyzed by log-rank test. Correlation coefficients were obtained using the Spearman correlation method. Any p-value less than 0.05 was considered statistically significant.
3. Results
3.1. TMEM59L mRNA expression in human cancers
The TIMER online database (https://cistrome.shinyapps.io/timer/) was first used to identify the expression of TMEM59L mRNA transcripts in different types of cancer (Figure 1A). Compared with corresponding normal tissues, TMEM59L mRNA expression was significantly increased in six human cancers, specifically BRCA, CHOL, LIHC, LUAD, PRAD, and THCA. In contrast, TMEM59L expression was evidently lower in BLCA, COAD, KICH, KIRC, KIRP, and STAD than that in the normal tissues. Subsequently, a pan-cancer analysis demonstrated that TMEM59L expression was decreased across most cancer types, such as GBM, GBMLGG, KIRP, COAD, KICH, KIRC, LGG, KIPAN, COADREAD, STAD, UCEC, READ, STES, and BLCA (Figure 1B). Considering the small number of normal samples in TCGA database, we integrated the data of normal tissues from the GTEx database with the data of TCGA tumor tissues to determine the expression characteristics of TMEM59L across the pan-cancer cohort. The results were similar; compared with its expression in normal samples, TMEM59L was significantly downregulated in most cancer types (Figure 1C).
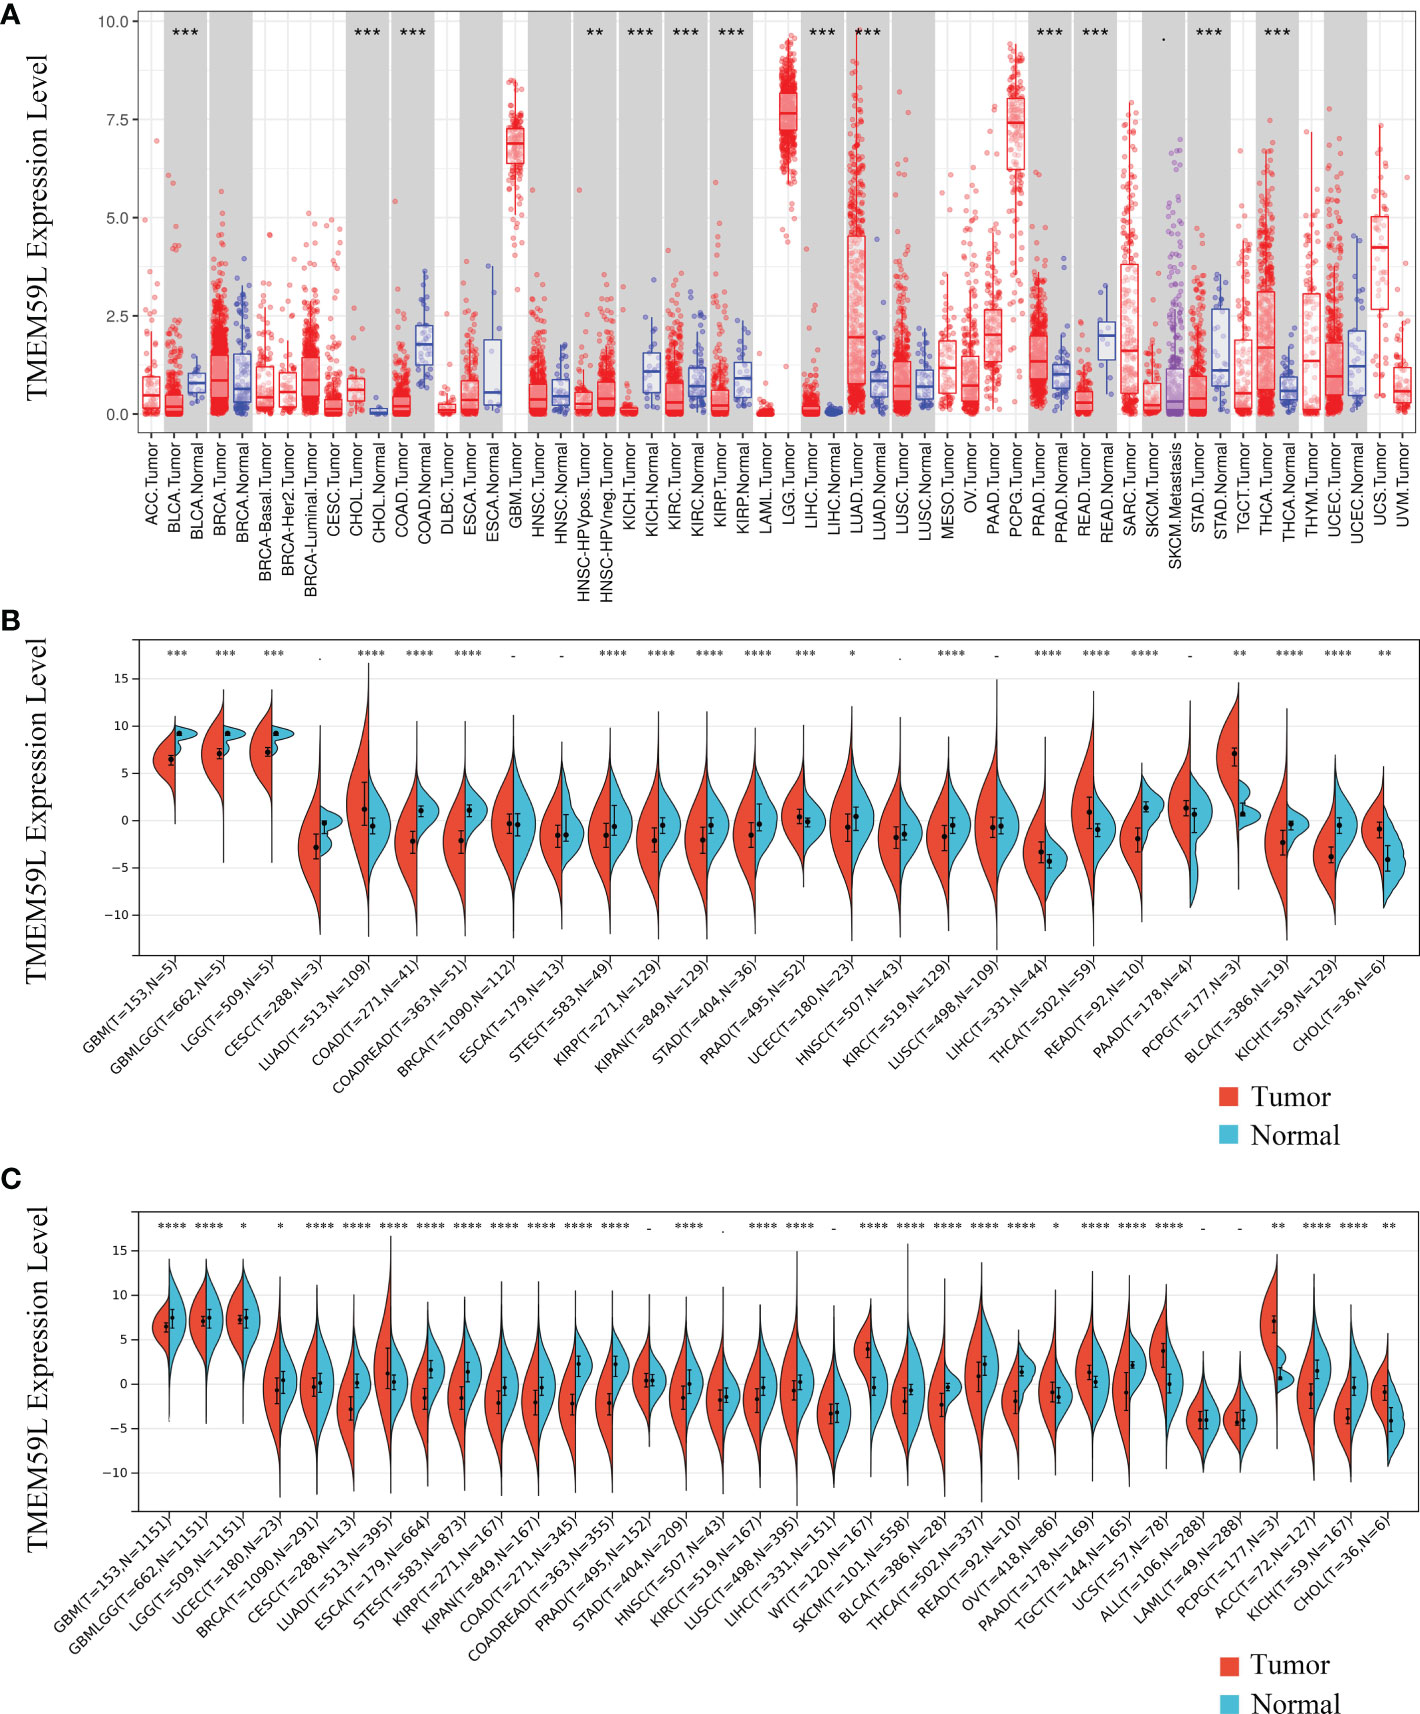
Figure 1 TMEM59L mRNA expression in different types of human cancers. (A) TMEM59L mRNA expression in different tumor types compared with normal tissues in the TIMER database. (B) TMEM59L mRNA expression in different tumor types compared with normal tissues from TCGA database. (C) mRNA expression of TMEM59L across tumor types using TCGA and GTEx data. (*P < 0.05, **P < 0.01, ***P < 0.001), ****p < 0.0001.
3.2. TMEM59L expression profile at different clinical stages or in different cancer subtypes
We further analyzed TMEM59L mRNA expression tendency at different clinical stages and in different cancer subtypes (Figure 2A). Distinct differences could be observed in varying clinical stages in several cancer types, including KIRP, BLCA, COAD, and KIRC. Remarkably, in KIRP, BLCA, COAD, and KIRC, later pathological stage showed higher TMEM59L mRNA expression (Figures 2B–F). Furthermore, TMEM59L mRNA expression in LUAD, GBM, HNSC, BRCA, KIRC, and STAD was also significantly different based on the molecular specific subtype (Figures 2G–M). To increase the reliability of our study, we verified the protein expression level of TMEM59L. Based on the HPA database (https://www.proteinatlas.org/), we further explored the protein level of TMEM59L in normal tissues and human cancers. Figure S1A showed the protein expression level of TMEM59L in normal tissues. The immunohistochemical results showed that the expression level of TMEM59L is not high in most tissues except for the pituitary gland; Subsequently, we also explored the expression of TMEM59L in cancer tissues. As shown in Figure S1B, TMEM59L has a relatively high protein expression level in colorectal cancer, pancreatic cancer, kidney cancer, and liver cancer. These results were consistent with our previous results that the later the stage, the higher mRNA level of TMEM59L in COAD and KIRP. Figure S1C further showed the representative IHC images of TMEM59L in colorectal and renal cancer based on HPA database.
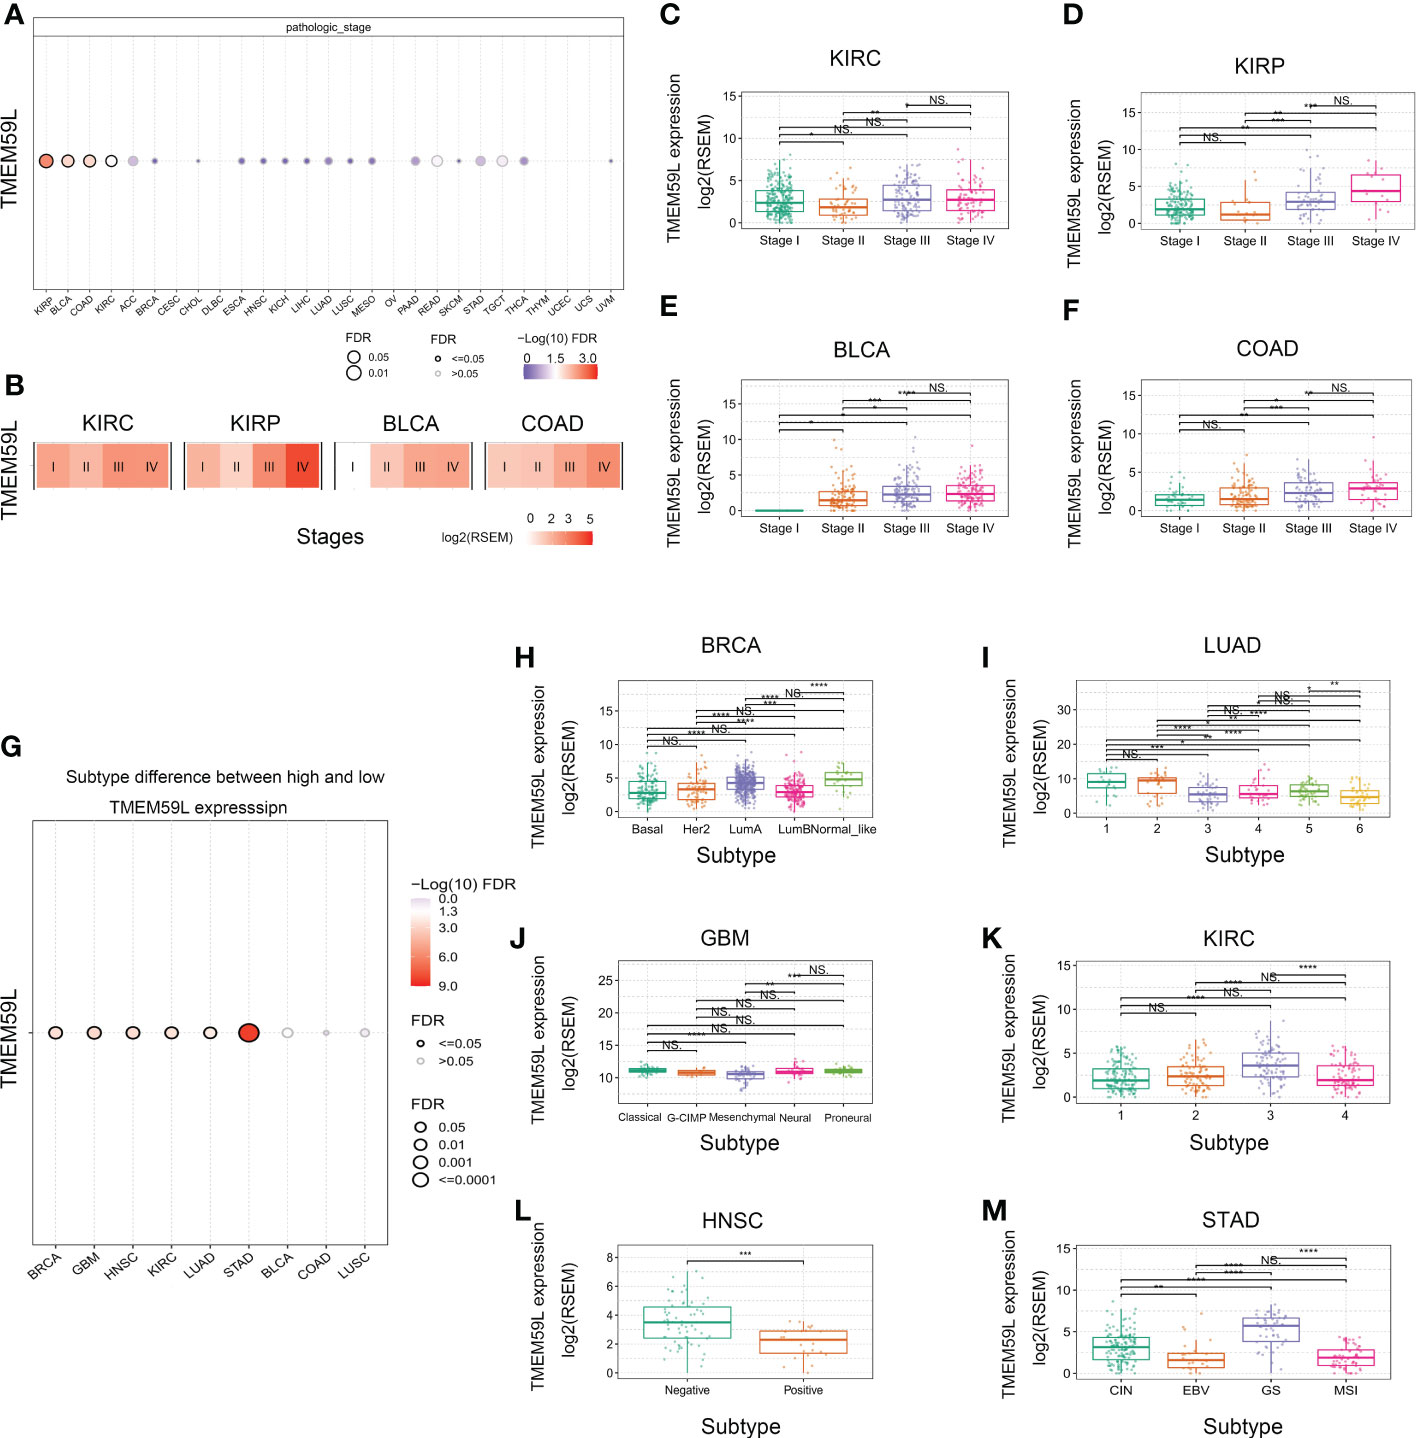
Figure 2 TMEM59L expression at different clinical stages or subtypes of different cancers. (A) The difference of TMEM59L mRNA expression between pathologic stages in the specific cancers. (B) Heatmap presents the TMEM59L mRNA expression profile among stages in the specific cancers. (C–F) TMEM59L mRNA expression in pathologic stage of KIRC, KIRP, BLCA, and COAD. (G) The associations between subtypes and TMEM59L expression. (H–M) TMEM59L mRNA expression in subtypes of BRCA, LUAD, GBM, KIRC, HNSC, and STAD. (ns: not significant, *P < 0.05, **P < 0.01, ***P < 0.001, ****p < 0.0001).
3.3. Prognostic value of TMEM59L mRNA expression
To further identify the prognostic value of TMEM59L, we then performed a survival analysis on the data retrieved from the TCGA database. Cox regression indicated that a high TMEM59L expression was associated with shorter overall survival (OS) and progression-free interval (PFI) of KIPAN, KIRP, BLCA, COAD, COADREAD, OV, ACC, HNSC, and STAD (Figures 3A, B). In contrast, higher TMEM59L expression predicted longer OS and PFI in GBMLGG, LGG, and PAAD (Figures 3A, B). Further survival curves also indicated that high TMEM59L expression was associated with worse OS (Figures 3C–F) and PFI in BLCA, COAD, KIRC, and KIRP (Figures 3G–J). Meanwhile, there was no significant association between TMEM59L expression and clinical outcome in other cancers.
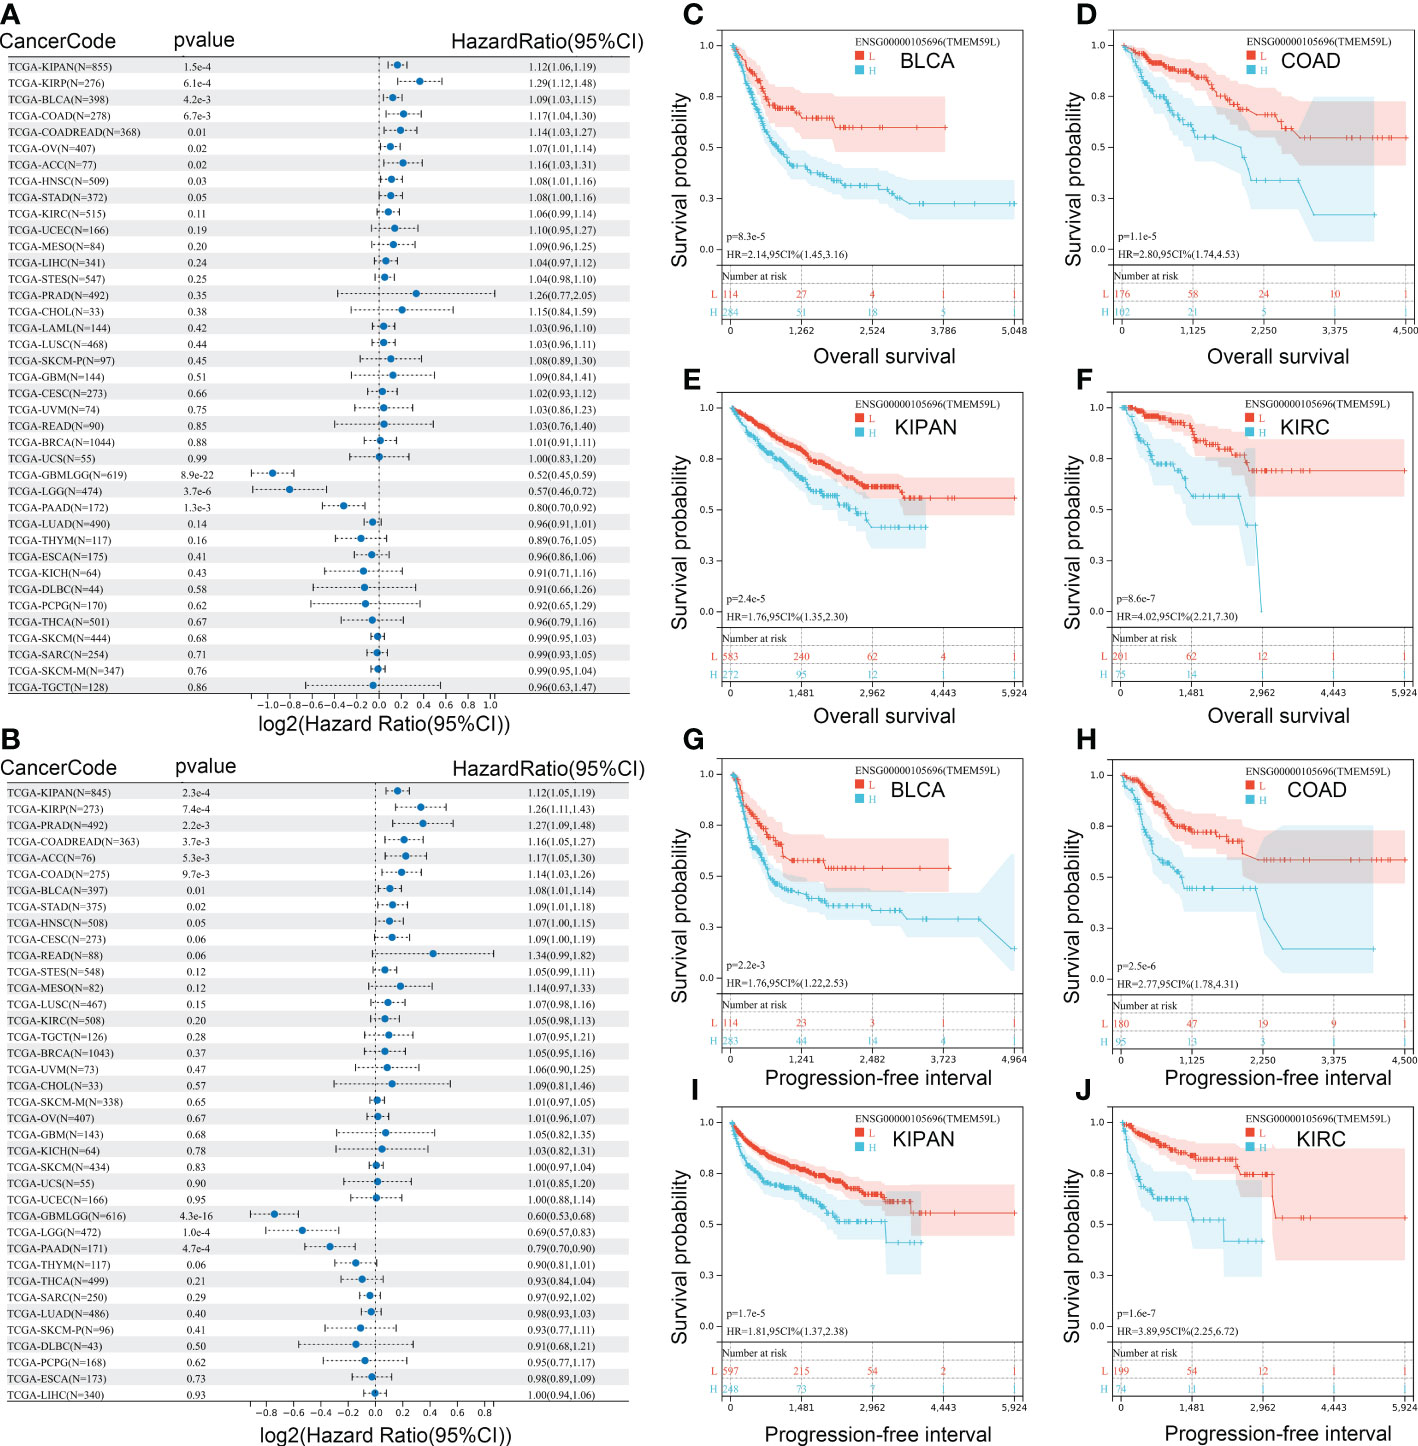
Figure 3 Correlation analysis between mRNA expression of TMEM59L and prognostic value. (A) The Overall survival (OS) difference between high and low TMEM59L expression groups. (B) The Progression-free interval (PFI) difference between high and low TMEM59L expression groups. (C–J) OS and PFI difference between high and low TMEM59L expression groups in BLCA, COAD, KIPAN, and KIRC.
3.4. Association between TMEM59L mRNA expression and cancer-related pathways
To better understand the relevance and potential functions of TMEM59L in cancer pathogenesis, we performed functional enrichment analysis on the low and high TMEM59L expression groups across several cancer types (Figure 4A). The results indicated that TMEM59L expression was closely correlated with cancer-related hallmarks, including epithelial-mesenchymal transition (EMT), P53 pathway, E2F target, cell cycle regulation at G2-M, KRAS signaling, WNT beta-catenin signaling, and immune-related pathways, such as TGF-β, IL2-STAT5, and TNFα signaling via NF-kB. Moreover, the pathway activity analysis suggested that TMEM59L was significantly involved in 10 salient cancer-related pathways, namely DNA damage response, apoptosis, RTK, cell cycle, Hormone AR, Hormone ER, TSC–mTOR, Ras/MAPK, EMT and PI3K/AKT signaling pathways (Figure 4B). The main pathway activated by TMEM59L was EMT (28% activation vs. 3% inhibition), especially in BLCA, BRCA, COAD, ESCA, OV, READ, STAD, TGCT, and THCA (Figure S2), whereas the pathways inhibited by TMEM59L included apoptosis (31% inhibition vs. 0% activation) and cell cycle (22% inhibition vs. 0% activation). When compared with low TMEM59L expression group, the activities of EMT and estrogen receptor (ER) pathways were also higher, whereas a lower pathway activity in cell cycle and DNA damage response was observed in the high TMEM59L expression group for patients with COAD (Figures 4C–F). The above results suggested that TMEM59L exerts a key influence on cancer pathogenesis and development.
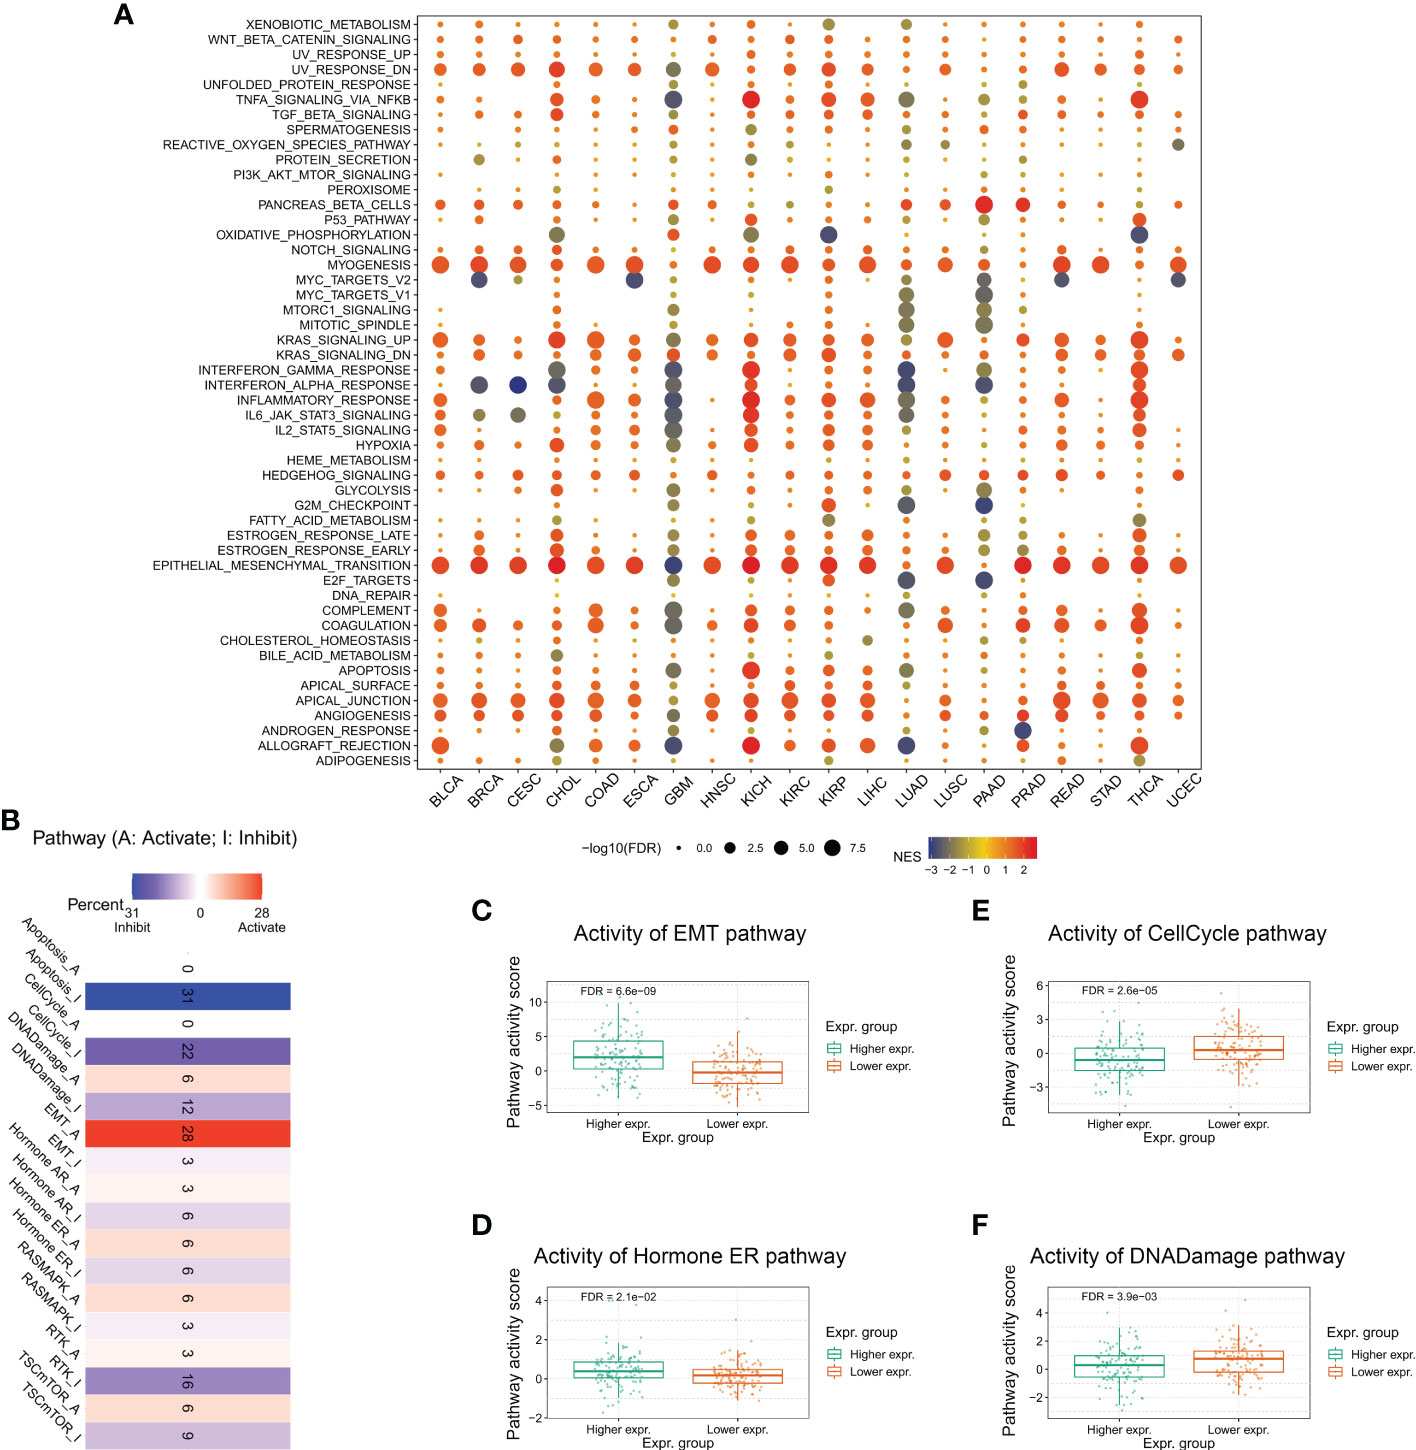
Figure 4 Association between TMEM59L and pathways in cancers. (A) Enrichment analysis for cancer signaling between high and low TMEM59L expression tumor tissues. NES is the normalized enrichment score in the GSEA algorithm. (B) The combined percentage of the effect of TMEM59L on pathway activity indifferent types of human cancers. (C–F) The differences of epithelial mesenchymal transition (EMT), Cell Cycle, Hormone estrogen receptor (ER), and DNA damage pathways activity between high and low TMEM59L expression groups in COAD.
3.5. Interaction network of TMEM59L
Based on the GeneMANIA database, the 20 proteins most closely correlated with TMEM59L expression, namely TMEM59, GABRA3, ITM2B, AK5, CAMK2B, HMGB4, BPIFB4, REEP2, ATP1B4, DNM1, RAB6B, GSTT1, PTPRN, CPLX2, MUC1, GDAP1L1, CORO2B, KCNS2, ASCL1, and KIF5A, were analyzed to construct a protein-protein interaction network (Figure 5A). Subsequently, these interacting genes were subjected to functional enrichment analysis, and consistently with the previous results, these genes were significantly enriched in the activation of EMT signaling pathway and in the inhibition of apoptosis and cell cycle signaling pathway (Figure 5B). Relative network analysis also indicated that TMEM59L and its interacting genes were involved in cancer-related pathways, such as TSC/mTOR, RTK, EMT, Ras/MAPK, and PI3K/AKT signaling, particularly in ACC, BLCA, COAD, READ, STAD, KIRP, KIRC, KICH, and PAAD (Figure 5C).
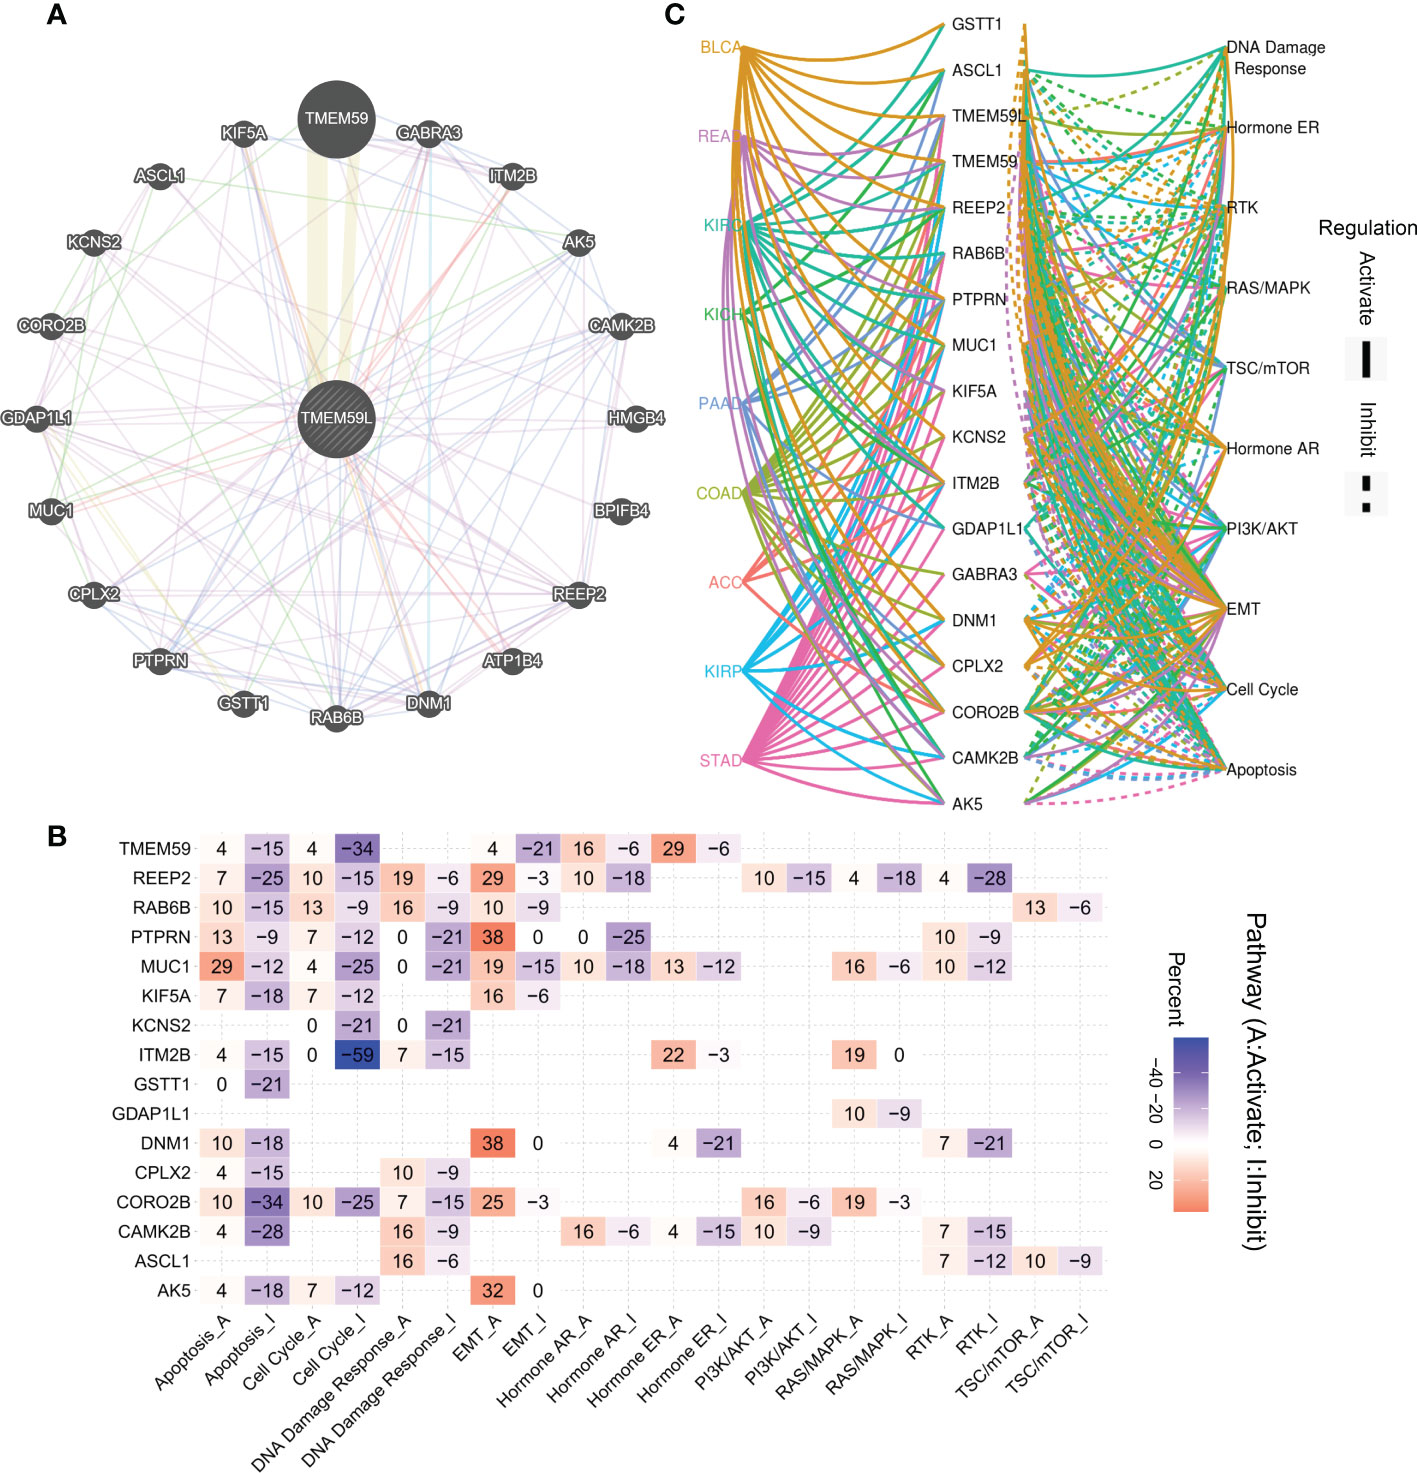
Figure 5 Association between interaction genes of TMEM59L and pathways in cancers. (A) Interaction Network of TMEM59L constructed by GeneMANIA. (B) The combined percentage of the effect of interaction genes of TMEM59L on pathway activity in different types of human cancers, the number in each cell means that the percentage of cancer types, in which TMEM59L showed significant association with the specific pathway, among the selected cancer types. (C) Association between interaction genes of TMEM59L and known pathways in ACC, BLCA, COAD, READ, STAD, KIRP, KIRC, KICH and PAAD. (solid line: activation; dashed line: inhibition), the different colors of the lines represent different types of cancer.
3.5.1. Association of TMEM59L expression with the tumor immune microenvironment
As the pathway enrichment analysis revealed that TMEM59L was closely related to inflammation and immune function, we further investigated the link between TMEM59L expression and immune cell infiltration levels using the CIBERSORT algorithm. The results demonstrated that TMEM59L expression was distinctly negatively correlated with immune infiltration levels in LUSC, SARC, COADREAD, LUAD, HNSC, CESC, BRCA, and TGCT, especially with the levels of CD8 T cell and activated CD4 T cells (Figure 6A and Table S1). We then further assessed Spearman’s correlation coefficient of TMEM59L and immune scores across distinct cancer types using the ESTIMATE algorithm. A significantly positive correlation between TMEM59L and stromal scores was detected, yet a negative correlation with immune scores across many cancer types (Table S2). IPS has been shown to effectively predict the response rate to anti-CTLA-4 and anti-PD-1 therapy. For this reason, we investigated the link between TMEM59L expression and the IPS across various cancer types. Figure 6B showed that TMEM59L expression was evidently negatively correlated with IPS in several types of cancers, including GBMLGG, LGG, OV, CESC, KIRC, SKCM, KIRP, and KIPAN. Moreover, IPS analysis demonstrated that TMEM59L expression was positively associated with immune checkpoints (CP) and suppressor cells (SCs) but was negatively correlated with MHC, average Z-score (AZ), and effector cells (ECs) in most tumors, all the p-values are less than 0.05.
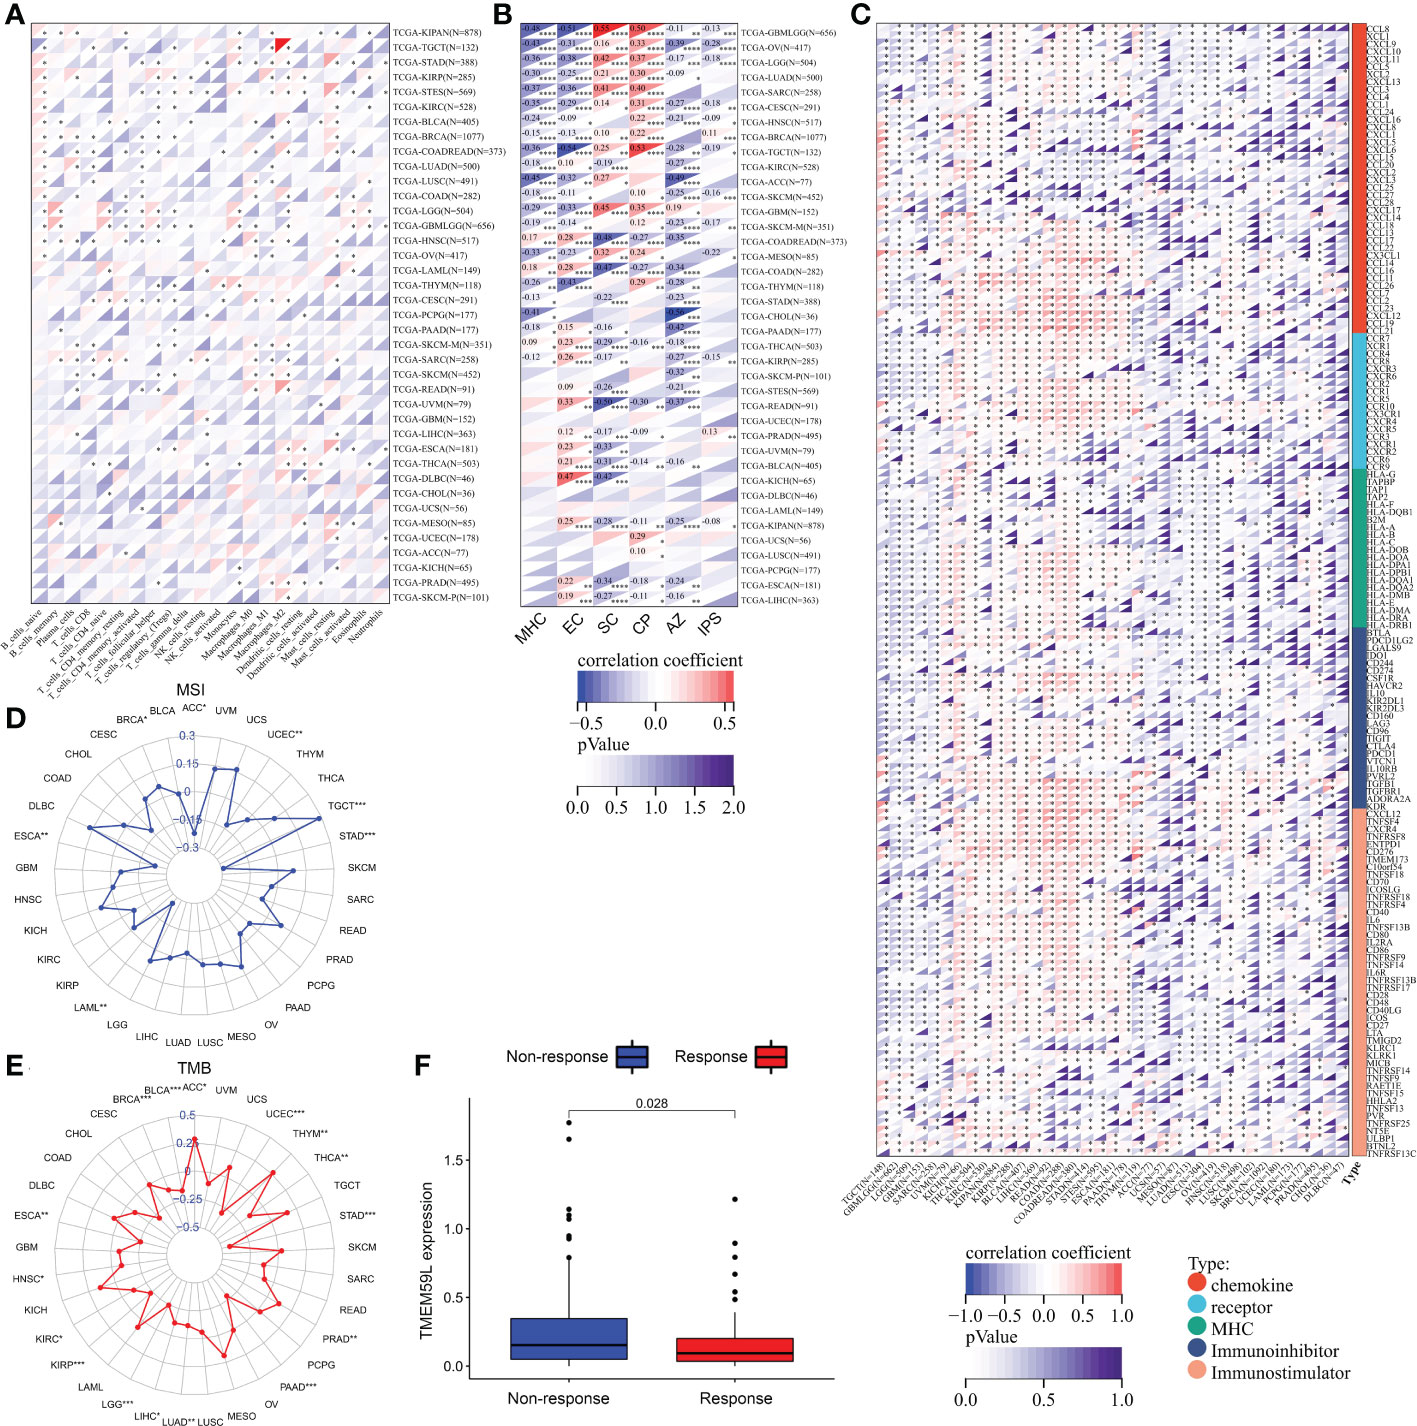
Figure 6 Relationship between TMEM59L expression and the tumor-immune microenvironment. (A) The correlation of TMEM59L expression with immune cell infiltration levels in pan-cancer. (B) The correlation between TMEM59L expression and the Immunophenoscore (IPS) across various cancer types. CP, immune checkpoints; SC, suppressor cells; EC, Effector cells; AZ, Average Z-score. (C) Correlation between TMEM59L and 155 immunomodulators, including chemokine, receptor, MHC, immuno-inhibitor, and immuno-stimulator across cancers. (D, E) Correlation of TMEM59L expression with tumor mutation burden (TMB) and microsatellite instability (MSI) in multiple cancer. (F) Patients with high TMEM59L expression have a worse clinical response to immune therapy in IMvigor210 cohort. (*p < 0.05, **p < 0.01, ***p < 0.001, ****p < 0.0001).
We also demonstrated that TMEM59L expression was negatively linked with the expression of many immune modulators, including PD-L1, IDO1, TIGIT, CTLA-4, and BTLA in various cancers (Figure 6C). TMEM59L also showed a negative correlation with tumor mutational burden (TMB) in many cancers, such as HNSC, LUAD, LIHC, KIRC, BRCA, THCA, BLCA, KIRP, LGG, ESCA, PAAD, UCEC, and STAD and a negative correlation with microsatellite instability (MSI) in UCEC, ACC, ESCA, LAML, and STAD, which suggest that TMEM59L may reflect cancer immunogenicity in these cancer types (Figures 6D–E and Table S3). Subsequently, based on the IMvigor210 cohort, we also found a link between the high expression of TMEM59L and poor clinical response to immune therapy (Figure 6F). These observations may hint at an intricate interplay between TMEM59L and the immune microenvironment, although more in-depth investigations are needed to unveil the specific molecular mechanisms.
To further clarify the possible role of TMEM59L in the tumor microenvironment, we analyzed single-cell sequencing data from BRCA-GSE148673 dataset through the TISCH database (a scRNA-seq database that provides extensive cell type annotations at the single-cell level, allowing TME exploration across various cancers). The results of UMAP showed that 28 clusters were identified in the BRCA-GSE148673 dataset (Figure S3A), and then the corresponding clusters were labeled into nine different cell subpopulations, including B cell, CD4 T conv, CD8 T cell, endothelial, epithelial, fibroblasts, malignant, mono/macro, and Tprolif (Figure S3B). For the BRCA-GSE148673 data set, TMEM59L is mainly expressed in fibroblasts (Figures S3C, D). Previous studies have shown that fibroblasts are mainly involved in the activation of the EMT pathway to promote metastasis (40–42), and functional enrichment analysis subsequently conducted further confirmed our speculation that the activity of the EMT and angiogenesis pathways in TMEM59L high-expressing cell cluster (fibroblasts) was significantly increased (Figures S3E, F). All the above results indicated that TMEM59L participates in tumor invasion and metastasis through the activity EMT pathway, which was consistent with our previous results.
We also performed GSEA analysis using TCGA-BRCA bulk RNA-seq data to compare the expression level of TMEM59L concerning related signaling pathways. The cancer-associated pathway signatures were extracted from Jiao Hu et al. (43), the cancer-immunity cycle reflects the anticancer immune response (44), and the activation levels cancer-immunity cycle were retrieved from tracking tumor immunophenotype (TIP) (45)(http://biocc.hrbmu.edu.cn/TIP/). And as shown, TMEM59L was significantly positively correlated with oncogenic pathways (such as Ta_pathway, EMT_differentiation, and Myofibroblasts pathway) (Figure S4A). Interestingly, we further found that TMEM59L is negatively correlated with cancer immunity cycle pathways which further confirmed that TMEM59L is related to the immunosuppressive microenvironment (Figure S4B).
3.6. DNA methylation alterations across TMEM59L gene across different human cancers
Epigenetic changes such as DNA methylation play key roles in modulating the behaviors of cancer cells and immune tolerance (46), thus we explored whether epigenetic regulation is involved in TMEM59L mRNA expression. As shown in Figure 6A, the methylation levels of TMEM59L gene in distinct cancers were highly heterogeneous (Figure 7A). The TMEM59L gene was hypermethylated in most cancers, including COAD (Figure 7B), BRCA (Figure 7C), PAAD (Figure 7D), HNSC (Figure 7E), BLCA, UCEC, KIRC, and LUSC, whereas it was hypomethylated in KIRP, LUAD, and THCA (P < 0.05, Figure S5). Spearman correlation analysis indicated that TMEM59L expression correlated negatively with its gene methylation level in BLCA, BRCA, COAD, UCEC, HNSC, LUAD, PAAD, and THCA (FDR < 0.05; Figure 7F and Figure S6). Subsequently, survival analysis also showed that the hypermethylation of the TMEM59L gene correlated with longer survival times than the survival times associated with the hypomethylation of TMEM59L gene (P < 0.05, Figure 7G), especially in COAD, KIRC, and KIRP. The hypermethylation of TMEM59L was significantly correlated with longer OS and PFI (Figures 7H–M). No association was found between TMEM59L methylation and survival in other cancer types.
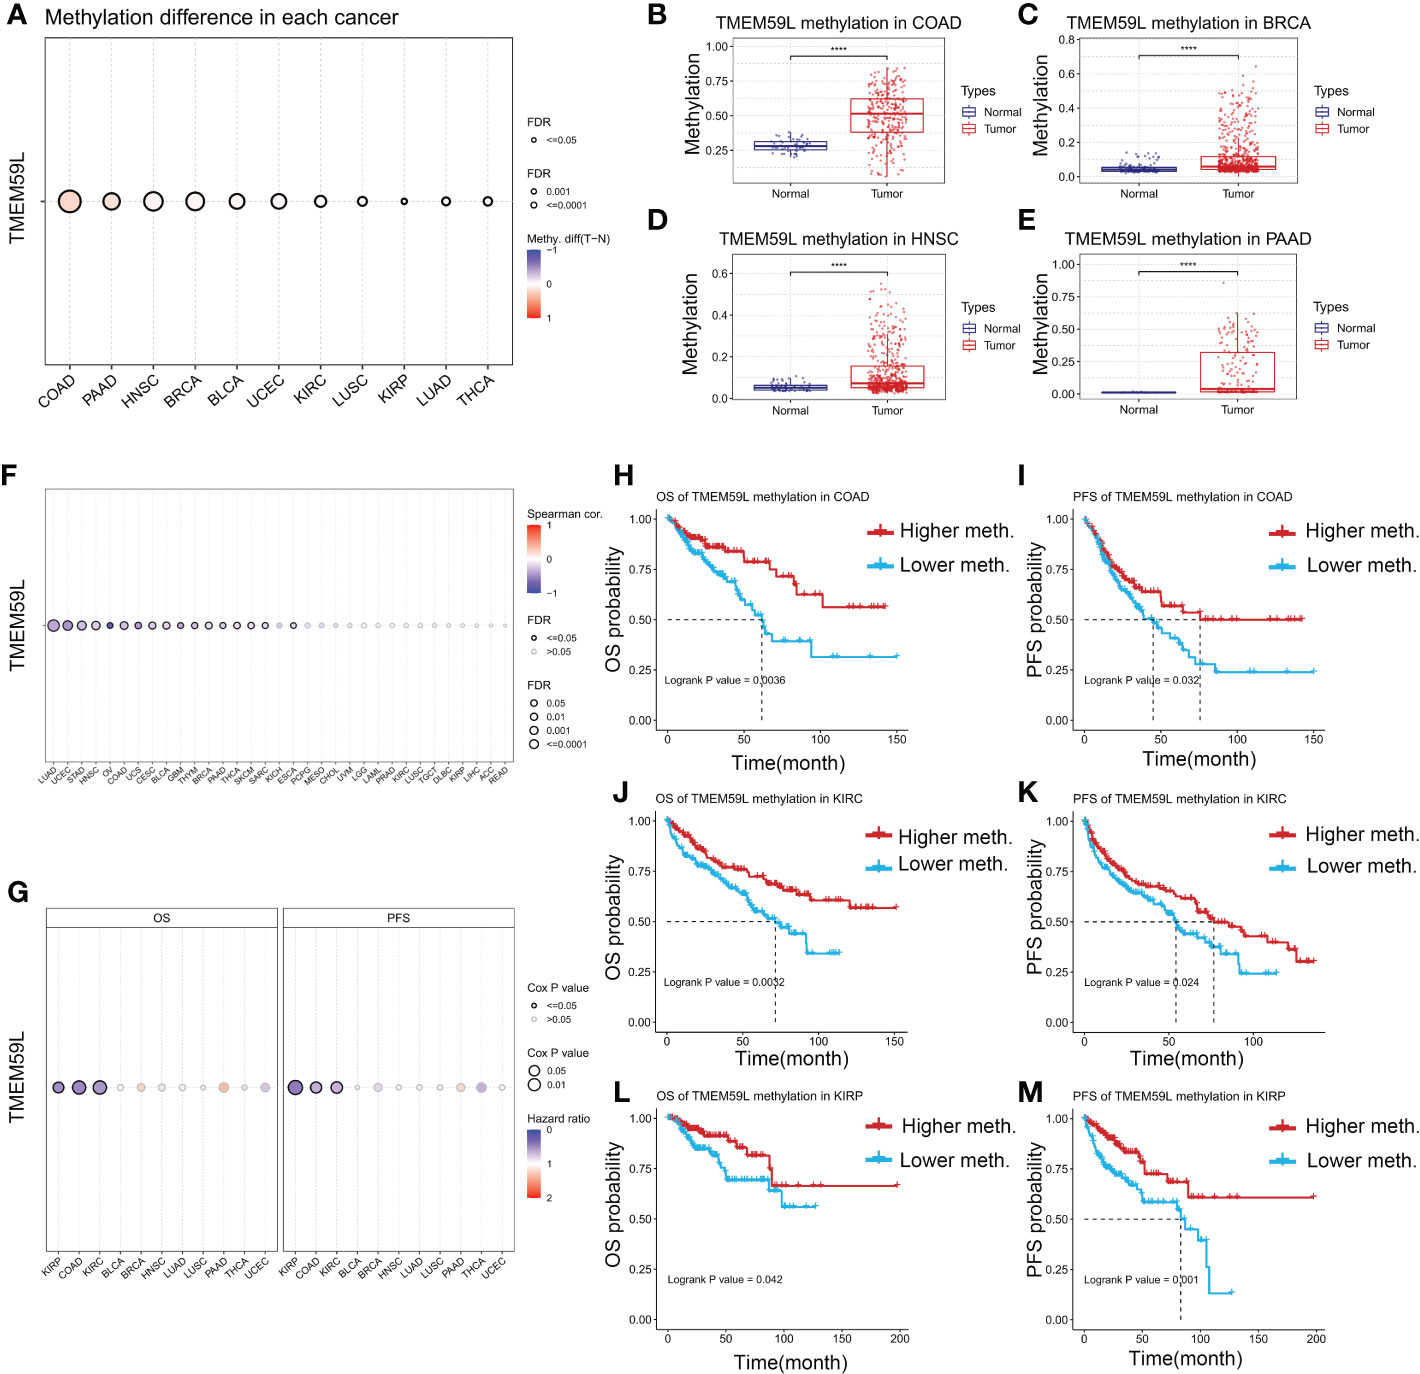
Figure 7 DNA methylation alterations of TMEM59L across different human cancers. (A) The methylation difference between tumor and normal samples of TMEM59L in different human cancers. (B–E) TMEM59L methylation in COAD, BRCA, HNSC, and PAAD. (F) The correlation between methylation and mRNA expression of TMEM59L in different human cancers. (G) The OS and PFS difference between higher and lower TMEM59L methylation groups in different human cancers. (H–M) The prognosis analysis of TMEM59L methylation in COAD, KIRC and KIRP.
3.7. Correlation analysis of TMEM59L expression with stemness index and genomic heterogeneity across cancers
Stem cell–like characteristics have been established as the main cause of chemoresistance (47, 48) and the key drivers of tumor progression (49–51). In the present study, we conducted correlation analyses to identify the association between TMEM59L expression and tumor stemness scores (RNA and DNA stemness scores). A significant negative correlation between DNA stemness score and TMEM59L expression in most tumors was observed in LGG, ESCA, SARC, STES, GBMLGG, STAD, COAD, LIHC, BRCA, TGCT, COADREAD, BLCA, PRAD, and KICH (Figure 8A). Similar results were seen when assessing the correlation between RNA stemness score and TMEM59L expression in most cancers, except for GBM, GBMLGG, LGG, and PCPG (Figure 8B). Homologous recombination is a critical pathway for double-strand break repairs (52, 53), thus homologous recombination deficiency would result in a high level of genomic instability, leading to a loss of heterozygosity and ultimately cell death (52, 54). Homologous recombination deficiency cancers have been shown to be markedly correlated with sensitivity to platinum-based chemotherapeutic drugs and PARP inhibitors (55, 56). In the current study, the expression of TMEM59L was closely related to homologous recombination deficiency status in most tumors (Figure 8C), and further loss of heterozygosity analysis showed a significantly positive association between loss of heterozygosity status and TMEM59L expression in several cancers, such as COAD, COADREAD, LAML, KIRP, PRAD, HNSC, LIHC, TGCT, and BLCA but a negative association with GBM, GBMLGG, LUAD, BRCA, SARC, and THCA (Figure 8D). Neoantigens were reported to be critical targets of immunotherapy and were correlated with improved clinical outcome and response rate to immune checkpoint blockade in several cancers, such as non-small cell lung cancer and melanoma (57–61). Our study discovered that TMEM59L expression was linked with neoantigens in only a limited number of cancers, such as COAD, COADREAD, GBM, UCEC, while no link was evident in other cancers (Figure 8E).
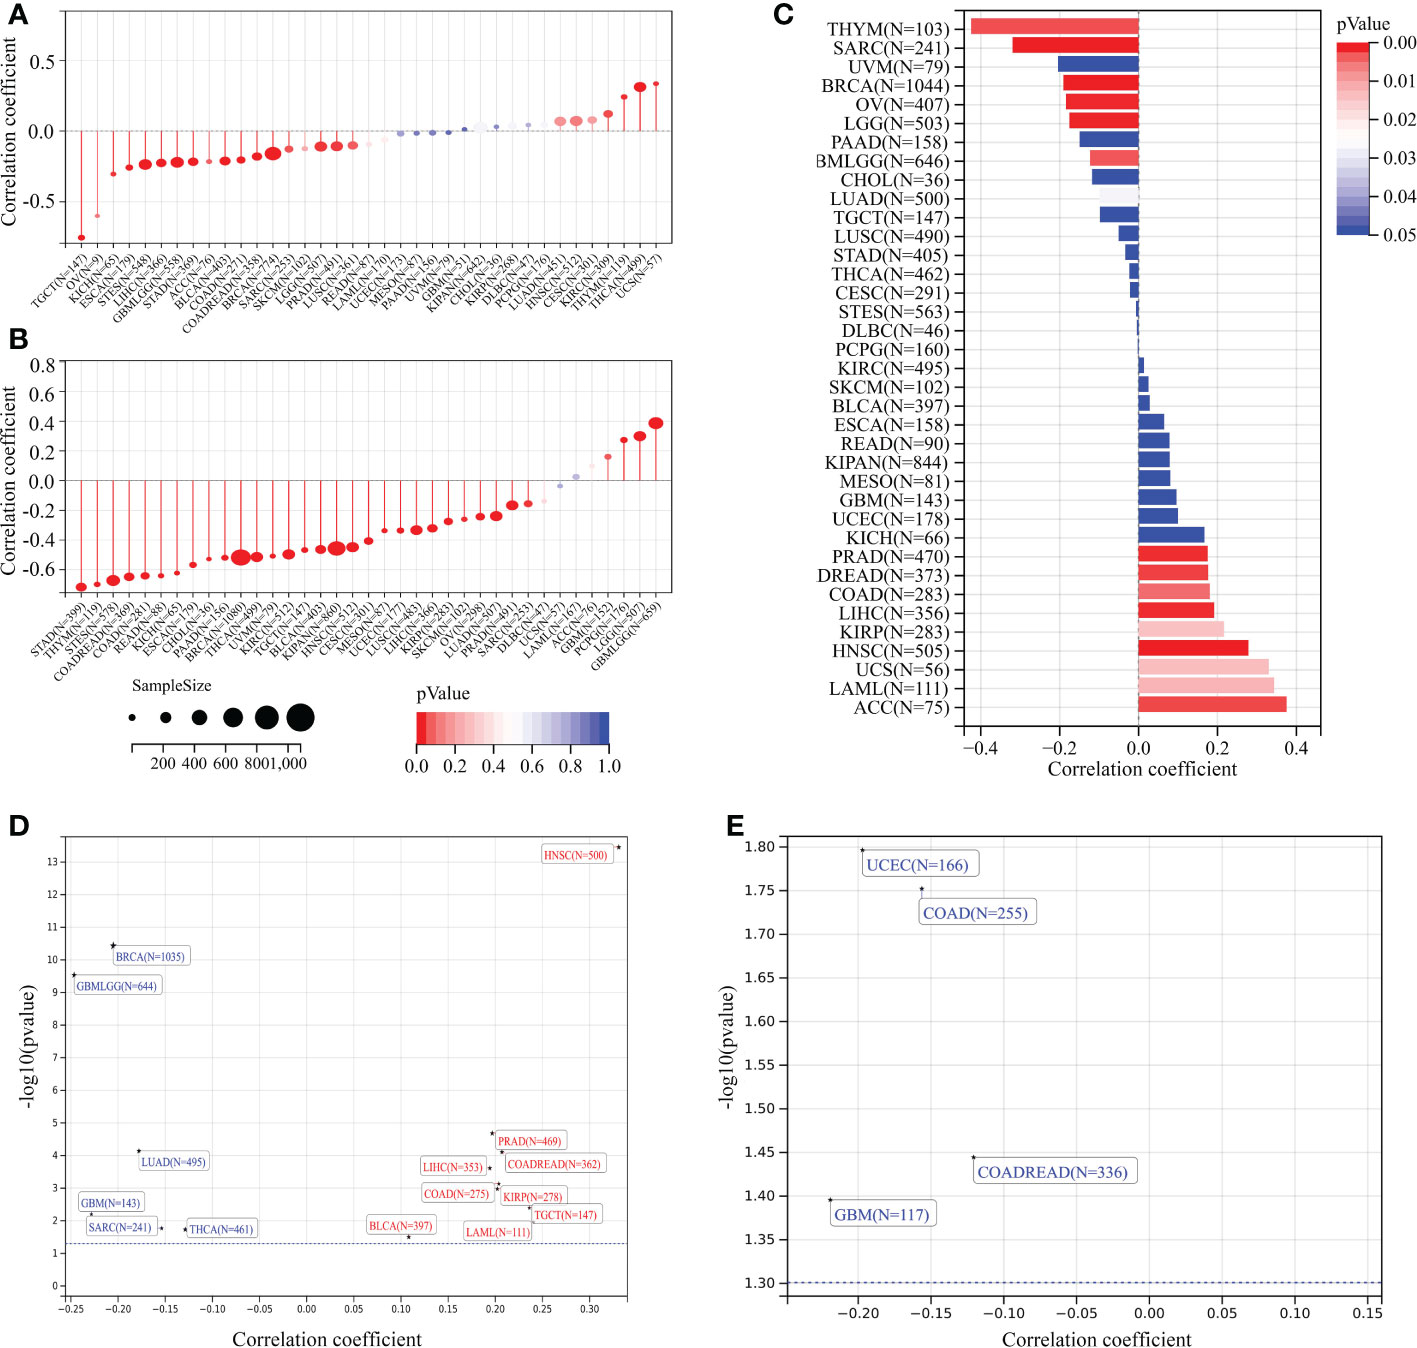
Figure 8 Correlation analysis of TMEM59L expression with stemness index and genomic heterogeneity across cancers. (A, B) The association between TMEM59L expression and tumor stemness score (DNAss and RNAss) in different cancers. (C) The association between TMEM59L expression and the homologous recombination deficiency (HRD) in different types of cancer. (D, E) The correlation of TMEM59L expression with heterozygosity (LOH) and Neoantigens (NEO) in different types of cancer.
3.8. Drug sensitivity analysis
Genomic aberrations would impact the sensitivity of malignant tumors to drug therapy (including chemotherapy and targeted therapy) (62). Since TMEM59L expression was closely associated with the genomic heterogeneity of various cancers, we then performed the drug sensitivity analysis on the GDSC (38) and CTRP databases. The results indicated that patients with high TMEM59L expression were more susceptible to AG-01469, BMS-754807, SB 505124, CIL70, DBeQ, ML162, ML210, axitinib, alisertib, olaparib, PYR-41, GMX-1778, BMS-195614, and B52334 (negative correlation with IC50, p < 0.05; Figures 9A, B). This implied that the dysregulation of TMEM59L could lead to anti-tumor drug resistance.
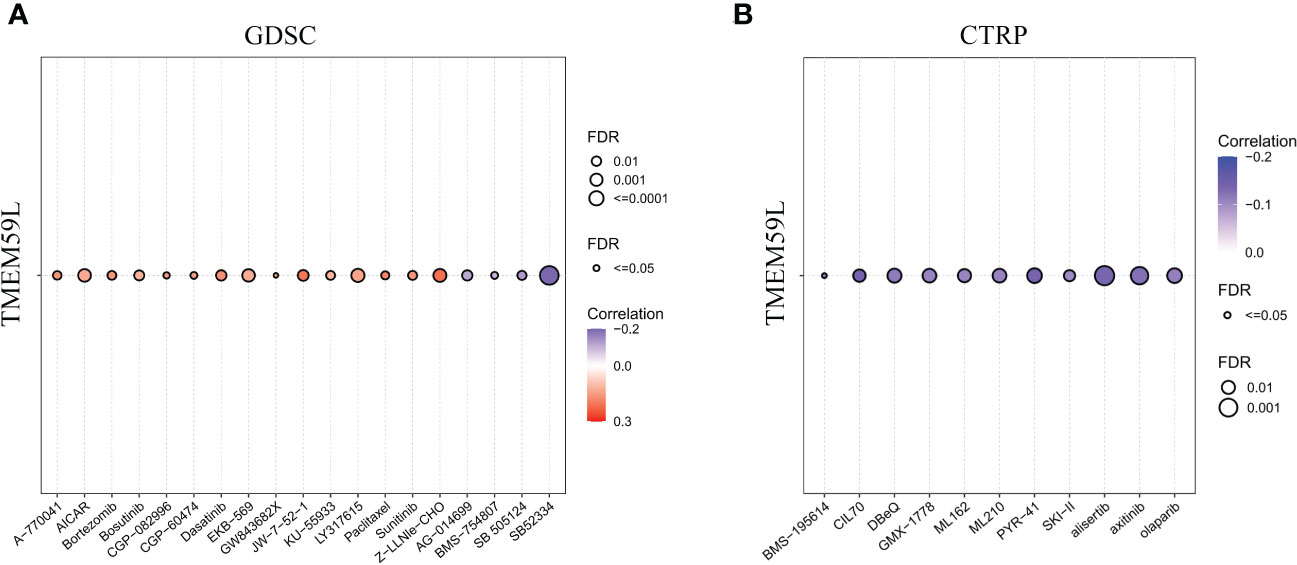
Figure 9 Drug sensitivity analysis. (A) The correlation between TMEM59L expression and the sensitivity of GDSC drugs in pan-cancer. (B) The correlation between TMEM59L expression and the sensitivity of CTRP drugs in pan-cancer. Blue bubbles represent negative correlations, red bubbles represent positive correlations, the deeper of color, the higher of the correlation. Bubble size is positively correlate with the FDR significance. Black outline border indicates FDR ≤ 0.05.
4. Discussion
Transmembrane proteins (TMEMs) are proteins that span the entirety of the cell membranes (63), and many of such proteins play an important role in cancer development and cancer cell dissemination (64, 65), by mediating signal transduction between the cytoplasmic proteins and extracellular environment (66). Therefore, TMEMs represent attractive drug targets for cancer therapy (64). TMEM59L is a newly discovered brain-specific membrane-anchored protein that has been reported to act as a pro-apoptotic protein (29, 31). TMEM59L downregulation protects neurons from oxidative stress (31). Recent studies have also shown that TMEM59L can also regulate autophagy-related biological processes (32). However, there is currently a dearth of systematic studies in the literature on the TMEM59L regulation of tumor pathophysiology across cancer types.
In the present research, we assessed the pan-cancer expression of TMEM59L and the correlation of dysregulation of TMEM59L expression with clinical outcome of patients. The results indicated that TMEM59L expression was altered in different types of cancer and associated with the clinical outcome of cancer patients. TMEM59L expression was evidently downregulated across most cancer types compared to its expression in the corresponding normal tissues. Further analysis demonstrated that distinct differences was observed in different clinical stages of several cancer types, such as KIRP, BLCA, COAD, and KIRC, where advanced tumor stage correlated with higher TMEM59L mRNA expression. Therefore, in these specific cancer types TMEM59L may serve as a tumor promoting factor. Additionally, survival analysis confirmed that TMEM59L was a risk factor in patients with KIRP, BLCA, COAD, and KIPAN (KIRC+KIRP+KICH).
The mechanism by which TMEM59L regulates tumorigenesis and cancer pathophysiology remains unclear, but the relationship we observed between TMEM59L and the hallmarks of cancer could improve our understanding of the functional roles of TMEM59L. GSEA analysis demonstrated that TMEM59L expression was strictly linked with hallmarks of malignancy and immune-related pathways in most cancers, such as EMT, P53, apoptosis, cell cycle, WNT, IL-6-JAK-STAT3, IL2-STAT5 and TGF-β signaling pathways.
Genetic and epigenetic changes play key roles in immune tolerance and cancer development (46). In our study, the abnormal hypermethylation of TMEM59L was associated with decreased mRNA levels and better clinical outcomes for several cancers, such as KIRP, KIRC, and COAD, suggesting that hypermethylation of TMEM59L gene may be key regulatory mechanism for TMEM59L expression in these cancers. Interestingly, in line with our previous findings, high TMEM59L expression were associated with poor prognosis in COAD, KIRC, and KIRP. Thus, we speculated that the epigenetic changes of TMEM59L gene may promote the occurrence of KIRC, KIRP, and COAD in some cases.
Tumor immunotherapy has made remarkable achievements in cancer treatment (67). Immune checkpoint blockade therapy has significantly prolonged the survival in many cancers typically associated with poor prognosis, such as melanoma and non-small cell lung cancer (68). However, immunotherapy is still only available for a subset of patients, and immunotherapy response rates vary widely across cancer types (69, 70). Our study found that in addition to regulating pathways involved in cancer progression, TMEM59L was also involved in immune regulatory pathways such as IL6-JAK-STAT3, IL2-STAT5, and TGF-β signaling. Correlation analysis showed that TMEM59L expression negatively correlated with activated CD4 T cells and CD8 T cells in most cancer types, and further IPS analysis also replicated the same trend; TMEM59L expression was negatively related to IPS score, AZ, and ECs, while being positively associated with SCs, indicating that TMEM59L could play a key role in the immunosuppressive microenvironment. At the same time, the close association of TMEM59L with most immunomodulators and immune checkpoints also implied that TMEM59L could predict the clinical response of patients to immune checkpoint blockade, and this was validated in the IMvigor210 cohort, as high expression of TMEM59L correlated with a worse clinical response to PD-L1 therapy. Taken together, all of the results presented above suggested that TMEM59L may exist in an ‘immune-excluded’ TME, consistent with higher stromal scores and activation of TGF-β signaling pathways. Despite the currently unclear role of TMEM59L in T cell suppression, our study indicated that TMEM59L could represent a potential novel immune target, and the application of anti-TMEM59L antibodies after other therapeutic interventions may be an effective therapeutic strategy.
The study bears few limitations. First, the bioinformatic analysis needs to be corroborated by experimental validation via immunostaining of the normal and tumor tissues. Then, mechanistic investigation is required to confirm the functional association between TMEM59L and cancer- and immune pathways, as well as the epigenetic regulation of TMEM59L expression in specific cancers.
In conclusion, by combining a multi-omics approach, we comprehensively explored TMEM59L gene expression signature, its prognostic value, as well as its association with immune cell infiltration and cancer-associated pathways in various cancer types. Our findings revealed that TMEM59L expression was correlated with poor prognosis across multiple tumor types, especially in COAD, KIRP, and KIRC. Moreover, our study also indicated that TMEM59L may represent a potential novel immune target and could play an immune-regulatory role in tumors. This study underscores the importance of TMEM59L as a prognostic biomarker and a treatment target and identified an area to be explored further in the future.
Data availability statement
The datasets presented in this study can be found in online repositories. The names of the repository/repositories and accession number(s) can be found in the article/Supplementary Material.
Author contributions
Conceptualization, CS, and LS; Data curation, analysis and validation, CS, LS, LZ, DC and HW, WQ, PZ, HG; Writing—original draft, CS, and LS; Writing—review and editing, CS, and LS. All authors contributed to the article and approved the submitted version.
Conflict of interest
The authors declare that the research was conducted in the absence of any commercial or financial relationships that could be construed as a potential conflict of interest.
Publisher’s note
All claims expressed in this article are solely those of the authors and do not necessarily represent those of their affiliated organizations, or those of the publisher, the editors and the reviewers. Any product that may be evaluated in this article, or claim that may be made by its manufacturer, is not guaranteed or endorsed by the publisher.
Supplementary material
The Supplementary Material for this article can be found online at: https://www.frontiersin.org/articles/10.3389/fimmu.2022.1054157/full#supplementary-material
Figure S1 | The expression of TMEM59L in normal and cancer tissues based on the HPA database. (A) The expression of TMEM59L in healthy tissues. (B) The expression of TMEM59L in human cancer tissues. (C) The representative IHC images of TMEM59L in colorectal and renal cancer based on HPA database .(Scale bar: 100 µm).
Figure S2 | The differences of EMT pathway activity between high and low TMEM59L mRNA expression in different types of cancer. (A) BRCA, (B) BLCA, (C) COAD, (D) ESCA, (E) READ, (F) OV, (G) TGCT, (H) THCA, (I) STAD.
Figure S3 | The single-cell RNA sequencing analysis exhibits the expression pattern as well as the signal pathway of TMEM59L. (A, B) The UMAP projection of all clusters and cell subpopulations. (C, D) TMEM59L expression from BRCA-GSE148673; (E) GSEA showed the the activity of the hallmark EMT pathways in different cells based on TISCH database; (F) GSEA showed the enriched upregulated hallmark pathways in different cells based on TISCH database.
Figure S4 | Correlations between TMEM59L and enrichment scores of cancer-associated pathways. (A) Correlations between TMEM59L and the enrichment scores of cancer-associated pathways. (B) Correlations between TMEM59L and the steps of the cancer immunity cycle. Solid lines represent a positive correlation, dashed lines represents a negative correlation, and the the colors represent significant P-values.
Figure S5 | The methylation difference between tumor and normal samples of TMEM59L in different human cancers. (A) BLCA, (B) KIRC, (C) KIRP, (D) UCEC, (E) LUSC, (F) LUAD, (G) THCA.
Figure S6 | The correlation between methylation and mRNA expression of TMEM59L in different human cancers. (A) BLCA, (B) BRCA, (C) COAD, (D) HNSC, (E) LUAD, (F) PAAD, (G) THCA, (H) UCEC.
References
1. Sung H, Ferlay J, Siegel RL, Laversanne M, Soerjomataram I, Jemal A, et al. Global cancer statistics 2020: GLOBOCAN estimates of incidence and mortality worldwide for 36 cancers in 185 countries. CA: A Cancer J Clin (2021) 71:209–49. doi: 10.3322/caac.21660
2. Cao W, Chen H, Yu Y, Li N, Chen W. Changing profiles of cancer burden worldwide and in China: a secondary analysis of the global cancer statistics 2020. Chin Med J (Engl) (2021) 134:783–91. doi: 10.1097/CM9.0000000000001474
3. Bray F, Laversanne M, Weiderpass E, Soerjomataram I. The ever-increasing importance of cancer as a leading cause of premature death worldwide. Cancer (2021) 127:3029–30. doi: 10.1002/cncr.33587
4. Malvezzi M, Carioli G, Bertuccio P, Negri E, La Vecchia C. Relation between mortality trends of cardiovascular diseases and selected cancers in the European union, in 1970–2017. focus on cohort and period effects. Eur J Cancer (2018) 103:341–55. doi: 10.1016/j.ejca.2018.06.018
5. Tahmasebi Birgani M, Carloni V. Data from: Tumor microenvironment, a paradigm in hepatocellular carcinoma progression and therapy. Int J Mol Sci (2017) 18(2):405. doi: 10.3390/ijms18020405
6. Zhang H, Grizzle WE. Exosomes: A novel pathway of local and distant intercellular communication that facilitates the growth and metastasis of neoplastic lesions. Am J Pathol (2014) 184:28–41. doi: 10.1016/j.ajpath.2013.09.027
7. Quail DF, Joyce JA. Microenvironmental regulation of tumor progression and metastasis. Nat Med (2013) 19:1423–37. doi: 10.1038/nm.3394
8. Catalano V, Turdo A, Di Franco S, Dieli F, Todaro M, Stassi G. Tumor and its microenvironment: A synergistic interplay. Semin Cancer Biol (2013) 23:522–32. doi: 10.1016/j.semcancer.2013.08.007
9. Roma-Rodrigues C, Mendes R, Baptista PV, Fernandes AR. Data from: Targeting tumor microenvironment for cancer therapy. Int J Mol Sci (2019) 20(4):840. doi: 10.3390/ijms20040840
10. Hanahan D, Coussens LM. Accessories to the crime: Functions of cells recruited to the tumor microenvironment. Cancer Cell (2012) 21:309–22. doi: 10.1016/j.ccr.2012.02.022
11. Hanahan D, Weinberg RA. Hallmarks of cancer: The next generation. Cell (2011) 144:646–74. doi: 10.1016/j.cell.2011.02.013
12. Lyssiotis CA, Kimmelman AC. Metabolic interactions in the tumor microenvironment. Trends Cell Biol (2017) 27:863–75. doi: 10.1016/j.tcb.2017.06.003
13. Govaert KM, Emmink BL, Nijkamp MW, Cheung ZJ, Steller EJA, Fatrai S, et al. Hypoxia after liver surgery imposes an aggressive cancer stem cell phenotype on residual tumor cells. Ann Surg (2014) 259(4):750–9. doi: 10.1097/SLA.0b013e318295c160
14. Stanta G, Bonin S. Overview on clinical relevance of intra-tumor heterogeneity. Front Med (Lausanne) (2018) 5:85. doi: 10.3389/fmed.2018.00085
15. Wang M, Zhao J, Zhang L, Wei F, Lian Y, Wu Y, et al. Role of tumor microenvironment in tumorigenesis. J Cancer (2017) 8:761–73. doi: 10.7150/jca.17648
16. Assaraf YG, Brozovic A, Gonçalves AC, Jurkovicova D, Linē A, Machuqueiro M, et al. The multi-factorial nature of clinical multidrug resistance in cancer. Drug Resist Update (2019) 46:100645. doi: 10.1016/j.drup.2019.100645
17. Leonetti A, Wever B, Mazzaschi G, Assaraf YG, Rolfo C, Quaini F, et al. Molecular basis and rationale for combining immune checkpoint inhibitors with chemotherapy in non-small cell lung cancer. Drug Resist Update (2019) 46:100644. doi: 10.1016/j.drup.2019.100644
18. Chen Y, Tan W, Wang C. Tumor-associated macrophage-derived cytokines enhance cancer stem-like characteristics through epithelial-mesenchymal transition. Onco Targets Ther (2018) 11:3817–26. doi: 10.2147/OTT.S168317
19. Colak S, Medema JP. Cancer stem cells – important players in tumor therapy resistance. FEBS J (2014) 281:4779–91. doi: 10.1111/febs.13023
20. Rycaj K, Tang DG. Cancer stem cells and radioresistance. Int J Radiat Biol (2014) 90:615–21. doi: 10.3109/09553002.2014.892227
21. Eppert K, Takenaka K, Lechman ER, Waldron L, Nilsson B, van Galen P, et al. Stem cell gene expression programs influence clinical outcome in human leukemia. Nat Med (2011) 17:1086–93. doi: 10.1038/nm.2415
22. Kim J, Joo H, Moon H, Lee Y. A case of amblyomma testudinarium tick bite in a Korean woman. Korean J Parasitol (2010) 48:313–17. doi: 10.3347/kjp.2010.48.4.313
23. Ben-Porath I, Thomson MW, Carey VJ, Ge R, Bell GW, Regev A, et al. An embryonic stem cell–like gene expression signature in poorly differentiated aggressive human tumors. Nat Genet (2008) 40:499–507. doi: 10.1038/ng.127
24. Kang G, Chen K, Yang F, Chuai S, Zhao H, Zhang K, et al. Monitoring of circulating tumor DNA and its aberrant methylation in the surveillance of surgical lung cancer patients: protocol for a prospective observational study. BMC Cancer (2019) 19:579. doi: 10.1186/s12885-019-5751-9
25. Sina AAI, Carrascosa LG, Liang Z, Grewal YS, Wardiana A, Shiddiky MJA, et al. Epigenetically reprogrammed methylation landscape drives the DNA self-assembly and serves as a universal cancer biomarker. Nat Commun (2018) 9:4915. doi: 10.1038/s41467-018-07214-w
26. Micevic G, Theodosakis N, Bosenberg M. Aberrant DNA methylation in melanoma: biomarker and therapeutic opportunities. Clin Epigenet (2017) 9:34. doi: 10.1186/s13148-017-0332-8
27. Nakaoka T, Saito Y, Saito H. Data from: Aberrant DNA methylation as a biomarker and a therapeutic target of cholangiocarcinoma. Int J Mol Sci (2017) 18(6):1111. doi: 10.3390/ijms18061111
28. Elson GCA, de Coignac AB, Aubry J, Delneste Y, Magistrelli G, Holzwarth J, et al. BSMAP, a novel protein expressed specifically in the brain whose gene is localized on chromosome 19p12. Biochem Biophys Res Commun (1999) 264:55–62. doi: 10.1006/bbrc.1999.1481
29. Mannherz O, Mertens D, Hahn M, Lichter P. Functional screening for proapoptotic genes by reverse transfection cell array technology. Genomics (2006) 87:665–72. doi: 10.1016/j.ygeno.2005.12.009
30. Ullrich S, Münch A, Neumann S, Kremmer E, Tatzelt J, Lichtenthaler SF. The novel membrane protein TMEM59 modulates complex glycosylation, cell surface expression, and secretion of the amyloid precursor protein. J Biol Chem (2010) 285:20664–74. doi: 10.1074/jbc.M109.055608
31. Zheng Q, Zheng X, Zhang L, Luo H, Qian L, Fu X, et al. The neuron-specific protein TMEM59L mediates oxidative stress-induced cell death. Mol Neurobiol (2017) 54:4189–200. doi: 10.1007/s12035-016-9997-9
32. Boada-Romero E, Letek M, Fleischer A, Pallauf K, Ramón-Barros C, Pimentel-Muiños FX. TMEM59 defines a novel ATG16L1-binding motif that promotes local activation of LC3. EMBO J (2013) 32:566–82. doi: 10.1038/emboj.2013.8
33. Bakulski KM, Dolinoy DC, Sartor MA, Paulson HL, Konen JR, Lieberman AP, et al. Genome-wide DNA methylation differences between late-onset alzheimer's disease and cognitively normal controls in human frontal cortex. J Alzheimer's Dis (2012) 29:571–88. doi: 10.3233/JAD-2012-111223
34. Hänzelmann S, Castelo R, Guinney J. GSVA: gene set variation analysis for microarray and RNA-seq data. BMC Bioinf (2013) 14:7. doi: 10.1186/1471-2105-14-7
35. Newman AM, Liu CL, Green MR, Gentles AJ, Feng W, Xu Y, et al. Robust enumeration of cell subsets from tissue expression profiles. Nat Methods (2015) 12:453–57. doi: 10.1038/nmeth.3337
36. Yoshihara K, Shahmoradgoli M, Martínez E, Vegesna R, Kim H, Torres-Garcia W, et al. Inferring tumour purity and stromal and immune cell admixture from expression data. Nat Commun (2013) 4:2612. doi: 10.1038/ncomms3612
37. Charoentong P, Finotello F, Angelova M, Mayer C, Efremova M, Rieder D, et al. Pan-cancer immunogenomic analyses reveal genotype-immunophenotype relationships and predictors of response to checkpoint blockade. Cell Rep (2017) 18:248–62. doi: 10.1016/j.celrep.2016.12.019
38. Yang W, Soares J, Greninger P, Edelman EJ, Lightfoot H, Forbes S, et al. Genomics of drug sensitivity in cancer (GDSC): a resource for therapeutic biomarker discovery in cancer cells. Nucleic Acids Res (2013) 41:D955–61. doi: 10.1093/nar/gks1111
39. Basu A, Bodycombe NE, Cheah JH, Price EV, Liu K, Schaefer GI, et al. An interactive resource to identify cancer genetic and lineage dependencies targeted by small molecules. Cell (2013) 154:1151–61. doi: 10.1016/j.cell.2013.08.003
40. Niu Z, Shi Q, Zhang W, Shu Y, Yang N, Chen B, et al. Caspase-1 cleaves PPAR纬 for potentiating the pro-tumor action of TAMs. Nat Commun (2017) 8:766. doi: 10.1038/s41467-017-00523-6
41. Fiaschi T, Marini A, Giannoni E, Taddei ML, Gandellini P, De Donatis A, et al. Reciprocal metabolic reprogramming through lactate shuttle coordinately influences tumor-stroma interplay. Cancer Res (2012) 72:5130–40. doi: 10.1158/0008-5472.CAN-12-1949
42. Giannoni E, Bianchini F, Masieri L, Serni S, Torre E, Calorini L, et al. Reciprocal activation of prostate cancer cells and cancer-associated fibroblasts stimulates epithelial-mesenchymal transition and cancer stemness. Cancer Res (2010) 70:6945–56. doi: 10.1158/0008-5472.CAN-10-0785
43. Hu J, Yu A, Othmane B, Qiu D, Li H, Li C, et al. Siglec15 shapes a non-inflamed tumor microenvironment and predicts the molecular subtype in bladder cancer. Theranostics (2021) 11:3089–108. doi: 10.7150/thno.53649
44. Chen DS, Mellman I. Oncology meets immunology: the cancer-immunity cycle. Immunity (2013) 39:1–10. doi: 10.1016/j.immuni.2013.07.012
45. Xu L, Deng C, Pang B, Zhang X, Liu W, Liao G, et al. TIP: A web server for resolving tumor immunophenotype profiling. Cancer Res (2018) 78:6575–80. doi: 10.1158/0008-5472.CAN-18-0689
46. Li B, Zhang B, Wang X, Zeng Z, Huang Z, Zhang L, et al. Expression signature, prognosis value, and immune characteristics of siglec-15 identified by pan-cancer analysis. Oncoimmunology (2020) 9:1807291. doi: 10.1080/2162402X.2020.1807291
47. Shibue T, Weinberg RA. EMT, CSCs, and drug resistance: the mechanistic link and clinical implications. Nat Rev Clin Oncol (2017) 14:611–29. doi: 10.1038/nrclinonc.2017.44
48. Seguin L, Desgrosellier JS, Weis SM, Cheresh DA. Integrins and cancer: regulators of cancer stemness, metastasis, and drug resistance. Trends Cell Biol (2015) 25:234–40. doi: 10.1016/j.tcb.2014.12.006
49. Zhang C, Chen T, Li Z, Liu A, Xu Y, Gao Y, et al. Depiction of tumor stemlike features and underlying relationships with hazard immune infiltrations based on large prostate cancer cohorts. Brief Bioinform (2021) 22:a211. doi: 10.1093/bib/bbaa211
50. Malta TM, Sokolov A, Gentles AJ, Burzykowski T, Poisson L, Weinstein JN, et al. Machine learning identifies stemness features associated with oncogenic dedifferentiation. Cell (2018) 173:338–54. doi: 10.1016/j.cell.2018.03.034
51. Friedmann-Morvinski D, Verma IM. Dedifferentiation and reprogramming: origins of cancer stem cells. EMBO Rep (2014) 15:244–53. doi: 10.1002/embr.201338254
52. Valieris R, Amaro L, Osório C, Bueno AP, Rosales MR, Carraro DM, et al. Deep learning predicts underlying features on pathology images with therapeutic relevance for breast and gastric cancer. Cancers (Basel) (2020) 12:3687. doi: 10.3390/cancers12123687
53. Moynahan ME, Jasin M. Mitotic homologous recombination maintains genomic stability and suppresses tumorigenesis. Nat Rev Mol Cell Biol (2010) 11:196–207. doi: 10.1038/nrm2851
54. Konstantinopoulos PA, Waggoner S, Vidal GA, Mita M, Moroney JW, Holloway R, et al. Single-arm phases 1 and 2 trial of niraparib in combination with pembrolizumab in patients with recurrent platinum-resistant ovarian carcinoma. JAMA Oncol (2019) 5:1141–49. doi: 10.1001/jamaoncol.2019.1048
55. Hoppe MM, Sundar R, Tan DSP, Jeyasekharan AD. Biomarkers for homologous recombination deficiency in cancer. JNCI: J Natl Cancer Institute (2018) 110:704–13. doi: 10.1093/jnci/djy085
56. Heeke AL, Baker T, Lynce F, Pishvaian MJ, Isaacs C. Prevalence of homologous recombination deficiency among all tumor types. J Clin Oncol (2017) 35:1502. doi: 10.1200/JCO.2017.35.15_suppl.1502
57. Sharma P, Barlow WE, Godwin AK, Pathak H, Isakova K, Williams D, et al. Impact of homologous recombination deficiency biomarkers on outcomes in patients with triple-negative breast cancer treated with adjuvant doxorubicin and cyclophosphamide (SWOG S9313). Ann Oncol (2018) 29:654–60. doi: 10.1093/annonc/mdx821
58. McGranahan N, Furness AJ, Rosenthal R, Ramskov S, Lyngaa R, Saini SK, et al. Clonal neoantigens elicit T cell immunoreactivity and sensitivity to immune checkpoint blockade. Science (2016) 351:1463–69. doi: 10.1126/science.aaf1490
59. Van Allen EM, Miao D, Schilling B, Shukla SA, Blank C, Zimmer L, et al. Genomic correlates of response to CTLA-4 blockade in metastatic melanoma. Science (2015) 350:207–11. doi: 10.1126/science.aad0095
60. Rizvi NA, Hellmann MD, Snyder A, Kvistborg P, Makarov V, Havel JJ, et al. Cancer immunology. mutational landscape determines sensitivity to PD-1 blockade in non-small cell lung cancer. Science (2015) 348:124–28. doi: 10.1126/science.aaa1348
61. Yap TA, Gerlinger M, Futreal PA, Pusztai L, Swanton C. Intratumor heterogeneity: seeing the wood for the trees. Sci Transl Med (2012) 4:110p–27p. doi: 10.1126/scitranslmed.3003854
62. Yang C, Huang X, Li Y, Chen J, Lv Y, Dai S. Prognosis and personalized treatment prediction in TP53-mutant hepatocellular carcinoma: an in silico strategy towards precision oncology. Brief Bioinform (2021) 22:a164. doi: 10.1093/bib/bbaa164
63. Zhang S, Dai H, Li W, Wang R, Wu H, Shen M, et al. TMEM116 is required for lung cancer cell motility and metastasis through PDK1 signaling pathway. Cell Death Dis (2021) 12:1086. doi: 10.1038/s41419-021-04369-1
64. Schmit K, Michiels C. TMEM proteins in cancer: A review. Front Pharmacol (2018) 9:1345. doi: 10.3389/fphar.2018.01345
65. Li B, Huang MZ, Wang XQ, Tao BB, Zhong J, Wang XH, et al. Erratum: TMEM140 is associated with the prognosis of glioma by promoting cell viability and invasion. J Hematol Oncol (2015) 8:101. doi: 10.1186/s13045-015-0199-0
66. Marx S, Dal Maso T, Chen J, Bury M, Wouters J, Michiels C, et al. Transmembrane (TMEM) protein family members: Poorly characterized even if essential for the metastatic process. Semin Cancer Biol (2020) 60:96–106. doi: 10.1016/j.semcancer.2019.08.018
67. Salmon H, Remark R, Gnjatic S, Merad M. Host tissue determinants of tumour immunity. Nat Rev Cancer (2019) 19:215–27. doi: 10.1038/s41568-019-0125-9
68. Cogdill AP, Andrews MC, Wargo JA. Hallmarks of response to immune checkpoint blockade. Br J Cancer (2017) 117:1–07. doi: 10.1038/bjc.2017.136
69. Pan C, Liu H, Robins E, Song W, Liu D, Li Z, et al. Next-generation immuno-oncology agents: current momentum shifts in cancer immunotherapy. J Hematol Oncol (2020) 13:29. doi: 10.1186/s13045-020-00862-w
Keywords: TMEM59L, pan-cancer, prognosis, tumor microenvironment, methylation
Citation: Shi C, Zhang L, Chen D, Wei H, Qi W, Zhang P, Guo H and Sun L (2022) Prognostic value of TMEM59L and its genomic and immunological characteristics in cancer. Front. Immunol. 13:1054157. doi: 10.3389/fimmu.2022.1054157
Received: 26 September 2022; Accepted: 12 December 2022;
Published: 23 December 2022.
Edited by:
Junjiang Fu, Southwest Medical University, ChinaReviewed by:
Angela Rita Elia, Institute of Oncology Research (IOR), SwitzerlandVinit C. Shanbhag, University of Missouri, United States
Copyright © 2022 Shi, Zhang, Chen, Wei, Qi, Zhang, Guo and Sun. This is an open-access article distributed under the terms of the Creative Commons Attribution License (CC BY). The use, distribution or reproduction in other forums is permitted, provided the original author(s) and the copyright owner(s) are credited and that the original publication in this journal is cited, in accordance with accepted academic practice. No use, distribution or reproduction is permitted which does not comply with these terms.
*Correspondence: Lei Sun, bGVpc3VuQGRtdS5lZHUuY24=
 Chang Shi
 Lizhi Zhang2
 Dan Chen
 Pengxin Zhang