 Shiyu Bai1,2†
 Qielan Wu1,2†
 Shasha Zhu3
 Yuwei Zhang1,2Xuran Chen1,2Miya Su1,2Jun Pan1,2Shuhang Li1,2Ting Yue4
 Linfeng Xu4Di Xie1,2Chenxi Tian1,2Dan Zhao2
 Xiang Li1,2Junjie Hou5Lu Wang6Sicheng Fu1,2Yanhong Xue5Amin Jiang5
 Dong Li5Tao Xu5
 Zhigang Tian1,2,4
 Rongbin Zhou1,2,4
 Huimin Zhang1,2*
 Li Bai1,2,4,7,8*‡
- 1Department of Oncology of the First Affiliated Hospital, The CAS Key Laboratory of Innate Immunity and Chronic Disease, Division of Life Sciences and Medicine, University of Science and Technology of China, Hefei, China
- 2School of Basic Medical Sciences, Division of Life Sciences and Medicine, University of Science and Technology of China, Hefei, China
- 3Reproductive Medicine Center, Department of Obstetrics and Gynecology, The First Affiliated Hospital of Anhui Medical University, Hefei, China
- 4Biomedical Sciences and Health Laboratory of Anhui Province, Division of Life Sciences and Medicine, University of Science and Technology of China, Hefei, China
- 5Institute of Biophysics, Chinese Academy of Sciences, Beijing, China
- 6Institute of Molecular Medicine, Renji Hospital, School of Medicine, Shanghai Jiao Tong University, Shanghai, China
- 7Institute of Health and Medicine, Hefei Comprehensive National Science Center, Hefei, China
- 8National Synchrotron Radiation Laboratory, University of Science and Technology of China, Hefei, China
Activation of mTORC1 is essential for anti-tumor function of iNKT cells. The mechanisms underlying impaired mTORC1 activation in intratumoral iNKT cells remain unclear. Via generating Vam6+/- mice and using flow cytometry, image approach, and RNA sequencing, we studied the role of Vam6 in controlling mTORC1 activation and intratumoral iNKT cell functions. Here, we find that increased Vam6 expression in intratumoral iNKT cells leads to impaired mTORC1 activation and IFN-γ production. Mechanistically, Vam6 in iNKT cells is essential for Rab7a-Vam6-AMPK complex formation and thus for recruitment of AMPK to lysosome to activate AMPK, a negative regulator of mTORC1. Additionally, Vam6 relieves inhibitory effect of VDAC1 on Rab7a-Vam6-AMPK complex formation at mitochondria-lysosome contact site. Moreover, we report that lactic acid produced by tumor cells increases Vam6 expression in iNKT cells. Given the key roles of increased Vam6 in promoting AMPK activation in intratumoral iNKT cells, reducing Vam6 expression signifificantly enhances the mTORC1 activation in intratumoral iNKT cells as well as their anti-tumor effificacy. Together, we propose Vam6 as a target for iNKT cell-based immunotherapy.
Introduction
Invariant natural killer T (iNKT) cells are innate-like T cells which express semi-invariant TCR and recognize lipid antigens presented by CD1d (1). Upon activation, iNKT cells produce both Th1 and Th2 cytokines and mediate cytotoxicity as well. These cells bridge the innate immunity and adaptive immunity (2), and are great candidates for immunotherapy against tumors, given their direct and indirect tumor killing effects and low risk of inducing cytokine storm and graft versus host disease (3). However, dysfunction of intratumoral iNKT cells has been reported to hinder their anti-tumor effects, and that is attributed to impaired activation of mTORC1 (4, 5). Previous studies have reported an essential role of mTOR pathway in functions of iNKT cells (6, 7). To date, the mechanisms underlying impaired mTORC1 activation in intratumoral iNKT cells are largely unknown.
Lysosomal proteins, lysosomal location of mTOR, and lysosome function are essential for mTORC1 activation (8). AMPK that inhibits mTORC1 activation also locates at lysosome, and its activity is controlled by lysosome related proteins (9). These findings indicate lysosome as a crucial hub for regulating mTORC1 pathway (10). Vam6 (also named Vps39), a key member of the homotypic fusion and vacuole protein sorting complex that controls tethering and fusion of lysosome with intracellular compartments (11), has been shown to regulate mTOR pathway in myoblast and senescent T cells (12, 13). However, opposite roles of Vam6 have been indicated by those two studies, and the molecular mechanisms that link Vam6 to mTOR pathway are still unknown. Whether and how Vam6 regulates mTORC1 activity and contributes to dysfunction of intratumoral iNKT cells remain to be explored.
Here, we found that Vam6 promoted AMPK activation and consequently inhibited mTORC1 activation and IFN-γ production in iNKT cells via forming Rab7a-Vam6-AMPK complex and recruiting AMPK to lysosome. VDAC1 interacting with Rab7a at mitochondria-lysosome contact site interfered with Rab7a-Vam6-AMPK complex formation and inhibited AMPK activation, demonstrating a negative control of this signal pathway at mitochondria-lysosome contact site. Notably, Vam6 inhibited Rab7a-VDAC1 interaction and relieved the inhibitory effect of VDAC1 on Rab7a-Vam6-AMPK complex formation. Our data propose dual roles of Vam6 in promoting AMPK activation. Moreover, we showed that lactic acid-induced increase of Vam6 expression in intratumoral iNKT cells led to increased AMPK activation, diminished mTORC1 activation, and impaired IFN-γ production. Reducing Vam6 expression, on the contrary, successfully restored function of intratumoral iNKT cells and enhanced their anti-tumor efficacy in mouse tumor models. Our data suggest that Vam6 could be a target for iNKT cell-based anti-tumor immunotherapy.
Material and methods
Mice
Vam6+/−, Vdac1+/−, and Vdac1−/− mice were generated using CRISPR/Cas9. Vα14 Tg mice were gifts from Dr. Albert Bendelac. Mice used in our experiments were 6-12 weeks old and cohoused littermates, and were on C57BL/6J background and maintained under specific pathogen-free conditions. To generate chimeric mice, bone marrow cells isolated from CD45.1 Vam6+/+ mice and CD45.2 Vam6+/- mice were mixed at 1:1 ratio (1 × 10⁶) and then were intravenously injected into irradiated Jα18-/- recipient mice (10 Gy) for 7 weeks. To activate iNKT cells in vivo, mice were intraperitoneally injected with 2 μg α-GC for 4 hours. Animal procedures were approved by the Animal Care and Use Committee of University of Science and Technology of China, and all experiments were performed in accordance with the approved guidelines.
Mouse tumor models
Mice were subcutaneously injected with B16F10 tumor cells (5 × 10⁵) on day 0. Tumor bearing mice were then paratumorally injected with PBS or expanded Vam6+/+ iNKT cells (5 × 10⁶) or expanded Vam6+/- iNKT cells (5 × 10⁶) on day 12. Tumor size was measured by vernier caliper every 2 days and tumor volume was calculated as length × width2 × 0.52. In lung metastasis models, B16F10 cells (5 × 10⁴) were intravenously injected into mice on day 0. After 24 hours, PBS or expanded Vam6+/− iNKT cells (1 × 10⁶) or expanded Vam6+/+ iNKT cells (1 × 10⁶) were intraperitoneally injected into these B16F10-transfered mice. On day 19 or 21, tumor-bearing mice were sacrificed for analysis of lung metastasis. To investigate the functions of lymphocytes in tumors or in lungs of metastasis models after iNKT cell transfer, Jα18-/- tumor-bearing mice were injected intraperitoneally with PBS or 2 μg α-GC for 4 hours, 2 days post transfer of expanded Vam6+/+ or Vam6+/- iNKT cells. Tumor-bearing animals were euthanized if they exhibited signs of distress or the tumor reached a diameter of 1.60 cm.
Cell stimulation and expansion
To measure the cytokine production in supernatants, iNKT cells from livers of Vam6+/+ or Vam6+/- mice were isolated as TCRβ+ CD1d-PBS57 tetramer+ cells by a BD influx cell sorter (BD FACSAriaIII, Franklin Lakes, US). Cells were stimulated with or without plate-coated 2 μg/mL CD1d-PBS57 tetramer for 48 hours, and cytokines in supernatants were measured using cytometric bead array kit (BD, 558296 and BD, 558298). To measure the intracellular cytokines, activation of AMPK and mTORC1, cell proliferation and apoptosis, magnetic beads (Miltenyi Biotec, Bergisch Gladbach, Germany)-enriched splenic iNKT cells were stimulated with plate-coated 4 μg/mL anti-CD3 plus 4 μg/mL anti-CD28 antibodies for 4 hours, or with 2 μg/mL CD1d-PBS57 tetramer for 18 hours, or with 1 μg/mL anti-CD3 plus 1 μg/mL anti-CD28 antibodies for 18 hours in vitro. To inhibit or activate AMPK, 10 nM Compound C (Selleck, Sylvanfield, US) or 200 μM AICAR (Sigma, St. Louis, US) was added to cells in the last 30 minutes. To inhibit mTORC1, 100 μM rapamycin (Sigma, St. Louis, US) was added to cells in the last 30 minutes. To expand iNKT cells in vitro, spleen cells from Vα14 Tg/Vam6+/− mice or Vα14 Tg/Vam6+/+ mice were stimulated with 100 ng/mL α-GC for 3 days in the presence of 200 IU/mL IL-2, and then were cultured for another 4 to 7 days in the presence of IL-2, the purity of iNKT cells was about 80%.
Sequence alignment and analysis
cDNA library was sequenced using the Illumina sequencing platform (NovaSeq6000). The size of the library was ~300 bp, and both ends of the library were sequenced to a length of 100 bp. The raw reads were cleaned by removing adaptor sequences, short sequences (length < 35 bp), low-quality bases (quality < 20). and ambiguous sequences (i.e., reads with more than two unknown bases ‘N’). We used Hisat2 (version:2.0.4) to map the cleaned RNA-seq reads to the mouse mm10 genome, with two mismatches, two gaps, and one multihit allowed. After genome mapping, Stringtie (version:1.3.0) was used to quantify gene expression. The gene expression value was normalized by FPKM and adjusted by a geometric algorithm. The accession number for the RNA-seq data is the National Center for Biotechnology Information Sequence Read Archive (NCBI SRA): SUB12104972.
Cell transfection
To knock down Vam6 in NIH-3T3 cells, we generated lentiviruses carrying the shVam6 sequences (Sigma, St. Louis, US). The lentivirus-containing media were collected and added to NIH-3T3 cells for 48 hours to knock down Vam6 in the presence of 6 μg/mL Polybrene (Sigma-Aldrich, St. Louis, US). To restore expression of Vam6 or its truncated mutants in Vam6 knockdown NIH-3T3 cells, lentiviruses carrying mCherry-Vam6, mCherry-ΔCT, mCherry-ΔCLH, mCherry-ΔCNH, and mCheery as control were packaged in 293T cells and were used to transduce target genes, respectively.
PLA
After surface staining of CD1d-PBS57 tetramer, enriched iNKT cells were fixed, permeabilized, and blocked, followed by intracellular staining with primary antibodies against Tom20 (CST, Danvers, US) and LAMP2 (Thermo Fisher, Waltham, US), against VDAC1 (Abcam, Cambridge, UK) and Rab7a (Sigma, St. Louis, US), against AMPKγ (Invitrogen, Carlsbad, US) and Rab7a (Sigma, St. Louis, US), against Vam6 (Thermo Fisher, Waltham, US) and Rab7a (Sigma, St. Louis, US), and against Vam6 (Thermo Fisher, Waltham, US) and AMPKγ3 (Invitrogen, Carlsbad, US), respectively. As negative controls, cells were stained with rabbit IgG (Invitrogen, Carlsbad, US) and mouse IgG2b (Invitrogen, Carlsbad, US), or stained with rabbit IgG (Invitrogen, Carlsbad, US) and mouse IgG1 (biolegend, San Diego, US). After washing, cells were stained with PLA detection reagents according to the manufacturer’s instructions (Duolink, Sigma). For colocalization analysis, cells were incubated with 500 nM Mitotracker Deep Red (Thermo Fisher, Waltham, US) for 30 minutes at 37 °C before surface staining, or stained with antibody against LAMP2 (eBioscience, San Diego, US) after PLA staining. PLA puncta in CD1d-PBS57 tetramer+ cells were detected by confocal microscope (ZEISS LSM980, Oberkochen, Germany) with a 40/63/100 × oil objective or ImageStreamX imaging flow cytometry (Merck Millipore, Burlington, US) with 40 × magnification. Images were analyzed with ImageJ software (Fiji) or with IDEAS software.
Antibodies and flow cytometry
After blocking with anti-CD16/32 (Biolegend, San Diego, US), cells were stained with antibodies against surface molecules. For intracellular staining, cells were fixed and permeabilized with foxp3 staining buffer kit (eBioscience, San Diego, US) after surface staining, followed by staining with antibodies against intracellular molecules. Fluorophore-conjugated or unconjugated antibodies included anti-TCRβ (Biolegend, San Diego, US), anti-PLZF (Biolegend, San Diego, US), anti-RORγt (Biolegend, San Diego, US), anti-CD24 (Biolegend, San Diego, US), anti-Granzyme B (Biolegend, San Diego, US), anti-IFN-γ (Biolegend, San Diego, US), anti-IL-4 (Biolegend, San Diego, US), anti-CD45.1 (Biolegend, San Diego, US), anti-CD45.2 (Biolegend, San Diego, US), anti-B220 (Biolegend, San Diego, US), anti-Bcl2 (Biolegend, San Diego, US), anti-p-S6S235/236 (CST, Danvers, US), anti-AMPKα (Abcam, Cambridge, UK), anti-p-AMPKα (Invitrogen, Carlsbad, US), anti-Vam6 (Thermo Fisher, Waltham, US), anti-VDAC1 (Abcam, Cambridge, UK), anti-Rab7a (NewEast, Kelayres, US), anti-LAMP2 (Invitrogen, Carlsbad, US), and anti-Ki67 (BD Pharmingen, San Diego, US). Apoptosis was measured using Annexin V apoptosis detection kit with PI (Biolegend, San Diego, US). CD1d-PBS57 tetramer was provided by the NIH Tetramer Core Facility. Secondary antibodies included donkey-anti-rabbit IgG-PE (Biolegend, San Diego, US) and goat-anti-rabbit IgG-FITC (Jackson Immunoresearch). Isotype controls included BV510 rat IgG1 (Biolegend, 400435), BV421 rat IgG1 (Biolegend, San Diego, US), PE mouse IgG1 (Biolegend, San Diego, US), rabbit IgG (Invitrogen, Carlsbad, US), Alexa Fluor 488 rabbit IgG (CST, Danvers, US), and APC rat IgG2a (eBioscience, San Diego, US). Samples were acquired with a BD FACSVerse flow cytometry, and data were analyzed with FlowJo software (TreeStar).
Co-immunoprecipitation and immunoblotting
Antibodies were incubated with Dynabeads protein G (Invitrogen, Carlsbad, US) at 4°C for at least 30 minutes. Cells were lysed in NP-40 buffer (Beyotime, Shanghai, China) supplemented with protease inhibitor cocktail (Thermo Fisher, Waltham, US). Cell lysate was incubated with antibody-coated beads at 4 °C overnight. Antibodies used for immunoblotting and co-immunoprecipitation included anti-Vam6 (Thermo Fisher, Waltham, US), anti-VDAC1 (Abcam, Cambridge, UK), anti-Rab7a (NewEast, Kelayres, US), anti-AMPKγ (Invitrogen, Carlsbad, US), anti-mCherry (Invitrogen, Carlsbad, US), anti-β-actin (Proteintech, Chicago, US), and rabbit IgG isotype ctrl (Invitrogen, Carlsbad, US). HRP-conjugated secondary antibodies included mouse-anti-rabbit IgG light chain (CST, Danvers, US), goat-anti-mouse IgG (H+L) (Proteintech, Chicago, US), and goat-anti-rabbit IgG (H+L) (Proteintech, Chicago, US). Antibodies and isotype controls used in co-immunoprecipitation experiments were at 1 μg/mL, and antibodies for immunoblotting were used at 1:1000 dilution unless other described.
Statistical analysis
Statistical analyses were performed with two-tailed unpaired Student’s t-test, Mann-Whitney test, Wilcoxon matched-pairs signed rank test, two-way ANOVA, Pearson correlation, and log-rank (Mantel-Cox) test, using GraphPad Prism software. Colocalization analyses were performed with ImageJ software (Fiji). *P<0.05, **P<0.01, ***P<0.001, and ****P<0.0001 were considered statistically significant. ns, not significant.
Results
Vam6 upregulation inhibits function of intratumoral iNKT cells
Previous study has reported dysfunction of intratumoral iNKT cells (4), but the underlying mechanisms remain unclear. We found that intratumoral iNKT cells expressed higher level of Vam6 than iNKT cells from normal tissues, such as livers and spleens (Figure 1A), and Vam6 expression in intratumoral iNKT cells was negatively correlated with their IFN-γ production in response to α-GC injection (Figure 1B). Next, we investigated whether the upregulated Vam6 influenced iNKT cell function in tumors. Since Vam6-/- homozygous mice were embryonically lethal (12), we generated Vam6+/- mice and confirmed reduction of Vam6 expression in these animals using splenic Vam6+/- T cells (Supplementary Figure 1A). Reducing Vam6 expression in Vam6+/- mice did not influence the frequencies of iNKT cells in thymuses, spleens, and livers (Supplementary Figures 1B, C). The absolute numbers of thymic and splenic iNKT cells were normal in Vam6+/- mice, despite the slightly elevated numbers of hepatic iNKT cells (Supplementary Figure 1C). Moreover, the proportions of thymic iNKT1/2/17 subsets were not influenced by reducing Vam6 expression (Supplementary Figure 1D). These results demonstrate normal iNKT cell development in Vam6+/- mice. To study the influence of reduced Vam6 expression on iNKT cell function, we sorted iNKT cells from livers of Vam6+/- mice and Vam6+/+ mice, respectively, and activated them with CD1d-PBS57 tetramer in vitro. Upon activation, Vam6+/- iNKT cells produced more IFN-γ and IL-4 in supernatants than Vam6+/+ iNKT cells did (Figure 1C). Again, the level of CD1d-PBS57 tetramer-induced intracellular IFN-γ was negatively correlated with the level of Vam6 in Vam6+/- iNKT cells and Vam6+/+ iNKT cells (Figure 1D). Additionally, Vam6+/- iNKT cells expressed higher level of anti-apoptosis protein Bcl-2 (Figure 1E), exhibited lower apoptosis (Figure 1F) but higher proliferation (Figure 1G). To confirm the role of Vam6 in controlling iNKT cell function in vivo, we measured the intracellular cytokines, 4 hours after injecting lipid antigen α-galactosylceramide (α-GC) into lethally irradiated iNKT-deficient Jα18-/- mice that received CD45.2+ Vam6+/- bone marrows mixed with CD45.1+ Vam6+/+ bone marrows at a ratio of 1:1 (Figure 1H). Consistently, reduced expression of Vam6 did not influence the development of iNKT cells in these chimeric mice, and CD45.2+ Vam6+/- iNKT cells exhibited higher levels of IFN-γ and IL-4 production than CD45.1+ Vam6+/+ iNKT cells did (Figures 1H, I). To prove that increased Vam6 led to impaired iNKT cell functions in tumors, we generated B16F10 tumor-bearing Jα18-/- chimeric mice, in which we found that those intratumoral iNKT cells with reduced Vam6 expression produced more IFN-γ and IL-4 in response to α-GC injection, despite their normal granzyme B production (Figures 1J, K). Together, our data demonstrate that the upregulation of Vam6 leads to iNKT cell dysfunction in tumors.
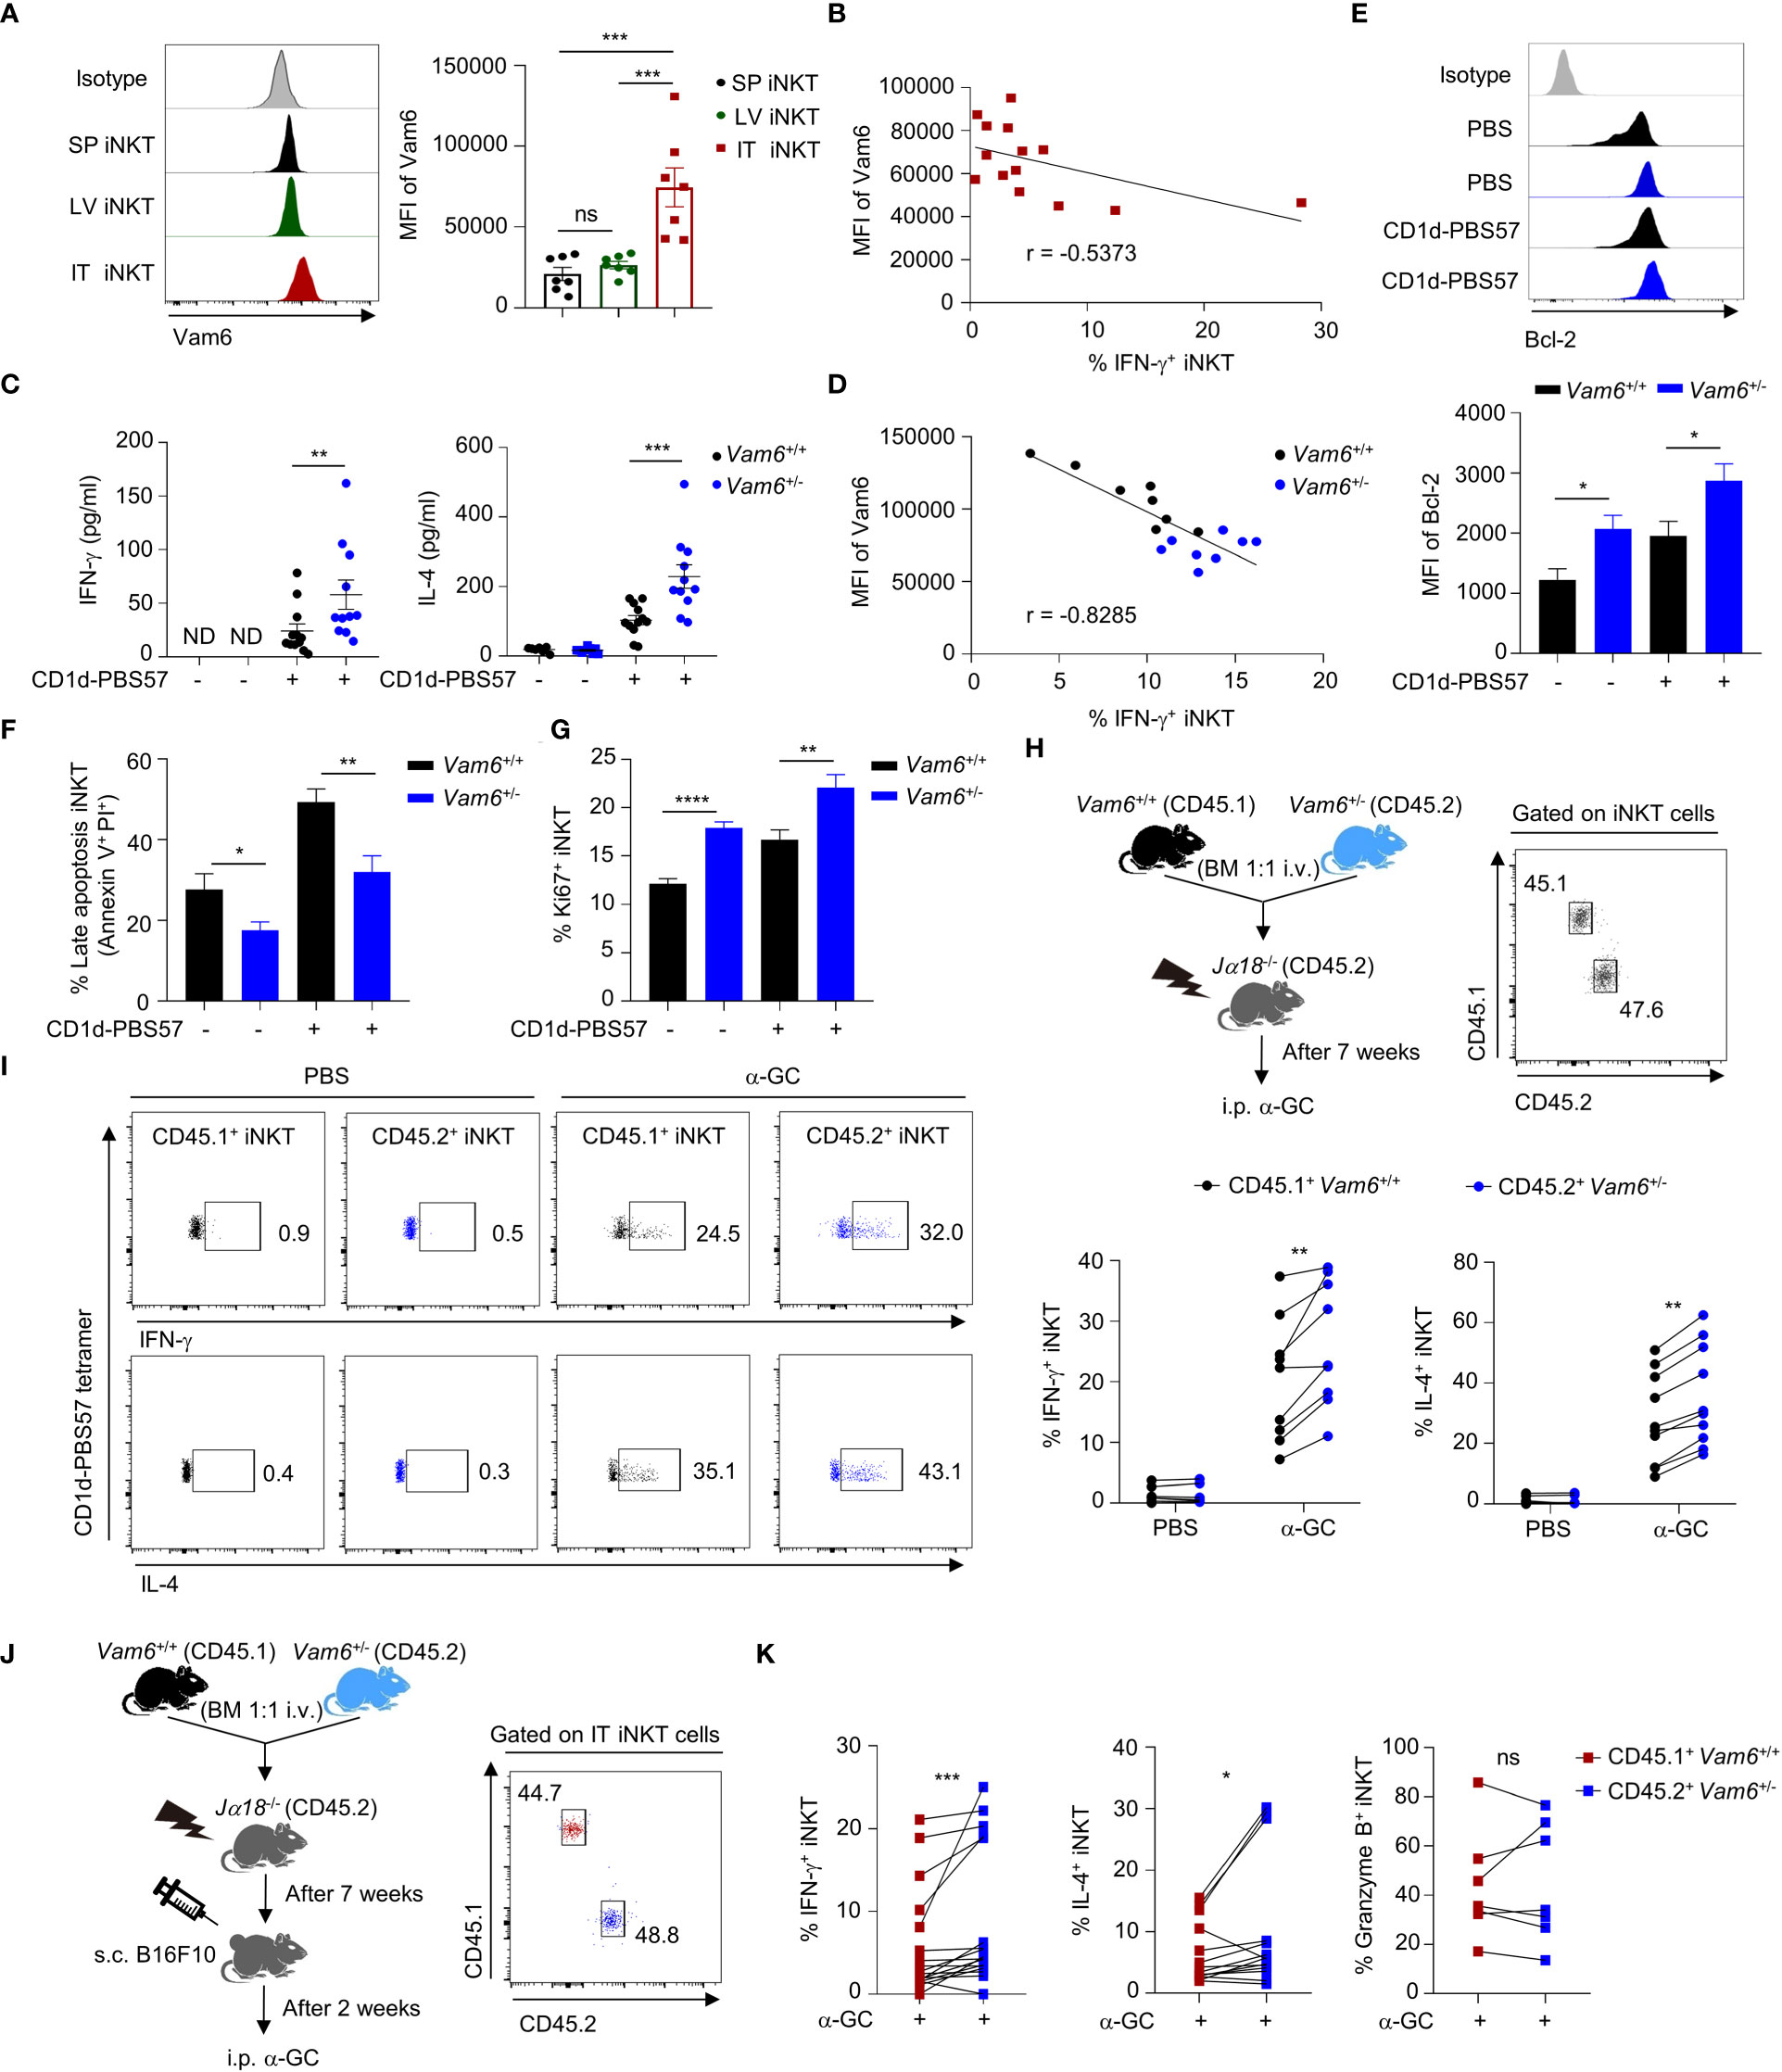
Figure 1 Increased Vam6 in intratumoral iNKT cells leads to impaired IFN-γ production. (A) Vam6 expression in splenic (SP), hepatic (LV), and intratumoral (IT) iNKT cells from B16F10 tumor-bearing mice, 4 hours post α-GC injection. n = 7 mice for each group. (B) Correlation between Vam6 and IFN-γ production in IT iNKT cells from tumor-bearing mice, 4 hours post α-GC injection. n = 14 mice. (C) Supernatant IFN-γ and IL-4 produced by sorted hepatic iNKT cells from Vam6+/+ and Vam6+/- mice, stimulated with or without plate-coated CD1d-PBS57 tetramer for 48 hours. n = 11-12 mice for each group. ND, not detected. (D) Correlation between Vam6 and IFN-γ production in Vam6+/+ and Vam6+/- SP iNKT cells, stimulated with CD1d-PBS57 tetramer in vitro. n = 16 mice. (E-G) Bcl-2 expression (E), frequencies of apoptotic cells (F), and frequencies of Ki67+ cells (G) in Vam6+/+ and Vam6+/- iNKT cells stimulated with or without CD1d-PBS57 tetramer for 18 hours. n = 9-12 samples for each group. (H) Experimental procedure for (I). (I) IFN-γ and IL-4 production in CD45.1+ Vam6+/+ iNKT cells and CD45.2+ Vam6+/- iNKT cells from spleens of chimeric mice, 4 hours after α-GC or PBS injection. n = 7-10 mice for each group. (J) Experimental procedure for (K). (K) IFN-γ, IL-4, and Granzyme B production in CD45.1+ Vam6+/+ iNKT cells and CD45.2+ Vam6+/- iNKT cells in B16F10 tumors from chimeric mice, 4 hours post α-GC injection. n = 7-17 mice. Data are shown as mean ± SEM (A, C, E-G) and pooled from two (A, B, D), three (C, E-G), or four (I, K) independent experiments. Data were analyzed by two-tailed Mann-Whitney tests (A, C, E-G), two-tailed Wilcoxon matched-pairs signed rank tests (I, K), and Pearson correlation (B, D). *P < 0.05, **P < 0.01, ***P < 0.001, ****P < 0.0001. ns, not significant. See also Supplementary Figure 1.
Vam6 inhibits iNKT cell functions via modulating AMPK/mTOR pathways
To study the role of Vam6 in controlling iNKT cell function, we performed RNA-seq experiments and found that reducing Vam6 expression altered gene expression profile in iNKT cells (Figures 2A, B). 1712 genes were upregulated whereas 1728 genes were downregulated in Vam6+/- iNKT cells. KEGG (Kyoto Encyclopedia of Genes and Genomespathway) analysis and GO (Gene Ontology) term analysis showed that the upregulated genes were enriched in cell cycle, cell activation, and metabolic processes, whereas the downregulated genes were enriched in cell death, autophagy, and AMPK pathway. The gene profile of Vam6+/- iNKT cells was in line with their increased proliferation, survival, and function (Figures 2C, D). It is well-known that cell growth and metabolic processes are promoted by mTORC1 (14) whereas the autophagy is inhibited by mTORC1 (15). Additionally, AMPK is a negative regulator of mTORC1 (16, 17). Therefore, our gene enrichment analysis implied alterations in AMPK/mTOR pathways in Vam6+/- iNKT cells. Indeed, we found increased expression of genes related to mTORC1 pathway (Figure 2E) and decreased expression of genes related to AMPK pathway (Figure 2F) in these iNKT cells with reduced Vam6 expression.
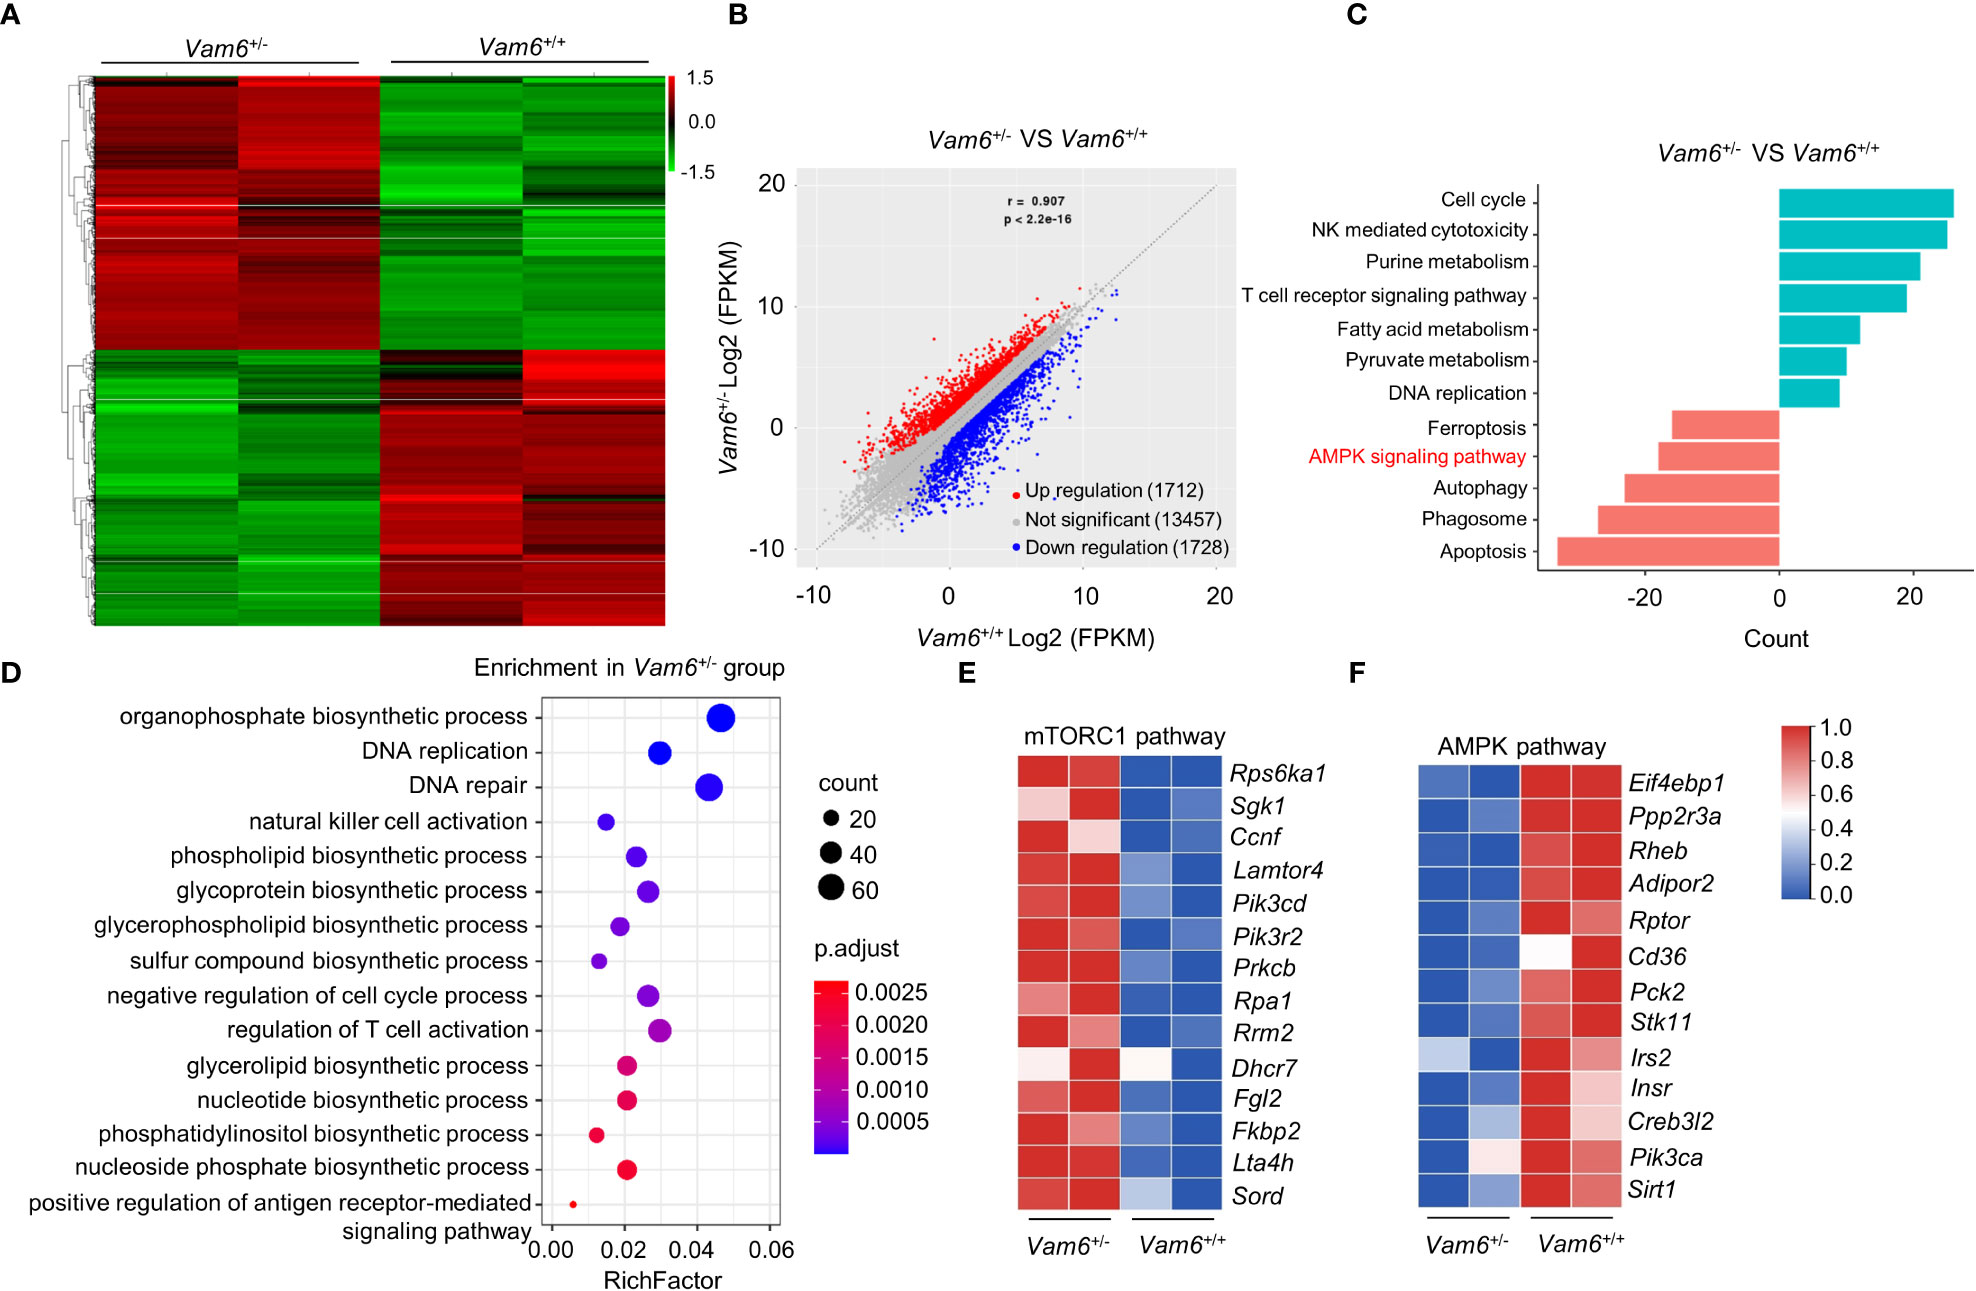
Figure 2 mRNA-seq data reveal the altered AMPK/mTORC1 signaling in Vam6+/- iNKT cells. (A) Heatmap displaying 3440 significantly dysregulated genes in Vam6+/- iNKT cells in comparison with Vam6+/+ iNKT cells after stimulation with CD1d-PBS57 tetramer for 4 hours. The significance threshold is fold change ≥ 2 and FDR ≤ 0.05. (B) Correlation plot displaying expression of genes in Vam6+/- iNKT cells and in Vam6+/+ iNKT cells. (C) KEGG pathway analysis showing pathways downregulated and upregulated in Vam6+/- iNKT cells. Bars represent the number of differentially expressed genes contributing to each gene set. (D) GO term analysis showing pathways upregulated in Vam6+/- iNKT cells. (E, F) Heatmaps showing expression of genes involved in mTORC1 pathway (E) and AMPK pathway (F) in Vam6+/- iNKT cells and in Vam6+/+ iNKT cells.
Next, we measured activation of mTORC1 and AMPK at protein levels, as indicated by the phosphorylation of S6S235/236 and phosphorylation of AMPKα, respectively. CD45.2+ Vam6+/- iNKT cells in Jα18-/- chimeric mice exhibited elevated mTORC1 activation (Figure 3A) and diminished AMPK activation (Figure 3B) after α-GC injection, in comparison with CD45.1+ Vam6+/+ iNKT cells. Consistently, enhanced mTORC1 activation (Figure 3C) and diminished AMPK activation (Figure 3D) were detected in Vam6+/- iNKT cells when they were stimulated with anti-CD3 plus anti-CD28 in vitro. In B16F10 tumor-bearing Jα18-/- chimeric mice (Figure 3E), CD45.2+Vam6+/- iNKT cells displayed higher level of mTORC1 activation (Figure 3F) and lower level of AMPK activation (Figure 3G) than CD45.1+ Vam6+/+ iNKT cells after α-GC injection. Activation of mTORC1 has been previously reported to promote cytokine production in iNKT cells (5). Notably, reducing Vam6 expression failed to enhance CD1d-PBS57 tetramer-induced IFN-γ production in iNKT cells treated with mTORC1 inhibitor rapamycin, further confirming that reduced Vam6 increased iNKT cell function via promoting mTORC1 activation (Figures 3H, I). Given the inhibitory effect of AMPK on mTORC1 activation (17), our results indicate that Vam6 inhibits mTORC1 activation via promoting AMPK activation. We found that inhibiting AMPK activation via Compound C increased mTORC1 activation and IFN-γ production in CD1d-PBS57 tetramer-stimulated Vam6+/+ iNKT cells but not in Vam6+/- iNKT cells (Figures 3J, K). Together, our results demonstrate that Vam6 in iNKT cells inhibits mTORC1 activation and IFN-γ production via promoting AMPK activation.

Figure 3 Reduced Vam6 expression promotes mTORC1 activation and IFNγ production via suppressing AMPK activation. (A, B) Phosphorylation of S6S235/S236 (A) and phosphorylation of AMPKα (B) in CD45.1+ Vam6+/+ and CD45.2+ Vam6+/- splenic iNKT cells in mixed bone marrow chimeras, after α-GC injection, as described in Figure 1H. n = 10 mice for each group. (C, D) Phosphorylation of S6S235/S236 (C) and phosphorylation of AMPKα (D) in anti-CD3 plus anti-CD28-stimulated splenic iNKT cells from Vam6+/+ and Vam6+/- mice. n = 6-9 replicates for each group. (E-G) Experimental procedure (E), phosphorylation of S6S235/S236 (F), and phosphorylation of AMPKα (G) in CD45.1+ Vam6+/+ and CD45.2+ Vam6+/- intratumoral iNKT cells in chimeric mice, after α-GC injection. n = 7-8 mice for each group. (H, I) Phosphorylation of S6S235/S236 (H) and IFN-γ production (I) in CD1d-PBS57 tetramer-stimulated splenic iNKT cells from Vam6+/+ and Vam6+/- mice, in the presence or absence of rapamycin. n = 12 replicates for each group. (J, K) Phosphorylation of S6S235/S236 (J) and IFN-γ production (K) in CD1d-PBS57 tetramer-stimulated splenic iNKT cells from Vam6+/+ and Vam6+/- mice, in the presence or absence of Compound C. n = 9 replicates for each group. Data are shown as mean ± SEM (C, D, H-K) and pooled from two (D, F, G), three (C, H-K), or four (A, B) independent experiments. Data were analyzed by two-tailed Mann-Whitney tests (C-D and H-K) and two-tailed Wilcoxon matched-pairs signed rank tests (A, B, F, G). *P < 0.05, **P < 0.01, ***P < 0.001, ****P < 0.0001. ns, not significant.
Vam6 promotes activation of AMPK via recruiting AMPK to lysosome
Despite the reduced phosphorylation of AMPKα, Vam6+/- iNKT cells expressed similar level of AMPKα protein as Vam6+/+ cells did (Figure 4A). Then, we investigated whether Vam6 promoted AMPKα phosphorylation via protein interactions. We performed co-immunoprecipitation experiments with expanded iNKT cells (Figure 4B and Supplementary Figure 2A), in which reducing Vam6 expression (Supplementary Figure 2B) increased IFN-γ production (Supplementary Figures 2C, D) and S6S235/236 phosphorylation (Supplementary Figure 2E) whereas diminished AMPKα phosphorylation (Supplementary Figure 2F), as it did in fresh iNKT cells. We found that AMPKγ3, Rab7a, and VDAC1 were co-immunoprecipitated with Vam6 (Figure 4B), indicating interactions between these proteins. Rab7a is a marker protein for lysosome (18). Recruiting AMPK to lysosome has been reported to be essential for AMPK activation (9). Next, we investigated whether Vam6 regulated recruitment of AMPK to lysosome via protein interactions. Using in situ proximity ligation assay (PLA) approach, we showed that AMPKγ interacted with Rab7a in activated iNKT cells, and reducing Vam6 expression impaired the Rab7a-AMPKγ interaction, as indicated by reduced Rab7a-AMPKγ PLA puncta numbers (Figure 4C). Additionally, we proved that reducing Vam6 expression did not influence the protein level of Rab7a (Figure 4D). In line with the lysosomal location of Rab7a, the Rab7a-AMPKγ complex was colocalized with lysosome marker LAMP2 (Figure 4E), indicating lysosomal location of Rab7a-AMPKγ interaction. In agreement with the reduced Rab7a-AMPKγ interaction in activated Vam6+/- iNKT cells, these cells had less amount of AMPK on lysosome in comparison with activated Vam6+/+ iNKT cells (Figure 4F). These data demonstrate that Vam6 promotes Rab7a-AMPKγ interaction and recruits AMPK to lysosome. Notably, when AMPK in CD1d-PBS57 tetramer-stimulated iNKT cells was activated by AICAR, an AMP analog, the Rab7a-AMPKγ PLA puncta numbers (Figure 4G), the colocalization coefficient of AMPKγ and LAMP2 (Figure 4H), and the AMPKα phosphorylation (Figure 4I) was all increased in a Vam6 dependent manner. As a consequence, the inhibitory effects of AICAR on mTORC1 activation (Figure 4J) and on IFN-γ production (Figure 4K) depended on Vam6 as well. Together, these data demonstrate an essential role of Vam6 in recruiting AMPK to lysosome and activating AMPK, and exclude the possibility of regulating AMPK activation via influencing AMP production.
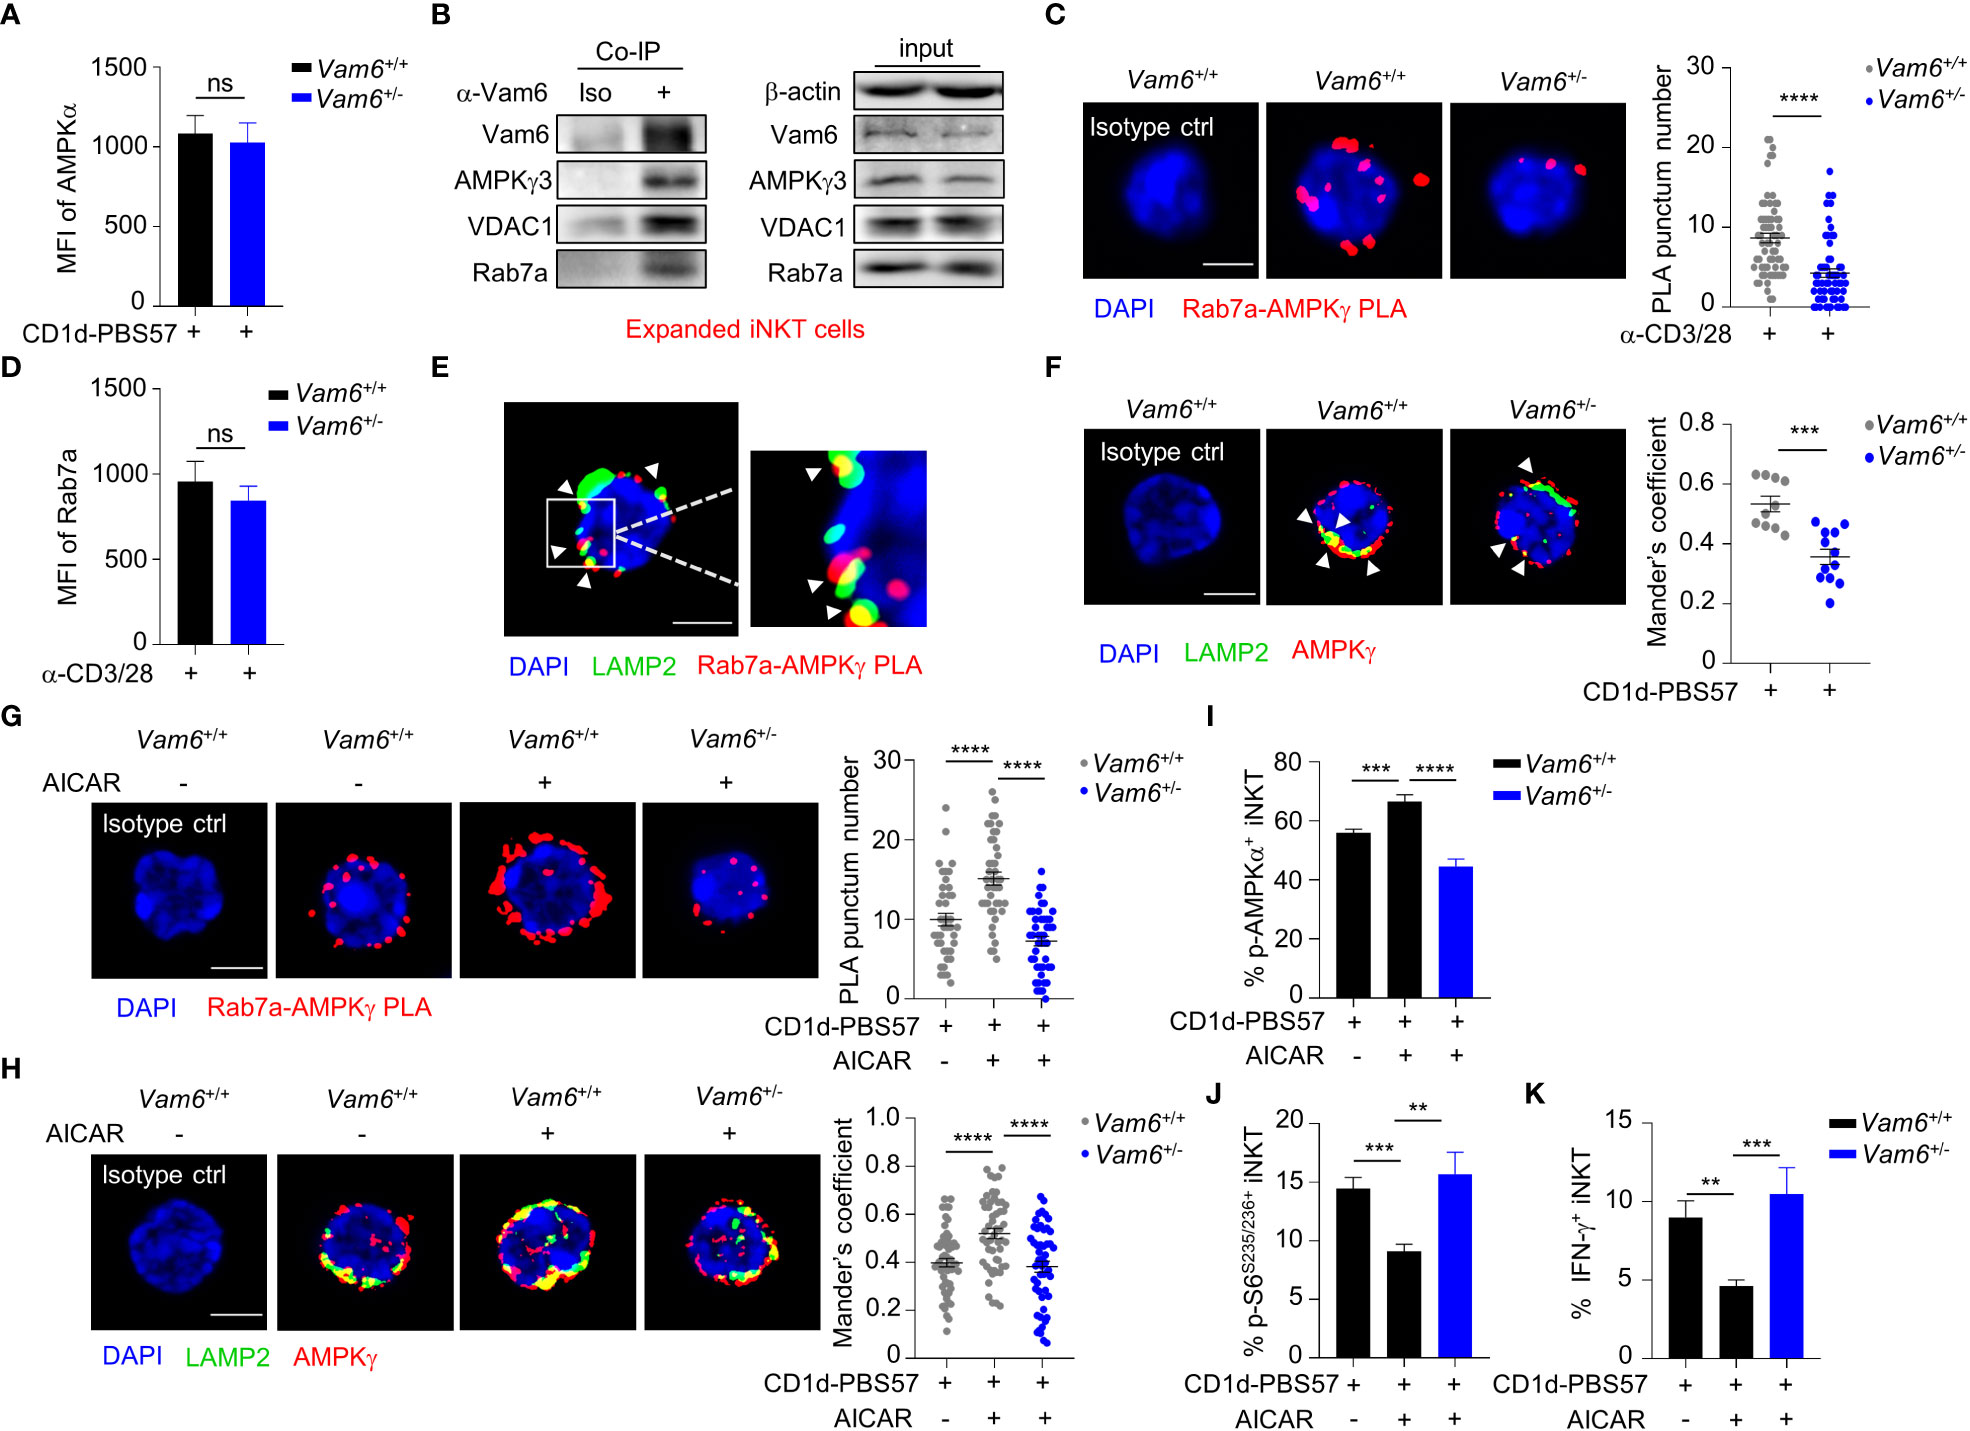
Figure 4 Vam6 promotes Rab7a-AMPKγ interaction and recruits AMPK to lysosome. (A) Protein level of AMPKα in Vam6+/+ and Vam6+/- iNKT cells stimulated with CD1d-PBS57 tetramer. n = 12 replicates for each group. (B) Co-immunoprecipitation of Vam6 with AMPKγ3, VDAC1, and Rab7a in expanded iNKT cells. (C) Representative Rab7a-AMPKγ PLA images (left) and PLA punctum number per cell (right) in Vam6+/+ and Vam6+/- iNKT cells stimulated with anti-CD3 plus anti-CD28 for 4 hours. n = 60-65 cells for each group. Scale bar, 3 µm. (D) Protein level of Rab7a in Vam6+/+ and Vam6+/- iNKT cells stimulated with anti-CD3 plus anti-CD28 for 4 hours. n = 9 replicates for each group. (E) Representative confocal image showing colocalization of Rab7a-AMPKγ PLA puncta and lysosomal LAMP2 in iNKT cells stimulated with CD1d-PBS57 tetramer for 4 hours. Scale bar, 3 µm. (F) Colocalization of AMPKγ and LAMP2 in Vam6+/+ and Vam6+/- iNKT cells stimulated with CD1d-PBS57 tetramer for 4 hours. Scale bar, 3 µm. (G, H) Rab7a-AMPKγ PLA puncta (G) and colocalization of AMPKγ and LAMP2 (H) in Vam6+/+ and Vam6+/- iNKT cells stimulated with CD1d-PBS57 tetramer for 4 hours in the presence or absence of AICAR. n = 41-55 cells for each group. Scale bar, 3 µm. (I-K) Phosphorylation of AMPKα (I), phosphorylation of S6S235/S236 (J), and IFN-γ production (K) in Vam6+/+ and Vam6+/- iNKT cells stimulated with CD1d-PBS57 tetramer in the presence or absence of AICAR. n = 9-12 replicates for each group. Data are shown as mean ± SEM (A, C, D, F-K) and pooled from three (A, C, D, G, J, K) or four (H–I) independent experiments. Data were analyzed by two-tailed unpaired Student’s t test (C, F–H) and two-tailed Mann-Whitney tests (A, D, I–K). **P < 0.01, ***P < 0.001, ****P < 0.0001. ns, not significant. See also Supplementary Figures 2, 3.
To understand how Vam6 regulated Rab7a-AMPKγ interaction, we generated various truncated Vam6 based on previous study (19), including the C terminal-deleted ΔCT, the middle fragment CLH-deleted ΔCLH, and the N terminal-deleted ΔCNH (Supplementary Figure 3A), and showed that Rab7a bound wide-type Vam6 as well as ΔCT but not ΔCNH or ΔCLH, and AMPKγ3 only bound wide-type Vam6 (Supplementary Figure 3B). These results suggest that Rab7a binds Vam6 in a N terminal and CLH fragment dependent manner, and AMPK is dispensable for their interaction. Although ΔCT interacted with Rab7a, it failed to recruit AMPK, suggesting a key role of Vam6 C terminal in forming Rab7a-Vam6-AMPK complex. We could not exclude the possibility that AMPK might not directly bind Rab7a but indirectly interacts with Rab7a through Vam6.
Vam6 relieves inhibitory effect of VDAC1 on Rab7a-Vam6-AMPK complex formation
Among the proteins co-immunoprecipitated with Vam6, we detected a mitochondrial protein VDAC1 (Figure 4B). In activated iNKT cells, reducing Vam6 expression promoted VDAC1-Rab7a interaction, as indicated by increased puncta numbers of VDAC1-Rab7a PLA (Figure 5A). Given the fact that VDAC1 and Rab7a are mitochondrial protein and lysosomal protein, respectively (20, 21), the VDAC1-Rab7a interaction might occur at the contact site between lysosome and mitochondria. Indeed, we found that VDAC1-Rab7a interaction sites were colocalized well with mitochondria probe Mitotracker Deep Red and with lysosome marker LAMP2 as well (Figure 5B), confirming the existence of VDAC1-Rab7a interaction at mitochondrial-lysosome contact sites. In line with the increased VDAC1-Rab7a interaction in Vam6+/- iNKT cells, these cells displayed elevated mitochondrial-lysosome contacts (Supplementary Figure 4A). Meanwhile, the expression levels of mitochondrial maker VDAC1 (Supplementary Figure 4B) and lysosomal markers LAMP2 (Supplementary Figure 4C) were not influenced by reduced Vam6 expression in iNKT cells, excluding the possible changes in organelle numbers. Next, we investigated whether VDAC1 at mitochondrial-lysosome contact sites regulated interactions between Vam6, Rab7a, and AMPKγ. For this purpose, we generated Vdac1+/- and Vdac1-/- mice (Supplementary Figure 4D). Reducing VDAC1 expression in iNKT cells impaired mitochondrial-lysosome interaction without influencing the amounts of these two organelles (Supplementary Figures 4E-G). Notably, deleting one allele of Vdac1 significantly enhanced the Rab7a-AMPKγ PLA puncta numbers (Figure 5C), the Rab7a-Vam6 PLA puncta numbers (Figure 5D), the Vam6-AMPKγ3 PLA puncta numbers (Figure 5E), and the AMPKα phosphorylation (Figure 5F), whereas significantly reduced S6S235/236 phosphorylation (Figure 5G) and IFN-γ production (Figure 5H), although to a lesser extent than deleting two alleles (Figures 5C–H). Additionally, in Jα18-/- chimeric mice that received CD45.2+ Vdac1+/- bone marrows mixed with CD45.1+ Vdac1+/+ bone marrows, CD45.2+ Vdac1+/- iNKT cells produced lower levels of IFN-γ and IL-4 than CD45.1+ Vdac1+/+ iNKT cells did, in response to α-GC injection (Supplementary Figures 5A, B). Consistently, in those B16F10 tumor-bearing Jα18-/- chimeric mice, α-GC induced less IFN-γ and IL-4 production in intratumoral CD45.2+ Vdac1+/- iNKT cells, despite their normal granzyme B production (Supplementary Figures 5C, D). These results further prove the essential role of VDAC1 in promoting cytokine production in iNKT cells. Moreover, the increased Rab7a-AMPKγ interaction (Figure 5I), AMPK activation (Figure 5J), and decreased mTOR activation (Figure 5K), IFN-γ production (Figure 5L), in Vdac1+/- iNKT cells were recovered by reducing Vam6 expression. These results demonstrate that mitochondrial protein VDAC1 inhibits AMPK activation via interfering with Rab7a-Vam6-AMPK complex formation. Given the inhibitory effects of Vam6 on VDAC1-Rab7a interaction as well as lysosome-mitochondria contact, our study imply that Vam6 relieves the inhibitory effect of VDAC1 on Rab7a-Vam6-AMPK complex formation and AMPK activation.
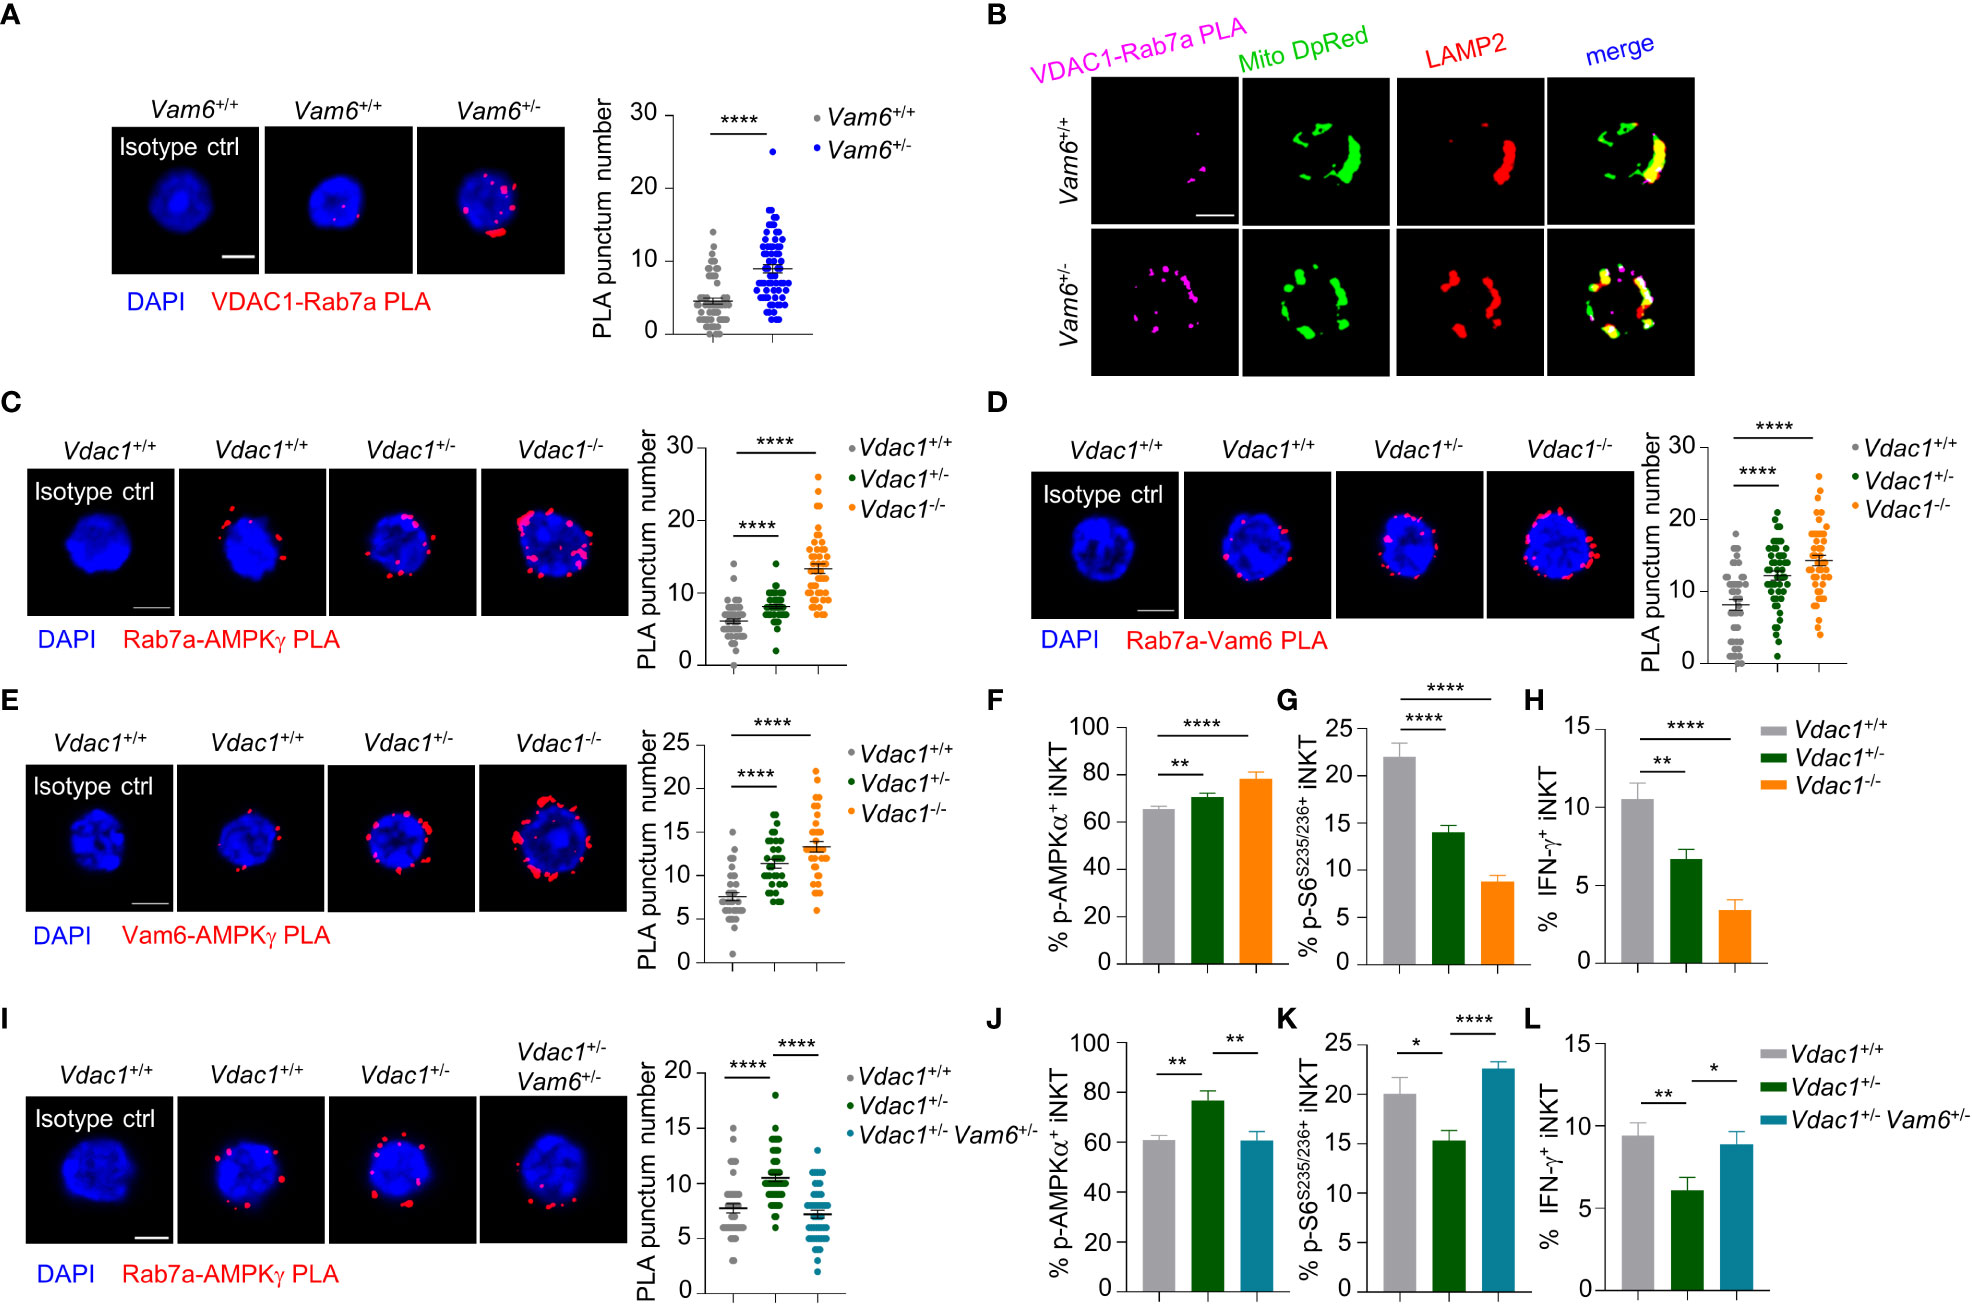
Figure 5 VDAC1 at mitochondria-lysosome contact site interferes with Vam6- Rab7a-AMPKγ complex formation and AMPK activation. (A) VDAC1-Rab7a PLA puncta in Vam6+/+ and Vam6+/- iNKT cells stimulated with anti-CD3 plus anti-CD28 for 4 hours. n = 62-66 cells for each group. Scale bar, 3 μm. (B) Representative confocal images showing colocalization between VDAC1-Rab7a PLA puncta, Mitotracker deep red, and lysosomal LAMP2 in Vam6+/+ and Vam6+/- iNKT cells stimulated with CD1d-PBS57 tetramer for 4 hours. Scale bar, 3 μm. (C–E) Rab7a-AMPKγ PLA puncta (C, n = 46-56 cells for each group), Rab7a-Vam6 PLA puncta (D, n = 45-49 cells for each group), and Vam6-AMPKγ PLA puncta (E, n = 33-37 cells for each group) in Vdac1+/+, Vdac1+/-, and Vdac1-/- iNKT cells stimulated with CD1d-PBS57 tetramer for 4 hours. Scale bar, 3 μm. (F–H) Phosphorylation of AMPKα (F), phosphorylation of S6S235/S236 (G), and IFN-γ production (H) in Vdac1+/+, Vdac1+/-, and Vdac1-/- iNKT cells stimulated with CD1d-PBS57 tetramer for 18 hours. n = 12-16 replicates for each group. (I) Rab7a-AMPKγ PLA puncta in Vdac1+/+, Vdac1+/-, and Vdac1+/- Vam6+/- iNKT cells stimulated with CD1d-PBS57 tetramer for 4 hours. n = 44-51 cells for each group. Scale bar, 3 μm. (J–L) Phosphorylation of AMPKα (J), phosphorylation of S6S235/S236 (K), and IFN-γ production (L) in Vdac1+/+, Vdac1+/-, and Vdac1+/- Vam6+/- iNKT cells stimulated with CD1d-PBS57 tetramer for 18 hours. n = 12-16 replicates for each group. Data are shown as mean ± SEM (A, C–L) and pooled from two (E), three (A, C, D, G–J), or four (F, K, L) independent experiments. Data were analyzed by two-tailed unpaired Student’s t test (A, C–E, I) and two-tailed Mann-Whitney tests (F–H, J–L). *P < 0.05, **P < 0.01, ****P < 0.0001. See also Supplementary Figures 4–6.
In line with the increased Vam6 expression in intratumoral iNKT cells, we further confirmed that these cells showed reduced mTORC1 activation (Supplementary Figure 6A), increased AMPK activation (Supplementary Figure 6B), elevated Rab7a-AMPKγ interaction (Supplementary Figure 6C), reduced VDAC1-Rab7a interaction (Supplementary Figure 6D), and lower lysosome-mitochondria contact (Supplementary Figure 6E) than splenic iNKT cells, after activation.
Lactic acid from tumor cells increases Vam6 expression in intratumoral iNKT cells
Previous study has indicated that lactic acid in tumor microenvironment inhibit mTORC1 activation (4). To investigate whether lactic acid in tumor microenvironment elevated Vam6 expression, we treated iNKT cells with lactic acid in vitro, and found that lactic acid increased Vam6 expression in both anti-CD3 plus anti-CD28 stimulated and unstimulated cells (Figure 6A). To confirm the effects of lactic acid in vivo, we knocked down Ldha in B16F10 melanoma cells to inhibit production of lactic acid, and subcutaneously injected these Ldha knockdown B16F10 cells and normal B16F10 cells into mice, respectively. We showed that iNKT cells isolated from Ldha knockdown B16F10 tumors exhibited lower expression of Vam6 than cells isolated from normal B16F10 tumors, no matter these iNKT cells were activated or not (Figure 6B), confirming that lactic acid in tumor microenvironment elevated Vam6 expression. In line with their lower level of Vam6, these intratumoral iNKT cells from Ldha knockdown B16F10 tumors showed higher levels of IFN-γ (Figure 6C) and S6 phosphorylation (Figure 6D) but lower level of AMPKα phosphorylation (Figure 6E) than those intratumoral iNKT cells from normal B16F10 tumors, in response to α-GC injection. On the other hand, reducing Vam6 expression in lactic acid-treated iNKT cells partially restored their IFN-γ production in vitro (Figure 6F). These results demonstrate that lactic acid produced by tumor cells increases Vam6 expression in intratumoral iNKT cells and thus leads to impaired cell function.
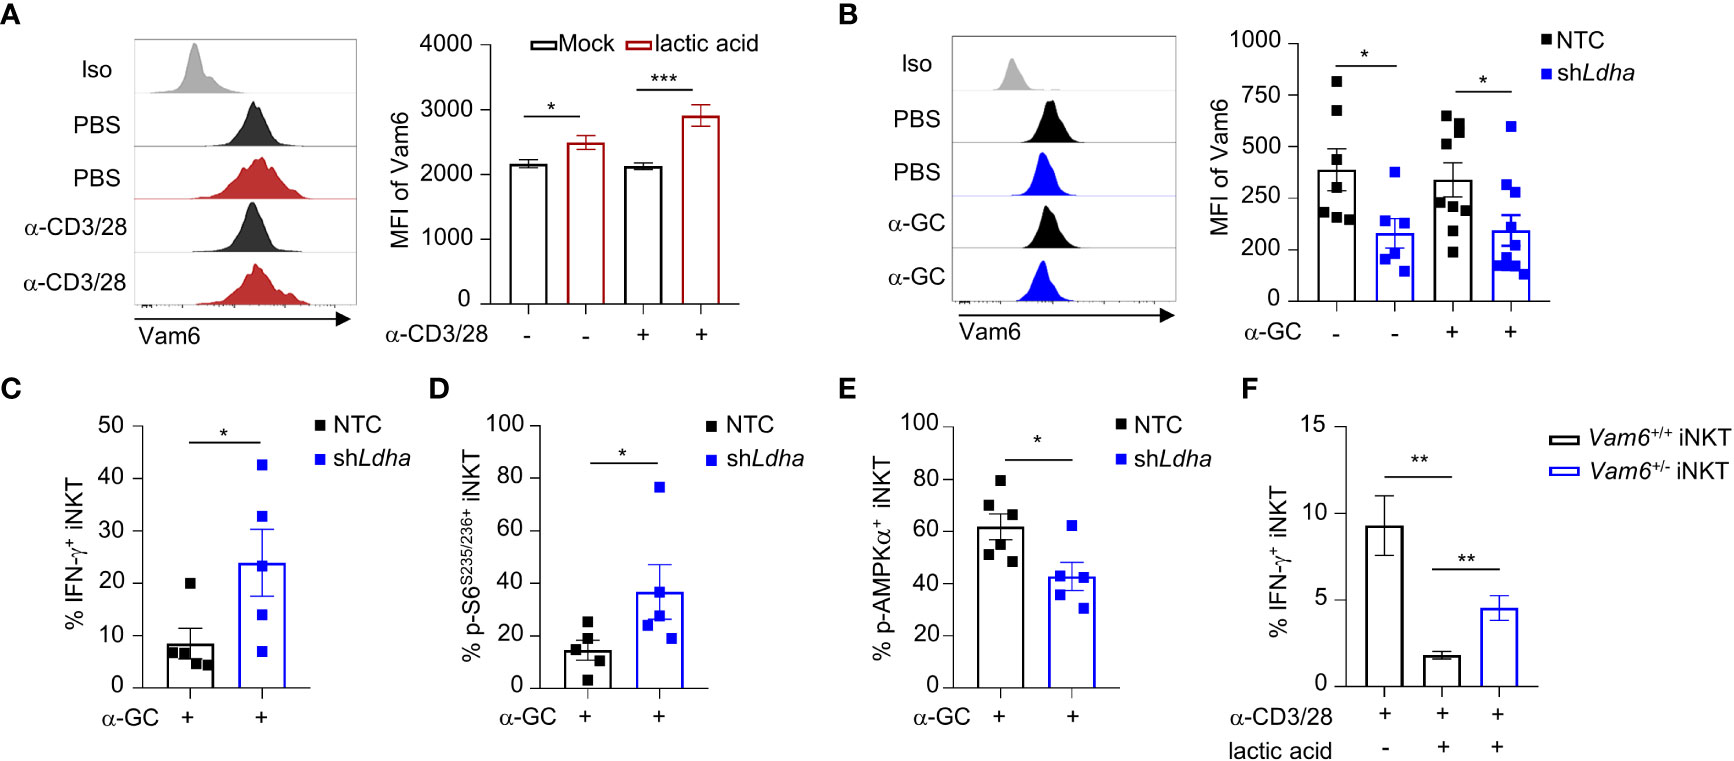
Figure 6 Lactic acid from tumor cells increases Vam6 expression and leads to dysfunction of intratumoral iNKT cells. (A) Vam6 expression in splenic iNKT cells activated with or without plate-coated anti-CD3 plus anti-CD28 for 4 hours, in the presence or absence of 5 mM lactic acid. n = 10 replicates for each group. (B-E) Vam6 expression (B, n = 6-10 mice for each group), IFN-γ production (C, n = 5 mice for each group), phosphorylation of S6S235/S236 (D, n = 5 mice for each group), and phosphorylation of AMPKα (E, n = 5-6 mice for each group) in intratumoral iNKT cells from Ldha knockdown B16F10 tumors or NTC B16F10 tumors, 4 hours post α-GC injection. NTC, none target control cells transfected with scramble shRNA. (F) IFN-γ production in splenic Vam6+/- and Vam6+/+ iNKT cells, activated by plate-coated anti-CD3 plus anti-CD28 for 18 hours, in the presence or absence of 10 mM lactic acid. n = 6 replicates for each group. Data are shown as mean ± SEM and were analyzed by two-tailed Mann-Whitney tests. *P < 0.05, **P < 0.01, ***P < 0.001.
Vam6+/− iNKT cells exhibits enhanced anti-tumor efficacy
To study the anti-tumor efficacy of Vam6+/− iNKT in vivo, we transferred expanded Vam6+/− iNKT cell, expanded Vam6+/+ iNKT cells, and PBS into wide-type mice bearing subcutaneous B16F10 tumor cells, respectively (Figure 7A). The expanded Vam6+/- iNKT cells exhibited better anti-tumor efficacy than expanded Vam6+/+ iNKT cells, as indicated by lower tumor weight and smaller tumor size (Figures 7B-D). Previous studies have reported that enhancing iNKT cell activation leads to augmented activation of NK and CD8 T cells, both of which could contribute to increased anti-tumor efficacy (5, 22). We found that, upon α-GC injection, expanded Vam6+/− iNKT cells in B16F10 tumors of Jα18-/- mice showed higher level of S6 phosphorylation and IFN-γ production but similar level of granzyme B production, in comparison with expanded Vam6+/+ iNKT cells (Figures 7E, F). These results imply that expanded Vam6+/− iNKT cells increased tumor clearance via indirect manner. Indeed, we found that intratumoral NK cells and CD8 T cells in mice received expanded Vam6+/− iNKT cells produced more granzyme B than those cells in mice received expanded Vam6+/+ iNKT cells, indicating a contribution of NK cells and CD8 T cells in enhanced tumor clearance (Figures 7G, H). Furthermore, we tested the anti-tumor effect of expanded Vam6+/− iNKT cells with tumor metastasis models. We respectively transferred expanded Vam6+/− iNKT cells, expanded Vam6+/+ iNKT cells, and PBS into wide-type mice that were intravenously injected with B16F10 tumor cells one day before (Figure 7I). Again, transfer of expanded Vam6+/- iNKT cells better inhibited lung metastasis (Figure 7J) and prolonged mouse survival (Figure 7K) than transfer of expanded Vam6+/+ iNKT cells. Consistently, expanded Vam6+/− iNKT cells in lungs of Jα18-/- metastasis models showed higher level of S6 phosphorylation and IFN-γ production but similar level of granzyme B production in response to α-GC injection, in comparison with expanded Vam6+/+ iNKT cells (Figures 7L, M). Moreover, we found that NK cells in lungs of mice received expanded Vam6+/− iNKT cells produced more granzyme B than those cells in mice received expanded Vam6+/+ iNKT cells, despite similar level of granzyme B in CD8 T cells, indicating a contribution of NK cells in enhanced tumor clearance in lung metastasis models (Figures 7N, O). Together, our results demonstrate enhanced anti-tumor efficacy of iNKT cells with reduced Vam6 expression.
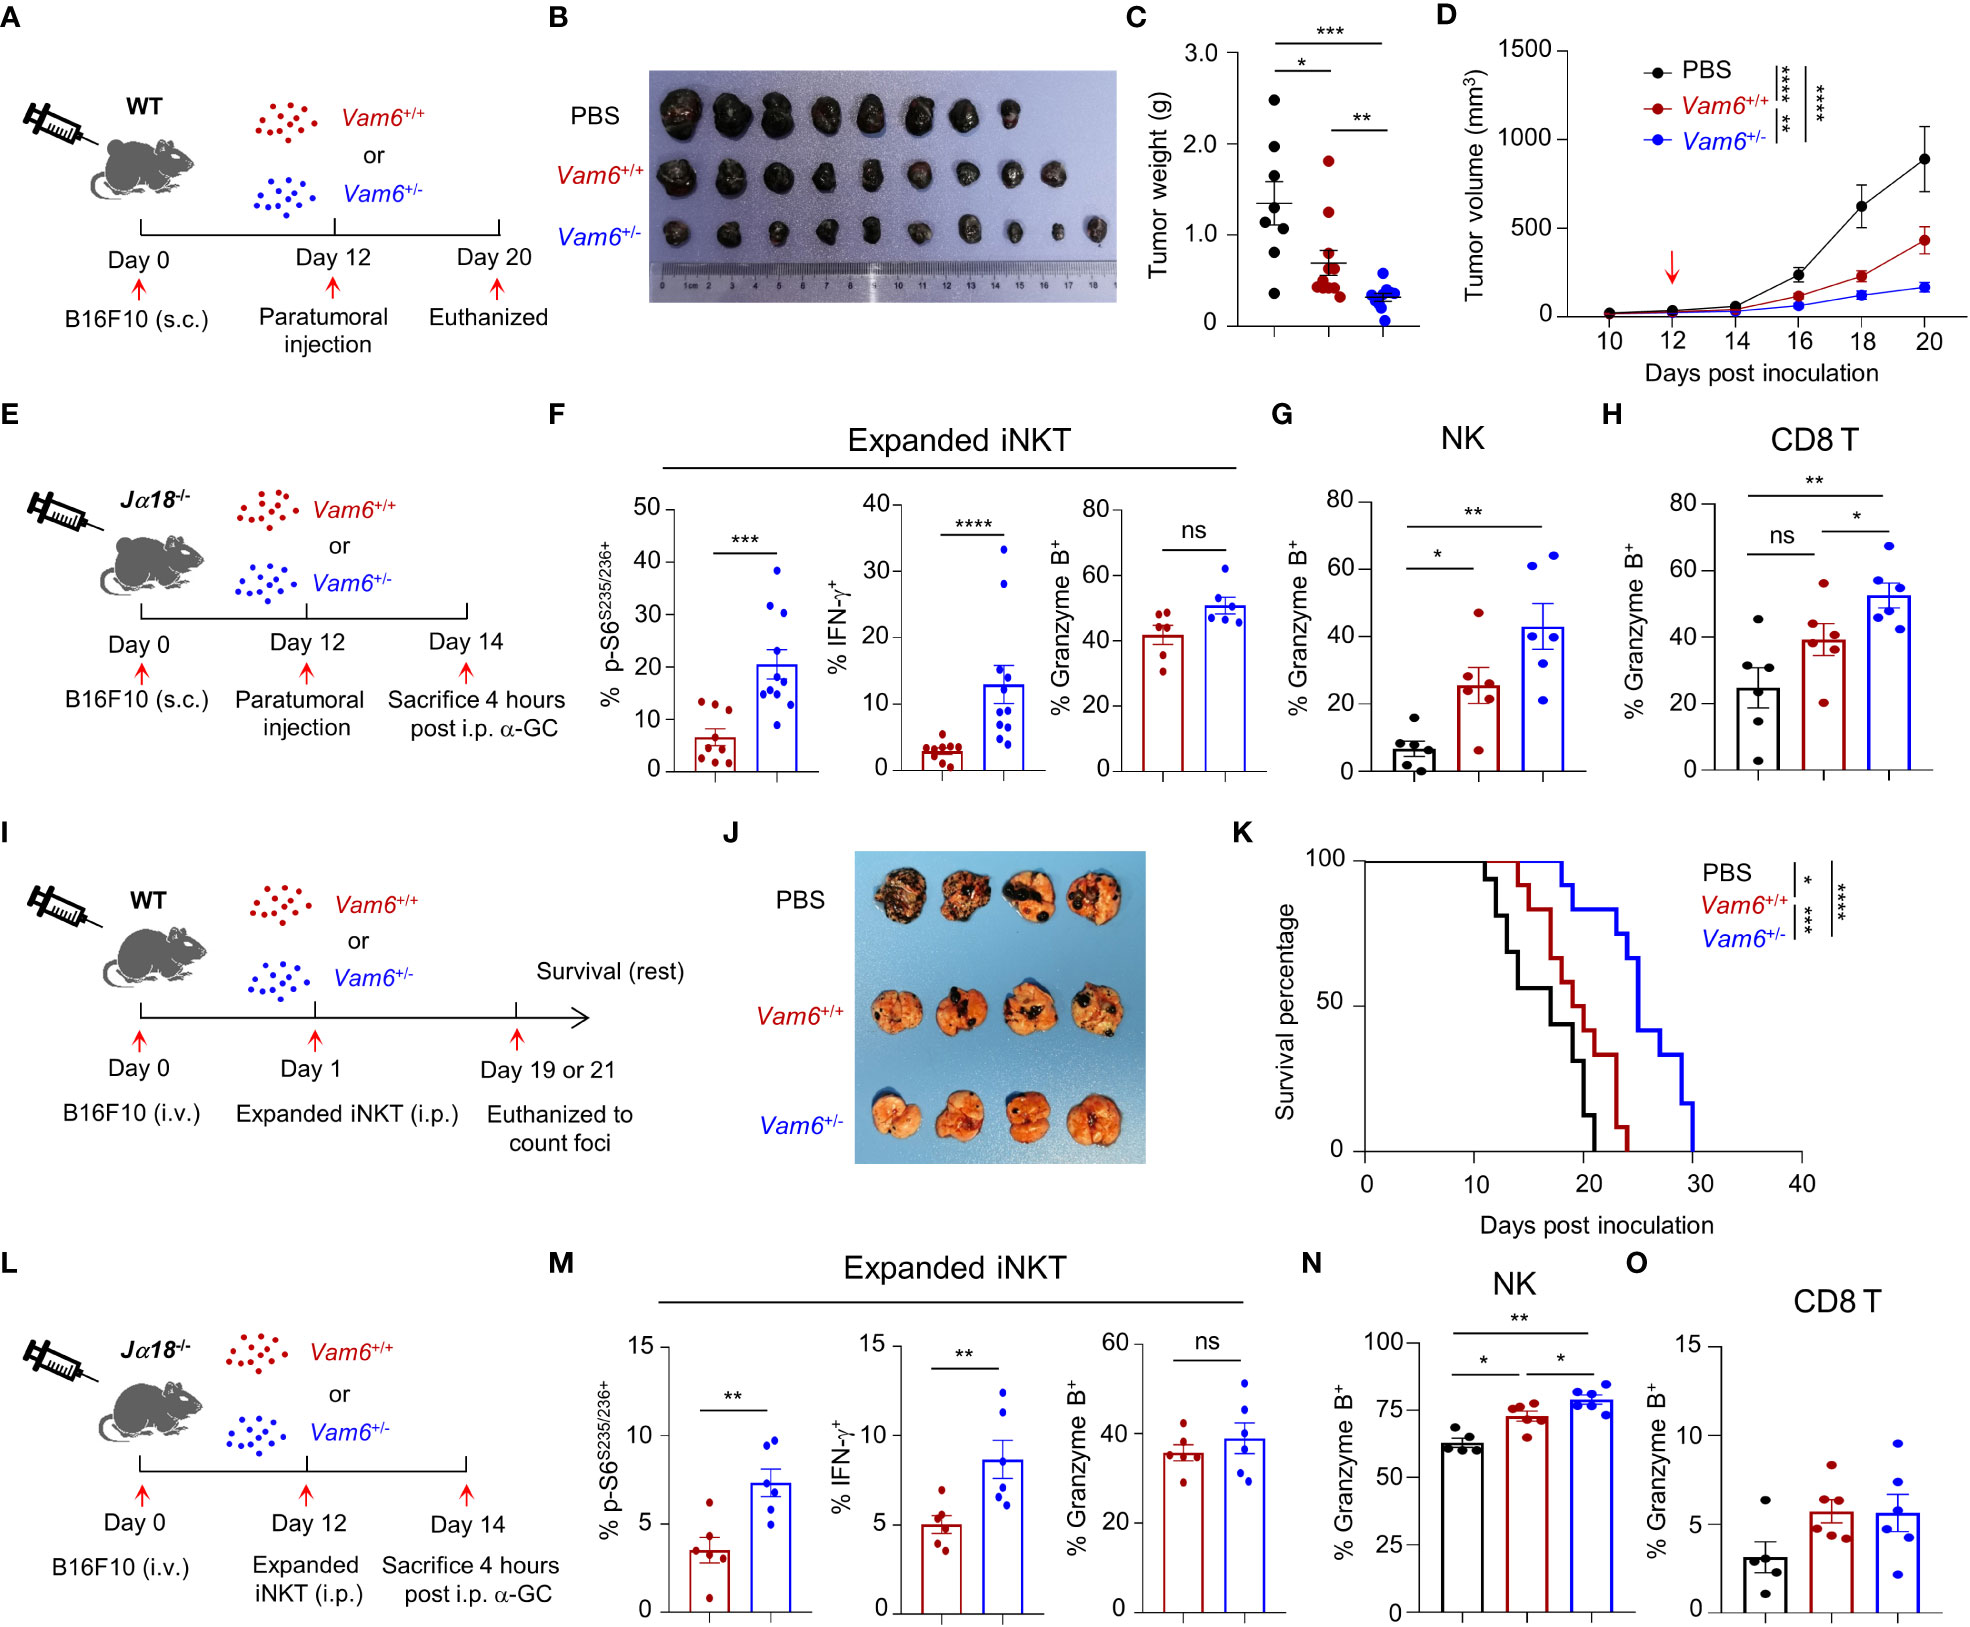
Figure 7 Reduction of Vam6 expression enhances anti-tumor efficacy of expanded iNKT cells. (A) Experimental procedure for (B–D). (B–D) Representative image of B16F10 tumors (B), tumor weight on day 20 (C), and tumor size (D) in wide-type mice receiving PBS, expanded Vam6+/+ iNKT cells, and expanded Vam6+/- iNKT cells, respectively. n = 9-10 mice for each group. Red arrow in (D) indicates time point of paratumoral injection. (E) Experimental procedure for (F–H). (F–H) S6S235/S236 phosphorylation, IFN-γ production, and granzyme B production in transferred expanded iNKT cells (F), and granzyme B production in NK cells (G) and CD8 T cells (H) in tumors of Jα18-/- mice received PBS, expanded Vam6+/+ iNKT cells, and expanded Vam6+/- iNKT cells, respectively, after α-GC injection on Day 14. n = 6-11 mice for each groups. (I) Experimental procedure for (J, K). (J) Representative image of lungs with melanoma foci from wide-type mice injected with B16F10 cells (i.v.) and received PBS, expanded Vam6+/+ iNKT cells, and expanded Vam6+/- iNKT cells, respectively. n = 7 mice for each group. (K) Survival rates of mice injected with B16F10 cells (i.v.) and received PBS, expanded Vam6+/+ iNKT cells, and expanded Vam6+/- iNKT cells, respectively. n = 12-16 mice for each group. (L) Experimental procedure for (M–O). (M–O) S6S235/S236 phosphorylation, IFN-γ production, and granzyme B production in transferred expanded iNKT cells (M), and granzyme B production in NK cells (N) and CD8 T cells (O) in lungs of Jα18-/- mice injected with B16F10 cells (i.v.) and received PBS, expanded Vam6+/+ iNKT cells, and expanded Vam6+/- iNKT cells, respectively, after α-GC injection on Day 14. n = 5-6 mice for each groups. Data are shown as mean ± SEM (C-D, F–H, M–O) and were analyzed by Two-tailed Mann-Whitney tests (C, F–H, M–O), Two-way ANOVA (D), and Log-rank (Mantel-Cox) test (K). *P < 0.05, **P < 0.01, ***P < 0.001, ****P < 0.0001. ns, not significant.
Discussion
In this study, we demonstrate that reduction of Vam6 expression impairs AMPK activation and thus increases mTORC1 activation in iNKT cells. Recruitment of AMPK to lysosome is essential for its activation, and that is mediated through protein interactions between AMPK, AXIN, LKB1, and LAMTOR1 (9). In addition to these proteins, our results indicate that Vam6 plays an essential role in recruiting AMPK to lysosome and activating AMPK via promoting formation of Rab7a-Vam6-AMPK complex at lysosome. On the other hand, mitochondrial protein VDAC1 at mitochondria-lysosome contact site interferes with this complex formation via protein-protein interaction, and this inhibitory effect of VDAC1 is relieved by Vam6. It is rational that this de-suppressive effect of Vam6 would help to stabilize the Rab7a-Vam6-AMPK complex, in addition to the adaptor protein function of Vam6 in complex formation.
Here, our results reveal that the mitochondria-lysosome contact site serves as a platform for blocking AMPK activation in iNKT cells via VDAC1-mediated inhibition of Rab7a-Vam6-AMPK complex formation. Although mitochondria-lysosome contact has been identified for years, the molecules tethering and regulating the contact as well as its contribution to cell fate and functional determination remain unclear. In yeasts, the mitochondria-vacuole contact is mediated by interaction between Vam6, Ypt7 (Rab7a homologue), and Tom40 (23). In contrary to its role in yeasts, Vam6 in iNKT cells serves as a negative regulator that interferes with VDAC1-Rab7a interaction and mitochondria-lysosome interaction. Our data demonstrate an essential role of VDAC1 in tethering mitochondria and lysosome in iNKT cells. Mitochondrial protein VDAC1 has been shown to control the calcium transport at mitochondria-lysosome contact site (24). In addition to favoring the molecule transport between mitochondria and lysosome, our study indicates that VDAC1 also modulates activity of AMPK-mTORC1 pathways at the contact site between these two organelles. In line with our results, lysosomal Rab7a has been previously reported to maintain mitochondria-lysosome contact in both mammalian cells (25) and yeasts (23). A previous study focusing on Rab7a GTPase-activating protein TBC1D15 suggests that active Rab7a promotes mitochondria-lysosome contact (26). Active Rab7a but not inactive Rab7a exhibits lysosomal location (27). Despite the discrepancies in Vam6’s potential guanidine exchange factor (GEF) activity toward Rab7a (28, 29), we found that reduction of Vam6 increased VDAC1-Rab7a interaction at lysosome and promoted mitochondria-lysosome contact. It is rational that Vam6 inhibits the VDAC1-Rab7a interaction and mitochondria-lysosome contact independently of its GEF activity, but through protein-protein interaction.
Our findings that Vam6 promotes AMPK activation and diminishes mTORC1 activation in iNKT cells are in line with a recent study on Vam6 knockdown myoblasts (12). On the other hand, another study on senescent conventional T cells demonstrates sustained activation of mTORC1 in a lysosomal function independent but Vam6-controlled late endosome dependent manner (13). In the same study, the contribution of Vam6 to mTORC1 activation in young T cells differs at different time windows (13). Additionally, Vam6 in fission yeasts has been reported to activate mTORC1 through activating Gtr1-Gtr2 (30). Whether the senescent T cells and the fission yeasts share similar mechanisms in controlling mTORC1 activation remain to be revealed. It is possible that mTORC1 pathway is regulated by different mechanisms depending on cell type, spatial and temporal distribution of mTOR and Vam6, and other pathways involved.
Notably, iNKT cells are good candidates for anti-tumor immunotherapy (3, 5). Impaired activation of mTORC1 hinders anti-tumor function of intratumoral iNKT cells (4). Here, we demonstrate that lactic acid produced by tumor cells increases Vam6 expression in intratumoral iNKT cells and thus leads to impaired mTORC1 activation and cell function. Although we did not measure the vam6 expression and mTORC1 activation in human intratumoral iNKT cells, published scRNA-seq data of colorectal liver metastases (CRLM) patients from other group (31) show a slightly increase of Vam6 and impaired mTORC1 activation in intratumoral CD27+ iNKT cell cluster, in comparison with cells in para-carcinoma tissues (Supplementary Figure 7). These data imply that Vam6-mTORC1 regulatory axis might contribute to the dysfunction of intratumoral iNKT cells in human patients. On the other hand, our findings that reducing Vam6 expression in iNKT leads to enhanced iNKT cell function and exhibits augmented anti-tumor efficacy shed light on future gene editing in iNKT cell-based immunotherapy against tumors.
Data availability statement
The datasets presented in this study can be found in online repositories. The name of the repository and accession number can be found below: NCBI Sequence Read Archive; PRJNA884874.
Ethics statement
The animal study was reviewed and approved by Animal Care and Use Committee of the University of Science and technology of China.
Author contributions
SB, QW, XC, MS, and JP performed experiments, TY and LX generated knockout mice, SZ, YZ, SL, DX, CT, DZ, LW, SF, XL, AJ, DL, JH, YX, TX, ZT, and RZ provided materials, developed methods, or discussed experiments. SB, QW, HZ, and LB conceived the idea, designed the experiments, and wrote the manuscript. All authors contributed to the article and approved the submitted version.
Funding
This work was supported by National Key R&D Program of China 2021YFC2300604, National Natural Science Foundation of China 91954122, 92254304, 82071736, 82101912, 82202022, the CAS Project for Young Scientists in Basic Research (YSBR-074), Fundamental Research Funds for the Central Universities WK9110000149 and WK9100000001, the University Synergy Innovation Program of Anhui Province GXXT-2021-066, and the Natural Science Foundation of Hefei 2021024.
Acknowledgments
We thank NIH Tetramer Core Facility for providing CD1d-PBS57 tetramer.
Conflict of interest
The authors declare that the research was conducted in the absence of any commercial or financial relationships that could be construed as a potential conflict of interest.
Publisher’s note
All claims expressed in this article are solely those of the authors and do not necessarily represent those of their affiliated organizations, or those of the publisher, the editors and the reviewers. Any product that may be evaluated in this article, or claim that may be made by its manufacturer, is not guaranteed or endorsed by the publisher.
Supplementary material
The Supplementary Material for this article can be found online at: https://www.frontiersin.org/articles/10.3389/fimmu.2022.1051045/full#supplementary-material
References
1. Godfrey DI, MacDonald HR, Kronenberg M, Smyth MJ, Van Kaer L. NKT cells: what’s in a name? Nat Rev Immunol (2004) 4(3):231–7. doi: 10.1038/nri1309
2. Bendelac A, Savage PB, Teyton L. The biology of NKT cells. Annu Rev Immunol (2007) 25(1):297–336. doi: 10.1146/annurev.immunol.25.022106.141711
3. Heczey A, Liu D, Tian G, Courtney AN, Wei J, Marinova E, et al. Invariant NKT cells with chimeric antigen receptor provide a novel platform for safe and effective cancer immunotherapy. Blood (2014) 124(18):2824–33. doi: 10.1182/blood-2013-11-541235
4. Xie D, Zhu S, Bai L. Lactic acid in tumor microenvironments causes dysfunction of NKT cells by interfering with mTOR signaling. Sci China Life Sci (2016) 59(12):1290–6. doi: 10.1007/s11427-016-0348-7
5. Fu S, He K, Tian C, Sun H, Zhu C, Bai S, et al. Impaired lipid biosynthesis hinders anti-tumor efficacy of intratumoral iNKT cells. Nat Commun (2020) 11(1):438. doi: 10.1038/s41467-020-14332-x
6. Kumar A, Pyaram K, Yarosz EL, Hong H, Lyssiotis CA, Giri S, et al. Enhanced oxidative phosphorylation in NKT cells is essential for their survival and function. Proc Natl Acad Sci U S A (2019) 116(15):7439–48. doi: 10.1073/pnas.1901376116
7. Prevot N, Pyaram K, Bischoff E, Sen JM, Powell JD, Chang CH. Mammalian target of rapamycin complex 2 regulates invariant NKT cell development and function independent of promyelocytic leukemia zinc-finger. J Immunol (2015) 194(1):223–30. doi: 10.4049/jimmunol.1401985
9. Zhang CS, Jiang B, Li M, Zhu M, Peng Y, Zhang YL, et al. The lysosomal v-ATPase-Ragulator complex is a common activator for AMPK and mTORC1, acting as a switch between catabolism and anabolism. Cell Metab (2014) 20(3):526–40. doi: 10.1016/j.cmet.2014.06.014
10. Carroll B, Dunlop EA. The lysosome: a crucial hub for AMPK and mTORC1 signalling. Biochem J (2017) 474(9):1453–66. doi: 10.1042/BCJ20160780
11. Balderhaar HJK, Ungermann C. CORVET and HOPS tethering complexes – coordinators of endosome and lysosome fusion. J Cell Sci (2013) 126(6):1307–16. doi: 10.1242/jcs.107805
12. Davegardh C, Sall J, Benrick A, Broholm C, Volkov P, Perfilyev A, et al. VPS39-deficiency observed in type 2 diabetes impairs muscle stem cell differentiation via altered autophagy and epigenetics. Nat Commun (2021) 12(1):2431. doi: 10.1038/s41467-021-22068-5
13. Jin J, Kim C, Xia Q, Gould TM, Cao W, Zhang H, et al. Activation of mTORC1 at late endosomes misdirects T cell fate decision in older individuals. Sci Immunol (2021) 6(60). doi: 10.1126/sciimmunol.abg0791
14. Saxton RA, Sabatini DM. mTOR signaling in growth, metabolism, and disease. Cell (2017) 168(6):960–76. doi: 10.1016/j.cell.2017.02.004
15. Wang Y, Zhang H. Regulation of autophagy by mTOR signaling pathway. Adv Exp Med Biol (2019) 1206:67–83. doi: 10.1007/978-981-15-0602-4_3
16. González A, Hall MN, Lin SC, Hardie DG. AMPK and TOR: The yin and yang of cellular nutrient sensing and growth control. Cell Metab (2020) 31(3):472–92. doi: 10.1016/j.cmet.2020.01.015
17. Shaw RJ. LKB1 and AMP-activated protein kinase control of mTOR signalling and growth. Acta Physiol (Oxf) (2009) 196(1):65–80. doi: 10.1111/j.1748-1716.2009.01972.x
18. Méresse S, Gorvel JP, Chavrier P. The rab7 GTPase resides on a vesicular compartment connected to lysosomes. J Cell Sci (1995) 108(Pt 11):3349–58. doi: 10.1242/jcs.108.11.3349
19. Caplan S, Hartnell LM, Aguilar RC, Naslavsky N, Bonifacino JS. Human Vam6p promotes lysosome clustering and fusion in vivo. J Cell Biol (2001) 154(1):109–22. doi: 10.1083/jcb.200102142
20. Feng Y, Press B, Wandinger-Ness A. Rab 7: an important regulator of late endocytic membrane traffic. J Cell Biol (1995) 131(6 Pt 1):1435–52. doi: 10.1083/jcb.131.6.1435
21. Camara AKS, Zhou Y, Wen PC, Tajkhorshid E, Kwok WM. Mitochondrial VDAC1: A key gatekeeper as potential therapeutic target. Front Physiol (2017) 8:460. doi: 10.3389/fphys.2017.00460
22. McEwen-Smith RM, Salio M, Cerundolo V. The regulatory role of invariant NKT cells in tumor immunity. Cancer Immunol Res (2015) 3(5):425–35. doi: 10.1158/2326-6066.CIR-15-0062
23. Gonzalez Montoro A, Auffarth K, Honscher C, Bohnert M, Becker T, Warscheid B, et al. Vps39 interacts with Tom40 to establish one of two functionally distinct vacuole-mitochondria contact sites. Dev Cell (2018) 45(5):621–36 e7. doi: 10.1016/j.devcel.2018.05.011
24. Peng W, Wong YC, Krainc D. Mitochondria-lysosome contacts regulate mitochondrial Ca(2+) dynamics via lysosomal TRPML1. Proc Natl Acad Sci United States America (2020) 117(32):19266–75. doi: 10.1073/pnas.2003236117
25. Yu W, Sun S, Xu H, Li C, Ren J, Zhang Y. TBC1D15/RAB7-regulated mitochondria-lysosome interaction confers cardioprotection against acute myocardial infarction-induced cardiac injury. Theranostics (2020) 10(24):11244–63. doi: 10.7150/thno.46883
26. Wong YC, Ysselstein D, Krainc D. Mitochondria-lysosome contacts regulate mitochondrial fission via RAB7 GTP hydrolysis. Nature (2018) 554(7692):382–6. doi: 10.1038/nature25486
27. Jimenez-Orgaz A, Kvainickas A, Nagele H, Denner J, Eimer S, Dengjel J, et al. Control of RAB7 activity and localization through the retromer-TBC1D5 complex enables RAB7-dependent mitophagy. EMBO J (2018) 37(2):235–54. doi: 10.15252/embj.201797128
28. Peralta ER, Martin BC, Edinger AL. Differential effects of TBC1D15 and mammalian Vps39 on Rab7 activation state, lysosomal morphology, and growth factor dependence*. J Biol Chem (2010) 285(22):16814–21. doi: 10.1074/jbc.M110.111633
29. Wurmser AE, Sato TK, Emr SD. New component of the vacuolar class c-vps complex couples nucleotide exchange on the Ypt7 GTPase to SNARE-dependent docking and fusion. J Cell Biol (2000) 151(3):551–62. doi: 10.1083/jcb.151.3.551
30. Valbuena N, Guan KL, Moreno S. The Vam6 and Gtr1-Gtr2 pathway activates TORC1 in response to amino acids in fission yeast. J Cell Sci (2012) 125(Pt 8):1920–8. doi: 10.1242/jcs.094219
Keywords: Vam6, mTORC1, AMPK, Rab7a-Vam6-AMPK complex, iNKT cells
Citation: Bai S, Wu Q, Zhu S, Zhang Y, Chen X, Su M, Pan J, Li S, Yue T, Xu L, Xie D, Tian C, Zhao D, Li X, Hou J, Wang L, Fu S, Xue Y, Jiang A, Li D, Xu T, Tian Z, Zhou R, Zhang H and Bai L (2023) Vam6 reduces iNKT cell function in tumor via modulating AMPK/mTOR pathways. Front. Immunol. 13:1051045. doi: 10.3389/fimmu.2022.1051045
Received: 12 October 2022; Accepted: 30 December 2022;
Published: 19 January 2023.
Edited by:
Luc Van Kaer, Vanderbilt University Medical Center, United StatesReviewed by:
Masaki Terabe, National Cancer Institute (NIH), UnIted StatesTonya J. Webb, University of Maryland, Baltimore, United States
Shin-ichiro Fujii, RIKEN Center for Integrative Medical Sciences (IMS), Japan
Copyright © 2023 Bai, Wu, Zhu, Zhang, Chen, Su, Pan, Li, Yue, Xu, Xie, Tian, Zhao, Li, Hou, Wang, Fu, Xue, Jiang, Li, Xu, Tian, Zhou, Zhang and Bai. This is an open-access article distributed under the terms of the Creative Commons Attribution License (CC BY). The use, distribution or reproduction in other forums is permitted, provided the original author(s) and the copyright owner(s) are credited and that the original publication in this journal is cited, in accordance with accepted academic practice. No use, distribution or reproduction is permitted which does not comply with these terms.
*Correspondence: Huimin Zhang, hmzhang@ustc.edu.cn; Li Bai, baili@ustc.edu.cn
†These authors have contributed equally to this work
‡ORCID: Li Bai, orcid.org/0000000290281920