
94% of researchers rate our articles as excellent or good
Learn more about the work of our research integrity team to safeguard the quality of each article we publish.
Find out more
ORIGINAL RESEARCH article
Front. Immunol., 20 October 2022
Sec. Viral Immunology
Volume 13 - 2022 | https://doi.org/10.3389/fimmu.2022.1029006
This article is part of the Research TopicModulation of the Adaptive Immune Responses and the Chronicity of Infections with Enveloped VirusesView all 7 articles
 Lucy Kundura1*
 Renaud Cezar2
 Sonia André3
 Mauricio Campos-Mora4
 Claire Lozano5
 Thierry Vincent5Laurent Muller6
 Jean-Yves Lefrant6Claire Roger6Pierre-Géraud Claret7Sandra Duvnjak8
 Paul Loubet9
 Albert Sotto9Tu-Ahn Tran10
 Jérôme Estaquier3,11†
 Pierre Corbeau1,2†
T cell cytotoxicity plays a major role in antiviral immunity. Anti-SARS-CoV-2 immunity may determine acute disease severity, but also the potential persistence of symptoms (long COVID). We therefore measured the expression of perforin, a cytotoxic mediator, in T cells of patients recently hospitalized for SARS-CoV-2 infection. We recruited 54 volunteers confirmed as being SARS-CoV-2-infected by RT-PCR and admitted to Intensive Care Units (ICUs) or non-ICU, and 29 age- and sex-matched healthy controls (HCs). Amounts of intracellular perforin and granzyme-B, as well as cell surface expression of the degranulation marker CD107A were determined by flow cytometry. The levels of 15 cytokines in plasma were measured by Luminex. The frequency of perforin-positive T4 cells and T8 cells was higher in patients than in HCs (9.9 ± 10.1% versus 4.6 ± 6.4%, p = 0.006 and 46.7 ± 20.6% vs 33.3 ± 18.8%, p = 0.004, respectively). Perforin expression was neither correlated with clinical and biological markers of disease severity nor predictive of death. By contrast, the percentage of perforin-positive T8 cells in the acute phase of the disease predicted the onset of long COVID one year later. A low T8 cytotoxicity in the first days of SARS-CoV-2 infection might favor virus replication and persistence, autoimmunity, and/or reactivation of other viruses such as Epstein-Barr virus or cytomegalovirus, paving the way for long COVID. Under this hypothesis, boosting T cell cytotoxicity during the acute phase of the infection could prevent delayed sequelae.
Coronavirus disease 2019 (COVID-19) develops in certain individuals infected with SARS-CoV-2, mostly as acute respiratory distress syndrome (ARDS) (1). Acute immune activation, including a cytokine storm and T cell death, appear to be a major driver of disease severity (2–4). Moreover, around half of hospitalized COVID-19 patients (31%-69%), and 10% of all patients, present long-term sequelae from COVID-19 (long COVID) (5, 6). Long COVID was defined in October 2021 by the World Health Organization as de novo or persisting symptoms 3 months after the onset of COVID-19 and lasting at least 2 months (7). Several pathophysiological hypotheses have been proposed to explain the onset of long COVID. Firstly, as the SARS-CoV-2 receptor ACE2 is expressed on the surface of a myriad of epithelial and endothelial cells, the cytopathic effect of SARS-CoV-2 may cause long-term tissue damage (8, 9). Secondly, various authors have suggested that the detected of SARS-CoV-2 (10) or at least some of its fragments (11) in blood, urine and/or stools (12) may mediate long COVID. Thirdly, autoimmune phenomena have also been reported in long-term recovered patients (13–17), and may also explain certain forms of long COVID (18). Indeed, autoantibodies and autoreactive T cells have been observed on the autopsies of deceased patients (19, 20). Such autoimmunity might lead to chronic inflammation, organ damage and the subsequent development of symptoms (13, 16, 17). Finally, Gold et al. observed a link between long COVID and anti-Epstein-Barr Virus (EBV) antibody titer (21), and Su et al. between fatigue, sputum as well as memory impairment and EBV viremia (22). The frequency of anti-Cytomegalovirus (CMV) cytotoxic CD8 T cells has also been associated with gastrointestinal sequelae of COVID-19 (22). This suggests that EBV or CMV reactivation might contribute to long COVID.
Cytotoxic T lymphocytes (CTL) are important participants in the immune response to respiratory viral infections, including coronavirus (23). They may kill infected cells by releasing perforin and granzyme, once triggered by a specific antigen on the surface of the target, specifically recognized by the T cell receptor. Although classical CTL are CD8-positive, CD4 CTL have been described in the context of infection, particularly viral infections, vaccination, and cancer (24).
Because CTL participate in viral clearance, limit tissue lesions, prevent virus reactivation, and as cytotoxic deficiency may favor autoimmunity (25, 26), we reasoned that T cell cytotoxicity might play a role, not only during acute SARS-CoV-2 infection, but also in the development of long COVID. We therefore analyzed T4 and T8 cell perforin expression in patients hospitalized for severe SARS-CoV-2 infection and looked for links between this expression and acute disease severity as well as chronic symptomatology.
All patients were confirmed as being SARS-CoV-2-infected by RT-PCR. They were admitted to an intensive care unit (ICU) for oxygen saturation <90% in ambient air or <95% with 5L/mn of oxygenotherapy and/or arterial oxygen tension (PaO2) of less than 60 mm Hg or admitted to a non-ICU for oxygen saturation <96% in ambient air at Nîmes University Hospital, France. This study was approved by the French Île-de-France 1 Ethics Committee. All patients had provided written informed consent. The trial was registered on ClinicalTrials.gov under the reference NCT04351711. Sixteen mL of blood was drawn once on EDTA on the day of admission. Plasma and peripheral blood mononuclear cells (PBMC) were isolated and frozen at -80°C.
Perforin and granzyme B expression was determined by two independent rounds of intracellular PBMC labeling. Cells were first thawed, washed twice and counted. 200 000 cells were surface-labeled with the following antibody panel: CD45-KrO/CD3-APC-A750/CD8-APC/CD4-APC-A700 (Beckman Coulter), and CD107A-PE (Clone H4A3, Biolegend). The cells were then fixed using TQ Perp (Beckman Coulter) and permeabilized for Perforin (Clone REA-1061, human IgG1, 1:50 dilution, Myltenyi Biotec) and granzyme B (Invitrogen) labeling using a cytofix-cytoperm kit (Becton-Dickinson), according to the Multicolor Staining for Cell Surface Antigens and Intracellular Cytokines protocol. Labeled and fixed cells were washed, re-suspended in PBS, and the percentages of perforin- and granzyme B-positive cells were measured by flow cytometry using the Beckman Coulter Navios apparatus. Gating for cells positive for perforin and CD107A cells was determined using isotype controls (PE Mouse IgG1, Clone MOPC-21, Biolegend for CD107A and REAfinity human IgG1 Clone 293, Myltenyi Biotec, for perforin). Analyses were performed using Kaluza software.
The number of peripheral blood lymphocytes and monocytes were determined by a Sysmex XN-10 automated hematology analyzer. C-reactive protein (CRP) and lactate dehydrogenase (LDH) in the plasma were quantified by turbidimetry.
Biomarker levels (IL-1-beta, IL-4, IL-6, IL-8, IL-10, IL-12p70, IL-13, IL-17A, GM-CSF, IFN-alpha, IFN-gamma, MIP-1alpha, MIP-1beta, TNF-alpha, IP-10) were measured by Luminex/xMAP immunoassays (ProcartaPlex, ThermoFisher Scientific) in 1:2 diluted plasma according to the manufacturer’s instructions.
Statistical analyses and graphical presentations were computed with GraphPad Prism version 6. The values indicated are means ± standard deviations. The d’Agostino and Pearson normality test was performed. Differences between two groups were analyzed using a two-sided unpaired student’s t test or Mann-Whitney test as appropriate. We used a two-sided Spearman rank test to evaluate correlations. A p-value of <0.05 was considered statistically significant.
Patient characteristics are shown in Table 1. We included 28 (52%) females and 26 (48%) males with a mean ± SD age of 69.0 ± 17.5 years. Twenty-nine age- (63.7 ± 19.0 vs 69.0 ± 17.5 years, p = 0.277) and sex- (41% vs 52% females, p = 0.490) matched negative controls, presenting no infectious, autoimmune or tumoral diseases, and not treated with any immunomodulatory drugs were also recruited.
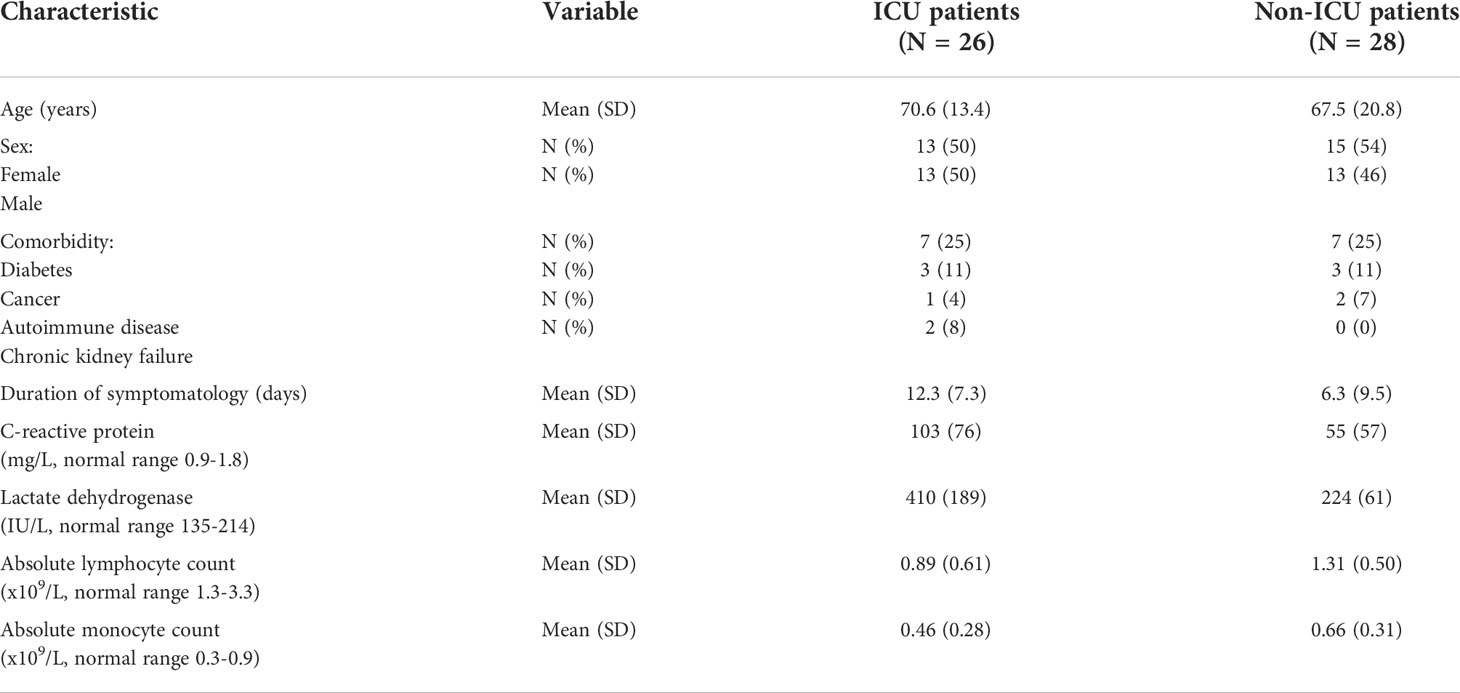
Table 1 Patient characteristics.
Perforin expression in T lymphocytes was measured by flow cytometry according to the gating strategy shown in Figure 1. The proportion of T4 cells positive for perforin was higher in patients than in controls (9.9 ± 10.1% versus 4.6 ± 6.4%, p = 0.006, Figure 2A). Compared with negative controls, we observed that the percentage of perforin-positive T8 cells was also higher in patients than in controls (46.7 ± 20.6% vs 33.3 ± 18.8%, p = 0.004, Figure 2B). In patients, the proportion of T4 cells harboring perforin was linked to the proportion of T4 cells harboring granzyme B (r = 0.586, p < 0.001, Figure 2C). The same was true for T8 cells (r = 0.431, p = 0.016, Figure 2D). We also assessed the proportions of degranulated T cells using the CD107A marker (27). Although perforin and CD107A expressions were not at all linked in T4 cells (r = 0.009, p = 0.949, Figure 2E), we observed an inverse correlation between the percentage of perforin-positive T8 cells and the percentage of CD107A-positive T8 cells (r = -0.310, p = 0.021, Figure 2F).

Figure 1 Gating strategy for the identification of T4 cells expressing perforin and/or CD107A.
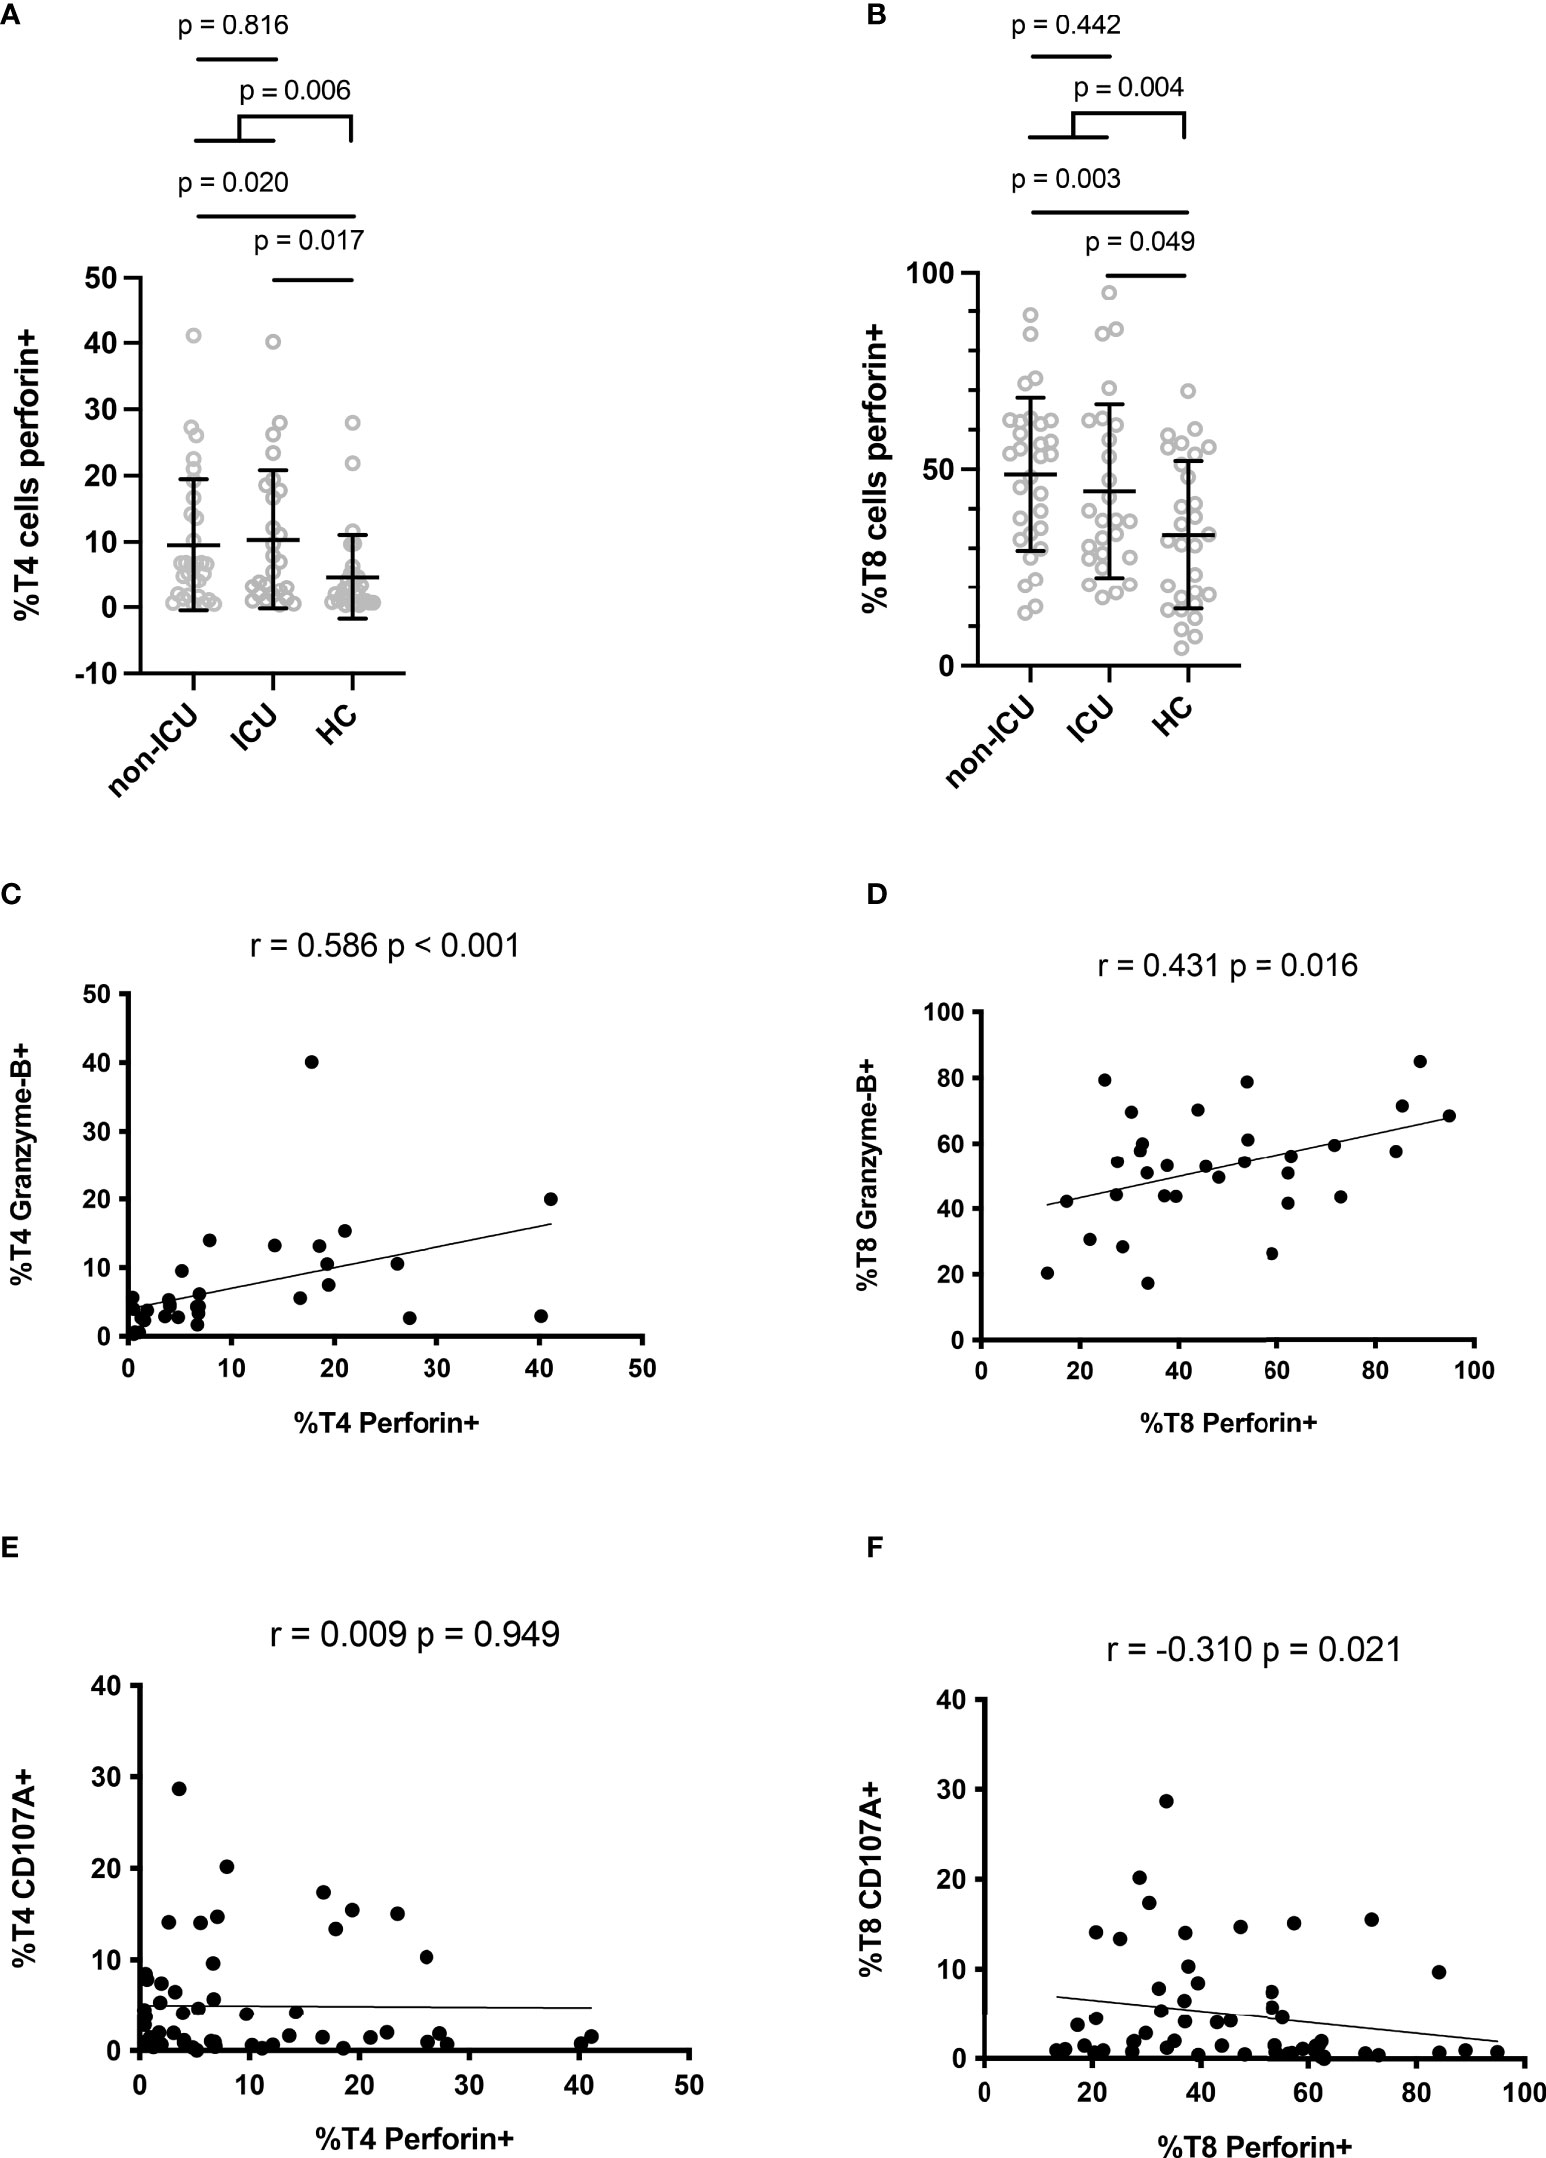
Figure 2 Perforin expression in CD4+ (A) and CD8+ (B) lymphocytes. Correlation between perforin and granzyme B expressions in CD4+ (C) and CD8+ (D) lymphocytes. Correlation between perforin and CD107A expressions in CD4+ (E) and CD8+ (F) lymphocytes.
As perforin expression in T cells represents a potential ability to lyse SARS-CoV-2-infected cells, we investigated whether this expression was linked to disease severity.
Of note, ICU patients presented similar percentages of perforin-positive T4 cells (10.3 ± 10.5% versus 9.5 ± 10.0%, p = 0.816, Figure 2A) and T8 cells (44.5 ± 22.0% versus 48.7 ± 19.4%, p = 0.442, Figure 2B) as non-ICU patients. We then looked for correlations between perforin expression and two biomarkers of severity, CRP, an inflammation marker, and LDH, a tissue damage marker. Perforin expression in T4 and T8 cells was linked neither to CRP (r = 0.114, p = 0.473, Figure 3A and r = 0.077, p = 0.629, Figure 3B, respectively), nor to LDH (r = -0.118, p = 0.558, Figure 3C, and r = -0.146, p = 0.468, Figure 3D, respectively). As lymphopenia and monocytopenia (28) are also two markers of disease severity, we also searched for correlations between the level of perforin expressed in T4 and T8 cells and lymphocyte as well as monocyte counts. Here again, we observed no correlation (Figures 3E–H). Many cytokine plasma levels have been reported to be higher during the cytokine storm observed in SARS-CoV-2 infection (29). We measured TNF-alpha, IL-1beta, IL-4, IL-6, IL-8, IL-10, IL-12p70, IL-13, IL-17A, IFNalpha, IFNgamma, GM-CSF and the chemokines MIP-1alpha/CCL3, MIP-1beta/CCL4, and IP-10/CXCL10 in the volunteer plasmas. We found no link between perforin expression in T cells and the measured concentrations of these biomarkers of disease severity (Table 2).
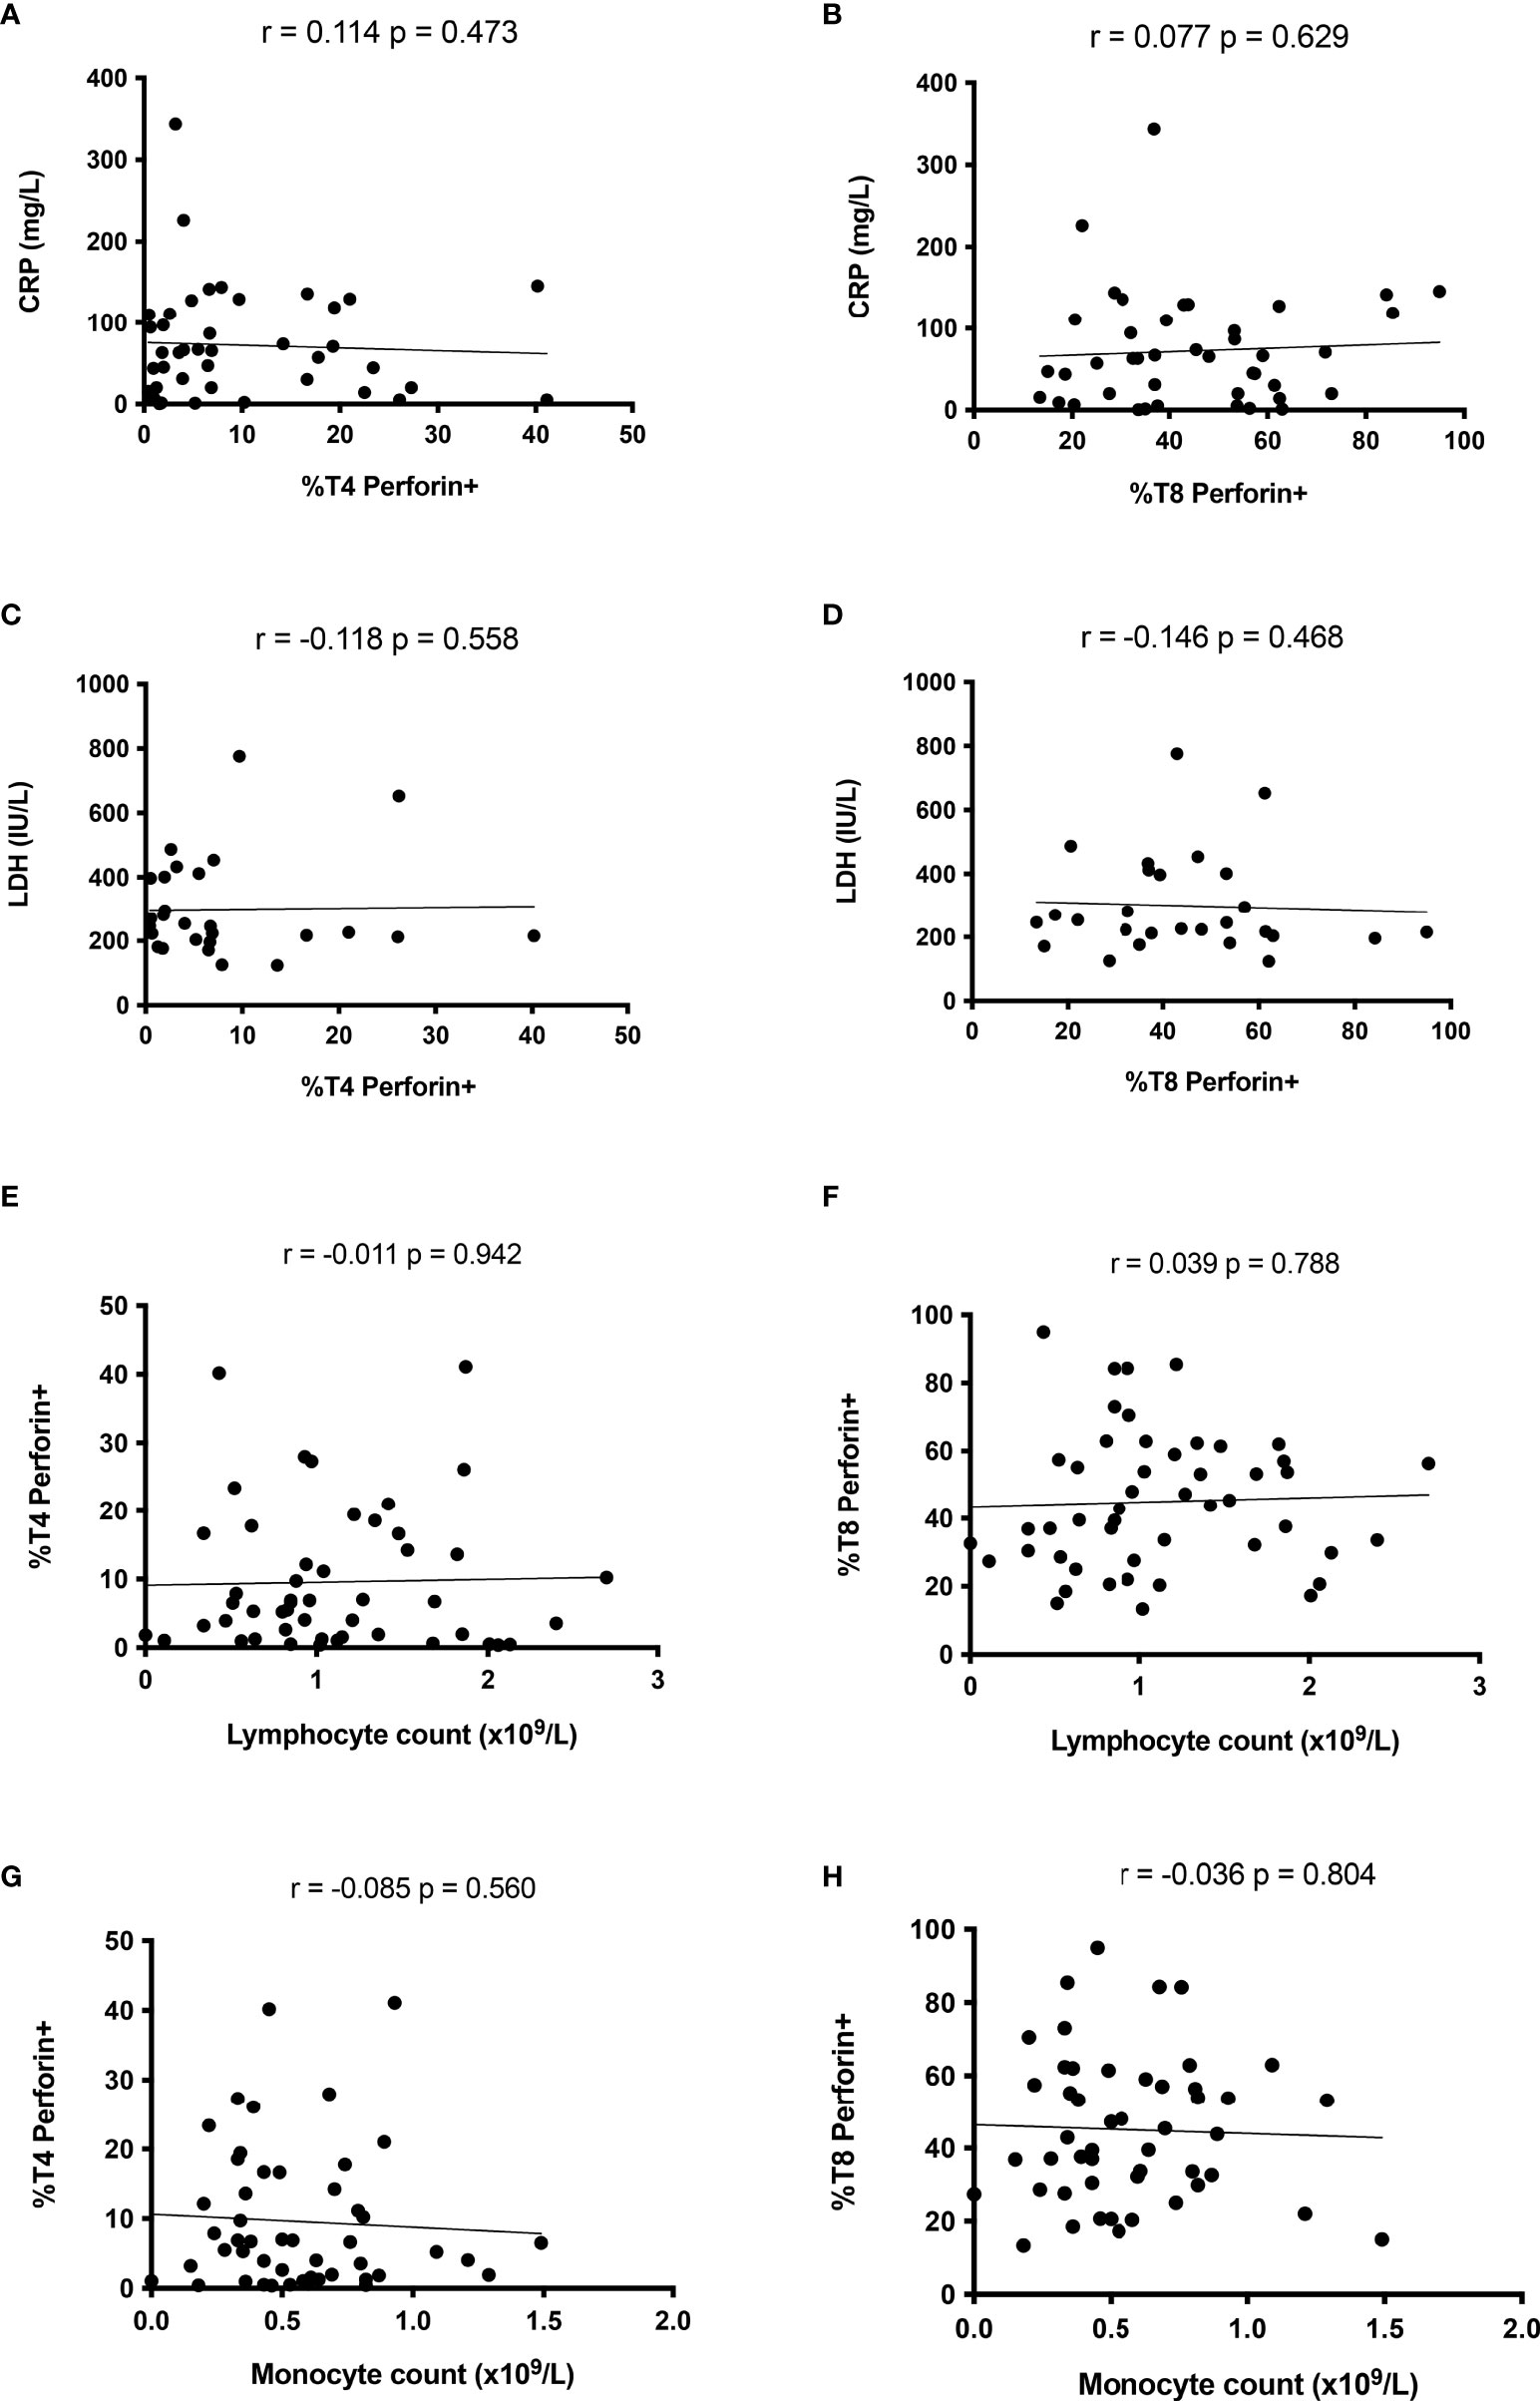
Figure 3 Perforin expression in T cells is not linked to disease severity during the acute phase of SARS-CoV-2 infection. Absence of correlation between perforin expression in CD4+ lymphocytes and CRP (A), LDH (C), lymphocyte (E) and monocyte (G) counts. Perforin expression in CD8+ lymphocyte is linked neither to CRP (B), LDH (D) nor to lymphocyte (F) or monocyte (H) counts.
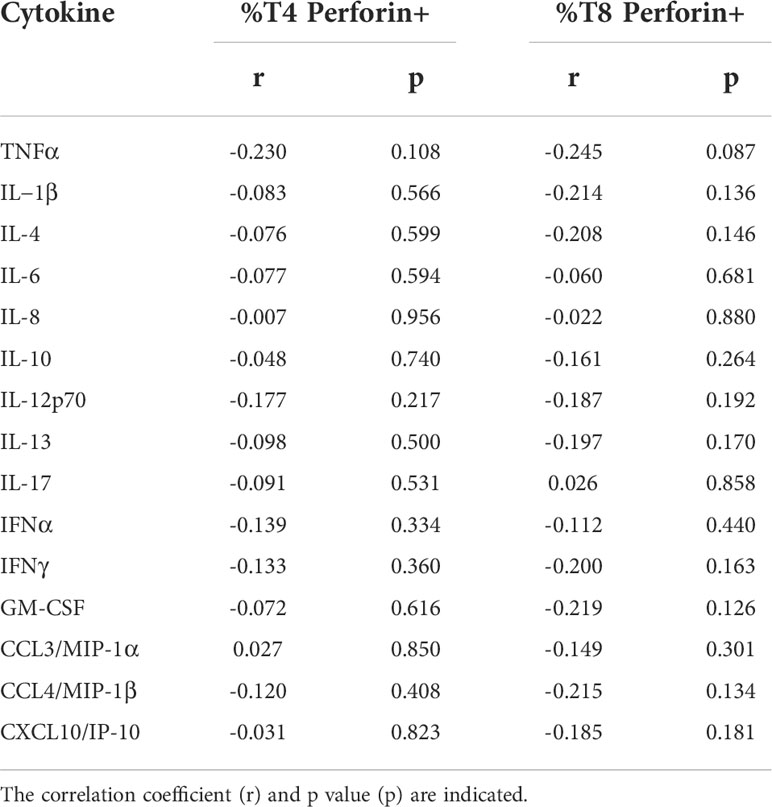
Table 2 Absence of correlation between the frequency of perforin-positive T4 cells and T8 cells and the plasma level of 15 biomarkers of COVID-19 severity.
Finally, we tested whether low perforin expression could predict an adverse prognosis. No difference in the percentage of perforin-positive T4 (8.8 ± 8.2% versus 15.2 ± 16.1%, p = 0.533, Figure 4A) and T8 (42.0 ± 19.7% versus 52.6 ± 29.0%, p = 0.421, Figure 4B) cells was noted between ICU patients who survived and those who did not.
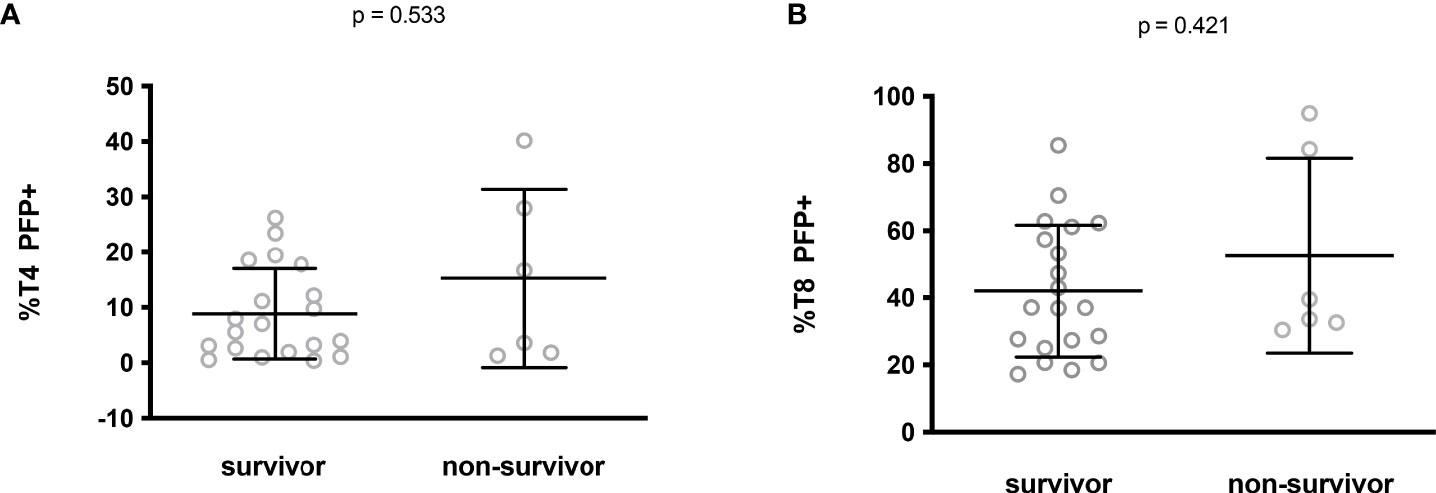
Figure 4 Perforin expression in CD4+ (A) and CD8+ (B) lymphocytes from ICU patients who survived or not.
Altogether these data show the absence of any link between perforin expression in T cells and disease severity.
Cytotoxic T4 and T8 cells are involved in antiviral defense. The persistence of SARS-CoV-2 or some of its components (10–12) and the reactivation of other viruses, such as cytomegalovirus or Epstein-Barr viruses (21, 22), have been proposed as potential causes of long COVID. Another possible driver of long COVID is autoimmunity (13, 16, 17) which may be favored by a deficiency in T cell cytotoxicity (25, 26). We therefore tested the hypothesis that a relatively low amount of perforin in T cells during the first days of SARS-CoV-2 infection might promote the development of long COVID. To this aim, we followed 23 patients for 13.3 ± 0.6 months after the acute phase of SARS-CoV-2 infection. Thirteen of them developed long COVID according to the WHO criteria (7). 54% presented fatigue, sleep disorders and cognitive dysfunction, 31% presented shortness of breath, 15% anxiety and tachycardia/palpitations and 8% depression. We observed no difference in T4 perforin expression during the acute phase of infection between patients who developed long COVID 13 months later or not (7.2 ± 8.3% versus 6.9 ± 3.8%, p = 0.919, Figure 5A). By contrast, we found that patients with the lowest amount of perforin in their T8 cells during the acute phase of infection more often had persistent symptoms one year after (37.0 ± 19.2% versus 53.7 ± 18.4%, p = 0.048, Figure 5B).
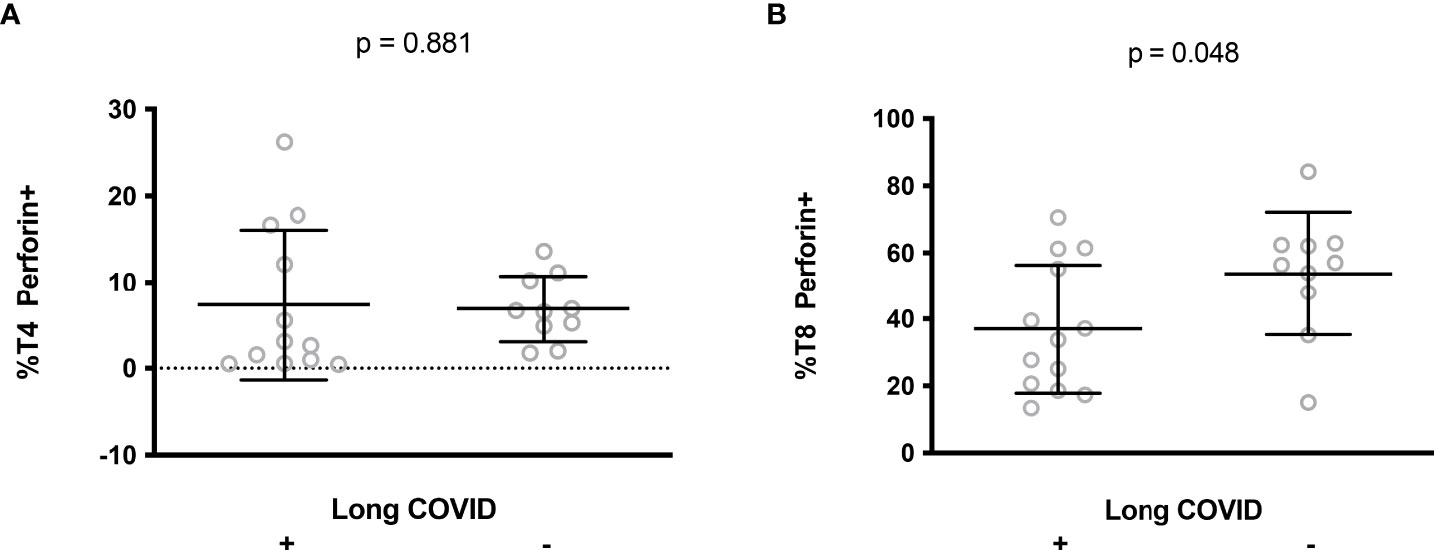
Figure 5 Perforin expression in CD4+ (A) and CD8+ (B) lymphocytes during the acute phase of infection in patients who later developed long COVID or not.
Contradictory data have been published on T8 cell perforin expression and cytotoxicity in COVID-19 patients. Some articles report low levels of perforin-positive T cells (30, 31) and T cell cytotoxicity (32), whereas others describe high levels of perforin-positive T cells (33, 34) and T cell cytotoxicity (35). In the present study, we found a high prevalence of perforin-positive T4 cells and T8 cells in patients hospitalized with COVID-19. These discrepancies may be due to differences in the patients recruited. For instance, Singh et al. reported a low proportion of T8 cells expressing granzyme A and coexpressing granzyme A and perforin, but they recruited patients with mild and moderate COVID-19 (31). Results may also depend on the T8 subpopulation analyzed. Thus, in critically ill patients who died, Adam et al. observed a lower percentage of granzyme B- and perforin-positive T8 cells, but among effector memory cells (30).
CD4 CTL have been reported in the blood (36–38), lymph node and lungs (39) of COVID-19 patients and in the lungs of SARS-CoV-2-infected pig-tailed macaque monkeys (40). Type I IFN (41) and IL-6 (42) have been reported to promote CD4 CTL development, and IL-4 to inhibit it (24). Yet, we found no link between the plasma level of these cytokines and the frequency of T4 cells expressing perforin (Table 2). Apart from its role in infection (43) and cancer, this T4 subpopulation has been involved in autoimmune diseases, including rheumatoid arthritis (44), ankylosing spondylitis (45), multiple sclerosis (46), and Sjögren syndrome (47). Yet, we found no link in our study between the frequency of CD4 CTL and long COVID. Thus, the potential pro-autoimmune effect of CD4 CTL does not seem to be involved in the post-acute sequelae of SARS-CoV-2 infection.
It is worth noting that our data argue against the hypothesis of perforin deficiency as a cause of cytokine storm in SARS-CoV-2 infection. This hypothesis was proposed due to some common features shared by COVID-19 and hemophagocytic lymphohistiocytosis (48, 49). Indeed, hemophagocytic lymphohistiocytosis, characterized by fever, cytopenia, hyperferritinemia, an increase in soluble CD25, high triglyceridemia, low fibrinogenemia and cytokine storm, possibly triggered by a viral infection, may be due to a primary defect in perforin production (49). The putative link between perforin deficiency and cytokine storm is based on the observation that perforin-deficient cytotoxic cells overproduce cytokines (50), and that cytotoxic cells might kill activated NK, T and antigen-presenting cells, thereby downregulating immune activation (51, 52). Yet, many of our data are incompatible with this scenario, since i) perforin content was not lower in T cells, ii) perforin and granzyme B expression in T cells were linked, iii) perforin expression in T8 cells was anti-correlated with degranulation, suggesting that any low perforin content in T8 cells was due to consumption rather than a primary deficiency, and iv) T cell perforin expression was not linked to any of the markers of disease severity that we analyzed, and was not predictive of death.
Not only did we fail to find any argument in favor of perforin deficiency, but we also found increased expression of perforin in T cells. Type I IFN (53) and IL-6 (54, 55) have been reported to promote CD8 CTL development. Yet we found no positive correlation between the level of production of these cytokines and the frequency of T8 cells expressing perforin (Table 2). Therefore, either IFNα and IL-6 did not drive T8 lymphocyte perforin production in our cohort, or their effect was counterbalanced by consumption.
A major finding in our study is that low T8 cell perforin expression in the acute phase of infection predicts the presence of long COVID a year later. This observation is in line with the lower frequency of T8 cells expressing CD107a in response to nucleocapsid, as reported by Peluso et al. in long COVID patients (56). A causal link may be proposed for the following reasons. First, the low proportion of perforin-positive T8 cells, either due to low perforin production and/or high perforin consumption, may result in defective CTL activity favoring the replication and persistence of SARS-CoV-2 and, thereby, tissue damage, a potential cause of long COVID (8, 9). Second, perforin deficiency promotes autoimmunity (25, 26), another mechanism which could be involved in the development of long COVID. Finally, a defect in cell cytotoxicity might pave the way for EBV or CMV reactivation favoring long COVID.
This raises the hypothesis that T8 cell perforin insufficiency may have a causal role in the development of long COVID. It also suggests the interest of administering drugs like Type-I interferons, for example, to boost perforin expression during the acute phase of infection, thus preventing long COVID.
The raw data supporting the conclusions of this article will be made available by the authors, without undue reservation.
The studies involving human participants were reviewed and approved by French Ethics Committee, Île-de-France 1. The patients/participants provided their written informed consent to participate in this study.
LK, SA, MC, CL and TV contributed to the conception and design of the flow cytometry study, acquired, analyzed and interpreted cell surface marker data. RC acquired, analyzed and interpreted soluble marker data. LM, J-YL, CR, P-GC, SD, PL, AS, and T-AT contributed to the conception and design of the study, patient enrolment and acquired, analyzed and interpreted the clinical data. JE and PC contributed to the conception and design of the study, analyzed and interpreted the data and wrote the first draft of the manuscript. All authors revised and approved the final version.
The study was funded by Nîmes University Hospital (grant NIMAO/2020/COVID/PC-0), ANR/FRM (grant 216261), and AbbVie. JE thanks the Canada Research Chair program for its financial support. These sponsors had no role, either in the study design, collection, analysis, interpretation of data, writing the report, or in the decision to submit the paper for publication.
We are most grateful to all those who volunteered for this study, to Teresa Sawyers, Medical Writer at the BESPIM, Nîmes University Hospital, France, for revising this manuscript, and to the Centre de Ressources Biologiques, Nîmes University Hospital, France.
The authors declare that the research was conducted in the absence of any commercial or financial relationships that could be construed as a potential conflict of interest.
All claims expressed in this article are solely those of the authors and do not necessarily represent those of their affiliated organizations, or those of the publisher, the editors and the reviewers. Any product that may be evaluated in this article, or claim that may be made by its manufacturer, is not guaranteed or endorsed by the publisher.
1. Huang C, Wang Y, Li X, Ren L, Zhao J, Hu Y, et al. Clinical features of patients infected with 2019 novel coronavirus in wuhan, China. Lancet (2020) 395(10223):497–506. doi: 10.1016/S0140-6736(20)30183-5
2. Hadjadj J, Yatim N, Barnabei L, Corneau A, Boussier J, Smith N, et al. Impaired type I interferon activity and inflammatory responses in severe COVID-19 patients. Science (2020) 369(6504): 718–24. doi: 10.1101/2020.04.19.20068015
3. Andre S, Picard M, Cezar R, Roux-Dalvai F, Alleaume-Butaux A, Soundaramourty C, et al. T Cell apoptosis characterizes severe covid-19 disease. Cell Death Differ (2022) 29(8):1486–99. doi: 10.1038/s41418-022-00936-x
4. Kundura L, Gimenez S, Cezar R, Andre S, Younas M, Lin YL, et al. Angiotensin II induces reactive oxygen species, DNA damage, and T cell apoptosis in severe COVID-19. J Allergy Clin Immunol (2022) 150(3):594–603. doi: 10.1016/j.jaci.2022.06.020
5. Groff D, Sun A, Ssentongo AE, Ba DM, Parsons N, Poudel GR, et al. Short-term and long-term rates of postacute sequelae of SARS-CoV-2 infection: A systematic review. JAMA Netw Open (2021) 4(10):e2128568. doi: 10.1001/jamanetworkopen.2021.28568
6. Carfì A, Bernabei R, Landi F, Gemelli Against COVID-19 Post-Acute Care Study Group. Persistent symptoms in patients after acute COVID-19. JAMA (2020) 324(6):603–5. doi: 10.1001/jama.2020.12603
7. Available at: https://www.who.int/publications/i/item/WHO-2019-nCoV-Post_COVID-19_condition-Clinical_case_definition-2021.1.
8. Nalbandian A, Sehgal K, Gupta A, Madhavan MV, McGroder C, Stevens JS, et al. Post-acute COVID-19 syndrome. Nat Med (2021) 27(4):601–15. doi: 10.1038/s41591-021-01283-z
9. Sollini M, Ciccarelli M, Cecconi M, Aghemo A, Morelli P, Gelardi F, et al. Vasculitis changes in COVID-19 survivors with persistent symptoms: An [(18)F]FDG-PET/CT study. Eur J Nucl Med Mol Imaging (2021) 48(5):1460–6. doi: 10.1007/s00259-020-05084-3
10. Ye G, Pan Z, Pan Y, Deng Q, Chen L, Li J, et al. Clinical characteristics of severe acute respiratory syndrome coronavirus 2 reactivation. J Infect (2020) 80(5):e14–e7. doi: 10.1016/j.jinf.2020.03.001
11. Ramakrishnan RK, Kashour T, Hamid Q, Halwani R, Tleyjeh IM. Unraveling the mystery surrounding post-acute sequelae of COVID-19. Front Immunol (2021) 12:686029. doi: 10.3389/fimmu.2021.686029
12. Tejerina F, Catalan P, Rodriguez-Grande C, Adan J, Rodriguez-Gonzalez C, Munoz P, et al. Post-COVID-19 syndrome. SARS-CoV-2 RNA detection in plasma, stool, and urine in patients with persistent symptoms after COVID-19. BMC Infect Dis (2022) 22(1):211. doi: 10.1186/s12879-022-07153-4
13. Proal AD, VanElzakker MB. Long COVID or post-acute sequelae of COVID-19 (PASC): An overview of biological factors that may contribute to persistent symptoms. Front Microbiol (2021) 12:698169. doi: 10.3389/fmicb.2021.698169
14. Wang EY, Mao T, Klein J, Dai Y, Huck JD, Jaycox JR, et al. Diverse functional autoantibodies in patients with COVID-19. Nature (2021) 595(7866):283–8. doi: 10.1038/s41586-021-03631-y
15. Marino Gammazza A, Légaré S, Lo Bosco G, Fucarino A, Angileri F, Conway de Macario E, et al. Human molecular chaperones share with SARS-CoV-2 antigenic epitopes potentially capable of eliciting autoimmunity against endothelial cells: possible role of molecular mimicry in COVID-19. Cell Stress Chaperones (2020) 25(5):737–41. doi: 10.1007/s12192-020-01148-3
16. Richter AG, Shields AM, Karim A, Birch D, Faustini SE, Steadman L, et al. Establishing the prevalence of common tissue-specific autoantibodies following severe acute respiratory syndrome coronavirus 2 infection. Clin Exp Immunol (2021) 205(2):99–105. doi: 10.1111/cei.13623
17. Sapkota HR, Nune A. Long COVID from rheumatology perspective - A narrative review. Clin Rheumatol (2022) 41(2):337–48. doi: 10.1007/s10067-021-06001-1
18. Galeotti C, Bayry J. Autoimmune and inflammatory diseases following COVID-19. Nat Rev Rheumatol (2020) 16(8):413–4. doi: 10.1038/s41584-020-0448-7
19. Knight JS, Caricchio R, Casanova JL, Combes AJ, Diamond B, Fox SE, et al. The intersection of COVID-19 and autoimmunity. J Clin Invest (2021) 131(24): e154886. doi: 10.1172/JCI154886
20. Ehrenfeld M, Tincani A, Andreoli L, Cattalini M, Greenbaum A, Kanduc D, et al. Covid-19 and autoimmunity. Autoimmun Rev (2020) 19(8):102597. doi: 10.1016/j.autrev.2020.102597
21. Gold JE, Okyay RA, Licht WE, Hurley DJ. Investigation of long COVID prevalence and its relationship to Epstein-Barr virus reactivation. Pathogens (2021) 10(6): 763. doi: 10.3390/pathogens10060763
22. Su Y, Yuan D, Chen DG, Ng RH, Wang K, Choi J, et al. Multiple early factors anticipate post-acute COVID-19 sequelae. Cell (2022) 185(5): 881–95. doi: 10.1016/j.cell.2022.01.014.
23. Schmidt ME, Varga SM. The CD8 T cell response to respiratory virus infections. Front Immunol (2018) 9:678. doi: 10.3389/fimmu.2018.00678
24. Juno JA, van Bockel D, Kent SJ, Kelleher AD, Zaunders JJ, Munier CM. Cytotoxic CD4 T cells-friend or foe during viral infection? Front Immunol (2017) 8:19. doi: 10.3389/fimmu.2017.00019
25. Shustov A, Luzina I, Nguyen P, Papadimitriou JC, Handwerger B, Elkon KB, et al. Role of perforin in controlling b-cell hyperactivity and humoral autoimmunity. J Clin Invest. (2000) 106(6):R39–47. doi: 10.1172/JCI8876
26. Peng SL, Moslehi J, Robert ME, Craft J. Perforin protects against autoimmunity in lupus-prone mice. J Immunol (1998) 160(2):652–60.
27. Betts MR, Brenchley JM, Price DA, De Rosa SC, Douek DC, Roederer M, et al. Sensitive and viable identification of antigen-specific CD8+ T cells by a flow cytometric assay for degranulation. J Immunol Methods (2003) 281(1-2):65–78. doi: 10.1016/S0022-1759(03)00265-5
28. Fan BE, Chong VCL, Chan SSW, Lim GH, Lim KGE, Tan GB, et al. Hematologic parameters in patients with COVID-19 infection. Am J Hematol (2020) 95(6):E131–E4. doi: 10.1002/ajh.25774
29. Liu Y, Zhang C, Huang F, Yang Y, Wang F, Yuan J, et al. Elevated plasma levels of selective cytokines in COVID-19 patients reflect viral load and lung injury. Natl Sci Rev (2020) 7(6):1003–11. doi: 10.1093/nsr/nwaa037
30. Adam L, Rosenbaum P, Quentric P, Parizot C, Bonduelle O, Guillou N, et al. CD8+PD-L1+CXCR3+ polyfunctional T cell abundances are associated with survival in critical SARS-CoV-2-infected patients. JCI Insight (2021) 6(18): e151571. doi: 10.1172/jci.insight.151571
31. Singh Y, Trautwein C, Fendel R, Krickeberg N, Berezhnoy G, Bissinger R, et al. SARS-CoV-2 infection paralyzes cytotoxic and metabolic functions of the immune cells. Heliyon (2021) 7(6):e07147. doi: 10.1016/j.heliyon.2021.e07147
32. Vigon L, Fuertes D, Garcia-Perez J, Torres M, Rodriguez-Mora S, Mateos E, et al. Impaired cytotoxic response in PBMCs from patients with COVID-19 admitted to the ICU: Biomarkers to predict disease severity. Front Immunol (2021) 12:665329. doi: 10.3389/fimmu.2021.665329
33. Chen Q, Yu B, Yang Y, Huang J, Liang Y, Zhou J, et al. Immunological and inflammatory profiles during acute and convalescent phases of severe/ critically ill COVID-19 patients. Int Immunopharmacol (2021) 97:107685. doi: 10.1016/j.intimp.2021.107685
34. Tincati C, Cannizzo ES, Giacomelli M, Badolato R, d'Arminio Monforte A, Marchetti G. Heightened circulating interferon-inducible chemokines, and activated pro-cytolytic Th1-cell phenotype features covid-19 aggravation in the second week of illness. Front Immunol (2020) 11:580987. doi: 10.3389/fimmu.2020.580987
35. Jiang Y, Wei X, Guan J, Qin S, Wang Z, Lu H, et al. COVID-19 pneumonia: CD8(+) T and NK cells are decreased in number but compensatory increased in cytotoxic potential. Clin Immunol (2020) 218:108516. doi: 10.1016/j.clim.2020.108516
36. Riou C, Schafer G, du Bruyn E, Goliath RT, Stek C, Mou H, et al. Rapid, simplified whole blood-based multiparameter assay to quantify and phenotype SARS-CoV-2-specific T-cells. Eur Respir J (2022) 59(1): 2100285. doi: 10.1183/13993003.00285-2021
37. Law JC, Koh WH, Budylowski P, Lin J, Yue F, Abe KT, et al. Systematic examination of antigen-specific recall T cell responses to SARS-CoV-2 versus influenza virus reveals a distinct inflammatory profile. J Immunol (2021) 206(1):37–50. doi: 10.4049/jimmunol.2001067
38. Mitsuyama Y, Yamakawa K, Kayano K, Maruyama M, Wada T, Fujimi S. Prolonged enhancement of cytotoxic T lymphocytes in the post-recovery state of severe COVID-19. J Intensive Care (2021) 9(1):76. doi: 10.1186/s40560-021-00591-3
39. Kaneko N, Boucau J, Kuo HH, Perugino C, Mahajan VS, Farmer JR, et al. Temporal changes in T cell subsets and expansion of cytotoxic CD4+ T cells in the lungs in severe COVID-19. Clin Immunol (2022) 237:108991. doi: 10.1016/j.clim.2022.108991
40. Melton A, Doyle-Meyers LA, Blair RV, Midkiff C, Melton HJ, Russell-Lodrigue K, et al. The pigtail macaque (Macaca nemestrina) model of COVID-19 reproduces diverse clinical outcomes and reveals new and complex signatures of disease. PloS Pathog (2021) 17(12):e1010162. doi: 10.1371/journal.ppat.1010162
41. Moore TC, Vogel AJ, Petro TM, Brown DM. IRF3 deficiency impacts granzyme b expression and maintenance of memory T cell function in response to viral infection. Microbes Infect (2015) 17(6):426–39. doi: 10.1016/j.micinf.2015.03.001
42. Workman AM, Jacobs AK, Vogel AJ, Condon S, Brown DM. Inflammation enhances IL-2 driven differentiation of cytolytic CD4 T cells. PloS One (2014) 9(2):e89010. doi: 10.1371/journal.pone.0089010
43. Laforge M, Silvestre R, Rodrigues V, Garibal J, Campillo-Gimenez L, Mouhamad S, et al. The anti-caspase inhibitor q-VD-OPH prevents AIDS disease progression in SIV-infected rhesus macaques. J Clin Invest. (2018) 128(4):1627–40. doi: 10.1172/JCI95127
44. Fasth AE, Snir O, Johansson AA, Nordmark B, Rahbar A, Af Klint E, et al. Skewed distribution of proinflammatory CD4+CD28null T cells in rheumatoid arthritis. Arthritis Res Ther (2007) 9(5):R87. doi: 10.1186/ar2286
45. Duftner C, Goldberger C, Falkenbach A, Wurzner R, Falkensammer B, Pfeiffer KP, et al. Prevalence, clinical relevance and characterization of circulating cytotoxic CD4+CD28- T cells in ankylosing spondylitis. Arthritis Res Ther (2003) 5(5):R292–300. doi: 10.1186/ar793
46. Peeters LM, Vanheusden M, Somers V, Van Wijmeersch B, Stinissen P, Broux B, et al. Cytotoxic CD4+ T cells drive multiple sclerosis progression. Front Immunol (2017) 8:1160. doi: 10.3389/fimmu.2017.01160
47. Wang Q, Che N, Lu C, Sun X, Wang Y, Wang Q, et al. Correlation of peripheral CD4+GranzB+CTLs with disease severity in patients with primary sjogren's syndrome. Arthritis Res Ther (2021) 23(1):257. doi: 10.1186/s13075-021-02632-6
48. Mehta P, McAuley DF, Brown M, Sanchez E, Tattersall RS, Manson JJ, et al. COVID-19: consider cytokine storm syndromes and immunosuppression. Lancet (2020) 395(10229):1033–4. doi: 10.1016/S0140-6736(20)30628-0
49. Prilutskiy A, Kritselis M, Shevtsov A, Yambayev I, Vadlamudi C, Zhao Q, et al. SARS-CoV-2 infection-associated hemophagocytic lymphohistiocytosis. Am J Clin Pathol (2020) 154(4): 466–74. doi: 10.1101/2020.05.07.20094888
50. Sad S, Kagi D, Mosmann TR. Perforin and fas killing by CD8+ T cells limits their cytokine synthesis and proliferation. J Exp Med (1996) 184(4):1543–7. doi: 10.1084/jem.184.4.1543
51. Crouse J, Bedenikovic G, Wiesel M, Ibberson M, Xenarios I, Von Laer D, et al. Type I interferons protect T cells against NK cell attack mediated by the activating receptor NCR1. Immunity (2014) 40(6):961–73. doi: 10.1016/j.immuni.2014.05.003
52. Madera S, Rapp M, Firth MA, Beilke JN, Lanier LL, Sun JC. Type I IFN promotes NK cell expansion during viral infection by protecting NK cells against fratricide. J Exp Med (2016) 213(2):225–33. doi: 10.1084/jem.20150712
53. Voskoboinik I, Whisstock JC, Trapani JA. Perforin and granzymes: function, dysfunction and human pathology. Nat Rev Immunol (2015) 15(6):388–400. doi: 10.1038/nri3839
54. Greene AL, Makrigiannis AP, Fitzpatrick L, Hoskin DW. Anti-CD3-activated killer T cells: Interleukin-6 modulates the induction of major histocompatibility complex-unrestricted cytotoxicity and the expression of genes coding for cytotoxic effector molecules. J Interferon Cytokine Res (1997) 17(12):727–37. doi: 10.1089/jir.1997.17.727
55. Smyth MJ, Ortaldo JR, Bere W, Yagita H, Okumura K, Young HA. IL-2 and IL-6 synergize to augment the pore-forming protein gene expression and cytotoxic potential of human peripheral blood T cells. J Immunol (1990) 145(4):1159–66.
Keywords: perforin, T lymphocytes, COVID-19, SARS-CoV-2, cytotoxicity, sequelae
Citation: Kundura L, Cezar R, André S, Campos-Mora M, Lozano C, Vincent T, Muller L, Lefrant J-Y, Roger C, Claret P-G, Duvnjak S, Loubet P, Sotto A, Tran T-A, Estaquier J and Corbeau P (2022) Low perforin expression in CD8+ T lymphocytes during the acute phase of severe SARS-CoV-2 infection predicts long COVID. Front. Immunol. 13:1029006. doi: 10.3389/fimmu.2022.1029006
Received: 26 August 2022; Accepted: 03 October 2022;
Published: 20 October 2022.
Edited by:
Jean-Pierre Routy, McGill University, CanadaReviewed by:
Pooja Vir, Uniformed Services University of the Health Sciences, United StatesCopyright © 2022 Kundura, Cezar, André, Campos-Mora, Lozano, Vincent, Muller, Lefrant, Roger, Claret, Duvnjak, Loubet, Sotto, Tran, Estaquier and Corbeau. This is an open-access article distributed under the terms of the Creative Commons Attribution License (CC BY). The use, distribution or reproduction in other forums is permitted, provided the original author(s) and the copyright owner(s) are credited and that the original publication in this journal is cited, in accordance with accepted academic practice. No use, distribution or reproduction is permitted which does not comply with these terms.
*Correspondence: Lucy Kundura, bHVjeS5rdW5kdXJhQGdtYWlsLmNvbQ==
†These authors have contributed equally to this work
Disclaimer: All claims expressed in this article are solely those of the authors and do not necessarily represent those of their affiliated organizations, or those of the publisher, the editors and the reviewers. Any product that may be evaluated in this article or claim that may be made by its manufacturer is not guaranteed or endorsed by the publisher.
Research integrity at Frontiers
Learn more about the work of our research integrity team to safeguard the quality of each article we publish.