
94% of researchers rate our articles as excellent or good
Learn more about the work of our research integrity team to safeguard the quality of each article we publish.
Find out more
ORIGINAL RESEARCH article
Front. Immunol., 09 December 2021
Sec. Comparative Immunology
Volume 12 - 2021 | https://doi.org/10.3389/fimmu.2021.773146
 Inés Ruedas-Torres*
 Jaime Gómez-Laguna
 José María Sánchez-Carvajal
 Fernanda Larenas-MuñozInmaculada Barranco
 Francisco José Pallarés
 Librado Carrasco
 Irene Magdalena Rodríguez-Gómez
Transcription factors (TFs) modulate genes involved in cell-type-specific proliferative and migratory properties, metabolic features, and effector functions. Porcine reproductive and respiratory syndrome virus (PRRSV) is one of the most important pathogen agents in the porcine industry; however, TFs have been poorly studied during the course of this disease. Therefore, we aimed to evaluate the expressions of the TFs T-bet, GATA3, FOXP3, and Eomesodermin (EOMES) in target organs (the lung, tracheobronchial lymph node, and thymus) and those of different effector cytokines (IFNG, TNFA, and IL10) and the Fas ligand (FASL) during the early phase of infection with PRRSV-1 strains of different virulence. Target organs from mock-, virulent Lena-, and low virulent 3249-infected animals humanely euthanized at 1, 3, 6, 8, and 13 days post-infection (dpi) were collected to analyze the PRRSV viral load, histopathological lesions, and relative quantification through reverse transcription quantitative PCR (RT-qPCR) of the TFs and cytokines. Animals belonging to both infected groups, but mainly those infected with the virulent Lena strain, showed upregulation of the TFs T-bet, EOMES, and FOXP3, together with an increase of the cytokine IFN-γ in target organs at the end of the study (approximately 2 weeks post-infection). These results are suggestive of a stronger polarization to Th1 cells and regulatory T cells (Tregs), but also CD4+ cytotoxic T lymphocytes (CTLs), effector CD8+ T cells, and γδT cells in virulent PRRSV-1-infected animals; however, their biological functionality should be the object of further studies.
The correct functioning of the cell-mediated immune system is a major branch in the successful eradication of viruses (1). After antigen presentation, naive CD4+ T cells undergo several rounds of division and become polarized into different effector T helper (Th) cell subsets (2). This process is tightly regulated by a set of transcription factors (TFs) that, together with cytokines in the priming environment, contribute to building a strong and guided adaptive immune response ready to defend the host (2, 3). The protective effect of these CD4+ T-cell subsets is achieved, on the one hand, by the production of different effector cytokines and, on the other hand, through direct cytolytic activity mediated by proteins such as granzyme B or Fas (2). This effect is also reached by the participation of cytotoxic T cells and natural killer (NK) cells (4, 5).
T-bet (also known as TBX21) is a member of the T-box family TFs whose expression induces Th1 cell differentiation and promotes the production of tumor necrosis factor alpha (TNF-α) and interferon gamma (IFN-γ) (3, 6, 7). The TF GATA-binding protein 3 (or GATA3) acts as a master regulator for the differentiation of Th2 response; however, it is also involved in the earlier stages of hematopoietic and lymphoid cell development in the thymus (8). FOXP3, belonging to the forkhead box family of TFs, plays a role in the differentiation of regulatory T cells (Tregs), a subset of CD4 T cells that mediates an important role between inflammation and autotolerance (9), partly because of the action of anti-inflammatory cytokines such as interleukin 10 (IL-10) (2). Furthermore, minor expression of the TF FOXP3 has also been reported in CD8+ T cells (10). Another T-box TF family member, Eomesodermin (EOMES), is involved in the polarization of cytotoxic CD4 Th1 cells, also known as CD4 cytotoxic T lymphocytes (CD4 CTLs), which yield the release of cytolytic effector molecules such as granzyme B and perforin and/or the ligation of cell death surface ligands such as FasL (2, 11–13). In addition, it has also been demonstrated that these TFs, particularly T-bet and EOMES, are highly expressed in CD4, CD8β, and γδT cells isolated from the lung of healthy pigs (14). Moreover, they have been related with other functions beyond the regulation of CD4 T-cell differentiation, such as the regulation of cytotoxic CD8+ T-cell activity and memory differentiation (1).
Forty years after the appearance of porcine reproductive and respiratory syndrome (PRRS), it is still one of the most economically important diseases in pigs. Because of this, deepening the understanding on the pathogenesis of different PRRS virus (PRRSV) strains continues being a goal for the research community. PRRSV includes two distinct viral species: Betaarterivirus suid 1 (formerly PRRSV-1) and Betaarterivirus suid 2 (formerly PRRSV-2) (15). It has been described that PRRSV suppresses the innate immunity, which yields to an inefficient adaptive immune response in infected pigs (16). The Lena strain, classified as a virulent PRRSV-1 strain, has been shown to exhibit a strong inflammatory immune response in the tracheobronchial lymph node and the lung, together with high severity of lesions (17, 18). Moreover, several studies from our researcher group have shown high rates of cell death in the lung and thymus of pigs infected with virulent PRRSV-1 strains (19–21), which could be partially linked with cytotoxic activity (2, 11–13).
Although the expressions of TFs have been studied in detail in T-cell subsets from different porcine tissues from healthy animals (16, 22, 23), their expressions during PRRSV infection have been poorly studied. Ebner et al. (24) demonstrated a higher frequency of T-bet+ CD4+ T cells in peripheral blood mononuclear cells (PBMCs) from piglets experimentally infected with PRRSV, together with the overexpression of IFN-γ in in vitro stimulated splenocytes. Experimental in vivo studies with dendritic cells infected with two different low virulent PRRSV strains showed a significant increase in the expression of the FOXP3 gene, but not for T-bet and GATA3 (25). Moreover, the role of FOXP3 and Tregs in virulent PRRSV infection is controversial. Comparative in vivo experiments have demonstrated that virulent PRRSV-1 strains induced similar or even lower frequencies of Tregs in comparison with low virulent PRRSV-1 strains (26, 27). However, other in vitro studies have shown that the virulent PRRSV-2 strain BB0907 induced more CD4+CD25+Foxp3+ Tregs than did a classical PRRSV-2 strain (28).
Considering the role of T-bet, GATA3, FOXP3, and EOMES in T-cell development, differentiation, and memory formation, as well as cytokine production, and the scarcity of studies evaluating their expressions after PRRSV infection, the following work aimed to evaluate the expressions of these TFs in target organs, namely, the lung, tracheobronchial lymph node, and the thymus, and the expressions of different effector cytokines (IFN-γ, TNF-α, and IL-10) and FasL produced by T-cell polarization during the early phase of infection with PRRSV-1 strains of different virulence.
The present study is part of a large project carried out to investigate the pathogenesis of PRRSV-1 strains of different virulence. Animals and samples were collected from the experiment published elsewhere (29). Seventy 4-week-old Landrace × Large White piglets, negative against PRRSV (IDEXX PRRS X3 Ab test, IDEXX Laboratories S.L., Barcelona, Spain), Mycoplasma hyopneumoniae, and PCV2 [in-house PCR against M. hyopneumoniae (30) and PCV2 (31)], were arbitrarily distributed into three different experimental groups at the Centre de Recerca en Sanitat Animal (IRTA-CReSA, Cerdanyola del Vallès, Barcelona, Spain). Briefly, 16 pigs were intranasally inoculated with 2 ml (using MAD Nasal™ Intranasal Mucosal Atomization Device; Teleflex, Alcala de Henares, Madrid, Spain) of porcine alveolar macrophage supernatant diluted in RPMI 1640 medium (Thermo Fisher Scientific, Barcelona, Spain) (control group), 26 pigs with 2 ml of 105 TCID50 (50% tissue culture infectious dose) of the low virulent PRRSV-1 3249 strain (subtype 1; 3249 group) (32), and 28 pigs with 105 TCID50 of the high virulent PRRSV-1 Lena strain (subtype 3; Lena group) (33). At 1, 3, 6, and 8 days post-infection (dpi), three pigs from the control group and five pigs from each infected group were humanely euthanized. At 13 dpi, four pigs from the control group, six pigs from the 3249, group and eight pigs from the Lena group were euthanized under the same conditions. The experiment was carried out following the guidelines of the European Union (Directive 2010/63/EU) and approved by the Catalan Autonomous Government and by the IRTA Ethics Committee (Project 3647; FUE-2017-00533413). During the necropsies, samples from the lung, tracheobronchial lymph node, and the thymus were collected, immersed in TRIzol™ LS Reagent (Invitrogen, Carlsbad, CA, USA), and frozen at −80°C until processing for RNA extraction. The rest of the tissue sample was fixed in 10% neutral buffered formalin and Bouin’s solution for histopathological and immunohistochemical studies.
Four-micrometer hematoxylin and eosin-stained sections from the lung, tracheobronchial lymph node, and the thymus were blindly examined and scored. Evaluation of the severity of lesions in the lung and thymus has been described elsewhere (20, 29). Briefly, interstitial pneumonia and suppurative bronchopneumonia were scored independently, but with the same scale: 0, no microscopic lesions; 1, mild interstitial pneumonia/bronchopneumonia; 2, moderate multifocal interstitial pneumonia/bronchopneumonia; 3, moderate diffuse interstitial pneumonia/bronchopneumonia; and 4, severe interstitial pneumonia/bronchopneumonia. The sum of the interstitial pneumonia and bronchopneumonia scores was considered the final one, being 8 the maximum possible score. The presence of tingible body macrophages in the tracheobronchial lymph node was scored from 0 to 2 as follows: 0, no microscopic changes (<10% of the tissue was affected); 1, mild to moderate microscopic changes (from 10% to 50% of the tissue was affected); and 2, severe microscopic changes (>50% of the tissue was affected). Likewise, the level of depletion on the tissue was scored from 0 to 2. The sum of the presence of tingible body macrophages and the level of lymphoid depletion comprised the final score. The presence of germinal center activation, hemorrhage, inflammatory cells, and mitotic figures was also evaluated. For the thymus, scores were given as follows: 0, no microscopic changes; 1, focal cortical reduction; 2, mild decrease of the ratio cortex/medulla (C/M), multifocal cortical reduction, and presence of tingible body macrophages; 3, moderate decrease of the C/M ratio, multifocal cortical reduction, “starry sky” picture in the cortex, and poor corticomedullary differentiation; and 4, severe decrease of the C/M ratio, disappearance of corticomedullary differentiation with an increase of the stroma, and extensive presence of apoptotic bodies in the cortex.
Total RNA was isolated from 100 mg of lung, tracheobronchial lymph node, and thymus homogenized with 2 ml of TRIzol™ LS Reagent using homogenizer 150 (FisherBrand™, Thermo Fisher Scientific) and the NucleoSpin® RNA Virus Column kit (Macherey-Nagel, Düren, Germany) according to the manufacturer’s protocols. In order to remove genomic DNA, a DNase type I Ambion® TURBO-DNA-free™ kit (Life Technologies, Carlsbad, CA, USA) was applied following the manufacturer’s instructions. The concentration and purity of the extracted RNA were determined by spectrophotometry using the Nanodrop 2000 (Thermo Fisher Scientific). One microliter of total RNA was used to generate cDNA using the Script™ cDNA Synthesis Kit (BioRad, Hercules, CA, USA) following the manufacturer’s indications.
The LSI™ VetMAX™ PRRSV EU/NA 2.0 kit (Invitrogen) was used to quantify the PRRSV genome according to the manufacturer’s protocol. RT-qPCR reactions were performed in duplicate for each sample in the MyiQ™2 Two-Color Real-Time PCR Detection System (BioRad) for 5 min at 50°C, 10 min at 95°C, followed by 40 cycles of 3 s at 95°C and 30 cycles at 60°C for 30 s. To avoid overestimating the number of viral particles, the results of PRRSV viral load in the lung, tracheobronchial lymph node, and thymus were expressed in quantification cycle (Cq) as previously reported (34).
Relative quantification of the porcine TFs T-bet, GATA3, FOXP3, and EOMES, the cytokines IFNG, TNFA, and IL10, and FASL in the lung, tracheobronchial lymph node, and thymus was performed using the comparative CT method (also known as the 2−ΔΔCT method). Relative quantification of porcine TFs (T-bet, GATA3, FOXP3, and EOMES) and the IFNG, TNFA, IL10, and FASL results from Lena- and 3249-infected animals are presented as fold change, comparing the value from each infected animal versus the average of control animals at each specific time point. The Cq values of the above-mentioned target genes were normalized to the Cq values of the reference genes (35). GeNorm analysis (qbase+ 2.6.1 software, Biogazelle, Zwijnaarde, Belgium; www.qbaseplus.com) (36) was performed to determine the most stable reference genes from a set of eight reference gene candidates and 10 representative cDNA samples from the lung, tracheobronchial lymph node, and thymus. Three and two reference genes with high stability (average geNorm M ≤ 0.5) were established as the optimal reference gene number for lung and tracheobronchial lymph node samples and for thymus samples, respectively. The optimal normalization factor was calculated with the arithmetic mean of ribosomal protein L4 (RPLA4), peptidyl-prolyl cis–trans isomerase A (PPIA), and beta-2-microglobulin (B2M) in the lung; RPLA4, hypoxanthine phosphoribosyl transferase 1 (HPRT1), and TATA box-binding protein (TBP) in the case of tracheobronchial lymph node; and RPLA4 and HPRT1 for the thymus. The sequences of the primers of the porcine reference genes, TFs, cytokines, and FasL are shown in Table 1. The primers for PPIA and B2M were designed using the online Primer3Plus tool (www.primer3plus.com) (46). The iTaq™ Universal SYBR Green Supermix kit (BioRad) was used following the manufacturer’s instructions. Reactions were performed in triplicate using 50 ng of cDNA from each sample and 0.5 µM of each primer in the MyiQ™2 Two-Color Real-Time PCR Detection System (BioRad) for 20 s at 95°C for polymerase activation, followed by 40 cycles for denaturation (15 s, 95°C) and annealing/extension (30 s, 60°C). Subsequently, a melting curve analysis was performed (65–95°C) to verify the specificity of amplicons. An inter-run calibrator sample with a known Cq value was introduced in each plate to guarantee the quality of the retrotranscription and to detect inter-run variations.
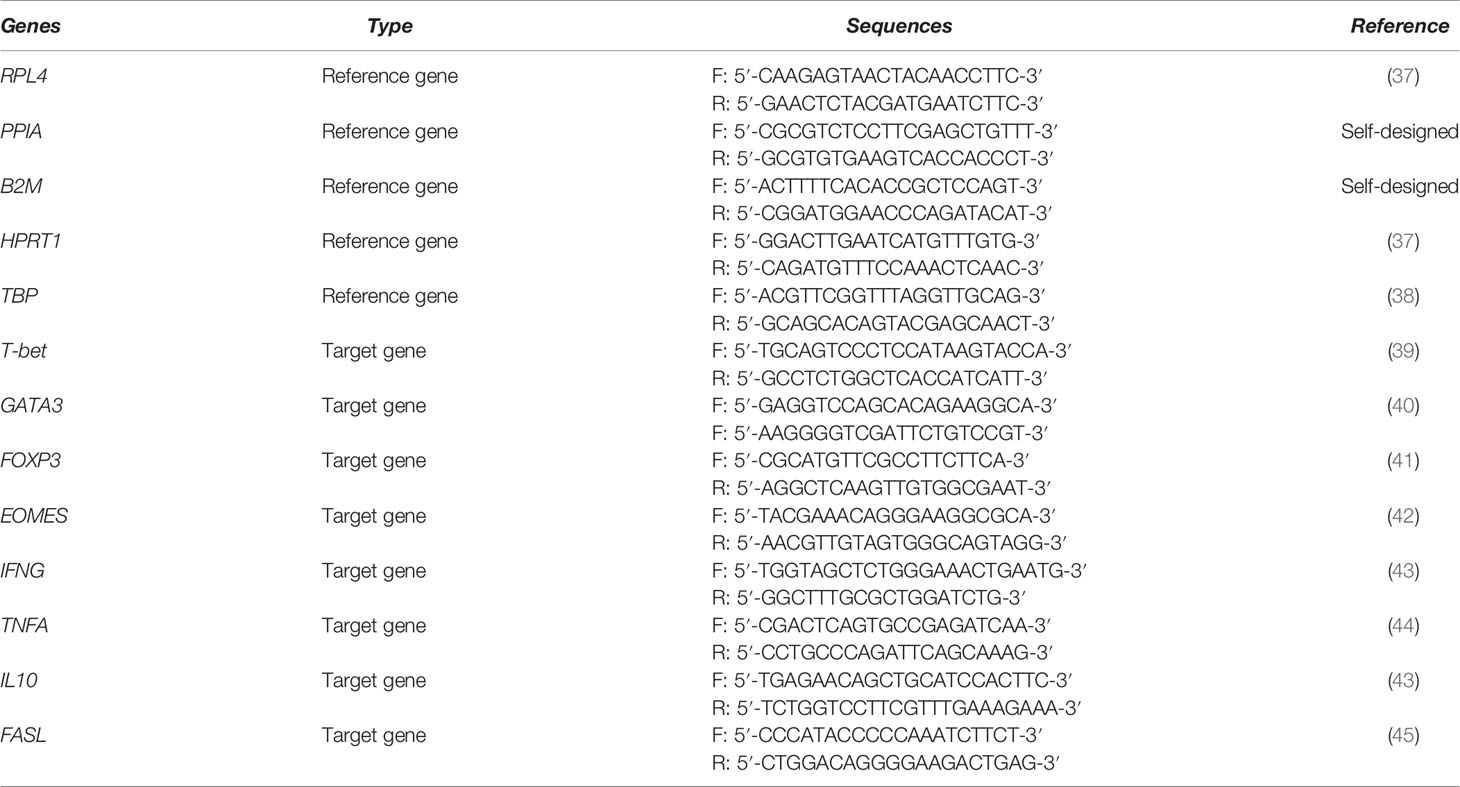
Table 1 Primer sequences of the porcine reference genes (RPL4, PPIA, B2M, HPRT1, and TBP) and target genes (T-bet, GATA3, FOXP3, EOMES, IFNG, TNFA, IL10, and FASL).
The immunohistochemical study of IFN-γ, TNF-α, FOXP3, and Fas was performed in the lung, tracheobronchial lymph node, and thymus of animals from control and 3249- and Lena-infected groups euthanized at selected time points according to the RT-qPCR results to identify the main cell subsets implicated in their expression and tissue distribution. In brief, 4-µm tissue sections from each sample were de-waxed and rehydrated in xylene and descending grades of alcohol, respectively, followed by endogenous peroxidase inhibition using 3% H2O2 in methanol for 30 min in darkness. Table 2 summarizes the different fixatives, antigen retrieval methods, and dilutions for each antibody. After phosphate-buffered saline (PBS) washes (pH 7.4) and incubation with 100 µl of 2% bovine serum albumin (BSA) for IFN-γ, TNF-α, and Fas and 10% normal goat serum (NGS) for FOXP3, monoclonal primary antibodies were applied and incubated overnight at 4°C in a humidity chamber. For negative controls, the primary antibody was replaced by either an isotype control or by BSA to confirm the lack of nonspecific binding. Thereafter, the slides were washed with PBS and incubated with the corresponding biotinylated secondary antibody diluted in the blocking solution for each case. Labeling was visualized with the NovaRED substrate kit (Vector Elite Laboratories, Burlingame, CA, USA) for IFN-γ, TNF-α, and Fas and with 3,3′-diaminobenzidine chromogen (Dako, Santa Clara, CA, USA) for FOXP3. Finally, the sections were counterstained with Harris hematoxylin, dehydrated, and mounted. In each organ, immunolabeled cells were identified and manually counted by a pathologist in 25 non-overlapping high magnification fields of 0.2 mm2 (Olympus BX51, Olympus Iberia SAU, L’Hospitalet de Llobregat, Barcelona, Spain).
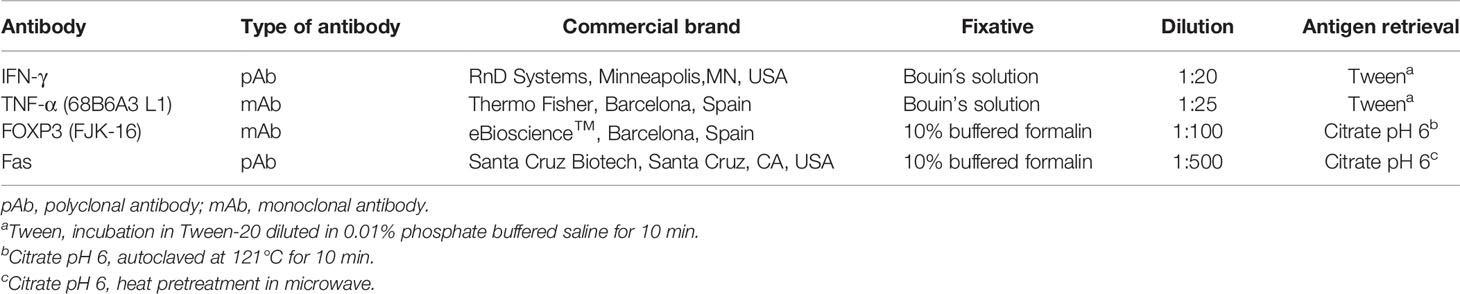
Table 2 Summary of the immunohistochemical methodology.
Differences between the viral loads in the lung, tracheobronchial lymph node, and thymus and in the relative expressions of TFs (T-bet, GATA3, FOXP3, and EOMES), cytokines (IFNG, TNFA, and IL10), and the FASL molecule were evaluated for approximate normality of distribution using the D’Agostino and Pearson omnibus normality test, followed by the non-parametric Kruskal–Wallis test for multiple comparisons and the Mann–Whitney non-parametric U test for unpaired groups (GraphPad Prism software 7.0, Inc., San Diego, CA, USA). A p-value lower than 0.05 was considered statistically significant, indicated with * (p ≤ 0.05) and ** (p ≤ 0.01). Data are presented as the median ± interquartile range (IQR).
Significant differences were observed between the severity of the lesions in the lung from both infected groups in comparison with that in the control group at 6 and 8 dpi (p ≤ 0.05 and p ≤ 0.01, respectively) (Figure 1A), as previously described (29). In brief, these differences consisted of the presence of severe interstitial pneumonia, characterized by a thickening of the alveolar septa together with extensive foci of suppurative bronchopneumonia composed of neutrophils, cell debris, and mucus filling the bronchial, bronchiolar, and alveolar lumen, especially in animals infected with the virulent Lena strain (Figure 2A). The microscopic score for the tracheobronchial lymph node was similar between groups, with high individual variability (Figure 1B). Minor histological changes were observed when comparing control animals (Figure 2B) with both infected groups, except for some infected animals euthanized at 1, 6, 8, and 13 dpi, which presented severe lymphoid depletion (Figure 2C) and/or an increase in the number of tingible body macrophages (Figure 2D). In the thymus, both infected groups showed a progressive increase in the severity of the lesions; however, the thymus from virulent Lena-infected animals showed significant differences in the microscopic score from 3 dpi onwards in comparison with low virulent 3249-infected animals (p ≤ 0.05) (Figure 1C). At 8 dpi, the thymus from animals of the virulent Lena group showed severe signs of thymic atrophy characterized by an elevated number of apoptotic bodies in the cortical layer (Figure 2E), poor corticomedullar differentiation, and a severe decrease of the C/M ratio with an increase of the stroma [for more details, see (20)].
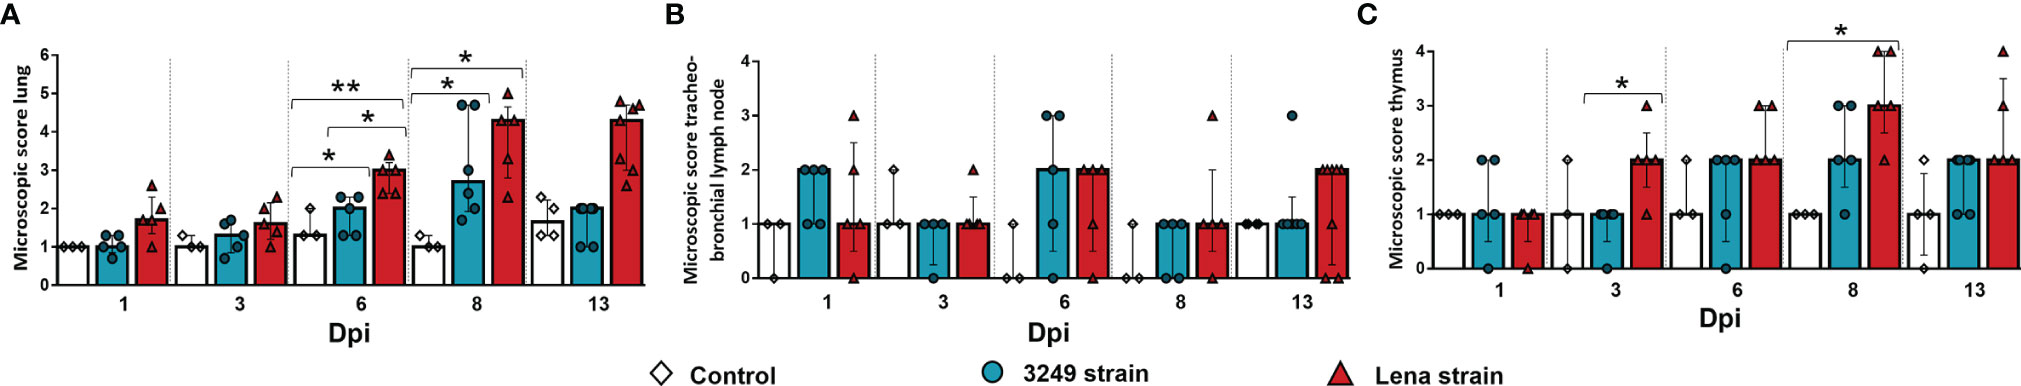
Figure 1 Microscopic findings in the lung, tracheobronchial lymph node, and thymus of each experimental group during the experimental study. Graphs display the microscopic score in the lung (A), tracheobronchial lymph node (B), and thymus (C). Columns represent the median ± IQR. Individual values for each animal from the control (white diamond), low virulent 3249-infected (blue circle), and Lena-infected (red triangle) groups are represented. Significant differences between groups are represented (*p ≤ 0.05 and **p ≤ 0.01).
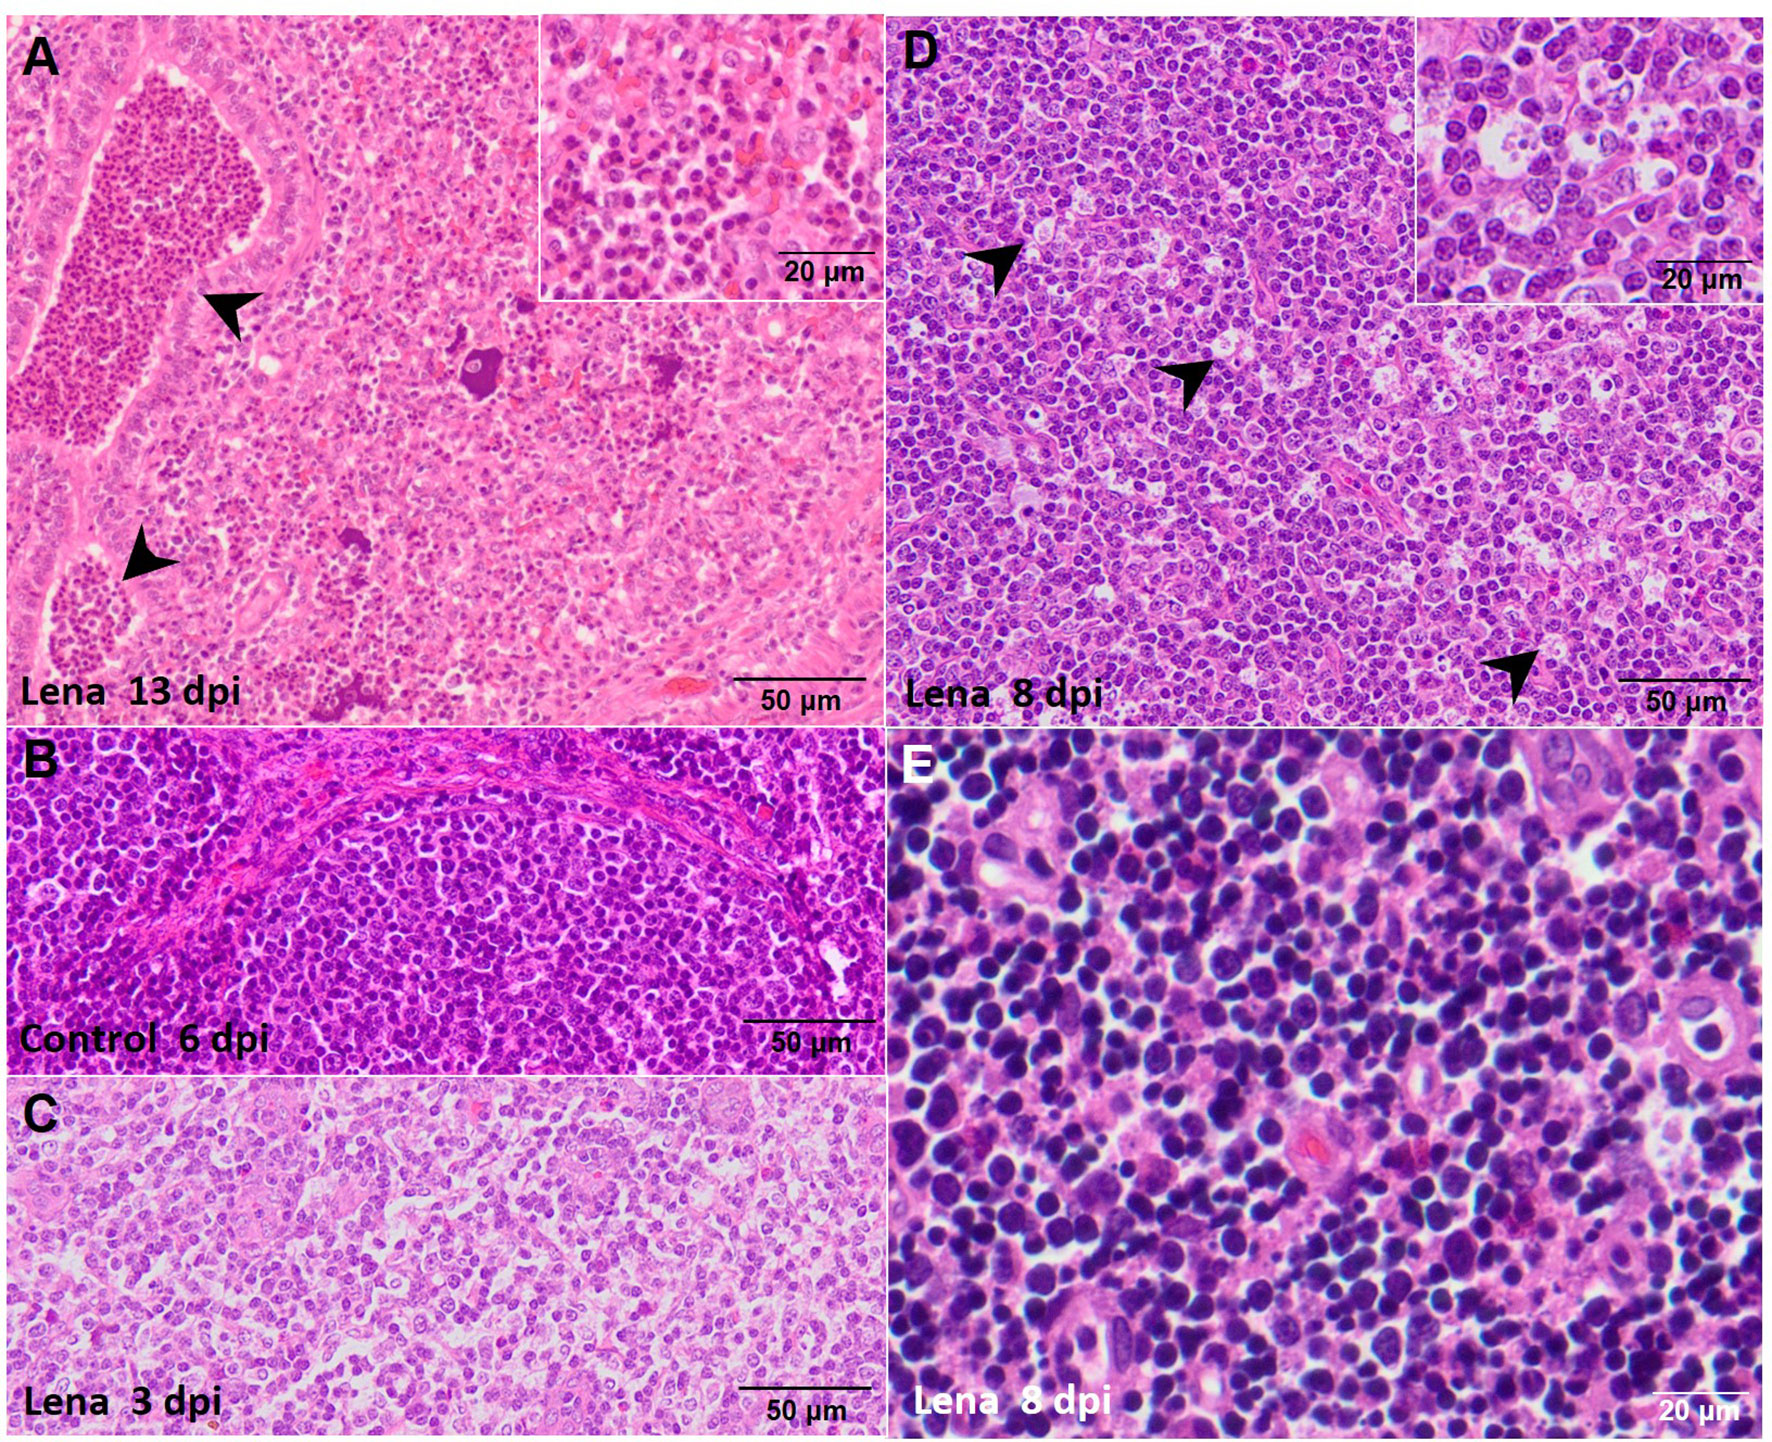
Figure 2 Microscopic pictures of hematoxylin and eosin of representative target organs from infected animals. (A) Suppurative bronchopneumonia from a pig infected with the Lena strain and euthanized at 13 days post-infection (dpi) showing a marked intra-alveolar and intra-bronchiolar infiltrate of neutrophils (black arrowheads). Inset shows the infiltrate of intra-alveolar neutrophils. (B) Representative microphotograph of the tracheobronchial lymph node from a pig from the control group euthanized at 6 dpi. (C) Lymphoid depletion in the tracheobronchial lymph node from a pig infected with the Lena-strain and euthanized at 3 dpi. (D) Numerous tingible body macrophages in the tracheobronchial lymph node (black arrowheads) from a pig infected with the Lena strain and euthanized at 8 dpi. Inset shows tingible body macrophages. (E) Abundant apoptotic bodies in the cortex of the thymus from a pig infected with the Lena strain euthanized at 8 dpi.
PRRSV was not detected in any studied organ from control animals along the study. Similar viral kinetics was observed in the lung, tracheobronchial lymph node, and thymus from Lena- and 3249-infected animals, but the increase occurred earlier and was higher in those infected with the virulent Lena strain throughout the study (Figure 3). PRRSV was detected in the lung as early as 1 dpi in two out of five animals from both infected groups (Figure 3A). Significant differences between Lena- and 3249-infected pigs (p ≤ 0.01 at 3 dpi; p ≤ 0.05 at 6 and 8 dpi) were observed in the PRRSV load, reaching the maximum at 6 dpi in virulent Lena-infected animals (Cq = 18.68, IQR = 1.27) and at 8 dpi in those infected with the low virulent 3249 strain (Cq = 22.07, IQR = 3.89) and reducing these differences at 13 dpi (Lena group: Cq = 21.95, IQR = 3.23; 3249 group: Cq = 22.74, IQR = 2.71) (Figure 3A). In the tracheobronchial lymph node, on the contrary, the virus was detected as early as 1 dpi, but only in two out of five animals from the virulent Lena group (Cq = 27.6, IQR = 5.06) (Figure 3B). Whereas all animals from this group were positive (Cq = 21.07, IQR = 4.41) at 3 dpi, only three out of five animals from the low virulent 3249 group were positive at this date. At 6 dpi, the 3249 group peaked (Cq = 23.1, IQR = 1.85) and the Lena group showed similar value to that detected at 3 dpi (Cq = 22.35, IQR = 3.51). Then, a progressive decrease was observed in both infected groups until the end of the study (Cq = 27.96, IQR = 3.14 for the Lena group and Cq = 28.29, IQR = 1.39 for the 3249 group at 13 dpi). No statistical differences were found between both infected groups regarding the PRRSV load in the tracheobronchial lymph node (Figure 3B). At 1 dpi, PRRSV was detected in the thymus from only one virulent Lena-infected pig (Cq = 36.01), followed by a strong increase at 3 dpi, where the PRRSV viral load was detected in the thymus from all virulent Lena-infected animals and only in three out of five pigs infected with low virulent 3249 (Figure 3C). Both infected groups showed similar viral kinetics, peaking at 8 dpi (Lena-infected animals: Cq = 20.87, IQR = 4.05; 3249-infected animals: Cq = 22.57, IQR = 2.05) and dropping at 13 dpi (Lena-infected animals: Cq = 28.61, IQR = 7.26; 3249-infected animals: Cq = 28.86, IQR = 5.34). No significant differences in PRRSV viral load were detected in the thymus of both infected groups (Figure 3C).
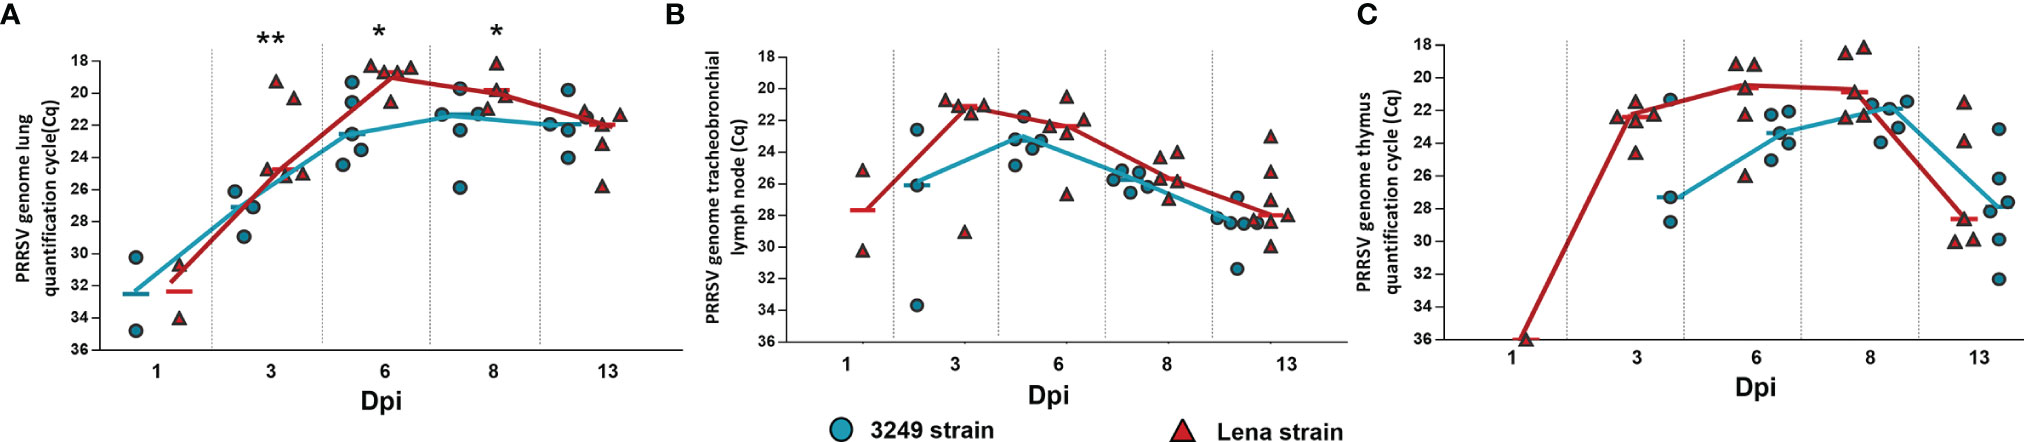
Figure 3 Porcine reproductive and respiratory syndrome virus (PRRSV) viral load in the lung, tracheobronchial lymph node, and thymus of each experimental group during the experimental study. Graphs show PRRSV viral load in the lung (A), tracheobronchial lymph node (B), and thymus (C) of infected pigs. Values of PRRSV viral load are represented in quantification cycle (Cq). Individual values for each animal from the low virulent 3249-infected (blue circle) and Lena-infected (red triangle) groups are represented. Significant differences between groups are represented (*p ≤ 0.05 and **p ≤ 0.01).
A marked peak in T-bet expression in the lung of virulent Lena-infected animals (fold change = 3.01, IQR = 1.42) was observed at 13 dpi with significant differences compared with the low virulent 3249-infected group (p ≤ 0.01) and the control group (p ≤ 0.05) (Figure 4A). T-bet was significantly overexpressed from 8 dpi onwards in the tracheobronchial lymph node of virulent Lena-infected animals in comparison with low virulent 3249-infected animals (p ≤ 0.01) (Figure 4A) (Lena-infected animals: fold change = 2.32, IQR = 2.09; 3249-infected animals: fold change = 0.42, IQR = 0.47). An increase in the expression of T-bet at 13 dpi was also observed in the tracheobronchial lymph node of piglets infected with the 3249 and Lena strains (3249-infected group: fold change = 2.45, IQR = 1.93; Lena-infected group = 3.4, IQR = 2.96), although only statistically significant in Lena-infected animals (p ≤ 0.05) (Figure 4B). In the thymus, a striking peak of T-bet expression was detected at 8 dpi in the Lena-infected group compared with the 3249-infected group (Lena-infected animals: fold change = 25.01, IQR = 29.49; 3249-infected animals: fold change = 3.03, IQR = 12.50; p ≤ 0.05), followed by a drastic drop at 13 dpi (fold change = 10.27, IQR = 7.05) (Figure 4C).
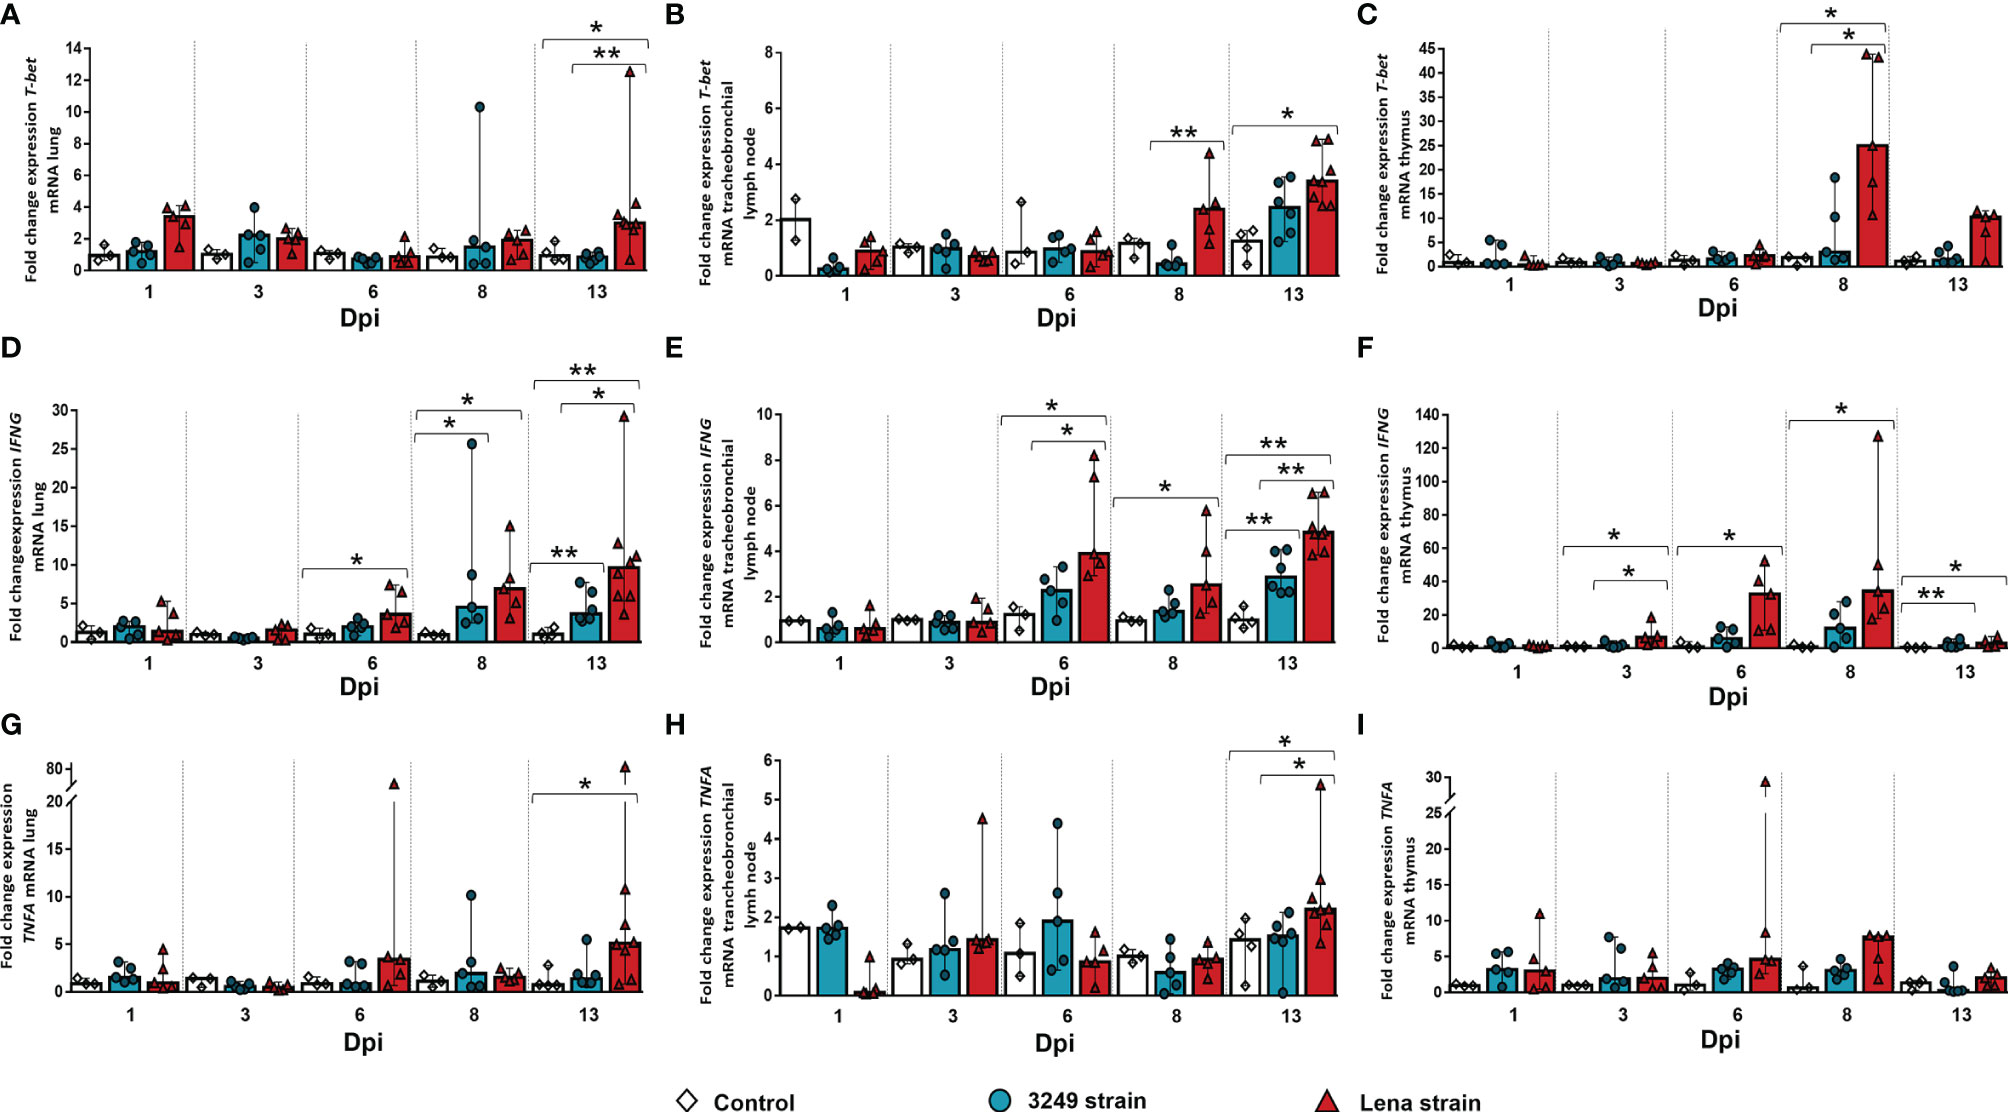
Figure 4 Relative mRNA expressions of T-bet, IFNG, and TNFA in target organs. Graphs show fold change expressions of T-bet, IFNG, and TNFA in the lung (A, D, G, respectively), tracheobronchial lymph node (B, E, H, respectively), and thymus (C, F, I, respectively). Relative quantification was performed with the CT method (also known as the 2−ΔΔCT method). Columns represent the median ± IQR. Individual values for each animal from the control (white diamond), 3249-infected (blue circle), and Lena-infected (red triangle) groups are represented. Significant differences between groups are represented (*p ≤ 0.05 and **p ≤ 0.01).
Regarding the expression level of IFNG, a progressive increase in the lung of virulent Lena-infected animals from 6 dpi (fold change = 3.59, IQR = 4.74) to 13 dpi (fold change = 9.63, IQR = 6.41) was observed (p ≤ 0.05 at 6, 8, and 13 dpi) (Figure 4D). This raise was also noticed in low virulent 3249-infected pigs at 8 dpi (p ≤ 0.05), mildly decreasing at the end of the study (fold change = 3.64, IQR = 3.83; p ≤ 0.01) (Figure 4D). An increase in the gene expression of this cytokine was observed in the tracheobronchial lymph nodes from both infected groups from 6 dpi (Lena-infected animals: fold change = 3.89, IQR = 4.53; 3249-infected animals: fold change = 2.27, IQR = 1.70) until the end of the study (fold change = 4.82, IQR = 2.01 for Lena-infected animals and fold change = 2.86, IQR = 1.82 for 3249-infected animals at 13 dpi), but was always higher in virulent Lena- than that in low virulent 3249-infected pigs (Figure 4E). Significant differences between the virulent Lena and control groups were found at 6, 8, and 13 dpi and between the low virulent 3249 and control groups at 13 dpi (p ≤ 0.01 and p ≤ 0.05) (Figure 4E). The expression of IFNG in the thymus from virulent Lena-infected piglets showed a progressive increase from 3 dpi (fold change = 6.43, IQR = 10.17, p ≤ 0.05) until 8 dpi (fold change = 34.22, IQR = 67.86, p ≤ 0.05), undergoing a significant drop at 13 dpi (fold change = 2.87, IQR = 5.20, p ≤ 0.05) (Figure 4F). In the thymus from low virulent 3249-infected group, a similar kinetics was observed, but with a lower intensity than that in virulent Lena-infected group, with significant differences observed only at 13 dpi with respect to the control group (fold change = 1.42, IQR = 3.13, p ≤ 0.01) (Figure 4F).
TNFA in the lung of virulent Lena-infected animals showed two peaks, one at 6 dpi (fold change = 3.34, IQR = 12.49) and the other at 13 dpi (fold change = 5.10, IQR = 7.83, p ≤ 0.05) (Figure 4G). No significant changes were found in the TNFA kinetics of the lung from low virulent 3249-infected animals (Figure 4G). TNFA in the tracheobronchial lymph node showed basal expression in both infected groups compared to the control group, except for the last day of study when an increased expression was observed only in virulent Lena-infected piglets (fold change = 2.20, IQR = 1.03, p ≤ 0.05) (Figure 4H). In the thymus, the main changes were observed in the expression of TNFA at 8 dpi (fold change = 7.77, IQR = 4.63), decreasing onwards in the virulent Lena-infected group, but with wide individual variability and no statistically significant changes (Figure 4I). A basal expression of TNFA was noted in the thymus from low virulent 3249-infected animals along the whole study (Figure 4I).
Immunohistochemical labeling of IFN-γ revealed a greater number of immunostained cells in tissues from virulent Lena-infected piglets in comparison with low virulent 3249-infected piglets and control piglets (Figure 5). Pulmonary alveolar macrophages and interstitial macrophages were the main subsets immunolabeled against IFN-γ in the lung (Figures 5A, B), particularly in virulent Lena-infected animals (Figure 5A). In the tracheobronchial lymph node, the IFN-γ protein was mainly detected in the cytoplasm of lymphocytes located in the medulla and paracortex (Figures 5D, E). In the thymus, the expression of IFN-γ was observed mainly in thymocytes and macrophage-like cells of the thymic medulla from virulent Lena-infected piglets (Figure 5G), and to a lesser extent in low virulent 3249-infected and control piglets (Figure 5H).
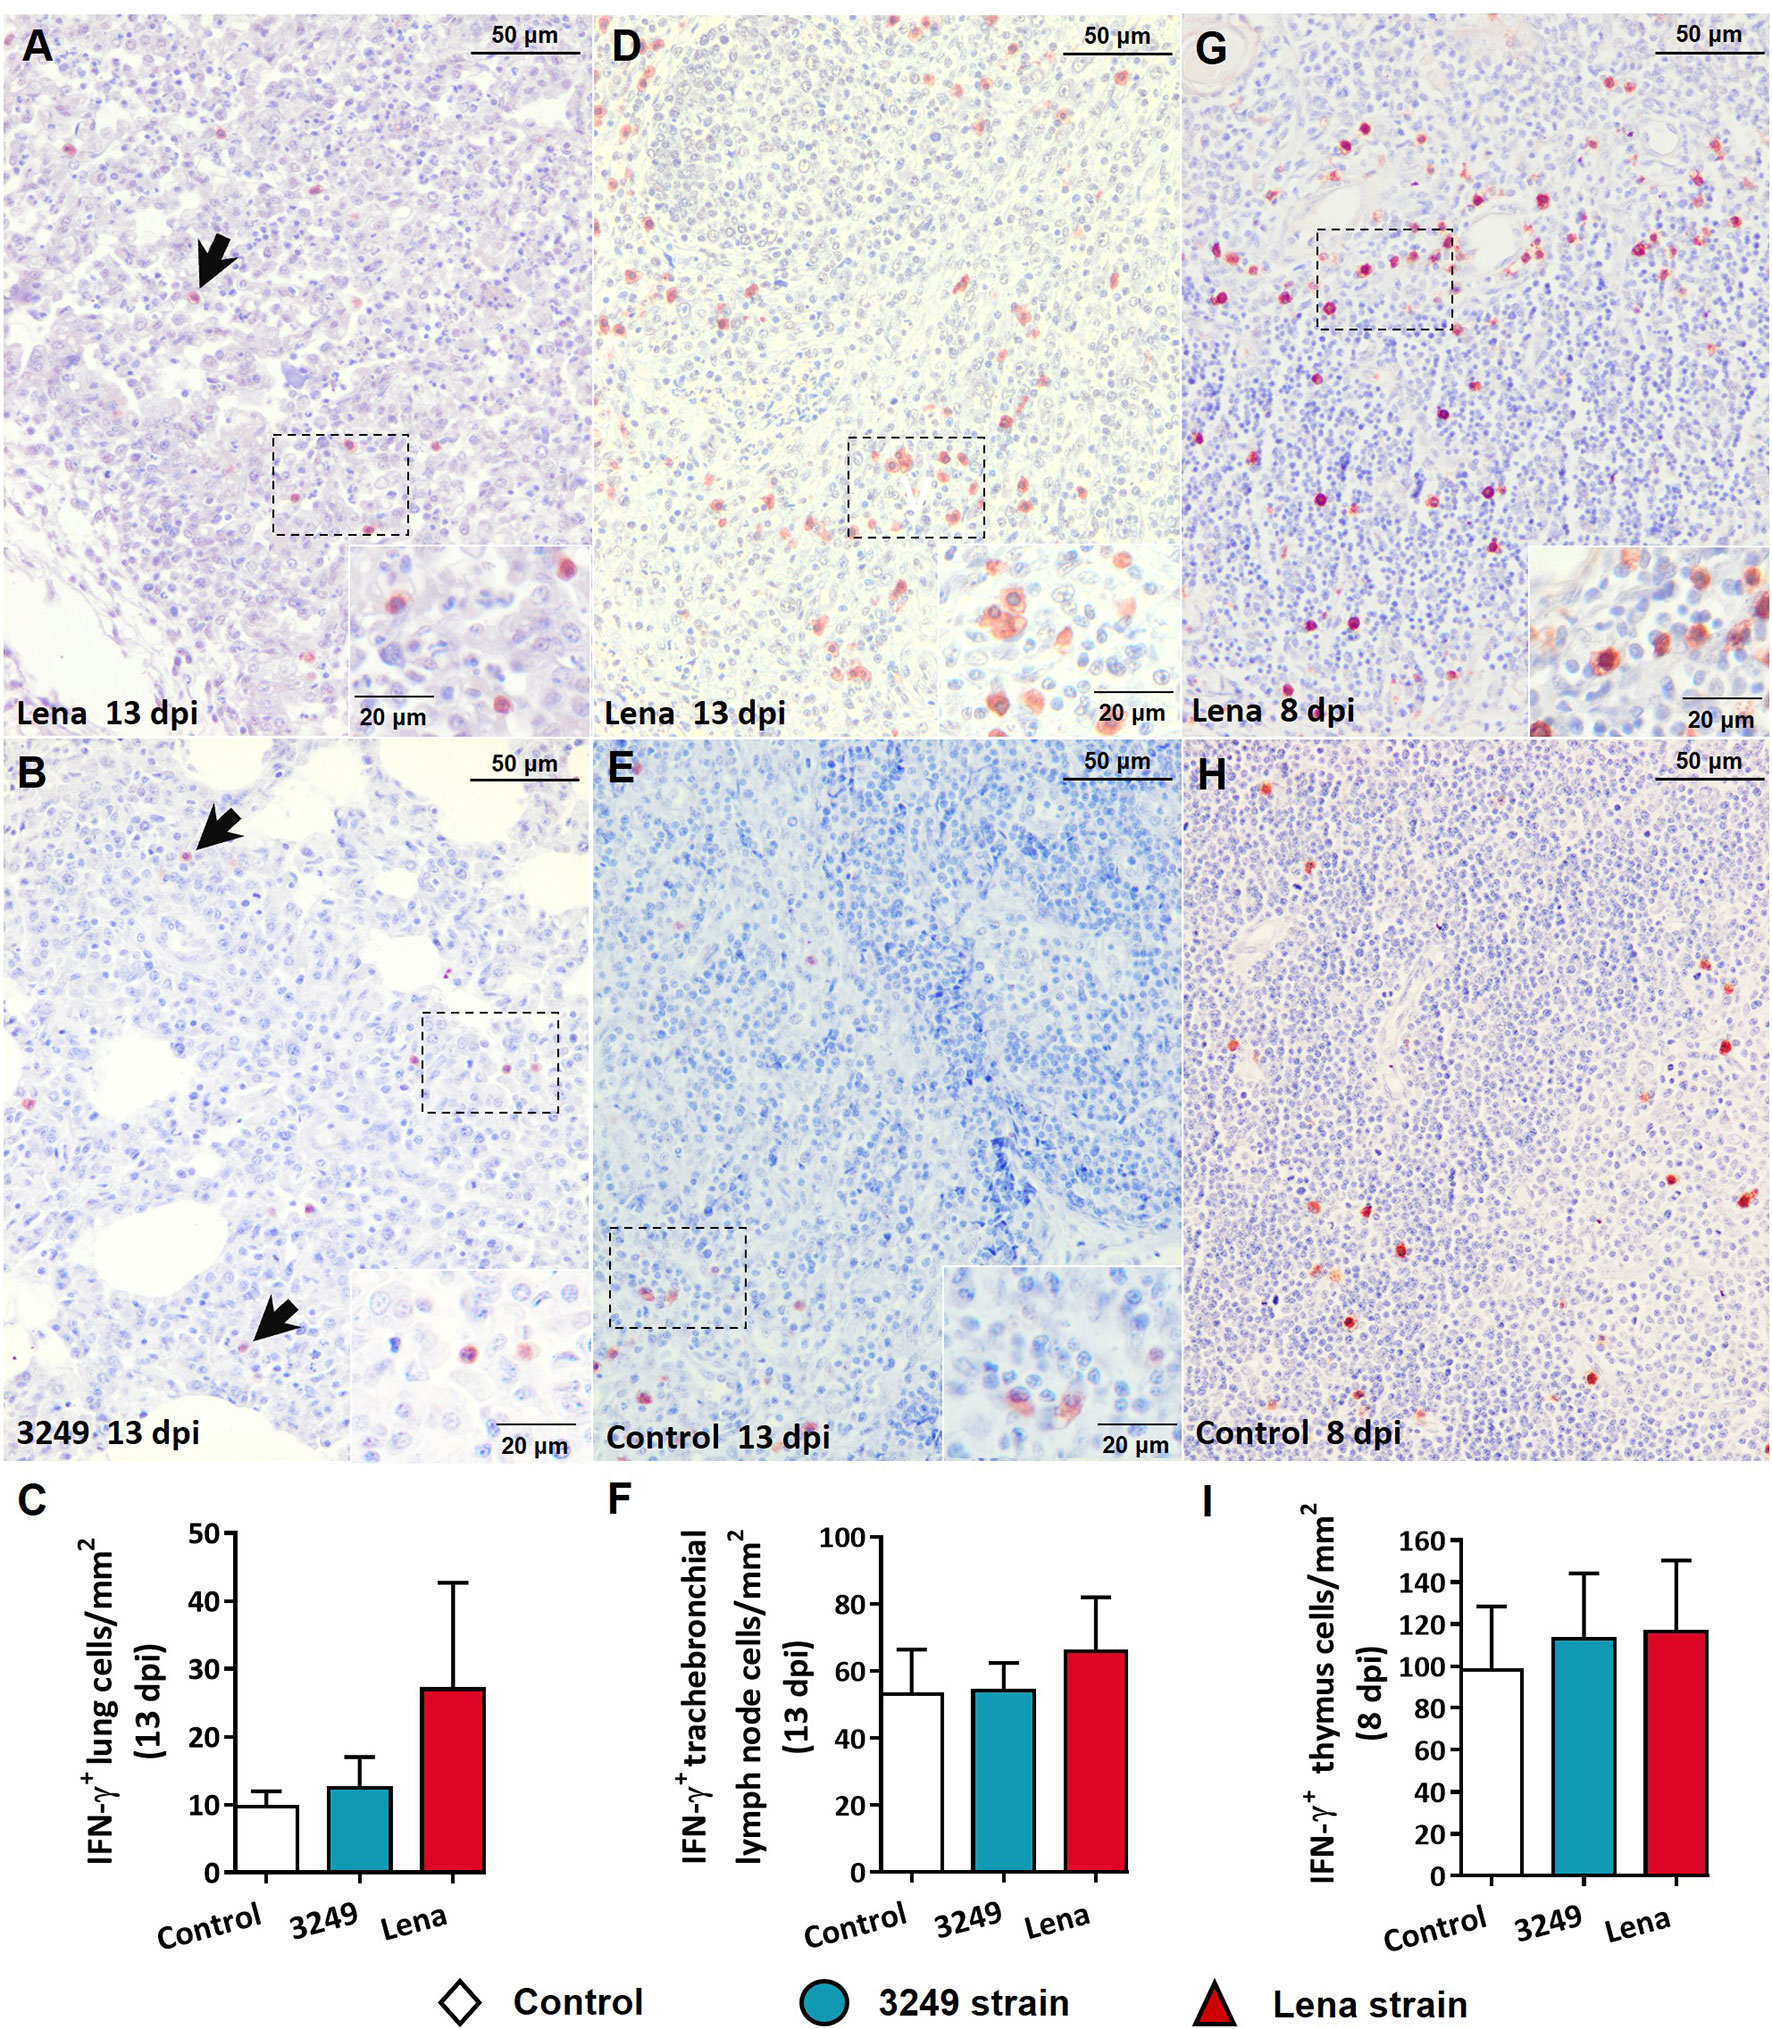
Figure 5 Immunohistochemical expression and counting of IFN-γ in target organs. (A, B) Photomicrographs against IFN-γ of the lung from Lena-infected (A) and 3249-infected (B) piglets euthanized at 13 days post-infection (dpi) showing pulmonary alveolar macrophages and interstitial macrophages (black arrows) in foci of interstitial pneumonia and suppurative bronchopneumonia. Insets show pulmonary alveolar macrophages. (C) Graph showing the number of IFN-γ+ cells in the lung. (D, E) Photomicrographs against IFN-γ of the tracheobronchial lymph node from a piglet infected with the Lena strain (D) and from a control piglet (E) euthanized at 13 dpi. Insets show lymphocytes and macrophages from the paracortex and medulla expressing IFN-γ. (F) Graph showing the number of IFN-γ+ cells in the tracheobronchial lymph node. (G, H) Photomicrographs against IFN-γ of thymus from a piglet infected with the Lena strain (G) and from a control piglet (H) euthanized at 8 dpi. Inset shows thymocytes and macrophages from the medulla expressing IFN-γ. (I) Graph showing the number of IFN-γ+ cells in the tracheobronchial lymph node. Columns represents the median with range from the control group (white), low virulent 3249-infected (blue), and Lena-infected (red) groups.
Immunolabeling against TNF-α was mainly detected in tissues from virulent Lena-infected piglets in comparison with low virulent 3249-infected piglets and control animals (Figure 6). Interstitial macrophages from areas of interstitial pneumonia of the infected animals (Figure 6A) and pulmonary alveolar macrophages from the lung of control animals (Figure 6B) were the main populations involved in TNF-α expression. In the tracheobronchial lymph node, labeling revealed TNF-α+ lymphocytes in the medulla of tracheobronchial lymph nodes from both infected groups (Figures 6D, E), but mainly in those from virulent Lena-infected animals (Figure 6D). In the thymus, the expression of TNF-α was detected in the corticomedullary border and medulla from both infected groups (Figures 6H, I) but mainly in those infected with the virulent Lena strain (Figure 6H). Significant differences in the number of TNF-α+ cells were detected between the control and Lena-infected group in the tracheobronchial lymph node and thymus (p ≤ 0.05).
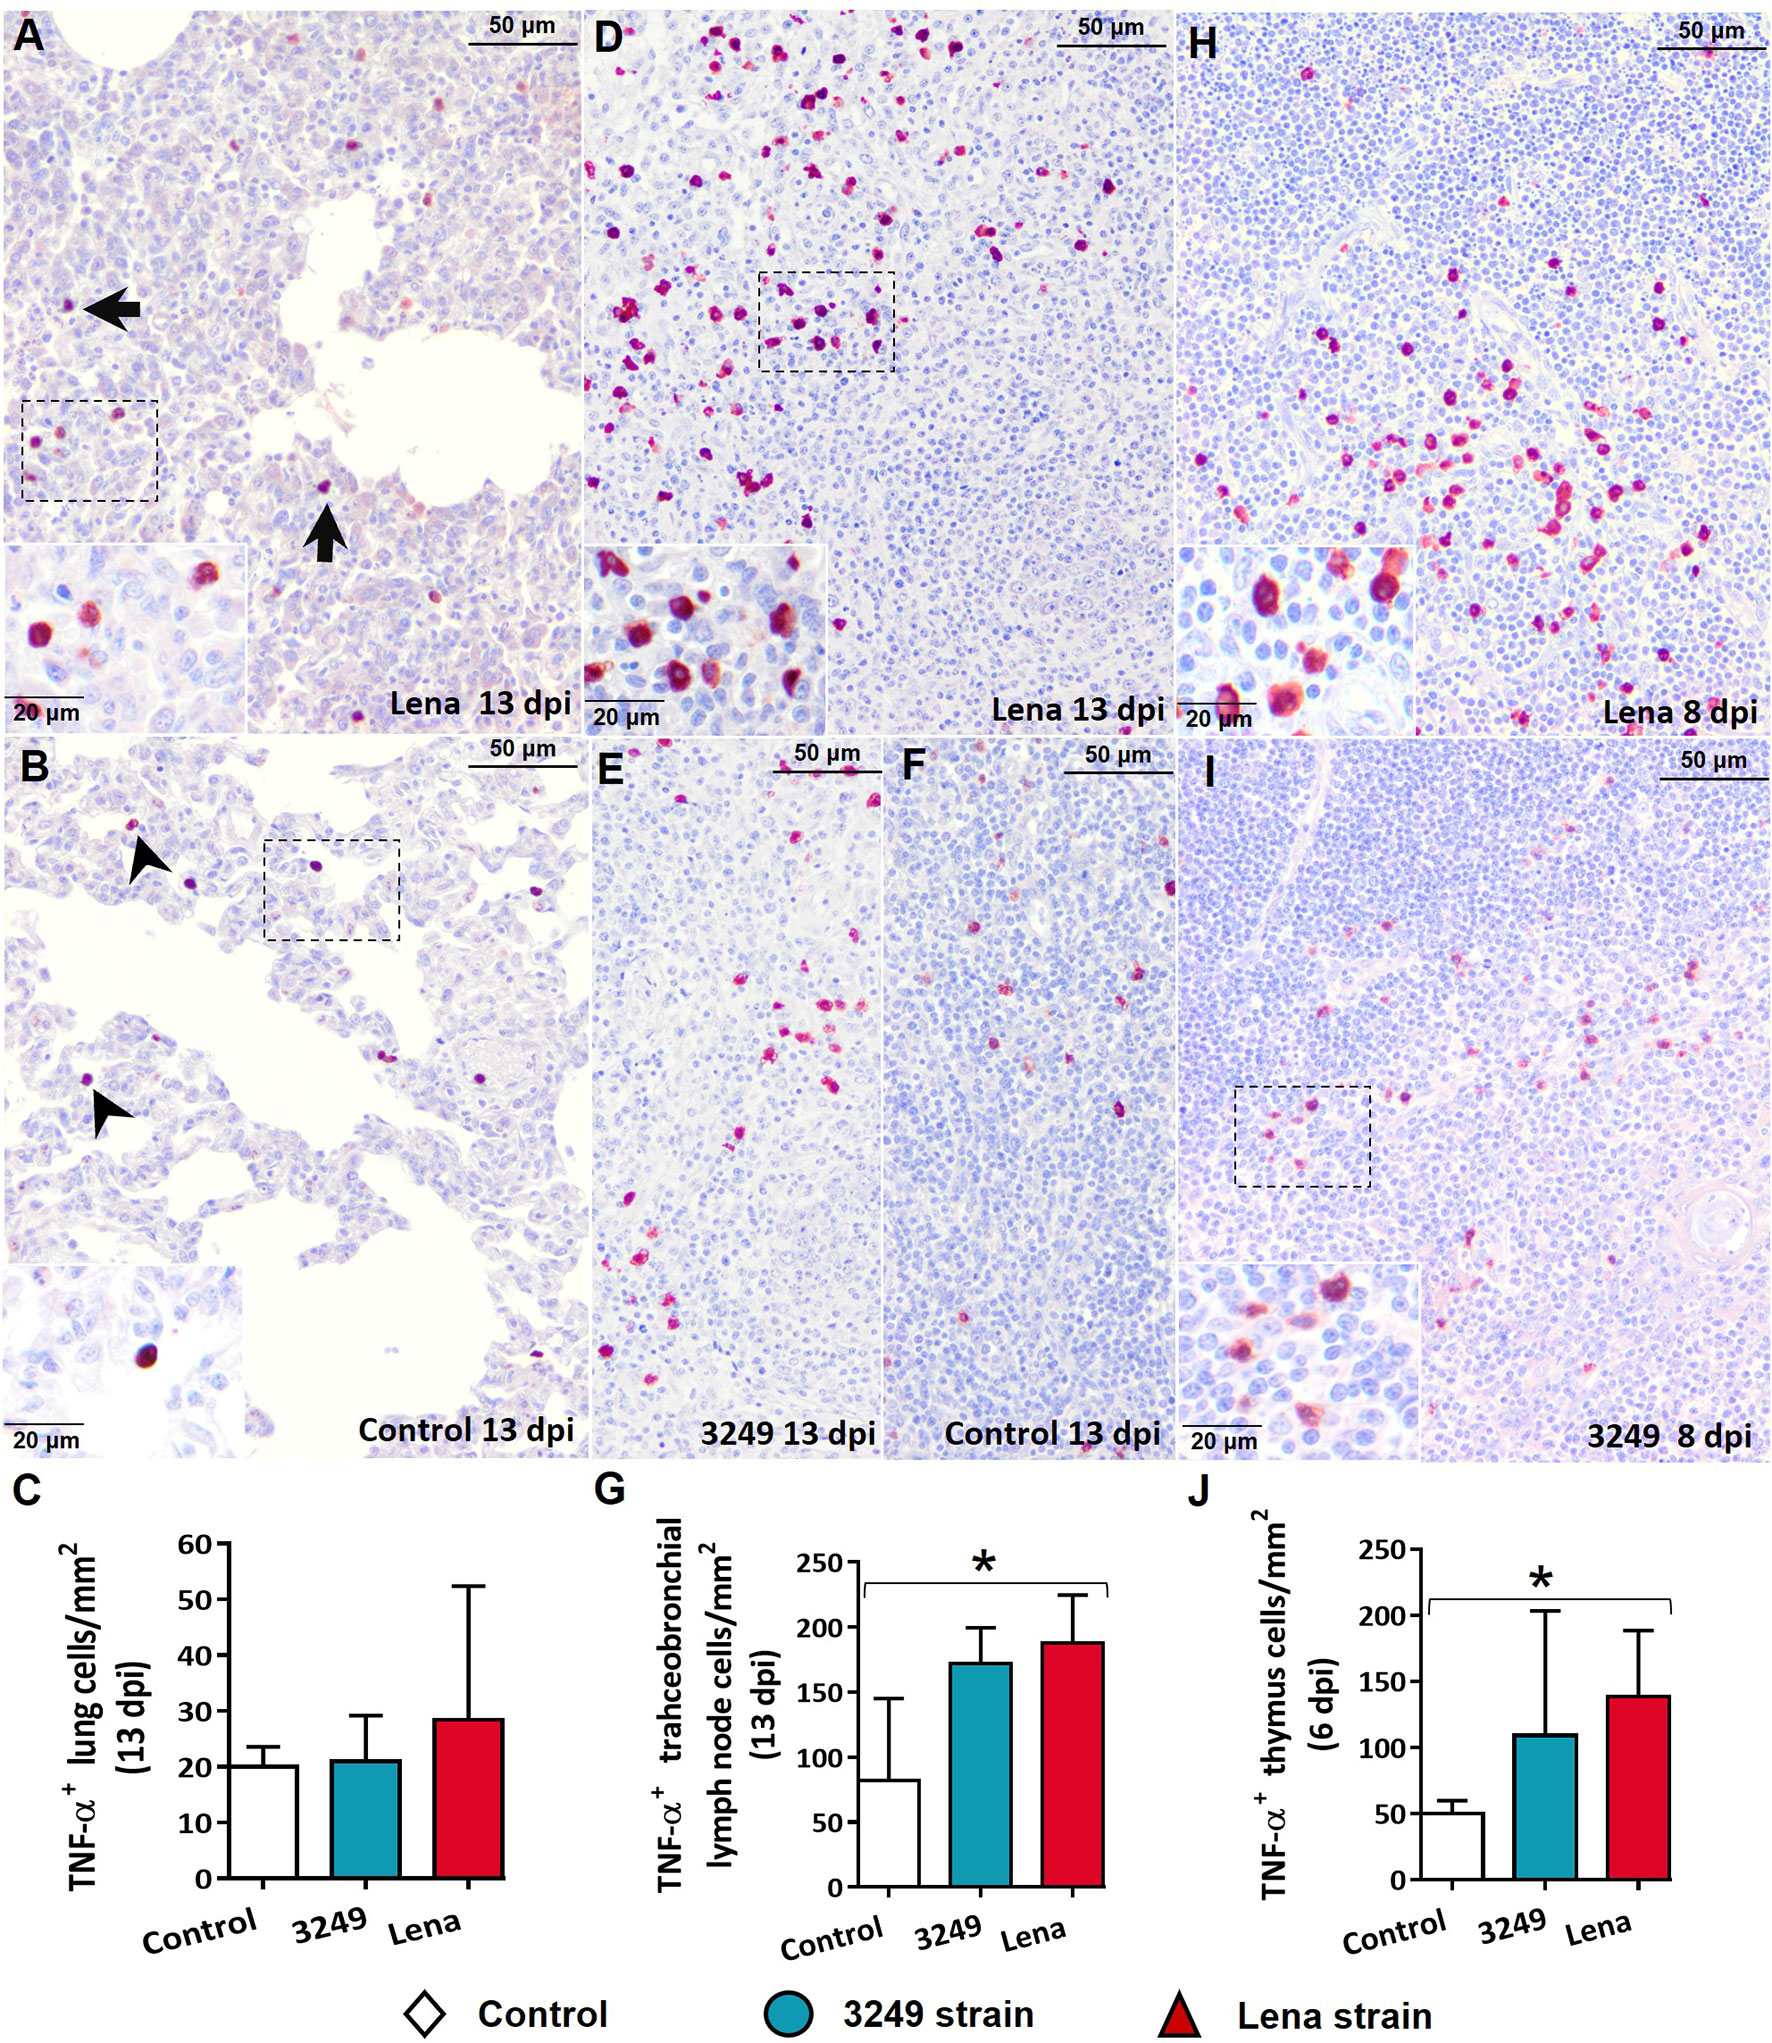
Figure 6 Immunohistochemical expression and counting of TNF-α in target organs. (A, B) Photomicrographs against TNF-α of the lung from a Lena-infected pig (A) and from a control pig (B) euthanized at 13 days post-infection (dpi) showing interstitial macrophages (black arrows) and pulmonary alveolar macrophages (black arrowheads) and in foci of suppurative bronchopneumonia and interstitial pneumonia and. Insets show interstitial macrophages (top) and pulmonary alveolar macrophages (bottom). (C) Graph showing the number of TNF-α+ cells in the lung. (D–F) Photomicrographs against TNF-α of the tracheobronchial lymph node from a pig infected with the Lena strain (D), from a piglet infected with 3249 (E), and from a control piglet (F) euthanized at 13 dpi. Inset shows lymphocytes and macrophages from the medulla expressing TNF-α. (G) Graph showing the number of TNF-α+ cells in the tracheobronchial lymph node. (H, I) Photomicrographs against TNF-α of the thymus from Lena-infected (H) and 3249-infected (I) piglets euthanized at 8 dpi. Inset shows thymocytes and macrophages from the corticomedullary border and medulla expressing TNF-α. (J) Graph showing the number of TNF-α+ cells in the thymus. Columns represents the median with range from the control group (white), low virulent 3249-infected (blue), and Lena-infected (red) groups. Significant differences between groups are represented (*p ≤ 0.05).
The expression of GATA3 in the studied organs from infected groups was low, and no differences were found with respect to the control group (Figure 7). A marked individual variability was observed between animals, particularly in the thymus.
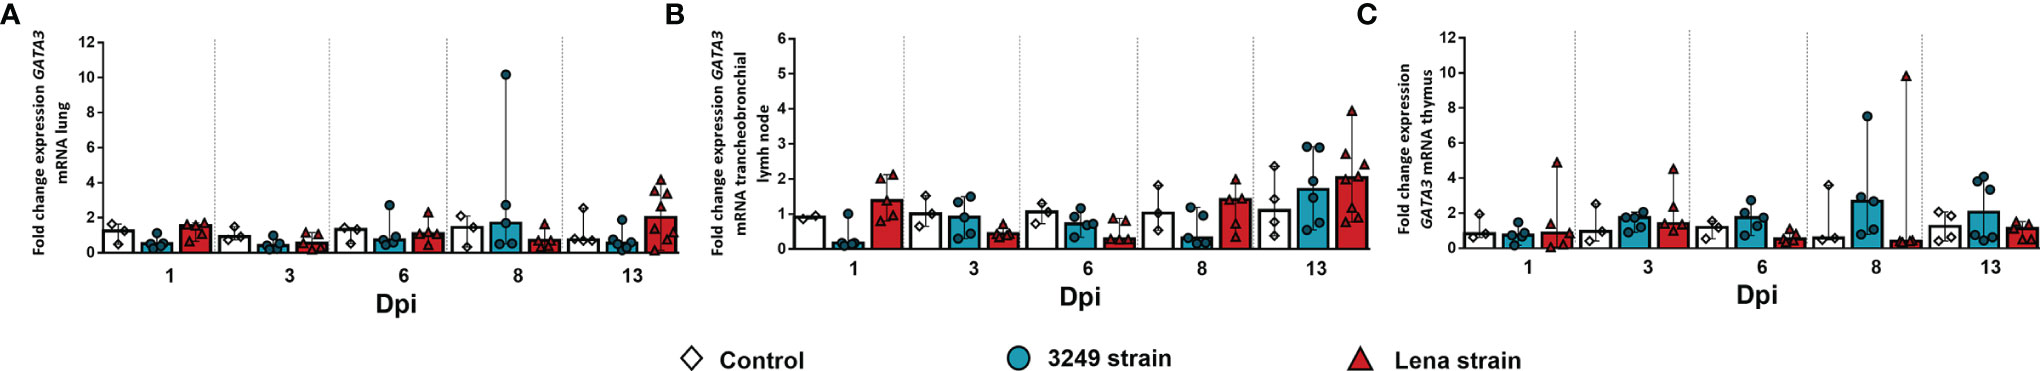
Figure 7 Relative mRNA expression of GATA3 in target organs. (A–C) Graphs showing fold change expression of GATA3 in the lung (A), tracheobronchial lymph node (B), and thymus (C). Relative quantification was performed using the CT method (also known as the 2−ΔΔCT method). Columns represent the median ± IQR. Individual values for each animal from the control (white diamond), 3249-infected (blue circle), and Lena-infected (red triangle) groups are represented.
An overexpression in the FOXP3 gene was detected in the lung and tracheobronchial lymph nodes from both infected groups at 13 dpi (Figures 8A, B). However, statistically significant differences between infected groups and the control group were only detected in the tracheobronchial lymph node (virulent Lena-infected animals: fold change = 5.63, IQR = 3.67; low virulent 3249-infected animals: fold change = 5.58, IQR = 7.60; p ≤ 0.05) (Figure 8B). In thymus, in contrast, the increase in the expression of FOXP3 was only detected in virulent Lena-infected animals at 13 dpi (fold change = 3.28, IQR = 4.91, p ≤ 0.01) (Figure 8C).
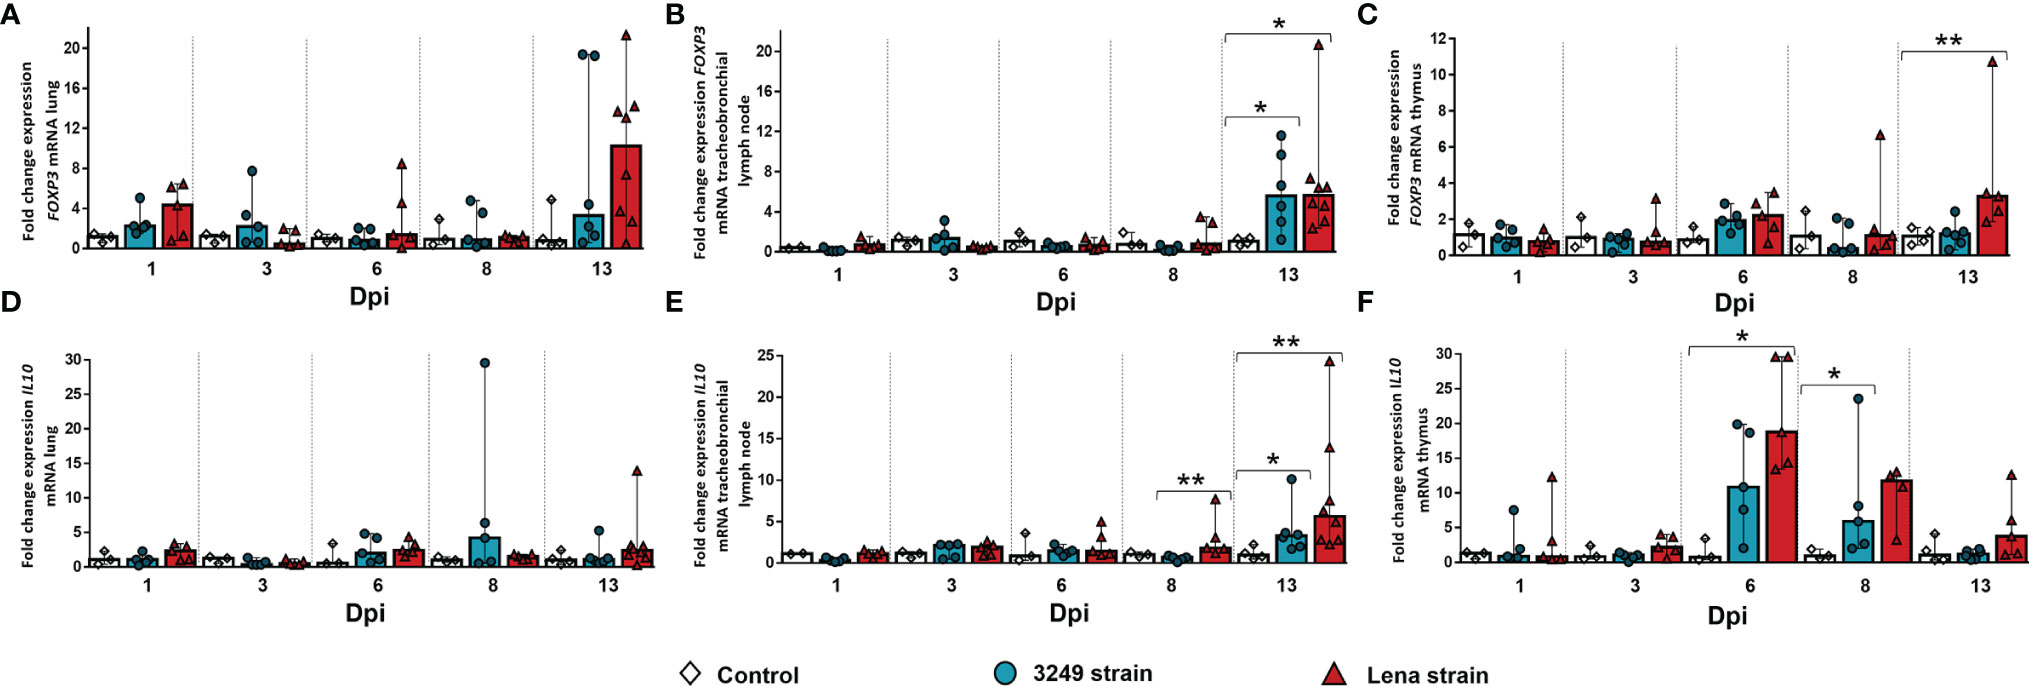
Figure 8 Relative mRNA expressions of FOXP3 and IL10 in target organs. Graphs show fold change expressions of FOXP3 and IL10 in the lung (A, D, respectively), tracheobronchial lymph node (B, E, respectively), and thymus (C, F, respectively). Relative quantification was performed using the CT method (also known as the 2−ΔΔCT method). Columns represent the median ± IQR. Individual values for each animal from the control (white diamond), 3249-infected (blue circle), and Lena-infected (red triangle) groups are represented. Significant differences between groups are represented (*p ≤ 0.05 and **p ≤ 0.01).
Regarding the expression of the IL10 gene in the lung, no significant differences were observed, except for a peak at 8 dpi in the lung from low virulent 3249-infected pigs, but with large individual variability (fold change = 4.22, IQR = 17.30) (Figure 8D). A high increase was observed at 13 dpi in the tracheobronchial lymph nodes from both virulent Lena- and low virulent-infected piglets, but to a lesser extent in the latter (Lena-infected group: fold change = 5.62, IQR = 9.57; 3249-infected group: fold change = 3.26, IQR = 3.34; p ≤ 0.01 and ≤ 0.05, respectively) (Figure 8E). The peak in the expression of IL10 was observed earlier (at 6 dpi) in the thymus from both infected groups, being higher in the thymus from virulent Lena-infected animals (Lena-infected animals: fold change = 18.78, IQR = 15.71; 3249-infected animals: fold change = 10.86, IQR = 14.45) and decreasing onwards (Figure 8F).
The immunolabeling of FOXP3 in the lung was observed in the nuclei of lymphocytes mainly located in areas of interstitial pneumonia in both Lena- and 3249-infected groups (Figures 9A, B). In the tracheobronchial lymph node, FOXP3 was evident in the nuclei of lymphocytes from the cortex and paracortex (Figures 9E, F). Animals from both infected groups evidenced a higher number of FOXP3+ cells in comparison with animals from the control group (Figure 9G). Significant differences were found between the control and Lena-infected groups in the FOXP3+ cell counts in the lung and tracheobronchial lymph node (p ≤ 0.05) (Figures 9D, G). In the case of the thymus, thymocytes from the medulla of both groups of infected animals (Figures 9H, I) showed a higher expression of FOXP3 than did the control animals (Figures 9J, K). Lung from control group showed low expression of FOXP3+ cells (Figure 9C). In general, FOXP3+ cells were more numerous in target organs from virulent Lena-infected pigs than from low virulent 3249-infected animals.
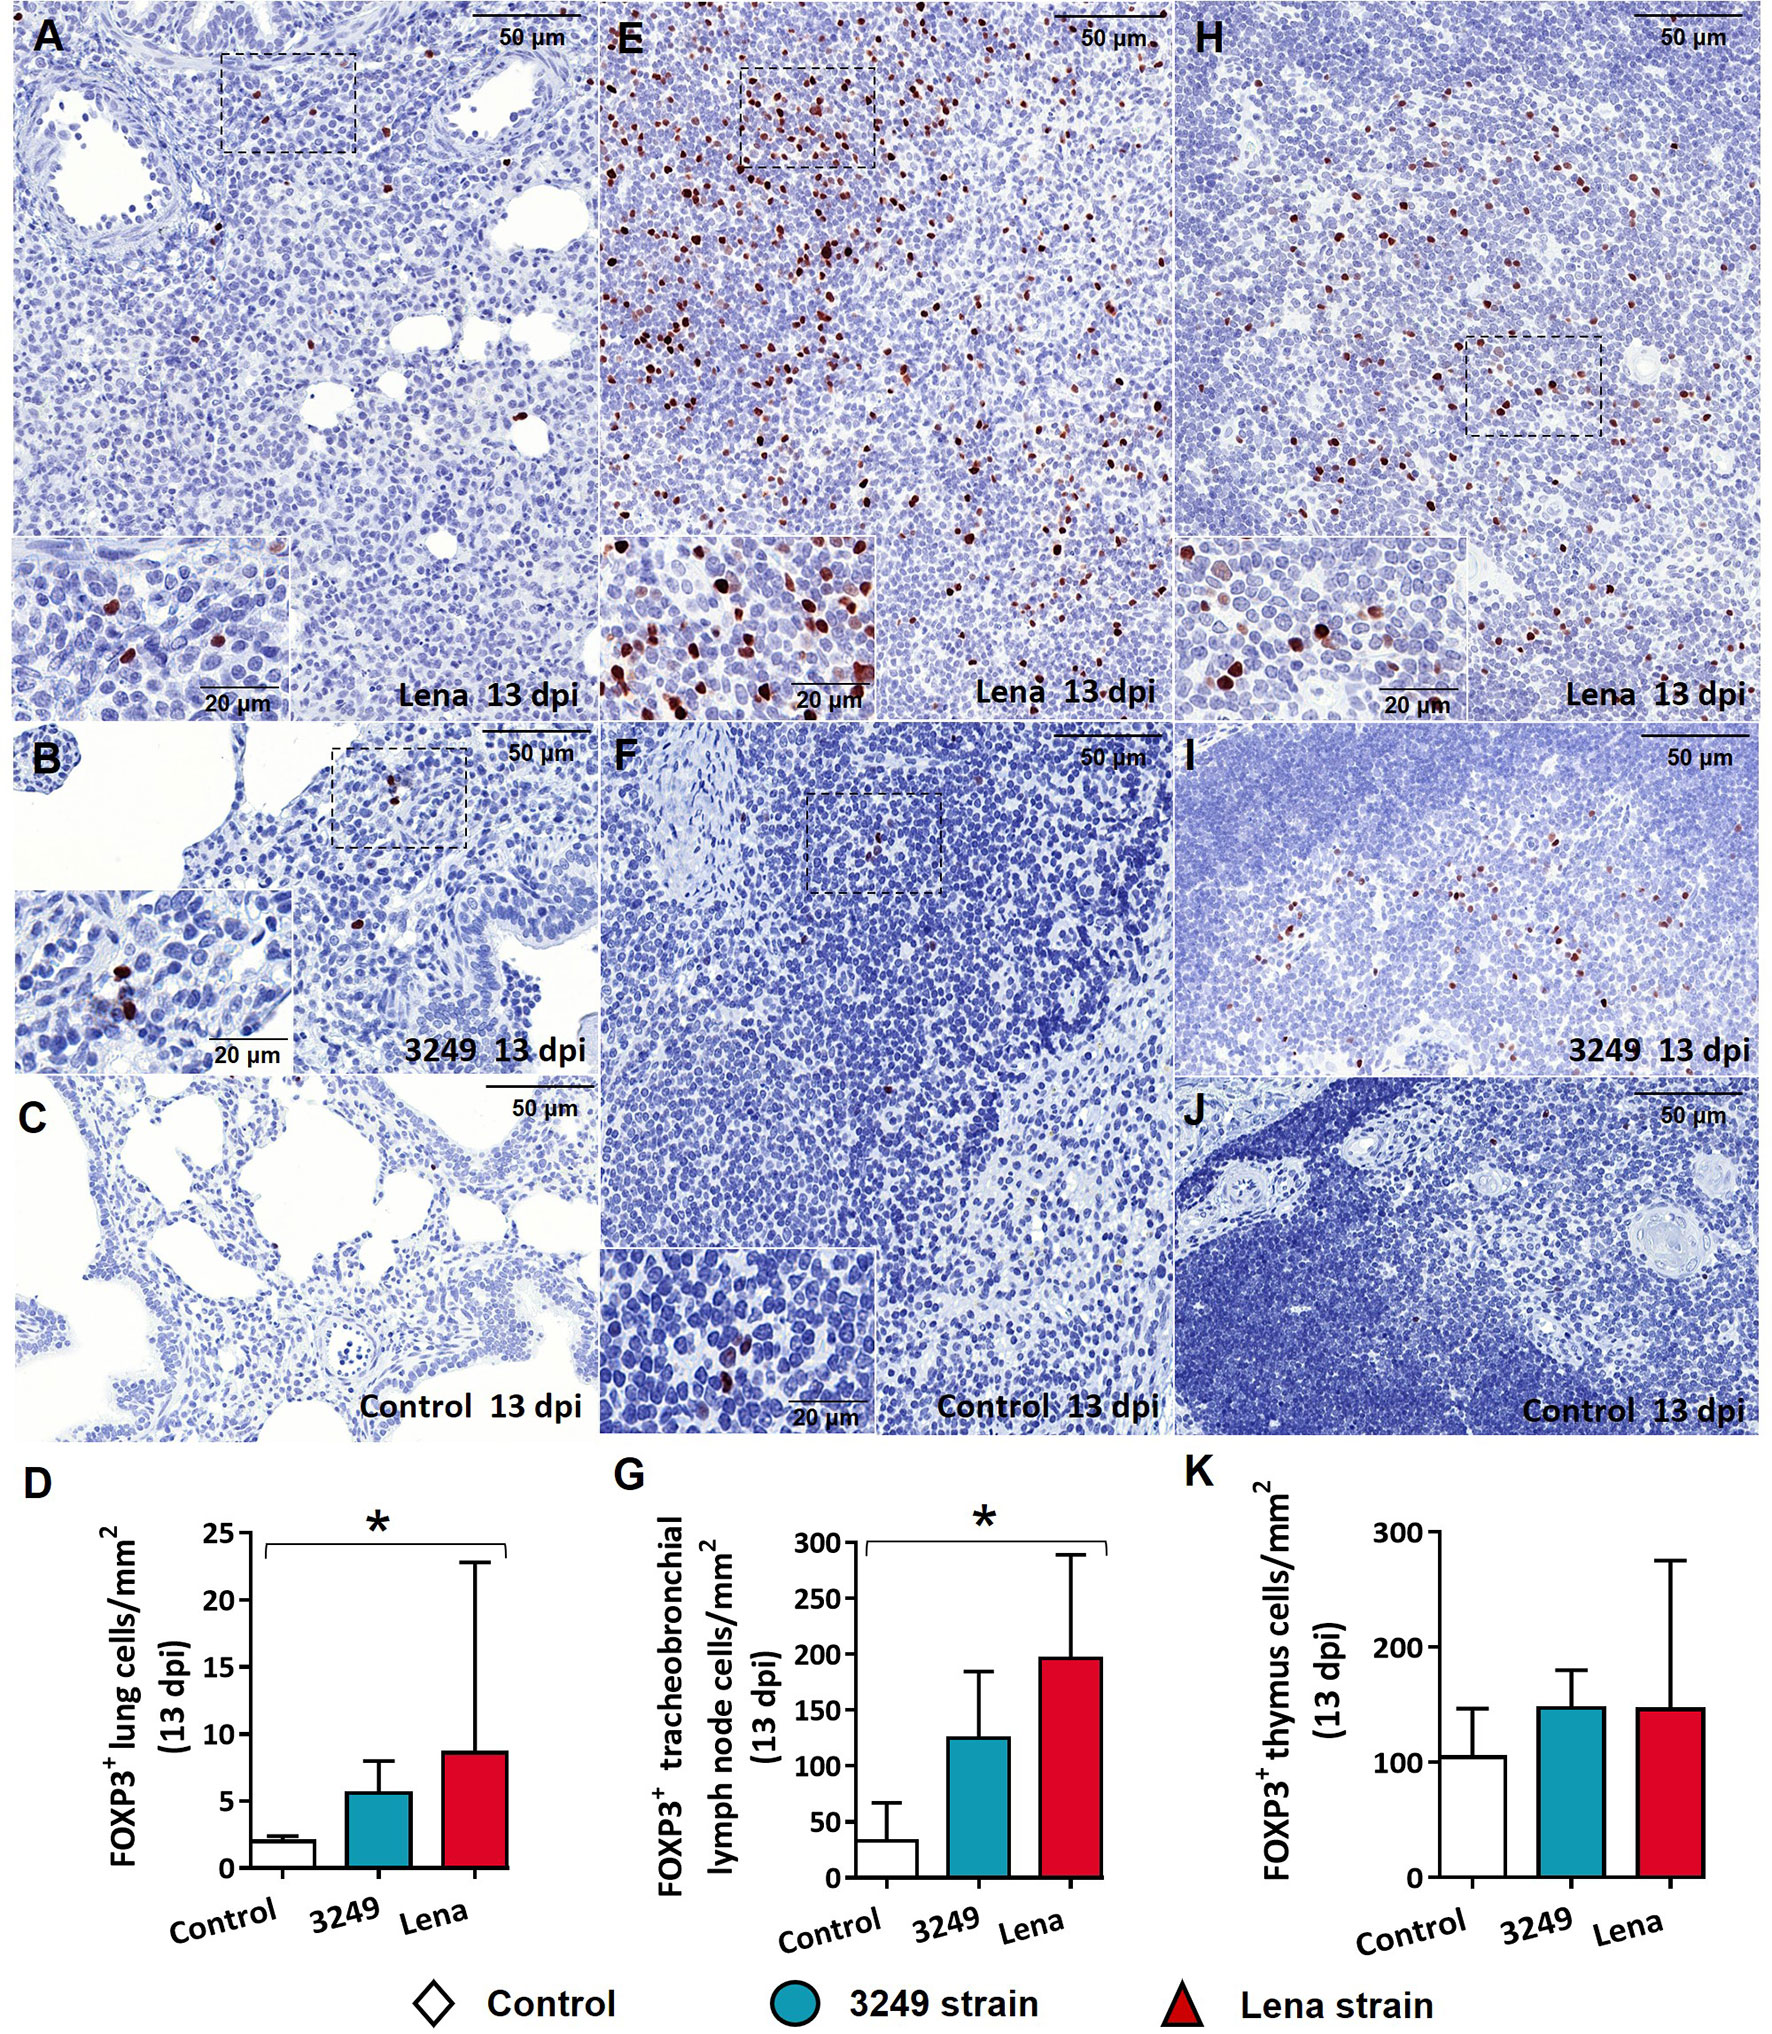
Figure 9 Immunohistochemical expression and counting of FOXP3 target organs. (A–C) Photomicrographs against FOXP3 of the lung from Lena-infected (A), 3249-infected (B), and control (C) piglets euthanized at 13 days post-infection (dpi). Insets show lymphocytes expressing FOXP3 in foci of interstitial pneumonia. (D) Graph showing the number of FOXP3+ cells in the lung. (E, F) Photomicrographs against FOXP3 of the tracheobronchial lymph node from a piglet infected with the Lena strain (E) and from a control piglet (F) euthanized at 13 dpi. Insets show lymphocytes from the paracortex and medulla expressing FOXP3. (G) Graph showing the number of FOXP3+ cells in the tracheobronchial lymph node. (H–J) Photomicrographs against FOXP3 of the thymus from Lena-infected (H), 3249-infected (I), and control (J) piglets euthanized at 13 dpi. Inset shows lymphocytes from the medulla expressing FOXP3. (K) Graph showing the number of FOXP3+ cells in the thymus. Columns represents the median with range from the control group (white), low virulent 3249-infected (blue), and Lena-infected (red) groups. Significant differences between groups are represented (*p ≤ 0.05).
The expression of the EOMES gene in the lung from virulent Lena-infected animals increased at 1, 3, and 13 dpi in comparison with the control group (fold change = 3.00, IQR = 3.27; fold change = 3.76, IQR = 1.94; and fold change = 2.65, IQR = 3.14, respectively), but only at 13 dpi were there significant differences (p ≤ 0.01) due to the wide individual variability along the study (Figure 10A). In the case of the tracheobronchial lymph node, EOMES was observed at 13 dpi in the tracheobronchial lymph nodes from both infected groups, but greater in those from piglets infected with the virulent Lena strain (Lena-infected animals: fold change = 3.47, IQR = 2.56; 3249-infected animals: fold change = 2.06, IQR = 2.29 for; p ≤ 0.01) (Figure 10B). EOMES was lightly expressed in the thymus during the whole experiment, with an increase in both infected groups only at the end of the study (3249-infected pigs: fold change = 3.31, IQR = 0.73; Lena-infected pigs: fold change = 5.00, IQR = 18.59; p ≤ 0.01) (Figure 10C).
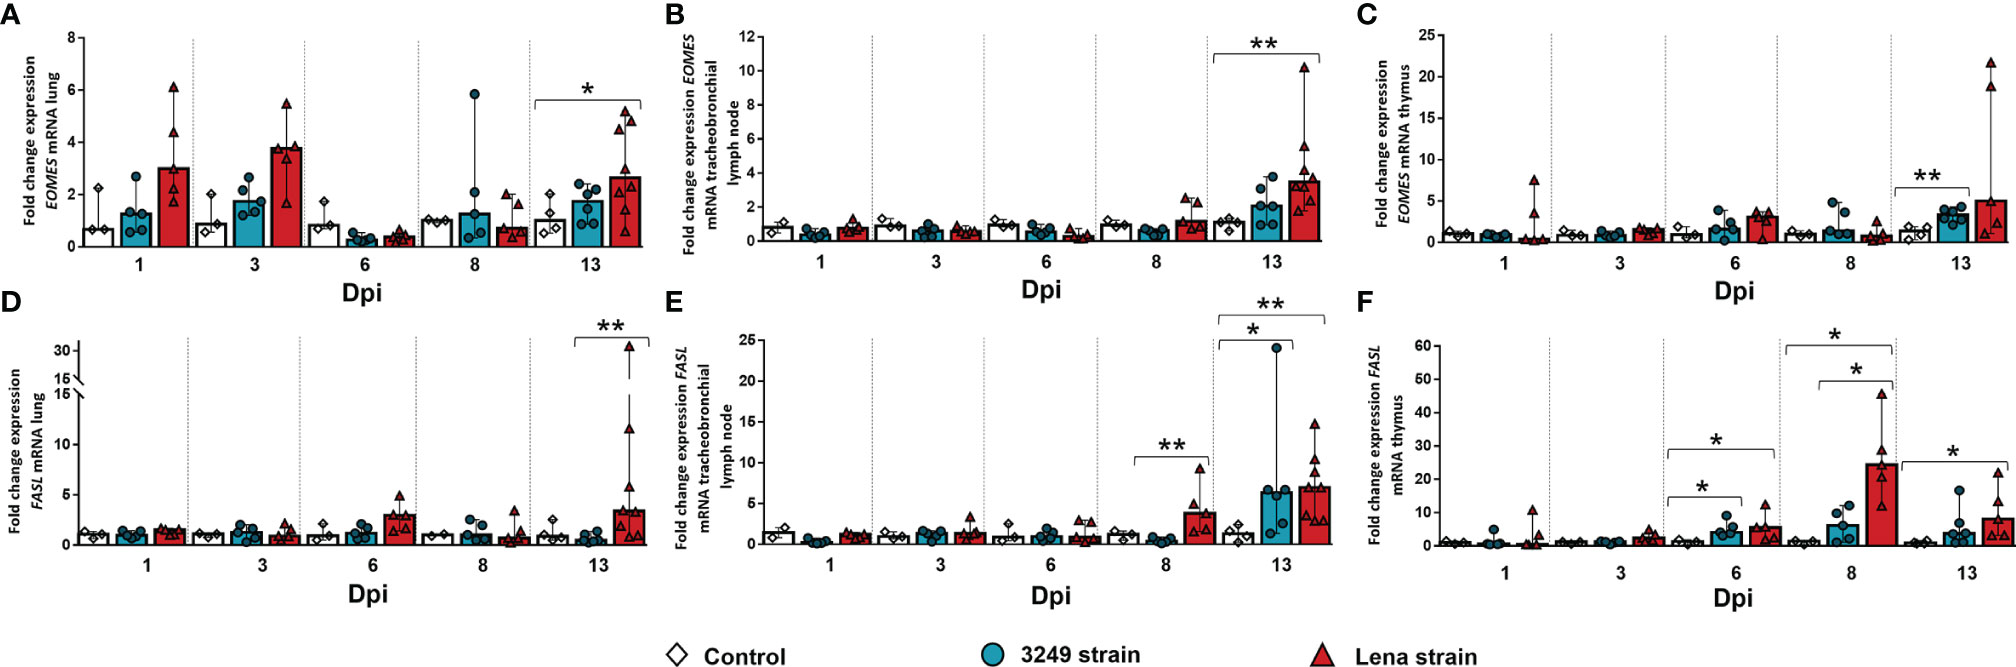
Figure 10 Relative mRNA expressions of EOMES and FASL in target organs. Graphs show fold change expressions of EOMES and FASL in the lung (A, D, respectively), tracheobronchial lymph node (B, E, respectively), and thymus (C, F, respectively). Relative quantification was performed with the CT method (also known as the 2−ΔΔCT method). Columns represent the median ± IQR. Individual values for each animal from the control (white diamond), 3249-infected (blue circle), and Lena-infected (red triangle) groups are represented. Significant differences between groups are represented (*p ≤ 0.05 and **p ≤ 0.01).
Regarding FASL, a statistically significant increase in its expression was observed in the lung from virulent Lena-infected animals at the end of the study (fold change = 3.38, IQR = 8.94, p ≤ 0.05), whereas it presented baseline levels in the lung from low virulent 3249-infected animals along the study (Figure 10D). FASL was significantly overexpressed in the tracheobronchial lymph node from virulent Lena-infected piglets from 8 dpi onwards (fold change = 3.80, IQR = 5.41 at 8 dpi; fold change = 6.96, IQR = 6.98 at 13 dpi; p ≤ 0.01) (Figure 10E). At 13 dpi, FASL was also overexpressed in the lymph node from pigs infected with the low virulent 3249 strain (fold change = 6.31, IQR = 8.79, p ≤ 0.01) compared with the control group (Figure 10E). In the thymus from virulent Lena-infected animals, the expression of FASL displayed a curve peaking at 8 dpi (fold change = 24.38, IQR = 20.86) and dropping at 13 dpi (fold change = 8.09, IQR = 14.48, p ≤ 0.05) (Figure 10F). In the thymus from low virulent 3249-infected animals, only a mild increase of FASL was detected from 6 dpi (fold change = 4.15, IQR = 3.98, p ≤ 0.05), which was maintained until the end of the study (fold change = 3.72, IQR = 8.25) (Figure 10F).
In the lung, Fas+ cells consisted of lymphocytes and interstitial and pulmonary alveolar macrophages from areas of interstitial pneumonia (Figures 11A, B), mainly in animals from the virulent Lena-infected group (Figure 11A). These cells were also observed in the lung from low virulent 3249-infected animals, but to a lesser extent (Figure 11B). Lung from control group showed low expression of Fas+ cells (Figure 11C). Fas labeling was detected in the cytoplasm of lymphocytes and macrophage-like cells in the medulla and paracortex of the tracheobronchial lymph nodes from both infected groups (Figures 11D–F). In the thymus, Fas expression was mainly evidenced in thymocytes of the thymic medulla from both infected groups (Figures 11G, H) in comparison with the control group (Figures 11I, J), but also in the cortex from virulent Lena-infected animals (Figure 11G).
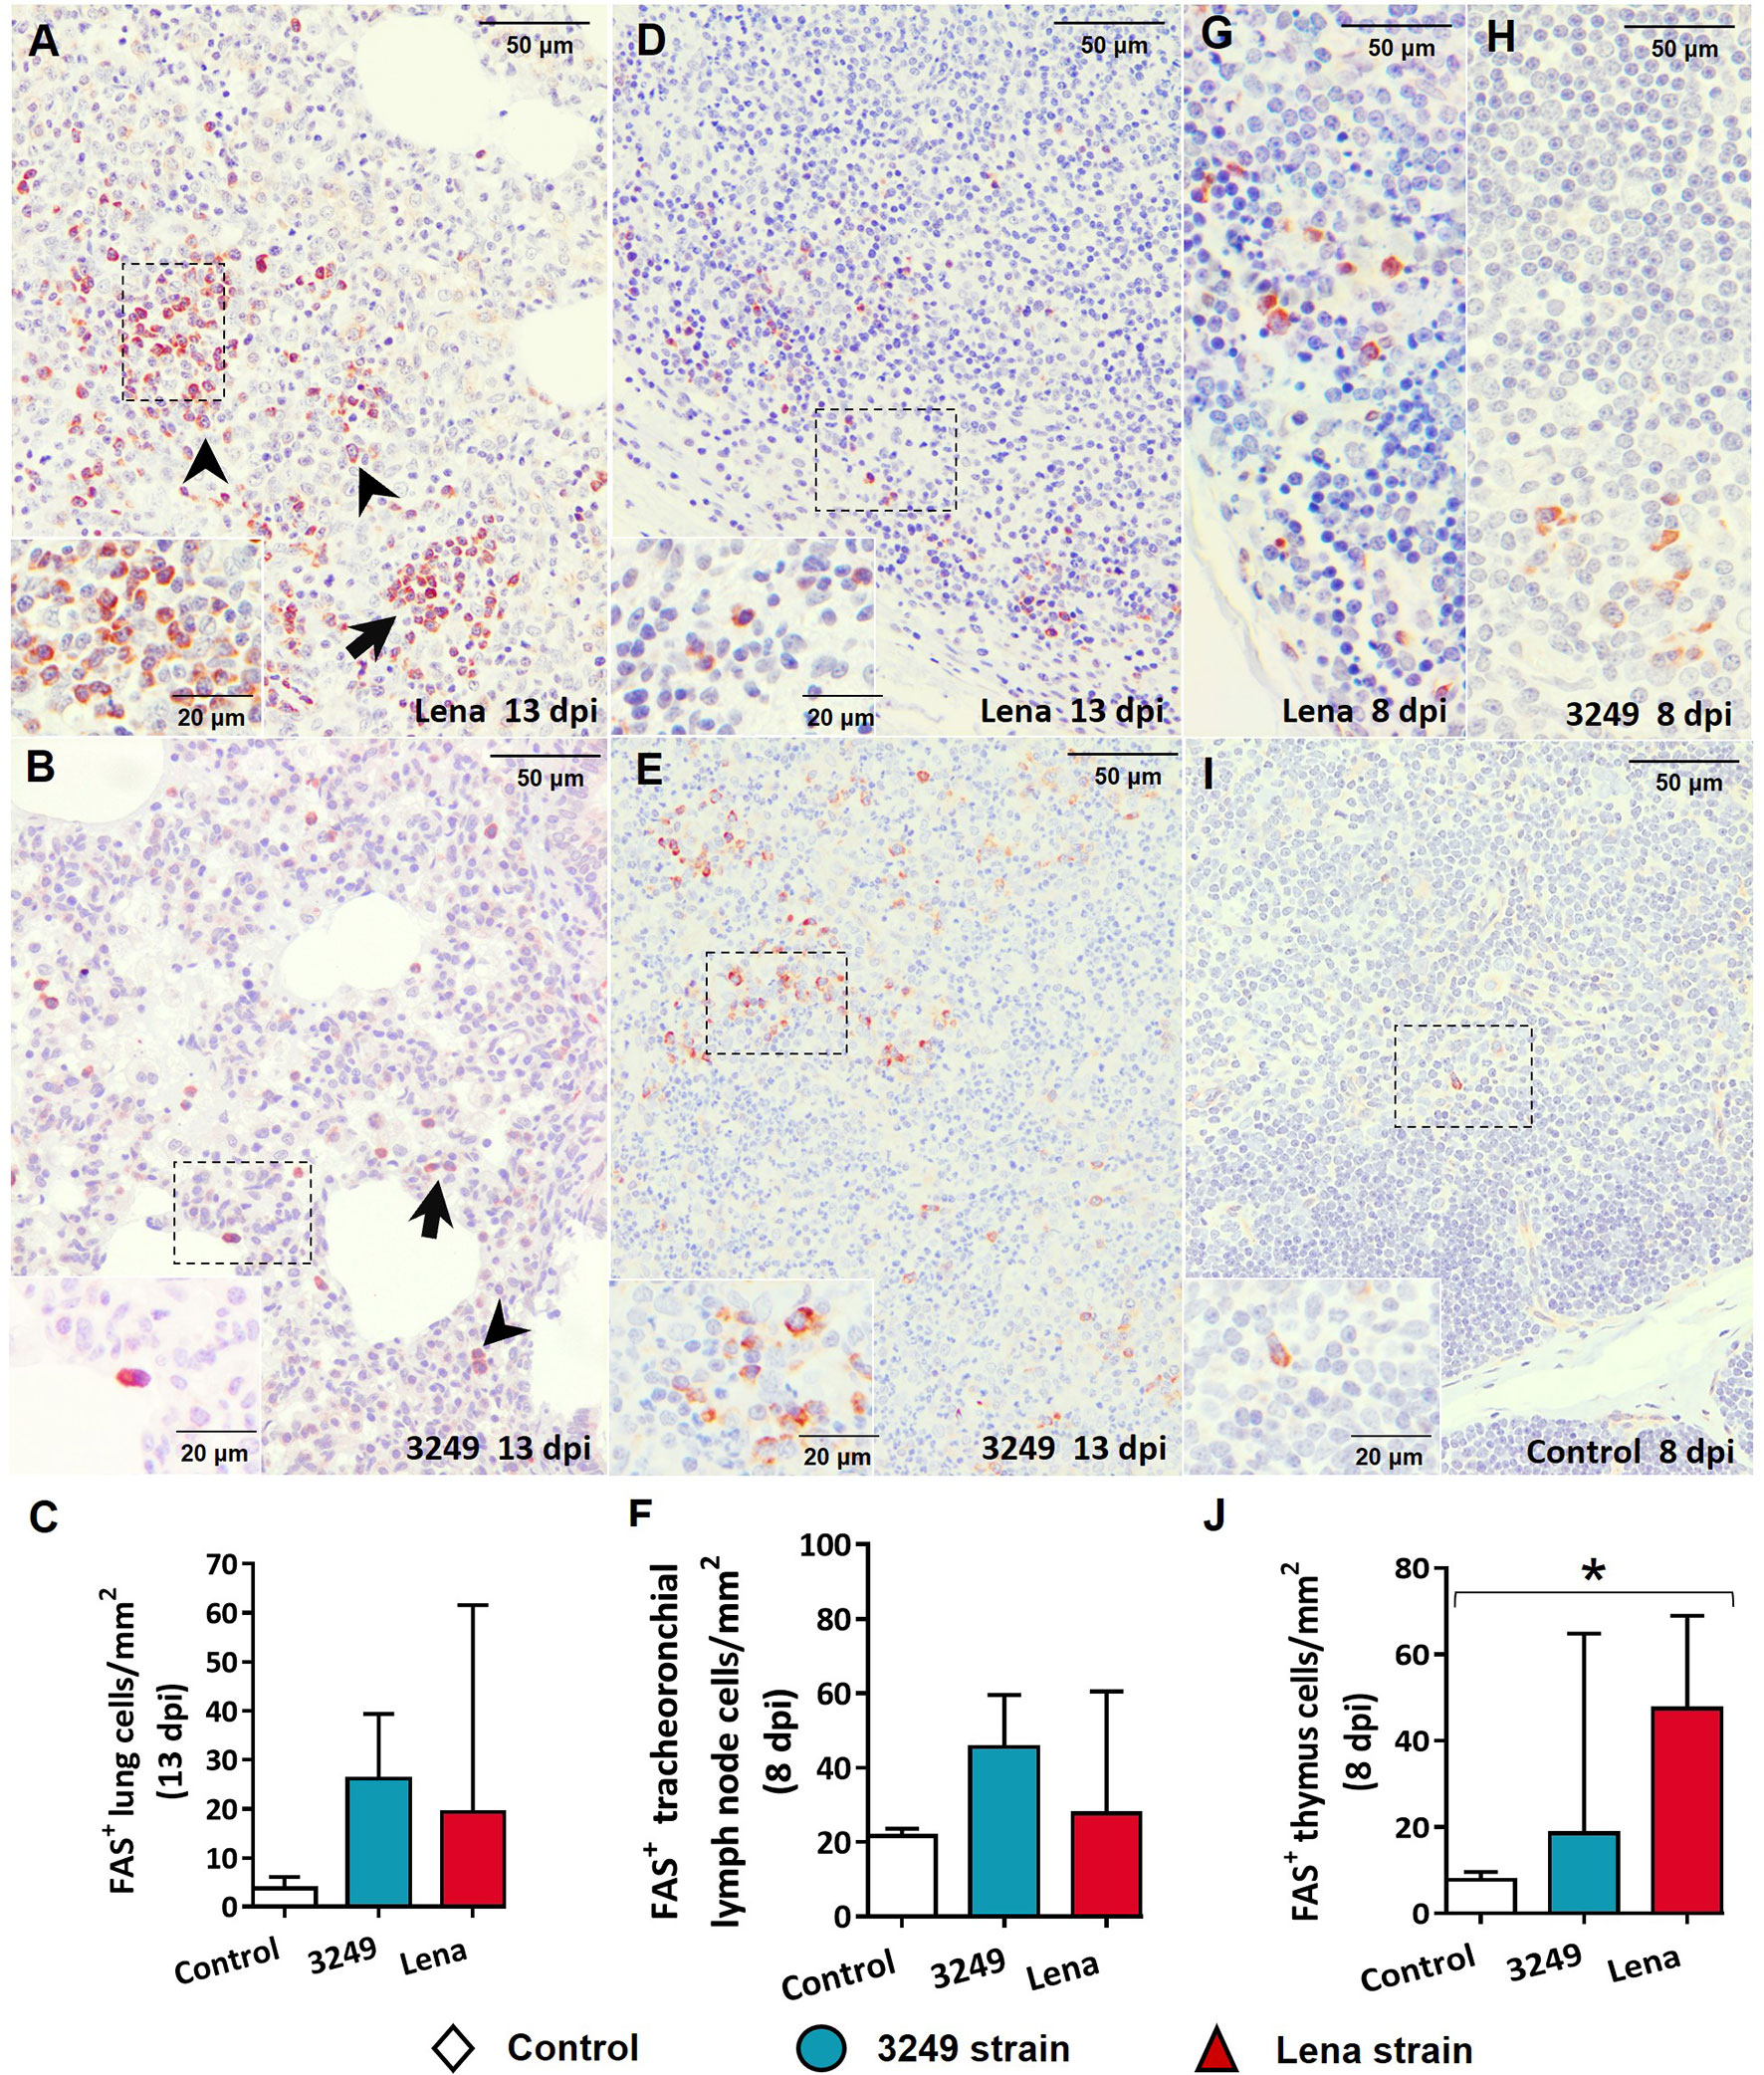
Figure 11 Immunohistochemical expression and counting of Fas in target organs. (A, B) Photomicrographs against Fas of the lung from Lena-infected (A) and 3249-infected (B) animals euthanized at 13 days post-infection (dpi) showing interstitial macrophages (black arrowheads) and lymphocytes (black arrows) in foci of interstitial pneumonia. Insets show lymphocytes (top) and pulmonary alveolar macrophages (bottom). (C) Graph showing the number of Fas+ cells in the lung. (D, E) Photomicrographs against Fas of the tracheobronchial lymph node from Lena-infected (D) and 3249-infected (E) piglets euthanized at 13 dpi. Insets show lymphocytes from the medulla and paracortex expressing Fas. (F) Graph showing the number of Fas+ cells in the tracheobronchial lymph node. (G–I) Photomicrographs against Fas of the thymus from Lena-infected (G), 3249-infected (H), and control (I) piglets euthanized at 8 dpi. Insets show lymphocytes from the medulla and thymic cortex expressing Fas. (J) Graph showing the number of Fas+ cells in the thymus. Columns represents the median with range from the control group (white), low virulent 3249-infected (blue), and Lena-infected (red) groups. Significant differences between groups are represented (*p ≤ 0.05).
The crosstalk between T cells and antigen-presenting cells (APCs) plays a key role in the establishment of adaptive immunity in lymph nodes (47). TFs regulate the development of different immune cell subsets by activating or repressing genes that are critical to cellular identity (3). Moreover, TFs control the genes that are involved in cell-type-specific proliferative and migratory properties, metabolic features, and effector functions (3). In this study, we evaluated the expressions of different TFs (T-bet, GATA3, FOXP3, and EOMES) through RT-qPCR and the associated cytokine profiles during infection with PRRSV-1 strains of different virulence in target organs.
The expression of the T-bet gene was upregulated in the lung, tracheobronchial lymph node, and thymus of virulent Lena-infected animals from 8 dpi onwards in comparison with the low virulent 3249 and control groups. This TF has been pointed out as the key regulator of CD4+ Th1 cells due to its role not only of genetically reprogramming CD4+ Th1 cells but also suppressing CD4+ Th2 cells (7). A low expression of T-bet has been noticed in the thymus from control and low virulent infected animals in our study, as was previously detected in γδT cells of the thymus from healthy pigs in other studies (23). However, a marked upregulation of the T-bet transcripts was observed in the thymus from the Lena-infected group at 8 dpi, which could be playing a role in the context of virulent PRRSV infection in this organ. This thymic upregulation of T-bet could be related with the migration of these cells from the periphery to the thymus, mainly from regional lymph nodes as priming organs. Another explanation could be related to the development of innate T cells, among which are γδT cells, mucosal-associated invariant T cells, and NK T cells (48, 49), as already speculated for other viral diseases (50), although further studies would be required to confirm this hypothesis in the context of PRRSV infection.
T-bet expression is induced by antigen receptor-derived signals and inflammatory cytokines, such as IL-12, IL-27, and IFN-γ (3, 7). Interestingly, in our study, a peak of IFNG expression was observed before that of T-bet expression (6-8 dpi), which was more marked in the target organs from Lena-infected animals. A previous study revealed a high proportion of CD4+ T cells co-expressing T-bet and IFN-γ in comparison with uninfected animals, which was suggestive of a Th1 polarization induced by the low virulent CReSA 3267 PRRSV-1 strain (24). Beyond this commitment, T-bet was also expressed by other immune cell types, including CD8+ T cells, γδT cells, DCs, or NK cells, being required for the proper functioning of these cells and acting as a bridge between innate and adaptive immune responses (14, 23, 48, 51). Thus, T-bet promotes the effector differentiation of CD8 T cells, playing a minor role during memory formation (3). A high frequency of T-bet in CD8+ T cells has been reported in lung from healthy pigs, whereas the percentages were rather low in the mediastinal lymph node (14). In our study, enhanced expressions of T-bet in the lung and tracheobronchial lymph node from the Lena-infected group in comparison with the low virulent and control groups were detected in our study. The greater expressions of T-bet in the tracheobronchial lymph node and lung at the end of this study would suggest the traveling of activated Th1 and effector CD8+ T cells from the former (8 dpi) to the latter (13 dpi) in order to face the infection with the virulent Lena strain. Interestingly, CD8 T cells were the primary source of IFN-γ production in the lung after vaccination with the virulent PRRSV-21-7-4 strain (52).
Our results suggest that the virulent Lena strain induces a stronger and earlier Th1 and effector CD8+ T-cell polarization than does the low virulent 3249 strain in target organs. In agreement with this result, Bordet et al. (53) reported a higher in vitro activation of conventional type 1 dendritic cells (cDC1) induced by the virulent Lena strain in comparison with low virulent strains, which suggested a Th1 response also accompanied by high expressions of T-bet, IFN-γ, and IL-12. The activation of the Th1 and effector CD8 phenotypes by the upregulation of the T-bet gene is also supported in our study by the overexpression of the cytokine TNFA in the tracheobronchial lymph node and lung of virulent Lena-infected animals at the end of the study. This pro-inflammatory cytokine has been associated with apoptosis and other cell death phenomena in the context of PRRSV infection, specifically during infection with the virulent Lena strain, not only in the lung but also in the thymus (20, 21), helping to explain the severity of the lesions associated with this strain. Whereas IFN-γ+ and TNF-α+ cells were mainly located in lymphocytes from the medullar area in the tracheobronchial lymph node and thymus, pointing out lymphoid lineage (expressing the T-bet gene) as the major source of IFN-γ and TNF-α in these organs, the expressions of these cytokines in the lung were mostly evidenced in interstitial and pulmonary alveolar macrophages, mainly associated with local inflammatory response.
GATA3 has been shown to be essential for both T-cell development and Th2 cell fate (8, 54–56). However, during the whole study, no differences in the expression of GATA3 were observed in the thymus, neither in tracheobronchial lymph node nor in the lung, from control and both infected groups. A previous report was able to evidence an increase in the frequency of GATA3 CD4 T cells following infection with Trichuris suis, but, in agreement with our result, was not demonstrated after PRRSV infection (24).
A high expression of the FOXP3 gene, the main modulator of CD4+ Tregs (9), was also observed in the tracheobronchial lymph node and lung at the end of the study. Two types of FOXP3+ Tregs could affect the immunopathogenesis during viral infections (57). Natural Tregs are generated in the thymus and help to prevent autoimmunity, whereas activated or induced Tregs are responsible for limiting tissue damage and inflammation in peripheral tissues and are associated with innate and adaptive immune responses (57–59). Increased frequencies of CD4+ Tregs have been observed in a huge number of studies on human and animal viral infections and have been associated with the establishment of persistent infection (2, 60). Porcine in vitro studies have demonstrated that low virulent PRRSV strains are able to induce Tregs (25, 60, 61), which has been associated with IL-10 production in subsequent studies (60, 62, 63). The expression of IL-10 could favor viral persistence and secondary complications in the lungs from infected piglets (62). However, in vivo studies with virulent PRRSV-1 strains have released controversial results regarding the induction of Tregs during the early phase of infection. Whereas no evident increase in the frequency of Tregs was observed in pigs infected with virulent PR40/2014 and SU1 PRRSV-1 strains in comparison with low virulent strains (26, 27), our research group already described an increase in FOXP3 expression in the lung from Lena-infected pigs at 2 weeks post-infection (18). In the present study, the same kinetics in the expression of the FOXP3 gene in the tracheobronchial lymph node was observed for IL10. These Tregs could be the source of IL-10, which could mean an attempt to modulate the expressions of the other cytokines, such as IFN-γ and TNF-α, as mentioned above, observed in this organ. In the thymus from low virulent 3249-infected animals, the expression of the FOXP3 gene was constant along the whole study. However, an induction of natural Tregs could be speculated in the thymus from virulent Lena-infected animals due to the higher expression of the FOXP3 gene in this group in comparison with the control and low virulent 3249-infected groups at the end of the study (13 dpi). Additionally, FOXP3 has been demonstrated to be expressed in CD8+ T cells from the mesenteric lymph nodes and thymus of healthy pigs (22); however, these CD8+FOXP3+ cells have been demonstrated to be low IFN-γ inducers in other studies (64).
The EOMES gene, the main TF of CD4 CTLs, was overexpressed in target organs from virulent Lena-infected animals at the end of the study. This effector CD4+ T-cell subset is developed under inflammation and infection, being induced during antiviral response to promote virus clearance through cytotoxicity and cytokine-dependent mechanisms (2, 13). However, depending on their maturation stage, CD4 CTLs could also be regulated by T-bet (13). Particularly, EOMES induces CD4+ T cytotoxicity by activating the perforin and FasL pathways (2, 11–13). Curiously, in our study, a peak of the FASL gene was demonstrated in the lung and tracheobronchial lymph node from virulent Lena-infected piglets parallel to the expression of EOMES, which was also shown through immunohistochemical expression of Fas. The interaction of Fas/FasL mediates the cleavage of caspase-8, a mediator of extrinsic apoptotic pathway (65), whose activation has been previously described in the lung and thymus from animals infected with the virulent Lena strain (20, 21). Moreover, EOMES, together with T-bet, could also be co-expressed in naïve and effector CD8+ T cells, which promotes IFN-γ, perforin, and granzyme B expressions (3, 66). In the thymus from virulent Lena-infected animals, a high expression of the EOMES gene was detected at the end of the study (13 dpi), but with wide individual variability and no significant differences with respect to the other groups. Nevertheless, earlier expression of the FASL gene was detected in the thymus from both infected groups (6 dpi), with a peak of expression at 8 dpi in the thymus of virulent Lena-infected piglets coinciding with the severity of lesions in this organ. A similar kinetics to this one was also observed in the expression of the Fas protein in the thymus from virulent Lena-infected animals in a parallel study from our research group (20). The expression of the FASL gene observed in our study could be associated with an indirect induction by pro-apoptotic cytokines, such as TNF-α, a hypothesis supported by the enhancement of the expression of the TNFA gene observed in our study.
In the present study, we have observed high expressions of T-bet, EOMES, and FOXP3, which are suggestive of a polarization toward Th1 cells and Tregs, but also toward CD4+ CTLs, effector CD8+ T cells, and γδT cells particularly in response against the virulent PRRSV-1 Lena strain. Although our findings suggest an activation of some T-cell subsets, it would be of interest to study the kinetics of expression of such TFs during the late stages of PRRSV infection to better understand the immunobiology of this disease.
The raw data supporting the conclusions of this article will be made available by the authors, without undue reservation.
The animal study was reviewed and approved by the IRTA Ethics Committee and by the Catalan Autonomous Government (Project 3647; FUE-2017-00533413) and carried out following the European Union guidelines (Directive 2010/63/EU).
IR-G, JG-L, and LC conceived, designed, and performed the project. FP, IR-G, and JG-L helped in the animal experiments and sample collection. IR-T, JS-C, FL-M, and IB conducted the laboratory experiments and analyzed the data. IR-T wrote the manuscript. JG-L and IR-G reviewed the manuscript. LC, FP, and JG-L supervised the study and contributed to reagents/materials/analysis tools. All authors contributed to the article and approved the submitted version.
This work was supported by the Spanish Ministry of Economy and Competitiveness (#AGL2016-76111-R and PID2019-109718GB-I00).
The authors declare that the research was conducted in the absence of any commercial or financial relationships that could be construed as a potential conflict of interest.
All claims expressed in this article are solely those of the authors and do not necessarily represent those of their affiliated organizations, or those of the publisher, the editors and the reviewers. Any product that may be evaluated in this article, or claim that may be made by its manufacturer, is not guaranteed or endorsed by the publisher.
The authors would like to thank Alberto Alcántara and Marta Ordóñez-Martínez for their technical assistance.
1. Intlekofer AM, Takemoto N, Wherry EJ, Longworth SA, Northrup JT, Palanivel VR, et al. Effector and Memory CD8+ T Cell Fate Coupled by T-Bet and Eomesodermin. Nat Immunol (2005) 6:1236–44. doi: 10.1038/ni1268
2. Swain SL, McKinstry KK, Strutt TM. Expanding Roles for CD4 + T Cells in Immunity to Viruses. Nat Rev Immunol (2012) 12:136–48. doi: 10.1038/nri3152
3. Kallies A, Good-Jacobson KL. Transcription Factor T-Bet Orchestrates Lineage Development and Function in the Immune System. Trends Immunol (2017) 38:287–97. doi: 10.1016/j.it.2017.02.003
4. Sullivan BM, Juedes A, Szabo SJ, von Herrath M, Glimcher LH. Antigen-Driven Effector CD8 T Cell Function Regulated by T-Bet. Proc Natl Acad Sci (2003) 100(26):15818–23. doi: 10.1073/pnas.2636938100
5. Townsend MJ, Weinmann AS, Matsuda JL, Salomon R, Farnham PJ, Biron CA, et al. T-Bet Regulates the Terminal Maturation and Homeostasis of NK and Vα14i NKT Cells. Immunity (2004) 20(4):477–94. doi: 10.1016/S1074-7613(04)00076-7
6. Pritchard GH, Kedl RM, Hunter CA. The Evolving Role of T-Bet in Resistance to Infection. Nat Rev Immunol (2019) 19:398–410. doi: 10.1038/s41577-019-0145-4
7. Szabo SJ, Kim ST, Costa GL, Zhang X, Fathman CG, Glimcher LH. A Novel Transcription Factor, T-Bet, Directs Th1 Lineage Commitment. Cell (2000) 100:655–69. doi: 10.1016/S0092-8674(00)80702-3
8. Ho I-C, Tai T-S, Pai S-Y. GATA3 and the T-Cell Lineage: Essential Functions Before and After T-Helper-2-Cell Differentiation. Nat Rev Immunol (2009) 9:125–35. doi: 10.1038/nri2476
9. Deng G, Xiao Y, Zhou Z, Nagai Y, Zhang H, Li B, et al. Molecular and Biological Role of the FOXP3 N-Terminal Domain in Immune Regulation by T Regulatory/Suppressor Cells. Exp Mol Pathol (2012) 93:334–8. doi: 10.1016/j.yexmp.2012.09.013
10. Fontenot JD, Rasmussen JP, Williams LM, Dooley JL, Farr AG, Rudensky AY. Regulatory T Cell Lineage Specification by the Forkhead Transcription Factor Foxp3. Immunity (2005) 22:329–41. doi: 10.1016/j.immuni.2005.01.016
11. Eshima K, Chiba S, Suzuki H, Kokubo K, Kobayashi H, Iizuka M, et al. Ectopic Expression of a T-Box Transcription Factor, Eomesodermin, Renders CD4 + Th Cells Cytotoxic by Activating Both Perforin- and FasL-Pathways. Immunol Lett (2012) 144:7–15. doi: 10.1016/j.imlet.2012.02.013
12. Qui HZ, Hagymasi AT, Bandyopadhyay S, St. Rose M-C, Ramanarasimhaiah R, Ménoret A, et al. CD134 Plus CD137 Dual Costimulation Induces Eomesodermin in CD4 T Cells To Program Cytotoxic Th1 Differentiation. J Immunol (2011) 187:3555–64. doi: 10.4049/jimmunol.1101244
13. Takeuchi A, Saito T. CD4 CTL, a Cytotoxic Subset of CD4+ T Cells, Their Differentiation and Function. Front Immunol (2017) 8:194. doi: 10.3389/fimmu.2017.00194
14. Rodríguez-Gómez IM, Talker SC, Käser T, Stadler M, Hammer SE, Saalmüller A, et al. Expression of T-Bet, Eomesodermin and GATA-3 in Porcine αβ T Cells. Dev Comp Immunol (2016) 60:115–26. doi: 10.1016/j.dci.2016.02.022
15. Brinton MA, Gulyaeva A, Balasuriya UBR, Dunowska M, Faaberg KS, Goldberg T, et al. Proposal 2017.012S.a.V1. Expansion Rank Structure Family Arteriviridae Renaming its Taxa.+. (2018).
16. Butler JE, Lager KM, Golde W, Faaberg KS, Sinkora M, Loving C, et al. Porcine Reproductive and Respiratory Syndrome (PRRS): An Immune Dysregulatory Pandemic. Immunol Res (2014) 59:81–108. doi: 10.1007/s12026-014-8549-5
17. Weesendorp E, Rebel JMJ, Popma-De Graaf DJ, Fijten HPD, Stockhofe-Zurwieden N. Lung Pathogenicity of European Genotype 3 Strain Porcine Reproductive and Respiratory Syndrome Virus (PRRSV) Differs From That of Subtype 1 Strains. Vet Microbiol (2014) 174:127–38. doi: 10.1016/j.vetmic.2014.09.010
18. Sánchez-Carvajal JM, Rodríguez-Gómez IM, Ruedas-Torres I, Larenas-Muñoz F, Díaz I, Revilla C, et al. Activation of Pro- and Anti-Inflammatory Responses in Lung Tissue Injury During the Acute Phase of PRRSV-1 Infection With the Virulent Strain Lena. Vet Microbiol (2020) 246:108744. doi: 10.1016/j.vetmic.2020.108744
19. Amarilla SP, Gómez-Laguna J, Carrasco L, Rodríguez-Gómez IM, Caridad y Ocerín JM, Graham SP, et al. Thymic Depletion of Lymphocytes is Associated With the Virulence of PRRSV-1 Strains. Vet Microbiol (2016) 188:47–58. doi: 10.1016/j.vetmic.2016.04.005
20. Ruedas-Torres I, Rodríguez-Gómez IM, Sánchez-Carvajal JM, Pallares FJ, Barranco I, Carrasco L, et al. Activation of the Extrinsic Apoptotic Pathway in the Thymus of Piglets Infected With PRRSV-1 Strains of Different Virulence. Vet Microbiol (2020) 243:108639. doi: 10.1016/j.vetmic.2020.108639
21. Sánchez-Carvajal JM, Ruedas-Torres I, Carrasco L, Pallarés FJ, Mateu E, Rodríguez-Gómez IM, et al. Activation of Regulated Cell Death in the Lung of Piglets Infected With Virulent PRRSV − 1 Lena Strain Occurs Earlier and Mediated by Cleaved Caspase − 8. Vet Res (2021) 52.12:1–14. doi: 10.1186/s13567-020-00882-x
22. Käser T, Gerner W, Hammer SE, Patzl M, Saalmüller A. Phenotypic and Functional Characterisation of Porcine CD4+CD25high Regulatory T Cells. Vet Immunol Immunopathol (2008) 122:153–8. doi: 10.1016/j.vetimm.2007.08.002
23. Rodríguez-Gómez IM, Talker SC, Käser T, Stadler M, Reiter L, Ladinig A, et al. Expression of T-Bet, Eomesodermin, and GATA-3 Correlates With Distinct Phenotypes and Functional Properties in Porcine γδ T Cells. Front Immunol (2019) 10:396. doi: 10.3389/fimmu.2019.00396
24. Ebner F, Rausch S, Scharek-Tedin L, Pieper R, Burwinkel M, Zentek J, et al. A Novel Lineage Transcription Factor Based Analysis Reveals Differences in T Helper Cell Subpopulation Development in Infected and Intrauterine Growth Restricted (IUGR) Piglets. Dev Comp Immunol (2014) 46:333–40. doi: 10.1016/j.dci.2014.05.005
25. Silva-Campa E, Flores-Mendoza L, Reséndiz M, Pinelli-Saavedra A, Mata-Haro V, Mwangi W, et al. Induction of T Helper 3 Regulatory Cells by Dendritic Cells Infected With Porcine Reproductive and Respiratory Syndrome Virus. Virology (2009) 387:373–9. doi: 10.1016/j.virol.2009.02.033
26. Ferrari L, Canelli E, De Angelis E, Catella A, Ferrarini G, Ogno G, et al. A Highly Pathogenic Porcine Reproductive and Respiratory Syndrome Virus Type 1 (PRRSV-1) Strongly Modulates Cellular Innate and Adaptive Immune Subsets Upon Experimental Infection. Vet Microbiol (2018) 216:85–92. doi: 10.1016/j.vetmic.2018.02.001
27. Morgan SB, Graham SP, Salguero FJ, Sánchez Cordón PJ, Mokhtar H, Rebel JMJ, et al. Increased Pathogenicity of European Porcine Reproductive and Respiratory Syndrome Virus is Associated With Enhanced Adaptive Responses and Viral Clearance. Vet Microbiol (2013) 163:13–22. doi: 10.1016/j.vetmic.2012.11.024
28. Fan B, Liu X, Bai J, Li Y, Zhang Q, Jiang P. The 15N and 46R Residues of Highly Pathogenic Porcine Reproductive and Respiratory Syndrome Virus Nucleocapsid Protein Enhance Regulatory T Lymphocytes Proliferation. PloS One (2015) 10:e0138772. doi: 10.1371/journal.pone.0138772
29. Rodríguez-Gómez IM, Sánchez-Carvajal JM, Pallarés FJ, Mateu E, Carrasco L, Gómez-Laguna J. Virulent Lena Strain Induced an Earlier and Stronger Downregulation of CD163 in Bronchoalveolar Lavage Cells. Vet Microbiol (2019) 235:101–9. doi: 10.1016/j.vetmic.2019.06.011
30. Mattsson JG, Bergstrom K, Wallgren P, Johansson KE. Detection of Mycoplasma Hyopneumoniae in Nose Swabs From Pigs by In Vitro Amplification of the 16S rRNA Gene. J Clin Microbiol (1995) 33:893–7. doi: 10.1128/jcm.33.4.893-897.1995
31. Sibila M, Calsamiglia M, Segalés J, Blanchard P, Badiella L, Le Dimma M, et al. Use of a Polymerase Chain Reaction Assay and an ELISA to Monitor Porcine Circovirus Type 2 Infection in Pigs From Farms With and Without Postweaning Multisystemic Wasting Syndrome. Am J Vet Res (2004) 65:88–92. doi: 10.2460/ajvr.2004.65.88
32. Gimeno M, Darwich L, Diaz I, de la Torre E, Pujols J, Martín M, et al. Cytokine Profiles and Phenotype Regulation of Antigen Presenting Cells by Genotype-I Porcine Reproductive and Respiratory Syndrome Virus Isolates. Vet Res (2011) 42:9. doi: 10.1186/1297-9716-42-9
33. Karniychuk UU, Geldhof M, Vanhee M, Van Doorsselaere J, Saveleva TA, Nauwynck HJ. Pathogenesis and Antigenic Characterization of a New East European Subtype 3 Porcine Reproductive and Respiratory Syndrome Virus Isolate. BMC Vet Res (2010) 6:1–10. doi: 10.1186/1746-6148-6-3
34. Kuzemtseva L, de la Torre E, Martín G, Soldevila F, Ait-Ali T, Mateu E. Drwich I Regulation of Toll-Like Receptors 3,7 and 9 in Porcine Alveolar Macrophages by Differing Genotype 1 Strains. Vet Immunol Immunopathol (2014) 158:189–98. doi: 10.1016/j.vetimm.2014.01.009
35. Pfaffl MW. Relative Quantification. Real-Time PCR. International University Line (2007). pp. 64–82.
36. Vandesompele J, De Preter K, Pattyn F, Poppe B, Van Roy N, De Paepe A, et al. Accurate Normalization of Real-Time Quantitative RT-PCR Data by Geometric Averaging of Multiple Internal Control Genes. Genome Biol (2002) 3:1–12. doi: 10.1186/gb-2002-3-7-research0034
37. Nygard AB, Jørgensen CB, Cirera S, Fredholm M. Selection of Reference Genes for Gene Expression Studies in Pig Tissues Using SYBR Green qPCR. BMC Mol Biol (2007) 8:1–6. doi: 10.1186/1471-2199-8-67
38. Uddin M, Cinar M, Tesfaye D, Looft C, Tholen E, Schellander K. Age-Related Changes in Relative Expression Stability of Commonly Used Housekeeping Genes in Selected Porcine Tissues. BMC Res Notes (2011) 4:7–9. doi: 10.1186/1756-0500-4-441
39. Bordet E, Blanc F, Tiret M, Crisci E, Bouguyon E, Renson P, et al. Porcine Reproductive and Respiratory Syndrome Virus Type 1.3 Lena Triggers Conventional Dendritic Cells 1 Activation and T Helper 1 Immune Response Without Infecting Dendritic Cells. Front Immunol (2018) 9:2299. doi: 10.3389/fimmu.2018.02299
40. Fujii T, Sakurai N, Osaki T, Iwagami G, Hirayama H, Minamihashi A, et al. Changes in the Expression Patterns of the Genes Involved in the Segregation and Function of Inner Cell Mass and Trophectoderm Lineages During Porcine Preimplantation Development. J Reprod Dev (2013) 59:151–8. doi: 10.1262/jrd.2012-122
41. Ferrarini G, Borghetti P, De Angelis E, Ferrari L, Canelli E, Catella A, et al. Immunoregulatory Signal FoxP3, Cytokine Gene Expression and IFN-γ Cell Responsiveness Upon Porcine Reproductive and Respiratory Syndrome Virus (PRRSV) Natural Infection. Res Vet Sci (2015) 103:96–102. doi: 10.1016/j.rvsc.2015.09.018
42. Magaña G, Rodríguez A, Zhang H, Webb R, Alberio R. Paracrine Effects of Embryo-Derived FGF4 and BMP4 During Pig Trophoblast Elongation. Dev Biol (2014) 387:15–27. doi: 10.1016/j.ydbio.2014.01.008
43. Royaee AR, Husmann RJ, Dawson HD, Calzada-Nova G, Schnitzlein WM, Zuckermann FA, et al. Deciphering the Involvement of Innate Immune Factors in the Development of the Host Response to PRRSV Vaccination. Vet Immunol Immunopathol (2004) 102:199–216. doi: 10.1016/j.vetimm.2004.09.018
44. Moue M, Tohno M, Shimazu T, Kido T, Aso H, Saito T, et al. Toll-Like Receptor 4 and Cytokine Expression Involved in Functional Immune Response in an Originally Established Porcine Intestinal Epitheliocyte Cell Line. BiochimBiophys Acta - Gen Subj (2008) 1780:134–44. doi: 10.1016/j.bbagen.2007.11.006
45. Gao W, Sun W, Qu B, Cardona CJ, Powell K, Wegner M, et al. Distinct Regulation of Host Responses by ERK and JNK MAP Kinases in Swine Macrophages Infected With Pandemic (H1N1) 2009 Influenza Virus. PloS One (2012) 7(1):e30328. doi: 10.1371/journal.pone.0030328
46. Untergasser A, Nijveen H, Rao X, Bisseling T, Geurts R, Leunissen JAM. Primer3Plus, an Enhanced Web Interface to Primer3. Nucleic Acids Res (2007) 35:71–4. doi: 10.1093/nar/gkm306
47. Hirosue S, Dubrot J. Modes of Antigen Presentation by Lymph Node Stromal Cells and Their Immunological Implications. Front Immunol (2015) 6:446. doi: 10.3389/fimmu.2015.00446
48. Lazarevic V, Glimcher LH, Lord GM. T-Bet: A Bridge Between Innate and Adaptive Immunity. Nat Rev Immunol (2013) 13(11):777–89. doi: 10.1038/nri3536
49. Lee M, Lee E, Han SK, Choi YH, Kwon DI, Choi H, et al. Single-Cell RNA Sequencing Identifies Shared Differentiation Paths of Mouse Thymic Innate T Cells. Nat Commun (2020) 11(1):1–17. doi: 10.1038/s41467-020-18155-8
50. Juno JA, Keynan Y, Fowke KR. Invariant NKT Cells: Regulation and Function During Viral Infection. PLoS Pathog (2012) 8:(8):e1002838. doi: 10.1371/journal.ppat.1002838
51. Jameson SC, Lee YJ, Hogquist KA. Innate Memory T Cells. Adv Immunol (2015) 126:173–213. doi: 10.1016/bs.ai.2014.12.001
52. Kick AR, Wolfe ZC, Amaral AF, Cortes LM, Almond GW, Crisci E, et al. Maternal Autogenous Inactivated Virus Vaccination Boosts Immunity to PRRSV in Piglets. Vaccines (Basel) (2021) 9(2):106. doi: 10.3390/vaccines9020106
53. Bordet E, Blanc F, Tiret M, Crisci E, Bouguyon E, Renson P, et al. Porcine Reproductive and Respiratory Syndrome Virus Type 1.3 Lena Triggers Conventional Dendritic Cells 1 Activation and T Helper 1 Immune Response Without Infecting Dendritic Cells. Front Immunol (2018) 9:2299. doi: 10.3389/fimmu.2018.02299
54. Hendriks RW, Nawijn MC, Engel JD, van Doorninck H, Grosveld F, Karis A. Expression of the Transcription Factor GATA-3 Is Required for the Development of the Earliest T Cell Progenitors and Correlates With Stages of Cellular Proliferation in the Thymus. Eur J Immunol (1999) 29:1912–8. doi: 10.1002/(sici)1521-4141(199906)29:06<1912::aid-immu1912>3.3.co;2-4
55. Tindemans I, Serafini N, DiSanto JP, Hendriks RW. GATA-3 Function in Innate and Adaptive Immunity. Immunity (2014) 41:191–206. doi: 10.1016/j.immuni.2014.06.006
56. Wang L, Wildt KF, Zhu J, Zhang X, Feigenbaum L, Tessarollo PWE, et al. Distinct Functions for the Transcription Factors GATA-3 and ThPOK During Intrathymic Differentiation of CD4+ T Cells. Nat Immunol (2008) 9(10):1122–30. doi: 10.1038/ni.1647
57. Veiga-Parga T, Sehrawat S, Rouse BT. Role of Regulatory T Cells During Virus Infection. Immunol Rev (2013) 255(1):182–96. doi: 10.1111/imr.12085
58. Miyara M, Sakaguchi S. Natural Regulatory T Cells: Mechanisms of Suppression. Trends Mol Med (2007) 13:108–16. doi: 10.1016/j.molmed.2007.01.003
59. Vignali DAA, Collison LW, Workman CJ. How Regulatory T Cells Work. Nat Rev Immunol (2008) 8:523–32. doi: 10.1038/nri2343
60. Silva-Campa E, Mata-Haro V, Mateu E, Hernández J. Porcine Reproductive and Respiratory Syndrome Virus Induces CD4 +CD8 +CD25 +Foxp3 + Regulatory T Cells (Tregs). Virology (2012) 430:73–80. doi: 10.1016/j.virol.2012.04.009
61. Wongyanin P, Buranapraditkun S, Chokeshai-usaha K, Thanawonguwech R, Suradhat S. Induction of Inducible CD4+CD25+Foxp3+ Regulatory T Lymphocytes by Porcine Reproductive and Respiratory Syndrome Virus (PRRSV). Vet Immunol Immunopathol (2010) 133:170–82. doi: 10.1016/j.vetimm.2009.07.012
62. Nedumpun T, Sirisereewan C, Thanmuan C, Techapongtada P, Puntarotairung R, Naraprasertkul S, et al. Induction of Porcine Reproductive and Respiratory Syndrome Virus (PRRSV)-Specific Regulatory T Lymphocytes (Treg) in the Lungs and Tracheobronchial Lymph Nodes of PRRSV-Infected Pigs. Vet Microbiol (2018) 216:13–9. doi: 10.1016/j.vetmic.2018.01.014
63. Wongyanin P, Buranapraditkul S, Yoo D, Thanawongnuwech R, Roth JA, Suradhat S. Role of Porcine Reproductive and Respiratory Syndrome Virus Nucleocapsid Protein in Induction of Interleukin-10 and Regulatory T-Lymphocytes (Treg). J Gen Virol (2012) 93:1236–46. doi: 10.1099/vir.0.040287-0
64. Mayer CT, Floess S, Baru AM, Lahl K, Huehn J, Sparwasser T. CD8+ Foxp3+ T Cells Share Developmental and Phenotypic Features With Classical CD4+ Foxp3+ Regulatory T Cells But Lack Potent Suppressive Activity. Eur J Immunol (2011) 41(3):716–25. doi: 10.1002/eji.201040913
65. Danial NN, Korsmeyer SJ. Cell Death: Critical Control Points. Cell (2004) 116:205–19. doi: 10.1016/S0092-8674(04)00046-7
Keywords: transcription factors, cytokines, PRRSV-1, virulence, target organs
Citation: Ruedas-Torres I, Gómez-Laguna J, Sánchez-Carvajal JM, Larenas-Muñoz F, Barranco I, Pallarés FJ, Carrasco L and Rodríguez-Gómez IM (2021) Activation of T-bet, FOXP3, and EOMES in Target Organs From Piglets Infected With the Virulent PRRSV-1 Lena Strain. Front. Immunol. 12:773146. doi: 10.3389/fimmu.2021.773146
Received: 09 September 2021; Accepted: 08 November 2021;
Published: 09 December 2021.
Edited by:
Nicolas Bertho, INRA Biologie, Épidémiologie et Analyse de Risque en santé animale (BIOEPAR), FranceReviewed by:
Tobias Kaeser, North Carolina State University, United StatesCopyright © 2021 Ruedas-Torres, Gómez-Laguna, Sánchez-Carvajal, Larenas-Muñoz, Barranco, Pallarés, Carrasco and Rodríguez-Gómez. This is an open-access article distributed under the terms of the Creative Commons Attribution License (CC BY). The use, distribution or reproduction in other forums is permitted, provided the original author(s) and the copyright owner(s) are credited and that the original publication in this journal is cited, in accordance with accepted academic practice. No use, distribution or reproduction is permitted which does not comply with these terms.
*Correspondence: Inés Ruedas-Torres, aXJ1ZWRhc0B1Y28uZXM=
Disclaimer: All claims expressed in this article are solely those of the authors and do not necessarily represent those of their affiliated organizations, or those of the publisher, the editors and the reviewers. Any product that may be evaluated in this article or claim that may be made by its manufacturer is not guaranteed or endorsed by the publisher.
Research integrity at Frontiers
Learn more about the work of our research integrity team to safeguard the quality of each article we publish.