 Jose L. Sanchez-Trincado
 Hector F. Pelaez-Prestel
 Esther M. Lafuente
 Pedro A. Reche
- Laboratory of Immunomedicine, Department of Immunology & O2, School of Medicine, Complutense University of Madrid, Madrid, Spain
The oral mucosa is constantly exposed to a plethora of stimuli including food antigens, commensal microbiota and pathogens, requiring distinct immune responses. We previously reported that human oral epithelial cells (OECs) suppress immune responses to bacteria, using H413 and TR146 OEC lines and primary OECs in co-culture with dendritic cells (DCs) and T cells (OEC-conditioned cells). OECs reduced DCs expression of CD80/CD86 and IL-12/TNFα release and impaired T cell activation. Here, we further evaluated the immunosuppression by these OECs and investigated the underlying mechanisms. OEC-conditioned DCs did not induce CD4 T cell polarization towards Treg, judging by the absence of FoxP3 expression. OECs also repressed T-bet/IFNγ expression in CD4 and CD8 T cells activated by DCs or anti-CD3/CD28 antibodies. This inhibition depended on OEC:T cell ratio and IFNγ repression occurred at the transcriptional level. Time-lapse experiments showed that OECs inhibited early steps of T cell activation, consistent with OECs inability to suppress T cells stimulated with PMA/ionomycin. Blocking CD40/CD40L, CD58/CD2 and PD-L1/PD-1 interactions with specific antibodies did not disrupt T cell suppression by OECs. However, preventing prostaglandin E2 (PGE2) synthesis or blocking PGE2 binding to the cognate EP2/EP4 receptors, restored IFNγ and TNFα production in OEC-conditioned T cells. Finally, treating OECs with poly(I:C), which simulates viral infections, limited T cell suppression. Overall, these results point to an inherent ability of OECs to suppress immune responses, which can nonetheless be eluded when OECs are under direct assault.
Introduction
The oral mucosa constitutes a primary barrier for harmful pathogens, but it is also in close contact with food antigens and commensal microbiota. Therefore, there must be a fine balance between the mechanisms leading to defensive responses and immune tolerance (1). In this context, mounting evidence has demonstrated that mucosal epithelial cells have a pivotal role as initial sensors of alarm and regulators of local immune responses.
Epithelial cells in the mucosae provide a tissue-specific environment that conditions the immune response of surrounding cells such as dendritic cells (DCs) and different subsets of T cells (2, 3). For instance, in the gut mucosa, intestinal epithelial cells (IECs) constantly release retinoic acid and transforming growth factor β (TGFβ) promoting the generation of CD103+ DCs, which in turn induce the generation of regulatory T cells (Tregs) (4). Epithelial cells can also release specific cytokines such as thymic stromal lymphopoietin (TSLP), which condition DCs to promote Th2 differentiation (5, 6). In the gut mucosa, the TSLP released by IECs also conditions DCs to promote Treg differentiation (7).
Mucosal epithelial cells can also regulate T cell responses without DC mediation. They can act as antigen-presenting cells (APCs) and maintain a crosstalk with T cells (8). It has been reported that colonic, esophageal and intestinal epithelial cells express MHC II and costimulatory CD80/CD86 molecules in response to IFNγ under pathological conditions (9–12). Likewise, epithelial cells can downregulate antigen-mediated activation of alloreactive CD4 T cells, as shown in various studies using colonic, renal tubular and amniotic epithelial cells (13–15). The crosstalk between T cells and epithelial cells may also involve soluble mediators. In fact, T cells can sense many factors secreted by epithelial cells including thrombospondin, alpha-melanocyte stimulating hormone (α-MSH), TGFβ, interleukin 10 (IL-10), prostaglandin E2 (PGE2) or indoleamine 2,3-dioxygenase (IDO)-derived metabolites (16–21).
Oral epithelial cells (OECs) are also capable of modulating immune responses. In a previous work, we used OEC lines H413 and TR146 and primary OECs to show that DCs stimulated with bacteria do not fully mature in co-culture with OECs and are unable to activate alloreactive naive CD4 T cells. Similarly, OECs also suppressed the activation and response of CD4 T cells stimulated with anti-CD3/CD28 antibodies (22). In this work, we have investigated the mechanisms by which OECs suppress T cell responses and evaluated if this inhibition could be prevented. To that end, we evaluated the activation of T cells stimulated with allogenic DCs or anti-CD3/CD28 antibodies in co-culture with H413, TR146 and primary OECs. Time-lapse experiments pointed that inhibition of T cells by OECs acts on the early steps of T cell receptor (TCR) signaling, as stimulation with PMA/ionomycin prevented OEC-mediated inhibition. Interestingly, blocking PGE2 receptors on T cells and PGE2 production by OECs restored CD4 T cell activation. Also, OEC-mediated T cell suppression was limited when stimulating OECs with poly(I:C), a TLR3 agonist, emulating a viral infection. Here, we will also discuss the implications of our findings in mucosal and cancer immunology.
Materials and Methods
Oral Epithelial Cells (OECs)
As OECs we used two human cell lines, H413 and TR146, derived from oral squamous cell carcinomas, and primary OECs, which were collected from healthy donors after oral cavity brushing (23). Volunteers signed informed consent documents. Culture of the mentioned OECs was carried out as previously described (22). Briefly, H413 cells were grown in DMEM:HAMS F12 (1:1,vol/vol) (Gibco, NY, USA) supplemented with 0.5 μg/ml hydrocortisone sodium succinate (Merck KGaA, Darmstadt, Germany), TR146 cells in DMEM (Gibco, NY, USA), and primary OECs in RPMI 1640 (Gibco, NY, USA). All cells were grown at 37°C and 5% CO2.
Dendritic Cells and T Cells
Monocyte-derived DCs, CD4 and CD8 T cells were obtained from peripheral blood mononuclear cells (PBMCs). PBMCs were isolated from buffy coats by a density gradient on Ficoll-Paque™ PLUS (Amersham). Buffy coats were provided by the regional blood transfusion center (Centro de Transfusion de la Comunidad de Madrid, Spain). Donors signed the informed consent document following the legislation regarding the Royal Decree-Law 1088/2005 of September 16 (BOE-A-2005-15514). Monocytes and T cells were isolated using magnetic separation kits as per the manufacturer’s instructions (CD14+ Microbeads, CD4+ T Cell Isolation Kit and CD8+ T Cell Isolation Kit; Miltenyi Biotec). DCs were obtained by differentiating monocytes as described previously (22).
OECs Co-Cultures and Treatments
OECs were cultured in complete RPMI medium on 96-well plates (2.5 x 10⁴ cells/well) for 48 hours prior to co-culture with DCs and/or T cells. For OEC:DC co-cultures, DCs were plated alone (controls) or with OECs (1 × 10⁵ cells/well, 4 DC:1 OEC), and matured with 500 ng/mL LPS (Escherichia coli serotype 055:B5, Merck) for 48 h. For OEC:DC:T cell co-cultures, we added allogenic CD4 and CD8 T cells to the previous OEC:DC co-cultures (2 x 10⁵ cells/well, 8 T cells:4 DCs:1 OEC) and to the DCs alone (DC:T cell controls). DC:T cell cultures with or without OECs were incubated for 6 days, adding 10 ng/ml IL-2 (Immunotools) every 2 days.
Additionally, OECs were co-cultured with T cells alone (2 x 10⁵ T cells/well, 8 T Cells:1 OEC), previously stimulated using anti-CD3/CD28 antibodies (Dynabeads™ Human T-Activator CD3/CD28, ThermoFisher Scientific) or with 25 ng/mL PMA and 1 μg/mL ionomycin (Merck). As controls, T cells were cultured without OECs. OEC:T cell co-cultures were incubated for 4 or 48 hours depending on the experimental readout. In some experiments, OECs were pretreated before co-culture with 20 μg/mL poly(I:C) (InvivoGen) or 2 μg/mL indomethacin (Merck) for 4 h, or with 2 μg/mL anti-CD40 (HB14), anti-CD58 (TS2/9) (both from Miltenyi-Biotec) or anti-PD-L1 (MIH1) (eBioscience) for 15 min. Likewise, CD4 T cells were treated in some cases with 1 μg/mL PF-04418948 and/or ONO-AE3-208 (Merck), two selective antagonists of EP2 and EP4 receptors, respectively, for 30 min before antibody activation and co-culture with OECs. In the experiments using anti-CD40, anti-CD58, anti-PD-L1 and poly(I:C) treatments, cell cultures were washed twice with PBS and replaced with fresh media before the addition of T cells.
Flow Cytometry
The expression of cell markers and intracellular cytokines was analyzed by flow cytometry using the following antibodies and kits: anti-T-bet (REA102), anti-IFNγ (45–15), anti-TNFα (cA2) and anti-IL-2 (JES6-5H4), from Miltenyi Biotec; anti-CD25 (BC96), anti-FoxP3 (PCH101) and anti-PD-L1 (MIH1), from eBioscience and Annexin V Apoptosis Detection Kit with 7-AAD (Biolegend). Briefly, cells were washed with 0.5% BSA 2 mM EDTA in PBS (staining buffer), Fc receptors were blocked with 200 μg/mL IgG from human serum (Merck) and cells were stained with the fluorescence-labeled antibodies. T-bet and FoxP3 were detected by intracellular staining, using a FoxP3 staining buffer set (eBioscience, San Diego, CA) following the manufacturer’s instructions. Intracellular cytokines were stained as described previously (24), incubating cells with 10 μg/mL Brefeldin A (Merck) to stop Golgi protein transport for 4 hours before the FACS staining protocol. Data were acquired using a FACSCalibur flow cytometer (BD) and analyzed using FlowJo software (Tree Star, Ashland, OR). Gating strategy is shown in Supplementary Figure 1.
ELISA
Collected cell-free supernatants were analyzed using IL-6 and IL-8 Human Matched Antibody Pairs and Prostaglandin E2 Human ELISA kits (Invitrogen) as per manufacturer’s instructions. Plate readout was performed using a BioTek ELx800 Absorbance Microplate Reader.
Quantitative RT-PCR
TR146 or CD4 T cells (>1 x 10⁶) were used for total RNA extraction (TRIzol® Plus RNA Purification Kit, Invitrogen) and cDNA generation (High Capacity RNA-to-cDNA kit, ThermoFisher Scientific). IFNB1, IFNG and CXCL10 expression was determined by RT-qPCR. The comparative method RQ=2(-ΔΔCt) was used to quantify mRNA transcripts and normalize IFNγ expression levels to those of CD3E and IFNB1 and CXCL10 to those of GAPDH. The primers used are shown in Supplementary Table 1 and were designed with the Universal ProbeLibrary System Assay Design tool from Roche.
Cell Proliferation Assay
OECs were seeded on 96-well plates (1.5 x 10⁴ cells/well) in complete RPMI media with or without 2 μg/mL indomethacin or 20 μg/mL poly(I:C) for 48 h. Subsequently, cell proliferation was assayed using the MTT Kit I, from Roche Diagnostics, following the manufacturer’s instructions. Absorbance was measured at 570 nm (reference 650 nm) using a BioTek ELx800 Absorbance Microplate Reader. Cell proliferation was calculated relative to the untreated control (OECs without indomethacin).
Statistical Analysis
Data values were expressed as the mean ± standard error of the mean. Two-tailed Student’s t tests for independent samples were applied to assess statistical significance between two means and ANOVA tests for multiple comparisons between more than two means. P < 0.05 was considered significant. Statistic calculations were performed on GraphPad Prism 8.
Results
OECs Suppress T Cell Responses
We previously reported that OECs suppress DC-mediated activation of CD4 T cells, abrogating IFNγ and TNFα release as determined by ELISA (22). Here, we evaluated in more detail this immunosuppression in both CD4 and CD8 T cells using intracellular staining and FACS analysis. To that end, allogenic CD4 and CD8 T cells were cultured with LPS-matured DCs alone (control) or OEC-conditioned DCs for 6 days. Alternatively, anti-CD3/CD28 antibodies were used instead of DCs to stimulate CD4 and CD8 T cells with and without (controls) OECs. As OECs we used H413, TR146 and primary OECs. To examine the activation of effector Th1 cells, we analyzed the expression of T-bet and IFNγ. Stimulation of CD4 and CD8 T cells with allogenic DCs or anti-CD3/CD28 antibodies resulted in large amounts of T-bet+ IFNγ-producing cells (Figure 1A). In contrast, the presence of OECs prevented the expansion and/or differentiation of T-bet+ T cells and their activation, as judge by the IFNγ production. Similarly, the population of CD25+FoxP3+ CD4 T cells observed in the cultures of CD4 T cells stimulated with DC decreased drastically in the presence of OECs (Figure 1B). In both cases, primary OECs showed less immunosuppressive effect on T cells than H413 or TR146 cells, possibly due to their reduced viability.
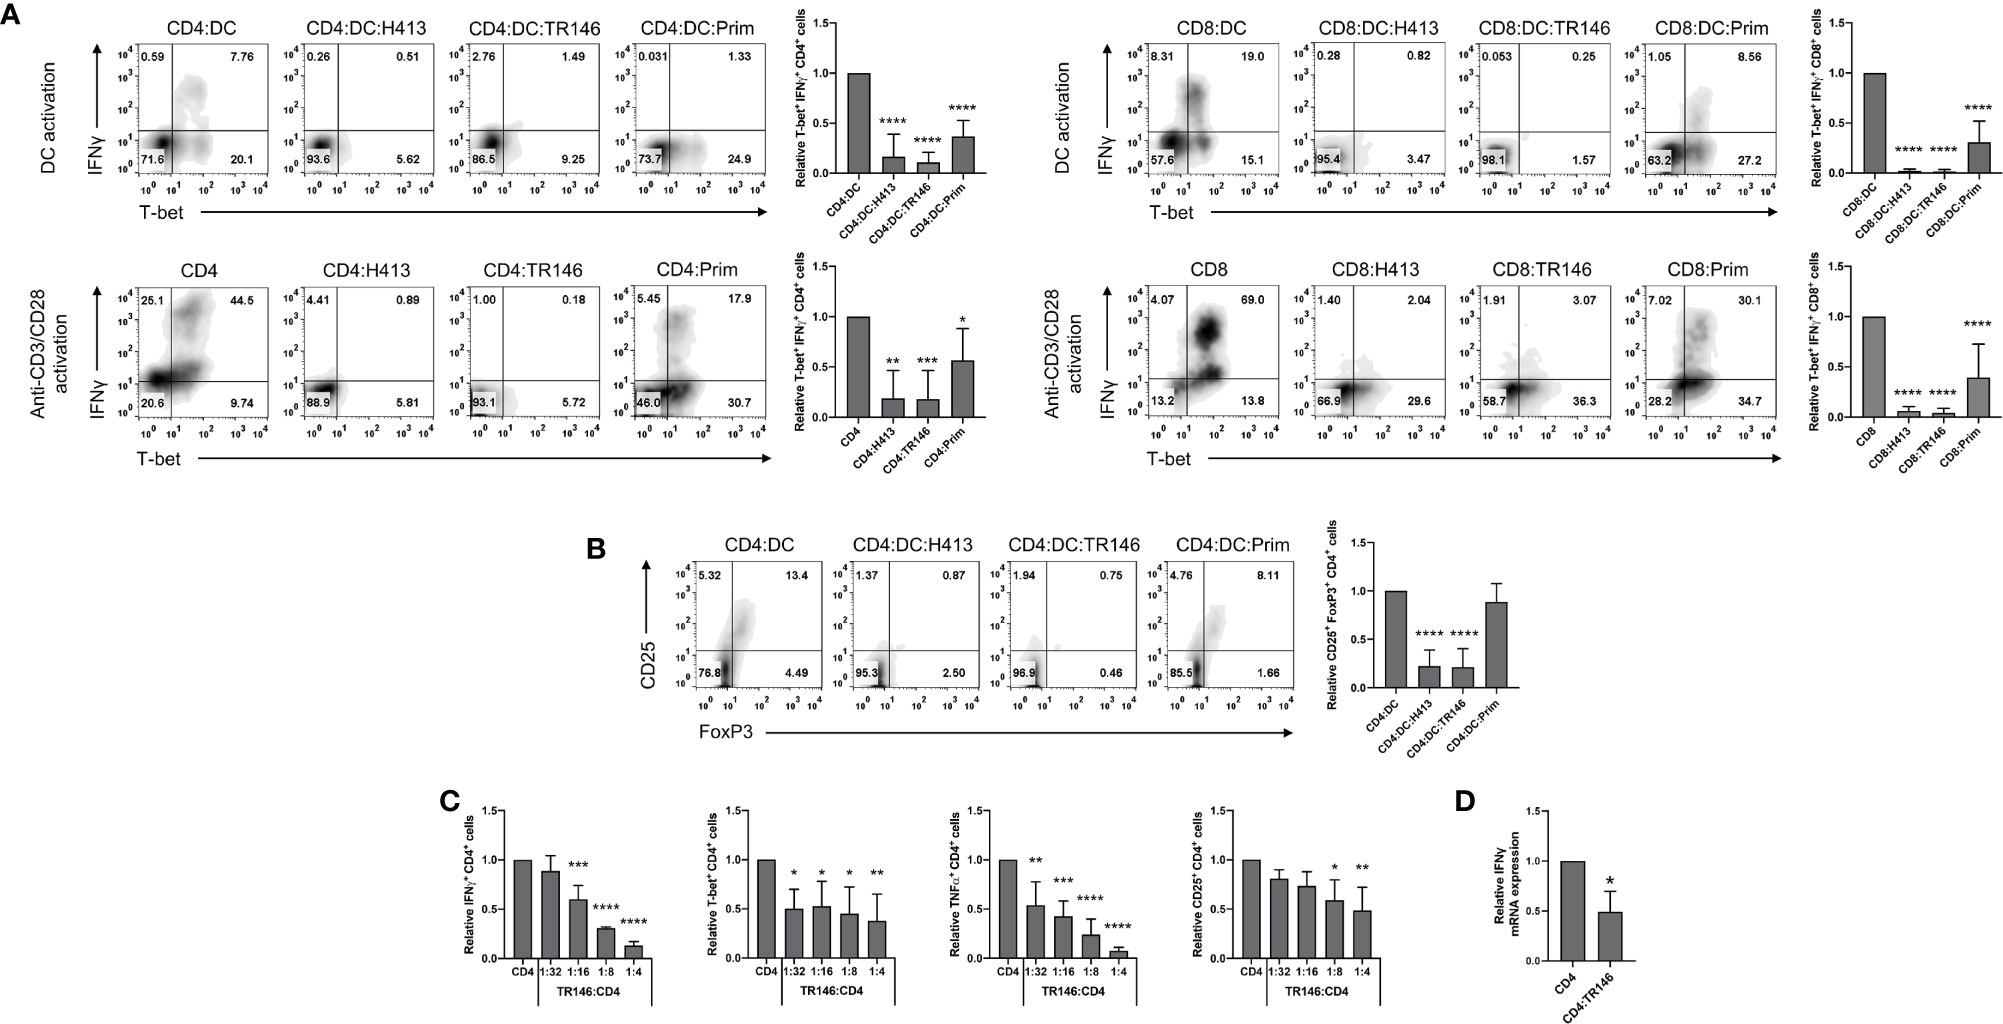
Figure 1 OECs restrain T cell activation and polarization. (A) CD4 and CD8 T cells were activated by allogenic LPS-matured DCs for 6 days (top) or with anti-CD3/CD28 antibodies for 48 h (bottom), both in the presence or not of H413, TR146 or primary (Prim.) OECs. T-bet and IFNγ expression was analyzed by flow cytometry in CD4 and CD8 T cells. (B) Flow cytometry analysis of CD25 and FoxP3 expression in CD4 T cells activated for 6 days by allogenic LPS-matured DCs and cultured alone or with H413, TR146 or primary (Prim) OECs. In both panels, results are shown as the percentage of CD4 T cells expressing the mentioned markers from a representative experiment (density plots) and relative to CD4 T cells alone when considering all experiments (bar graphs). (C) Percentage of CD4 T cells expressing T-bet, CD25, IFNγ and TNFα as determined by flow cytometry relative to CD4 T cell alone. CD4 T cells were activated by anti-CD3/CD28 beads and cultured alone or with TR146 cells for 48 hours with increasing TR146:CD4 cell number ratios. (D) Relative expression of IFNG mRNA from CD4 T cells as measured by RT-qPCR. CD4 T cells were activated by anti-CD3/CD28 beads and cultured alone or with TR146 cells for 48 hours. In all previous cases, CD4 T cells were re-stimulated with PMA and ionomycin for 4 hours before analysis. FACS gatings were adjusted by the use of mouse anti-IgG-PE and anti-IgG-APC antibodies. We plotted mean values with error bars corresponding to SEM. Statistically significant differences were obtained applying ANOVA tests (A-C) or two-tailed Student’s t tests for independent samples (D). Significant differences (p < 0.05, p < 0.01, p < 0.001 or p < 0.0001) are noted as “*”, “**”, “***”, and “****”, respectively. Data were obtained from a total of three independent experiments using samples from different donors.
To analyze if the observed inhibition by OECs depended on the OEC:CD4 ratio we activated CD4 T cells with anti-CD3/CD28 antibodies and co-cultured them for 48 hours with increasing numbers of TR146 cells, as representative OECs. We then determined CD4 T cells expression levels of CD25, T-bet, IFNγ and TNFα. We observed that the expression of these molecules decreased as the TR146:CD4 ratio increased, indicating a dose-dependent inhibitory effect (Figure 1C). To determine if IFNγ production was inhibited at the transcriptional or translational level, we examined IFNG mRNA expression by quantitative RT-PCR in anti-CD3/CD28-activated CD4 T cells incubated or not with TR146 cells. As observed in Figure 1D, IFNG transcription in CD4 T cells was strongly reduced in the presence of TR146 cells (>50%) compared to control activated T cells. This strong reduction in IFNG transcription levels explains the marginal production of this cytokine by T cells in the presence of OECs.
OEC-Dependent Inhibition of T Cells Targets Early TCR Signaling Events
To gain further insight into the dynamics of the inhibition by OECs, we performed time-lapse experiments by delaying the co-culture of activated T cells with OECs. CD4 T cells were stimulated with anti-CD3/CD28 antibodies for 0, 0.5, 1 and 2 h prior to co-culture with TR146 cells, as illustrated in Figure 2A (left side). After a 4-hour co-culture, we monitored the percentage of IFNγ and TNFα-producing T cells (Figure 2A). When CD4 T cells were co-cultured with OECs immediately after anti-CD3/CD28 stimulation (co-culture lag = 0 hours), IFNγ and TNFα-producing T cell populations were completely abrogated in relation to control CD4 T cells. However, when T cells were stimulated for 1 hour or longer prior to TR146 co-culture, the percentage of T cell inhibition dropped to only 15-30% of that of T cells co-cultured immediately after anti-CD3/CD28 stimulation. This result suggests that the inhibitory mechanism(s) mediated by OECs operated promptly during T cell activation. We also used phorbol 12-myristate 13-acetate (PMA), that directly activates Protein Kinase C (PKC) (25), and ionomycin, a calcium ionophore that increases cytoplasmic Ca2+ concentration (26) to activate CD4 T cells before co-culture with OECs. The activation of T cells by these two compounds bypasses the first events of T cell receptor (TCR) signaling. We observed that, opposite to anti-CD3/CD28 stimulation, TR146 cells were unable to inhibit IFNγ and TNFα production by T cells activated by PMA and ionomycin (Figure 2B), supporting that OECs inhibition acts on early steps of TCR signaling, preceding PKC activation and calcium release from the endoplasmic reticulum.
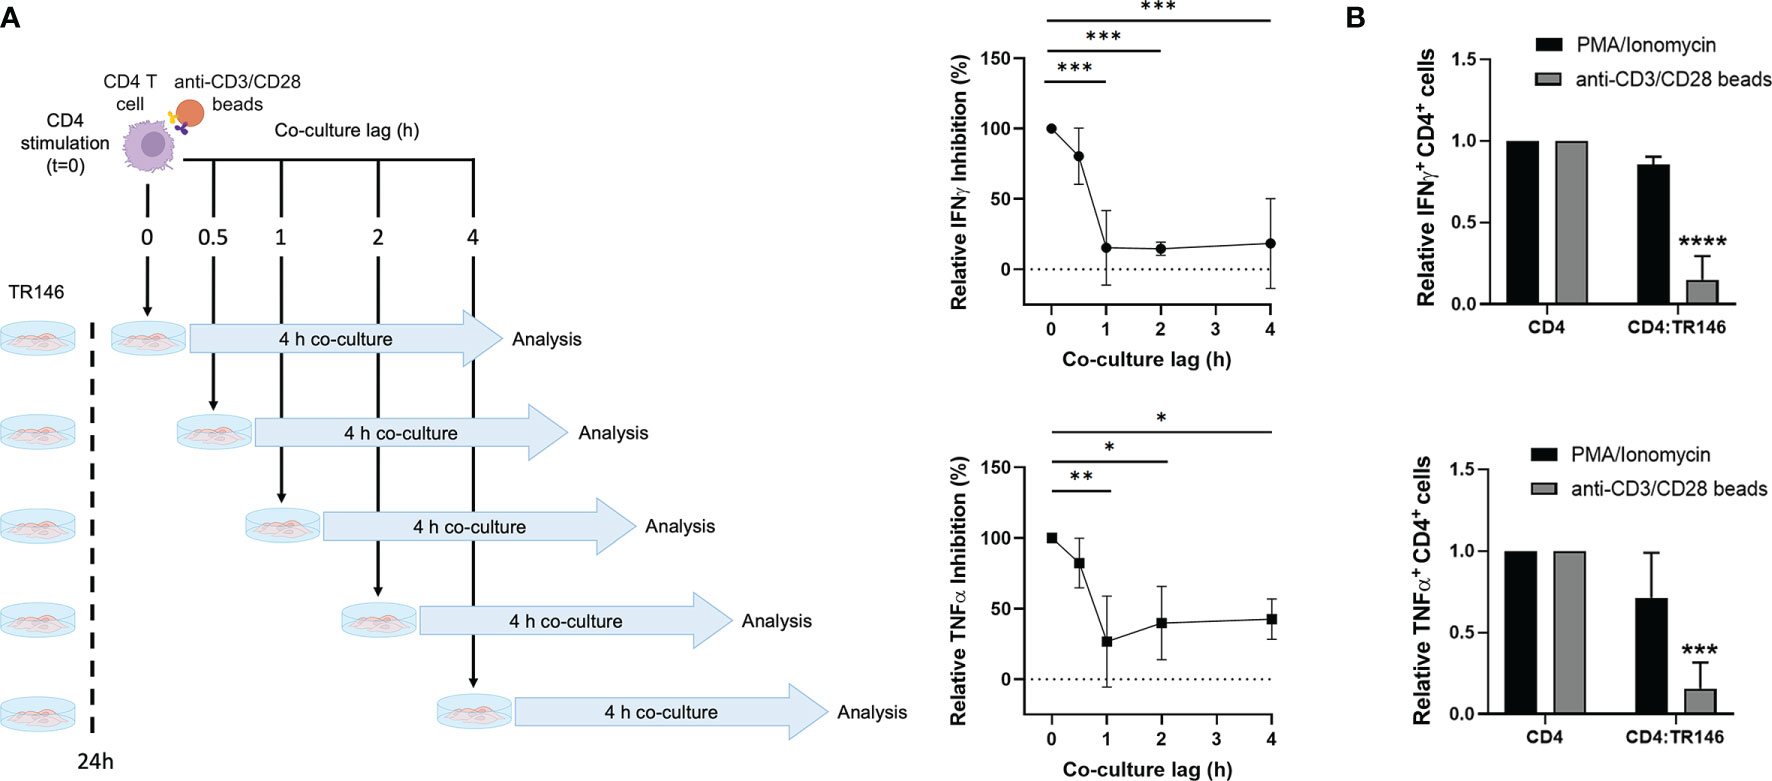
Figure 2 CD4 T cell inhibition by TR146 cells takes place early during TCR signaling. (A) CD4 T cells were incubated with anti-CD3/CD28 antibodies for different times (0, 0.5, 1 or 2 hours) before an additional 4-hour co-culture with TR146 cells. Activated CD4 T cells were also cultured alone. Schematic diagram on the left depicts the experiment workflow. The percentage of CD4 T cells that were inhibited when cultured with TR146 cells in comparison to CD4 T cells cultured alone for each co-culture lag time were detected by flow cytometry. Data are expressed as the percentage of IFNγ and TNFα inhibition relative to control of maximum inhibition (co-culture lag time = 0 h). (B) CD4 T cells were activated with PMA/ionomycin or anti-CD3/CD28 beads and cultured alone or with TR146 cells for 4 hours. The amount of IFNγ and TNFα-producing CD4 T cells was measured by flow cytometry and expressed as relative to control. FACS gatings were adjusted by the use of mouse anti-IgG-PE and anti-IgG-APC antibodies. All data are plotted as mean values with error bars corresponding to SEM. Statistically significant differences were obtained applying ANOVA tests. Significant differences (p < 0.05, p < 0.01, p < 0.001 and p < 0.0001) are noted as “*”, “**”, “***” and “****”, respectively. Data were obtained from a total of three independent experiments using samples from different donors.
T Cell Suppression Is Independent of CD40, CD58 and PD-L1 Expression by OECs
Epithelial cells can express various surface molecules that allow them to engage T cells and modulate their response (27–29). Here, we evaluated the potential role of three of these molecules, CD40, CD58 and PD-L1, in the observed immunosuppression, using TR146 cells as representative OECs. We first confirmed that TR146 cells express detectable levels of these three proteins (Figure 3A). Subsequently, we incubated OECs with anti-CD40, anti-CD58 and anti-PD-L1 blocking antibodies for 15 min, co-cultured them with anti-CD3/CD28-activated CD4 T cells and analyzed cytokine production. As shown in Figure 3B, these antibodies were unable to prevent the inhibition by OECs.
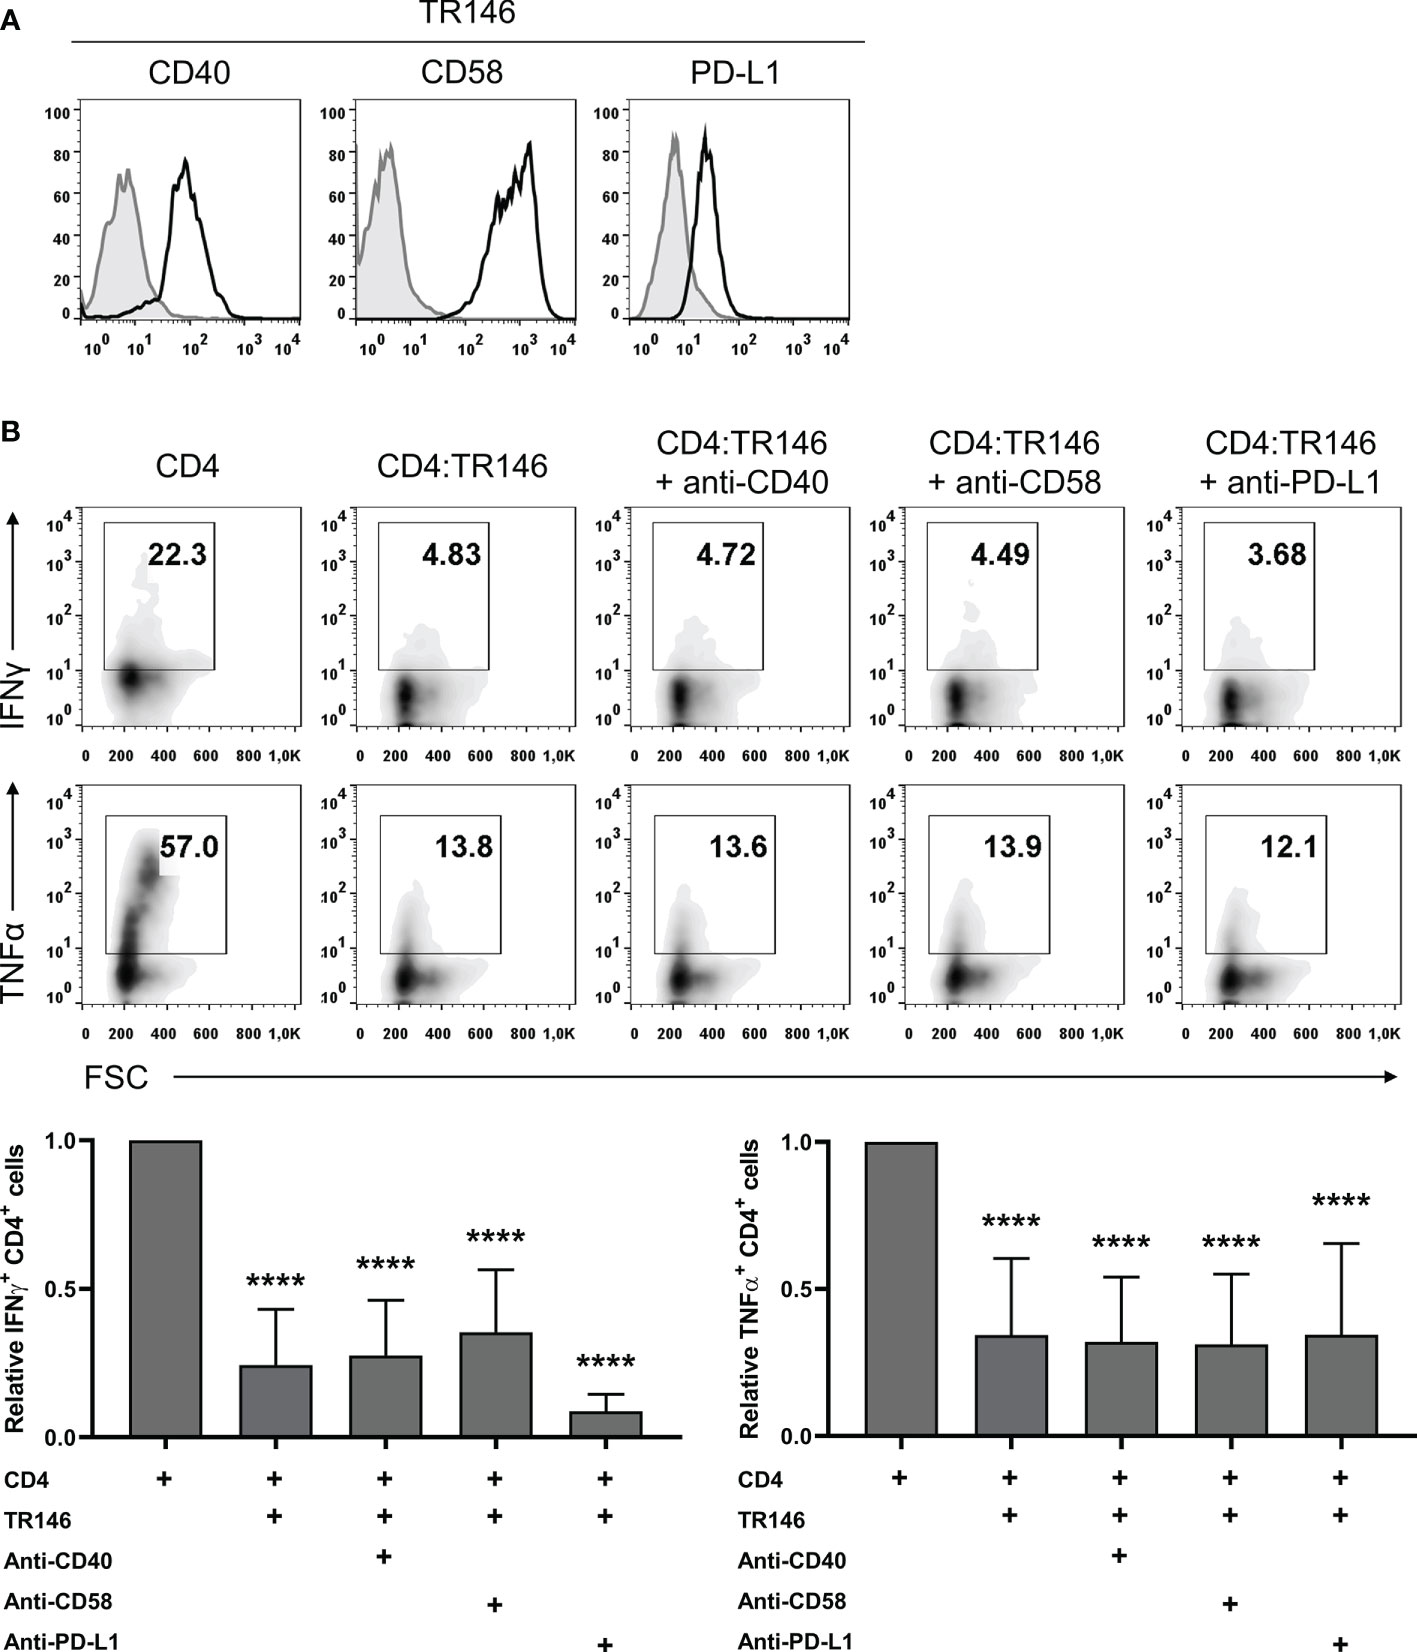
Figure 3 CD40, CD58 or PD-L1 in TR146 cells do not participate in CD4 T cells inhibition. (A) TR146 cells surface expression of CD40, CD58 and PD-L1 (black) compared with isotype control (grey), as detected by flow cytometry. (B) TR146 cells were incubated with anti-CD40, anti-CD58 or anti-PD-L1 blocking antibodies for 15 min and cultured with CD3/CD28-activated CD4 T cells for 4 hours. Activated CD4 T cells were cultured alone as a control. Data were collected by flow cytometry and shown as the percentage of IFNγ and TNFα-producing CD4 T cells from a representative experiment (density plots) and relative to CD4 T cells alone when considering all experiments (bar graphs). FACS gatings were adjusted by the use of mouse anti-IgG-PE and anti-IgG-APC antibodies. Bar graphs display mean values with SEM error bars. Statistically significant differences were obtained applying ANOVA tests. Significant differences (p < 0.001) are noted as “****”. Data were obtained from a total of four independent experiments using samples from different donors.
OEC Suppression of T Cell Responses Is Largely Mediated by PGE2
Mounting evidence supports that prostaglandin E2 (PGE2) can act as an anti-inflammatory mediator by suppressing immune responses (20, 30). To examine if OECs suppress T cell responses by releasing PGE2 we used indomethacin, an inhibitor of COX-1 and COX-2 enzymes involved in PGE2 synthesis (31). PGE2 production by TR146 cells (about 5000 pg/mL), was significantly abrogated following indomethacin treatment, although it did not affect cell viability and proliferation (Supplementary Figure 2). PGE2 levels in H413 cell cultures were similar to those found in TR146 cell cultures and around 100 pg/mL in primary OECs cultures, and could all be downregulated by indomethacin (data not shown). TR146 cells treated with or without indomethacin were co-cultured with anti-CD3/CD28-activated CD4 T cells and cytokine production was monitored. As shown earlier, the production of IFNγ and TNFα by T cells was inhibited by OECs. However, this inhibition was prevented when TR146 cells were previously treated with indomethacin (Figure 4A). In this situation, IFNγ and TNFα-producing T cells in TR146 co-cultures were comparable to those in activated control T cells. The concentration of indomethacin used in these assays, 2 µg/mL, was selected after dose-response experiments (Supplementary Figure 3A). COX-1/COX-2 enzymes mediate the synthesis of more prostanoids than just PGE2 (32). To verify that PGE2 is indeed involved in T cell inhibition, we incubated CD4 T cells with PF-04418948 and ONO-AE3-208, which block PGE2 binding to EP2 and EP4, respectively (33, 34), prior to CD3/CD28 stimulations and co-culture with OECs. Consistent with the results of indomethacin treatment, PF-04418948 and ONO-AE3-208 restored 75-100% of IFNγ and TNFα-producing T cells in TR146 co-cultures, confirming that PGE2 released by OECs mediated T cell inhibition (Figure 4B). Simultaneous incubation with both receptor antagonists only increased T cell cytokine production marginally, compared to T cells treated with the antagonists individually. We also carried out dose-response experiments with PF-04418948 and/or ONO-AE3-208, finding that 1 μg/mL of these compounds was enough to prevent OECs-mediated immunosuppression (Supplementary Figure 3B). Similar results were found in T cells co-cultured with H413 cells and primary OECs, either treating OECs with indomethacin or T cells with PF-04418948 and/or ONO-AE3-208, with the exception of primary OECs, which did not inhibit TNFα in any case (Supplementary Figure 4). Treatment of CD4 T cells with PF-04418948 and/or ONO-AE3-208 alone did not alter IFNγ and TNFα production in comparison to untreated CD4 T cells (Supplementary Figure 5).
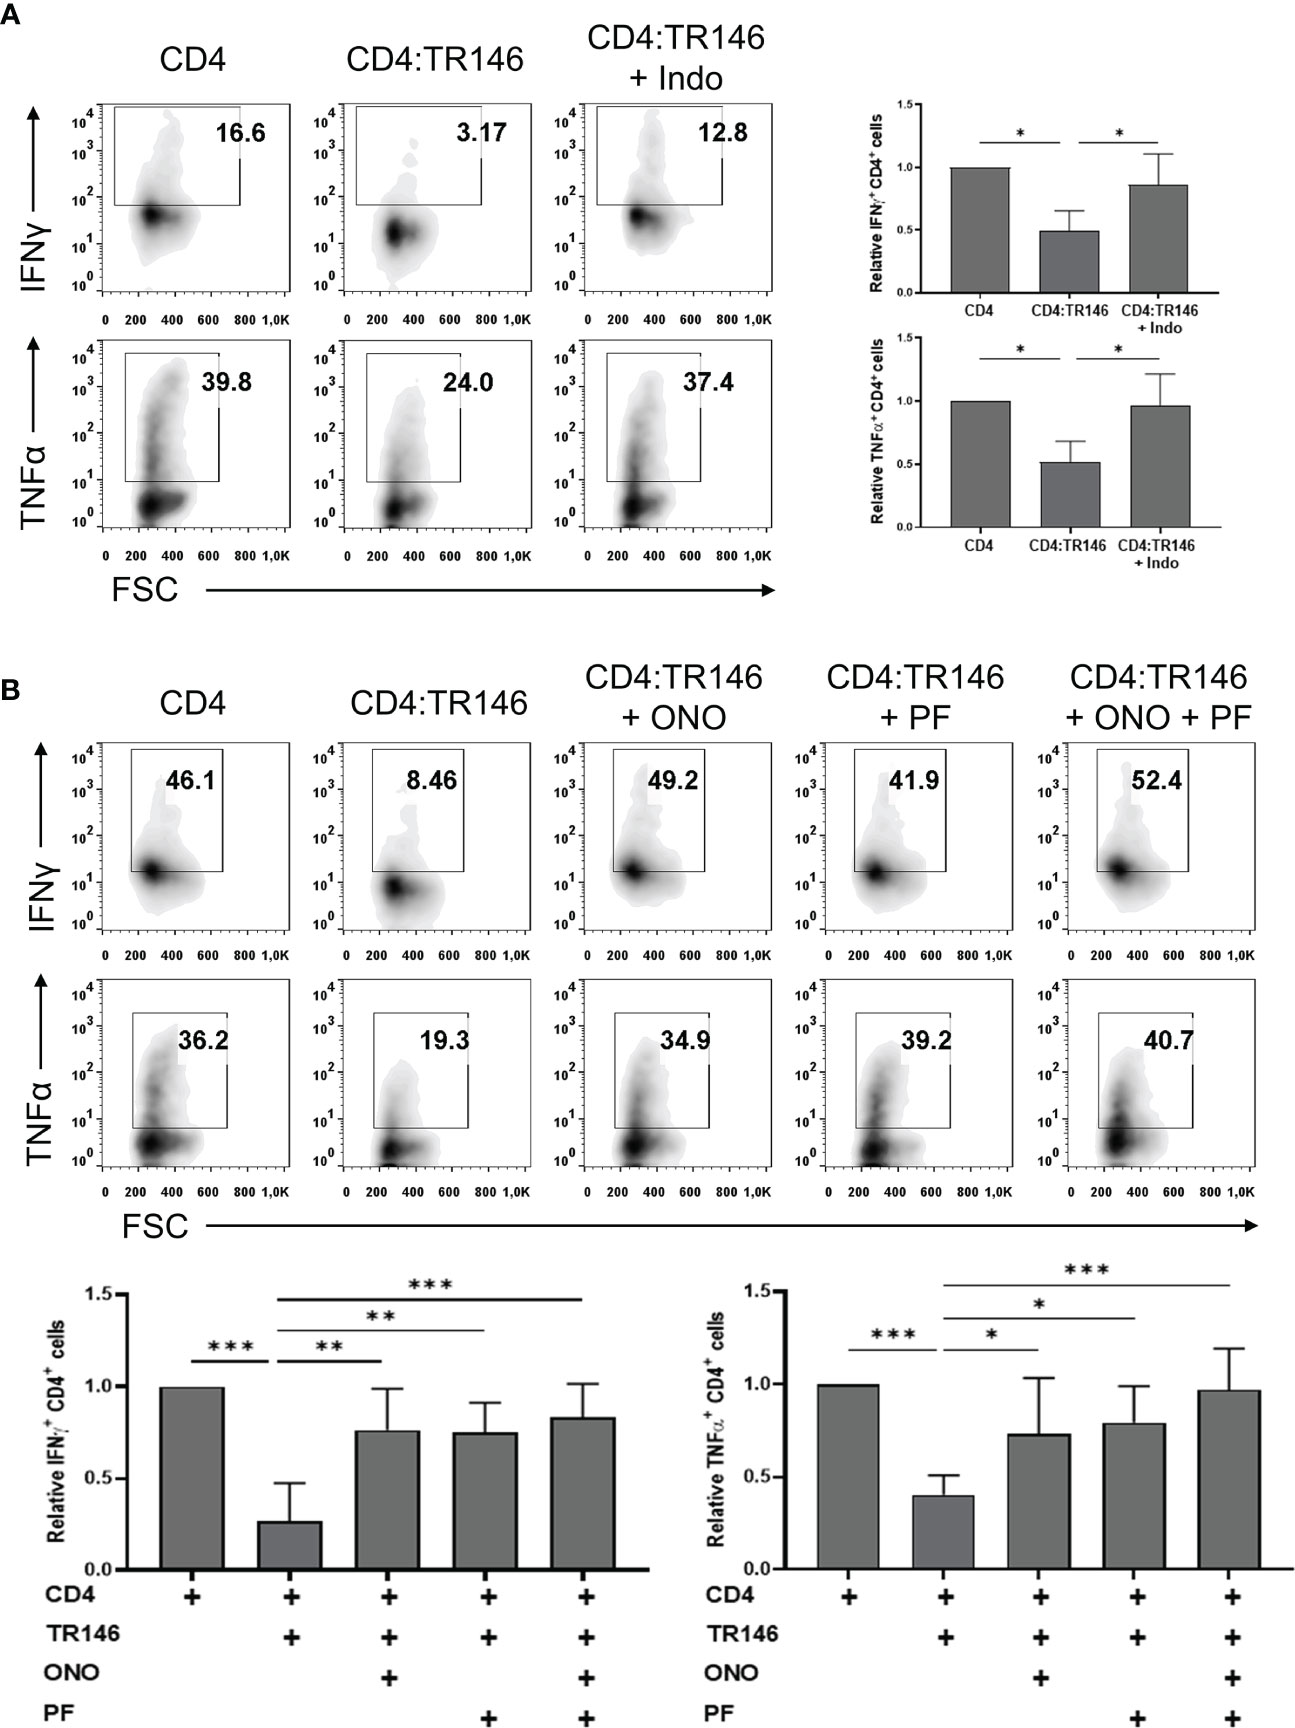
Figure 4 TR146 cells suppress CD4 T cells via PGE2 release. (A) TR146 cells were treated or not with 2 μg/mL indomethacin (Indo) for 4 hours and co-cultured with anti-CD3/CD28-activated CD4 T cells for 4 hours. (B) CD4 T cells were treated with PF-04418948 (PF) and/or ONO-AE3-208 (ONO) inhibitors for 1 hour, activated with anti-CD3/CD28 beads and co-cultured with TR146 cells for 4 hours. All data were obtained by flow cytometry analysis and shown as the percentage of IFNγ and TNFα-producing CD4 T cells from representative experiments (density plots) and relative to CD4 T cells alone when considering all experiments (bar graphs). FACS gatings were adjusted by the use of mouse anti-IgG-PE and anti-IgG-APC antibodies. Bar graphs display mean values with SEM error bars. Statistically significant differences were obtained applying ANOVA tests. Significant differences (p < 0.05, p < 0.01 and p < 0.001) are noted as “*”, “**” and “***”, respectively. Data were obtained from a total of four independent experiments using samples from different donors.
OECs Exposed to a Viral-Like Insult Permit Partial T Cell Responses
To emulate OECs behavior under viral infections, we challenged TR146 cells with poly(I:C), a synthetic analog of viral dsRNA that activates TLR3. As shown in Figures 5A, B, poly(I:C) stimulated the expression of IFNB1 and CXCL10 and the release of IL-6 and IL-8 in TR146 cells. In addition, poly(I:C)-treated TR146 cells could not completely suppress the response of anti-CD3/CD28-activated CD4 T cells; there were about twice more IFNγ and TNFα-producing CD4 T cells in co-cultures with treated OECs than in co-cultures with non-treated OECs (Figure 5C). The amount of poly(I:C) used to treat OECs (20 μg/mL) was selected upon dose-response assays (Supplementary Figure 3C). Interestingly, PGE2 levels were slightly increased in poly(I:C)-treated TR146 cell cultures (Supplementary Figure 2A).
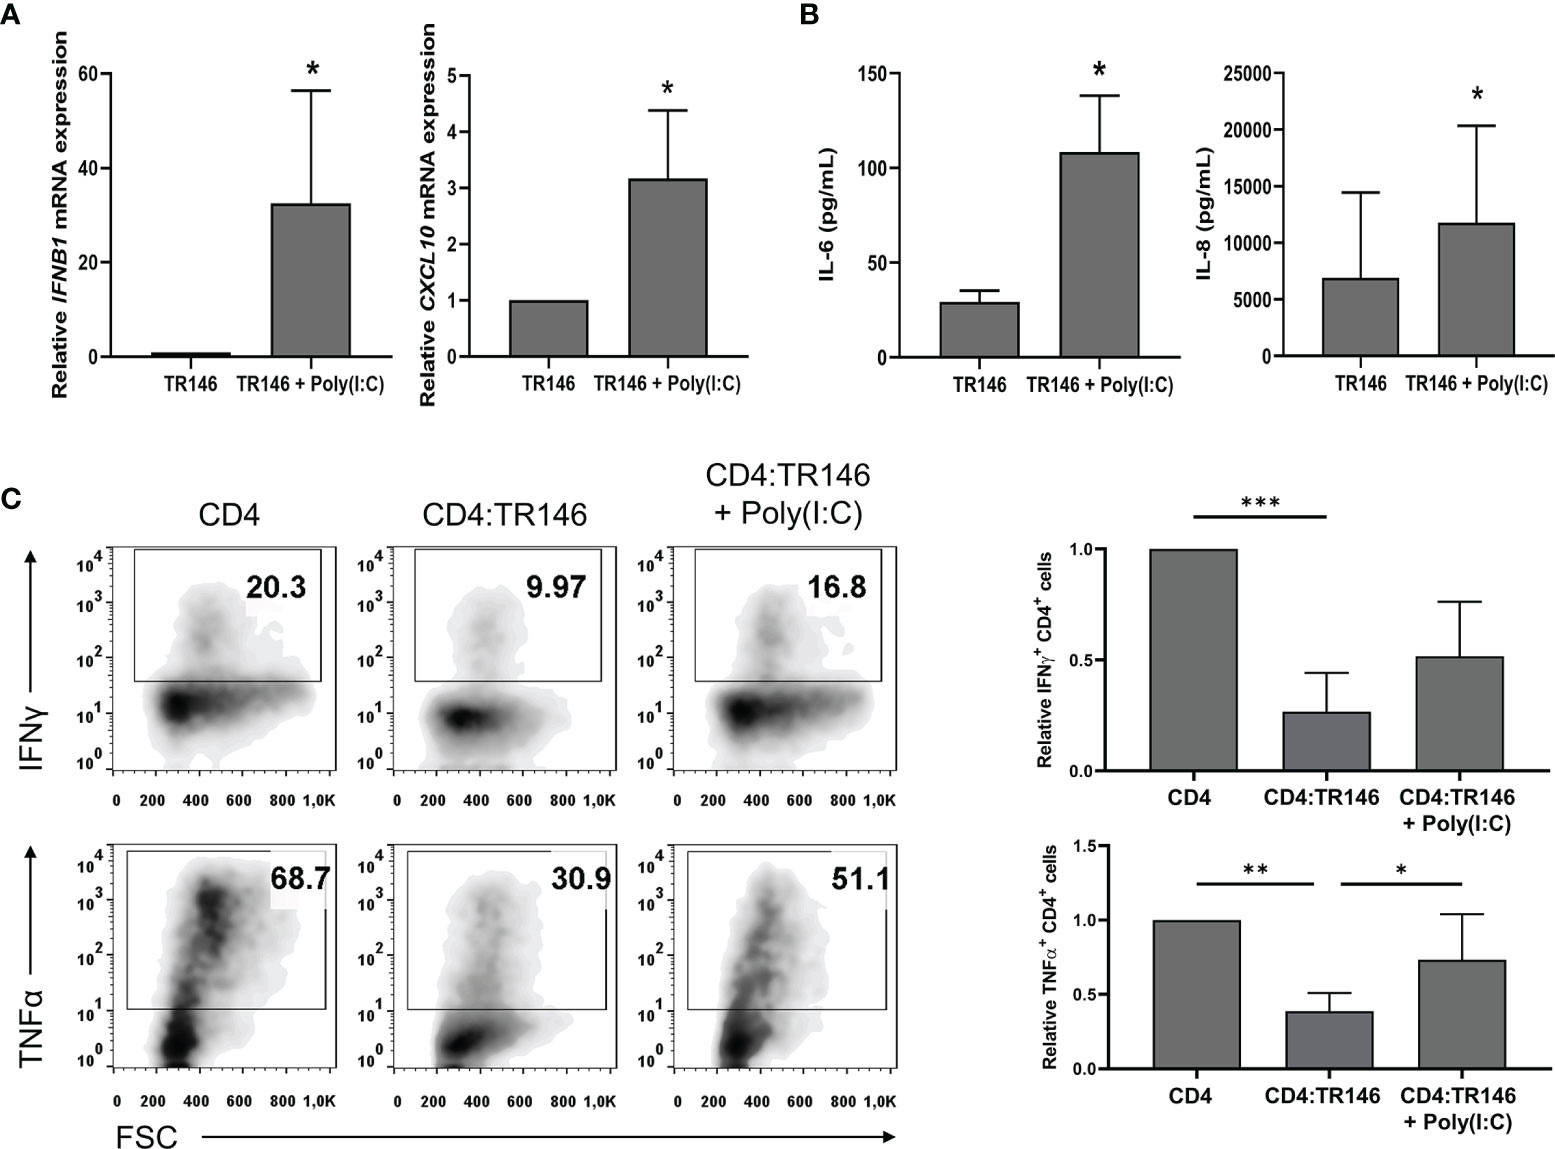
Figure 5 Poly(I:C) stimulates cytokine expression in TR146 cells and partially prevents T cell inhibition by OECs. TR146 cells were first stimulated or not with 20 μg/mL poly(I:C) for 4 hours and then washed twice with PBS. (A) IFNB1 and CXCL10 mRNA relative expression was evaluated in TR146 cells by RT-qPCR. (B) TR146 cells were cultured for other 48 hours and IL-6 and IL-8 release was measured by ELISA in cell-free supernatants. (C) TR146 cells were co-cultured with anti-CD3/CD28-activated CD4 T cells for other 48 hours and re-stimulated with PMA and ionomycin for 4 hours before analysis. Data were obtained by flow cytometry and shown as the percentage of IFNγ and TNFα-producing CD4 T cells from a representative experiment (density plots) and relative to CD4 T cells alone when considering all experiments (bar graphs). FACS gatings were adjusted by the use of mouse anti-IgG-PE and anti-IgG-APC antibodies. Bar graphs display mean values with SEM error bars. Statistically significant differences were obtained applying two-tailed Student’s t tests for independent samples (A, B) or ANOVA tests (C). Significant differences (p < 0.05, p < 0,01 and p < 0.001) are noted as “*”, “**” and “***”, respectively. Data were obtained from a total of three independent experiments using samples from different donors.
Discussion
Epithelial cells are fundamental for the regulation of mucosal immunity and those in the oral mucosa are not an exception (7, 35). We have previously shown that, in co-cultures, OECs suppress DC and T cell responses to various stimuli, including bacteria. In this context, we concluded that oral epithelial cells mandate an immune quiescence that prevents undesired immune responses (22). Here, we have further investigated the inhibition of T cells by OECs. To that end, we used the OEC lines H413 and TR146, and primary OECs in co-culture with activated T cells, either with allogenic DCs or with anti-CD3/CD28 antibodies. For many mechanistic/blocking studies, we chose TR146 cells as the representative OEC line since they grow and proliferate better than H413 cells. Moreover, PD-L1 cell surface expression in TR146 cells is higher than in H413 cells and T cell inhibition through the PD-1/PD-L1 axis, if any, could be better detected using TR146 cells.
The most relevant findings of the study are summarized in Figure 6. We demonstrated that impairing PGE2 synthesis or its binding to cognate receptors in T cells prevented the inhibition of CD4 T cell responses by OECs. Treating OECs with indomethacin, a non-selective inhibitor of COX enzymes, or T cells with specific antagonists of PGE2 receptors EP2 and EP4 (PF-04418948 and ONO-AE3-208, respectively) allowed T cell responses, judging by IFNγ and TNFα productions. PGE2 is a soluble mediator synthesized by the constitutive COX-1 and the inducible COX-2 enzymes, which can inhibit the TCR signaling cascade in T cells (37). In vitro, several studies have already shown that the addition of PGE2 to T cell cultures at concentrations in the range of 0.1 nM to 10 μM inhibits T cell activation/responses (37–39). EP2 and EP4 receptors promote cAMP production and PKA activation leading to the phosphorylation of the C-terminal Src kinase (Csk), which eventually interrupts the TCR signaling cascade by inactivating Lck (36, 40). In line with this, when we activated T cells with PMA and ionomycin, targeting signaling events downstream of Lck activation, OECs suppression was prevented, as this activation eludes the inhibitory mechanism of PGE2. The ability of epithelial cells, including OECs, to secrete this prostanoid has been previously reported (41, 42). PGE2 is present in human saliva at a concentration of around 0.1 nM (43) comparable to what we found in primary OECs cultures (0.3 nM, data not shown), enough to inhibit T cell activation. The immunoregulatory role of PGE2 has been widely studied in different mucosae. PGE2 is essential for the homeostasis of the gastrointestinal tract (20, 44, 45) and has emerged as a local protection factor in a number of epithelia, like retinal, bronchial, glomerular or biliary epithelia (42, 46–48). Interestingly, tumoral epithelial cells synthesize huge amounts of PGE2 in order to create a suppressive environment (49). It is worth noting that 80 to 90% of all cancer cases are caused by epithelial malignancies1. In this context, indomethacin has been reported to have an anti-tumoral potential, which has been attributed to its capacity to inhibit cellular calcium mobilization (50) and angiogenesis through VGEF downregulation (51). However, an alternative mechanism suggested by our study will be that indomethacin facilitates tumor specific T cell responses by precluding the release of PGE2.
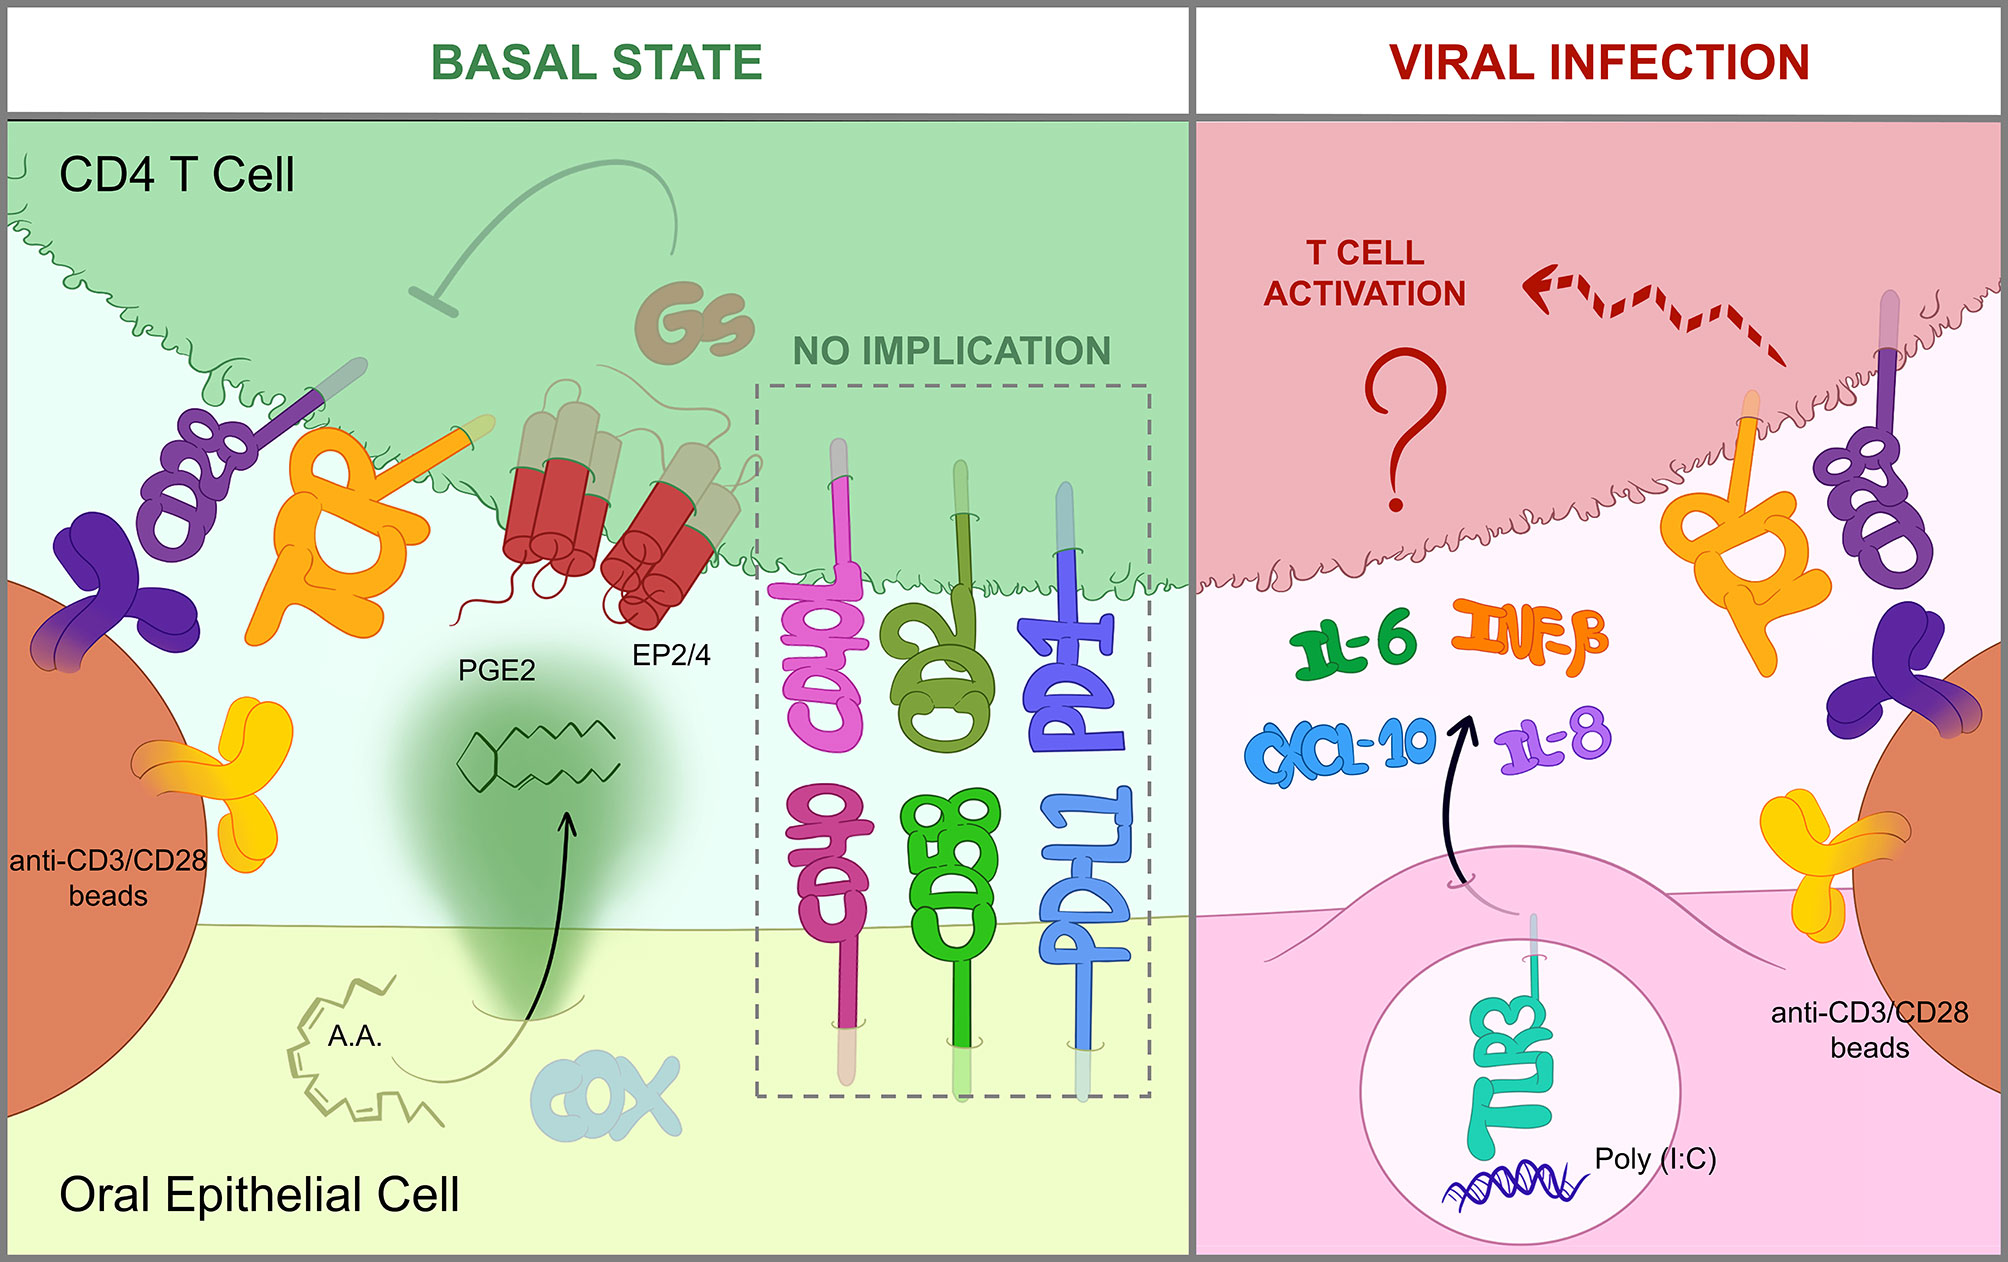
Figure 6 OEC-mediated immunomodulation of T cells. Graphical summary of the most relevant findings obtained in this study. In a basal state (left), OECs constitutively suppress T cells through the action of PGE2, which is produced by COX enzymes from arachidonic acid (AA) and then sensed by EP2/EP4 receptors in the T cell. EP2/EP4 signaling occur through Gs-proteins and eventually blocks TCR signaling, thus hindering activation by anti-CD3/CD28 antibodies (36). Cell-to-cell contacts including CD40/CD40L, CD58/CD2 or PD-L1/PD-1 are not involved in OEC-derived inhibition. Contrarily, when OECs are exposed to viral insults like poly(I:C), a dsRNA mimic and TLR3-inducer, they express IL-6, IL-8, IFNB1 and CXCL10 and relieve CD4 T cell suppression by an unknown mechanism (right).
The observed effect of OECs on T cells was dose-dependent and immediate, operating faster than CD3/CD28 stimulation. PGE2 secretion enabled OECs to inhibit T cell responses and likely also their differentiation. A similar phenomenon has been observed in the intestinal mucosa, where epithelial cells reduce the mRNA levels of IL2, IFNG, IL4 and IL5 in CD4 T cells (52). In our experiments, the inhibition of T cell activation was not explained by an enhancement of CD25+FoxP3+ Treg cells. In the absence of epithelial cells, some authors have reported that PGE2 inhibited T-bet and IFNγ expression in CD4 T cells but promoted their differentiation to Treg (53) or Th17 cells (54). In vivo, there is evidence that the lymphoid tissue associated with the oral mucosa is highly enriched in Treg cells (55), but the origin of these cells is yet unclear. According to Tanaka et al. (56), murine oral classical DCs induced antigen-specific FoxP3+ Treg cells in draining submandibular lymph nodes but not directly in the oral mucosa. Therefore, while the PGE2 produced by OECs is probably sufficient to perform T cell suppression in vitro, the lack of a microenvironmental context may be impeding Treg promotion. Taken together, and compatible with Treg-derived immunomodulation, our data support that PGE2 secretion by oral epithelial cells acts as an innate and default immunosuppressive mechanism that prevent undesired responses. Moreover, it is also tantalizing to speculate that the elicitation of T cell responses in secondary lymphoid tissues with the additional need for antigen delivery/transport has evolved as a mechanism to elude the immunosuppressive effect of epithelial cells.
We previously hypothesized that immune suppression by OECs was contact-dependent as OECs-conditioned media did not have much effect on T cells (22). Others have also shown that epithelial cells inhibit T cell responses through cell-to-cell contacts. For instance, tubular renal and iris pigment epithelial cells express PD-L1 and suppress T cell activation in this way (57, 58). We also found that OECs expressed PD-L1 as well as other surface markers, including CD58 and CD40, which are implicated in T cell adhesion and co-stimulation (13, 59–63). However, none of these proteins mediated the observed inhibition in our experimental settings. Moreover, we found that PGE2 secretion by OECs is a main mechanism implicated in T cell suppression. This result could appear paradoxical. Nevertheless, we cannot rule out that other cell-contact mechanisms can participate in the inhibition of T cells. Moreover, the action of PGE2 is likely enhanced by the proximity between OEC and T cells. In fact, it also worth noting that PGE2 is a highly hydrophobic molecule and probably remains bound to membranes close to the secretion sites.
PGE2 release by OECs is constitutive (43), representing a constant immunosuppressive mechanism that has presumably evolved to tolerate the presence of resident bacteria. However, this default immunosuppression should be eluded under some threatening conditions. In fact, we found that OECs treated with poly(I:C), a TLR3 agonist simulating a viral infection, did not completely prevent T cell activation. In line with these results, Schwarze et al. (64) showed that poly(I:C) can attenuate T cell suppression by airway epithelial cells. Furthermore, in vivo poly(I:C) treatment of epithelial carcinomas has also been shown to promote T cell tumor infiltration and responses (65, 66). The mechanism by which OECs treated with poly(I:C) had a limited ability to inhibit T cells did not involve downregulation of PGE2 production. OECs treated with poly(I:C) exhibit enhanced expression of IFNB1 and CXCL10 and release of IL-6 and IL-8. However, the addition of IFNβ1, CXCL10, IL-6 and IL-8 cytokines in OECs and T cell co-cultures was not sufficient to reproduce the effect of poly(I:C) treatment (data not shown), suggesting the involvement of other unknown mediators capable of counteracting the inhibitory effect of PGE2. In summary, our results indicate that PGE2 release by OECs contributes to restrain T cells and maintain a tolerant environment. However, under certain conditions like a viral assault, OECs can lift T cell immunosuppression through a PGE2-independent mechanism that may involve the expression of yet to discover contact-dependent or soluble factors.
Data Availability Statement
The original contributions presented in the study are included in the article/Supplementary Material. Further inquiries can be directed to the corresponding authors.
Ethics Statement
The studies involving human participants were reviewed and approved by CEIm from Hospital Clínico San Carlos, Madrid, Spain. The patients/participants provided their written informed consent to participate in this study.
Author Contributions
EML and PAR: conceptualization. JS-T and HP-P: methodology. JS-T, HP-P, EL, and PAR: investigation. JS-T, HP-P, EML and PAR: writing-original draft. JS-T, EML, and PAR: final writing and editing. All authors contributed to the article and approved the submitted version.
Conflict of Interest
The authors declare that the research was conducted in the absence of any commercial or financial relationships that could be construed as a potential conflict of interest.
Publisher’s Note
All claims expressed in this article are solely those of the authors and do not necessarily represent those of their affiliated organizations, or those of the publisher, the editors and the reviewers. Any product that may be evaluated in this article, or claim that may be made by its manufacturer, is not guaranteed or endorsed by the publisher.
Acknowledgments
We wish to thank the University Complutense and the Comunidad de Madrid Research Agency for financial support through grants B AE21/20/20-23164 and IND2020/BMD-17364, respectively, to PAR. JS-T and HP-P were supported by Complutense University of Madrid through CT17/17 - CT18/17 and FPU 2019 Grants, respectively.
Supplementary Material
The Supplementary Material for this article can be found online at: https://www.frontiersin.org/articles/10.3389/fimmu.2021.740613/full#supplementary-material
Supplementary Table 1 | List of primers used for real-time PCR analysis.
Supplementary Figure 1 | Gating strategy for T cell flow cytometry analysis. Isolated CD4 T cells were stained with the antibodies of interest or their isotype controls (mouse anti-IgG antibodies) and analyzed by flow cytometry. In both cases the antibodies were conjugated to FITC, PE or APC fluorochromes. Gating of the CD4 T cell population was determined based on SSC and FSC parameters. On this population the signal from isotype controls was used to define the ground fluorescence produced by stimulated CD4 T cells and adjust the positive region for FITC, PE or APC fluorescence emission. This gating conditions were used to analyze flow cytometry data. As an example, we have shown the gating strategy for detecting IFNγ+ (APC) and TNFα+ (PE) double positive cells (upper plots, APC vs PE) or IFNγ+ cells (lower plots, APC vs FSC).
Supplementary Figure 2 | Effect of indomethacin and poly(I:C) treatment on TR146 cells. TR146 cells were treated with 2 μg/mL indomethacin (Indo) or 20 μg/mL poly(I:C) for 48 hours. (A) PGE2 release was measured by ELISA in cell-free supernatants. (B) Cell proliferation was measured by MTT assay (left) and viability was analyzed by flow cytometry, staining cells with 7-AAD and Annexin V, as shown in density plots from a representative experiment (right). FACS gates were adjusted by the use of a mouse anti-IgG-FITC antibody (for Annexin V) and unstained cells for 7-AAD. Bar graphs display mean values with SEM error bars. Statistically significant differences (p < 0.05) were noted as “*”. Data were obtained from a total of three independent experiments using samples from different donors.
Supplementary Figure 3 | Dose-response effect of indomethacin, EP2/EP4 receptors antagonists and poly(I:C). (A) TR146 cells were treated or not with different concentrations of indomethacin (Indo) (0.01, 0.5 and 2 μg/mL) for 4 hours and co-cultured with anti-CD3/CD28-activated CD4 T cells for 4 hours. (B) CD4 T cells were treated with different concentrations of PF-04418948 (PF) and/or ONO-AE3-208 (ONO) inhibitors (0.05, 0.1 and 1 μg/mL) for 1 hour, activated with anti-CD3/CD28 beads and co-cultured with TR146 cells for 4 hours. (C) TR146 cells were stimulated or not with different concentrations of poly(I:C) (1, 5 and 20 μg/mL) for 4 hours and then washed twice with PBS. TR146 cells were co-cultured with anti-CD3/CD28-activated CD4 T cells for other 48 hours and restimulated with PMA and ionomycin for 4 hours before analysis. All data were obtained by flow cytometry analysis and shown as the percentage of IFNγ (upper plots) and TNFα-producing (lower plots) CD4 T cells from a representative experiment. FACS gates were adjusted by the use of mouse anti-IgG-PE and anti-IgG-APC antibodies.
Supplementary Figure 4 | H413 cells and primary OECs suppress CD4 T cells through PGE2 production. (A) H413 cells and (B) primary OECs were treated or not with 2 μg/mL indomethacin (Indo) for 4 hours and co-cultured with anti-CD3/CD28-activated CD4 T cells for 4 hours. (C) H413 cells or (D) primary OECs were cocultured 4 hours with anti-CD3/CD28-activated CD4 T pretreated for 1 hour with PF-04418948 (PF) and/or ONO-AE3-208 (ONO) inhibitors. All data were collected by flow cytometry and shown as the amount of IFNγ and TNFα-producing CD4 T cells relative to CD4 T cells alone. FACS gatings were adjusted by the use of mouse anti-IgG-PE and anti-IgG-APC antibodies. Bar graphs display mean values with SEM error bars. Statistically significant differences (p < 0.05, p < 0,01 and p < 0.001) are noted as “*”, “**” and “***”, respectively. Data were obtained from a total of three independent experiments using samples from different donors.
Supplementary Figure 5 | Treatment of CD4 T cells with PF-04418948 and ONO-AE3-208 inhibitors do not alter IFNγ and TNFα production. CD4 T cells were treated with PF-04418948 (PF) and/or ONO-AE3-208 (ONO) inhibitors for 1 hour, activated with anti-CD3/CD28 beads and cultured alone for 4 hours. Data were collected by flow cytometry and shown as the amount of IFNγ and TNFα-producing CD4 T cells relative to untreated CD4 T cells. FACS gatings were adjusted by the use of mouse anti-IgG-PE and anti-IgG-APC antibodies. Bar graphs display mean values with SEM error bars. Data were obtained from a total of three independent experiments using samples from different donors.
Footnotes
- ^ SEER Training Modules, Cancer Classification. U. S. National Institutes of Health, National Cancer Institute. https://training.seer.cancer.gov/disease/categories/classification.html [Accessed May 11 2021].
References
1. Novak N, Haberstok J, Bieber T, Allam JP. The Immune Privilege of the Oral Mucosa. Trends Mol Med (2008) 14(5):191–8. doi: 10.1016/j.molmed.2008.03.001
2. Swamy M, Jamora C, Havran W, Hayday A. Epithelial Decision Makers: In Search of the ‘Epimmunome’. Nat Immunol (2010) 11(8):656–65. doi: 10.1038/ni.1905
3. Rescigno M. Intestinal Epithelial Cells Control Dendritic Cell Function. J Pediatr Gastroenterol Nutr (2008) 46 Suppl 1:E17–9. doi: 10.1097/01.mpg.0000313831.09089.36
4. Iliev ID, Spadoni I, Mileti E, Matteoli G, Sonzogni A, Sampietro GM, et al. Human Intestinal Epithelial Cells Promote the Differentiation of Tolerogenic Dendritic Cells. Gut (2009) 58(11):1481–9. doi: 10.1136/gut.2008.175166
5. Reche PA, Soumelis V, Gorman DM, Clifford T, Liu M, Travis M, et al. Human Thymic Stromal Lymphopoietin Preferentially Stimulates Myeloid Cells. J Immunol (2001) 167(1):336–43. doi: 10.4049/jimmunol.167.1.336
6. Soumelis V, Reche PA, Kanzler H, Yuan W, Edward G, Homey B, et al. Human Epithelial Cells Trigger Dendritic Cell Mediated Allergic Inflammation by Producing TSLP. Nat Immunol (2002) 3(7):673–80. doi: 10.1038/ni805
7. Rimoldi M, Chieppa M, Salucci V, Avogadri F, Sonzogni A, Sampietro GM, et al. Intestinal Immune Homeostasis Is Regulated by the Crosstalk Between Epithelial Cells and Dendritic Cells. Nat Immunol (2005) 6(5):507–14. doi: 10.1038/ni1192
8. Wosen JE, Mukhopadhyay D, Macaubas C, Mellins ED. Epithelial MHC Class II Expression and Its Role in Antigen Presentation in the Gastrointestinal and Respiratory Tracts. Front Immunol (2018) 9:2144. doi: 10.3389/fimmu.2018.02144
9. Blumberg RS, Lencer WI, Zhu X, Kim HS, Claypool S, Balk SP, et al. Antigen Presentation by Intestinal Epithelial Cells. Immunol Lett (1999) 69(1):7–11. doi: 10.1016/S0165-2478(99)00093-0
10. Telega GW, Baumgart DC, Carding SR. Uptake and Presentation of Antigen to T Cells by Primary Colonic Epithelial Cells in Normal and Diseased States. Gastroenterology (2000) 119(6):1548–59. doi: 10.1053/gast.2000.20168
11. Thelemann C, Eren RO, Coutaz M, Brasseit J, Bouzourene H, Rosa M, et al. Interferon-Gamma Induces Expression of MHC Class II on Intestinal Epithelial Cells and Protects Mice From Colitis. PloS One (2014) 9(1):e86844. doi: 10.1371/journal.pone.0086844
12. Mulder DJ, Pooni A, Mak N, Hurlbut DJ, Basta S, Justinich CJ. Antigen Presentation and MHC Class II Expression by Human Esophageal Epithelial Cells: Role in Eosinophilic Esophagitis. Am J Pathol (2011) 178(2):744–53. doi: 10.1016/j.ajpath.2010.10.027
13. Cruickshank SM, McVay LD, Baumgart DC, Felsburg PJ, Carding SR. Colonic Epithelial Cell Mediated Suppression of CD4 T Cell Activation. Gut (2004) 53(5):678–84. doi: 10.1136/gut.2003.029967
14. Demmers MW, Korevaar SS, Roemeling-van Rhijn M, van den Bosch TP, Hoogduijn MJ, Betjes MG, et al. Human Renal Tubular Epithelial Cells Suppress Alloreactive T Cell Proliferation. Clin Exp Immunol (2015) 179(3):509–19. doi: 10.1111/cei.12469
15. Motedayyen H, Rezaei A, Zarnani AH, Tajik N. Human Amniotic Epithelial Cells Inhibit Activation and Pro-Inflammatory Cytokines Production of Naive CD4+ T Cells From Women With Unexplained Recurrent Spontaneous Abortion. Reprod Biol (2018) 18(2):182–8. doi: 10.1016/j.repbio.2018.04.002
16. Niederkorn JY, Streilein JW. Alloantigens Placed Into the Anterior Chamber of the Eye Induce Specific Suppression of Delayed-Type Hypersensitivity But Normal Cytotoxic T Lymphocyte and Helper T Lymphocyte Responses. J Immunol (1983) 131(6):2670–4.
17. Namba K, Kitaichi N, Nishida T, Taylor AW. Induction of Regulatory T Cells by the Immunomodulating Cytokines Alpha-Melanocyte-Stimulating Hormone and Transforming Growth Factor-Beta2. J Leukoc Biol (2002) 72(5):946–52. doi: 10.1189/jlb.72.5.946
18. Wilbanks GA, Mammolenti M, Streilein JW. Studies on the Induction of Anterior Chamber-Associated Immune Deviation (ACAID). III. Induction of ACAID Depends Upon Intraocular Transforming Growth Factor-Beta. Eur J Immunol (1992) 22(1):165–73. doi: 10.1002/eji.1830220125
19. Murai M, Turovskaya O, Kim G, Madan R, Karp CL, Cheroutre H, et al. Interleukin 10 Acts on Regulatory T Cells to Maintain Expression of the Transcription Factor Foxp3 and Suppressive Function in Mice With Colitis. Nat Immunol (2009) 10(11):1178–84. doi: 10.1038/ni.1791
20. Chinen T, Komai K, Muto G, Morita R, Inoue N, Yoshida H, et al. Prostaglandin E2 and SOCS1 Have a Role in Intestinal Immune Tolerance. Nat Commun (2011) 2:190. doi: 10.1038/ncomms1181
21. Aldajani WA, Salazar F, Sewell HF, Knox A, Ghaemmaghami AM. Expression and Regulation of Immune-Modulatory Enzyme Indoleamine 2,3-Dioxygenase (IDO) by Human Airway Epithelial Cells and Its Effect on T Cell Activation. Oncotarget (2016) 7(36):57606–17. doi: 10.18632/oncotarget.11586
22. Molero-Abraham M, Sanchez-Trincado JL, Gomez-Perosanz M, Torres-Gomez A, Subiza JL, Lafuente EM, et al. Human Oral Epithelial Cells Impair Bacteria-Mediated Maturation of Dendritic Cells and Render T Cells Unresponsive to Stimulation. Front Immunol (2019) 10:1434. doi: 10.3389/fimmu.2019.01434
23. Michalczyk A, Varigos G, Smith L, Ackland ML. Fresh and Cultured Buccal Cells as a Source of mRNA and Protein for Molecular Analysis. Biotechniques (2004) 37(2):262–4, 6-9. doi: 10.2144/04372RR03
24. Nagashima H, Okuyama Y, Asao A, Kawabe T, Yamaki S, Nakano H, et al. The Adaptor TRAF5 Limits the Differentiation of Inflammatory CD4(+) T Cells by Antagonizing Signaling via the Receptor for IL-6. Nat Immunol (2014) 15(5):449–56. doi: 10.1038/ni.2863
25. Niedel JE, Kuhn LJ, Vandenbark GR. Phorbol Diester Receptor Copurifies With Protein Kinase C. Proc Natl Acad Sci USA (1983) 80(1):36–40. doi: 10.1073/pnas.80.1.36
26. Yoshida S, Plant S. Mechanism of Release of Ca2+ From Intracellular Stores in Response to Ionomycin in Oocytes of the Frog Xenopus Laevis. J Physiol (1992) 458:307–18. doi: 10.1113/jphysiol.1992.sp019419
27. Dugger K, Lowder TW, Tucker TA, Schwiebert LM. Epithelial Cells as Immune Effector Cells: The Role of CD40. Semin Immunol (2009) 21(5):289–92. doi: 10.1016/j.smim.2009.06.002
28. Selvaraj P, Plunkett ML, Dustin M, Sanders ME, Shaw S, Springer TA. The T Lymphocyte Glycoprotein CD2 Binds the Cell Surface Ligand LFA-3. Nature (1987) 326(6111):400–3. doi: 10.1038/326400a0
29. Tsushima F, Yao S, Shin T, Flies A, Flies S, Xu H, et al. Interaction Between B7-H1 and PD-1 Determines Initiation and Reversal of T-Cell Anergy. Blood (2007) 110(1):180–5. doi: 10.1182/blood-2006-11-060087
30. Brzozowski T, Konturek PC, Konturek SJ, Brzozowska I, Pawlik T. Role of Prostaglandins in Gastroprotection and Gastric Adaptation. J Physiol Pharmacol (2005) 56 Suppl 5:33–55.
31. Park JY, Pillinger MH, Abramson SB. Prostaglandin E2 Synthesis and Secretion: The Role of PGE2 Synthases. Clin Immunol (2006) 119(3):229–40. doi: 10.1016/j.clim.2006.01.016
32. Dubois RN, Abramson SB, Crofford L, Gupta RA, Simon LS, Van De Putte LB, et al. Cyclooxygenase in Biology and Disease. FASEB J (1998) 12(12):1063–73. doi: 10.1096/fasebj.12.12.1063
33. af Forselles KJ, Root J, Clarke T, Davey D, Aughton K, Dack K, et al. In Vitro and In Vivo Characterization of PF-04418948, A Novel, Potent and Selective Prostaglandin EP(2) Receptor Antagonist. Br J Pharmacol (2011) 164(7):1847–56. doi: 10.1111/j.1476-5381.2011.01495.x
34. Kabashima K, Saji T, Murata T, Nagamachi M, Matsuoka T, Segi E, et al. The Prostaglandin Receptor EP4 Suppresses Colitis, Mucosal Damage and CD4 Cell Activation in the Gut. J Clin Invest (2002) 109(7):883–93. doi: 10.1172/JCI0214459
35. Groeger S, Meyle J. Oral Mucosal Epithelial Cells. Front Immunol (2019) 10:208. doi: 10.3389/fimmu.2019.00208
36. Vang T, Torgersen KM, Sundvold V, Saxena M, Levy FO, Skalhegg BS, et al. Activation of the COOH-Terminal Src Kinase (Csk) by cAMP-Dependent Protein Kinase Inhibits Signaling Through the T Cell Receptor. J Exp Med (2001) 193(4):497–507. doi: 10.1084/jem.193.4.497
37. Wiemer AJ, Hegde S, Gumperz JE, Huttenlocher A. A Live Imaging Cell Motility Screen Identifies Prostaglandin E2 as a T Cell Stop Signal Antagonist. J Immunol (2011) 187(7):3663–70. doi: 10.4049/jimmunol.1100103
38. Walker C, Kristensen F, Bettens F, deWeck AL. Lymphokine Regulation of Activated (G1) Lymphocytes. I. Prostaglandin E2-Induced Inhibition of Interleukin 2 Production. J Immunol (1983) 130(4):1770–3.
39. Rincon M, Tugores A, Lopez-Rivas A, Silva A, Alonso M, De Landazuri MO, et al. Prostaglandin E2 and the Increase of Intracellular cAMP Inhibit the Expression of Interleukin 2 Receptors in Human T Cells. Eur J Immunol (1988) 18(11):1791–6. doi: 10.1002/eji.1830181121
40. Sreeramkumar V, Fresno M, Cuesta N. Prostaglandin E2 and T Cells: Friends or Foes? Immunol Cell Biol (2012) 90(6):579–86. doi: 10.1038/icb.2011.75
41. Schmalz G, Schweikl H, Hiller KA. Release of Prostaglandin E2, IL-6 and IL-8 From Human Oral Epithelial Culture Models After Exposure to Compounds of Dental Materials. Eur J Oral Sci (2000) 108(5):442–8. doi: 10.1034/j.1600-0722.2000.108005442.x
42. Schmidt LM, Belvisi MG, Bode KA, Bauer J, Schmidt C, Suchy MT, et al. Bronchial Epithelial Cell-Derived Prostaglandin E2 Dampens the Reactivity of Dendritic Cells. J Immunol (2011) 186(4):2095–105. doi: 10.4049/jimmunol.1002414
43. Maan AS, Patil AK. Assessment of Salivary Interleukin-1beta (IL-1beta), Prostaglandin E2 (PGE2) Levels and Pain Intensity in Children and Adults During Initial Orthodontic Treatment. J Orthod Sci (2019) 8:16. doi: 10.4103/jos.JOS_13_19
44. Dey I, Lejeune M, Chadee K. Prostaglandin E2 Receptor Distribution and Function in the Gastrointestinal Tract. Br J Pharmacol (2006) 149(6):611–23. doi: 10.1038/sj.bjp.0706923
45. Dejani NN, Orlando AB, Nino VE, Penteado LA, Verdan FF, Bazzano JMR, et al. Intestinal Host Defense Outcome is Dictated by PGE2 Production During Efferocytosis of Infected Cells. Proc Natl Acad Sci USA (2018) 115(36):E8469–78. doi: 10.1073/pnas.1722016115
46. Wallace CA, Moir G, Malone DF, Duncan L, Devarajan G, Crane IJ. Regulation of T-Lymphocyte CCL3 and CCL4 Production by Retinal Pigment Epithelial Cells. Invest Ophthalmol Vis Sci (2013) 54(1):722–30. doi: 10.1167/iovs.12-10602
47. Aoudjit L, Potapov A, Takano T. Prostaglandin E2 Promotes Cell Survival of Glomerular Epithelial Cells via the EP4 Receptor. Am J Physiol Renal Physiol (2006) 290(6):F1534–42. doi: 10.1152/ajprenal.00267.2005
48. Kamihira T, Shimoda S, Nakamura M, Yokoyama T, Takii Y, Kawano A, et al. Biliary Epithelial Cells Regulate Autoreactive T Cells: Implications for Biliary-Specific Diseases. Hepatology (2005) 41(1):151–9. doi: 10.1002/hep.20494
49. Wang D, DuBois RN. The Role of Prostaglandin E(2) in Tumor-Associated Immunosuppression. Trends Mol Med (2016) 22(1):1–3. doi: 10.1016/j.molmed.2015.11.003
50. Guo YC, Chang CM, Hsu WL, Chiu SJ, Tsai YT, Chou YH, et al. Indomethacin Inhibits Cancer Cell Migration via Attenuation of Cellular Calcium Mobilization. Molecules (2013) 18(6):6584–96. doi: 10.3390/molecules18066584
51. Wang HM, Zhang GY. Indomethacin Suppresses Growth of Colon Cancer via Inhibition of Angiogenesis In Vivo. World J Gastroenterol (2005) 11(3):340–3. doi: 10.3748/wjg.v11.i3.340
52. Yamamoto M, Fujihashi K, Kawabata K, McGhee JR, Kiyono H. A Mucosal Intranet: Intestinal Epithelial Cells Down-Regulate Intraepithelial, But Not Peripheral, T Lymphocytes. J Immunol (1998) 160(5):2188–96.
53. Baratelli F, Lin Y, Zhu L, Yang SC, Heuze-Vourc’h N, Zeng G, et al. Prostaglandin E2 Induces FOXP3 Gene Expression and T Regulatory Cell Function in Human CD4+ T Cells. J Immunol (2005) 175(3):1483–90. doi: 10.4049/jimmunol.175.3.1483
54. Boniface K, Bak-Jensen KS, Li Y, Blumenschein WM, McGeachy MJ, McClanahan TK, et al. Prostaglandin E2 Regulates Th17 Cell Differentiation and Function Through Cyclic AMP and EP2/EP4 Receptor Signaling. J Exp Med (2009) 206(3):535–48. doi: 10.1084/jem.20082293
55. Park JY, Chung H, DiPalma DT, Tai X, Park JH. Immune Quiescence in the Oral Mucosa is Maintained by a Uniquely Large Population of Highly Activated Foxp3(+) Regulatory T Cells. Mucosal Immunol (2018) 11(4):1092–102. doi: 10.1038/s41385-018-0027-2
56. Tanaka Y, Nagashima H, Bando K, Lu L, Ozaki A, Morita Y, et al. Oral CD103(-)CD11b(+) Classical Dendritic Cells Present Sublingual Antigen and Induce Foxp3(+) Regulatory T Cells in Draining Lymph Nodes. Mucosal Immunol (2017) 10(1):79–90. doi: 10.1038/mi.2016.46
57. Ding H, Wu X, Gao W. PD-L1 is Expressed by Human Renal Tubular Epithelial Cells and Suppresses T Cell Cytokine Synthesis. Clin Immunol (2005) 115(2):184–91. doi: 10.1016/j.clim.2005.01.005
58. Hattori T, Kezuka T, Usui Y, Okunuki Y, Takeuchi M, Maruyama K, et al. Human Iris Pigment Epithelial Cells Suppress T-Cell Activation via Direct Cell Contact. Exp Eye Res (2009) 89(3):358–64. doi: 10.1016/j.exer.2009.04.004
59. Yellin MJ, D’Agati V, Parkinson G, Han AS, Szema A, Baum D, et al. Immunohistologic Analysis of Renal CD40 and CD40L Expression in Lupus Nephritis and Other Glomerulonephritides. Arthritis Rheum (1997) 40(1):124–34. doi: 10.1002/art.1780400117
60. Propst SM, Denson R, Rothstein E, Estell K, Schwiebert LM. Proinflammatory and Th2-Derived Cytokines Modulate CD40-Mediated Expression of Inflammatory Mediators in Airway Epithelia: Implications for the Role of Epithelial CD40 in Airway Inflammation. J Immunol (2000) 165(4):2214–21. doi: 10.4049/jimmunol.165.4.2214
61. Galy AH, Spits H. CD40 Is Functionally Expressed on Human Thymic Epithelial Cells. J Immunol (1992) 149(3):775–82.
62. Hirosako S, Goto E, Fujii K, Tsumori K, Hirata N, Tsumura S, et al. Human Bronchial Intraepithelial T Cells Produce Interferon-Gamma and Stimulate Epithelial Cells. Clin Exp Immunol (2009) 155(2):266–74. doi: 10.1111/j.1365-2249.2008.03811.x
63. Framson PE, Cho DH, Lee LY, Hershberg RM. Polarized Expression and Function of the Costimulatory Molecule CD58 on Human Intestinal Epithelial Cells. Gastroenterology (1999) 116(5):1054–62. doi: 10.1016/S0016-5085(99)70008-9
64. Schwarze J, Fitch PM, Heimweg J, Errington C, Matsuda R, de Bruin HG, et al. Viral Mimic Poly-(I:C) Attenuates Airway Epithelial T-Cell Suppressive Capacity: Implications for Asthma. Eur Respir J (2016) 48(6):1785–8. doi: 10.1183/13993003.00841-2016
65. Schau I, Michen S, Hagstotz A, Janke A, Schackert G, Appelhans D, et al. Targeted Delivery of TLR3 Agonist to Tumor Cells With Single Chain Antibody Fragment-Conjugated Nanoparticles Induces Type I-Interferon Response and Apoptosis. Sci Rep (2019) 9(1):3299. doi: 10.1038/s41598-019-40032-8
Keywords: oral epithelial cells, dendritic cells, T cells, immunomodulation, PGE2, viral infection
Citation: Sanchez-Trincado JL, Pelaez-Prestel HF, Lafuente EM and Reche PA (2022) Human Oral Epithelial Cells Suppress T Cell Function via Prostaglandin E2 Secretion. Front. Immunol. 12:740613. doi: 10.3389/fimmu.2021.740613
Received: 13 July 2021; Accepted: 15 December 2021;
Published: 19 January 2022.
Edited by:
Eric Cox, Ghent University, BelgiumReviewed by:
Shailesh K Shahi, The University of Iowa, United StatesSandra Donnini, University of Siena, Italy
Copyright © 2022 Sanchez-Trincado, Pelaez-Prestel, Lafuente and Reche. This is an open-access article distributed under the terms of the Creative Commons Attribution License (CC BY). The use, distribution or reproduction in other forums is permitted, provided the original author(s) and the copyright owner(s) are credited and that the original publication in this journal is cited, in accordance with accepted academic practice. No use, distribution or reproduction is permitted which does not comply with these terms.
*Correspondence: Pedro A. Reche, cGFyZWNoZWdAbWVkLnVjbS5lcw==; Esther M. Lafuente, bWVsYWZ1ZW50ZUBtZWQudWNtLmVz
†These authors have contributed equally to this work