
95% of researchers rate our articles as excellent or good
Learn more about the work of our research integrity team to safeguard the quality of each article we publish.
Find out more
ORIGINAL RESEARCH article
Front. Immunol. , 07 December 2021
Sec. Immunological Memory
Volume 12 - 2021 | https://doi.org/10.3389/fimmu.2021.722320
This article is part of the Research Topic A year in review: Discussions in Immunological Memory View all 10 articles
 Raquel Blanco1*†
 Marta Gómez de Cedrón2
 Laura Gámez-Reche1,3
 Ana Martín-Leal1
 Alicia González-Martín3
 Rosa A. Lacalle1
 Ana Ramírez de Molina2
 Santos Mañes1*†
The inhibition of anabolic pathways, such as aerobic glycolysis, is a metabolic cornerstone of memory T cell differentiation and function. However, the signals that hamper these anabolic pathways are not completely known. Recent evidence pinpoints the chemokine receptor CCR5 as an important player in CD4+ T cell memory responses by regulating T cell antigen receptor (TCR) nanoclustering in an antigen-independent manner. This paper reports that CCR5 specifically restrains aerobic glycolysis in memory-like CD4+ T cells, but not in effector CD4+ T cells. CCR5-deficient memory CD4+ T cells thus show an abnormally high glycolytic/oxidative metabolism ratio. No CCR5-dependent change in glucose uptake nor in the expression of the main glucose transporters was detected in any of the examined cell types, although CCR5-deficient memory cells did show increased expression of the hexokinase 2 and pyruvate kinase M2 isoforms, plus the concomitant downregulation of Bcl-6, a transcriptional repressor of these key glycolytic enzymes. Further, the TCR nanoclustering defects observed in CCR5-deficient antigen-experienced CD4+ T cells were partially reversed by incubation with 2-deoxyglucose (2-DG), suggesting a link between inhibition of the glycolytic pathway and TCR nanoscopic organization. Indeed, the treatment of CCR5-deficient lymphoblasts with 2-DG enhanced IL-2 production after antigen re-stimulation. These results identify CCR5 as an important regulator of the metabolic fitness of memory CD4+ T cells, and reveal an unexpected link between T cell metabolism and TCR organization with potential influence on the response of memory T cells upon antigen re-encounter.
The adaptive immune system has the ability to generate immunological memory. This allows for rapid and robust secondary responses upon antigen re-encounter (1). The response of memory T (TM) cells to low antigen concentrations has been linked to the antigen-independent formation of T cell antigen receptor (TCR) oligomers known as nanoclusters (2–4). The nanoscopic organization of the TCR molecules is not exclusive to TM cells; it also occurs in effector T (TE) cells, although to a lesser extent. Indeed, the antigenic sensitivity gradient in CD4+ and CD8+ T cell subsets (TM>TE>>naive) correlates with the valency of TCR nanoclusters at the cell surface (5, 6). TCR nanoscopic organization allows cooperativity between TCR molecules (7) and increases avidity for multimeric peptide-major histocompatibility complexes (5, 8). TCR nanoclustering in antigen-experienced TM and TE lymphoblasts is strongly dependent on the sterol and sphingolipid composition of the plasma membrane (6, 9, 10); the importance of the cell’s metabolic state in TCR organization has, however, been left completely unexplored.
A solid body of evidence indicates that dynamic changes in cellular metabolism determine the functionality and fate of CD4+ and CD8+ T cells (11–13). Each differentiation state and lineage subset of T cells has a unique metabolic profile. Quiescent, naive T cells, which have low metabolic needs, are largely dependent on the oxidative phosphorylation (OXPHOS) of small amounts of glucose or fatty acids in the mitochondria to generate ATP (12). Upon antigen stimulation, TE cells increase both OXPHOS and aerobic glycolysis to fulfill their new ATP and building block demands. The net result is a metabolic switchover that reduces the OXPHOS/glycolytic ratio in these cells. This increase in glycolysis, which occurs in CD8+ and all effector CD4+ T helper (Th) subsets (Th1, Th2 and Th17), is not only important for generating the biomass needed for the expansion of activated cells, it is also required for the expression of cytokines involved in T cell effector function (14–17). In contrast, the metabolism of CD4+ regulatory T cells, and of both CD4+ and CD8+ TM cells, largely relies on OXPHOS and fatty acid oxidation (FAO) (12, 16, 18). Thus, TM cells undergo a metabolic switchover that increases the OXPHOS/glycolytic ratio compared to TE cells. Indeed, the inhibition of glycolysis is a necessary step in preserving the generation of long-lived CD8+ TM cells, whereas enhanced glycolytic flow prevents TM cell formation (19).
Switches between these dynamic metabolic programs are orchestrated by the TCR plus co-stimulatory and cytokine signaling. Together, these induce top-down signaling circuits culminating in the expression or repression of specific transcription factors. For instance, interleukin (IL)-2 signaling boosts the transcription of glycolytic genes through the induction of interferon-regulatory factor (IRF)-4, hypoxia-inducible factor (HIF)-1α, and Myc (20). Interestingly, IL-2 also downregulates the glycolysis-inhibiting repressor B-cell lymphoma 6 (Bcl)-6, thus preventing the induction of a Bcl-6-guided transcriptional program more compatible with TM cell metabolism (21). Other cytokines such as IL-15 and IL-7 promote TM cell formation by triggering mitochondrial oxidative metabolism through the expression of carnitine palmitoyltransferase-1a (CPT1a) and lipases, which respectively control FAO and the mobilization of intrinsic fatty acids (22). Co-stimulatory and cytokine signaling also control mitochondrial fusion and fission dynamics, and the ultrastructure of the cristae, affecting mitochondrial respiratory capacity and hence the formation of TE and TM cells (23–27). Although information on the regulation of T cell metabolism has increased in recent years, much remains to be learnt about the array of signals involved in its reprogramming.
T cells are also exposed to signals provided by chemokines - cytokines that act through seven-transmembrane G-protein-coupled receptors and traditionally catalogued as regulators of leukocyte trafficking (28). Solid evidence exists, however, that some chemokine receptors influence T-cell fate and function in a chemotactic-independent manner (29). In particular, C-C chemokine receptor 5 (CCR5) has been implicated in maximizing CD4+ T cell co-stimulation and the induction of transcriptional programs responsible for cytokine production (30–34). CCR5 transduces signals from CCL3, CCL4 and CCL5, the expression of which is induced upon TCR-mediated activation (35). Recently, CCR5 has been involved in CD4+ TM cell responses. CCR5 deficiency does not affect CD4+ TM cell generation, but reduces TCR nanoclustering organization and, consequently, the antigenic sensitivity of TM cells after antigen re-encounter (6). As a result, CCR5-/- mice show impaired production of high-affinity class-switched antibodies after antigen re-challenge, a phenomenon dependent on CD4+ TM cell function.
Since CCR5 activity affects CD4+ TM cell functionality, the present work examines whether it also affects TM cell metabolism. The information of potential effects of CCR5 on T cell metabolism is, however, limited. In activated CD4+ TE cells, CCR5 has been reported to increase glucose uptake, glycolysis and AMP-activated protein kinase (AMPK)-α1 activity and, therefore, presumably FAO; indeed, the inhibition of glycolysis and the AMPK pathway prevents CCR5-mediated chemotaxis (36). The CCL5-mediated chemotactic activity of activated and resting CD4+ TM cells has different metabolic requirements (37), but the involvement of CCR5 activation in metabolic alterations has never before been studied. The present work shows that CCR5 deficiency enhances glycolysis in CD4+ TM cells, thus hindering the metabolic switch associated with the TM cell lineage. OXPHOS and glycolysis were found comparable in CCR5-deficient and CCR5-proficient CD4+ TE cells, indicating the CCR5 effect in TM cells to be specific to them. CCR5-deficient CD4+ TM cells showed very little expression of Bcl-6, whereas some key enzymes regulating the glycolytic flow were increased. Strikingly, the inhibition of glycolysis in CCR5-deficient, antigen-experienced CD4+ T lymphoblasts increased the degree of TCR nanoclustering. These results indicate that CCR5 improves the functional and metabolic fitness of CD4+ TM cells, and reveal an unexpected bond between metabolic reprogramming and TCR nanoscopic organization.
TCR transgenic OT-II CCR5-/- mice (31) recognizing the peptide OVA323–339 (ISQAVHAAHAEINEAGR; I-Ab MHC class II molecule) were maintained under specific-pathogen-free conditions at the CNB animal facilities, in agreement with Spanish national and EU guidelines. All animal procedures were approved by the ethics committees of the CNB and the Comunidad de Madrid (PROEX 277/14; PROEX 090/19).
Spleen and lymph nodes from 6 to 12 week-old OT-II WT and CCR5-/- mice were isolated and cell suspensions obtained using 40 µm pore filters. Erythrocytes were lysed with AKT lysis buffer (0.15 M NH4Cl, 10 mM KHCO3, 0.1 mM EDTA) and activated with the OVA323–339 peptide for 3 days in complete medium, i.e., RPMI 1640 (Biowest), 10% FBS, 1 mM sodium pyruvate, 2 mM L-glutamine, 1% non-essential amino acids, 100 U/ml penicillin/streptomycin, 10 µM β-mercaptoethanol. The antigen was removed and the cells cultured with IL-2 (5 ng/ml) or IL-15 (20 ng/ml) for four more days.
The oxygen consumption rate (OCR) and the extracellular acidification rate (ECAR) were measured using an XF96 Extracellular Flux analyzer (Seahorse Bioscience). CD4+ TE/TM cells were seeded (0.3x10⁶ cells/well) on a XF96 cell culture microplate previously treated with Cell-Tak (Corning). Mitochondrial stress tests were performed by incubating cells for 1 h in the absence of CO2 in non-buffered XF assay medium pH7.4 (Seahorse Bioscience), supplemented with 25 mM glucose, 2 mM glutamine and 1 mM sodium pyruvate. After basal rate measurements, different modulators of mitochondrial respiration were injected sequentially (1): 2.5 μM oligomycin to inhibit ATP-synthase and to calculate the ATP-linked oxygen consumption (2); 1.5 μM carbonyl cyanide-P-trifluoro-methoxy-phenylhydrazone (FCCP; an uncoupling agent) to obtain the maximum respiration under stress conditions; and (3) a mix of 0.5 μM rotenone/antimycin A to completely block mitochondrial respiration by inhibiting complexes I and III respectively.
The oxidation of exogenous fatty acids was measured using palmitate-BSA as a substrate. Briefly, cells were seeded overnight in complete medium. Forty-five minutes prior to the assay, cells were incubated with non-buffered XF assay medium pH7.4 (Seahorse Bioscience) supplemented with palmitate-BSA, 1 mM glucose, 0.5 mM carnitine, and 5 mM HEPES, adjusted to pH 7.4, and incubated (30-45 min, 37°C) in a non-CO2 incubator; etomoxir (40 μM) was added in the corresponding wells 15 min before starting the assay. OCR was measured under basal conditions and after the sequential addition of 2.5 μM oligomycin, 1.5 μM FCCP and 0.5 μM rotenone/antimycin A.
Glycolysis stress tests were performed using cells starved in a non-CO2 incubator for 1 h at 37°C in non-buffered XF assay medium (Seahorse Bioscience) supplemented with 2 mM glutamine and 1 mM sodium pyruvate. After measuring basal ECAR and OCR, 15 mM glucose were injected to stimulate glycolysis, followed by 2.5 μM oligomycin to obtain the maximum glycolytic capacity via the inhibition of oxygen consumption. Finally, 100 mM of 2-deoxy-D-glucose (2-DG) were injected to shut down glycolysis. For glycolytic rate assays, cells were incubated in the absence of CO2 for 1 h in non-buffered XF assay medium (Seahorse Bioscience) supplemented with 25 mM glucose, 2 mM glutamine and 1 mM sodium pyruvate. After basal ECAR measurements, 0.5 μM rotenone/antimycin and 100 mM 2-DG were injected.
OCR and ECAR were measured three times after the addition of each drug. At least three animals per condition, run in triplicate, were used in each experiment. Calculations were performed with the Seahorse XF Cell Test Report Generator software (Seahorse Bioscience).
The supernatant of OT-II cells (106 cells/well) differentiated under TE and TM conditions (as indicated above) was collected on day 7 of culture, and mouse CCL3, CCL4 and CCL5 levels determined using a specific sandwich ELISA (R&D Systems) following the manufacturer’s instructions.
Total RNA was extracted from cells using the RNeasy Mini Kit (Qiagen), and cDNA synthesized from 1 μg total RNA using the High Capacity cDNA Reverse Transcription Kit (Promega). Quantitative RT–PCR was performed in a QuantStudio 5 Real-Time PCR System (Applied Biosystems), using FluoCycle II SYBR Master Mix (EuroClone) with the primer pairs listed in Supplementary Table S1. Gene expression was normalized using the 18S ribosomal RNA signal.
Protein extracts were obtained after cell lysis with RIPA buffer (50 mM Tris-HCl pH 8.0, 150 mM NaCl, 1% NP-40, 0.5% sodium deoxycholate and 1% SDS) supplemented with protease and phosphatase inhibitors (1 mM PMSF, 1 mM Na3VO4, 10 μg/ml leupeptin, 10 μg/ml aprotinin and 5 mM NaF). Proteins were quantified using the Micro BCA Protein Assay Kit (Pierce). Equal amounts of proteins were resolved on 10% polyacrylamide gels and transferred to PVDF membranes. Membranes were probed with anti-Bcl-6 (BD Pharmingen) and anti-β-actin (Sigma Aldrich) antibodies.
WT and CCR5-/- OT-II lymphoblasts (106) differentiated under TE or TM conditions were stained (30 min, 4°C) with LIVE/DEAD™ Fixable Near-IR Dead Cell Stain (Thermofisher Scientific) and, after extensive washing with ice-cold PBS-2% BSA, stained (15 min, 4°C) with anti-CD4-PECy5.5 (clone GK1.5; BioLegend) in the dark. The cells were then fixed and permeabilized using the eBioscience™ Foxp3/Transcription Factor Fixation/Permeabilization Kit (Thermofisher Scientific) following the manufacturer’s instructions, and stained (1 h, 20°C, in the dark) with anti-Bcl6-PE (clone K112-91; 2 µg/ml; BD Bioscience). Cells were analyzed using a Gallios Flow Cytometry Analyzer (Beckman Coulter), and data processed using FlowJo software (BD Bioscience).
Glucose uptake was determined for the whole cell population using the Glucose Uptake-Glo Assay (Promega). Basically, WT and CCR5-/- OT-II lymphoblasts differentiated under TE or TM conditions (0.5x10⁶) were starved for 30 min in glucose-free RPMI 1640 medium (Biowest) supplemented with 2 mM L-glutamine, 1% non-essential amino acids and 100 U/ml penicillin/streptomycin, and then incubated with 2-DG (20 min, 37°C). Cells were lysed and 2-DG incorporation determined following the manufacturer’s instructions.
CCR5-/- and WT OT-II lymphoblasts treated - or not - with 2-DG (2 mM, 24 h) were used to prepare cell surface replicas as previously described (5, 6). Briefly, T cells were fixed in 1% paraformaldehyde and labeled with anti-mouse CD3ϵ mAb (145-2C11), followed by 10 nm gold-conjugated protein A (Sigma-Aldrich). Labeled cells were adhered to poly-L-lysine-coated mica strips and fixed with 0.1% glutaraldehyde. Samples were covered with another mica strip, frozen in liquid ethane (KF-80, Leica), and stored in liquid nitrogen. Cell replicas were prepared with a Balzers 400T freeze fracture (FF) unit, mounted on copper grids, and analyzed using a JEM1010 electron microscope (Jeol) operating at 80 kV. Images were taken with a Bioscan CCD camera (Gatan) and processed with TVIPS software. EM image acquisition and quantification was performed by two researchers, one of them blind to the experiment. The number of TCR molecules in the same cluster was determined when the distance between gold particles was smaller than their diameter (10 nm).
CCR5-/- OT-II lymphoblasts were treated with vehicle or 2-DG (2mM) for 24 h and, after extensive washing to remove all remnants of 2-DG, co-cultured (24 h) with irradiated (15 Gy) splenocytes loaded (2 h, 37°C) with different concentration of OVA323-339 peptide. Supernatants were collected to measure IL-2 by ELISA (ELISA MAX Deluxe, BioLegend). Proliferation was assessed via methyl-3[H]-thymidine (1 μCi/well) incorporation into DNA, using a 1450 Microbeta liquid scintillation counter (PerkinElmer).
Statistical analyses were performed using Prism software (GraphPad). Differences were assessed using the two-tailed Student t test with Welch’s correction or the Holm-Sidak correction for multiple t test comparisons, or, when appropriate, two-way ANOVA with the post-hoc Bonferroni test for multiple comparisons. The Chi-square test was used to analyze the overall distribution of gold particles. Variances were compared using the F test. Data are expressed as means ± SEM. Significance was set at p<0.05.
To analyze whether CCR5 affects the metabolic reprogramming of CD4+ T cells, WT and CCR5-/- OT-II splenocytes were stimulated with cognate antigen and subsequently cultured for four days in the presence of IL-2 or IL-15, but in the absence of antigenic stimulation (Figure 1A). In accordance with other studies (6, 23), these culture conditions generated resting CD4+ TE (IL-2) or TM (IL-15) lymphoblasts, respectively. Notably, TE and TM lymphoblasts expressed comparable levels of the main CCR5 ligands (CCL3, CCL4 and CCL5) and the receptor CCR5 (Supplementary Figure S1), suggesting that the differentiation conditions do not affect potential autocrine/paracrine CCR5 signaling (6).
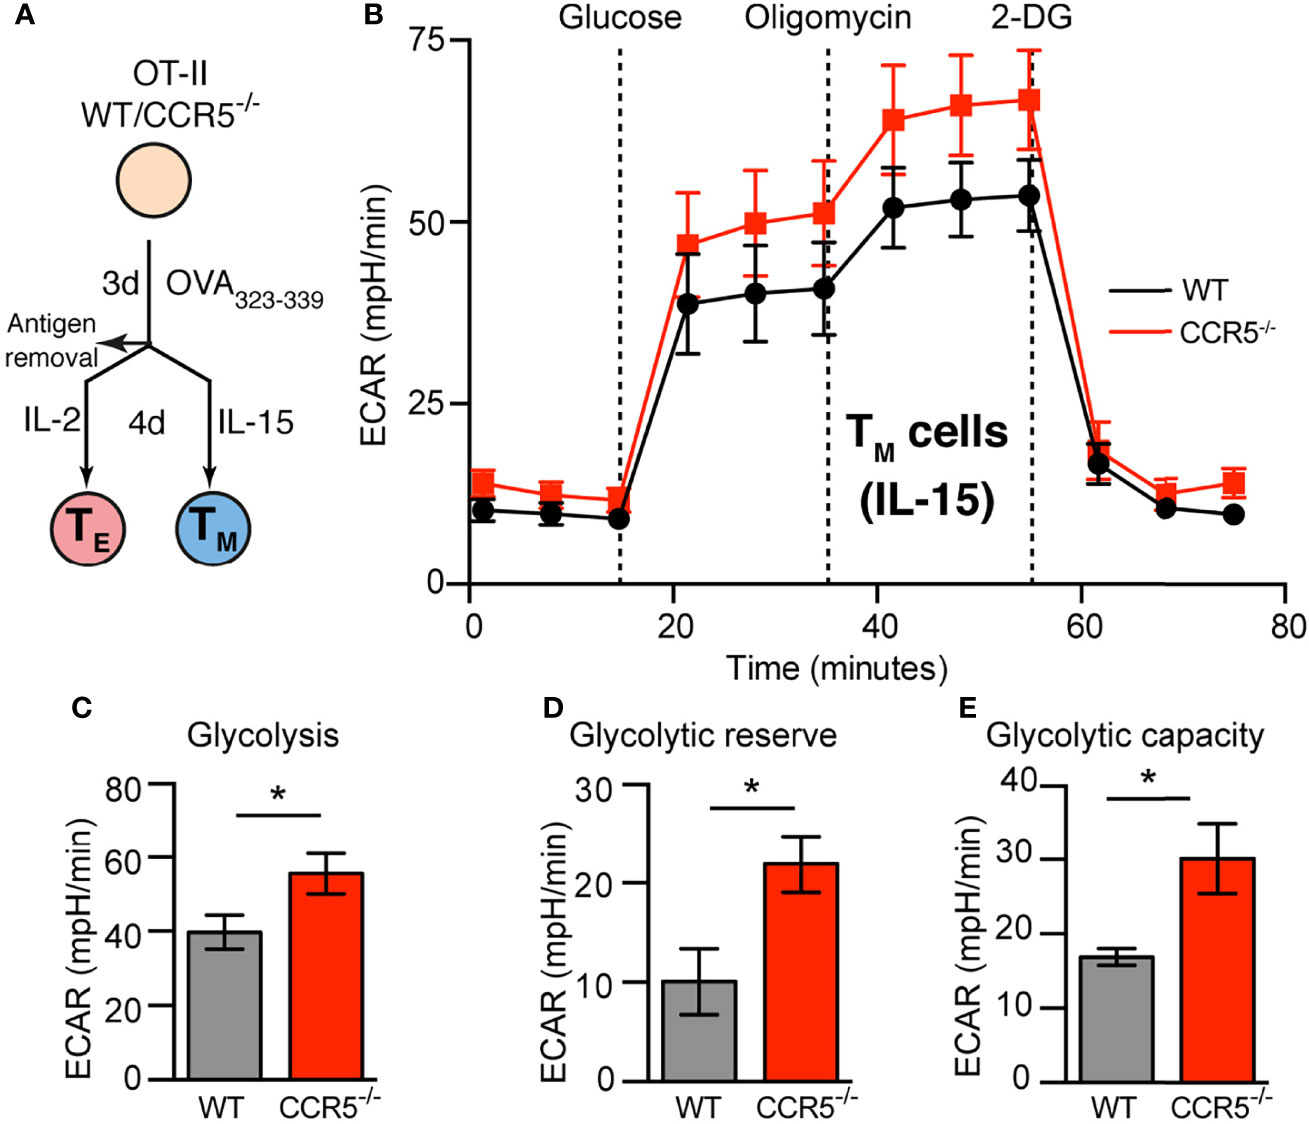
Figure 1 CCR5 deficiency increases glycolytic metabolism in memory CD4+ T cells. (A). Diagram showing the ex-vivo activation and differentiation of primary CD4+ T cells (OT-II). (B) ECAR profiles of WT and CCR5-/- TM (IL-15-expanded) lymphoblasts differentiated as in (A), incubated in XF assay medium supplemented with 2 mM glutamine and 1 mM sodium pyruvate in the absence of CO2, and subsequently inoculated with glucose, oligomycin and 2-DG as indicated. (C–E). Determination of glycolysis (C), glycolytic reserve (D) and glycolytic capacity (E) (details in Results) from the ECAR curves obtained as in (B). Data represent means ± SEM (n≥9 from three independent experiments). *p < 0.05, two-tailed Student t test.
The oxygen consumption rate (OCR) was monitored as an indicator of mitochondrial function in WT and CCR5-/- TE and TM cells, using glucose as carbon source. No differences were seen between any cell type in terms of basal or maximum OCR (OCRmax), spare respiratory capacity (SRC; a variable determining the capacity of the cell to respond to an energy demand), or ATP production (Supplementary Figure S2). To rule out that the lack of differences was associated with the carbon source, similar experiments were performed using palmitate in a low glucose medium (1 mM). Pre-treatment of the cells with etomoxir, a CPT1a inhibitor, drastically reduced the OCR (Supplementary Figure S3), allowing the contribution of FAO to the measured variables to be distinguished. Again, no significant differences were seen between any cell type in terms of OCRmax, SRC or ATP production (Supplementary Figure S3). In agreement with the lack of differences in OXPHOS determinations between CCR5 proficient and deficient cells, no relative differences were found in the expression of mitochondrial genes (Supplementary Figure S4), including NADH:ubiquinone oxidoreductase subunit A9 (NDUFA9, respiratory complex I), succinate dehydrogenase complex iron sulfur subunit B (SDHB; complex II), cytochrome C Oxidase assembly factor heme A:farnesyltransferase (COX10, complex IV), mitochondrial ATP synthetase (ATP5A1; complex V), mitochondrial pyruvate carrier (MPC)-1, or carnitine palmitoyltransferase 1A (CPT-1A). Nevertheless, NDUFA9 and SDHB were upregulated in TM compared to TE cells, independent of CCR5 status. Thus, the absence of CCR5 does not alter mitochondrial activity in CD4+ T cells.
Whether CCR5 affects the glycolytic pathway was next studied, measuring the extracellular acidification rate (ECAR). CCR5 affected none of the glycolytic variables measured in TE cells (Supplementary Figure S5), i.e., no significant differences were found between WT and CCR5-/- CD4+ TE cells in their glycolytic rate (ECAR after the addition of saturating amounts of glucose), glycolytic capacity (maximum ECAR after oligomycin-induced OXPHOS inhibition) or glycolytic reserve (the capacity to respond to an energetic demand). In contrast, CCR5-/- TM cells showed a significant increase in all the glycolytic variables measured compared to their WT counterparts (Figures 1B–E). This suggests that CCR5 signals restrain the glycolytic activity of TM cells.
Although extracellular acidification is mainly driven by glycolytic activity, it can also be the consequence of other metabolic processes, such as the production of CO2 by the tricarboxylic acid (TCA) cycle. The relative contribution of glycolysis and the TCA cycle activity to ECAR was therefore measured using the glycolytic rate assay. This assay determines the glycolytic proton efflux rate (glycoPER), which represents acidification due solely to glycolysis. Both the WT and CCR5-/- TE cells showed comparable glycoPER values under untreated conditions (basal glycolysis), and after the addition of rotenone/antimycin A to inhibit mitochondrial activity (compensatory glycolysis; Supplementary Figure S6). However, the values recorded for both basal and compensatory glycolysis were significantly higher in CCR5-/- than in CCR5-proficient TM cells (Figures 2A–C). Further, CCR5 deficiency in TM cells caused a significant reduction in OXPHOS/glycolytic activity (i.e., the mitoOCR/glycoPER ratio) compared to the WT TM cells (Figure 2D). Indeed, whereas the WT TM cells showed a higher mitoOCR/glycoPER ratio than did the WT TE cells, the CCR5-/- TM and TE cells showed comparable mitoOCR/glycoPER ratios (Figure 2D). Together, these results indicate that the metabolic switch associated with CD4+ TM cell formation is impaired in CCR5-/- cells due to their enhanced glycolytic metabolism.
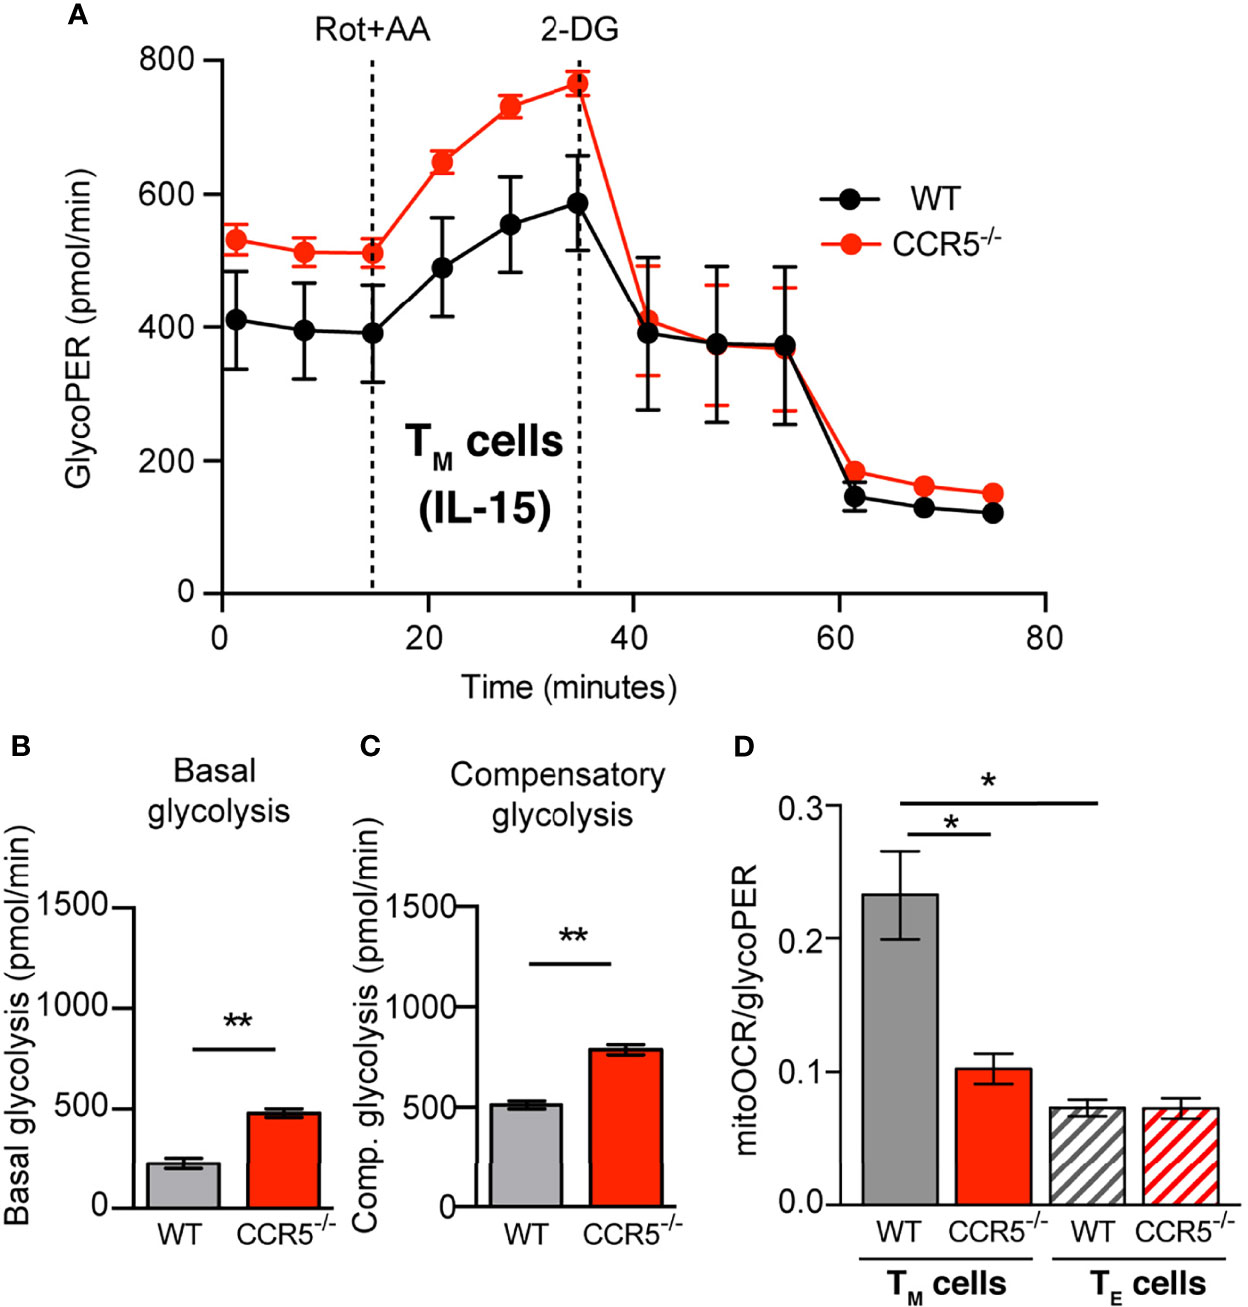
Figure 2 CCR5 deficiency prompts glycolytic metabolism over OXPHOS in memory CD4+ T cells. (A) GlycoPER profiles in WT and CCR5-/- TM cells under basal condition (non-buffered XF assay medium pH 7.4, containing 25 mM glucose and 2 mM glutamine 1 mM sodium pyruvate, in the absence of CO2), and following addition of rotenone/antimycin A (Rot+AA) and 2-DG. (B, C) Basal glycolysis (B) and compensatory glycolysis (C) determined from profiles as in (A). (D) Basal mitoOCR/glycoPER ratio in WT and CCR5-/- TM (solid bars) and TE (hatched bars) cells. Data are means ± SEM (n≥9 from three independent experiments). **p < 0.01, *p < 0.05, two-tailed Student t test (B, C), or two-way ANOVA with Bonferroni post-hoc test (D).
Given that the CCR5-/- TM cells were substantially more glycolytic than CCR5-proficient cells, a detailed inspection was made of the different elements involved in the glycolytic route. Glucose internalization in WT and CCR5-/- TE and TM cells was examined using 2-DG as a probe, and an increased uptake of glucose was seen in the TE cells but of both backgrounds. This is consistent with the reduced glycolysis seen in the TM compared to the TE cells. Nonetheless, differences in 2-DG internalization were not associated with CCR5 expression (Figure 3A).
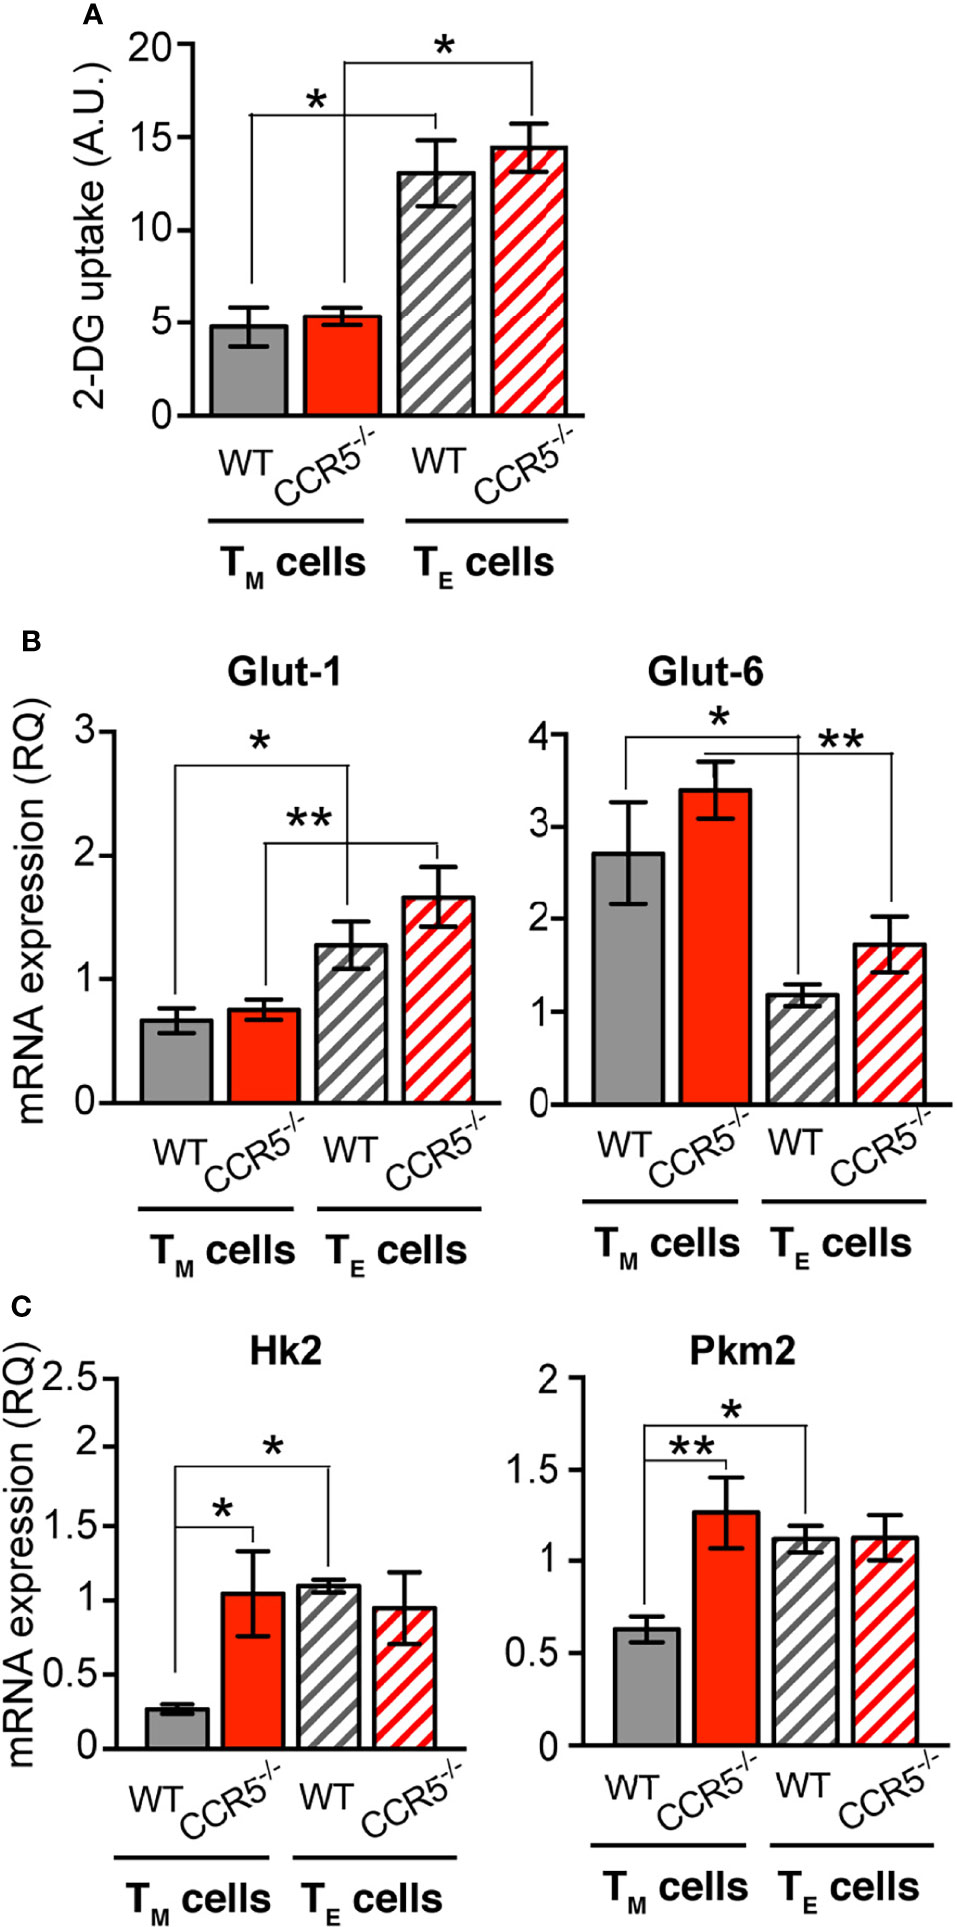
Figure 3 CCR5 regulates glucose uptake and rate-limiting glycolytic enzymes specifically in CD4+ TM cells. (A) Determination of 2-DG uptake in WT and CCR5-/- TM (solid bars) and TE (hatched bars) cells (n=3). (B, C) Relative mRNA expression of the glucose transporters Glut-1 and Glut-6 (B), and the glycolytic enzymes Hk2 and Pkm2 (C) in WT and CCR5-/- TM and TE lymphoblasts (n=12). Data are means ± SEM. **p < 0.01, *p < 0.05, two-way ANOVA with Bonferroni post-hoc test.
The expression of glucose transporters was also determined at the mRNA level. Glut-1, Glut-3, Glut-6 and Glut-8 mRNA were detected in WT and CCR5-/- TE and TM cells. Glut-1 and Glut-6 mRNAs were differentially expressed between TE and TM cells, independent of their WT or CCR5-/- genetic background (Figure 3B). The mRNA levels for Glut-3 and Glut-8 were associated with no remarkable differences between the cells of any type (Supplementary Figure S7A). Collectively, these results indicate that CCR5 does not affect the expression of glucose transporters, which is consistent with the lack of difference seen in glucose uptake between the WT and CCR5-/- cells.
To study how CCR5 expression regulates the glycolytic flow in TM cells, mRNA levels were determined in WT and CCR5-/- TE and TM cells for enzymes proposed to be rate-limiting in the glycolytic cascade: hexokinase 2 (HK2) and isoform M2 of pyruvate kinase (PKM2) (38). In addition, the relative expression of glyceraldehyde-3-phosphate dehydrogenase (GAPDH) and lactate dehydrogenase (LDHA) was determined. The mRNA levels for HK2 and PKM2 were significantly upregulated in CCR5-/- CD4+ TM cells compared to their WT counterparts, but both enzymes were equally expressed in CCR5-/- and WT TE cells (Figure 3C). Moreover, both HK2 and PKM2 mRNA levels were higher in the WT TE than in the WT TM cells (Figure 3C), confirming the existence of the TE/TM metabolic switchover. The expressions of GAPDH and LDHA were not affected by CCR5 status in either the TE and TM cells (Supplementary Figure S7B). These results indicate that CCR5 activity in TM cells affects the regulation of key glycolytic enzymes, explaining the glycolytic differences observed between CCR5-proficient and -deficient TM cells.
The mechanism behind the deregulation of glycolysis in CCR5-/- TM cells was next investigated. Since glycolysis is not affected by CCR5 in TE cells, it was reasoned that the glycolytic differences between in CCR5-/- and WT CD4+ TM cells might be associated with the different cytokines used in TE and TM cell differentiation. Bcl-6 is a transcriptional repressor of genes involved in glycolysis, the expression of which is increased in CD4+ T cells cultured under low IL-2 concentrations (21). In agreement with published data, Bcl-6 protein was very low in IL-2-differentiated TE cells, independent of the CCR5 genotype (Figures 4A–E). In contrast, Bcl-6 was clearly upregulated in the WT TM cells but remained low in the CCR5-/- TM cells, both by flow cytometry and immunoblotting (Figures 4A–E). In agreement with the protein data, Bcl-6 mRNA levels were also significantly higher in the WT than in the CCR5-/- TM cells (Figure 4F), whereas no differences were seen between the WT and CCR5-/- TE cells. These results suggest that CCR5 deficiency downregulates Bcl-6 expression at the transcriptional and translational level.
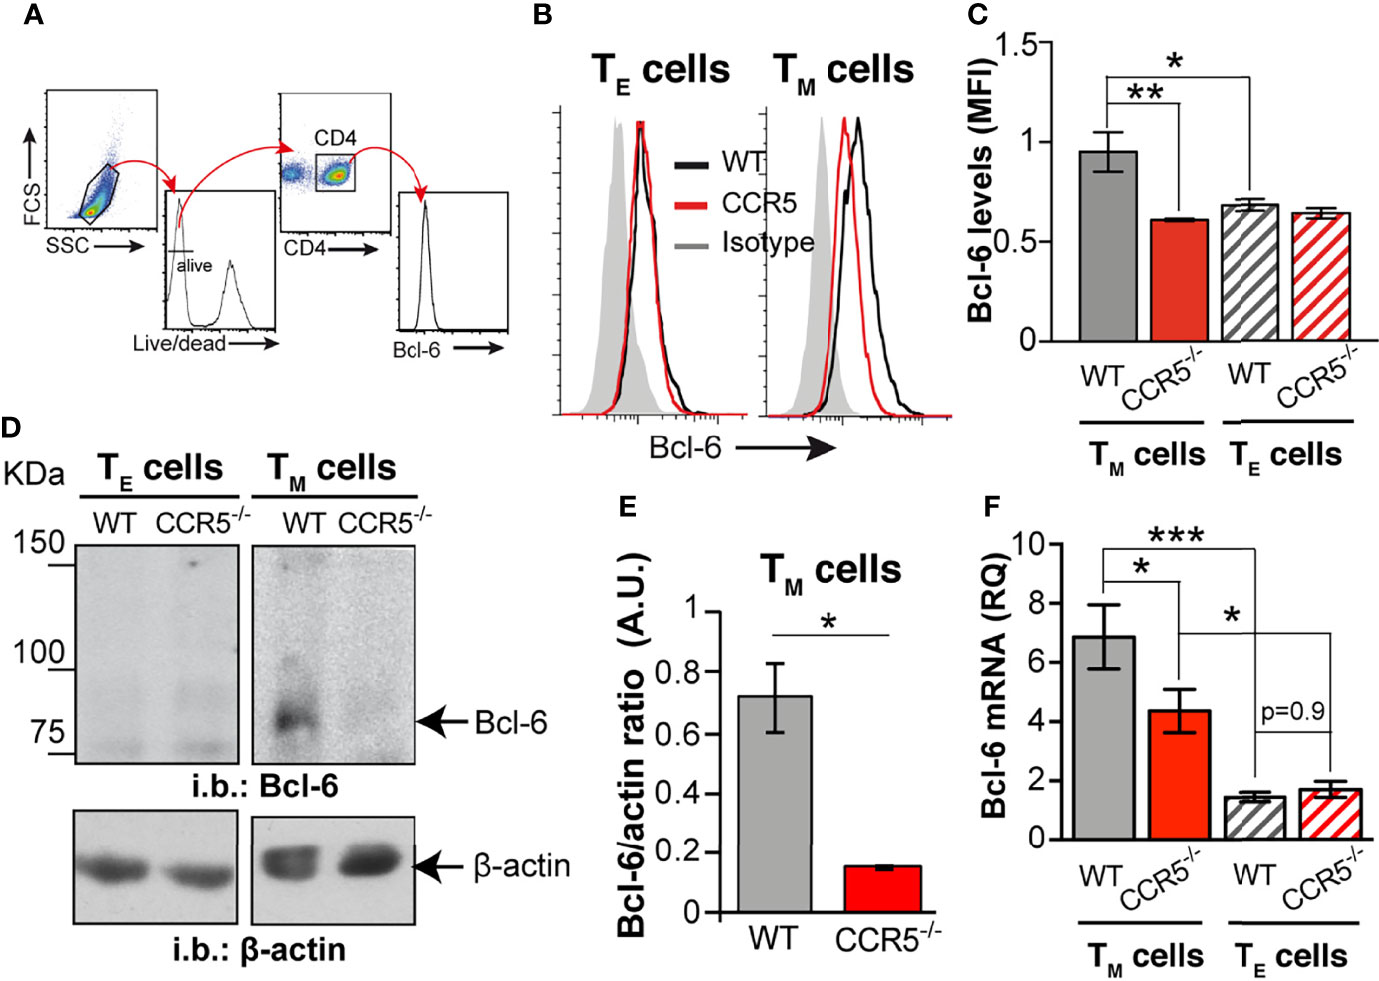
Figure 4 CCR5 deficiency downregulates the glycolytic repressor Bcl-6 in CD4+ TM cells. (A) Gating strategy for determination of relative Bcl-6 levels by flow cytometry. (B) Representative histograms for Bcl-6 levels in WT (black lines) and CCR5-/- (red lines) TE (left) and TM (right) cells; the isotype control histogram is also shown (gray). (C) Quantification of the mean fluorescent intensity (MFI) for Bcl-6 staining in WT and CCR5-/- TE (hatched bars) and TM (solid bars) cells (n=3) (D). Representative immunoblots of Bcl-6 and β-actin (loading control) in total cell extracts from WT and CCR5-/- TE and TM cells (n=3). (E) Bcl-6: β-actin densitometry ratio from immunoblots as in (A). (F) Relative expression of Bcl-6 mRNA in WT and CCR5-/- TE (hatched bars) and TM (solid bars) cells (n=12). Data are means ± SEM. ***p < 0.001, **p < 0.01 *p < 0.05, two-tailed Student t test (E), or two-way ANOVA with Bonferroni post-hoc test (C, F).
Finally, experiments were performed to see whether the metabolic changes driven by CCR5 affect the nanoscopic organization of the TCR in CD4+ T cells, a process in which CCR5 signaling is also determinant (6). Electron microscopy (EM) was used to analyze surface replicas of antigen-experienced OT-II WT and CCR5-/- CD4+ lymphoblasts after labeling with anti-CD3ϵ antibody and 10 nm gold-conjugated protein A. In agreement with earlier findings (6), TCR nanoclustering was reduced in CCR5-/- compared to WT lymphoblasts (Figure 5A). The percentage of monovalent TCRs was significantly higher among CCR5-/- than WT lymphoblasts, whereas the percentage of TCR nanoclusters larger than four TCR molecules was higher in WT than in CCR5-/- cells. To determine if the TCR nanoclustering differences could be ascribed to the enhanced glycolytic activity of CCR5-/- lymphoblasts, TCR organization was analyzed in CCR5-/- lymphoblasts cultured for one day in the presence of the glycolytic inhibitor 2-deoxyglucose (2-DG). 2-DG significantly increased TCR nanocluster number and size in CCR5-/- lymphoblasts, whereas the percentage of monovalent TCRs was drastically reduced (Figure 5B). These results suggest that the inhibition of the glycolytic pathway is important in the formation of TCR nanoclusters in antigen-experienced T cells.
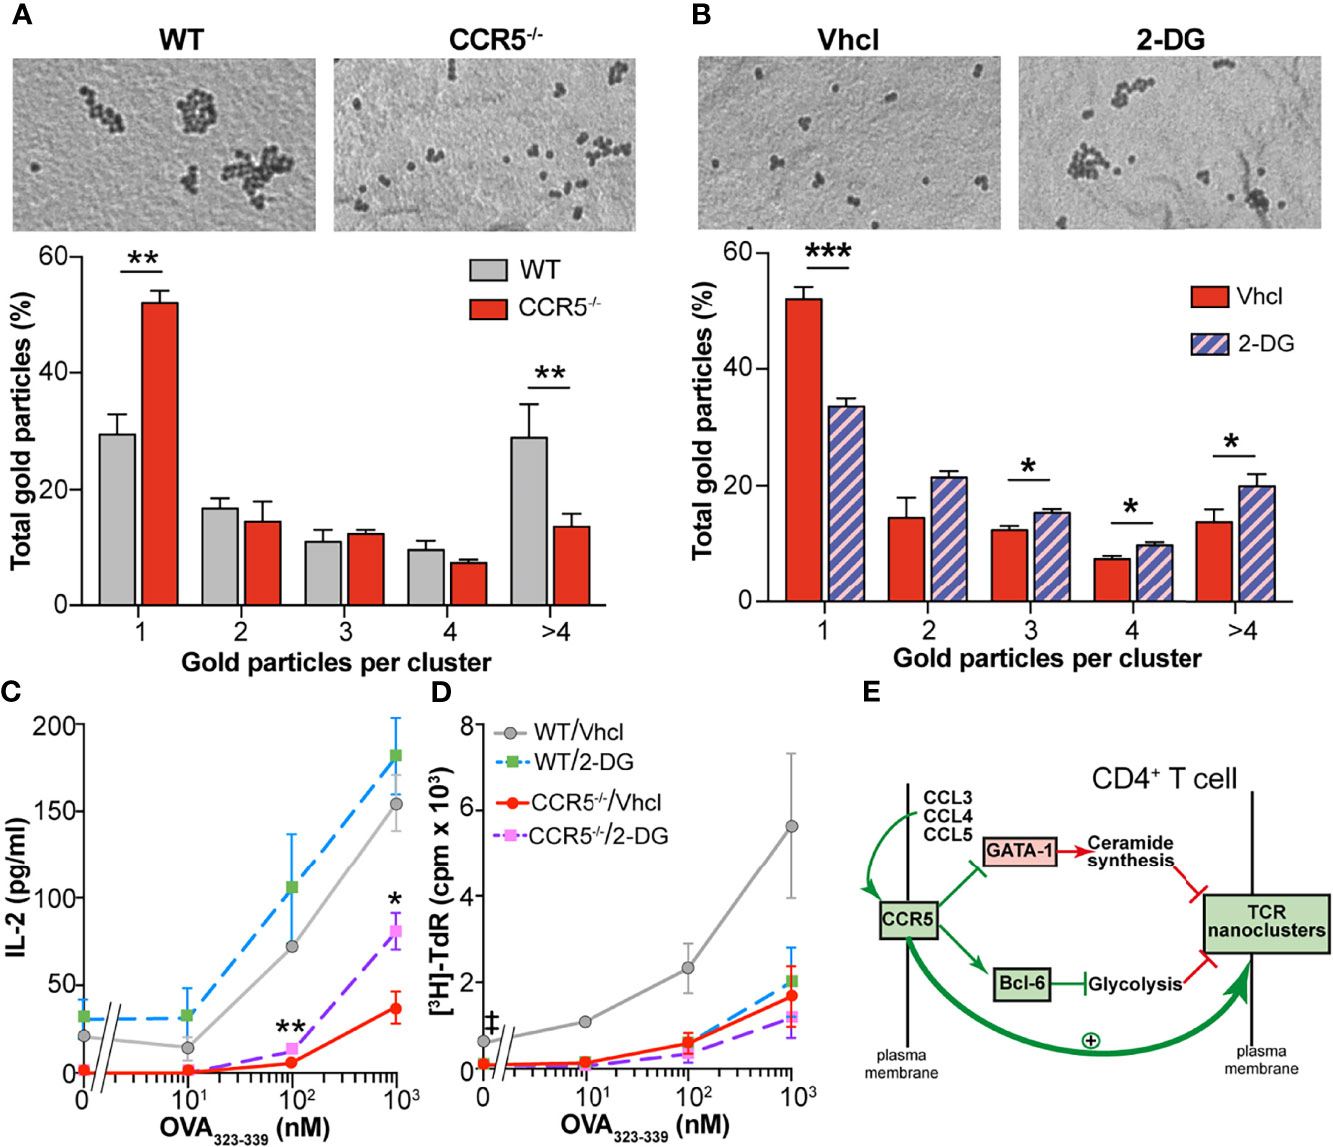
Figure 5 Inhibition of glycolysis increases TCR nanoclustering in CCR5-/- cells. (A) Analysis of TCR nanoclustering by EM in OT-II WT and CCR5-/- lymphoblasts (WT, n=5 cells, 11,339 particles; CCR5-/-, n=5 cells, 9,347 particles). Top: A representative small field image shows gold particle distribution in the cell surface replicas of anti-CD3ϵ-labeled cells. Bottom: quantification (means ± SEM) of gold particles in clusters of the indicated size in WT (gray) and CCR5-/- cells (red). (B) OT-II CCR5-/- lymphoblasts were expanded in the presence of IL-2 (see Figure 1A), and incubated with the glycolysis inhibitor 2-DG over the last 24 h of expansion (day 7). Lymphoblast surface replicas were stained with anti-CD3ϵ and TCR nanoclustering analyzed by EM. Top: representative small field images show gold particle distribution in the cell surface replicas. Bottom: quantification (means ± SEM) of gold particles in clusters of the indicated size in vehicle- (solid red; n=5, 9,347 particles) and 2-DG-treated cells (hatched violet; n=5, 11,993 particles). Data are means ± SEM. ***p < 0.001, **p < 0.01, *p < 0.05 one-tailed Student t test (A, B). (C, D) OT-II WT and CCR5-/- lymphoblasts were incubated with 2-DG over the last 24 h of expansion, washed extensively to remove the inhibitor, and then co-cultured with irradiated splenocytes previously loaded with the OVA323-339 peptide. IL-2 (C) and cell proliferation (D) were determined after 24 h of re-stimulation- Data are means ± SEM (n=3). **p<0.01, *p<0.05 (for comparisons between Vhcl- and 2-DG-treated CCR5-/- cells), ‡p < 0.05 (for comparisons between Vhcl- and 2-DG-treated WT cells); two-tailed Student t test with Holm-Sidak correction for multiple comparisons. (E) Model proposed for the regulation of TCR nanoclustering by CCR5. It is here proposed that autocrine/paracrine activation of CCR5 fosters TCR nanoclustering by triggering two independent signals in CD4+ TM cells: (i) the inhibition of GATA-1 translocation into the nucleus, and (ii) the stabilization of the glycolytic repressor Bcl-6. More details are available in the text.
The valency of TCR nanoclusters has been related to their sensitivity to antigenic stimulation (5, 6). Given that glycolysis inhibition with 2-DG increased the valency of TCR nanoclusters in CCR5-/- lymphoblasts, tests were made to determine whether 2-DG would increase their antigenic re-stimulation. OT-II WT and CCR5-/- lymphoblasts were incubated for 24 h with 2-DG, and the inhibitor then removed before co-incubation with irradiated splenocytes pre-loaded with different doses of the OVA323-339 peptide. Since glycolysis activation is required for complete T cell activation (14–17), IL-2 production and T cell proliferation were analyzed shortly after re-stimulation. IL-2 production was seen to increase significantly in the 2-DG-treated CCR5-/- lymphoblasts compared to controls in an antigen dose-dependent manner (Figure 5C). A similar trend (i.e., not significant) towards enhanced IL-2 production was observed in the 2-DG-treated WT lymphoblasts. In contrast, 2-DG treatment tended to inhibit WT and CCR5-/- lymphoblast proliferation at all antigen doses (Figure 5D), suggesting that 2-DG interferes with cell proliferation in an antigen- and CCR5-independent manner.
Long-term memory mediated by CD4+ T cells is central to the recall response of the adaptive immune system to antigens. CD4+ TM cells expand after antigen exposure and begin to make cytokines (which direct immune cell function), provide help in the B cell and CD8+ T cell responses, and directly exert effector functions (39, 40). A major characteristic of CD4+ TM cells is their ability to respond to lower doses of antigen and/or to reduced levels of co-stimulation compared to naive CD4+ T cells (41, 42). This enhanced antigenic sensitivity has been associated with the organization of the TCR into nanoclusters (5, 6) and to the onset of a bioenergetic program in which OXPHOS dominates over glycolysis (43). This work shows CCR5 to be a key regulator of both TCR nanoclustering and the TM cell metabolic program, revealing its importance in the maximization of CD4+ TM immune responses (6).
CCR5 deficiency in mice and humans (homozygous carriers for the ccr5Δ32 polymorphism) causes no significant change in the frequency of the different CD4+ TM cell subtypes either in the periphery or in the secondary lymphoid organs. However, the functionality of CCR5-deficient TM cells is lessened, as demonstrated by the reduced expression of cytokines after re-stimulation, or their impaired helper function in the B cell-mediated humoral response (6). This functional deficit is linked to an enrichment of long-chain ceramides in the membrane of antigen-experienced CCR5-/- cells, caused by the increased GATA-1-induced expression of specific ceramide synthases. High levels of ceramides most likely rigidify the plasma membrane, which interferes with TCR nanoclustering and, hence, the ability to respond to low doses of antigen and/or co-stimulation. Here, we show that CCR5-/- TM cells also experience an aberrant increase in glycolysis compared to CCR5-proficient cells. The OXPHOS/glycolytic ratio in the former is reduced, altering the bioenergetic program associated with TM cell differentiation. Importantly, the inhibition of glycolysis increased TCR nanoclustering in antigen-experienced CCR5-/- cells, suggesting a link between high glycolytic activity and reduced TCR nanoclustering. We therefore propose that autocrine/paracrine stimulation of CCR5 enhances TCR nanoclustering in CD4+ TM cells through two signals (Figure 5E): (i) the reduction of GATA-1 translocation to the nucleus, which restrains the expression of enzymes involved in ceramide biosynthesis (a negative signal for TCR nanoclustering), and (ii) the stabilization of the repressor Bcl-6, which dampens the expression of rate-limiting enzymes for glycolysis (here detected as a negative signal for TCR nanoclustering).
The inhibition of glycolysis seems to be important for the generation of long-lived CD8+ TM cells (19, 20), but it also has a negative impact on CD4+ and CD8+ T cell activation (14–17). This renders it counterintuitive to associate the increased TCR nanoclustering induced by 2-DG treatment in CCR5-/- lymphoblasts with increased sensitivity upon antigen recall. We nonetheless addressed this experimentally by limiting the 2-DG treatment time (to enhance TCR nanoclustering prior to antigen recall), and by analyzing lymphoblast re-stimulation shortly after antigen exposure. This strategy revealed the enhanced production of IL-2 in 2-DG-treated compared to control (vehicle-treated) re-stimulated CCR5-/- lymphoblasts. This occurred in an antigen-dose-dependent manner, suggesting increased antigenic sensitivity in the 2-DG-treated lymphoblasts. The 2-DG treatment also increased IL-2 production in re-stimulated WT lymphoblasts, although the effect was less notable, probably because CCR5 signals already attenuate glycolysis in these cells. In contrast to IL-2, 2-DG treatment impaired WT and CCR5-/- lymphoblast proliferation, another effect of antigenic re-stimulation. The discrepancy between IL-2 and proliferation results might indicate that glycolysis is essential for the generation of the biomass necessary for cell division, but not for the initial TCR-induced signaling involved in IL-2 transcription - at least at the time point analyzed. More studies are needed to confirm this.
The present results suggest that the functional link between CCR5 and Bcl-6 is central for the inhibition of glycolysis in CD4+ TM cells. Bcl-6 expression is repressed when IL-2 signaling is elevated (21). Since IL-2 signaling is limited in the TM cell differentiation conditions (driven by IL-15), it is coherent that Bcl-6 levels should be higher in TM than in TE cells, but curiously, this only occurred in CCR5-proficient TM cells. Previous studies have reported no difference in IL-2 expression between CCR5-/- and WT TM lymphoblasts; indeed, IL-2 expression is reduced in antigen-experienced CCR5-/- cells after re-stimulation ( (6) and this study). It is therefore unlikely that the low Bcl-6 levels in CCR5-/- TM lymphoblasts should be a consequence of negative signals provided by autocrine IL-2 production.
How CCR5 signaling induces and/or stabilizes Bcl-6 levels deserves investigation. STAT3 deletion in CD8+ T cells reduces Bcl-6 expression during the transition of effector to memory cells (44), and low Bcl-6 levels and impaired TM cell function have been found in humans with dominant-negative STAT3 mutations (45). Since CCR5 triggers STAT signaling (28), CCR5-proficient TM cells might increase Bcl-6 mRNA levels through a STAT3 pathway not operative in CCR5-deficient cells. Nevertheless, preliminary experiments have shown no major differences in phospho-STAT3 levels between WT and CCR5-/- TM cells (data not shown).
An intriguing point is that the enhanced glycolysis of CCR5-/- TM cells is not associated with any increased glucose uptake. Whereas the TE and TM lymphoblasts showed clear divergence in their 2-DG uptake and the expression of some glucose transporters, these differences were independent of CCR5 expression. The upregulation of HK2 and PKM2 might explain the increased glycolytic flow in CCR5-/- TM cells while having no effect on glucose transporter expression. Glucose uptake in lymphocytes might occur by facilitated diffusion through GLUT transporters following a concentration gradient (46). HK2 catalyzes the rate-limiting phosphorylation of glucose to glucose-6-phosphate, which not only provides the initial substrate for glycolysis but removes glucose from equilibrium, favoring its continued diffusion through GLUTs. Pyruvate kinases catalyze the irreversible transphosphorylation between phosphoenolpyruvate and adenosine diphosphate to form pyruvate, another rate-limiting step in glycolysis. There are several isoforms expressed in mammals, which differ in terms of substrate affinity and catalytic efficiency (47). PKM2 is upregulated in cells with a high anabolic profile since its dimeric form is less active. This not only leads to the accumulation of glycolytic intermediates and their diversion to other biosynthetic pathways, but also to the reduced import of pyruvate into the mitochondria.
In summary, CCR5 signaling appears to be a key regulator of glycolytic metabolism specifically in CD4+ TM cells. Mechanistically this regulatory activity relies on the stabilization of the glycolytic repressor Bcl-6, which controls the expression of rate-limiting glycolytic enzymes. More important is the observation that the inhibition of glycolysis enhances the valency and frequency of TCR nanoclusters, a factor determining the re-stimulation response of CD4+ TM cells to low doses of antigen (6). By hampering the glycolytic pathway and modulating ceramide biosynthesis, CCR5 may foster TCR nanoclustering in CD4+ TM cells, making them more efficient in responding to antigen re-exposure. In humans, ccr5Δ32 homozygosity, which leads to functional CCR5 deficiency, does not cause immunodeficiency but is linked to a greater probability of certain pathogens, including influenza (48), causing fatal infections. Interestingly, CD4+ TM cell function seems to be very important in the protective response against these pathogens (40, 49). Thus, CCR5 might decisively maximize CD4+ TM cell responses by inhibiting glycolytic metabolism, and increase antigenic sensitivity through the induction of TCR nanoclustering.
The raw data supporting the conclusions of this article will be made available by the authors, without undue reservation.
The animal study was reviewed and approved by CNB and the Comunidad de Madrid (PROEX 277/14; PROEX 090/19).
SM and RB conceived the study.RB, MGdC and RAL designed the metabolic experiments. AM-L performed EM analyses. RB and LR-G performed most of the experiments and interpreted the data. AG-M contributed materials and technical support. ARdM contributed ideas and technical support. SM and RB wrote the manuscript. All authors read, discussed and edited the manuscript. All authors contributed to the article and approved the submitted version.
This research was funded by the Spanish Ministerio de Economía y Competitividad (SAF2017–83732-R to SM), the projects PID2020-116303RB-I00/MCIN/AEI/10.13039/501100011033 (to SM) and PID2019-110183RB-C21/MCIN/AEI/10.13039/501100011033 (to AR), the Comunidad de Madrid (B2017/BMD-3733/IMMUNOTHERCAN-CM to SM; P2018/BAA-4343-ALIBIRD2020-CM to AR), and the Merck-Salud Foundation (to SM). AM-L was a recipient of the Formación del Personal Universitario predoctoral fellowship from the Spanish Ministry of Education (FPU13/04430).
The authors declare that the research was conducted in the absence of any commercial or financial relationships that could be construed as a potential conflict of interest.
All claims expressed in this article are solely those of the authors and do not necessarily represent those of their affiliated organizations, or those of the publisher, the editors and the reviewers. Any product that may be evaluated in this article, or claim that may be made by its manufacturer, is not guaranteed or endorsed by the publisher.
We thank D. Sancho (CNIC) for providing reagents, RM Peregil (CNB) for technical assistance, MC Moreno and M.A. Sánchez for flow cytometry services (CNB), and MT Rejas and M Guerra for assistance with EM (CBM-SO).
The Supplementary Material for this article can be found online at: https://www.frontiersin.org/articles/10.3389/fimmu.2021.722320/full#supplementary-material
1. Luqman M, Bottomly K. Activation Requirements for CD4+ T Cells Differing in CD45R Expression. J Immunol (1992) 149:2300–6.
2. Lillemeier BF, Mortelmaier MA, Forstner MB, Huppa JB, Groves JT, Davis MM. TCR and Lat Are Expressed on Separate Protein Islands on T Cell Membranes and Concatenate During Activation. Nat Immunol (2010) 11:90–6. doi: 10.1038/ni.1832
3. Schamel WW, Arechaga I, Risueño RM, van Santen HM, Cabezas P, Risco C, et al. Coexistence of Multivalent and Monovalent TCRs Explains High Sensitivity and Wide Range of Response. J Exp Med (2005) 202:493–503. doi: 10.1084/jem.20042155
4. Schamel WW, Alarcon B, Minguet S. The TCR Is an Allosterically Regulated Macromolecular Machinery Changing Its Conformation While Working. Immunol Rev (2019) 291:8–25. doi: 10.1111/imr.12788
5. Kumar R, Ferez M, Swamy M, Arechaga I, Rejas MT, Valpuesta JM, et al. Increased Sensitivity of Antigen-Experienced T Cells Through the Enrichment of Oligomeric T Cell Receptor Complexes. Immunity (2011) 35:375–87. doi: 10.1016/j.immuni.2011.08.010
6. Martín-Leal A, Blanco R, Casas J, Sáez ME, Rodríguez-Bovolenta E, Rojas I, et al. CCR5 Deficiency Impairs CD4+ T-Cell Memory Responses and Antigenic Sensitivity Through Increased Ceramide Synthesis. EMBO J (2020) 39:e104749. doi: 10.15252/embj.2020104749
7. Martín-Blanco N, Blanco R, Alda-Catalinas C, Bovolenta ER, Oeste CL, Palmer E, et al. A Window of Opportunity for Cooperativity in the T Cell Receptor. Nat Commun (2018) 9:2618. doi: 10.1038/s41467-018-05050-6
8. Molnar E, Swamy M, Holzer M, Beck-Garcia K, Worch R, Thiele C, et al. Cholesterol and Sphingomyelin Drive Ligand-Independent T-Cell Antigen Receptor Nanoclustering. J Biol Chem (2012) 287:42664–74. doi: 10.1074/jbc.M112.386045
9. Beck-Garcia K, Beck-Garcia E, Bohler S, Zorzin C, Sezgin E, Levental I, et al. Nanoclusters of the Resting T Cell Antigen Receptor (TCR) Localize to Non-Raft Domains. Biochim Biophys Acta (2015) 1853:802–9. doi: 10.1016/j.bbamcr.2014.12.017
10. Wang F, Beck-Garcia K, Zorzin C, Schamel WW, Davis MM. Inhibition of T Cell Receptor Signaling By Cholesterol Sulfate, A Naturally Occurring Derivative of Membrane Cholesterol. Nat Immunol (2016) 17:844–50. doi: 10.1038/ni.3462
11. Buck MD, O’Sullivan D, Pearce EL. T Cell Metabolism Drives Immunity. J Exp Med (2015) 212:1345–60. doi: 10.1084/jem.20151159
12. Maciver NJ, Michalek RD, Rathmell JC. Metabolic Regulation of T Lymphocytes. Annu Rev Immunol (2013) 31:259–83. doi: 10.1146/annurev-immunol-032712-095956
13. Ohradanova-Repic A, Boes M, Stockinger H. Role of Metabolism in Regulating Immune Cell Fate Decisions. Front Immunol (2020) 11:527. doi: 10.3389/fimmu.2020.00527
14. Chang CH, Curtis JD, Maggi LB, Faubert B, Villarino AV, O’Sullivan D, et al. Posttranscriptional Control of T Cell Effector Function by Aerobic Glycolysis. Cell (2013) 153:1239. doi: 10.1016/j.cell.2013.05.016
15. Wang R, Dillon CP, Shi LZ, Milasta S, Carter R, Finkelstein D, et al. The Transcription Factor Myc Controls Metabolic Reprogramming Upon T Lymphocyte Activation. Immunity (2011) 35:871–82. doi: 10.1016/j.immuni.2011.09.021
16. Stark JM, Tibbitt CA, Coquet JM. The Metabolic Requirements of Th2 Cell Differentiation. Front Immunol (2019) 10:2318. doi: 10.3389/fimmu.2019.02318
17. De Oca MM, De Labastida Rivera F, Winterford C, Frame TCM, Ng SS, Amante FH, et al. IL-27 Signalling Regulates Glycolysis in Th1 Cells to Limit Immunopathology During Infection. PloS Pathog (2020) 16:e1008994. doi: 10.1371/journal.ppat.1008994
18. O’Sullivan D, van derWindt GWJ, Huang SCC, Curtis JD, Chang CH, Buck MDL, et al. Memory CD8+ T Cells Use Cell-Intrinsic Lipolysis to Support the Metabolic Programming Necessary for Development. Immunity (2014) 41:75–88. doi: 10.1016/j.immuni.2014.06.005
19. Sukumar M, Liu J, Ji Y, Subramanian M, Crompton JG, Yu Z, et al. Inhibiting Glycolytic Metabolism Enhances CD8+ T Cell Memory and Antitumor Function. J Clin Invest (2013) 123:4479–88. doi: 10.1172/JCI69589
20. Man K, Kallies A. Synchronizing Transcriptional Control of T Cell Metabolism and Function. Nat Rev Immunol (2015) 15:574–84. doi: 10.1038/nri3874
21. Oestreich KJ, Read KA, Gilbertson SE, Hough KP, McDonald PW, Krishnamoorthy V, et al. Bcl-6 Directly Represses the Gene Program of the Glycolysis Pathway. Nat Immunol (2014) 15:957–64. doi: 10.1038/ni.2985
22. Zhang J, Bi G, Xia Y, Li P, Deng X, Wei Z, et al. Transcriptional Regulation of T Cell Metabolism Reprograming. In: Advances in Experimental Medicine and Biology. New York LLC: Springer. (2017). 131–52. doi: 10.1007/978-94-024-1170-6_3
23. Buck MDD, O’Sullivan D, Klein Geltink R II, Curtis JDD, Chang CH, Sanin DEE, et al. Mitochondrial Dynamics Controls T Cell Fate Through Metabolic Programming. Cell (2016) 166:63–76. doi: 10.1016/j.cell.2016.05.035
24. Sena LA, Li S, Jairaman A, Prakriya M, Ezponda T, Hildeman DA, et al. Mitochondria Are Required for Antigen-Specific T Cell Activation Through Reactive Oxygen Species Signaling. Immunity (2013) 38:225–36. doi: 10.1016/j.immuni.2012.10.020
25. Li W, Zhang L. Rewiring Mitochondrial Metabolism for CD8+ T Cell Memory Formation and Effective Cancer Immunotherapy. Front Immunol (2020) 11:1834. doi: 10.3389/fimmu.2020.01834
26. Ogando J, Saéz ME, Santos J, Nuevo-Tapioles C, Gut M, Esteve-Codina A, et al. PD-1 Signaling Affects Cristae Morphology and Leads to Mitochondrial Dysfunction In Human CD8+ T Lymphocytes. J Immunother Cancer (2019) 7:151. doi: 10.1186/s40425-019-0628-7
27. Paik S, Jo EK. An Interplay Between Autophagy and Immunometabolism for Host Defense Against Mycobacterial Infection. Front Immunol (2020) 11:603951. doi: 10.3389/fimmu.2020.603951
28. Lacalle RA, Blanco R, Carmona-Rodríguez L, Martín-Leal A, Mira E, Mañes S. Chemokine Receptor Signaling and the Hallmarks of Cancer. Int Rev Cell Mol Biol (2017) 331:181–244. doi: 10.1016/bs.ircmb.2016.09.011
29. Matti C, Legler DF. CCR5 Deficiency/CCR5Δ32: Resistant to HIV Infection at the Cost of Curtailed CD4+ T Cell Memory Responses. EMBO J (2020) 39:e105854. doi: 10.15252/embj.2020105854
30. Molon B, Gri G, Bettella M, Gomez-Moutón C, Lanzavecchia A, Martinez AC, et al. T Cell Costimulation by Chemokine Receptors. Nat Immunol (2005) 6:465–71. doi: 10.1038/ni1191
31. González-Martín A, Gómez L, Lustgarten J, Mira E, Mañes S. Maximal T Cell-Mediated Antitumor Responses Rely Upon CCR5 Expression in Both CD4(+) and CD8(+) T Cells. Cancer Res (2011) 71:5455–66. doi: 10.1158/0008-5472.CAN-11-1687
32. Floto RA, MacAry PA, Boname JM, Mien TS, Kampmann B, Hair JR, et al. Dendritic Cell Stimulation by Mycobacterial Hsp70 Is Mediated Through Ccr5. Science (2006) 314:454–8. doi: 10.1126/science.1133515
33. Franciszkiewicz K, Le Floc’h A, Jalil A, Vigant F, Robert T, Vergnon I, et al. Intratumoral Induction of CD103 Triggers Tumor-Specific CTL Function and CCR5-Dependent T-Cell Retention. Cancer Res (2009) 69:6249–55. doi: 10.1158/0008-5472.CAN-08-3571
34. Camargo JF, Quiñones MP, Mummidi S, Srinivas S, Gaitan AA, Begum K, et al. CCR5 Expression Levels Influence NFAT Translocation, IL-2 Production, and Subsequent Signaling Events During T Lymphocyte Activation. J Immunol (2009) 182:171–82. doi: 10.4049/jimmunol.182.1.171
35. Choi WT, An J. Biology and Clinical Relevance of Chemokines and Chemokine Receptors CXCR4 and CCR5 in Human Diseases. Exp Biol Med (2011) 236:637–47. doi: 10.1258/ebm.2011.010389
36. Chan O, Burke JD, Gao DF, Fish EN. The Chemokine CCL5 Regulates Glucose Uptake and AMP Kinase Signaling in Activated T Cells to Facilitate Chemotaxis. J Biol Chem (2012) 287:29406–16. doi: 10.1074/jbc.M112.348946
37. Taub DD, Hesdorffer CS, Ferrucci L, Madara K, Schwartz JB, Goetzl EJ. Distinct Energy Requirements for Human Memory CD4 T-Cell Homeostatic Functions. FASEB J (2013) 27:342–9. doi: 10.1096/fj.12-217620
38. Soto-Heredero G, Gómez de las Heras MM, Gabandé-Rodríguez E, Oller J, Mittelbrunn M. Glycolysis – A Key Player in the Inflammatory Response. FEBS J (2020) 287:3350–69. doi: 10.1111/febs.15327
39. MacLeod MKL, Clambey ET, Kappler JW, Marrack P. CD4 Memory T Cells: What Are They and What Can They Do? Semin Immunol (2009) 21:53–61. doi: 10.1016/j.smim.2009.02.006
40. McKinstry KK, Strutt TM, Kuang Y, Brown DM, Sell S, Dutton RW, et al. Memory CD4+ T Cells Protect Against Influenza Through Multiple Synergizing Mechanisms. J Clin Invest (2012) 122:2847–56. doi: 10.1172/JCI63689
41. Rogers PR, Dubey C, Swain SL. Qualitative Changes Accompany Memory T Cell Generation: Faster, More Effective Responses at Lower Doses of Antigen. J Immunol (2000) 164:2338–46. doi: 10.4049/jimmunol.164.5.2338
42. London CA, Lodge MP, Abbas AK. Functional Responses and Costimulator Dependence of Memory CD4+ T Cells. J Immunol (2000) 164:265–72. doi: 10.4049/jimmunol.164.1.265
43. Van Der Windt GJW, O’Sullivan D, Everts B, Huang SCC, Buck MD, Curtis JD, et al. CD8 Memory T Cells Have a Bioenergetic Advantage That Underlies Their Rapid Recall Ability. Proc Natl Acad Sci USA (2013) 110:14336–41. doi: 10.1073/pnas.1221740110
44. Cui W, Liu Y, Weinstein JS, Craft J, Kaech SM. An Interleukin-21- Interleukin-10-STAT3 Pathway Is Critical for Functional Maturation of Memory CD8+ T Cells. Immunity (2011) 35:792–805. doi: 10.1016/j.immuni.2011.09.017
45. Siegel AM, Heimall J, Freeman AF, Hsu AP, Brittain E, Brenchley JM, et al. A Critical Role for STAT3 Transcription Factor Signaling in the Development and Maintenance of Human T Cell Memory. Immunity (2011) 35:806–18. doi: 10.1016/j.immuni.2011.09.016
46. Marko AJ, Miller RA, Kelman A, Frauwirth KA. Induction of Glucose Metabolism in Stimulated T Lymphocytes Is Regulated by Mitogen-Activated Protein Kinase Signaling. PloS One (2010) 5:e15425. doi: 10.1371/journal.pone.0015425
47. Ruiz-Iglesias A, Mañes S. The Importance of Mitochondrial Pyruvate Carrier in Cancer Cell Metabolism and Tumorigenesis. Cancers (Basel) (2021) 13:1488. doi: 10.3390/cancers13071488
48. Falcon A, Cuevas MT, Rodriguez-Frandsen A, Reyes N, Pozo F, Moreno S, et al. CCR5 Deficiency Predisposes to Fatal Outcome in Influenza Virus Infection. J Gen Virol (2015) 96:2074–8. doi: 10.1099/vir.0.000165
Keywords: memory CD4+ T cells, efector CD4+ T cells, metabolic reprogramming, chemokine signaling, CCR5, BCL6, glycolysis
Citation: Blanco R, Gómez de Cedrón M, Gámez-Reche L, Martín-Leal A, González-Martín A, Lacalle RA, Ramírez de Molina A and Mañes S (2021) The Chemokine Receptor CCR5 Links Memory CD4+ T Cell Metabolism to T Cell Antigen Receptor Nanoclustering. Front. Immunol. 12:722320. doi: 10.3389/fimmu.2021.722320
Received: 08 June 2021; Accepted: 16 November 2021;
Published: 07 December 2021.
Edited by:
Brian S. Sheridan, Stony Brook University, United StatesReviewed by:
Eva Reali, University of Milano-Bicocca, ItalyCopyright © 2021 Blanco, Gómez de Cedrón, Gámez-Reche, Martín-Leal, González-Martín, Lacalle, Ramírez de Molina and Mañes. This is an open-access article distributed under the terms of the Creative Commons Attribution License (CC BY). The use, distribution or reproduction in other forums is permitted, provided the original author(s) and the copyright owner(s) are credited and that the original publication in this journal is cited, in accordance with accepted academic practice. No use, distribution or reproduction is permitted which does not comply with these terms.
*Correspondence: Santos Mañes, c21hbmVzQGNuYi5jc2ljLmVz; Raquel Blanco, cmFxdWVsLmJsYW5jb2ZAZ21haWwuY29t
†These authors share senior authorship
Disclaimer: All claims expressed in this article are solely those of the authors and do not necessarily represent those of their affiliated organizations, or those of the publisher, the editors and the reviewers. Any product that may be evaluated in this article or claim that may be made by its manufacturer is not guaranteed or endorsed by the publisher.
Research integrity at Frontiers
Learn more about the work of our research integrity team to safeguard the quality of each article we publish.