 Johanna F. Scheunemann1†
 Julia J. Reichwald1†
 Patricia Jebett Korir1†
 Janina M. Kuehlwein1
 Lea-Marie Jenster1
 Christiane Hammerschmidt-Kamper2Matthew D. Lewis2Katrin Klocke1
 Max Borsche1Kim E. Schwendt1Camille Soun3Stephanie Thiebes3
 Andreas Limmer4Daniel R. Engel3
 Ann-Kristin Mueller2,5Achim Hoerauf1,6
 Marc P. Hübner1,6*‡
 Beatrix Schumak1‡
- 1Institute for Medical Microbiology, Immunology and Parasitology, University Hospital Bonn, Bonn, Germany
- 2Parasitology Unit, Centre for Infectious Diseases, Heidelberg University Hospital, Heidelberg, Germany
- 3Institute for Experimental Immunology and Imaging, University Hospital Essen, Essen, Germany
- 4Clinic for Anesthesiology and Intensive Care, University Hospital Essen, Essen, Germany
- 5German Center for Infection Research (DZIF), Heidelberg, Germany
- 6German Center for Infection Research (DZIF), Partner Site Bonn-Cologne, Bonn, Germany
Cerebral malaria is a potentially lethal disease, which is caused by excessive inflammatory responses to Plasmodium parasites. Here we use a newly developed transgenic Plasmodium berghei ANKA (PbAAma1OVA) parasite that can be used to study parasite-specific T cell responses. Our present study demonstrates that Ifnar1-/- mice, which lack type I interferon receptor-dependent signaling, are protected from experimental cerebral malaria (ECM) when infected with this novel parasite. Although CD8+ T cell responses generated in the spleen are essential for the development of ECM, we measured comparable parasite-specific cytotoxic T cell responses in ECM-protected Ifnar1-/- mice and wild type mice suffering from ECM. Importantly, CD8+ T cells were increased in the spleens of ECM-protected Ifnar1-/- mice and the blood-brain-barrier remained intact. This was associated with elevated splenic levels of CCL5, a T cell and eosinophil chemotactic chemokine, which was mainly produced by eosinophils, and an increase in eosinophil numbers. Depletion of eosinophils enhanced CD8+ T cell infiltration into the brain and increased ECM induction in PbAAma1OVA-infected Ifnar1-/- mice. However, eosinophil-depletion did not reduce the CD8+ T cell population in the spleen or reduce splenic CCL5 concentrations. Our study demonstrates that eosinophils impact CD8+ T cell migration and proliferation during PbAAma1OVA-infection in Ifnar1-/- mice and thereby are contributing to the protection from ECM.
Introduction
Despite major elimination efforts, malaria is still one of the ten leading causes of death in developing countries, with over 400,000 annual deaths (1). Plasmodium falciparum is responsible for over 99% of malaria cases in Africa and can lead to serious complications such as cerebral malaria (CM) (1). This complication is mainly caused by inflammatory immune responses of the infected host to parasite-specific components and toxins (2, 3). Several experimental models are used to investigate the immune responses towards parasites such as infection of C57BL/6 mice with Plasmodium berghei ANKA. This model mirrors the situation in CM patients to a reasonable extent, including the breakdown of the blood-brain-barrier, and allows the study of Plasmodium blood-stage infection in a complete homeostatic system (2, 4–6). Several factors, like interferon gamma (IFN-γ), have been linked to severity of malaria in both mice and humans (7–12) and a fundamental role in the etiology of experimental cerebral malaria (ECM) has also been attributed to T cells activated in the spleen (4, 5, 13–17). However, IFN-γ and T cells are also important for parasite control. Furthermore, IFN-γ production at an early time point of infection has been correlated with protection in mice and humans, as macrophages activated by IFN-γ show enhanced phagocytosis to remove parasites (16, 18–21). Thus, the immune system has to maintain the balance of generating adequate immune responses against the parasite and preventing self-inflicted damage (16, 21).
The contribution of pro-inflammatory mediators, such as type I interferons (IFNs), in the immunopathology and regulation of immune responses towards infection with Plasmodium parasites is of major interest (22). The induction of type I IFNs upon Plasmodium infection in general (23) and P. berghei infection in particular was demonstrated already about 50 years ago and subsequently also in human malaria (4, 24–28). The in vivo relevance of type I IFNs during Plasmodium infection can be studied in mice that genetically lack a functional type I IFN receptor. This model allows to identify type I IFN-dependent protective mechanisms, which else is challenging due to the lack of reliable type I IFN-depletion methods. As with any genetically modified organism, immunological side effects have to be considered. Studies in genetically modified type I IFN receptor deficient mice have shown that type I IFNs aid protection by inhibiting parasite development but at the same time suppress humoral immunity during Plasmodium-infection, as well as T cell activation (29–32). CD4+ T cells are important for the differentiation of CD8+ effector T cells and shaping the humoral immune response and depletion experiments suggest their contribution to ECM (14, 33). However, no direct effector role was associated with disease onset on day 6 post-infection (p.i.) (34).
Type I IFNs are induced early upon Plasmodium infection (32) and Ifnar1-/- mice have been described to be at least partially protected from ECM upon infection with wild type (WT) or transgenic P. berghei ANKA parasites (24, 26, 28, 35, 36). Since ECM pathology is dependent on CD8+ T cells and type I IFNs are capable of providing signal three for T cell activation (37), we first addressed here whether Ifnar1-/- mice benefit from reduced cytotoxic T cell (CTL) activation in the spleen and in consequence from abrogated ECM.
To elucidate antigen-specific T cell responses and their activity in vivo, we generated a transgenic PbAAma1OVA parasite that expresses a truncated C-terminal fragment of OVA under a blood-stage specific promoter of the apical membrane antigen-1 (AMA-1) gene, a merozoite surface antigen of the parasite. Using the resulting PbAAma1OVA clonal line, we demonstrate here that ECM protection in PbAAma1OVA-infected Ifnar1-/- mice was not due to an altered antigen-specific cytotoxic CD8+ T cell activity in comparison to infected WT mice. However, infected Ifnar1-/- mice retained more T cells in the spleen, concomitantly with an induction of large numbers of eosinophils. Importantly, eosinophil depletion reduced the protection of Ifnar1-/- mice from ECM and led to an increased CD8+ T cell number in the brain.
Thus, we present a so far unrecognized role of type I IFN signaling in combination with eosinophils in ECM pathology. We conclude that the protection of PbAAma1OVA-infected Ifnar1-;/- mice from ECM was not based on impaired CD8+ T cell generation, but was due to an alternative or regulatory milieu in the periphery – substantially mediated by eosinophils - that prevented the migration of CD8+ T cells into the brain in the absence of type I IFN signaling.
Material and Methods
Animals
For all experiments, six-week-old female C57BL/6 mice or NMRI (Naval Medical Research Institute) mice were purchased from Janvier Labs, Saint-Berthevin, France, and kept under specified pathogen-free conditions within the animal facility at Heidelberg University (IBF) or IMMIP, University Hospital Bonn. Ifnar1-/- mice (38) were bred in the House of Experimental Therapy (HET), University Hospital Bonn. All animal experiments were performed according to European regulations and approved by the state authorities (AZ 84-02.04.2012.A264 and AZ 81-02.04.2019.A083, Landesamt für Natur, Umwelt und Verbraucherschutz, Recklinghausen, Germany). Water and food were provided ad libitum. Animals were checked daily for wellbeing and scores 0-20 were used for the grading of disease burden according to the RMCBS (39).
Generation of OVA-Expressing P. berghei ANKA Parasites
Transgenic OVA-parasites (PbAAma1OVA) were generated to express ovalbumin-derived CD8 and CD4 T cell epitopes at distinct stages of their life cycle (Figure S1). Thus, the sequences encoding the SIINFEKL (OVA MHC class I) and TEWTSSNVMEERKIK (OVA MHC class II) peptide sequences were cloned under the control of the promoter and the corresponding signal peptide of AMA1. The gene targeting construct was based on a derivative of b3D.DT^H.^D namely b3D+, both containing Toxoplasma gondii DHFR/TS as a selectable marker for resistance to pyrimethamine (40).
For transfection of P. berghei schizont-enriched parasites, the targeting plasmid was linearized and afterwards transfected into PbGFPcon parasites by electroporation using the Nucleofactor® solution and Amaxa device (Lonza, Wuppertal, Germany) as described earlier (41). Transfected parasites were injected intravenously into naïve NMRI mice, and selected by providing pyrimethamine in the drinking water. For obtaining clonal parasite populations, limited dilution series with one parasite per defined volume were injected intravenously into 10 naïve recipient NMRI mice. Genotyping of WT and recombinant parasites was performed by PCR using parasite genomic DNA with primer combinations (Table S1).
Anopheles Infection Cycle
The transgenic blood-stage OVA parasite (PbAAma1OVA) was tested for its life cycle progression in order to rule out potential growth impairment due to the insertion of ovalbumin into the parasite’s genome. To this end transgenic blood-stage OVA-parasites were allowed to grow in NMRI mice for several days until they have reached a high proportion of sexual stages (gametocytes). Gametocytemic mice were then anesthetized and fed to five to seven days-old female Anopheles mosquitoes for 15 to 20 min. Mosquitoes were kept at 80% humidity and 21-24°C. Vital life-cycle progression of the transgenic parasite was then compared to infections with WT, i.e. sporozoites were dissected from mosquito midguts on day 14 and from mosquito salivary glands on day 17 to 21 after blood meal. 10,000 infectious sporozoites isolated from salivary glands were additionally used for intravenous infection of inbred C57BL/6 mice to test the capacity of the transgenic parasite line to normally infect the mammalian host i. e. to complete the clinically silent intrahepatic phase and initiate the pathological blood-stage infection. To this end infected mice were tested for parasitized erythrocytes by daily blood smears and analyzed after Giemsa staining and light microscopy. The parasites behave indistinguishable from WT parasites throughout the malarial life cycle.
Parasites, Infection, and Disease
Plasmodium berghei transgenic parasites (PbAAma1OVA) containing MHC class I restricted epitopes from chicken ovalbumin were generated as described above. Frozen stabilates of the parasites were stored in liquid N2. Stock mice received 200 µL of the stabilates i. p.. After 4 days blood smears were performed to determine the parasitemia of the stock mice (see below). For experimental infections, 5x10⁴ red blood cells infected with PbAAma1OVA (iRBC) were then injected intravenously (i. v.) in 100 µL PBS into the mice. From d+3 p. i., the mice were analyzed for symptoms related to ECM with the help of the recently described health score called rapid murine coma and behavior scale (RMCBS) (39). Briefly, the scoring bases on ten different parameters that evaluate health and behavior (gait, balance, motor performance, body position, limb strength, touch escape, pinna reflex, toe pinch, aggression, grooming). Each parameter is rated individually with a maximum of two points (good response) to zero (no response). Due to ethical reasons and in agreement with our ethical license, animals with a score of six or less were sacrificed. This humane endpoint was also applied for the “survival experiment”. For the survival experiment, 10 mice per group were infected with PbAAma1OVA and monitored, dependent on their RMCBS score, until day 15 p.i.
Parasitemia Determination
Blood was collected from the tail vein and thin blood smears were prepared. The blood slides were air dried and fixed in 100% methanol. Giemsa staining solution was prepared by diluting Giemsa stock (Merck KGaA, Darmstadt Germany) 1:20 in Giemsa buffer pH 7.2. Slides were stained for 20 mins followed by rinsing in tap water for 1 min, after which they were left to airdry. Approximately 1000 red blood cells were counted, the infected cells noted and the percentage of iRBCs calculated [=(iRBCs/counted RBCs)*100].
Evans Blue Assay for Determination of Blood-Brain-Barrier Stability
On d+6p.i. mice received 200 μL of 2% Evans Blue (Sigma-Aldrich, St. Louis, MO, USA) in 0.95% NaCl i. v.. One hour later, mice were sacrificed and the brains were removed, photographed and weighed, thereafter they were placed in 15 mL tubes containing 2 mL formamide (Sigma-Aldrich, St. Louis, MO, USA) and incubated for 48 h at 37°C. Quantification of Evans Blue extravasation was performed by transferring 100 μL of the incubated formamide/brain solution in 96 well plates in triplicates. The standard curve was prepared by diluting Evans Blue to 200 μg/mL with 0.95% NaCl (starting concentration), and diluted 1:2 in duplicates with formamide. The concentration of Evans Blue was measured spectro-photometrically at 620 nm. The amount of infiltrated dye was calculated as μg Evans Blue/g brain tissue x2.
Harvesting and Preparation of Organs and Flow Cytometric Analysis
Blood was collected from the Vena fascialis and the mice were afterwards anaesthetized with 4:1 Ketamine-Rompun mixture (0.01 mL/10 g body weight). After intracardial perfusion (1 X PBS for 5 minutes), spleens and brains were isolated, cut into small pieces, and digested with 0.5 mg/mL collagenase VIII (Roche, Basel, Switzerland) at 37 °C for 30 min. The tissues were then gently passed through a metal sieve (Ø 70 µm), single cells were washed with 1X PBS containing 1% FCS and 2 mM EDTA. Leukocytes from the brain were enriched as described before with a Percoll gradient (42). Cells were counted using CASY® TT Cell counter and then adjusted to 1x10⁷ cells/ml. For analysis by flow cytometry, 1x10⁶ cells were stained in 1X PBS containing 1% FCS and Rat IgG (diluted 1:1000, Sigma-Aldrich, St. Louis, MO, USA) for 20 min on ice. Intracellular staining was performed using the eBioscience™ Foxp3/Transcription Factor Staining Buffer Set (eBioscience, San Diego, CA, USA), according to the manufacturer’s protocol. To detect SIINFEKL-specific CD8+ T cells in spleens of PbAAma1OVA-infected mice, 1x10⁶ splenocytes were incubated in 30 μL FACS buffer (1X PBS containing 1% FCS) containing 2.5 μL Rat IgG and 5 μL SIINFEKL-H-2Kb pentamers coupled to allophycocyanin (ProImmune, Oxford, UK) for 20 min at room temperature. Next, 20 μL FACS buffer containing diluted fluorescently labeled anti-CD8a and CD11a antibodies were added and incubated for another 15 min on ice. Then, the cells were washed with FACS buffer and stored on ice until analysis. For intracellular staining of IFN-γ, CCL5 and Granzyme B (GrzB) the cells were treated with Golgi Plug/Stop (protein transport inhibitors) for at least 4 h to prevent secretion of these effector molecules. For that purpose, 1x10⁶ cells per sample were added to a 96-well cell culture plate and centrifuged for 5 min at 4°C and 400 xg. The cells were resuspended in 200 µL complete RPMI medium + 0.8 µL/mL Golgi Plug + 0.8 µL/mL Golgi Stop (1 x concentrated) and cultured for 4 h at 37°C and 5% CO2. For IFN-γ the cells were additionally stimulated with 50ng/mL PMA (Invivogen, San Diego, CA, USA), 250 ng/mL ionomycin (Sigma Aldrich, St. Louis, MO, USA) during this 4 h. Afterwards the cells were fixed, permeabilized and stained according to the eBioscience protocol mentioned above. The following fluorescently-labelled specific antibodies used for flow cytometric analysis were purchased from BioLegend, San Diego, CA, USA if not stated otherwise: anti-mouse CD3 (PE-Cy7, BV510 clone 145 2C11), CD4 (Al488, BV605, clone GK1.5), CD8α (BV785, PerCP-Cy5.5, clone 53-6.7), CD11a (Al488, clone M17/4), CD11b (BV510, clone M1-70), CD45 (FITC, PE, PerCP-Cy5.5 clone 30F11), CD49a (PE, clone HMa1), CD49b (Al488, clone HMa2), CD90.2=Thy1.2 (PE, clone 53-2.1), CCL5 (PE, clone 2E9/CCL5), CCR5=CD195 (Al647, clone HM-CCR5), CCR7=CD197 (PerCP-Cy5.5, clone 4B12), CXCR3 (PE, clone CXCR3-173), F4/80 (APC, clone CI:A3-1, BioRad), GATA-3 (PE-Cy7, clone L50-823), GrzB (APC clone GB11, Invitrogen), Lineage cocktail (Pacific Blue, including anti-CD3 clone 17A2, -Ly6C/Ly6G clone RB6-8C5, -CD11b clone M1/70, -CD45R clone RA3-6B2, -TER-119 clone Ter-119, Ly6C (APC-Cy7, clone HK1.4), Ly6G (PE, PE-Cy7, clone 1A8), NK1.1 (BV421, APC-Cy7, clone PK136), NKp46=CD335 (PE-Cy7, clone 29A1.4) RELM-α purified polyclonal, rabbit, (PeproTech, Inc., Rocky Hill, NJ, USA) in combination with goat anti-rabbit Al488 (Invitrogen, Carlsbad, CA, USA), Siglec-F (PE, clone E50-2440, BD, San Jose, USA), T-bet (APC, clone 4B10), TCRβ (Al700, clone H57-597). Data acquisition was performed on a LSR Fortessa® (BD, San Jose, USA) and CytoFLEX S (Beckman Coulter, Brea, CA, USA) and analyzed with FlowJo® Software V10 (FlowJo, LLC, Ashland, OR, USA).
Immunohistochemistry of Brain Samples
Organs were fixed with 0.05 M phosphate buffer containing 0.1 M L-lysine (pH 7.4, Roth), 2 mg/mL NaIO4 (Roth), and 10 mg/mL paraformaldehyde (Sigma-Aldrich, St. Louis, MO, USA) overnight at 4°C. Afterwards, the organs were equilibrated in 30% sucrose (Carl Roth, Karlsruhe, Germany) solution for 24 h and then frozen in OCT (Weckert Labortechnik) and stored at −80°C. Consecutive sections (5 μm) were mounted on Super Frost Plus glass slides (R. Langenbrinck), dried for 10 min at 70°C, rehydrated with PBS with 0.05% Triton X-100 (Carl Roth, Karlsruhe, Germany) and blocked for 1 h with PBS containing 1% bovine serum albumin (GE Healthcare, Chicago, IL, USA) and 0.05% Triton X-100. The staining was performed in blocking buffer (200 μL volume per section).
The antibodies (SiglecF (clone E50-2440, Alexa647, BD Biosciences); CD8a (clone 53-6.7, PE, BioLegend) were incubated for 1h, DAPI (2 mg/mL, Life Technologies, diluted 1:5000) was incubated for 5 min. After each staining step, three washing steps of 5 min with 0.05% Triton X-100 in PBS were performed. Sections were imaged with the Zeiss Axio Observer.Z1 and Apotome (Carl Zeiss, Oberkochen, Germany) at the Imaging Center Essen and processed by the ZEN Software (Carl Zeiss, Oberkochen, Germany), ImageJ and R. The image processing was done on ImageJ and R by generating cell- and tissue masks. Masks are images where the background is black (i.e., value 0), and the foreground, the object of interest, is white (i.e. value 1). The foreground signals were used to analyze the cell populations of interest, characterized by their emplacement, area and the distance to a point of interest. Tissue and cell signals were then coregistered to determine the location of individual cells, and cell population densities.
In Vivo Cytotoxicity Assay
The lytic activity of SIINFEKL-specific CD8+ T cells in PbAAma1OVA-infected animals was determined with an in vivo cytotoxicity assay on day 6 p.i. as described before (42). Briefly, splenocytes from syngenic donor mice were pulsed with 1 μM of the ovalbumin–derived specific H-2kb peptide SIINFEKL (PEPscreen/Sigma-Aldrich, St. Louis, MO, USA) for 30 min at 37°C and subsequently with 1 μM of 5(6)-Carboxyfluorescein diacetate N-succinimidyl ester (CFSE, Sigma-Aldrich, St. Louis, MO, USA) for 15 min (CFSEhigh, specific target cells). Reference cells were not pulsed with peptide and labeled with 0.1 μM CFSE for 15 min (CFSElow, reference cells). Cells were washed with 1 X PBS (PAA, Cölbe, Germany) and the cell number was determined. The cell populations were mixed at a 1:1 ratio (CFSEhigh/CFSElow). Each recipient received 5x10⁶ cells of each population diluted in 0.9% NaCl (Braun, Melsungen, Germany) into the tail vein on day 5 p.i.. Mice were sacrificed 18 h later on day 6 p.i. and spleens were isolated to prepare single-cell suspensions as described above. Lysis of peptide-loaded cells was quantified by measuring the ratio of CFSEhigh/CFSElow cells via flow cytometry (Canto II, BD Biosciences). The percentage of specific lysis, termed S8L-specific lysis, was calculated using the following equation: 100 - [(CFSEhigh/CFSElow) immunized/(CFSEhigh/CFSElow) naïve] x 100.
Depletion of Eosinophils in Ifnar1-/- Mice
After infection with PbAAma1OVA, Ifnar1-/- mice received 1.5 µg/g body weight anti-Siglec-F (R&D Systems, Minneapolis, MN, USA) i. p. in 100 or 150 μL PBS on day 3, 4 and 5 after infection. Mice were analyzed for symptoms related to ECM according to RMCBS. The depletion of eosinophils was confirmed by flow cytometric analysis of the spleen on day 6 after PbAAma1OVA infection.
Cytokine ELISA
Organs from experimental animals were isolated on day 6 p.i. and single cell suspensions were prepared as described above. 1x10⁶ splenocytes or 1.25x10⁶ cells from brain homogenates were cultured in triplicates in 200 μL RPMI 1640 (Life technologies Corporation, Grand Island, NY, USA) incl. 10% fetal calf serum (FCS) (PAA, Cölbe, Germany) 1% penicillin/streptomycin/L-Glutamin (Life technologies Corporation, Grand Island, NY, USA) medium overnight. The supernatants were analyzed by sandwich ELISA for IL-10, IL-13, IFN-γ or TNF (all eBiosciences), CCL5 and GrzB (DuoSet R&D Systems, Minneapolis, MN, USA) according to the manufacturers’ protocols.
CD11b Cell Sorting Using Magnetic Beads, Arginase Assay, RNA Purification and qPCR
From digested spleens, single cell suspensions were prepared and 4x10⁷ cells were incubated with anti-CD11b+ antibodies coupled to magnetic beads accordingly to the manufacturer’s protocol (Miltenyi, Bergisch Gladbach, Germany). Cell separation was performed with the AutoMACS® (Miltenyi, Bergisch Gladbach, Germany). Eluted cells were counted and stained to check the purity. For the arginase assay, 1x10⁶ cells MACS-sorted CD11b+ cells were plated into 96-well plates and centrifuged at 1000 x g at 4°C for 10 min. Cells were then lysed with 100 μL of 10 mM Tris-HCl, pH 7.4 (Sigma-Aldrich, St. Louis, MO, USA), containing 1 μM pepstatin A (Sigma-Aldrich, St. Louis, MO, USA), 1 μM leupeptin (Sigma-Aldrich, St. Louis, MO, USA), and 0.4% (w/v) Triton X-100 (Sigma-Aldrich, St. Louis, MO, USA) for 10 min. Lysates were centrifuged at 14,000 x g at 4 °C for 10 min. Supernatant was used for the arginase assay. Analysis for urea quantity was then performed according to manufacturer’s instructions (Abnova, Taipeh, Taiwan). Arginase activity was calculated as units per liter of sample (U/L).
For RNA purification, MACS-sorted CD11b+ cells were homogenized in TRIzol® (Thermo Fisher Scientifics, WA, USA) in BashingBeads tubes (Zymo Research, Freiburg, Germany). PeqGOLD HP Total RNA Kit was used for purification according to the manufacturer’s instructions. Thereafter, on-membrane DNase I digestion (peqGOLD, Erlangen, Germany) was performed. For qPCR, TaqMan® RNA-to-Ct™ 1-Step Kit (Life technologies Corporation, Grand Island, NY USA) was used with 2 μg total RNA in a reaction volume of 20 μL. Each sample was normalized to beta-actin. The expression level was calculated as fold-increase against naïve as described (43).
Primer Sequences
Primers (Seqlab, Göttingen, Germany) were used: YM1 FWD 5’ gcccttattgagaggagcttta 3’, REV 5’ tacagcagacaagacatcc 3’; Arginase FWD 5’ cctatgtgtcatttgggtgga 3’, REV 5’ caggagaaaggacacaggttg 3’; Beta actin FWD 5’ agagggaaatcgtgcgtgac 3’, REV 5’ caatagtgatgacctggcggt 3’.
Statistical Analysis
GraphPad Prism software version 8 (GraphPad Software, San Diego, CA, USA) was used for statistical analysis. Mann-Whitney-U-test was used to test for significant differences between two unpaired groups. Kruskal-Wallis test, followed by Dunn’s post hoc multiple comparisons was used to test for significant differences between multiple groups. Survival experiments were analyzed with Log-rank (Mantel-Cox) test. If not stated otherwise, values from each individual mouse and median with interquartile ranges (IQR) are shown. p values <0.05 were considered as significant. Prior to pooling data were analyzed for homogeneity by not passing Spearman’s test for heteroscedasticity. If data could not be pooled, but statistical trends (p<0.1) were confirmed by several experiments, the trends were included in the figure.
Results
Transgenic PbAAma1OVA Parasites Induce ECM in WT Mice Whereas Ifnar1-/- Mice Are Protected
ECM is the result of strong inflammatory immune responses towards PbA parasites in susceptible C57BL/6 mice driven by CD8+ T cells and IFN-γ (13, 34, 44). Type I IFNs are induced early upon Plasmodium infection (26) and Ifnar1-/- mice lacking type I IFN signaling have been shown to be protected from ECM (26, 28, 35, 36, 45). Since type I IFNs are also relevant in T cell activation, we investigated whether this protection was due to an impaired antigen-specific cytotoxic activity. To investigate this, we generated a transgenic PbAAma1OVA parasite clone constitutively expressing a truncated C-terminal fragment (SIINFEKL) of ovalbumin (OVA) including both CD8+ T and CD4+ T cell epitopes under the control of the AMA-1 promoter in PbA, termed PbAAma1OVA (Figure S1 and Table S1). This allows the identification of parasite-specific T cell responses by working with commonly available OVA.
SIINFEKL-specific CD8+CD11a+ T cells in the spleens of PbAAma1OVA-infected (PbA-infected) WT mice were detected on day 6 p.i., thus confirming the successful generation of endogenous parasite-specific T cells (Figure S2). Whereas PbA-infected WT mice succumbed to ECM within 6-7 days, infected Ifnar1-/- mice showed an increased survival (65%) and less ECM symptoms (Figures 1A, B), which is in line with previous reports from studies performed with other PbA clones (28, 35, 36, 46). Since parasitemia did not differ significantly between both groups of infected mice (p=0.59), an inefficient parasite replication in infected Ifnar1-/- mice as a possible reason for ECM protection was excluded (Figure 1C). Protection of infected Ifnar1-/- mice correlated with an intact blood-brain barrier (BBB), whereas the brains of ECM-positive WT mice showed a permeable BBB, demonstrated by an intensive staining due to strong extravasation of the i. v. injected Evans Blue dye (Figures 1D, E), also shown previously with another transgenic P. berghei ANKA strain (35). Thus, the lack of type I IFN signaling prevented PbAAma1OVA - infection-induced ECM in the genetically deficient Ifnar1-/- mice.
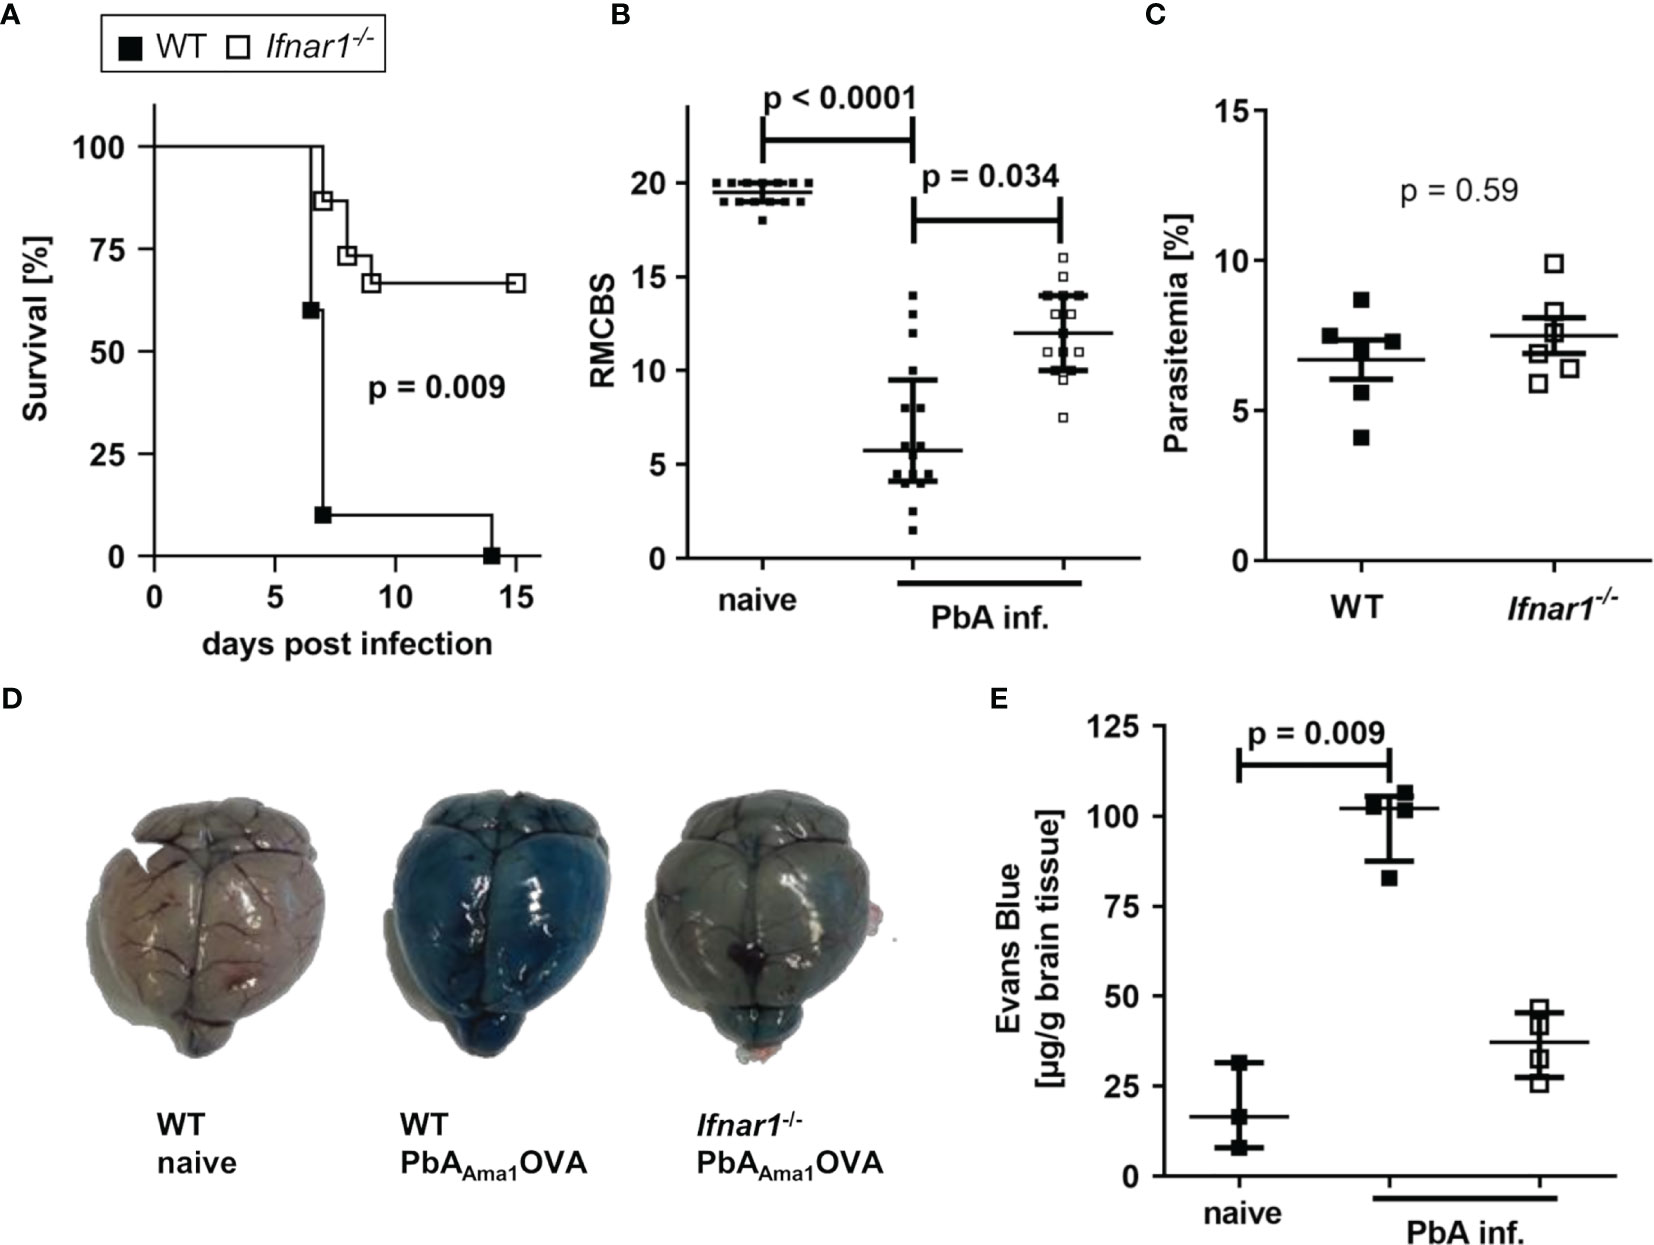
Figure 1 PbAAma1OVA-infected Ifnar1-/- mice are protected from ECM. (A–E) C57BL/6 WT and Ifnar1-/- mice were infected i.v. with 5x10⁴ PbAAma1OVA-infected red blood cells and monitored for ECM development and parasitemia. (A) Days until onset of ECM, stated as survival of infected mice. Due to ethical reasons animals were sacrificed with a score of six or less. (B) Neurological symptoms of PbAAma1OVA-infected (PbA inf.) mice according to the rapid murine coma and behavior scale (RMCBS) on day 6 p.i. compared to naïve WT controls. (C) Blood-stage parasitemia levels on day 6 p.i. (D, E) The stability of the blood brain-barrier was analyzed with an Evans Blue assay on day 6 p.i. in PbA inf. mice and naïve controls. (D) Photos from brains isolated from representative animals one hour after injection of Evans Blue. (E) Colorimetric quantification of dye extravasation from isolated brains of naïve and PbA inf. mice on day 6 p.i. (A) n=10 per group; Log-rank (Mantel-Cox) test. (B) n=14-16 per group, data are pooled from 4 individual experiments; Kruskal-Wallis with Dunn’s post-test. (C) n=6 per group, representative for 3 individual experiments; Mann-Whitney-U-test. (E) n=3-4 per group. Kruskal-Wallis with Dunn’s post-test. (B, C, E) Data show median with IQR. p.i., post infection; PbA inf., PbAAma1OVA-infected, RMCBS, rapid murine coma and behavior scale.
Less Cellular Infiltrates in Brains of PbAAma1OVA-Infected Ifnar1-/- Mice
Upon PbA-induced breakdown of the BBB, immune effector cells, parasite-derived particles and soluble mediators can infiltrate the brain. For analysis brains were perfused, digested and associated lymphocytes were enriched by density gradient centrifugation. We observed increased numbers (p=0.05) of infiltrated cells in samples of PbA-infected WT mice compared to WT naïve, but not of PbA-infected and naïve Ifnar1-/- mice (Figure 2A). Further, the number of infiltrated cells was significantly reduced in Ifnar1-/- compared to WT mice, when considering nominal statistical significance. Flow cytometric analysis of CD11b and CD45 expression allowed for the separation of brain-infiltrating cells (gated in P1 = CD11blo CD45hi and P2 = CD11bint CD45hi) from the periphery versus brain-resident microglia (gated in P3 = CD11bhi CD45int) (Figure 2B). Brain samples of naïve mice and of ECM-protected Ifnar1-/- mice contained only very few CD45hi cells, whereas brains of PbA-infected WT mice that suffered from ECM had significantly more CD45hi cells (Figures 2C, D). Among CD45hi infiltrates, brains of PbA-infected WT mice contained significantly increased frequencies of CD8+ T cells (Figure 2E) and NK cells (Figure 2F) compared to naïve WT mice. These cells were less prominent in brains of PbA-infected Ifnar1-/- mice, which is in line with data from other PbA clones (46). The trend in reduced NK cell numbers between PbA-infected groups was confirmed in three independent experiments, but data did not qualify for pooling all data sets. CD8+ T cells from PbA-infected WT mice had significantly increased expression levels of CCR5 (Figure 2G) in comparison to naïve WT mice. A relevance for CCR5 in ECM has been previously demonstrated (47, 48). In addition, brain-derived CD8+ T cells from infected WT mice expressed Granzyme B (GrzB), thus exhibiting a cytotoxic phenotype (Figures 2H, I). However, the few CD8+ T cells that were present in brain samples from PbA-infected Ifnar1-/- mice expressed CCR5 on comparable levels as the PbA-infected WT mice and expressed GrzB (Figures 2G–I). In order to analyze another important source for GrzB, we investigated brain-associated NK cells. Interestingly, the GrzB expression in NK cells enriched from brain cell suspensions was significantly higher compared to the expression in CD8+ T cells in WT and Ifnar1-/- mice, suggesting that NK cells might also be involved in the induction of ECM (Figure S3A).
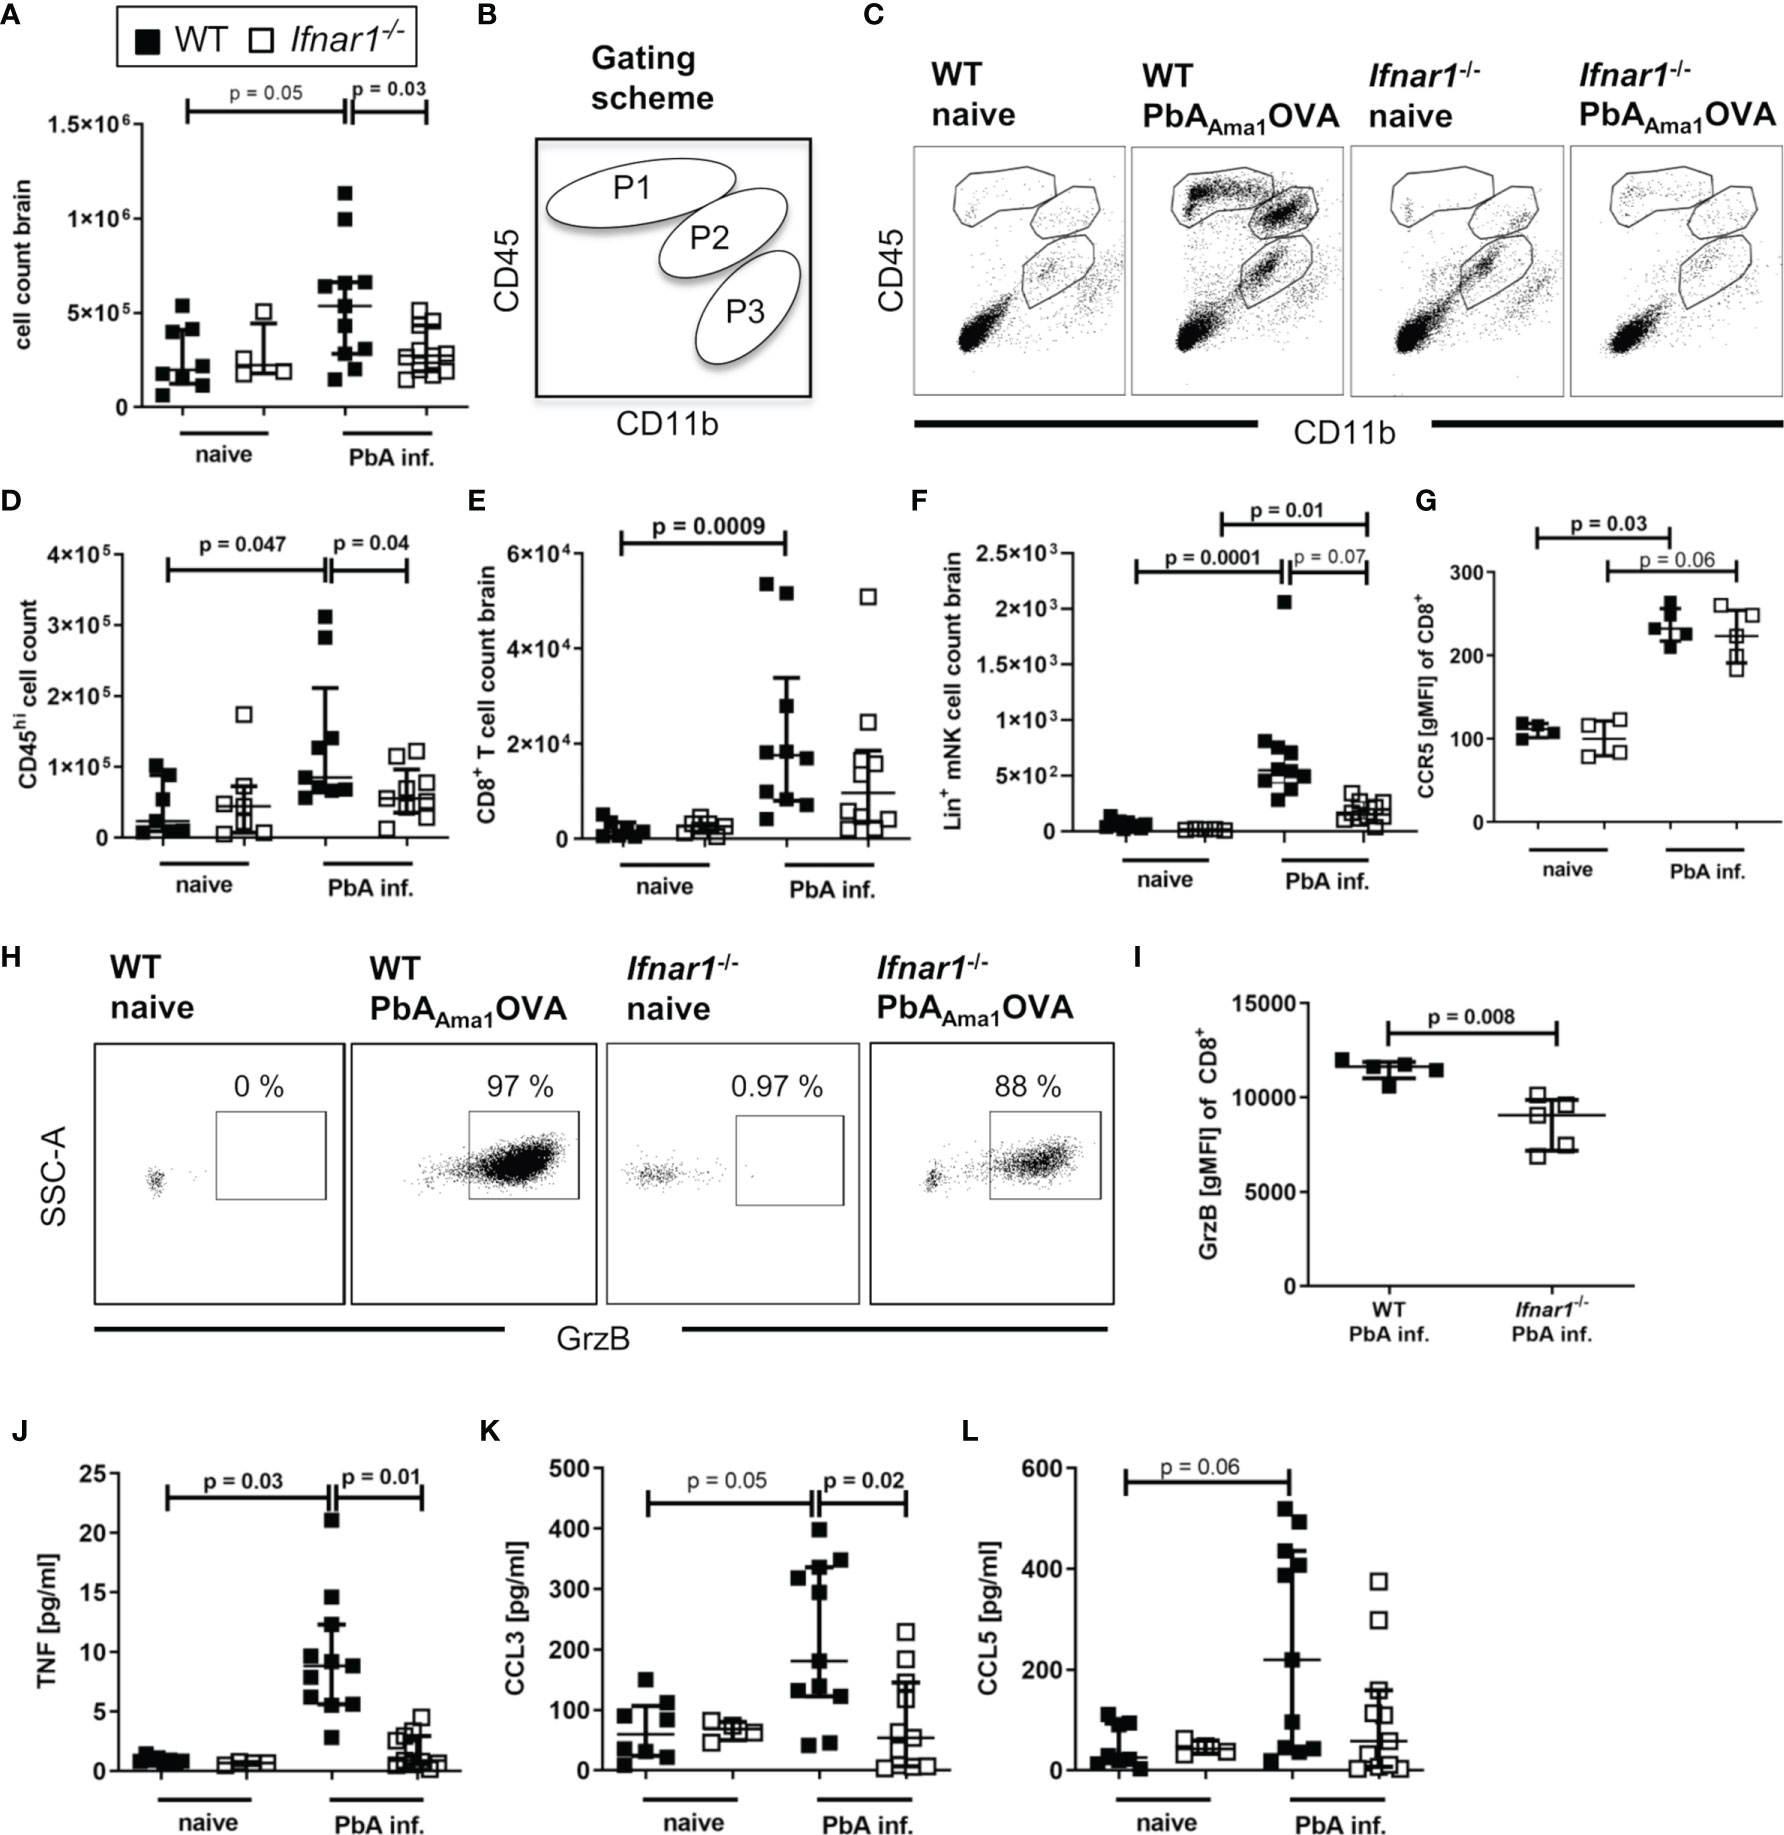
Figure 2 Cellular infiltration and brain inflammation are reduced in PbAAma1OVA-infected Ifnar1-/- mice. (A–L) C57BL/6 WT mice and Ifnar1-/- mice were infected i.v. with 5x10⁴ PbAAma1OVA-infected red blood cells and analyzed ex vivo on day 6 p.i. regarding cellular brain infiltration via flow cytometry and ELISA. (A) Enriched brain leukocytes from naïve and infected (PbA inf.) mice were analyzed according to the scheme in (B) via flow cytometry to distinguish CD11bloCD45hi-infiltrated leukocytes (gated in P1) and CD11bintCD45hi mononuclear cells (gated in P2) from CD11bhiCD45int-brain resident immune cells (gate P3). (C) Dotplots according to the gating in (B) from brain-enriched leukocytes of representative samples. (D) Total count of CD45hi-infiltrated leukocytes (P1+P2). (E) Total count of CD8+ T cells (CD45+CD3+CD8+). (F) Total count of lineage positive NK cells (CD45+Lineage+CD49b+NKp46+T-bet+). (G) Expression of CCR5 on CD8+ T cells. (H) Dotplots of Granzyme B (GrzB) expression in CD8+ T cells of representative samples. (I) Expression of GrzB in CD8+ T cells in PbA-inf. mice. (J–L) ELISA analysis of enriched brain leukocyte culture supernatants after 24h for (J) TNF, (K) CCL3 and (L) CCL5. (A–L) n=4-11, pooled data from 2 individual experiments. (A, D-G, I–L) Data show median with IQR. When comparing two groups Mann-Whitney-U-test, for more groups Kruskal-Wallis with Dunn’s post-test. (A, D) Mann-Whitney-U-test for comparing the PbA-infected groups. GrzB, Granzyme B; p.i., post infection; PbA inf., PbAAma1OVA-infected.
Next, we tested whether the production of chemokines and cytokines associated with ECM was altered in brain-associated lymphocyte cultures of PbA-infected Ifnar1-/- mice after 24h. Whereas samples of naïve controls and infected Ifnar1-/- mice contained low levels of TNF and CCL3, both mediators were significantly increased in PbA-infected WT mice in comparison to the infected Ifnar1-/- mice (Figures 2J, K). CCL5 levels were low in cultures from naïve cells and enhanced in ~50% of ECM susceptible WT mice following PbA infection (Figure 2L). Taken together, these data demonstrate the presence of activated effector cells and molecules in brains of ECM-positive PbA-infected WT mice, whereas lower cell counts and reduced levels of ECM-associated inflammatory mediators indicate only minor brain inflammation in PbA-infected Ifnar1-/- mice, which correlated with the absence of ECM.
T Cells Accumulate in Spleens of ECM Protected Ifnar1-/- Mice With Unaltered Inflammatory and Antigen-Specific CTL Responses
The spleen is essential in the process of immune activation and T cell activation upon encounter with Plasmodium parasites.
In order to further elucidate the events that result in prevention of ECM in Ifnar1-/- mice, spleens of PbA-infected animals were analyzed on day 6 p.i., the time point of ECM onset in PbA-infected WT mice. The Ifnar1-/- mice presented a strong splenomegaly, even in the absence of Plasmodium infection (Figure 3A). Although we observed unaltered parasite-specific cytotoxic functions of splenic T cells in PbA-infected Ifnar1-/- mice in comparison to PbA-infected WT mice (Figure S2), the frequency of splenic CD3+ T cells differed significantly between the two mouse strains (Figure 3B). The T cell frequency was significantly higher in PbA-infected Ifnar1-/- mice compared to PbA-infected WT mice (p=0.02) (Figure 3B). The frequency of CD8+ T cells of CD3+ T cells increased significantly only in PbA-infected Ifnar1-/- mice, while the frequency of CD4+ T cells of CD3+ T cells decreased significantly (Figures 3C, D). The observed shift in cell frequencies resulted in a changed CD4+/CD8+ T cell ratio in the spleen, which was significantly lower in Ifnar1-/- mice than in WT controls after PbAAma1OVA infection (Figure 3E). Due to the splenomegaly in Ifnar1-/- mice, we still observed elevated total splenic CD4+ T cell counts in PbA-infected Ifnar1-/- mice in comparison to infected WT mice (Figure S4A). Frequencies of FoxP3+ regulatory T cells in PbA-infected Ifnar1-/- mice were not altered (Figure S4B). At the same time we observed increased frequencies of splenic CD4+ T cells expressing T-bet, elevated from ~30% in PbA-infected WT mice to ~50% in PbA-infected Ifnar1-/- mice (Figure S4C). Furthermore, spleens of PbA-infected Ifnar1-/- mice contained a significantly higher percentage of CD4+IFN-γ+ T cells than spleens of WT controls (Figure S4D).
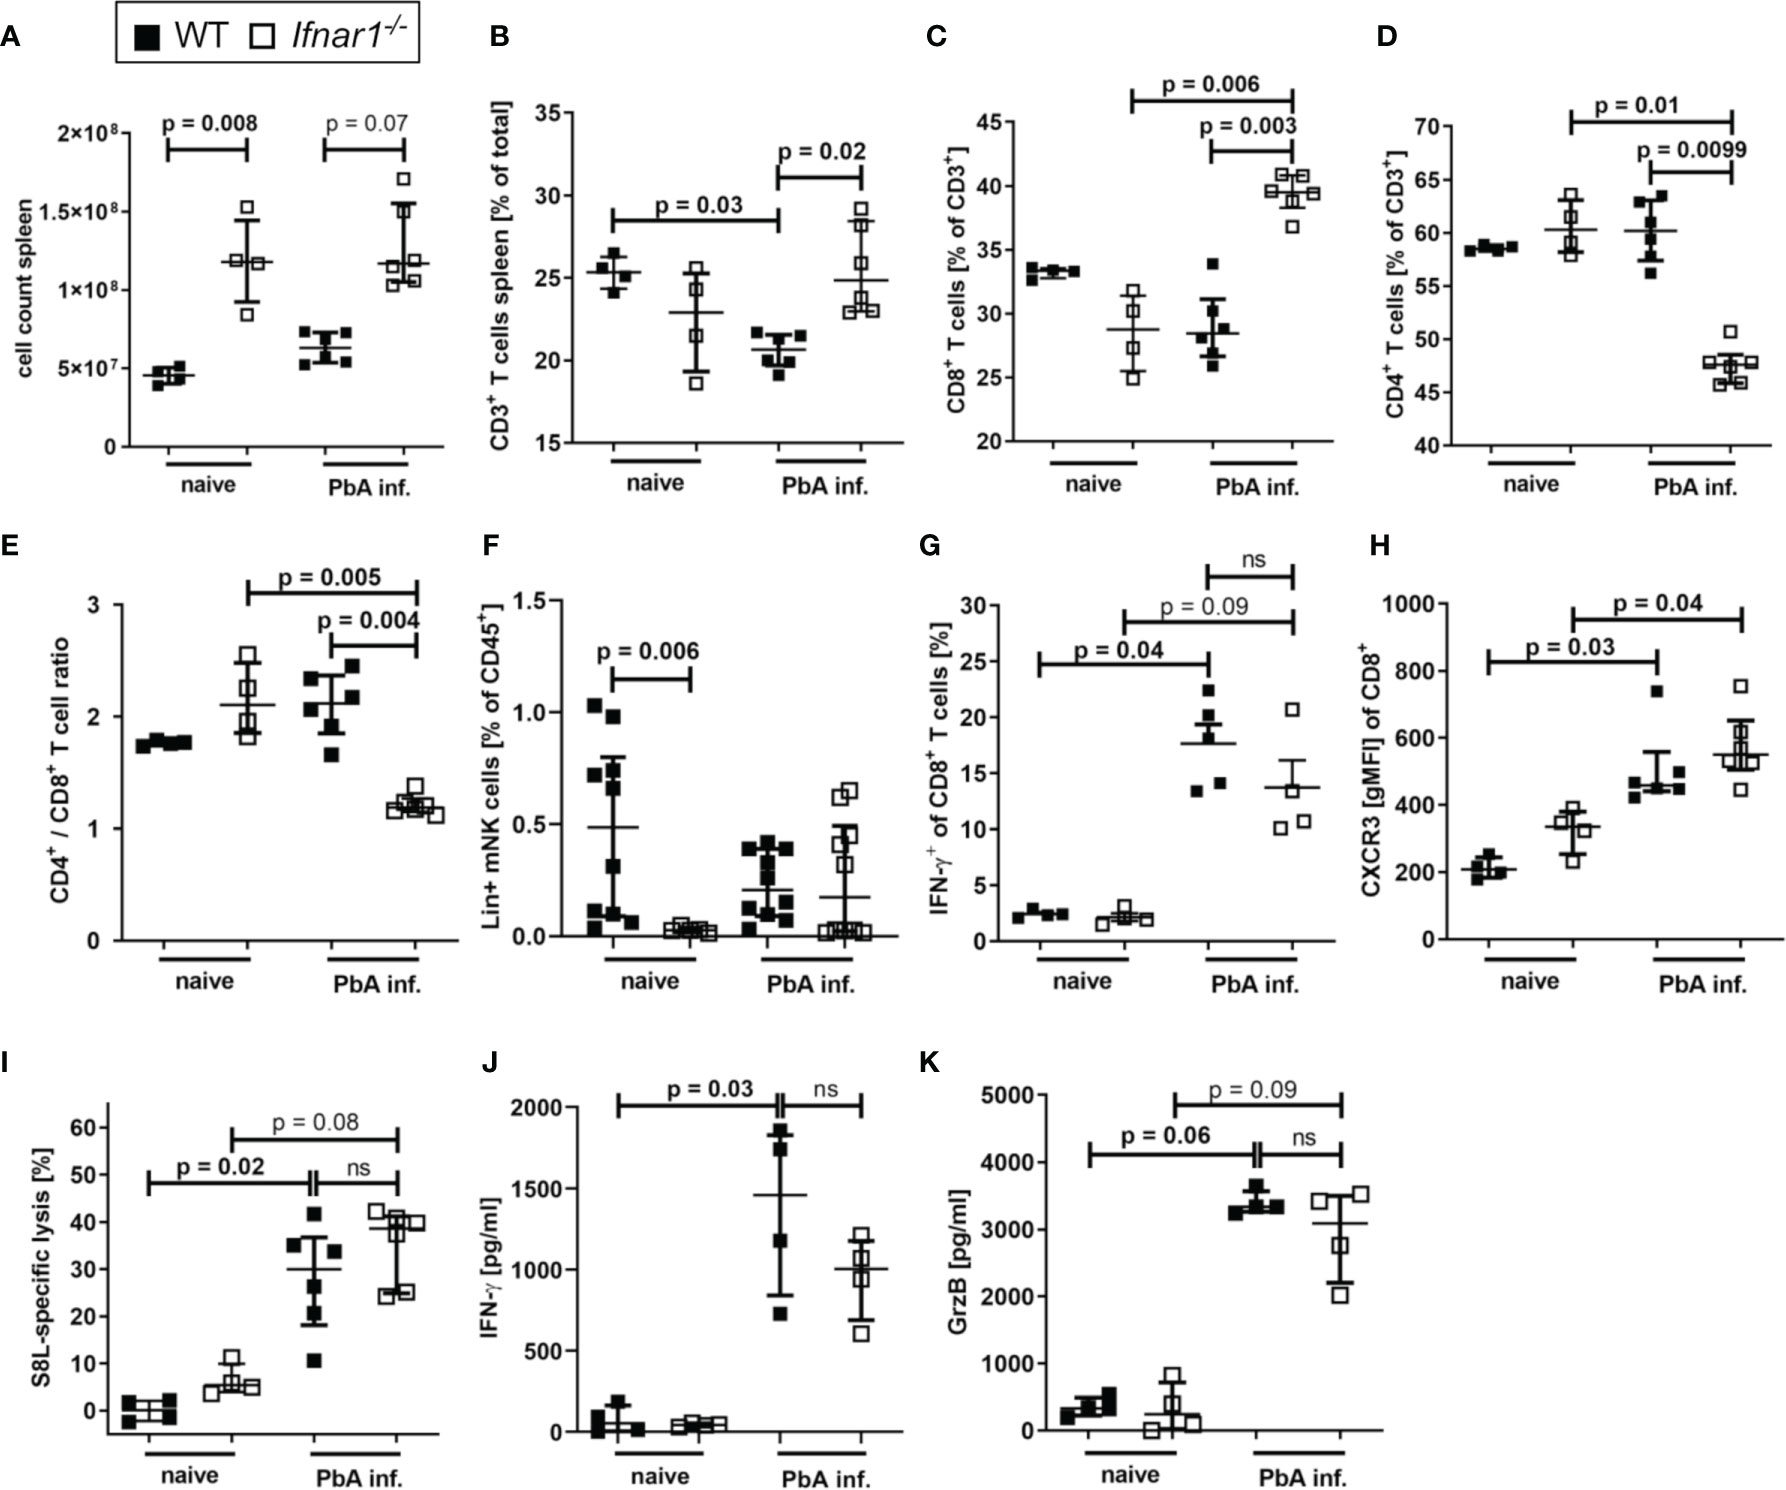
Figure 3 Accumulation of CD8+T cell T cells in spleens of PbAAmaOVA1-infected Ifnar1-/- mice. (A–K) C57BL/6 WT mice and Ifnar1-/- mice were infected i.v. with 5x10⁴ PbAAma1OVA-infected red blood cells and analyzed ex vivo on day 6 p.i. regarding cellular composition and immune activation in the spleen by flow cytometry (B–I) and ELISA (J, K). (A) Total splenocyte count. (B) Frequency of T cells (CD3+) among all splenocytes. (C) Frequency of CD8+ T cells (CD3+CD8+) and (D) frequency of CD4+ T cells (CD3+CD4+) of all T cells. (E) Ratio of CD4+ T cells to CD8+ T cells in the spleen based on their frequency. (F) Frequency of lineage positive NK cells (CD45+Lineage+CD49b+NKp46+T-bet+) among all splenocytes. (G) Frequency of IFN-y positive CD8+ T cells among all CD8+ T cells after in vitro stimulation with PMA and ionomycin. (H) CXCR3 on CD8+ T cells. (I) SIINFEKL (S8L)-specific lysis. (J, K) Cytokine quantification in total splenocyte culture supernatants after 24h for (J) IFN-γ, and (K) Granzyme B (GrzB). (A–E, H, J, K) n=4-6, representative for 3 individual experiments (F) n= 5-10, WT naïve and PbA-infected data pooled from two individual experiments. (G, I) n=4-6, data from 1 experiment. (A–K) Data shown as median with IQR; Kruskal-Wallis with Dunn’s post-test. GrzB, Granzyme B; ns, non-significant; p.i., post infection; PbA inf., PbAAma1OVA-infected; PMA, phorbol myristate acetate.
Here this increased frequency of T-bet expressing CD4+ was not statistically significant, but increased frequencies of IFNγ+ T-bet+CD4+ T cells have been described in P. berghei ANKA-infected Ifnar1-/- mice before (46).
Since NK cells were detected in the brains of PbA-infected animals and expressed significantly higher levels of GrzB compared to CD8+ T cells in the brain (Figure S3A), we isolated NK cells from spleens of PbA-infected WT and Ifnar1-/- mice to examine their activation status. With regard to NK cell frequencies in the spleen (gated according to Figure S5A), no differences were observed between Ifnar1-/- and WT mice after PbA-infection (Figure 3F), but splenic NK cells from PbA-infected Ifnar1-/- mice were less activated (Figures S3B-E). In order to investigate whether NK cells were involved in the different outcome of PbA-infection in WT and Ifnar1-/- mice, NK cells were depleted using anti-NK1.1 antibodies (Figure S6A and S7). NK cell depletion did not alter ECM development and parasitemia in PbA-infected WT mice (Figures S6B, C), which is in line with previous observations (49). Similarly, PbA-infected Ifnar1-/- mice were still protected from ECM following NK cell depletion (Figure S6B), suggesting that differences in NK cell activation were not responsible for the protection of Ifnar1-/- mice from ECM. In addition, NK cell depleted Ifnar1-/- mice did not show infiltration of immune cells into the brain (Figures S6D-G) and there was still an accumulation of CD8+ T cells in the spleens of Ifnar1-/- mice (Figures S6H, I). Furthermore, levels of IFN-γ and GrzB from splenocyte cultures derived from NK cell-depleted Ifnar1-/- mice were comparable to those of the isotype control treated mice (Figures S6J, K). Thus, no changes in the protection from ECM and T cell functions were observed after NK cell depletion, which suggests that NK cells were not essentially involved in the pathogenesis of ECM in WT and Ifnar1-/- mice.
Splenic CD8+ T cells of both WT and Ifnar1-/- mice neither differed in their IFN-γ production (Figure 3G) nor in surface expression of CXCR3 (Figure 3H), ICAM or CD11a (Figure S2). Since PbA-infected Ifnar1-/- mice had markedly reduced numbers and frequencies of brain infiltrating effector cells – in particular CD8+ T cells – we assessed whether this was due to an impaired cytotoxic T cell response upon infection. Transgenic PbAAma1OVA parasites successfully induced endogenous SIINFEKL-specific T cells in infected mice (Figure S2). The combined capacity of these parasite-induced CTLs to recognize and lyse SIINFEKL-pulsed target cells in vivo was comparable in PbA-infected WT and Ifnar1-/- mice (Figure 3I), while the frequency of CD8+ T cells in the spleen was higher in PbA-infected Ifnar1-/- mice compared to PbA-infected WT mice (Figure 3C). Similarly, the production of IFN-γ and GrzB by splenocytes from PbA-infected mice was comparable between WT and Ifnar1-/- mice (Figures 3J, K). In summary, our results indicate that T cells were retained in the spleens of PbA-infected Ifnar1-/- mice, and protection of Ifnar1-/- mice from ECM was not associated with differences in the capability to generate inflammatory and antigen-specific CTL responses. Thus, we hypothesize that primarily the retention of effector T cells in the spleen resulted in protection from ECM and maintained the integrity of the BBB.
Expansion of CCL5/CCR5 in ECM-Protected Ifnar1-/- Mice
Since PbA-infected Ifnar1-/- mice were protected from ECM despite the successful generation of antigen-specific T cell responses, we analyzed the interaction of CCL5 and CCR5 as one possible factor for mediation of CD8+ T cell retention in spleens of Ifnar1-/- mice. Concentrations of CCL5 were significantly reduced in splenocyte-cultures prepared from PbA-infected WT mice compared to naïve WT mice, while this decrease was not observed upon PbA infection in Ifnar1-/- mice (Figure 4A). CD8+ T cells of Ifnar1-/- mice had a significantly higher expression of the CCR5 receptor compared to corresponding naïve controls (Figure 4B) and in line with the results on CCL5 release (Figure 4A), PbA-infected Ifnar1-/- mice had significantly increased total numbers of CCL5-expressing cells in comparison to PbA-infected WT controls (Figure 4C).
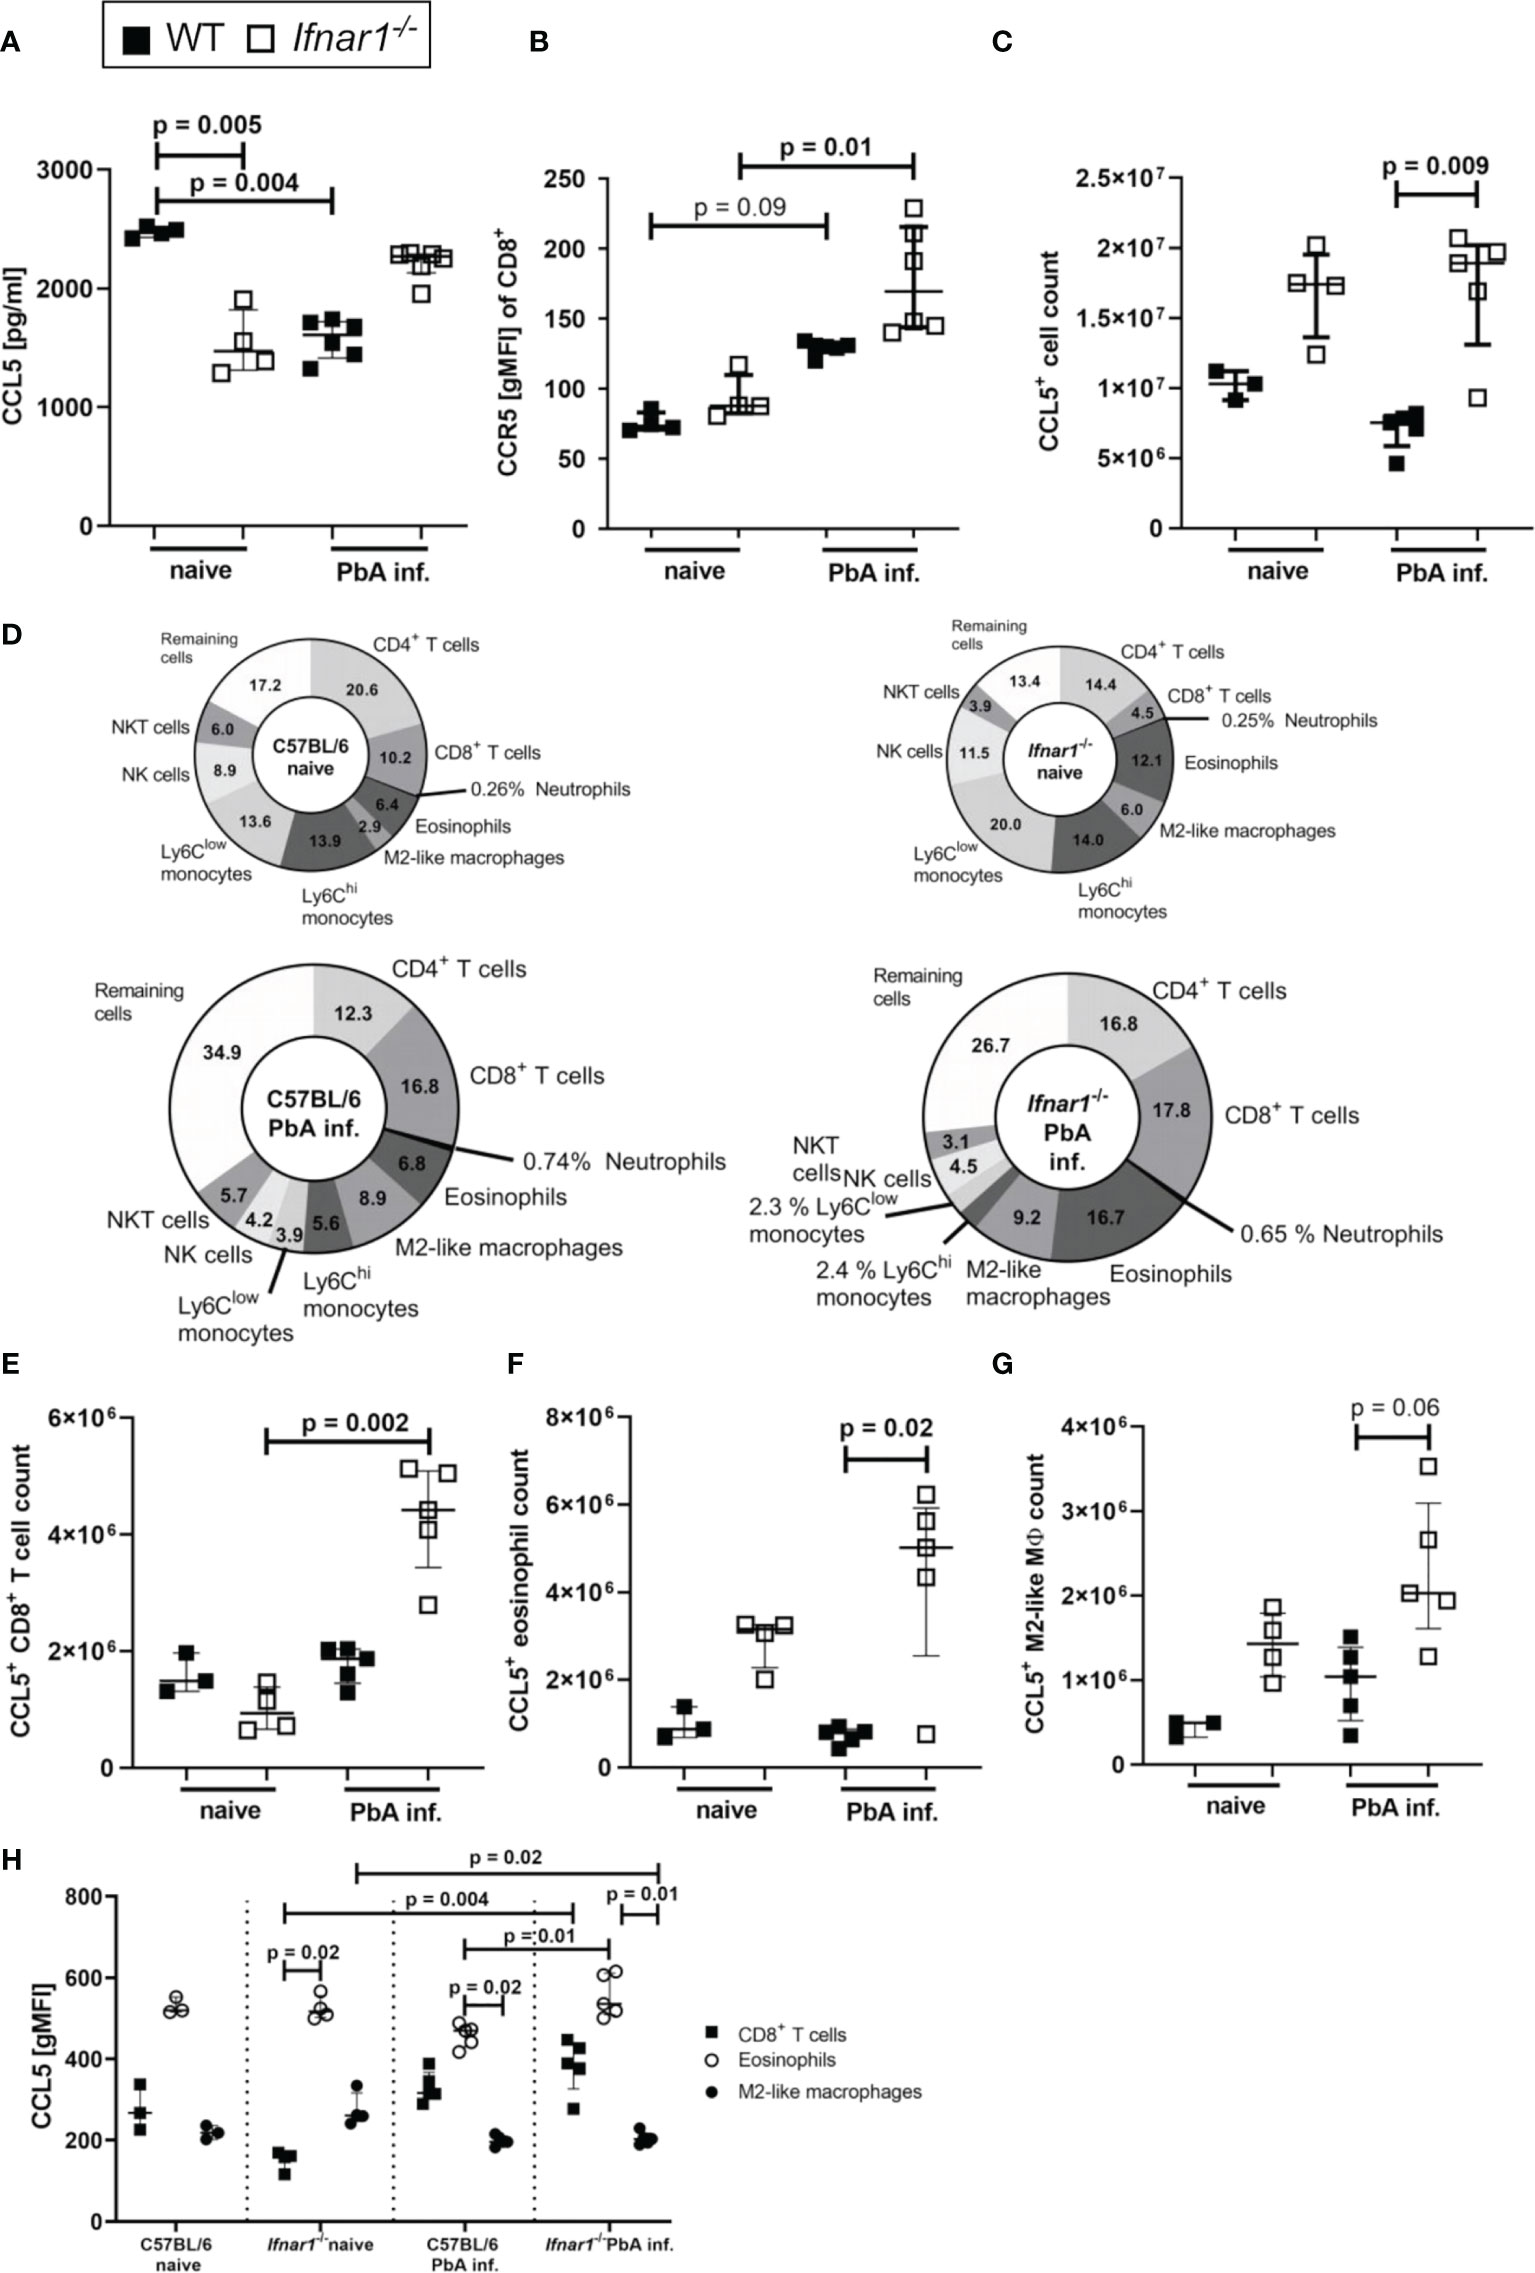
Figure 4 Increased secretion and expression of CCL5/CCR5 in ECM-protected Ifnar1-/- mice. (A–H) C57BL/6 WT mice and Ifnar1-/- mice were infected i.v. with 5x10⁴ PbAAma1OVA-infected red blood cells and spleen cells were analyzed ex vivo on day 6 p.i. by ELISA (A) and flow cytometry (B-H). (A) Cytokine quantification in total splenocyte culture supernatants after 24h for CCL5. (B) Expression of CCR5 on CD8+ T cells. (C) Total count of CCL5 expressing cells in the spleen. (D) Overview of CCL5 expressing cell populations in the spleens of naïve and PbA-inf. WT and Ifnar1-/- mice. (E) Total count of CCL5 expressing CD8+ T cells (CD3+CD8+), (F) CCL5 expressing eosinophils (CD8-CD11b+Ly6Cint-hiLy6G-SiglecF+) and (G) CCL5 expressing M2-like macrophages (CD11b+, Ly6G-, SiglecF-, F4/80+, Relmα+). (H) CCL5 expression in CD8+ T cells, eosinophils and M2-like macrophages. (A, B) n=4-6, representative for 3 individual experiments. (C–H) n=3-5, data from 1 experiment. (A–C, E–H) Data shown as median with IQR; Kruskal-Wallis with Dunn’s post-test. MØ, Macrophage; PbA inf., PbAAma1OVA-infected.
In the naïve status the composition of CCL5+ cells revealed a higher percentage of CCL5+ T cells in WT animals and higher percentages of CCL5+ eosinophils and M2-like macrophages in Ifnar1-/- mice (Figure 4D). Upon PbA-infection the proportion of CCL5+ monocytes vanished, so that CD8+ T cells (17.8%), CD4+ T cells (16.8%) and eosinophils (16.7%), together with M2-like macrophages (9.2%) were the main CCL5 producers in spleens of PbA-infected Ifnar1-/- mice (Figure 4D). There was an increase in the CCL5+ CD8+ T cell count (p=0.002) in Ifnar1-/- mice upon PbA-infection (Figure 4E). The CCL5+ eosinophil count was significantly higher (p=0.02) in the spleens of PbA-infected Ifnar1-/- mice compared to PbA-infected WT mice (Figure 4F). Concerning the CCL5+ M2-like macrophages, the cell numbers in the spleens of PbA-infected Ifnar1-/- mice roughly doubled compared to PbA-infected WT mice, but due to the small sample size no statistical significance (p=0.06) was reached (Figure 4G). Analysis of the CCL5 expression of each cell population revealed that eosinophils had the highest CCL5 expression in naïve groups of both WT and Ifnar1-/- mice (Figure 4H). Remarkably, eosinophils of PbA-infected Ifnar1-/- mice expressed significantly more CCL5 (p=0.01) than those of PbA-infected WT mice (Figure 4H), which might explain the differences in the splenic CCL5 level between WT and Ifnar1-/- mice. Taken together, these results suggest a role for eosinophils and the sustained production of CCL5 in the immune response towards PbA-infection in Ifnar1-/- mice that may contribute to ECM protection.
Expansion of Type 2-Associated Immune Cells and Accumulation of Eosinophils in Spleens of ECM Negative Ifnar1-/- Mice
After observing similar type 1-associated immune responses in both WT and Ifnar1-/- mice, but differences in CCL5 expression especially in eosinophils, we analyzed type 2-related cell populations and mediators in Ifnar1-/- mice and WT controls. The levels of regulatory IL-10 and the type 2-associated cytokine IL-13 were significantly increased in spleen cell cultures of infected Ifnar1-/- mice compared with cell cultures of uninfected mice (Figures 5A, B). This increase was not observed in cultures from infected vs uninfected WT mice indicating a general shift towards a type 2-associated immune response in Ifnar1-/-mice. Moreover, GATA3+ type 2 T helper (Th2) cells were analyzed (Figures 5C, D and S5B) and revealed a significant increase of these cells in the spleens of PbA-infected Ifnar1-/- mice compared to PbA-infected WT mice (Figure 5D). This increase was accompanied by significantly elevated eosinophil counts (Figures 5E, F and Figure S5C). Immunohistochemical analysis of PbA-infected WT and Ifnar1-/- spleens confirmed our flow cytometric observations and revealed higher numbers of eosinophils in ECM-protected PbA-infected Ifnar1-/- mice compared to PbA-infected WT mice, which rarely contained any eosinophils in the spleen (Figure 5G). Furthermore, type 2 immune response-related molecules from myeloid cells were increased in PbA-infected Ifnar1-/- mice, with significantly higher levels of urea, which is obtained after catalyzation of arginine by arginase (Figure 5H), as well as significant increases in the expression of YM-1 (Figure 5I).
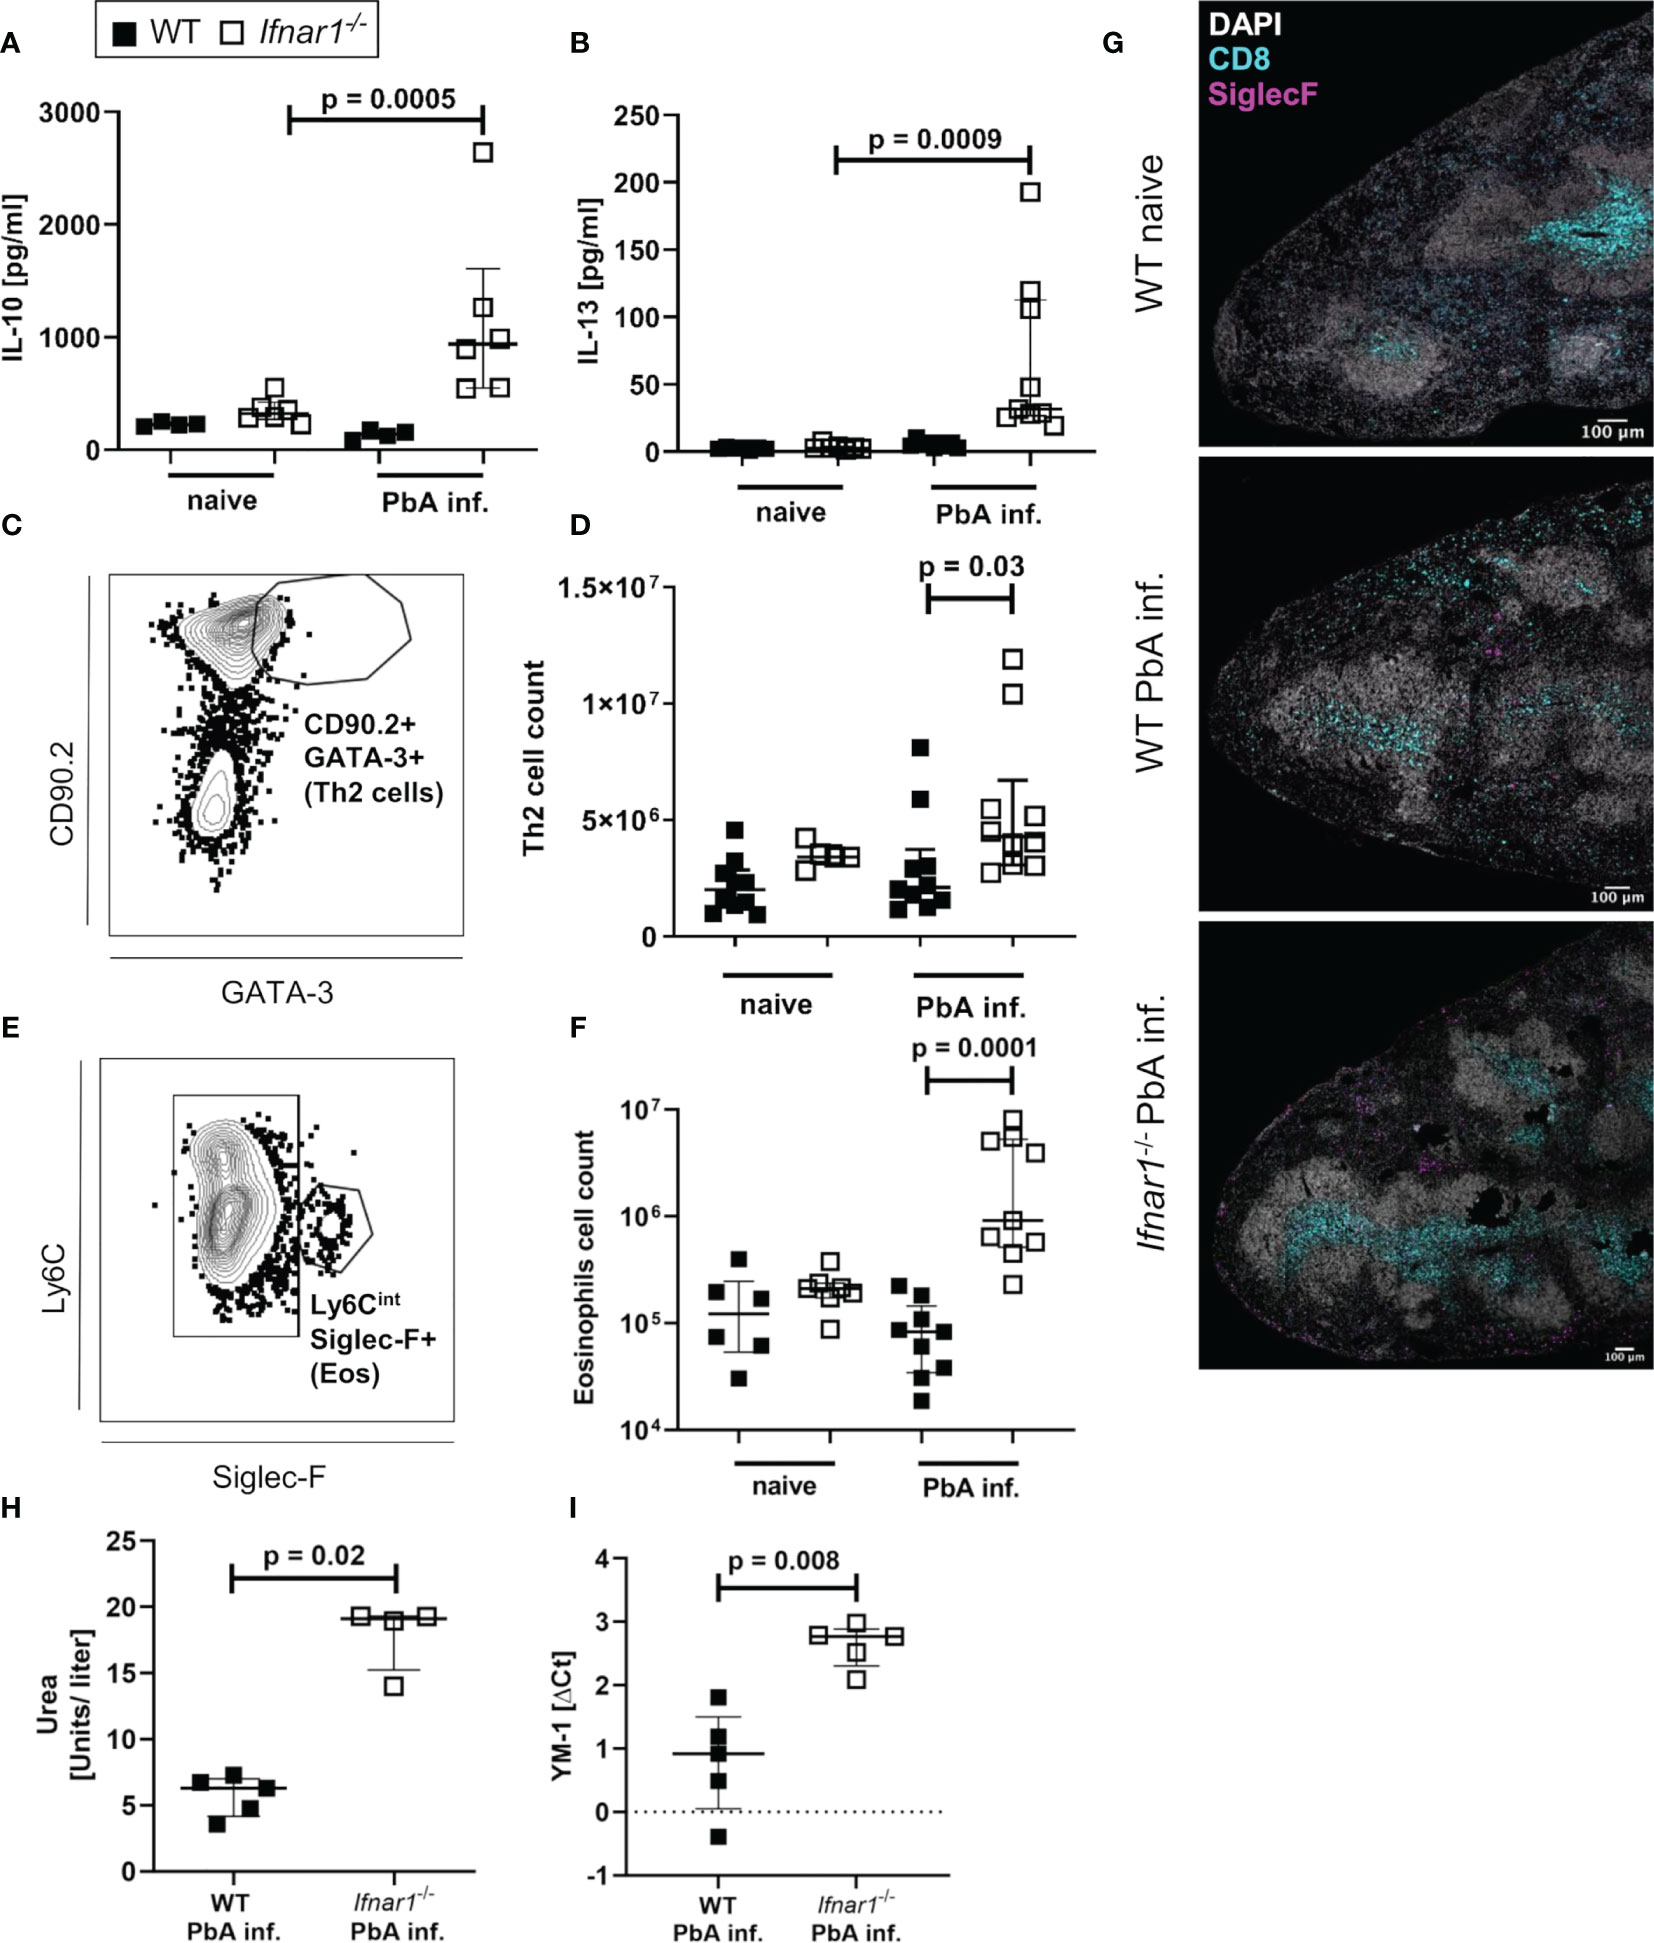
Figure 5 Enhanced type 2-associated immune response in the spleen of PbAAma1OVA-infected Ifnar1-/- mice. (A–I) C57BL/6 WT mice and Ifnar1-/- mice were infected i.v. with 5x10⁴ PbAAma1OVA-infected red blood cells and the spleen was analyzed ex vivo on day 6 p.i.. Cytokine quantification in total splenocyte culture supernatants after 24h for (A) IL-10 and (B) IL-13. (C) Gating of Th2 cells (gated on CD45+Lineage+TCRβ+cells) and (D) total count of Th2 spleen cells. (E) Gating of eosinophils (gated on CD8-CD11b+Ly6G-) and (F) total count of eosinophils in the spleen. (G) Representative immunohistochemical staining of spleen slides of PbA-infected WT and PbA-infected Ifnar1-/- mice for DNA (DAPI), CD8+ T cells (CD8) and eosinophils (SiglecF). Bar in pictures represents 100µm. (H, I) MACS-purified CD11b+ splenocytes from PbAAma1OVA-infected WT versus Ifnar1-/- mice on day 6 p.i. were analyzed for their (H) arginase activity by measuring urea production and expression of (I) YM-1 by PCR. Each sample was normalized to β-actin. The expression level was calculated as fold-increase against naïve controls. (A, B) n=4-6 per group, representative for 3 independent experiments. (D, F) n=5-9, pooled data from 2 individual experiments. (G) n=3, data from 1 experiment. (H) n=4-5, data representative for 2 individual experiments. (I) n=5, data from 1 experiment. (A, B, D, F, H, I) Data shown as median with IQR; Kruskal-Wallis with Dunn’s post-test. ΔCt, delta cycle threshold; PbA inf., PbAAma1OVA-infected.
Taken together, these data present a type 2-shifted immune response in ECM-protected Ifnar1-/- mice and strengthen the hypothesis of a protective role for eosinophils.
Eosinophils Contribute to ECM Protection in Ifnar1-/- Mice
After identifying eosinophils as major CCL5 producers and detecting significantly increased eosinophil numbers in the spleens of PbA-infected Ifnar1-/- mice, we analyzed whether eosinophils were key mediators for ECM protection in PbA-infected Ifnar1-/- mice.
Eosinophils were specifically depleted by administration of anti-SiglecF antibodies on day 3, 4 and 5 p.i. with PbA (Figure 6A and Figure S8), neutrophil counts were not affected. The depletion of eosinophils resulted in a partial loss of ECM protection in PbA-infected Ifnar1-/- mice with a nominal significant reduction (p=0.02) of RMCBS when comparing PbA-infected Ifnar1-/- mice to depleted Ifnar1-/- (Figure 6B). The parasitemia between PbA-infected Ifnar1-/- mice and eosinophil depleted PbA-infected Ifnar1-/- mice was comparable (Figure 6C). While PbA-infected Ifnar1-/- mice remained protected from ECM with scores ranging from 9-17, 50% of the PbA-infected Ifnar1-/- mice that were specifically depleted of eosinophils reached scores below 8 and were no longer protected from ECM. The drop of RMCBS in Ifnar1-/- mice after eosinophil depletion was partially based on reduced scores for toe pinch and pinna reflex, which could be related to neuronal malfunction as result of decreased BBB stability. In the brains, the count of CD45hi immune cells and the numbers of CD8+ T cells (p=0.03) were increased in the PbA-infected Ifnar1-/- mice that were depleted of eosinophils as compared to the Ifnar1-/- mice that had received the isotype control (Figures 6D, E). This raised the question whether the eosinophil-mediated protection was due to the retention of CD8+ T cells in the spleen. However, the splenomegaly in Ifnar1-/- mice subsisted in eosinophil depleted mice (Figure 6F) and percentages of CD8+ T cells in spleens of PbA-infected and eosinophil depleted Ifnar1-/- mice remained similar to infected Ifnar1-/- mice that received isotype control antibodies (Figure 6G). Furthermore, the count of CD8+ T cells was significantly higher in PbA-infected eosinophil-depleted Ifnar1-/- mice compared to naïve Ifnar1-/- mice (p=0.006) (Figure 6H). The activation of CD8+ T cells was not enhanced after eosinophil depletion (Figure S9). In line with these observations on CD8+ T cell numbers in the spleen, depletion of eosinophils in PbA-infected Ifnar1-/- did not alter the concentrations of the T cell recruiting chemokine CCL5 in the spleen (Figure 6I). Both, eosinophil-depleted and isotype treated Ifnar1-/- mice had higher levels of CCL5 in the spleens during PbA infection compared to the infected WT controls. Besides eosinophils, Th2 cell counts were significantly increased in the spleens of PbA-infected Ifnar1-/- mice compared to PbA-infected WT mice (p=0.0004) (Figure 6J). Following eosinophil depletion, Th2 cell numbers were still elevated in the PbA-infected Ifnar1-/- mice, although not statistically significant in comparison to the PbA-infected WT controls. Similarly, levels of the Th2 cytokine IL-13 were significantly increased in spleen cell cultures of PbA infected Ifnar1-/- mice compared to naïve controls, independent from the eosinophil depletion (Figure 6K). Cytokine analysis in the spleen further revealed the highest levels of IFN-γ in PbA-infected Ifnar1-/- mice depleted of eosinophils (Figure 6L). For GrzB the eosinophil depletion had no significant impact when comparing to PbA-infected Ifnar1-/- mice (Figure 6M). Overall, this suggests that the protection from ECM in Ifnar1-/- mice involves eosinophils by limiting the infiltration of CD8+ T cells into the brain, but this seems not to be due to an eosinophil-mediated retention of CD8+ T cells in the spleen via an enhanced CCL5 secretion.
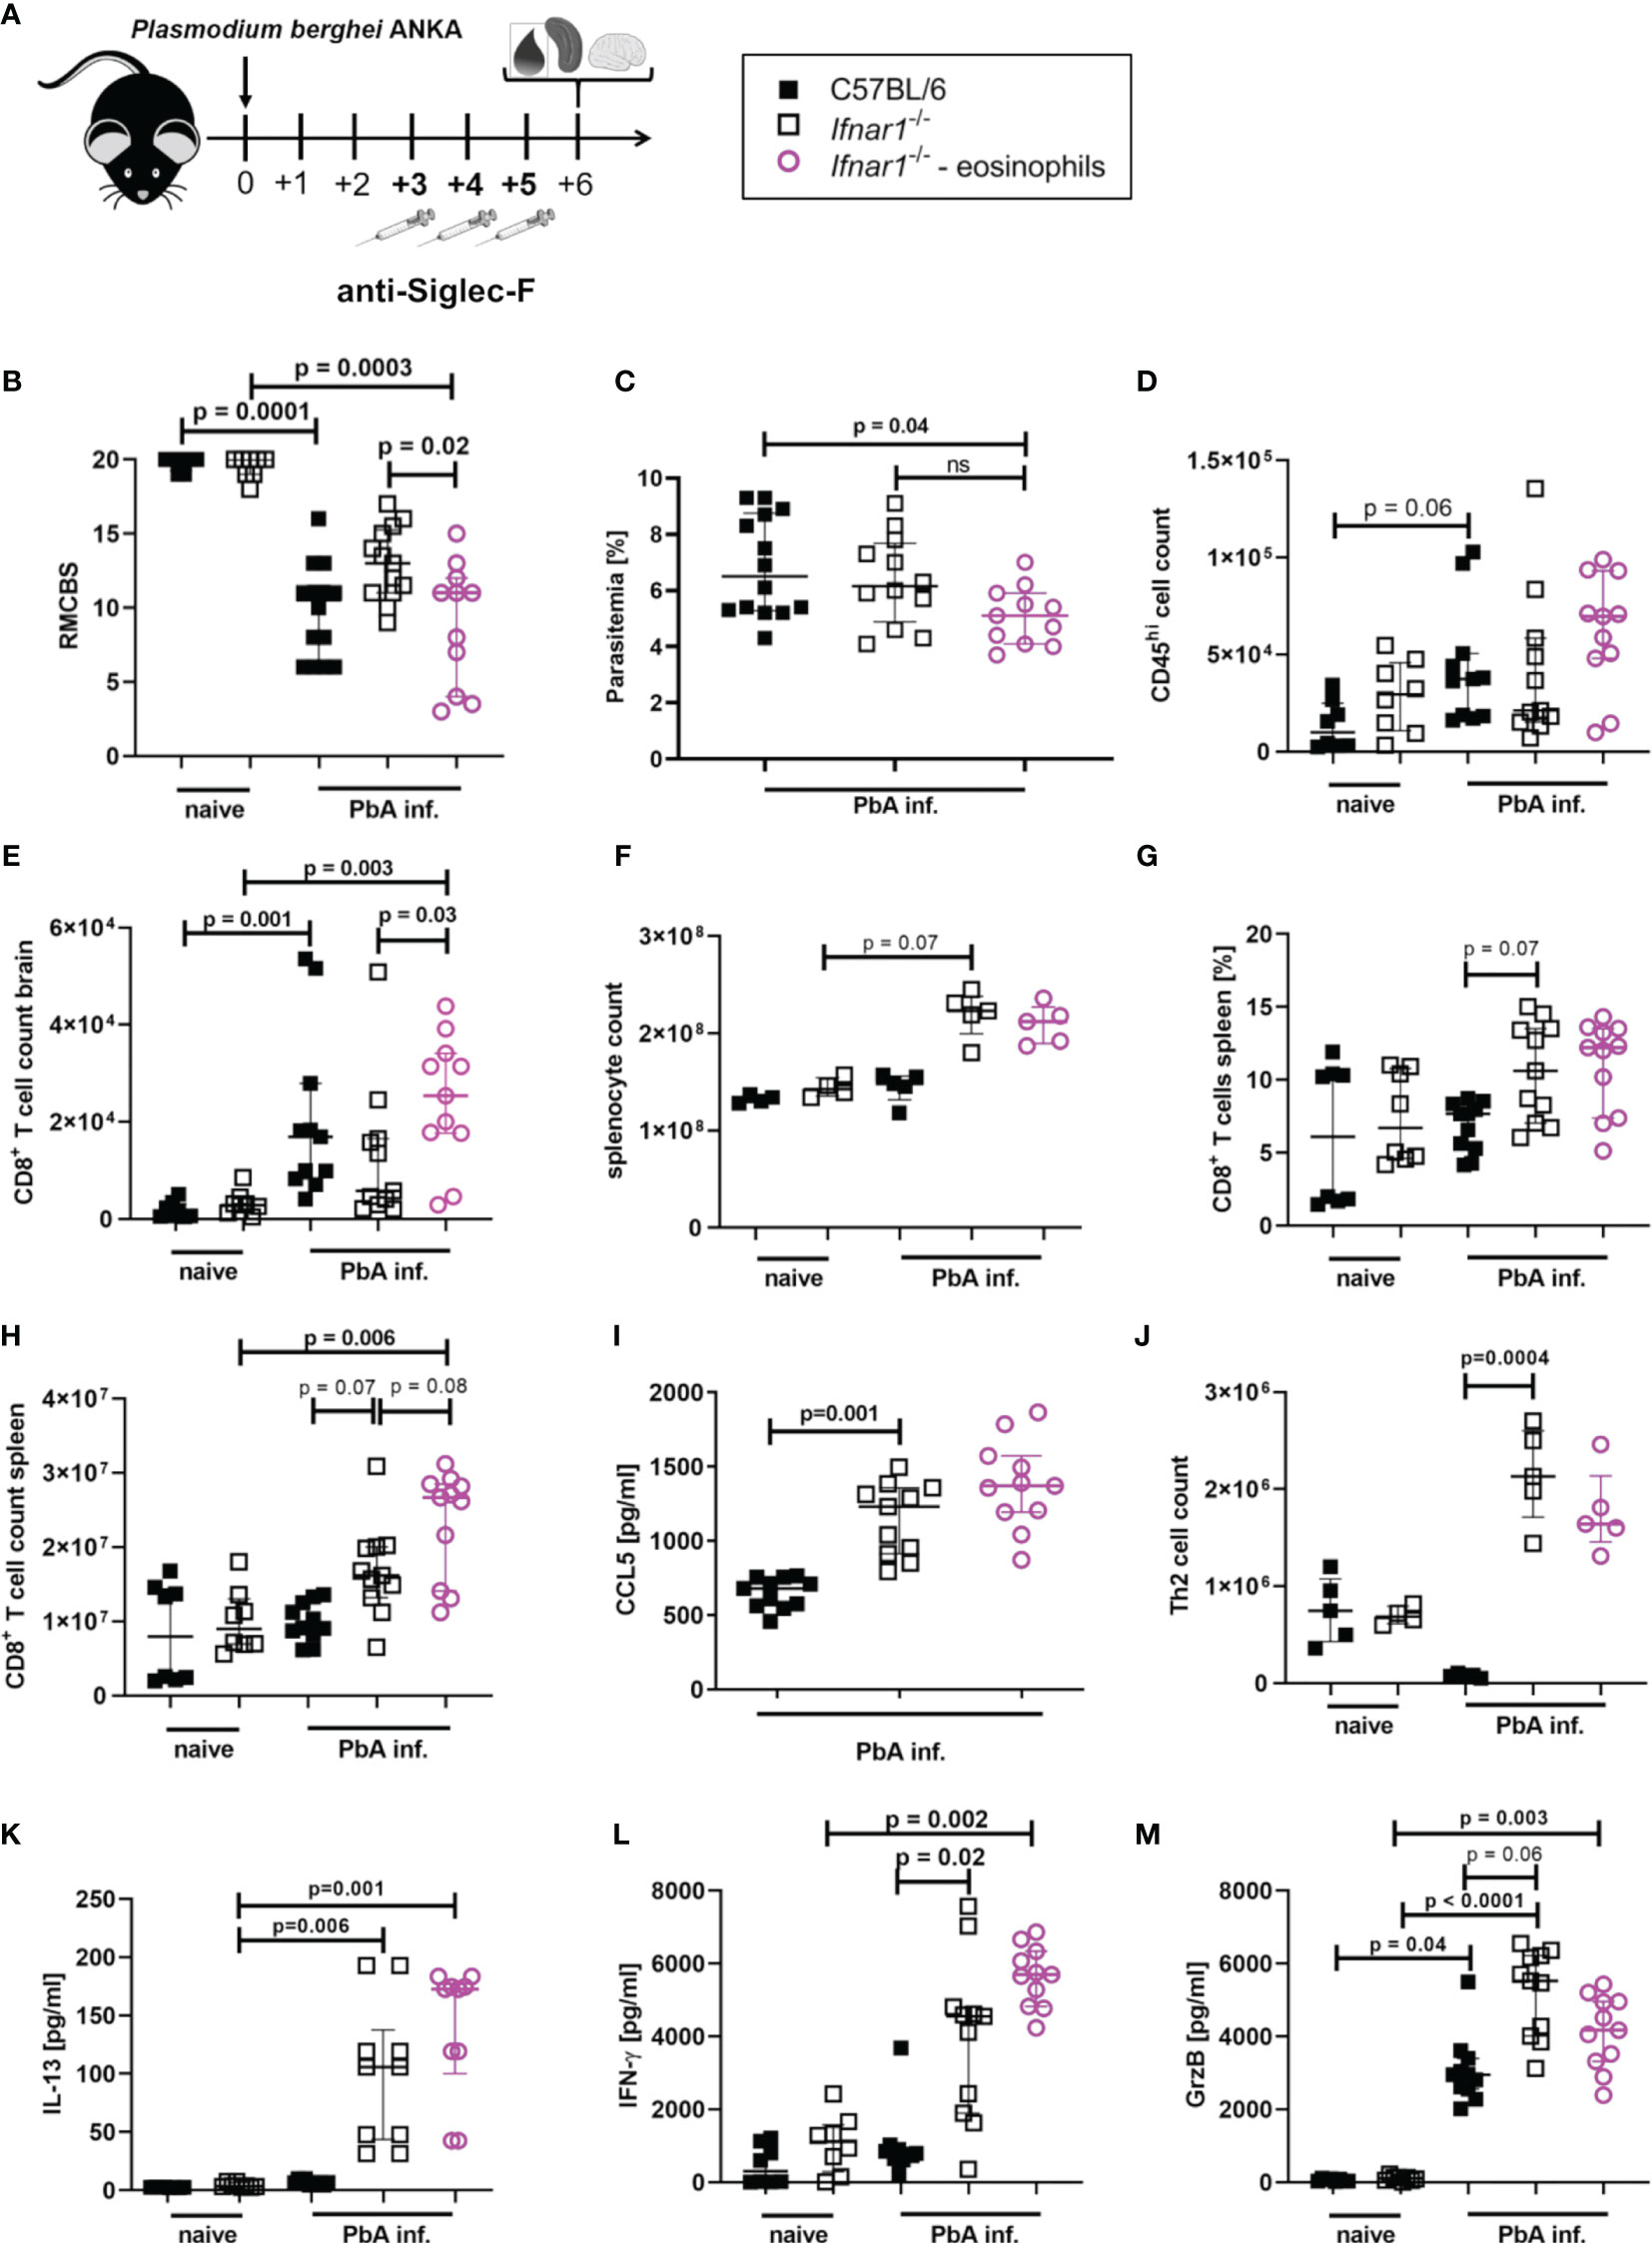
Figure 6 Eosinophil-mediated protection in PbAAma1OVA-infected Ifnar1-/- mice. (A–M) C57BL/6 WT mice and Ifnar1-/- mice were infected i.v. with 5x10⁴ PbAAma1OVA-infected red blood cells and a subset of Ifnar1-/- mice were depleted for eosinophils. (A) Experimental setup. (B) Neurological symptoms of PbA-infected (PbA inf.) mice according to the rapid murine coma and behavior scale (RMCBS) on day 6 p.i. compared to naïve WT controls. (C) Blood-stage parasitemia levels determined by Giemsa stains on day 6 p.i.. (D) Total count of brain infiltrated CD45hi leukocytes. (E) Total count of CD8+ T cells (CD3+CD8+) among infiltrated CD45hi-infiltrated leukocytes in the brain. (F) Total splenocyte count. (G) Frequency of CD8+ T cells (CD3+CD8+) among all splenocytes. (H) Total count of CD8+ T cells (CD3+CD8+) in the spleen. (I) CCL5 quantification in 24h unstimulated splenocyte culture supernatant. (J) Total count of Th2 cells (CD45+Lineage+TCRβ+CD90.2+GATA-3+) in the spleen. (K) IL-13, (L) IFN-γ and (M) Granzyme B (GrzB) quantification in 24h unstimulated splenocyte culture supernatant. (B, C) n=8-14, data pooled from 2 individual experiments. (D, E, G–I, K–M) n=8-11, data pooled from 2 individual experiments. (F, J) n=4-5, data from one experiment. (M) Data shown as median with IQR; Kruskal-Wallis with Dunn’s post-test. (B, F, G) Mann-Whitney-U-test between PbA-infected Ifnar1-/- vs. eosinophil-depleted Ifnar1-/-.GrzB, Granzyme B; ns, non-significant; PbA inf., PbAAma1OVA-infected.
Discussion
Immune activation during infection is a double-edged sword for the host. The effector cells and mediators generated to protect the host and eliminate Plasmodium parasites require tight control to prevent pathology and the development of CM (21). The interaction of effector immune mechanisms and their regulation during Plasmodium infections are still not yet understood in detail. Previous studies correlated genetic variations of IFNAR1 in African children and ECM models with protection from severe malaria (35, 50). In the present study we demonstrate that eosinophils support the protection of Ifnar1-/- mice from ECM development. The generation of fully functional parasite-specific cytotoxic T cell responses in the spleen of ECM-protected Ifnar1-/- mice was not impaired. However, those T cells were retained in the spleen and did not migrate into the brain where they could contribute to ECM. Moreover, spleens of PbA-infected Ifnar1-/- mice showed a type 2-shifted milieu with significantly increased numbers of eosinophils, and increased levels of the chemoattractant CCL5, which may contribute to the retention of T cells within the spleen.
In this study we used a newly generated transgenic P. berghei ANKA parasite clone that stably expresses OVA-derived peptides and causes ECM between day 6 and 9 p.i. in ≥90% of infected WT mice. This is in line with previous studies using other strains of P. berghei in WT mice (28, 35, 36). Furthermore, PbAAma1OVA-infected Ifnar1-/- mice showed a survival rate of 65% and comparable parasitemia as seen in infected WT mice, which was similar to the observations by Ball et al. and Palomo et al., whereas Edwards et al. described a reduced peripheral parasitemia in infected Ifnar1-/- mice (35, 36, 46). Sharma et al. reported a later ECM onset of P. berghei ANKA-infected WT mice and 100% protection of infected Ifnar1-/- mice (28). These inconsistences are likely due to different abilities of P. berghei ANKA clones to induce ECM, as well as differences in dose and route of infection used (51).
In mice, ECM pathology has been strongly associated to effector CD8+ T cells primed in the spleen that infiltrate the brain (52, 53). The induction of Plasmodium-specific T cells in infected WT mice towards antigens from different life cycle stages of PbA parasites has been shown before (54, 55). Using PbAAma1OVA transgenic parasites expressing ovalbumin-derived peptides during the blood stage, we demonstrate that OVA-specific CD8+ T cell responses in infected Ifnar1-/- mice are comparable to those in infected WT mice. This implies that an efficient priming by dendritic cells occurred, despite the systemic lack of type I IFN signaling in the genetically deficient mice. Accordingly, splenic CD8+ T cells in ECM-protected Ifnar1-/- mice and susceptible WT controls expressed similar levels of IFN-γ. Also, GrzB levels in whole splenocyte cultures were comparable in all infected groups. Both mediators are known to contribute to ECM development (21, 52, 56). These results support findings from other groups (57, 58). Thus, type I IFN signaling is dispensable for the development of CTL responses during PbAAma1OVA infection. We conclude that the protection of Ifnar1-/- mice from ECM was not due to generally impaired or inefficient antigen priming or CTL responses in the spleen, but rather to differences in the T cell recruitment to the brain in the course of PbA infection. Brains of PbA-infected and ECM protected Ifnar1-/- mice contained lower numbers of recruited CD8+ T cells in our study. Such a reduced T cell infiltration into the brains of Ifnar1-/- mice was previously reported by other studies focusing on type I IFN signaling during P. berghei ANKA infection (35, 36). Ball et al. showed by elegant transfer experiments that local stimulation via the type I IFN receptor on T cells is crucial for T cell accumulation in the brains of infected mice (35), although an altered generation of parasite-specific effector CD8+ T cells in the spleen could not be excluded in their study.
T cell influx into the brain during ECM requires CXCR3 and CCR5 (48, 59) and their ligands — CCL3, CCL5, CXCL9 and CXCL10 — are known to be induced in brains of ECM susceptible mice (48, 59, 60). Our study revealed that brains of ECM-protected Ifnar1-/- mice contained lower levels of CCL3 and CCL5, which may be due to the reduced number of myeloid cells in brains of these mice. In addition to activated T cells, macrophages and monocytes are described as possible sources of CCL5 (61). Interestingly, microglia are an additional source of CCL3 and CCL5 (62) and CCL5 production by microglia from PbA-infected WT mice was suggested to be driven by type I IFN (63). Thus, lower levels of CCL5 in brain samples from PbA-infected Ifnar1-/- mice could be associated with the genetically disrupted type I IFN signaling. However, CCL5 concentrations and populations of CCL5-positive cells were significantly increased in spleens of PbA-infected Ifnar1-/- mice, with CD8+ T cells, CD4+ T cells, eosinophils and M2-like macrophages being the main cell populations expressing CCL5 with eosinophils showing the highest expression. This may result in increased T cell retention in the spleen and thus reduced influx of effector cells into the brain, thereby preventing ECM pathology in Ifnar1-/- mice.
Besides elevated numbers of CD8+ T cells in the brains of ECM positive mice, we also found higher numbers of lineage positive NK cells. Both cell types are potent producers of pro-inflammatory mediators such as IFN-γ and GrzB and are recruited via CCL5 (64, 65). However, while depletion of CD8+ T cells results in the protection from ECM in WT mice, there are contradictory reports about the effect of NK cell depletion on ECM onset (13, 49, 66, 67), which could be due to differences in the depletion antibodies used with anti-asialo GM1 leading to protection in WT mice in contrast to anti-NK1.1 (13, 66). Apart from that, depletion of NK cells in the ECM model was not performed so far for ECM-protected Ifnar1-/- mice although, NK cells showed a lower activation level in the spleen in these mice suggesting an involvement in the protected phenotype. In our study, similar to the results of the anti-NK1.1 treatment in WT mice, depletion of NK cells via anti-NK1.1 had no impact on ECM protection in Ifnar1-/- mice, as no differences in inflammation and disease severity were observed.
Despite the retention of IFN-γ and GrzB-producing NK and T cells in the spleens of PbA-infected Ifnar1-/- mice, we detected high levels of the type 2 cytokines IL-10 and IL-13 in spleens of infected Ifnar1-/- mice. IL-10 is an anti-inflammatory cytokine (68) and may contribute to control the inflammation in Ifnar1-/- mice. The induction of a type 2 immune response within the spleens of Ifnar1-/- mice was further highlighted by the increased production of M2-like macrophage-derived urea and YM-1, as well as the presence of eosinophils. Upon PbA infection in WT mice, the immune system shifts towards a type 1 immune response and eosinophils in the spleen disappear. In contrast, the lack of type I interferon signaling resulted in the maintenance of eosinophils. Interestingly, eosinophils, Th2 cells and alternatively activated (M2) macrophage-driven immune responses are commonly induced by helminths and have the potential to downregulate type 1-driven immune responses. Thus, a protection from excessive inflammation in mice lacking type I IFN signaling was associated with the induction of type 2 immune responses that are usually associated with helminth infections. Accordingly, experimental studies described that co-infections with filariae result in the protection from ECM in an IL-10 dependent manner, although the role of eosinophils was not investigated so far (69).
Depletion of eosinophils in PbA-infected Ifnar1-/- mice confirmed that eosinophils are involved in mediating protection from ECM development, since neurological malfunctions, assessed by the RMCBS, were manifested in depleted animals. Such a potentially protective role of eosinophils was indicated by earlier studies in human patients, as increased eosinophil numbers in the blood were associated with asymptomatic malaria, while eosinophils were reduced during the onset of acute symptoms (70). However, the lower numbers of eosinophils from patients with acute symptoms showed increased activation based on the plasma levels of eosinophil granula proteins. The authors suggest that this eosinophil activation was not part of a Th2-associated immune response and the activation of eosinophils might also contribute to pathogenesis during malaria. Another study linked polymorphisms in the gene for eosinophil cationic protein with the susceptibility to CM (71). Thus, further studies are required to pinpoint the role of eosinophils during the pathogenesis of malaria. In general, it is known that eosinophils are able to exert pro-inflammatory, type 2 immune inducing or even anti-inflammatory effects and the local and systemic immunological milieu may be essential for their protective or detrimental role during malaria.
In our study, Ifnar1-/- mice showed a generalized type 2 immune dominance that was not reversed after eosinophil depletion, since Th2 cell numbers and IL-13 production by splenocytes remained stable. Similarly, CCL5 levels and CD8+ T cell numbers in the spleen remained increased in eosinophil-depleted Ifnar1-/- mice, suggesting that eosinophils were not essential for the maintenance of type 2 immune responses and the retention of CD8+ T cell populations in the spleen in Ifnar1-/- mice. Nevertheless, the depletion of eosinophils resulted in increased CD8+ T cell numbers in the brains of Ifnar1-/- mice, indicating that eosinophils do protect Ifnar1-/- mice from ECM by limiting the infiltration of CD8+ T cells into the brain by a mechanism that has still to be defined.
Taken together, our data provide important new aspects of type I IFN signaling in the initiation of ECM pathology. We conclude that in PbA-infected Ifnar1-/- mice functional effector T cells are induced, but their migration into the brain was hampered. This protective effect in Ifnar1-/- mice was partially dependent on eosinophils, arguably by limiting the proliferation and migration of CD8+ T cells into the brain.
Data Availability Statement
The original contributions presented in the study are included in the article/Supplementary Material. Further inquiries can be directed to the corresponding author.
Ethics Statement
The animal study was reviewed and approved by Landesamt für Natur, Umwelt und Verbraucherschutz, Recklinghausen, Germany.
Author Contributions
Conceived and designed the experiments: PK, JR, JS, JK, AH, MH, and BS. Performed the experiments: PK, JK, JR, JS, CH-K, ML, MB, KS, KK, DE, CS, and ST. Creation of mutant parasites: CH-K, ML, and A-KM. Analyzed the data: PK, JR, JS, JK, DE, and BS. Contributed reagents/materials/analysis tools: AL, DE, MH, and AH. Wrote the manuscript: PK, JR, JS, MH, and BS. All authors contributed to the article and approved the submitted version.
Funding
PK was supported by a PhD scholarship from the German Academic Exchange program (DAAD). JR and JS were supported by a PhD scholarship from the Jürgen Manchot Stiftung, Düsseldorf, Germany. JK, JR, JS, and BS were supported by BONFOR 2012-01-22, 2013-01-29, 2017-5-02, 2018-7-01, 2018-7-02, 2019-7-01, 2019-7-02, and 2020-7-03. A-KM is a recipient of a DZIF funded Maternity Leave stipend. AH and BS were members of the Bonn Cluster of Excellence ImmunoSensation EXC 1023 and AH and MH are funded by the Deutsche Forschungsgemeinschaft (DFG, German Research Foundation) under Germany’s Excellence Strategy – EXC2151 – 390873048. AH and MH are members of the German Center for Infection Research (DZIF).
Conflict of Interest
The authors declare that the research was conducted in the absence of any commercial or financial relationships that could be construed as a potential conflict of interest.
Publisher’s Note
All claims expressed in this article are solely those of the authors and do not necessarily represent those of their affiliated organizations, or those of the publisher, the editors and the reviewers. Any product that may be evaluated in this article, or claim that may be made by its manufacturer, is not guaranteed or endorsed by the publisher.
Acknowledgments
We thank the FCCF Core Facility of the University Hospital Bonn for excellent technical assistance. The b3D+ targeting vector was kindly provided by Kai Matuschewski and Markus Ganter, MPI for Infection Biology Berlin.
Supplementary Material
The Supplementary Material for this article can be found online at: https://www.frontiersin.org/articles/10.3389/fimmu.2021.711876/full#supplementary-material
References
1. World Health Organization. World Malaria Report 2019. [S.l.]. Geneva: World Health Organization (2019).
2. Schofield L, Grau GE. Immunological Processes in Malaria Pathogenesis. Nat Rev Immunol (2005) 5):722–35. doi: 10.1038/nri1686
3. Gazzinelli RT, Kalantari P, Fitzgerald KA, Golenbock DT. Innate Sensing of Malaria Parasites. Nat Rev Immunol (2014) 14):744–57. doi: 10.1038/nri3742
4. Gun SY, Claser C, Tan KSW, Rénia L. Interferons and Interferon Regulatory Factors in Malaria. Mediators Inflammation (2014) 2014:243713. doi: 10.1155/2014/243713
5. de Souza JB, Hafalla JCR, Riley EM, Couper KN. Cerebral Malaria: Why Experimental Murine Models are Required to Understand the Pathogenesis of Disease. Parasitology (2010) 137(5):755–72. doi: 10.1017/S0031182009991715
6. Ghazanfari N, Mueller SN, Heath WR. Cerebral Malaria in Mouse and Man. Front Immunol (2018) 9:2016. doi: 10.3389/fimmu.2018.02016
7. Franklin BS, Parroche P, Ataíde MA, Lauw F, Ropert C, de Oliveira RB, et al. Malaria Primes the Innate Immune Response Due to Interferon-Gamma Induced Enhancement of Toll-Like Receptor Expression and Function. Proc Natl Acad Sci U.S.A. (2009) 106(14):5789–94. doi: 10.1073/pnas.0809742106
8. Grau GE, Heremans H, Piguet PF, Pointaire P, Lambert PH, Billiau A, et al. Monoclonal Antibody Against Interferon Gamma can Prevent Experimental Cerebral Malaria and Its Associated Overproduction of Tumor Necrosis Factor. Proc Natl Acad Sci USA (1989) 86(14):5572–4. doi: 10.1073/pnas.86.14.5572
9. Grau GE, Taylor TE, Molyneux ME, Wirima JJ, Vassalli P, Hommel M, et al. Tumor Necrosis Factor and Disease Severity in Children With Falciparum Malaria. N Engl J Med (1989) 320(24):1586–91. doi: 10.1056/NEJM198906153202404
10. Cabantous S, Poudiougou B, Traore A, Keita M, Cisse MB, Doumbo O, et al. Evidence That Interferon-Gamma Plays a Protective Role During Cerebral Malaria. J Infect Dis (2005) 192(5):854–60. doi: 10.1086/432484
11. Gimenez F, Barraud de Lagerie S, Fernandez C, Pino P, Mazier D. Tumor Necrosis Factor Alpha in the Pathogenesis of Cerebral Malaria. Cell Mol Life Sci (2003) 60(8):1623–35. doi: 10.1007/s00018-003-2347-x
12. Leão L, Puty B, Dolabela MF, Povoa MM, Né YGDS, Eiró LG, et al. Association of Cerebral Malaria and TNF-α Levels: A Systematic Review. BMC Infect Dis (2020) 20(1):442. doi: 10.1186/s12879-020-05107-2
13. Yañez DM, Manning DD, Cooley AJ, Weidanz WP, van der Heyde HC. Participation of Lymphocyte Subpopulations in the Pathogenesis of Experimental Murine Cerebral Malaria. J Immunol (1996) 157(4):1620–4.
14. Hermsen C, van de Wiel T, Mommers E, Sauerwein R, Eling W. Depletion of CD4+ or CD8+ T-Cells Prevents Plasmodium Berghei Induced Cerebral Malaria in End-Stage Disease. Parasitology (1997) 114(Pt 1):7–12. doi: 10.1017/S0031182096008293
15. Claser C, Malleret B, Gun SY, Wong AYW, Chang ZW, Teo P, et al. CD8+ T Cells and IFN-γ Mediate the Time-Dependent Accumulation of Infected Red Blood Cells in Deep Organs During Experimental Cerebral Malaria. PloS One (2011) 6(4):e18720. doi: 10.1371/journal.pone.0018720
16. Deroost K, Pham T-T, Opdenakker G, van den Steen PE. The Immunological Balance Between Host and Parasite in Malaria. FEMS Microbiol Rev (2016) 40(2):208–57. doi: 10.1093/femsre/fuv046
17. Howland SW, Claser C, Poh CM, Gun SY, Rénia L. Pathogenic CD8+ T Cells in Experimental Cerebral Malaria. Semin Immunopathol (2015) 37(3):221–31. doi: 10.1007/s00281-015-0476-6
18. D’Ombrain MC, Robinson LJ, Stanisic DI, Taraika J, Bernard N, Michon P, et al. Association of Early Interferon-Gamma Production With Immunity to Clinical Malaria: A Longitudinal Study Among Papua New Guinean Children. Clin Infect Dis (2008) 47(11):1380–7. doi: 10.1086/592971
19. Pombo DJ, Lawrence G, Hirunpetcharat C, Rzepczyk C, Bryden M, Cloonan N, et al. Immunity to Malaria After Administration of Ultra-Low Doses of Red Cells Infected With Plasmodium Falciparum. Lancet (2002) 360(9333):610–7. doi: 10.1016/S0140-6736(02)09784-2
20. Mitchell AJ, Hansen AM, Hee L, Ball HJ, Potter SM, Walker JC, et al. Early Cytokine Production Is Associated With Protection From Murine Cerebral Malaria. Infect Immun (2005) 73(9):5645–53. doi: 10.1128/IAI.73.9.5645-5653.2005
21. King T, Lamb T. Interferon-γ: The Jekyll and Hyde of Malaria. PloS Pathog (2015) 11(10):e1005118. doi: 10.1371/journal.ppat.1005118
22. Mooney JP, Wassmer SC, Hafalla JC. Type I Interferon in Malaria: A Balancing Act. Trends Parasitol (2017) 33(4):257–60. doi: 10.1016/j.pt.2016.12.010
23. Yu X, Cai B, Wang M, Tan P, Ding X, Wu J, et al. Cross-Regulation of Two Type I Interferon Signaling Pathways in Plasmacytoid Dendritic Cells Controls Anti-Malaria Immunity and Host Mortality. Immunity (2016) 45(5):1093–107. doi: 10.1016/j.immuni.2016.10.001
24. Kim CC, Nelson CS, Wilson EB, Hou B, DeFranco AL, DeRisi JL. Splenic Red Pulp Macrophages Produce Type I Interferons as Early Sentinels of Malaria Infection But Are Dispensable for Control. PloS One (2012) 7(10):e48126. doi: 10.1371/journal.pone.0048126
25. Wu J, Tian L, Yu X, Pattaradilokrat S, Li J, Wang M, et al. Strain-Specific Innate Immune Signaling Pathways Determine Malaria Parasitemia Dynamics and Host Mortality. PNAS (2014) 111(4):E511–20. doi: 10.1073/pnas.1316467111
26. Haque A, Best SE, Ammerdorffer A, Desbarrieres L, de Oca MM, Amante FH, et al. Type I Interferons Suppress CD4⁺ T-Cell-Dependent Parasite Control During Blood-Stage Plasmodium Infection. Eur J Immunol (2011) 41(9):2688–98. doi: 10.1002/eji.201141539
27. Huang KY, Schultz WW, Gordon FB. Interferon Induced by Plasmodium Berghei. Science (1968) 162(3849):123–4. doi: 10.1126/science.162.3849.123
28. Sharma S, DeOliveira RB, Kalantari P, Parroche P, Goutagny N, Jiang Z, et al. Innate Immune Recognition of an AT-Rich Stem-Loop DNA Motif in the Plasmodium Falciparum Genome. Immunity (2011) 35(2):194–207. doi: 10.1016/j.immuni.2011.05.016
29. Yao X, Wu J, Lin M, Sun W, He X, Gowda C, et al. Increased CD40 Expression Enhances Early STING-Mediated Type I Interferon Response and Host Survival in a Rodent Malaria Model. PloS Pathog (2016) 12(10):e1005930. doi: 10.1371/journal.ppat.1005930
30. Zander RA, Guthmiller JJ, Graham AC, Pope RL, Burke BE, Carr DJJ, et al. Type I Interferons Induce T Regulatory 1 Responses and Restrict Humoral Immunity During Experimental Malaria. PloS Pathog (2016) 12(10):e1005945. doi: 10.1371/journal.ppat.1005945
31. Haque A, Best SE, Montes de Oca M, James KR, Ammerdorffer A, Edwards CL, et al. Type I IFN Signaling in CD8- DCs Impairs Th1-Dependent Malaria Immunity. J Clin Invest (2014) 124(6):2483–96. doi: 10.1172/JCI70698
32. Sebina I, Haque A. Effects of Type I Interferons in Malaria. Immunology (2018) 155(2):176–85. doi: 10.1111/imm.12971
33. Amante FH, Haque A, Stanley AC, Rivera FDL, Randall LM, Wilson YA, et al. Immune-Mediated Mechanisms of Parasite Tissue Sequestration During Experimental Cerebral Malaria. J Immunol (2010) 185(6):3632–42. doi: 10.4049/jimmunol.1000944
34. Belnoue E, Kayibanda M, Vigario AM, Deschemin J-C, van Rooijen N, Viguier M, et al. On the Pathogenic Role of Brain-Sequestered αβ CD8+ T Cells in Experimental Cerebral Malaria. J Immunol (2002) 169(11):6369–75. doi: 10.4049/jimmunol.169.11.6369
35. Ball EA, Sambo MR, Martins M, Trovoada MJ, Benchimol C, Costa J, et al. IFNAR1 Controls Progression to Cerebral Malaria in Children and CD8+ T Cell Brain Pathology in Plasmodium Berghei-Infected Mice. J Immunol (2013) 190(10):5118–27. doi: 10.4049/jimmunol.1300114
36. Palomo J, Fauconnier M, Coquard L, Gilles M, Meme S, Szeremeta F, et al. Type I Interferons Contribute to Experimental Cerebral Malaria Development in Response to Sporozoite or Blood-Stage Plasmodium Berghei ANKA. Eur J Immunol (2013) 43(10):2683–95. doi: 10.1002/eji.201343327
37. Curtsinger JM, Valenzuela JO, Agarwal P, Lins D, Mescher MF. Type I IFNs Provide a Third Signal to CD8 T Cells to Stimulate Clonal Expansion and Differentiation. J Immunol (2005) 174(8):4465–9. doi: 10.4049/jimmunol.174.8.4465
38. Hwang SY, Hertzog PJ, Holland KA, Sumarsono SH, Tymms MJ, Hamilton JA, et al. A Null Mutation in the Gene Encoding a Type I Interferon Receptor Component Eliminates Antiproliferative and Antiviral Responses to Interferons Alpha and Beta and Alters Macrophage Responses. Proc Natl Acad Sci USA (1995) 92(24):11284–8. doi: 10.1073/pnas.92.24.11284
39. Carroll RW, Wainwright MS, Kim K-Y, Kidambi T, Gómez ND, Taylor T, et al. A Rapid Murine Coma and Behavior Scale for Quantitative Assessment of Murine Cerebral Malaria. PloS One (2010) 5(10):e13124. doi: 10.1371/journal.pone.0013124
40. Silvie O, Goetz K, Matuschewski K. A Sporozoite Asparagine-Rich Protein Controls Initiation of Plasmodium Liver Stage Development. PloS Pathog (2008) 4(6):e1000086. doi: 10.1371/journal.ppat.1000086
41. Janse CJ, Franke-Fayard B, Mair GR, Ramesar J, Thiel C, Engelmann S, et al. High Efficiency Transfection of Plasmodium Berghei Facilitates Novel Selection Procedures. Mol Biochem Parasitol (2006) 145(1):60–70. doi: 10.1016/j.molbiopara.2005.09.007
42. Schumak B, Klocke K, Kuepper JM, Biswas A, Djie-Maletz A, Limmer A, et al. Specific Depletion of Ly6C(hi) Inflammatory Monocytes Prevents Immunopathology in Experimental Cerebral Malaria. PloS One (2015) 10(4):e0124080. doi: 10.1371/journal.pone.0124080
43. Pfaffl MW. A New Mathematical Model for Relative Quantification in Real-Time RT-PCR. Nucleic Acids Res (2001) 29(9):e45. doi: 10.1093/nar/29.9.e45
44. Belnoue E, Potter SM, Rosa DS, Mauduit M, Grüner AC, Kayibanda M, et al. Control of Pathogenic CD8+ T Cell Migration to the Brain by IFN-Gamma During Experimental Cerebral Malaria. Parasite Immunol (2008) 30(10):544–53. doi: 10.1111/j.1365-3024.2008.01053.x
45. Edwards CL, Zhang V, Werder RB, Best SE, Sebina I, James KR, et al. Coinfection With Blood-Stage Plasmodium Promotes Systemic Type I Interferon Production During Pneumovirus Infection But Impairs Inflammation and Viral Control in the Lung. Clin Vaccine Immunol (2015) 22(5):477–83. doi: 10.1128/CVI.00051-15
46. Edwards CL, Best SE, Gun SY, Claser C, James KR, de Oca MM, et al. Spatiotemporal Requirements for IRF7 in Mediating Type I IFN-Dependent Susceptibility to Blood-Stage Plasmodium Infection. Eur J Immunol (2015) 45(1):130–41. doi: 10.1002/eji.201444824
47. Miu J, Mitchell AJ, Müller M, Carter SL, Manders PM, McQuillan JA, et al. Chemokine Gene Expression During Fatal Murine Cerebral Malaria and Protection Due to CXCR3 Deficiency. J Immunol (2008) 180(2):1217–30. doi: 10.4049/jimmunol.180.2.1217
48. Belnoue E, Kayibanda M, Deschemin J-C, Viguier M, Mack M, Kuziel WA, et al. CCR5 Deficiency Decreases Susceptibility to Experimental Cerebral Malaria. Blood (2003) 101(11):4253–9. doi: 10.1182/blood-2002-05-1493
49. Burrack KS, Hart GT, Hamilton SE. Contributions of Natural Killer Cells to the Immune Response Against Plasmodium. Malar J (2019) 18(1):321. doi: 10.1186/s12936-019-2953-1
50. Aucan C, Walley AJ, Hennig BJW, Fitness J, Frodsham A, Zhang L, et al. Interferon-Alpha Receptor-1 (IFNAR1) Variants Are Associated With Protection Against Cerebral Malaria in the Gambia. Genes Immun (2003) 4(4):275–82. doi: 10.1038/sj.gene.6363962
51. Amani V, Boubou MI, Pied S, Marussig M, Walliker D, Mazier D, et al. Cloned Lines of Plasmodium Berghei ANKA Differ in Their Abilities to Induce Experimental Cerebral Malaria. Infect Immun (1998) 66(9):4093–9. doi: 10.1128/IAI.66.9.4093-4099.1998
52. Haque A, Best SE, Unosson K, Amante FH, de Labastida F, Anstey NM, et al. Granzyme B Expression by CD8+ T Cells is Required for the Development of Experimental Cerebral Malaria. J Immunol (2011) 186(11):6148–56. doi: 10.4049/jimmunol.1003955
53. Nitcheu J, Bonduelle O, Combadiere C, Tefit M, Seilhean D, Mazier D, et al. Perforin-Dependent Brain-Infiltrating Cytotoxic CD8+ T Lymphocytes Mediate Experimental Cerebral Malaria Pathogenesis. J Immunol (2003) 170(4):2221–8. doi: 10.4049/jimmunol.170.4.2221
54. Lundie RJ, de Koning-Ward TF, Davey GM, Nie CQ, Hansen DS, Lau LS, et al. Blood-Stage Plasmodium Infection Induces CD8+ T Lymphocytes to Parasite-Expressed Antigens, Largely Regulated by CD8α+ Dendritic Cells. Proc Natl Acad Sci USA (2008) 105(38):14509–14. doi: 10.1073/pnas.0806727105
55. Hafalla JCR, Bauza K, Friesen J, Gonzalez-Aseguinolaza G, Hill AVS, Matuschewski K. Identification of Targets of CD8⁺ T Cell Responses to Malaria Liver Stages by Genome-Wide Epitope Profiling. PloS Pathog (2013) 9(5):e1003303. doi: 10.1371/journal.ppat.1003303
56. Villegas-Mendez A, Strangward P, Shaw TN, Rajkovic I, Tosevski V, Forman R, et al. Gamma Interferon Mediates Experimental Cerebral Malaria by Signaling Within Both the Hematopoietic and Nonhematopoietic Compartments. Infect Immun (2017) 85(11):e01035-16. doi: 10.1128/IAI.01035-16
57. Zhao H, Aoshi T, Kawai S, Mori Y, Konishi A, Ozkan M, et al. Olfactory Plays a Key Role in Spatiotemporal Pathogenesis of Cerebral Malaria. Cell Host Microbe (2014) 15(5):551–63. doi: 10.1016/j.chom.2014.04.008
58. Tamura T, Kimura K, Yuda M, Yui K. Prevention of Experimental Cerebral Malaria by Flt3 Ligand During Infection With Plasmodium Berghei ANKA. Infect Immun (2011) 79(10):3947–56. doi: 10.1128/IAI.01337-10
59. Campanella GSV, Tager AM, El Khoury JK, Thomas SY, Abrazinski TA, Manice LA, et al. Chemokine Receptor CXCR3 and its Ligands CXCL9 and CXCL10 Are Required for the Development of Murine Cerebral Malaria. Proc Natl Acad Sci USA (2008) 105(12):4814–9. doi: 10.1073/pnas.0801544105
60. van den Steen PE, Deroost K, van Aelst I, Geurts N, Martens E, Struyf S, et al. CXCR3 Determines Strain Susceptibility to Murine Cerebral Malaria by Mediating T Lymphocyte Migration Toward IFN-Gamma-Induced Chemokines. Eur J Immunol (2008) 38(4):1082–95. doi: 10.1002/eji.200737906
61. Aldinucci D, Colombatti A. The Inflammatory Chemokine CCL5 and Cancer Progression. Mediators Inflammation (2014) 2014:292376. doi: 10.1155/2014/292376
62. Kohno H, Maeda T, Perusek L, Pearlman E, Maeda A. CCL3 Production by Microglial Cells Modulates Disease Severity in Murine Models of Retinal Degeneration. J Immunol (2014) 192(8):3816–27. doi: 10.4049/jimmunol.1301738
63. Capuccini B, Lin J, Talavera-López C, Khan SM, Sodenkamp J, Spaccapelo R, et al. Transcriptomic Profiling of Microglia Reveals Signatures of Cell Activation and Immune Response, During Experimental Cerebral Malaria. Sci Rep (2016) 6(1):39258. doi: 10.1038/srep39258
64. Maghazachi AA. Role of Chemokines in the Biology of Natural Killer Cells. Curr Top Microbiol Immunol (2010) 341:37–58. doi: 10.1007/82_2010_20
65. Murooka TT, Rahbar R, Platanias LC, Fish EN. CCL5-Mediated T-Cell Chemotaxis Involves the Initiation of mRNA Translation Through mTOR/4e-Bp1. Blood (2008) 111(10):4892–901. doi: 10.1182/blood-2007-11-125039
66. Hansen DS, Bernard NJ, Nie CQ, Schofield L. NK Cells Stimulate Recruitment of CXCR3+ T Cells to the Brain During Plasmodium Berghei-Mediated Cerebral Malaria. J Immunol (2007) 178(9):5779–88. doi: 10.4049/jimmunol.178.9.5779
67. Ryg-Cornejo V, Nie CQ, Bernard NJ, Lundie RJ, Evans KJ, Crabb BS, et al. NK Cells and Conventional Dendritic Cells Engage in Reciprocal Activation for the Induction of Inflammatory Responses During Plasmodium Berghei ANKA Infection. Immunobiology (2013) 218(2):263–71. doi: 10.1016/j.imbio.2012.05.018
68. Montes de Oca M, Kumar R, Rivera FDL, Amante FH, Sheel M, Faleiro RJ, et al. Type I Interferons Regulate Immune Responses in Humans With Blood-Stage Plasmodium Falciparum Infection. Cell Rep (2016) 17(2):399–412. doi: 10.1016/j.celrep.2016.09.015
69. Specht S, Ruiz DF, Dubben B, Deininger S, Hoerauf A. Filaria-Induced IL-10 Suppresses Murine Cerebral Malaria. Microbes Infect (2010) 12(8-9):635–42. doi: 10.1016/j.micinf.2010.04.006
70. Kurtzhals JA, Reimert CM, Tette E, Dunyo SK, Koram KA, Akanmori BD, et al. Increased Eosinophil Activity in Acute Plasmodium Falciparum Infection–Association With Cerebral Malaria. Clin Exp Immunol (1998) 112(2):303–7. doi: 10.1046/j.1365-2249.1998.00586.x
Keywords: experimental cerebral malaria (ECM), IFNAR1, malaria, CD8 T cells, eosinophils, Plasmodium berghei, NK cells, CCL5
Citation: Scheunemann JF, Reichwald JJ, Korir PJ, Kuehlwein JM, Jenster L-M, Hammerschmidt-Kamper C, Lewis MD, Klocke K, Borsche M, Schwendt KE, Soun C, Thiebes S, Limmer A, Engel DR, Mueller A-K, Hoerauf A, Hübner MP and Schumak B (2021) Eosinophils Suppress the Migration of T Cells Into the Brain of Plasmodium berghei-Infected Ifnar1-/- Mice and Protect Them From Experimental Cerebral Malaria. Front. Immunol. 12:711876. doi: 10.3389/fimmu.2021.711876
Received: 19 May 2021; Accepted: 13 September 2021;
Published: 30 September 2021.
Edited by:
Christoph Hölscher, Research Center Borstel (LG), GermanyReviewed by:
Carlos Penha-Goncalves, Gulbenkian Institute of Science (IGC), PortugalJørgen Kurtzhals, University of Copenhagen, Denmark
Copyright © 2021 Scheunemann, Reichwald, Korir, Kuehlwein, Jenster, Hammerschmidt-Kamper, Lewis, Klocke, Borsche, Schwendt, Soun, Thiebes, Limmer, Engel, Mueller, Hoerauf, Hübner and Schumak. This is an open-access article distributed under the terms of the Creative Commons Attribution License (CC BY). The use, distribution or reproduction in other forums is permitted, provided the original author(s) and the copyright owner(s) are credited and that the original publication in this journal is cited, in accordance with accepted academic practice. No use, distribution or reproduction is permitted which does not comply with these terms.
*Correspondence: Marc P. Hübner, aHVlYm5lckB1bmktYm9ubi5kZQ==
†These authors share first authorship
‡These authors share senior authorship