
95% of researchers rate our articles as excellent or good
Learn more about the work of our research integrity team to safeguard the quality of each article we publish.
Find out more
ORIGINAL RESEARCH article
Front. Immunol. , 21 April 2021
Sec. Cancer Immunity and Immunotherapy
Volume 12 - 2021 | https://doi.org/10.3389/fimmu.2021.666935
 Katharina Rindler1†
 Wolfgang M. Bauer1†
 Constanze Jonak1Matthias Wielscher1Lisa E. Shaw1Thomas B. Rojahn1Felix M. Thaler1Stefanie Porkert1Ingrid Simonitsch-Klupp2Wolfgang Weninger1Marius E. Mayerhoefer3,4Matthias Farlik1†
 Patrick M. Brunner1*†
Mycosis fungoides (MF) is the most common primary cutaneous T-cell lymphoma. While initially restricted to the skin, malignant cells can appear in blood, bone marrow and secondary lymphoid organs in later disease stages. However, only little is known about phenotypic and functional properties of malignant T cells in relationship to tissue environments over the course of disease progression. We thus profiled the tumor micromilieu in skin, blood and lymph node in a patient with advanced MF using single-cell RNA sequencing combined with V-D-J T-cell receptor sequencing. In skin, we identified clonally expanded T-cells with characteristic features of tissue-resident memory T-cells (TRM, CD69+CD27-NR4A1+RGS1+AHR+). In blood and lymph node, the malignant clones displayed a transcriptional program reminiscent of a more central memory-like phenotype (KLF2+TCF7+S1PR1+SELL+CCR7+), while retaining tissue-homing receptors (CLA, CCR10). The skin tumor microenvironment contained potentially tumor-permissive myeloid cells producing regulatory (IDO1) and Th2-associated mediators (CCL13, CCL17, CCL22). Given their expression of PVR, TNFRSF14 and CD80/CD86, they might be under direct control by TIGIT+CTLA4+CSF2+TNFSF14+ tumor cells. In sum, this study highlights the adaptive phenotypic and functional plasticity of MF tumor cell clones. Thus, the TRM-like phenotype enables long-term skin residence of MF cells. Their switch to a TCM-like phenotype with persistent skin homing molecule expression in the circulation might explain the multi-focal nature of MF.
Primary cutaneous T-cell lymphomas (CTCL) comprise a heterogeneous group of peripheral non-Hodgkin’s lymphomas (1, 2), with mycosis fungoides (MF) as their most frequent clinical entity. Usually, MF shows an indolent course with stable or only slowly progressing lesions confined to the skin, resulting in an overall 5-year survival rate of 70-80% (3). In line with this biological behavior, malignant T-cells show many features consistent with non-migratory, skin-resident memory cells (TRM) (4). Yet, in some patients, initial patches and plaques develop into tumors, eventually leading to systemic disease, with potential involvement of lymph nodes, blood, bone marrow and internal organs. Increasing expression of exhaustion markers by infiltrating CD4+ and CD8+ T-cells (5), and a shift from a Th1 towards a more Th2-like immune microenvironment are currently assumed to interfere with effective anti-tumor immune responses during progression of disease (6). However, exact mechanisms remain to be elucidated, and only little is known about the actual processes facilitating dissemination of tumor cells to extracutaneous sites. Using high-throughput TCR-β and TCR-γ sequencing, Kirsch et al. demonstrated seeding of a clonal population of malignant TRM to distant skin sites and the peripheral blood, and found the malignant clone to descend from a mature T-cell according to the number of rearranged TCR-γ genes (7, 8). Recently, this hypothesis has been challenged by data from copy number aberration and TCR clonotype analyses using whole exome and whole transcriptome sequencing, that suggest the presence of oligoclonal malignant T-cells in MF lesions (9, 10). Single-cell RNA sequencing (scRNA-seq) combined with single-cell V-D-J sequencing now bears the potential to shed new light on these incongruities. By simultaneous determination of clonality through sequencing of the TCR-α and β chains and analysis of differentially expressed genes, malignant and tumor infiltrating cells can be easily discriminated, and their interaction can be readily analyzed (11). Here we profiled skin, lymph node and peripheral blood from a patient with stage IVB MF at single cell resolution. We were able to consistently detect the malignant clone and assess its properties and dynamic interplay with the microenvironment specific to each of these body compartments, demonstrating considerable tumor cell plasticity spanning from TRM characteristics in skin to more TCM-like properties in blood and lymph node.
The study was conducted under a protocol approved by the Ethics Committee of the Medical University of Vienna, Austria (EK 1360/2018). After written informed consent, a 65 years old Caucasian woman with stage IVB (T3 N3 M1 B1) Mycosis fungoides (MF) was included. At time of sampling, the patient did not receive disease-specific treatment. Routine laboratory investigations revealed an LDH of 322U/L (normal range <250U/L) and a CRP value of 11.47mg/dL (normal range <0.5mg/dL).
A 6mm skin punch biopsy from an MF lesion was obtained from the right flank. The biopsy was minced with scalpels and digested in collagenase IV (0,5U/ml, Worthington) for 30min at 37°C to obtain a single cell suspension. Lymph node cells were obtained from a small fraction of a diagnostic biopsy from a pathologically enlarged axillary lymph node. PBMC were prepared by Ficoll® Paque density gradient centrifugation (GE Healthcare). All cell suspensions were frozen at -80°C until further processing. Cell suspensions were thawed and stained with CD7 FITC, CD4 PE, CD3 APC, CD45 ECD and 7-AAD. In the case of skin and lymph node, viable CD45+CD3+CD4+ T-helper cells, other CD45+ cells, and CD45-negative cells were sorted on a FACS Aria III (BD Biosciences) at a ratio of 1:2:1. In the case of PBMC, viable CD3+CD4+ helper T-cells and remaining CD45+ cells were sorted in a ratio of 1:2. Immediately after sorting, cells were subjected to scRNA-seq processing (10X Genomics, Pleasanton, CA) according to the manufacturer’s instructions.
T-cell receptor (TCR) sequencing and 5’ gene expression sequencing was performed using the Chromium Controller and Single Cell 5’ Library & Gel Bead Kit (10x Genomics) according to the manufacturer’s protocol. Sequencing was performed using the Illumina NovaSeq 4000 platform and the 150bp paired-end configuration.
RNA sequencing files were preprocessed with the Cell Ranger software from 10x Genomics (version 3.0.2, RRID: SCR_017344). After demultiplexing with the Cell Ranger command ‘mkfastq’, reads from each transcriptome library were aligned to the human reference genome assembly ‘refdata-cellranger-GRCh38-3.0.0’ using the ‘cellranger count’ pipeline. The pipeline generated both a raw UMI count matrix, including counts for all the droplets, and a filtered UMI count matrix, including only those droplets which are likely to contain at least one cell.
Reads from TCR receptor libraries were assembled using the ‘cellranger vdj’ pipeline in the reference-assisted mode using the vdj_GRCh38_alts_ensembl-3.1.0 reference version. The pipeline also annotated the assembled contigs according to the reference and grouped cells into clonotypes.
Filtered gene expression matrix, TCR amino acid sequences and clonotypes were then used for secondary analysis with R version 3.6.3 (2020–02–29).
Seurat package (version 3.1.4, RRID: SCR_016341) was applied to perform quality control and integrate all samples. The filtering criteria applied to each cell were the number of genes expressed (between 200 and 4000) and mitochondrial gene percentage (less than 12%) in order to discriminate for multiplets and dead cells leaking mRNA but include cell types with naturally higher mitochondrial content (such as macrophages). All cells not satisfying these criteria were discarded. Following QC, data from TCR receptor sequencing and transcriptome sequencing were merged by adding clonotype frequency and CDR3 amino acid sequences to the metadata column of the Seurat objects. All samples were aligned with the standard integration pipeline, as recommended by the Seurat developers (12, 13). Briefly, gene expression counts were log-normalized and 2,000 variable features were selected individually for each sample, and used to find integration anchors, and for principal component analysis. Based on explained variance by each principal component (elbow plot), we selected the first 22 principal components as input for dimension reduction and clustering using the Louvain algorithm at a resolution of 0.6. Clusters were visualized in two-dimensional space by Uniform Manifold Approximation and Projection (UMAP). The corresponding cell types of clusters were annotated by finding cluster markers with the “FindAllMarkers” command and running the SingleR package (1.0.5) (14). Differential gene expression (logFC>|0.25|, adjusted p-value<0.05) was calculated using the FindMarkers command and the Wilcoxon Rank Sum Test. P-values were adjusted for multiple comparisons with Bonferroni correction. We used scran package to find droplets containing more than one cell (15). The applied approach simulates thousands of doublets by adding together two randomly chosen single cell profiles. For the doublet score calculation cell clustering including the set randomly generated doublets was performed. Then for each cell of the original dataset the number of simulated doublets in their neighborhood was recoded and used as input for score calculation. We used 200 nearest neighbors for each cell. Doublet score was log10 of the ratio between simulated doublet cells and total number of neighbors taken into consideration for each cell.
Calculation of cell cycle scores was performed as implemented in the Seurat package, where gene expression of cell cycle marker genes was combined to a score. The score consisted of 43 genes primarily expressed in G1/S and 55 primarily expressed in G2/M, described in more detail by Tirosh I et al. (16).
Trajectories and Pseudotime were calculated using Monocle 2 version 2.13 (RRID: SCR_016339) (17, 18). Briefly, malignant cells (i.e. TRB1+ or TRB2+ cells) of clusters TC-1 and TC-3 of the filtered ‘Seurat’ object were converted to a CellDataSet and size factors and dispersions were estimated. Low quality cells and genes expressed in fewer than 10 cells were removed and unsupervised clustering was performed after “tSNE” dimension reduction (to 15 dimensions) and by specifying “tissue” as model formula for batch effect removal.
As model formula input for the first step of trajectory construction, differentially expressed genes between the tissues skin, blood and lymph node were used. In the next step dimensions were reduced with DDRTree and cells were ordered along the constructed trajectory and colored according to pseudotime, tissue of origin or cell cycle phase. For each branching point of the trajectory, we did branched expression analysis modelling (BEAM) (19) and genes with q‐value <0.00001 were displayed in a heat map, after eliminating ribosomal and mitochondrial genes.
Copy number variation analysis was performed using inferCNV of the Trinity CTAT Project (https://github.com/broadinstitute/inferCNV). The software compares gene expression values across genomic positions between case and control cells to identify genomic regions with consistent higher or lower signal intensities. We used a window of 201 for moving average smoothing and minimum of 5 cells per gene to include the corresponding gene into the analysis. CNVs were predicted with a Hidden Markov Model. We used a 6-state CNV model, attempting to predict either complete loss, loss of one copy, no change, addition of one copy, addition of two copies or addition of more than two copies.
The 10X Genomics datasets generated during this study are available via Gene Expression Omnibus GSE165623. The published article includes detailed descriptions on how publicly available coding pipelines were used during this study. The exact code is available from the corresponding author upon request. Further information and requests for resources and reagents should be directed to the Lead Contact, Patrick M. Brunner (cGF0cmljay5icnVubmVyQG1lZHVuaXdpZW4uYWMuYXQ=).
A 65-year-old female patient suffering from MF had been in care at our department for a total of 14 years. She was originally referred in 2006 with stage IIB (T3 N0 M0 B0) disease with patches, plaques and tumors on her head and lower extremities. The Modified Severity Weighted Assessment Tool (mSWAT) showed a severity score of 8.2, indicating generally limited skin involvement. Until 2012, treatments consisted of topical corticosteroids, involved site radiation therapy (ISRT), systemic retinoid treatment (bexarotene), total skin electron beam (TSEB) radiation therapy, and gemcitabine chemotherapy, which led to temporary remission of disease. After seven years of loss to follow up, she returned to our clinic in 2019, presenting with generalized patches, plaques and tumors, and an mSWAT of 108. Skin histopathology revealed a dense subepidermal infiltrate of small to medium sized lymphocytes positive for CD2, CD3, CD4, PD-L1 and TCRβF1, partial positivity for CD5, and negative stainings for CD7, CD30 and PD-1. Ki67 staining showed a proliferation index of approximately 20% (Figure 1A). In peripheral blood, the absolute leukocyte count was 7400/µl (normal range 4000-10,000), with 885 T-cells (CD3) per microliter (data not shown). 13% of blood T-cells (ie 1.6% of all leukocytes) showed an aberrant phenotype of high forward scatter (FSC-A), elevated CD4 and decreased CD7 levels (Figure 1B), with negativity for CD5 and CD30 (data not shown). Contrast-enhanced computed tomography (CT) of the chest, abdomen and pelvis revealed pathologically enlarged axillary, para-aortic, iliac and inguinal lymph nodes, as well as hepatic and pulmonary lesions suspicious of CTCL manifestations (Figure 1C). Routine histologic examination of a right axillary lymph node showed paracortical infiltration of conspicuous atypical small-to-medium sized lymphocytes, positive for CD2, CD3, CD4 and TCRβF1, with partial loss of CD5 and CD7 (Figure 1D), consistent with lymph node involvement of MF (Dutch grade N3). These cells were negative for PD-1, with a proliferation index of up to 50% (data not shown). There was no histological evidence for large cell transformation (LCT) neither in the skin nor the lymph node. In sum, the patient was diagnosed with stage IVB (T3 N3 M1 B1) disease.
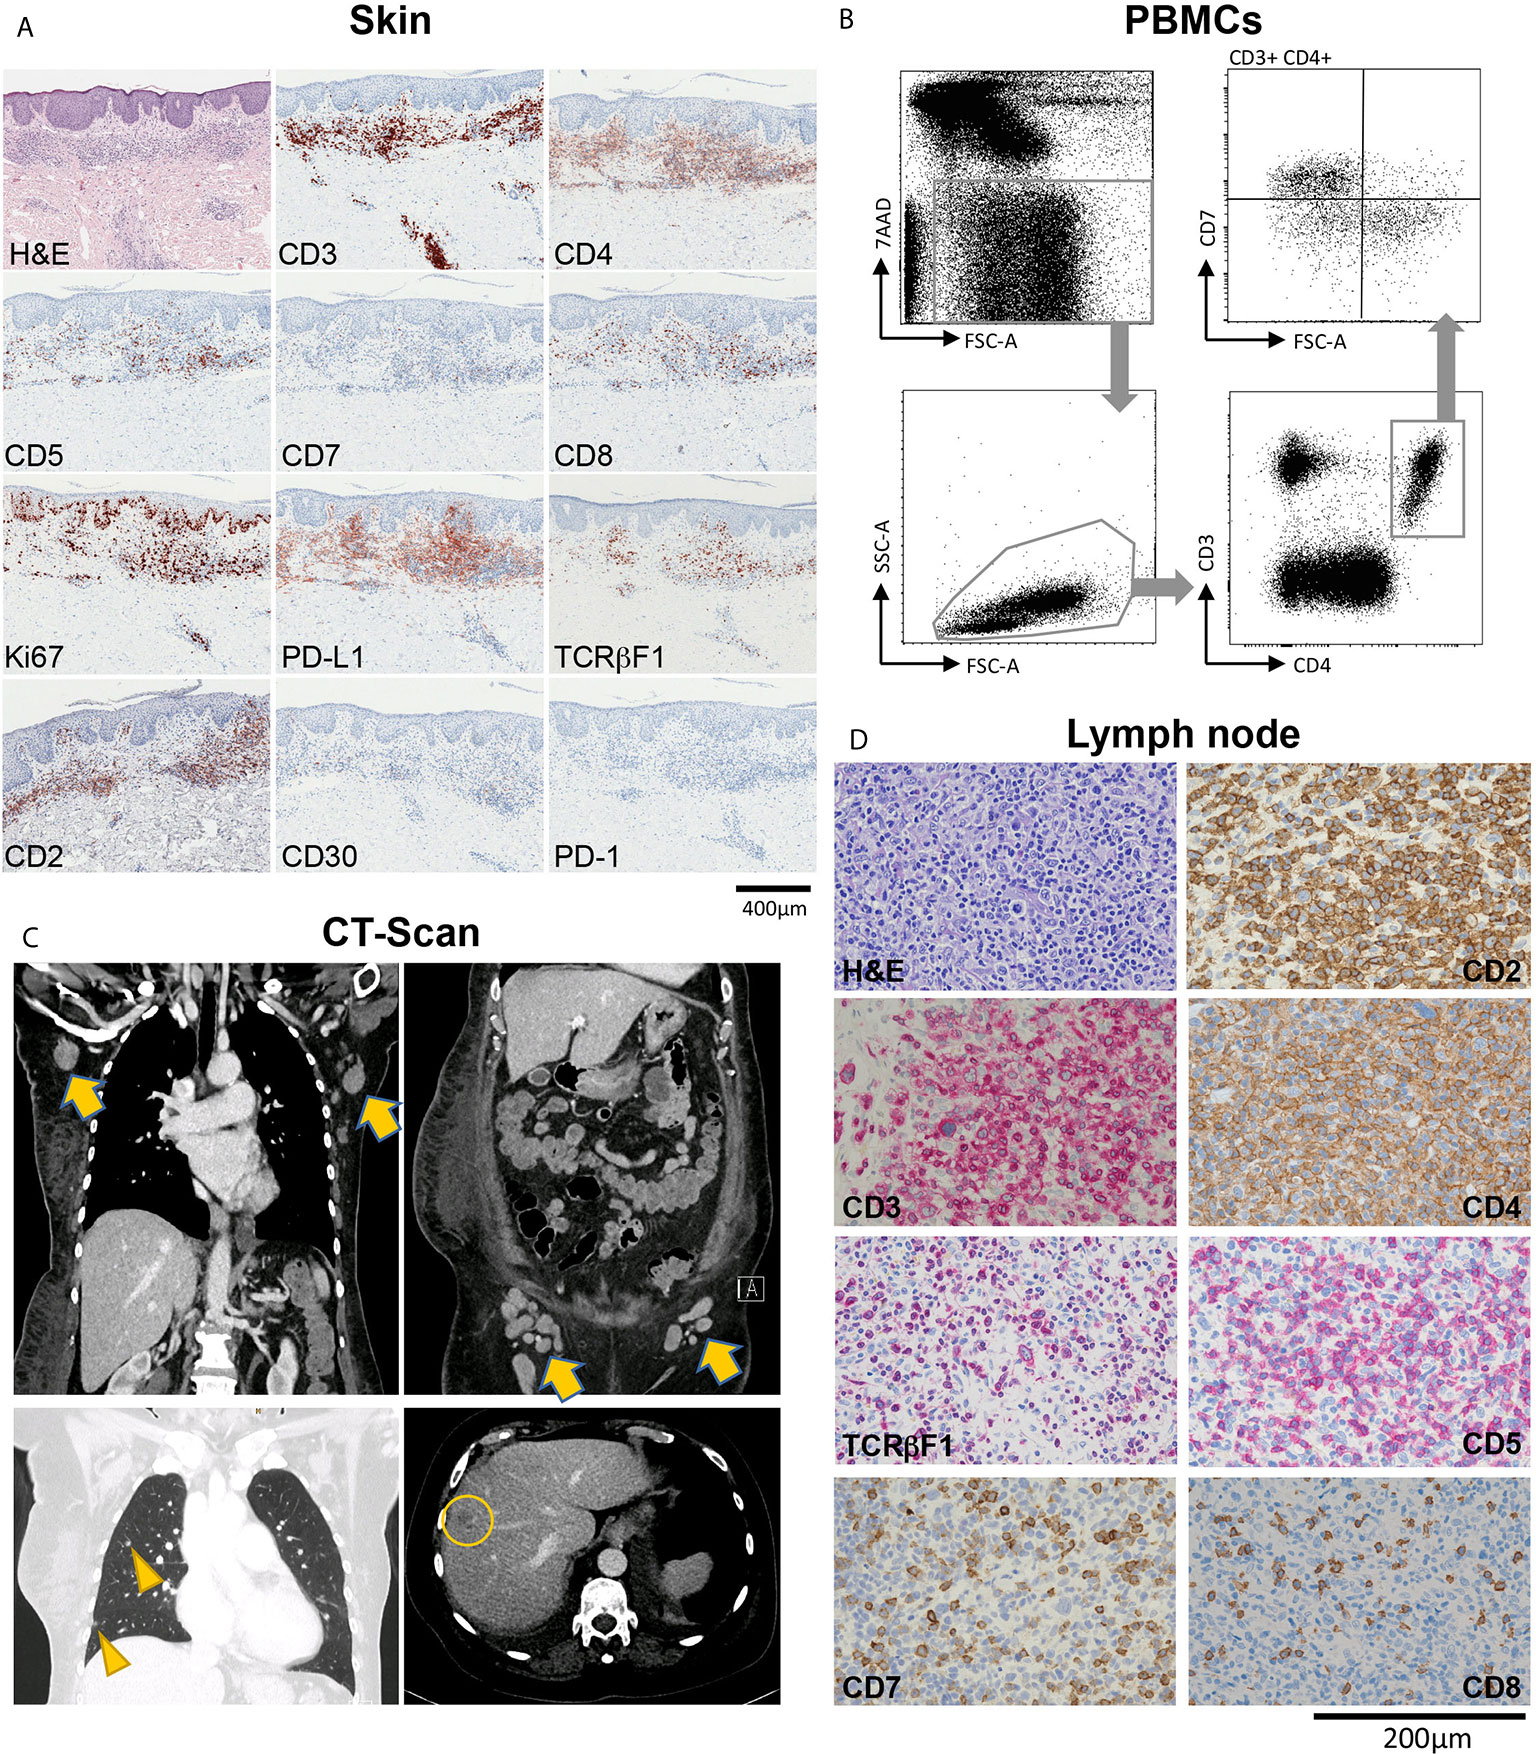
Figure 1 Overview of a patient with advanced-stage mycosis fungoides (MF) with skin, blood, lymph node and internal organ involvement. (A) Histopathological evaluation of a skin biopsy showing an inflammatory infiltrate highly suspicious of MF, with T-cells showing partial loss of CD5, and total loss of CD7. (B) Flow-cytometric evaluation of peripheral blood mononuclear cells (PBMCs) showing a large T-cell population with CD7 loss within the CD3+CD4+ helper cell compartment. (C) Contrast-enhanced CT chest, abdomen and pelvis showing pathologically enlarged axillary and inguinal lymph nodes (arrows), and lesions to the lung (arrow heads) and the liver (circle) suspicious of CTCL manifestations. (D) Histopathological characterization of a diagnostic biopsy of an axillary lymph node, confirming CTCL involvement.
To better understand tumor cell characteristics across tissues in this MF patient, we performed single-cell RNA sequencing (scRNA-seq) of cells sorted from involved skin, blood and lymph node, as outlined in Figure 2A. Sequencing data were filtered for low-quality cells and normalized, yielding 1,215 lymph node, 3,301 blood and 4,512 skin cells (Table S1). Clustering of these three compartments followed by visualization using uniform manifold approximation and projection for dimension reduction (UMAP) (20) revealed 19 distinct cell clusters (Figures 2B, C). We assigned cell identities on the basis of canonical markers (Figure 2D) and identified the top 10 upregulated genes (according to average log fold change and smallest adjusted p-value) for each cluster in comparison to all other clusters (Figure S1 and Table S2). We found PTPRC/CD45-negative cells consistent with endothelial cells (EC: CDH5/VE-cadherin), lymphatic endothelial cells (LEC: PROX1), fibroblasts (FB: DCN,), keratinocytes (KC: KRT5) and myofibroblasts (MFB: ACTA2, MYL9, TAGLN, EDNRA) (Figures 1D, S1 and Table S2). Among PTPRC/CD45+ cells we identified various myeloid cells including dendritic cells (DC-1: CD1C, ITGAX; DC-2: LAMP3), macrophages (MФ: CD163) and monocytes (non-classical monocytes MC-3 expressing CD68, FCGR3A; classical monocytes MC-1 and MC-2 expressing CD14). DC-1 also contained a minor population of CD207+ CD1A+ Langerhans cells that did not cluster separately (Figure 2D). We also found a small cluster of B cells (BC: MS4A1/CD20) and NK/NKT-cells (KLRC1/NKG2, KLRB1/CD161, NKG7). One cluster (“other”) contained cells positive for MALAT1, suggesting damaged or dead cells (Table S2) (21). Among CD3D+ T-cells, we found a large, distinct population of CD4+ helper T-cells (TC-1, and adjacent TC-3 and TC-4) as well as two smaller clusters of CD4+ helper and CD8A+ cytotoxic T-cells (TC-2 and TC-5, respectively), with TC-2 also containing some FOXP3+ regulatory T-cells, and TC-5 consisting of proliferating (MKI67+) cells (Figures 2B, D).
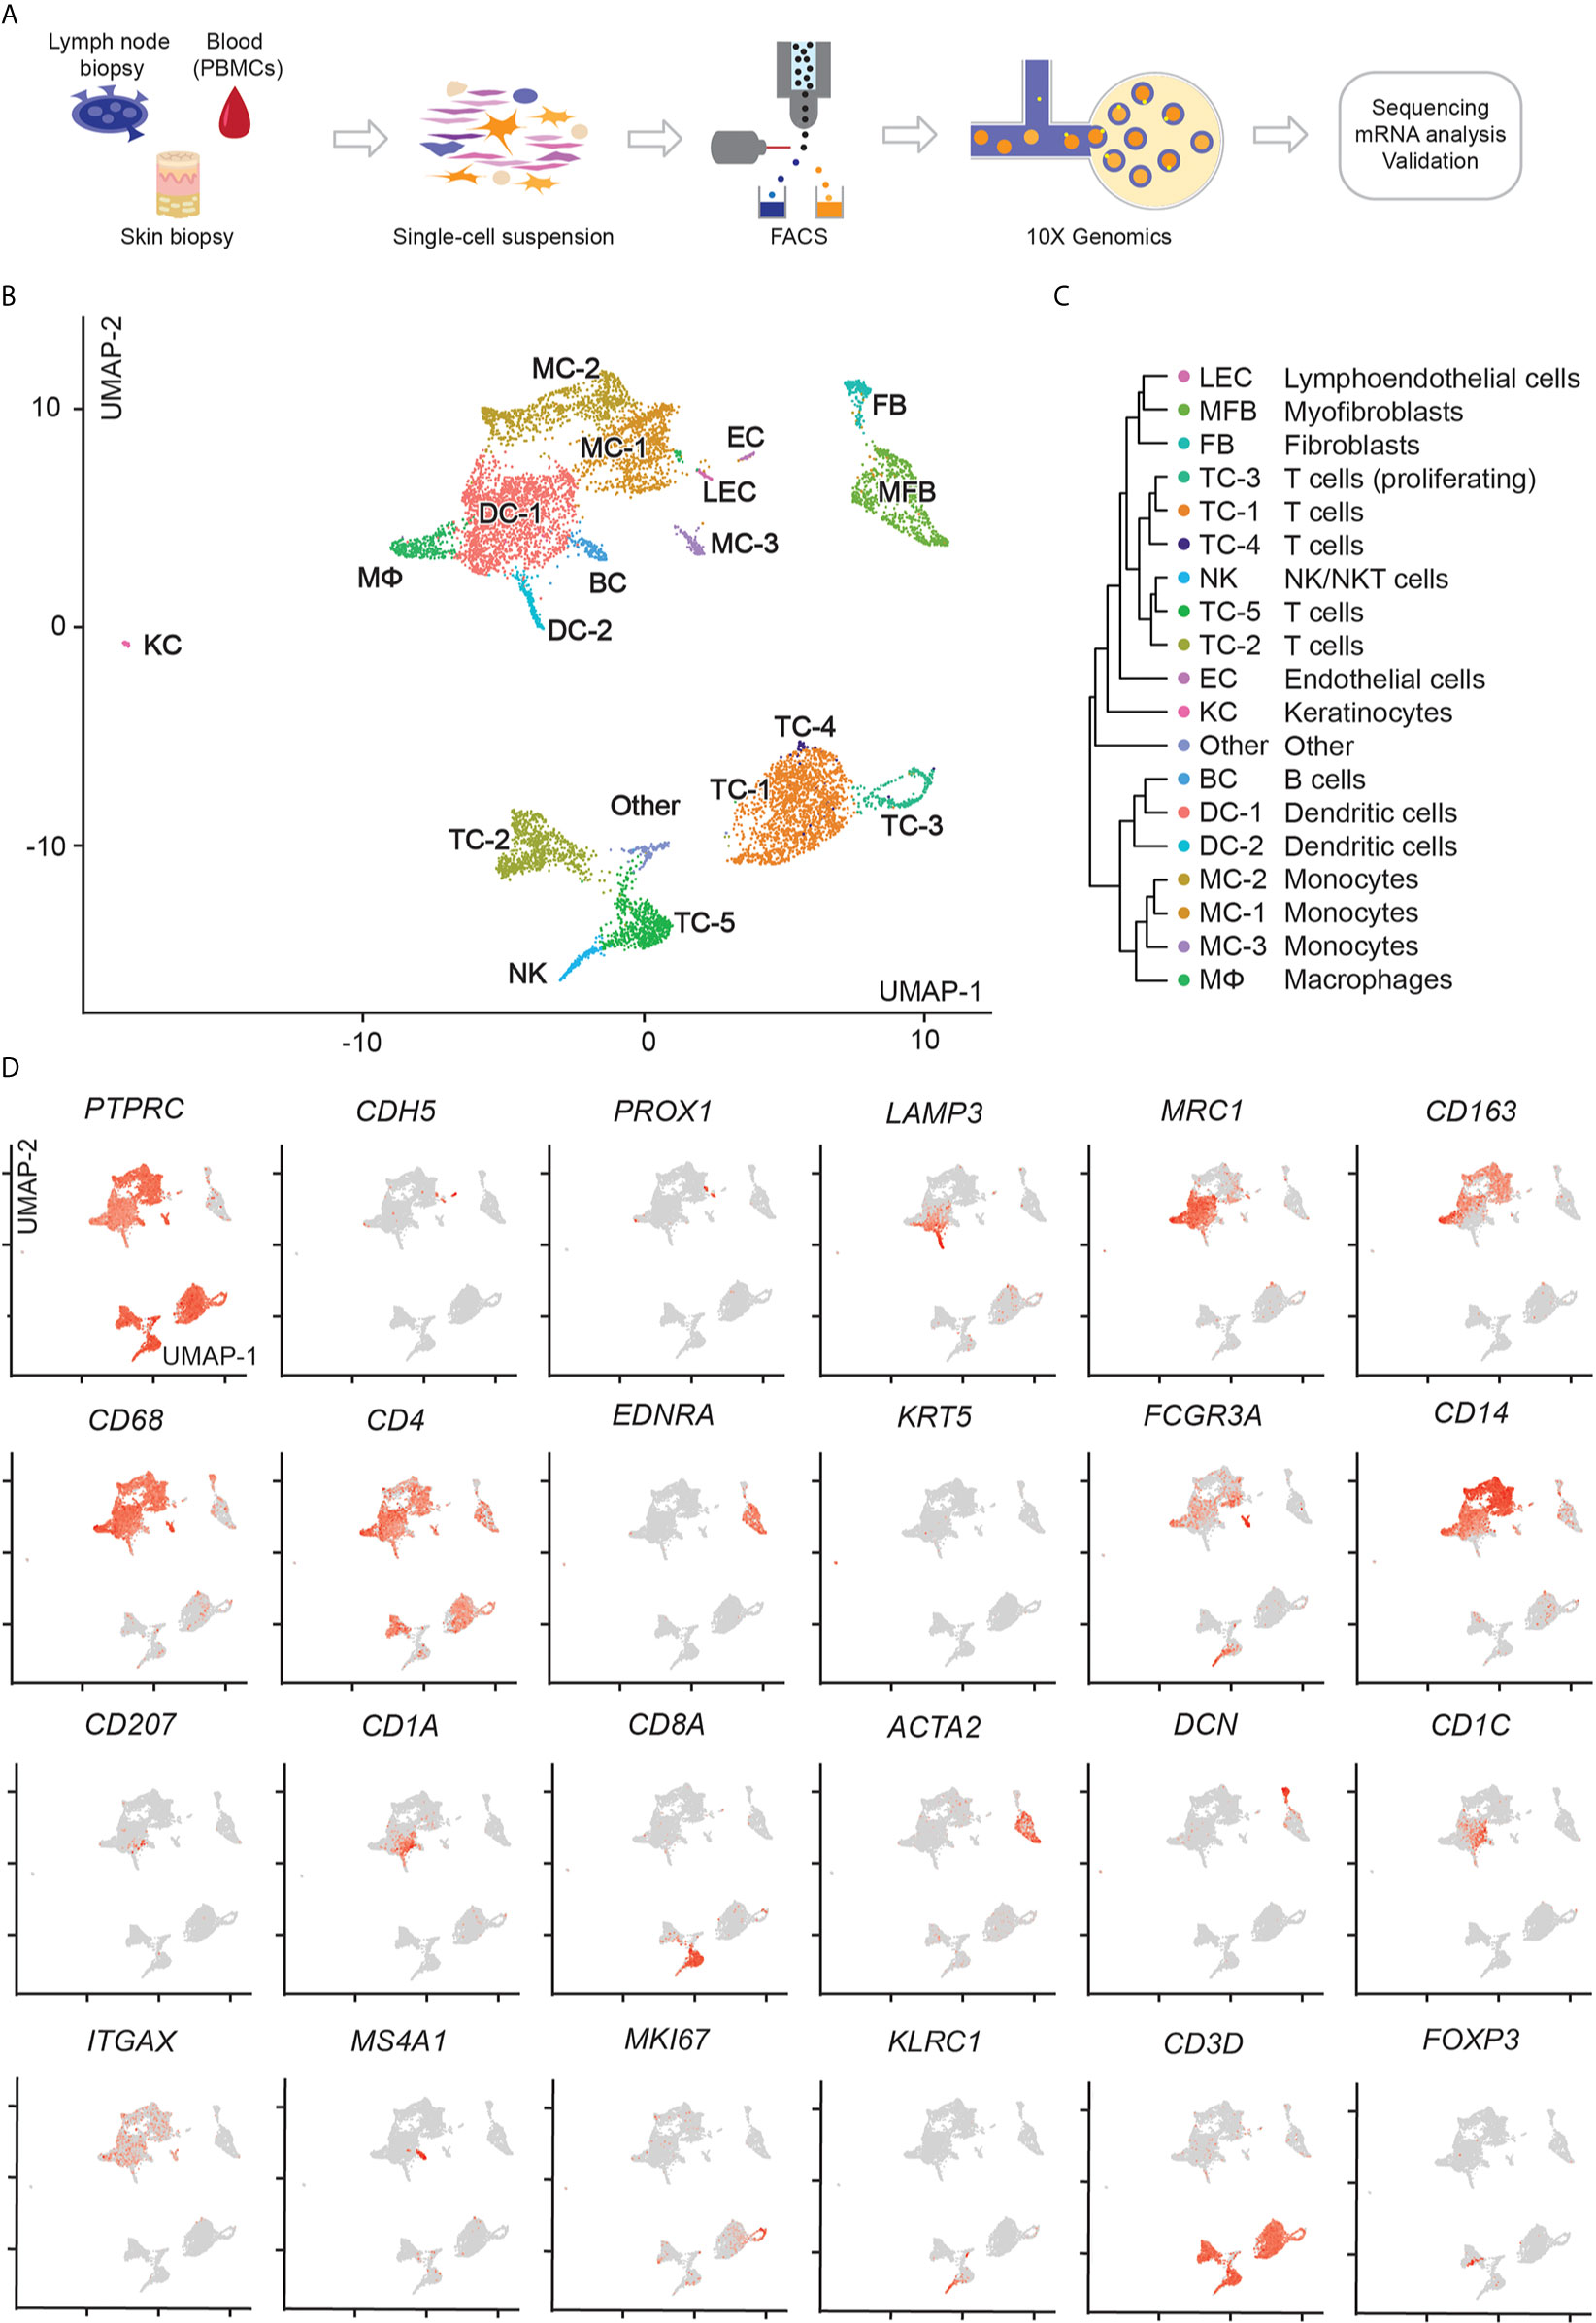
Figure 2 scRNA-seq workflow and map of isolated cells from lymph node, blood, and skin. (A) Outline of steps for single cell profiling of trancriptomes from different tissues. (B) UMAP of 9,028 cells integrated from lymph node (1,215), blood (3,301), and skin (4,512) samples according to similarity of their transcriptome, resulting in 19 different color-coded clusters. (C) Unsupervised hierarchical clustering showing relatedness of cell clusters (average gene signatures; correlation distance metric and average linkage). (D) Combined feature plots of all samples showing expression distribution for canonical markers. Intensity of normalized expression for each cell is color-coded (red) and overlaid onto UMAP plots.
When displaying cells separately for lymph node, blood and skin, we found most T-cell clusters to be present in all of these three body compartments (Figure 3A). By using 5’ scRNA-seq that allows simultaneous V-D-J sequencing of the T-cell receptor (TCR) alpha- and beta-chains (TRA and TRB), we overlaid TCR-positive cells onto UMAP plots (colored cells in Figure 3B). Generally, TRA and/or TRB sequences were detected in 2,952 cells which showed a polyclonal pattern in 45% of TCR-bearing cells (Figure 3B, labelled in blue, and Table S3). Similar to protein expression measured by immunohistochemistry (Figures 1A, D), the putative malignant cells expressed CD3D and CD4 but lacked CD5 and CD7 (Figures S2A, B). Further analysis of the TCR sequences revealed two clones to be strongly expanded at 46% and 9% of all TCR+ cells, which were confined within the CD4+ T-cell clusters TC-1, TC-3 and TC-4 (top expanded clones marked in red and green, Figure 3B). The two TRB chains of these two clones differed by only one amino acid, namely CASSQDRALENTIYF (“TRB1”) and CASSQDRTLENTIYF (“TRB2”), due to a single nucleotide change (guanine to adenine). These TRB chains were mainly paired with the TRA chain CAVDHARLMF, and in <5% of clonal cells also with CALSKKPGRKAYLRT (Table S3). TC-1 in skin contained 79% TRB1+ and 20% TRB2+ cells, with comparable distributions in blood (TRB1: 82%, TRB2: 17%) and lymph node (TRB1: 73%, TRB2: 26% of all cells) within this cluster (Figure 3C). The much smaller cluster TC-4 was sufficiently present only in skin and blood, with roughly the same distribution of TRB1+ and TRB2+ cells. In cluster TC-3, only skin showed largely clonal TRB1 and TRB2 percentages, while blood cells were mostly polyclonal (Figures 3B, C).
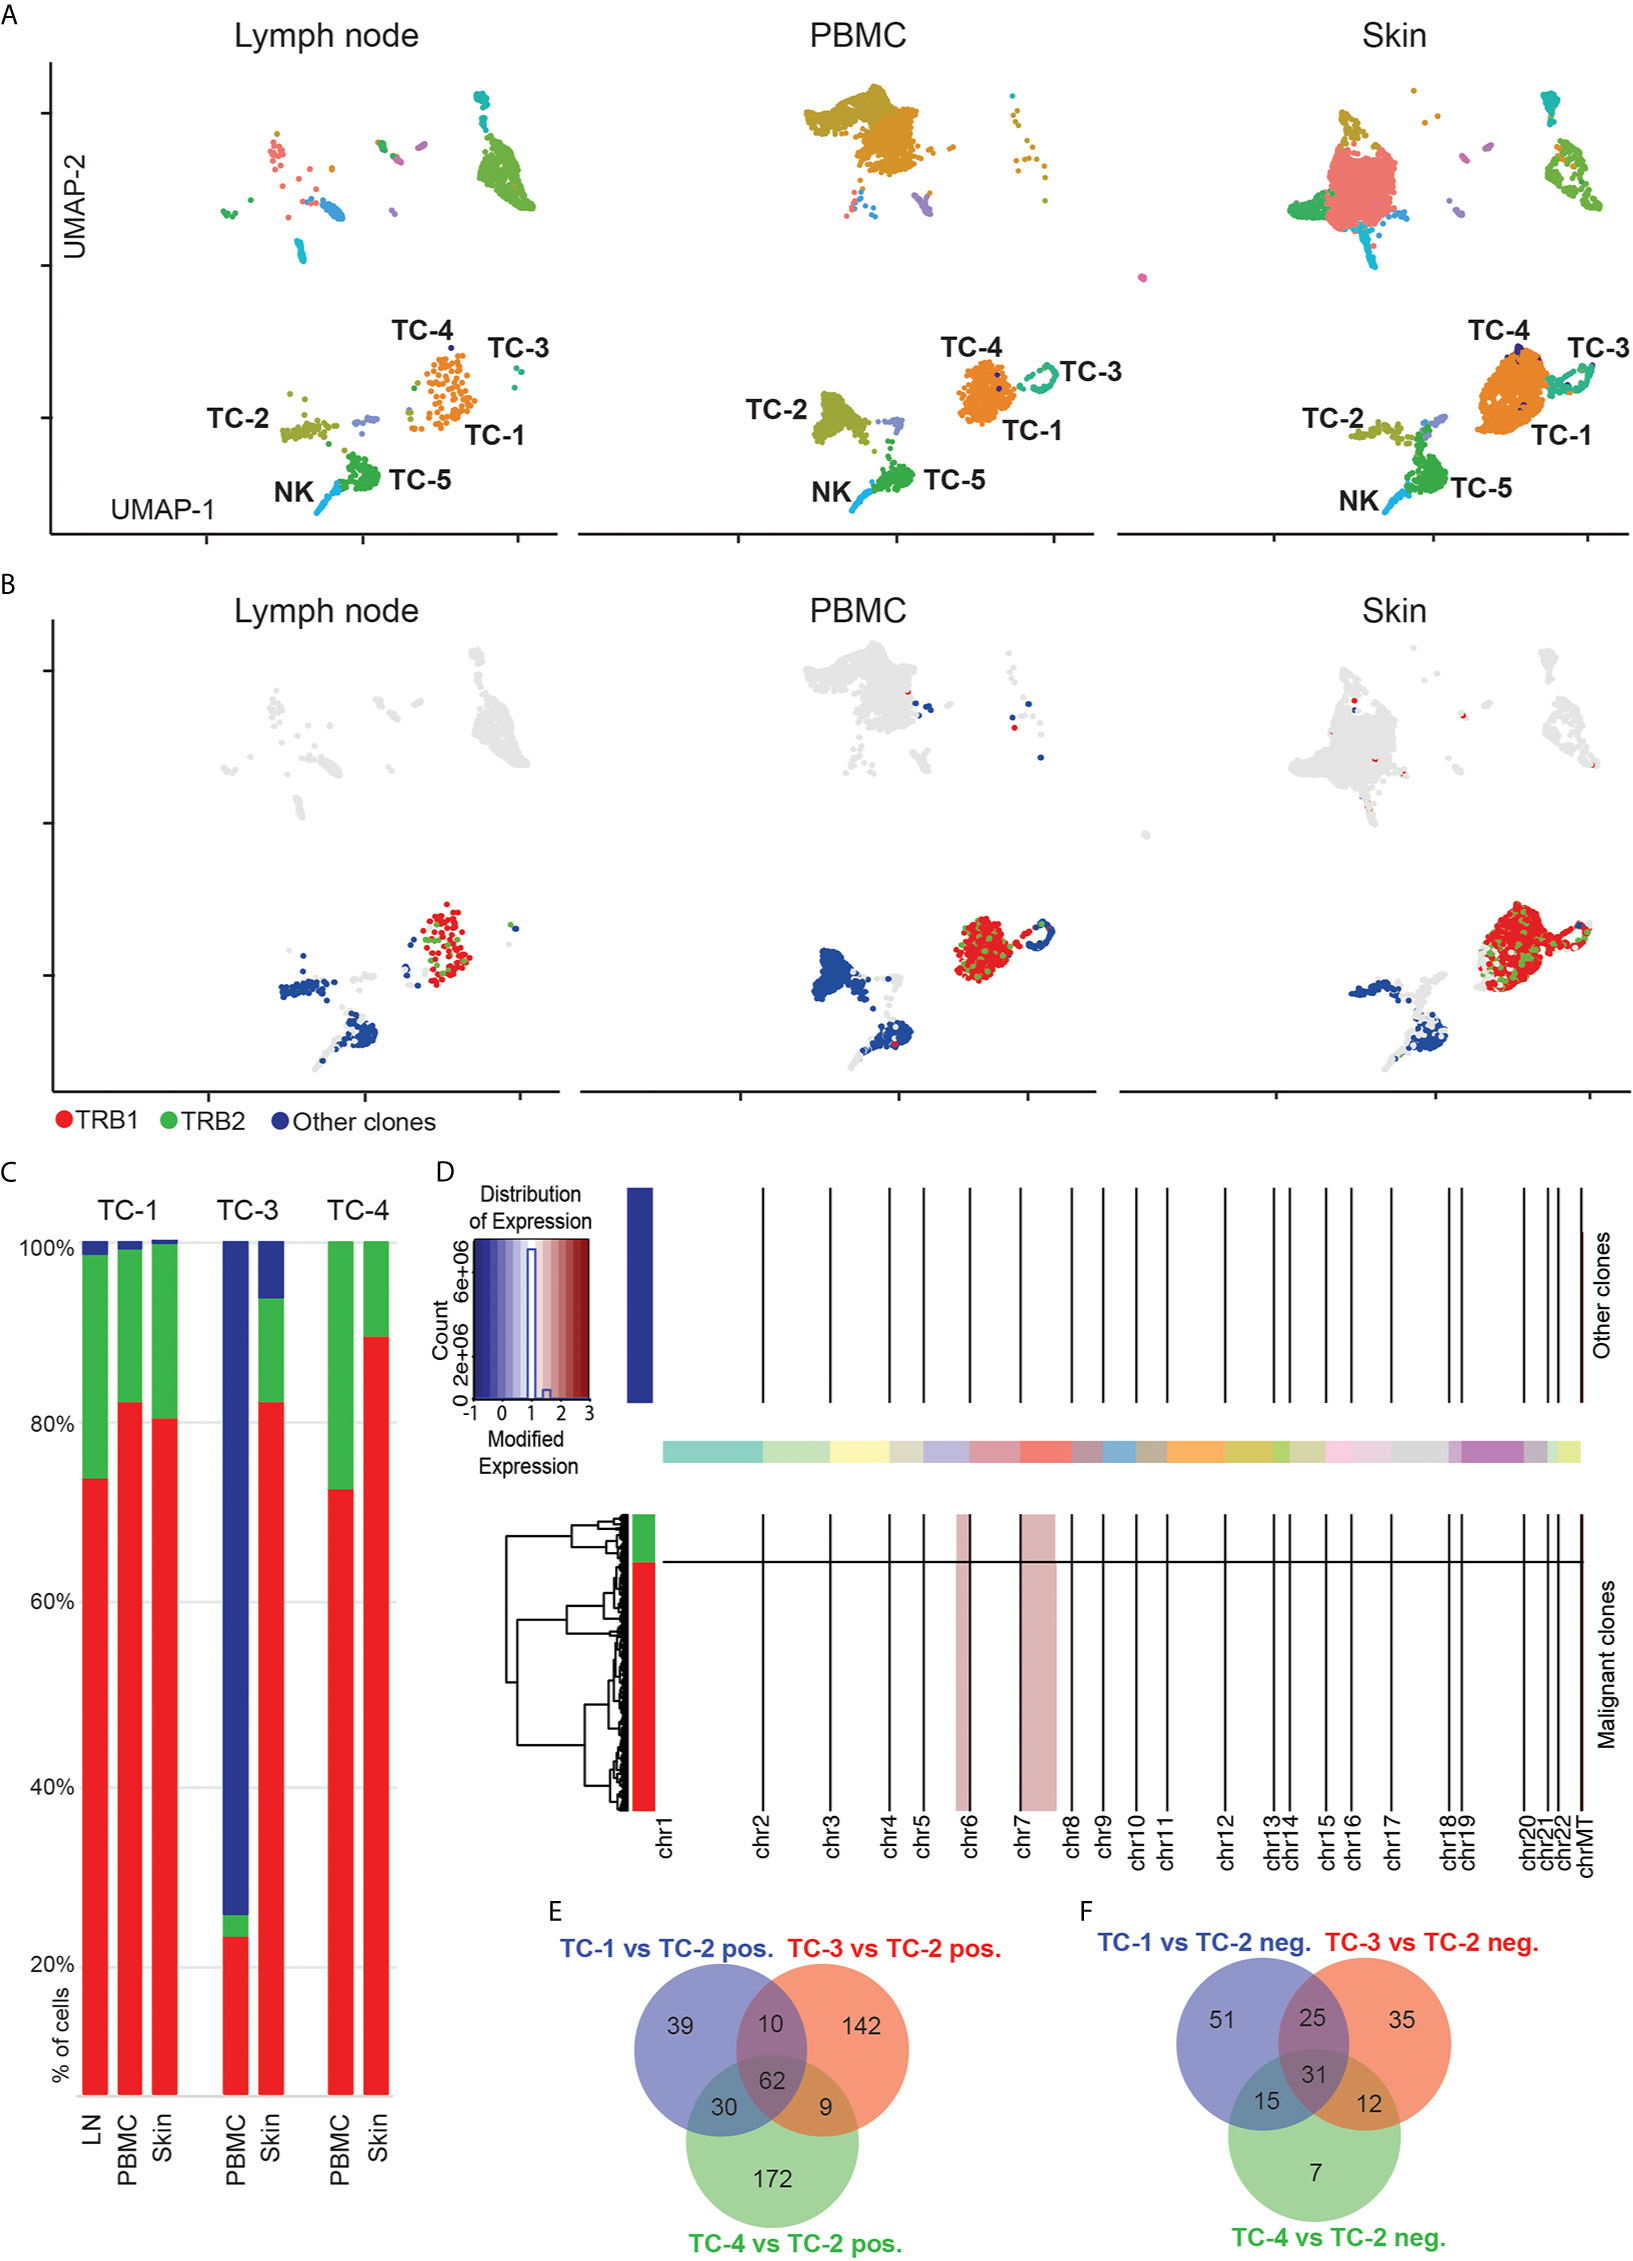
Figure 3 Expansion of two similar T-cell clones in blood, lymph node and skin. (A) Separate UMAP plots of lymph node, blood and skin samples; numbers refer to respective cell clusters. (B) Cells with detectable T-cell receptor are colored; cells without detectable T-cell receptor are displayed in grey. TCR+ polyclonal cells are labelled in blue, while the two top expanded clones are labelled in red and green, respectively. Data overlaid onto UMAP plots separately for each tissue. (C) Frequencies of most common clonotypes (red, green) and the polyclonal T-cell infiltrate (blue) in T-cell clusters TC-1, TC-3 and TC-4. (D) Copy number variation (CNV) analysis: Chromosomes are given on x-axis, and y-axis is proportional to cell numbers. Red indicates chromosomal gains. Dendrogram legend red is clonotype TRB1 and green TRB2. (E, F) Venn diagram of significantly up- and downregulated genes comparing tumor clusters TC-1, TC-3 and TC-4 with benign CD4+ T-helper cells from cluster TC-2 (adjusted p value<0.05, logFC>|0.5|). UMAP: Uniform Manifold Approximation and Projection; PBMC: Peripheral blood mononuclear cells.
The expression of two distinct TRB within the clonally expanded T-cell population either represents spontaneous mutation from one single clone, or the presence of two independent clones (22). When comparing gene expression of cells harboring TRB1 versus TRB2, we did not detect any significant differences (at an adjusted p<0.05, data not shown). Furthermore, we also used inferCNV to identify copy number variations between these two populations (23). Also on this level we did not find relevant differences between TRB1 and TRB2 clonotypes, but identified similar gains on chromosomes 5 and 7 in both clones (Figure 3D and Table S4), the latter being consistent with observations in previous CTCL whole exome sequencing studies (24). Taken together, these findings suggest that both expanded clones have a common T-cell ancestor. Based on these observations we conclude that clusters TC-1, TC-4 and in part TC-3 represent the malignant CTCL clone, while clusters TC-2 and TC-5 harbor benign helper and cytotoxic T-cells, respectively. To further define characteristics of these cells, we calculated differentially expressed genes between polyclonal, presumably benign CD4+ helper T-cells (TC-2) and clusters TC-1, TC-3 and TC-4 (Table S5). We observed substantial transcriptomic differences between these three clusters (Figures 3E, F, and Table S6). Cluster TC-3 contained mostly proliferating cells, as evidenced by the upregulation of MKI67 (Figure 2D and Table S5). Despite consistent CD3D expression in cluster TC-4, most cells co-expressed markers typically found in myeloid cells such as CD14, CD68, and CD1C (Table S5), and overall RNA content was approximately doubled in TC-4 when compared to other, non-proliferating cells (Figures S2C, D), suggesting either the presence of technical doublets, or the engulfment of T-cells by professional phagocytes (25), a question that cannot be definitively answered with the current dataset.
Malignant cells in MF are thought to be closely related to tissue-resident memory T-cells (TRM), given many phenotypic similarities (26). In our patient, clonally expanded cells in cluster TC-1 were CD4+ CD69+ ITGAE/CD103- (Figure 4A) suggesting their close relation to dermal, but not epidermal TRM (27). In addition, these cells expressed the skin homing molecule CCR10, but only weakly CCR4 (Figure 4A). Another chemokine receptor, CXCR3, was specifically expressed in cells of cluster TC-1 (Figure 4A), but was hardly present in benign helper T-cells of cluster TC-2 (data not shown). In cells from TC-1, representing the largest cluster of malignant cells, we found increased expression of various cytokines in comparison to benign helper T-cells from cluster TC-2, including type 22 (IL22), type 2 (IL4, IL13), and type 17 (IL26) cytokines, as well as IL21 and IL32 (Figures 4B, C, Table S5). In addition, they were rich in LTA, TNF, CSF2, and GNLY (Figure 4C and Table S5), creating a highly inflammatory environment that could not be attributed to a single classic T helper cell subset (28). We also found increases in the T-cell exhaustion-associated markers TIGIT and the CTCL-associated markers TOX (29) and MIR155 (30) (Figure 4D). IL22, IL32 and GNLY, as well as TOX and TIGIT were generally increased in skin, blood and lymph nodes, when compared to benign helper T-cells or cytotoxic T-cells (Figures 4C, D), consistent with a pro-inflammatory malignant phenotype spanning several body compartments (Table S7). By contrast, Th2 cytokines (IL4 and IL13) and associated mediators (IL21, TNFSF14/LIGHT) (31, 32), but also IFNG and MIR155 were mostly upregulated in malignant cell from skin (Figures 4C, D, Figures S3A, B and Table S8). The Th17-associated cytokine IL26, colony-stimulating factor-2 (CSF2), the co-stimulatory molecule CD40LG and tumor necrosis factor-alpha (TNF) were upregulated both in lymph nodes and skin, but less so in blood (Figures 4C, D). Expression of the transcription factors AIRE (previously associated with negative selection of self-recognizing T-cells) (33) and TCF7 (associated with central memory T-cells) (34) discriminated the malignant cells in peripheral blood from those in skin (Figure 4D). CD27, previously described to be absent from terminally differentiated memory T-cells (35), was universally downregulated in lymphoma cells (Figure 4A). Taken these data together, we found that malignant clones harbored a multitude of pro-inflammatory mediators, in stark contrast to benign T-cells.
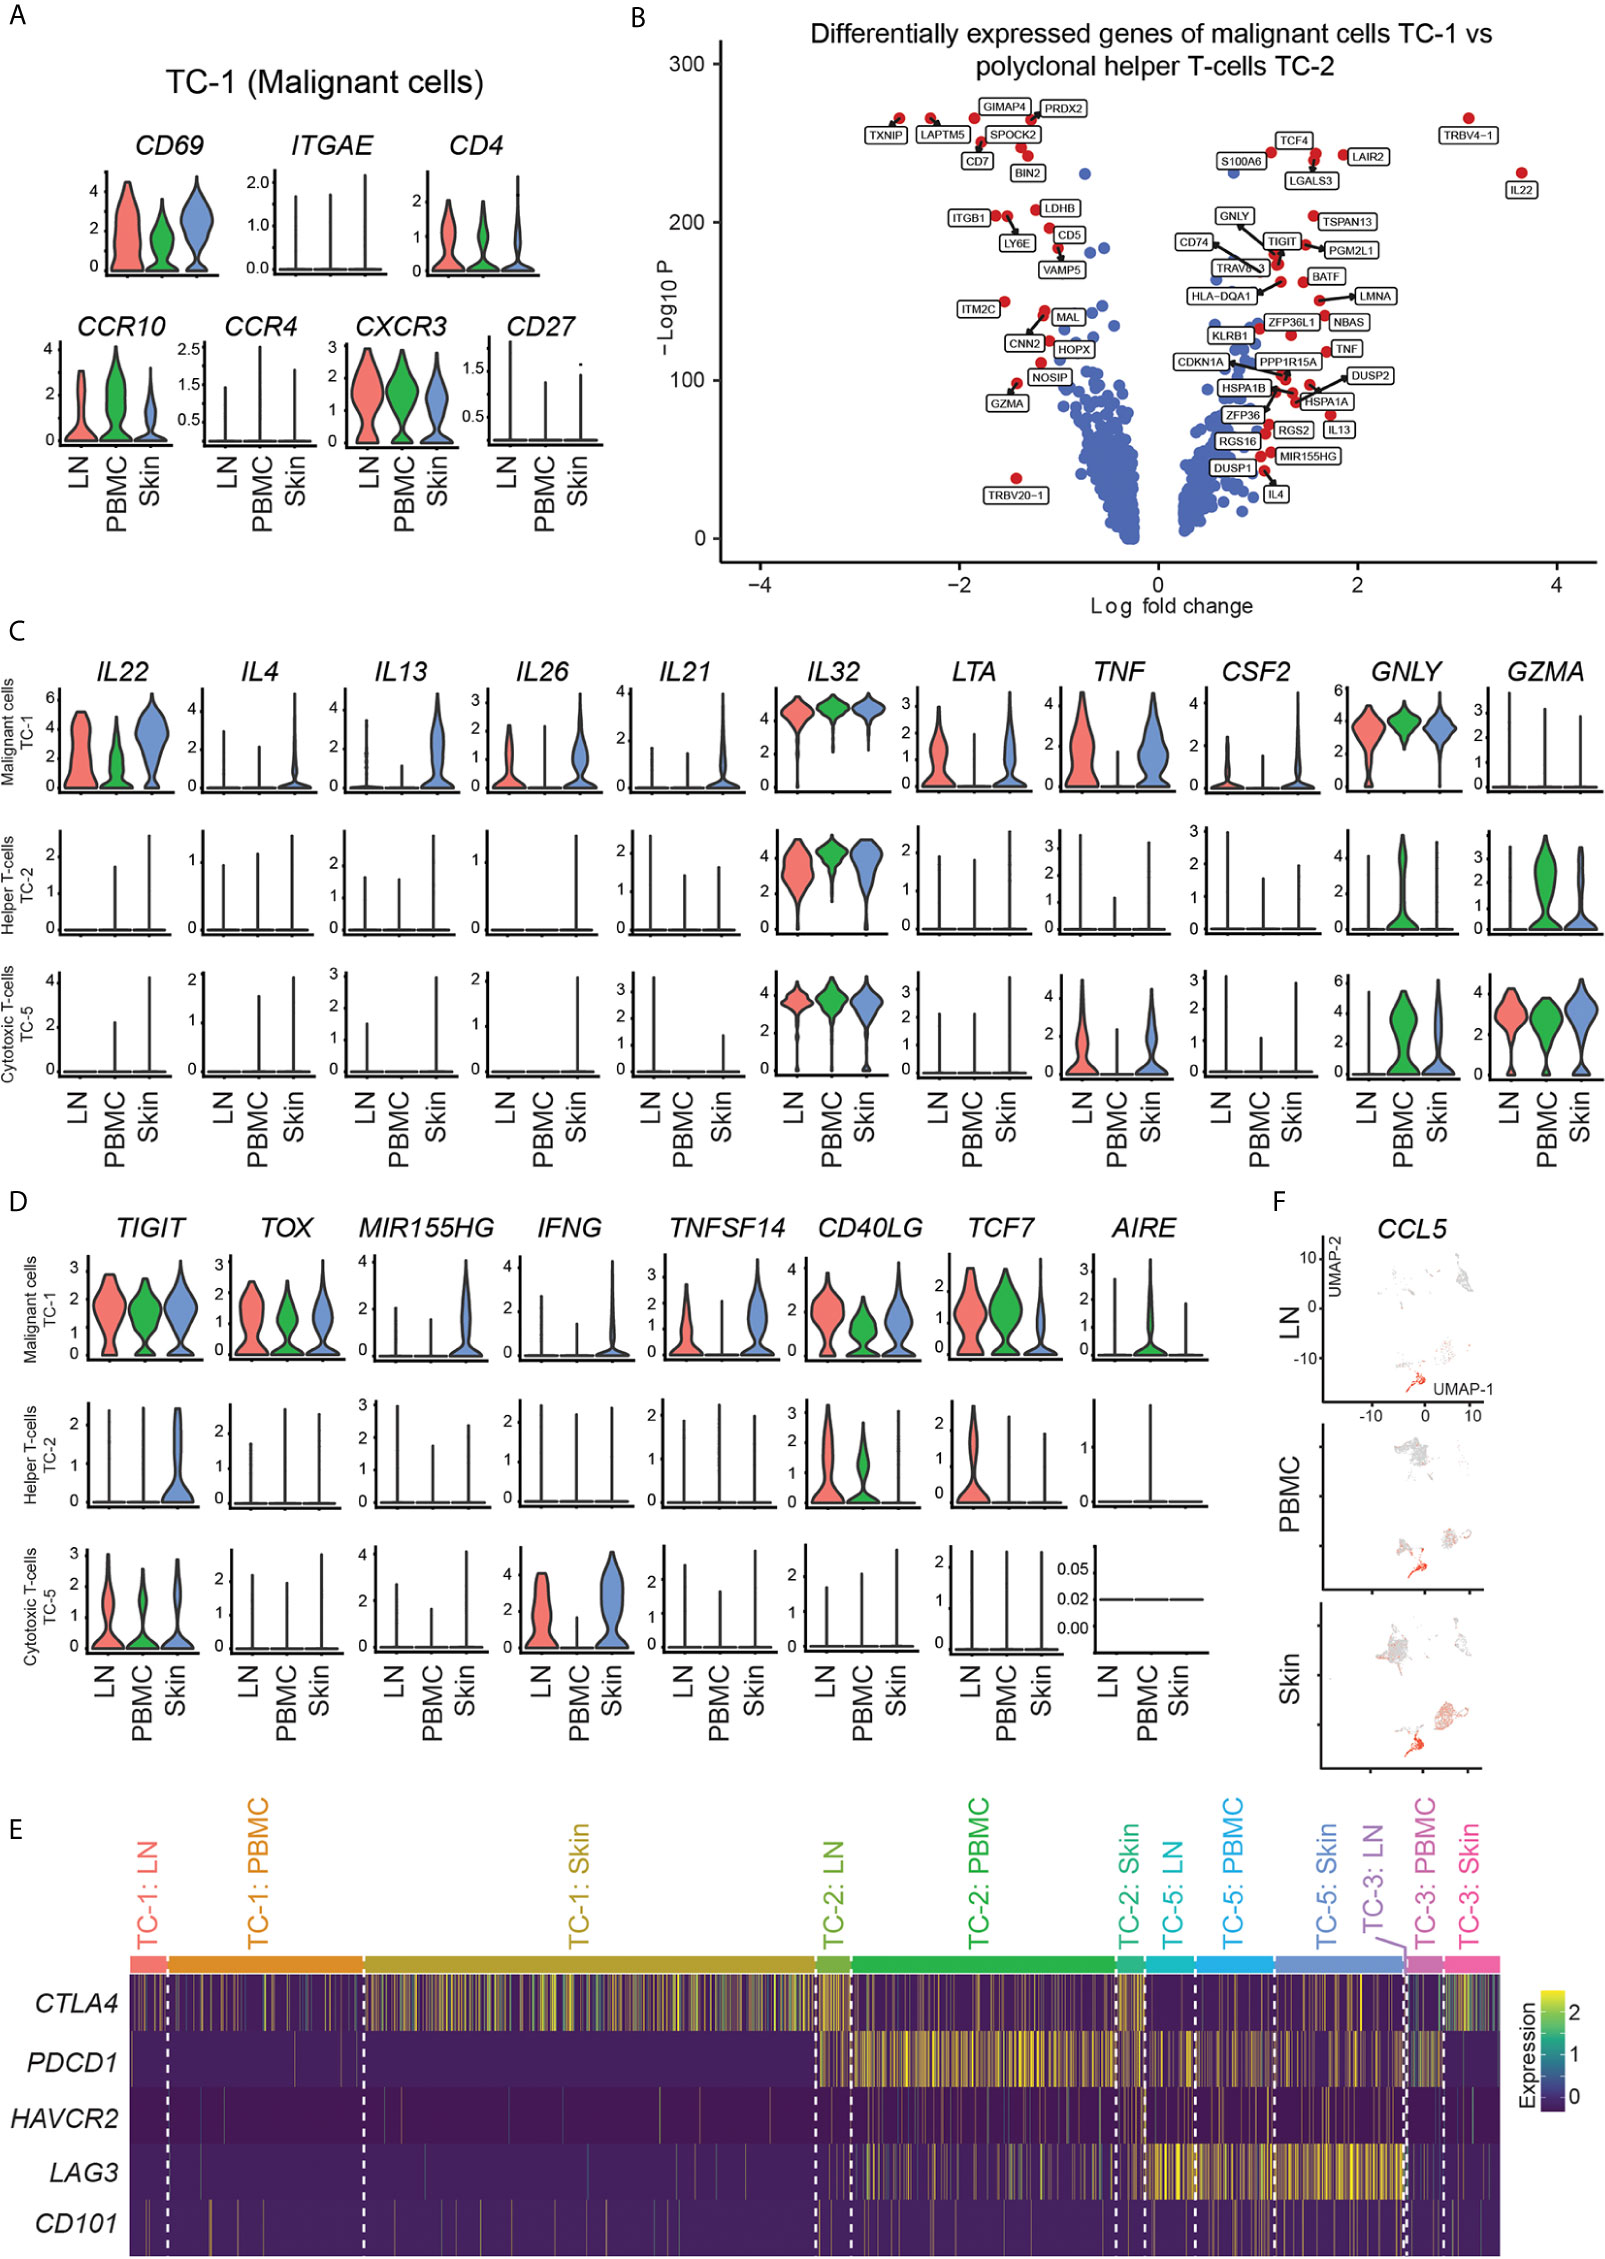
Figure 4 Marker expression of malignant and benign T-cells. (A) Violin plots of T-cells in cluster TC-1 showing distribution of normalized gene expression levels of the respective genes in lymph node (red), blood (green) and skin samples (blue). (B) Volcano plot of differentially express genes between T-cells in malignant cluster TC-1 and benign T-helper cell cluster TC-2 combining all samples as calculated by Wilcoxon Rank Sum Test and Bonferroni correction. Genes with log fold change >|1.0| are labeled in red. (C, D) Violin plots of TC-1 (clonally expanded tumor cells), TC-2 (benign helper T-cells) and TC-5 (benign CD8+ cytotoxic T-cells) showing the distribution of normalized gene expression levels of the respective genes in lymph node (red), blood (green) and skin samples (blue). (E) Expression heat map of selected checkpoint molecules. Upregulation is indicated in yellow, downregulation in purple. (F) Feature plots of CCL5 (RANTES). Normalized expression levels for each cell are color-coded (red) and overlaid onto separate UMAP plots for lymph node (LN), blood (PBMC) and skin. Intensity red color reflects respective level of expression.
Next, we assessed factors involved in the control of cell activation, namely inhibitory receptors such as CTLA4, PDCD1 (PD-1), HAVCR2 (TIM-3), LAG3, and CD101 (IGSF2) (36). In line with their strong pro-inflammatory phenotype, clonally expanded cells showed absence of these markers, with only a partial expression of CTLA4 (Figure 4E). By contrast, benign helper T-cells (TC-2) expressed PDCD1 and partly LAG3 and CTLA4, while cytotoxic T-cells (TC-5) highly expressed LAG3 (Figure 4E), consistent with their less inflammatory phenotype. These data indicate that the lack of inhibitory molecules might be involved in the aberrant inflammatory cytokine pattern of clonally expanded cells, suggesting a cell-intrinsic contribution of hyperactivation in these cells.
Besides the malignant clone, benign inflammatory cells surrounding CTCL cells have also been assumed to play a role in control versus progression of the disease (6). Activated CD8+ cytotoxic T-cells have been postulated as major anti-CTCL cells in early lesions when the disease is still confined to the skin, but lose this capacity when the disease progresses (6). CD8A+ cells in cluster TC-5 were rich in the killer molecules GZMA (Figure 4C), GZMK, GZMH, and GZMB (Figure S1), and were main producers of IFNG in skin and lymph nodes (Figure 4D and Table S2), the type-1 lead cytokine associated with anti-CTCL properties (37). However, CD8A+ cells also ubiquitously showed highest levels of CCL5 (RANTES) (Figure 4F and Table S2), a chemokine previously shown to maintain CD4+ TRM cells after infection or sensitization (38), but that also attracts monocytes which were shown to promote the survival of MF cells in a mouse model (39). NK/NKT-cells were also rich in GZMA, GZMB, CCL5 and IFNG (Figure S1 and Table S2), but did not show significant differences between skin and lymph nodes (Table S9). Benign helper T-cells (TC-2) displayed significantly increased levels of IL2RA and TNFRSF18 (GITR) in skin compared to lymph node tissue (Figure S3C and Table S10), consistent with a more regulatory phenotype. Compared to blood, they showed increases in the checkpoint molecule CTLA4, most likely due to increased levels of FOXP3+ regulatory T-cells within this cluster (Figure S3D and Table S10). Conversely, levels of the cytotoxic molecule TNFSF10 (TNF-related apoptosis-inducing ligand TRAIL) were decreased compared to blood cells (Figure S3D and Table S10), potentially marking decreased anti-tumor activity (40). Benign skin versus blood helper T-cells also showed increases in ICOS (CD278) (Figure S3D and Table S10), a costimulatory molecule present in activated T-cells especially associated with type 2 inflammation (41), corroborating a more Th2 versus Th1-skewed skin phenotype, consistent with CTCL progression (6, 42). These data suggest that both, helper and cytotoxic T-cells surrounding CTCL cells in skin, have several regulatory features and may thus help in sustaining a pro-tumorigenic environment.
Myeloid cells, including dendritic cells, play a central role in T-cell biology, including in vitro survival of malignant T-cells (39). We found a large population of ITGAX/CD11c dendritic cells (DC-1) in skin, strongly positive for the Th2-associated markers amphiregulin (AREG), and the chemokines CXCL2, CXCL3 and CXCL8 (Figure S1 and Table S2). While previous reports suggest an abundance of immature dendritic cells in advanced CTCL lesions implicated in tumor progression (39), DC-1 highly expressed the maturation marker CD83 (Figure 5A). Nevertheless, they were the main producers of the regulatory cytokine IL10 (Figure 5B), and positive for VEGFA (Figure 5C), a major angiogenetic growth factor associated with advanced CTCL (43).
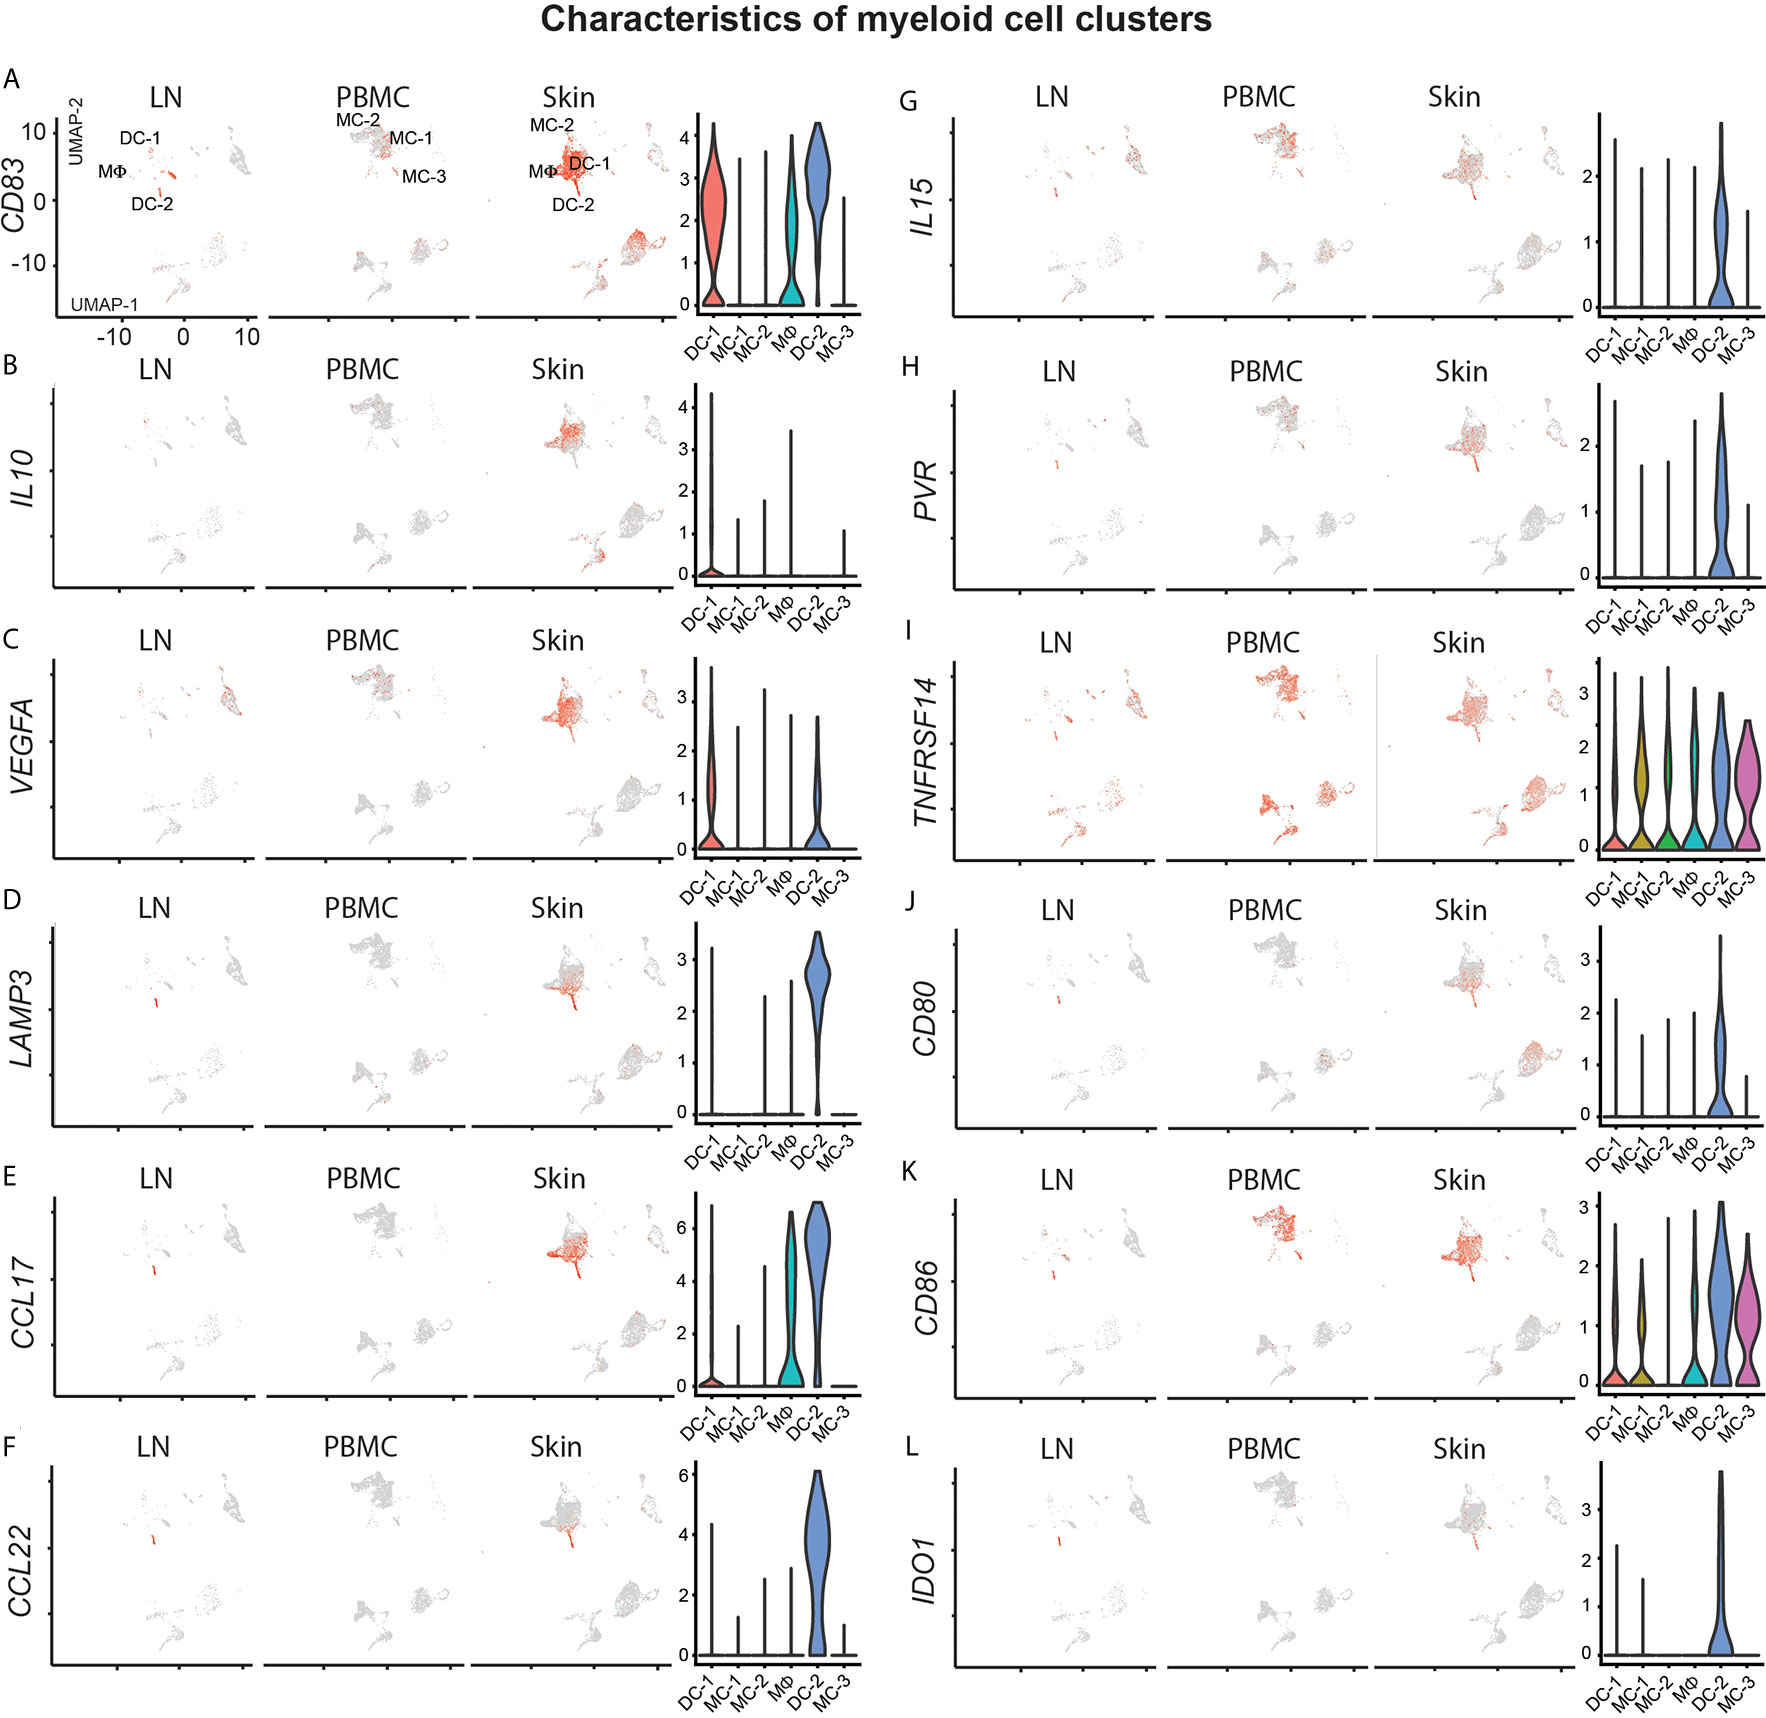
Figure 5 Characterization of myeloid cell clusters. (A–L) For feature plots, normalized expression levels for each cell are color-coded (red) and overlaid onto separate UMAP plots for lymph node (LN), blood (PBMC) and skin. Intensity of color reflects respective level of expression. Violin plots of the combined samples show the distribution of normalized gene expression levels of the respective genes in color-coded DC-1, MC-1, MC-2, MΦ, DC-2 and MC-3 clusters.
Dendritic cells from cluster DC-2 harbored the maturation marker LAMP3 (Figure 5D) and were present only at relatively small frequencies in comparison to all other myeloid cells (Figure 2B), but were also found in lymph node tissue, consistent with previous reports (44). They were characterized by peak expression of Th2-associated chemokines (45) CCL17 and CCL22 (Figures 5E, F). DC-2 also expressed IL15 both in skin and lymph node tissue (Figure 5G), a cytokine previously shown to promote CTCL (46) and implicated in the maintenance of TRM (47), as well as the receptors for tumor cell derived TIGIT, TNFSF14 (LIGHT) and CTLA4, namely PVR, TNFRSF14 and CD80/CD86, respectively (Figures 5H–K). They also expressed IDO1 (Figure 5L), coding for the enzyme indoleamine-pyrrole 2,3-dioxygenase that has immunosuppressive and T-cell modulatory functions, potentially involved in CTCL pathogenesis (48).
Skin macrophages (MФ) were also positive for Th2-promoting chemokines such as CCL18, CCL13 and CCL17 (Figure S1, Figure 5E and Table S2). Blood monocytes in clusters MC-1, MC-2 and MC-3 were found only at traces in lymph node and skin tissues, and generally lacked chemokine expression or activation markers such as CD83 (Figure 5A). Taken together, myeloid cells were largely skewed towards more type 2 inflammation and regulatory mediators, consistent with a more pro-CTCL tumor microenvironment (6).
To gain further insight into the relationship of cellular fates in skin, blood and lymph node (19), we applied trajectory inference analysis using the Monocle 2 algorithm on malignant T-cells (Figure 6A). In the resulting trajectory, cells from peripheral blood and skin were found at opposing ends, while lymph node cells were mostly scattered along the manifold (Figure 6B), suggesting transcriptomic properties related both to skin and blood cells.
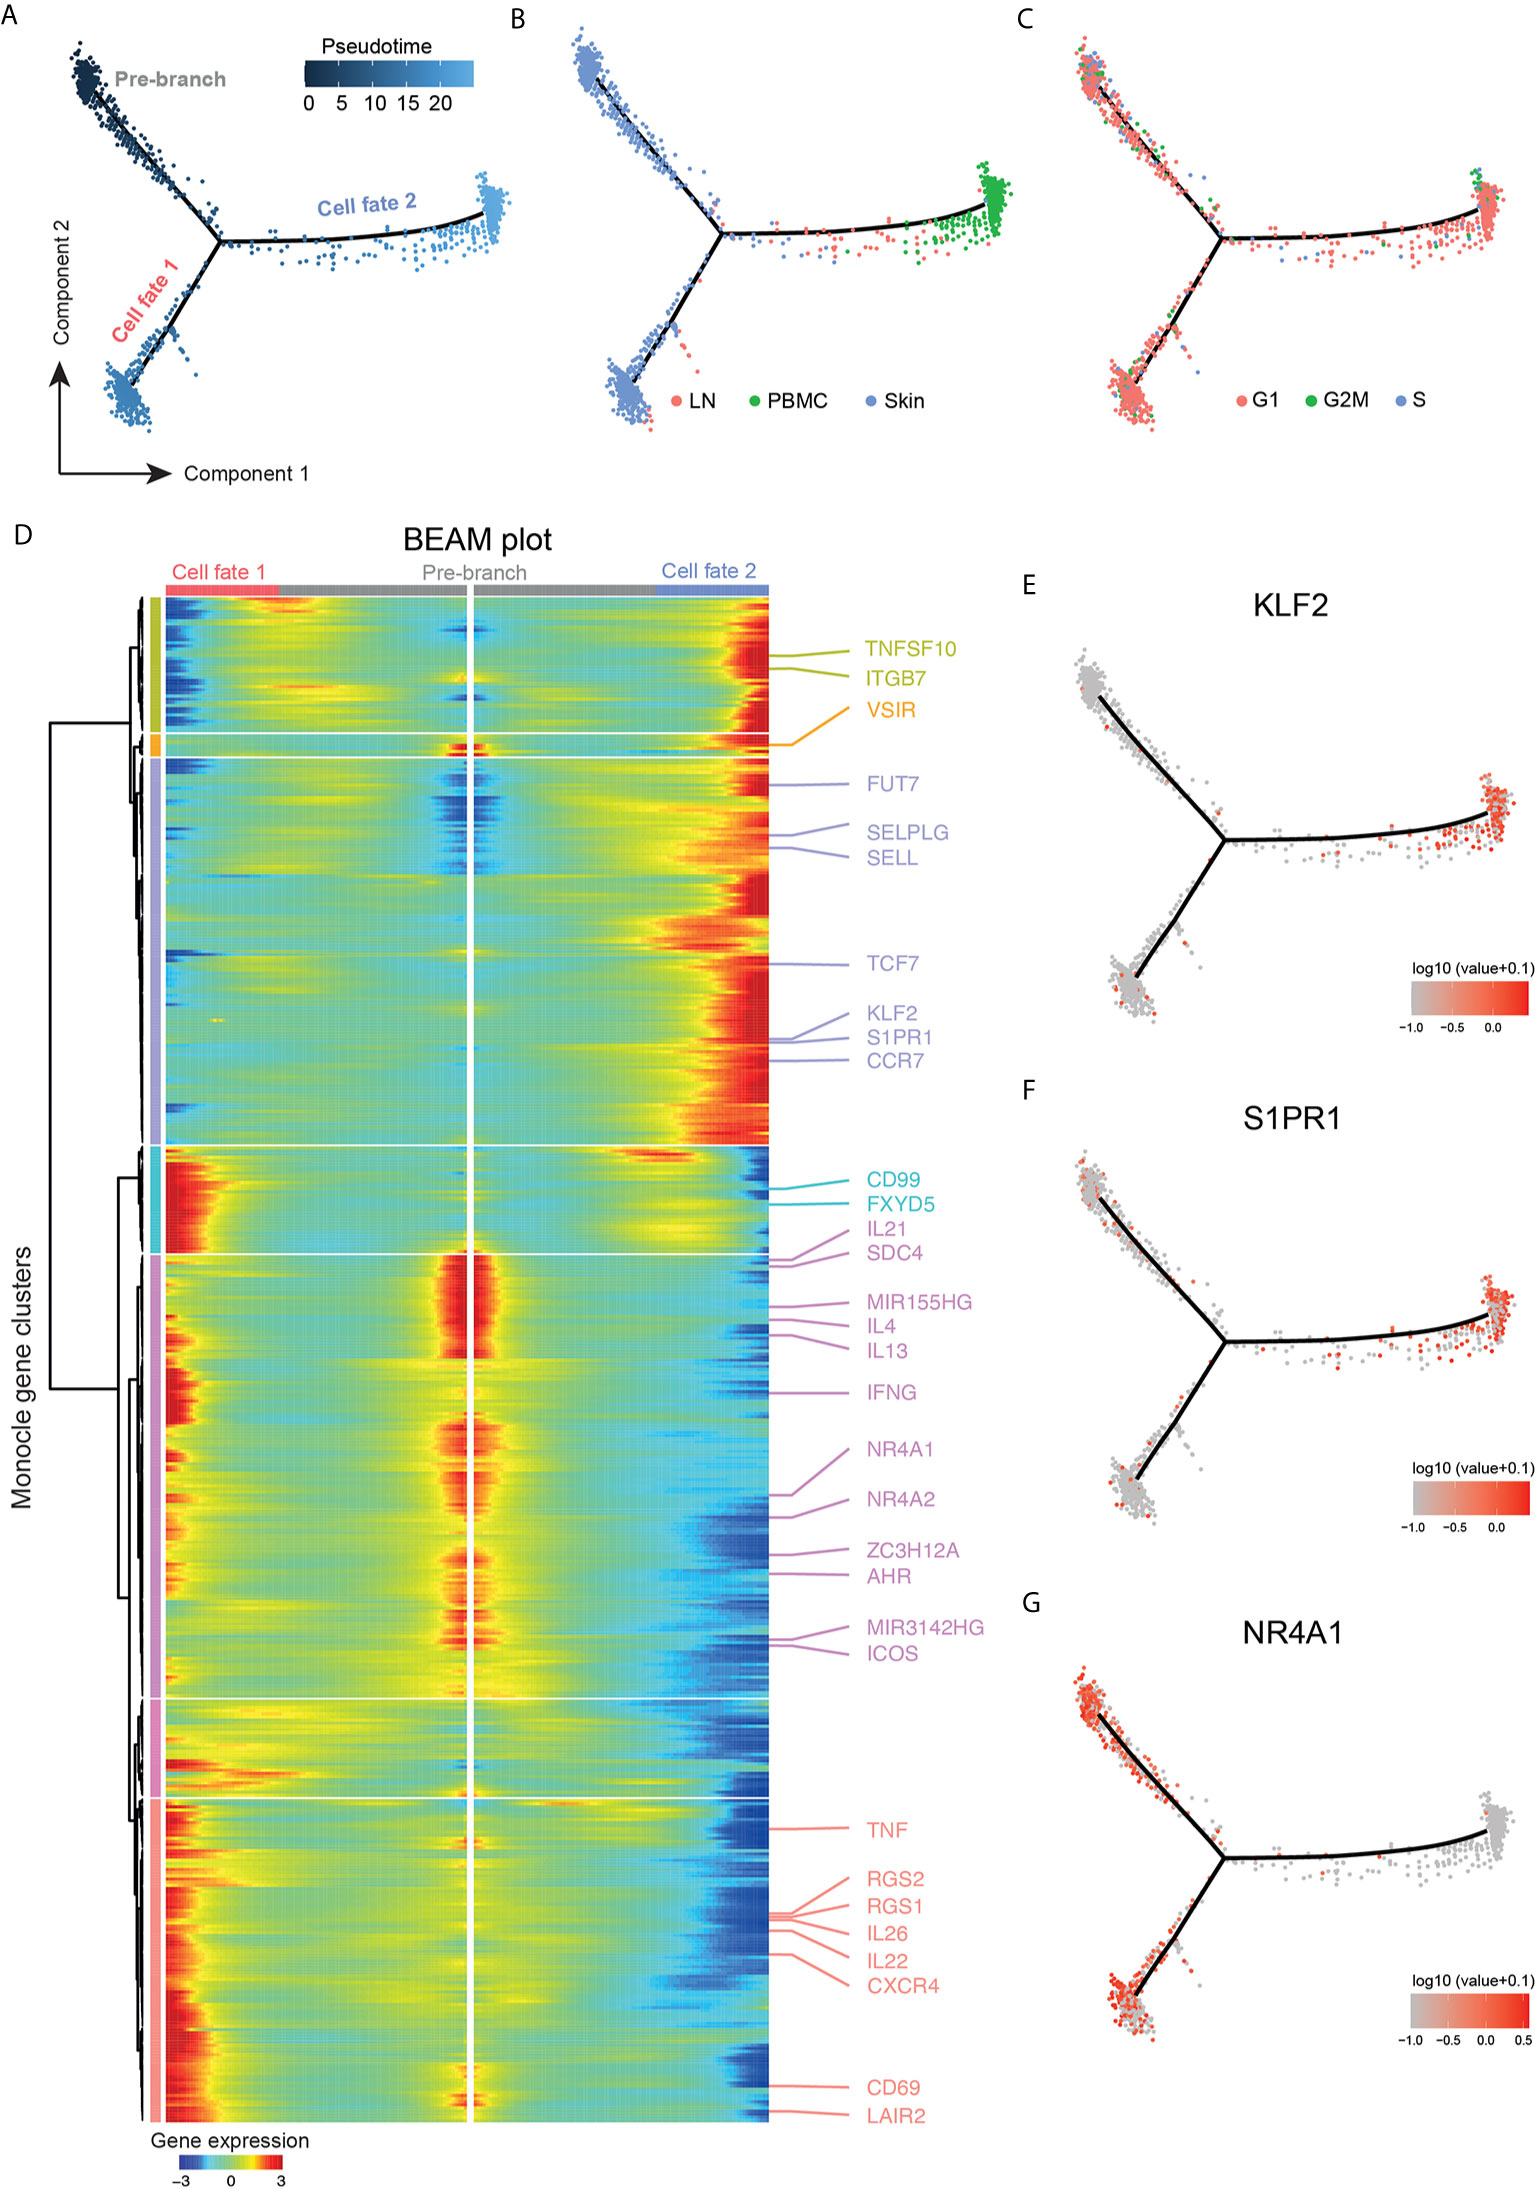
Figure 6 Trajectory analysis highlighting tumor clone plasticity throughout body compartments. (A) Pseudotime ordering of malignant cells from clusters TC-1 and TC-3 along a bifurcated cell trajectory. Plot colored according to pseudotime. (B) Trajectory plot colored according to tissue of origin in red (LN: lymph node), green (PBMC, peripheral blood mononuclear cells), and blue (skin). (C) Trajectory plot colored according cell cycle phase in red (G1), green (G2/M) and blue (S). (D) Bifurcated expression heat map of genes for bifurcation between cell fates 1 and 2. Middle of heat map shows pre-branch cells, left side the expression of cells from “cell fate 1”, and right side the expression blood-oriented cells (“cell fate 2”). (E–G) Trajectory plots with overlaid expression of respective genes, highest expression in red, lowest expression in grey.
The influence of cell cycle genes in proliferating cells was not the major determinant for pseudotime alignment since cycling cells were found on all branch ends, and were spread throughout the trajectory (Figure 6C). To discern genes responsible for the construction of the manifold, branched expression analysis modeling (BEAM) was performed (Figure 6D). Genes with a q-value<10-5 were considered for further analyses. For the main branching (“cell fate 1” versus “cell fate 2”), 500 genes fulfilled this criterion (Table S11). There was also a small side branch within “cell fate 1” containing a few lymph node cells (Figure 6B), but it did not elicit significantly regulated genes (all q-value>0.1) and was therefore not further analyzed (data not shown). In blood, the transcription factor KLF2 as well as the target downstream gene S1PR1 were upregulated (Figures 6D–F), consistent with the loss of tissue retention (49). Concordantly, the transcription factor TCF7, which is usually downregulated on TRM and is important for TCM differentiation (49), was expressed on malignant cells in the blood, together with the TCM surface markers and lymph node homing receptors SELL and CCR7 (Figure 6D).
Importantly, malignant cells of the peripheral blood expressed the skin-homing receptor CLA as shown by flow cytometry (Figure S4), consistent with corresponding gene upregulation of both SELPLG and the fucosyltransferase FUT7 (50) (Figure 6D), indicating their retained capability to home to the skin (51, 52).
NR4A1 (Nur77), NR4A2, and AHR, markers associated with tissue retention of TRM cells, as well as the CTCL-typical micro-RNAs MIR155 and MIR3142 were all associated with the skin phenotype (Figures 6D, G). “Pre-branch” cells expressed Th2-associated mediators (IL4, IL13, IL21, ICOS). Cells in the skin after the bifurcation (“cell fate 1”) further upregulated transcripts characteristic of TRM including CD69, CXCR4 (53), and regulator of G protein signaling 1 and 2 (RGS1, RGS2), and these cells showed additional upregulation of Th22, TH17 and Th1-associated cytokines (IL22, IL26, TNF, IFNG), while “pre-branch” cells expressed several immunoregulatory markers such as VSIR, SDC4, and ZC3H12A. In addition, “cell fate 1” cells showed upregulation of transcripts involved in cell motility including LAIR2 (54), CD99 (55) and FXYD5 (56), discriminating them from “pre-branch” cells. These data support intra-tumor heterogeneity not only between tissues, but also among malignant cells of the skin, reflected by distinct profiles of regulatory, inflammatory and potentially migratory properties.
Reliable tracing of individual T-cell populations in humans can be a major challenge. scRNA-seq with simultaneous V-D-J sequencing of the TCR now allows for the investigation of specific T-cell clones and their transcriptomic behavior throughout various body compartments. In our patient, malignant cells of the skin showed all the characteristics of benign TRM cells as described before, with expression of the skin homing molecule CCR10 as well as CD69 accompanied by downregulation of the transcription factor KLF2 (57), and ample production of cytokines (58). In blood, by contrast, these MF cells showed a loss of the tissue retention signature as evidenced by the upregulation of KLF2 and, consequently, upregulation of S1PR1 and downregulation of CD69, indicative of a shift towards a more TCM-like phenotype, consistent with increased TCF7 expression (57). In accordance, lymph node homing receptors (SELL and CCR7) were upregulated. Until recently, TRM were believed to be a sessile, non-recirculating, terminally differentiated population restricted to their non-lymphoid tissue of residence, such as the skin (59, 60). This dogma has recently been challenged by observations in mice showing equilibration of skin resident memory T-cells upon parabiosis over 12-16 weeks (38). Importantly, the malignant clone in our patient displayed exactly the same shift in phenotype as observed in TRM in a murine model, demonstrating that CD8+ TRM from skin can rejoin the circulation after antigenic stimulation or activation (61). They could then either maintain their phenotype and home back to their tissue of origin, or even differentiate into TEM and TCM cells (61). In a xenograft mouse model, TRM cells had the capability to migrate out of the skin, but showed preferential homing back to a human skin equivalent (62). In line, blood CD4+CD69-CD103+ cells were transcriptionally and clonally related to skin CD4+CD69+CD103+ TRM in this model system (62). In our MF patient, malignant cells in blood seemed to also retain their skin-homing capabilities, indicated by maintained CLA and CCR10 expression. The systemic dissemination of tumor cells in MF could therefore reflect the physiological migratory behavior of tissue resident memory T-cells, and might help to explain the clinical observation that MF lesions can spread to virtually any skin site, which, intuitively, needs to happen via the bloodstream. Importantly, it is not yet understood which factors regulate the egress or the reentry of TRM from non-lymphoid tissues. Upregulation of certain pro-migratory mediators (LAIR2, CD99, FXYD5) by a subset of skin lymphoma cells might contribute to the altered migratory behavior of these cells, but this hypothesis needs corroboration in functional studies.
TRM cells are poised to rapidly react after antigenic re-challenge, a process that is assumed to be under stringent control by inhibitory receptors (36), that can also be present on CTCL cells (5). In our patient, these receptors were largely absent, except for CTLA4. Secreted CTLA4 can act on dendritic cells inducing the expression of IDO and rendering them tolerant (63). Additionally, the resulting tryptophan deprivation and generation of toxic metabolites have been shown to preferentially induce apoptosis in Th1 cells and less so in Th2 cells, which would favor a pro-tumorigenic environment (6). In our patient, a distinct population of LAMP3+ dendritic cells expressed the CTLA4 receptors CD80 and CD86, as well as IDO1. They also expressed TNFRSF14 and PVR, the receptors for TNFSF14 (LIGHT) and TIGIT, respectively, which are both synthesized by the tumor cells, and might additionally enhance local Th2 immune skewing (31, 64). The main population of skin myeloid cells (DC-1) were CD83+ co- expressing VEGFA and small amounts of IL10, features that are implicated in the sustainment of a pro-tumorigenic milieu (65, 66).
This study is limited by data derived from only one patient, at one single (advanced) stage of disease. Also, due to scarcity of sample, we only had few lymph node cells available. Given the substantial heterogeneity not only between CTCL patients, but also within the malignant clone (11, 67, 68), our findings need corroboration in additional patients and subtypes of CTCL. Nevertheless, the general possibility to trace a defined clone throughout three human body compartments sheds new light on the transcriptomic plasticity within these cells, which might be directly linked to their migratory behavior. Future studies will need to clarify the role of cell intrinsic mechanisms versus the impact of the tissue microenvironment in this regard.
The datasets presented in this study can be found in online repositories. The names of the repository/repositories and accession number(s) can be found below: https://www.ncbi.nlm.nih.gov/geo/, GSE165623.
The studies involving human participants were reviewed and approved by Ethics Committee of the Medical University of Vienna, Austria. The patients/participants provided their written informed consent to participate in this study.
Conceptualization, PB, MF, WB, CJ, KR. Software and Formal Analysis, KR, MW. Investigation, MF, WB, LS, CJ, ISK, MM, FT, SP. Writing – Original Draft, WB, CJ, KR, WW. Writing – Review and Editing, PB, MF, KR. Visualization, TR. Funding Acquisition, PB. All authors contributed to the article and approved the submitted version.
This work was funded by a research grant to PMB from the Austrian Science Fund (grant number KLI 849-B). MF was supported by a research grant from the Austrian Science Fund (grant number SFB-F61.03).
CJ is an employee of the Medical University of Vienna, and has received personal fees from AbbVie, Almirall, Amgen, Eli Lilly, Janssen, LEO Pharma, Mallinckrodt/Therakos, Pfizer, Novartis, Sandoz, Takeda, and UCB. CJ is an investigator for Eli Lilly and Company, Novartis and 4SC (grant paid to her institution). PB is an employee of the Medical University of Vienna, and has received personal fees from LEO Pharma, Pfizer, Sanofi Genzyme, Eli Lilly, Novartis, Celgene, UCB Pharma, Biotest, Boehringer Ingelheim, AbbVie, Amgen and Arena Pharmaceuticals. PB is an investigator for Novartis (grant paid to his institution). WB is an employee of the Medical University of Vienna and has received personal fees from Takeda, Abbvie, GSK/ViiV and Gilead. SP has received personal fees from Takeda. MM has received personal fees (speaker honoraria) from Siemens and Bristol Myers Squibb. WW is an employee of the Medical University of Vienna and has received personal fees from LEO Pharma, Pfizer, Sanofi Genzyme, Eli Lilly, Novartis, Boehringer Ingelheim, AbbVie, and Janssen.
The remaining authors declare that the research was conducted in the absence of any commercial or financial relationships that could be construed as a potential conflict of interest.
The Supplementary Material for this article can be found online at: https://www.frontiersin.org/articles/10.3389/fimmu.2021.666935/full#supplementary-material
Supplementary Figure 1 | Cluster marker heat map. Heat map displaying the top 10 differentially expressed genes (according to highest log-fold change ordered by smallest adjusted p value using Wilcoxon Rank Sum Test with Bonferroni correction for each cluster compared with the rest of the dataset); upregulation is indicated in yellow, and downregulation in purple; numbers on top refer to the respective cell clusters displayed in Figure 2B.
Supplementary Figure 2 | (A, B) Feature plots of CD5 and CD7, respectively. Normalized expression levels for each cell are color-coded (red) and overlaid onto separate UMAP plots for lymph node (LN), blood (PBMC) and skin. Intensity of red color reflects respective level of expression. (C) Violin plots showing the number of genes per cell, the percentage of mitochondrial gene content and counts per cell in all clusters. (D) Violin plots showing the computed doublet score for each cluster combined for all samples.
Supplementary Figure 3 | Volcano plots of differentially expressed genes comparing skin and lymph node or skin and PBMCs in (A, B) TC-1 and in (C, D) TC-2, as calculated by Wilcoxon Rank Sum Test and Bonferroni correction. PBMC: Peripheral blood mononuclear cells.
Supplementary Figure 4 | Flow cytometric analysis of PBMCs confirming CLA expression of circulating MF tumor cells (CD3+CD4+CD7-). Blue histogram denotes isotype control.
Supplementary Table 1 | Cell counts per cluster and sample derived from our scRNA-seq dataset.
Supplementary Table 2 | Top 10 differentially expressed genes (scRNA-seq clustermarker) according to highest log fold change ordered by smallest adjusted p-value using Wilcoxon Rank Sum Test with Bonferroni correction for each cluster, as compared to the rest of the dataset in all sequenced skin cells.
Supplementary Table 3 | Numbers and frequencies of top 20 TCR clones as detected by TRA and/or TRB expression.
Supplementary Table 4 | Regions with copy number variations in malignant cells with clonotype TRB1 and TRB2. State 4= addition of one copy.
Supplementary Table 5 | Differential gene expression analysis within cell types of scRNA-seq analyses as defined by logFC>|0.25| and adjusted p-value<0.05, using Wilcoxon Rank Sum Test and Bonferroni correction. Comparisons of cluster TC-2 vs cluster TC-1, cluster TC-2 vs cluster TC-3, and cluster TC-2 vs cluster TC-4 are shown.
Supplementary Table 6 | Regulated genes (differentially expressed genes) corresponding to the Venn diagram in Figures 3E, F.
Supplementary Table 7 | Top 100 differentially expressed genes (scRNA-seq clustermarker) for T-cell clusters, according to highest log fold change ordered by smallest adjusted p-value using Wilcoxon Rank Sum Test with Bonferroni correction, as compared to the rest of the dataset, calculated separately for skin, blood and lymph node (LN) samples.
Supplementary Table 8 | Differential gene expression analysis within cell types of scRNA-seq analyses as defined by logFC>|0.25| and adjusted p-value<0.05, using Wilcoxon Rank Sum Test and Bonferroni correction. Comparison of lymph node (LN) vs skin, and skin vs blood (PBMC) samples within cluster TC-1.
Supplementary Table 9 | Differential gene expression analysis within cell types of scRNA-seq analyses as defined by logFC>|0.25| and adjusted p-value<0.05, using Wilcoxon Rank Sum Test and Bonferroni correction. Comparison of lymph node (LN) and skin samples within the NK cell cluster.
Supplementary Table 10 | Differential gene expression analysis within cell types of scRNA-seq analyses as defined by logFC>|0.25| and adjusted p-value<0.05, using Wilcoxon Rank Sum Test and Bonferroni correction. Comparison of lymph node (LN) vs skin, and skin vs blood (PBMC) samples within cluster TC-2.
Supplementary Table 11 | Genes with branch dependent changes in gene expression according to branched expression analysis modeling (BEAM) from the R package Monocle. Only genes with a q-value <10-6 and expressed in more than 10 cells are shown in the table and in Figure 6D (500 genes).
CTCL, Cutaneous T-cell lymphoma; MF, Mycosis fungoides; mSWAT, Modified Severity Weighted Assessment Tool; TCR, T-cell receptor; TCM, Central memory T-cell; TEM, Effector memory T-cell; TRM, Tissue resident memory T-cell; scRNA-seq, Single-cell RNA sequencing; TRA, T-cell receptor alpha locus; TRB, T-cell receptor beta locus; CDR3, Complementarity-determining region 3.
1. Jawed SI, Myskowski PL, Horwitz S, Moskowitz A, Querfeld C. Primary cutaneous T-cell lymphoma (mycosis fungoides and Sezary syndrome): part I. Diagnosis: clinical and histopathologic features and new molecular and biologic markers. J Am Acad Dermatol (2014) 70(2):205.e1–16; quiz 221-2. doi: 10.1016/j.jaad.2013.07.049
2. Willemze R, Cerroni L, Kempf W, Berti E, Facchetti F, Swerdlow SH, et al. The 2018 update of the WHO-EORTC classification for primary cutaneous lymphomas. Blood (2019) 133(16):1703–14. doi: 10.1182/blood-2018-11-881268
3. Wilcox RA. Cutaneous T-cell lymphoma: 2017 update on diagnosis, risk-stratification, and management. Am J Hematol (2017) 92:1085–102. doi: 10.1002/ajh.24876
4. Campbell JJ, Clark RA, Watanabe R, Kupper TS. Sezary syndrome and mycosis fungoides arise from distinct T-cell subsets: a biologic rationale for their distinct clinical behaviors. Blood (2010) 116:767–71. doi: 10.1182/blood-2009-11-251926
5. Querfeld C, Leung S, Myskowski PL, Curran SA, Goldman DA, Heller G, et al. Primary T Cells from Cutaneous T-cell Lymphoma Skin Explants Display an Exhausted Immune Checkpoint Profile. Cancer Immunol Res (2018) 6:900–9. doi: 10.1158/2326-6066.CIR-17-0270
6. Krejsgaard T, Lindahl LM, Mongan NP, Wasik MA, Litvinov IV, Iversen L, et al. Malignant inflammation in cutaneous T-cell lymphoma-a hostile takeover. Semin Immunopathol (2017) 39:269–82. doi: 10.1007/s00281-016-0594-9
7. Kirsch IR, Watanabe R, O'Malley JT, Williamson DW, Scott LL, Elco CP, et al. TCR sequencing facilitates diagnosis and identifies mature T cells as the cell of origin in CTCL. Sci Transl Med (2015) 7:308ra158. doi: 10.1126/scitranslmed.aaa9122
8. Sherwood AM, Desmarais C, Livingston RJ, Andriesen J, Haussler M, Carlson CS, et al. Deep sequencing of the human TCRgamma and TCRbeta repertoires suggests that TCRbeta rearranges after alphabeta and gammadelta T cell commitment. Sci Transl Med (2011) 3:90ra61. doi: 10.1126/scitranslmed.3002536
9. Iyer A, Hennessey D, O'Keefe S, Patterson J, Wang W, Salopek T, et al. Clonotypic heterogeneity in cutaneous T-cell lymphoma (mycosis fungoides) revealed by comprehensive whole-exome sequencing. Blood Adv (2019) 3:1175–84. doi: 10.1182/bloodadvances.2018027482
10. Iyer A, Hennessey D, O'Keefe S, Patterson J, Wang W, Wong GK, et al. Branched evolution and genomic intratumor heterogeneity in the pathogenesis of cutaneous T-cell lymphoma. Blood Adv (2020) 4:2489–500. doi: 10.1182/bloodadvances.2020001441
11. Gaydosik AM, Tabib T, Geskin LJ, Bayan CY, Conway JF, Lafyatis R, et al. Single-cell lymphocyte heterogeneity in advanced Cutaneous T-Cell Lymphoma skin tumors. Clin Cancer Res (2019) 25(14):4443–54. doi: 10.1158/1078-0432.CCR-19-0148
12. Butler A, Hoffman P, Smibert P, Papalexi E, Satija R. Integrating single-cell transcriptomic data across different conditions, technologies, and species. Nat Biotechnol (2018) 36:411–20. doi: 10.1038/nbt.4096
13. Stuart T, Butler A, Hoffman P, Hafemeister C, Papalexi E, Mauck WM 3rd, et al. Comprehensive Integration of Single-Cell Data. Cell (2019) 177:1888–902.e1821. doi: 10.1016/j.cell.2019.05.031
14. Aran D, Looney AP, Liu L, Wu E, Fong V, Hsu A, et al. Reference-based analysis of lung single-cell sequencing reveals a transitional profibrotic macrophage. Nat Immunol (2019) 20:163–72. doi: 10.1038/s41590-018-0276-y
15. Lun AT, McCarthy DJ, Marioni JC. A step-by-step workflow for low-level analysis of single-cell RNA-seq data with Bioconductor. F1000Res (2016) 5:2122. doi: 10.12688/f1000research.9501.2
16. Tirosh I, Izar B, Prakadan SM, Wadsworth MH 2nd, Treacy D, Trombetta JJ, et al. Dissecting the multicellular ecosystem of metastatic melanoma by single-cell RNA-seq. Science (2016) 352:189–96. doi: 10.1126/science.aad0501
17. Trapnell C, Cacchiarelli D, Grimsby J, Pokharel P, Li S, Morse M, et al. The dynamics and regulators of cell fate decisions are revealed by pseudotemporal ordering of single cells. Nat Biotechnol (2014) 32:381–6. doi: 10.1038/nbt.2859
18. Qiu X, Hill A, Packer J, Lin D, Ma YA, Trapnell C, et al. Single-cell mRNA quantification and differential analysis with Census. Nat Methods (2017) 14:309–15. doi: 10.1038/nmeth.4150
19. Qiu X, Mao Q, Tang Y, Wang L, Chawla R, Pliner HA, et al. Reversed graph embedding resolves complex single-cell trajectories. Nat Methods (2017) 14:979–82. doi: 10.1038/nmeth.4402
20. Becht E, McInnes L, Healy J, Dutertre CA, Kwok IWH, Ng LG, et al. Dimensionality reduction for visualizing single-cell data using UMAP. Nat Biotechnol (2018) 37:38–44. doi: 10.1038/nbt.4314
21. Ilicic T, Kim JK, Kolodziejczyk AA, Bagger FO, McCarthy DJ, Marioni JC, et al. Classification of low quality cells from single-cell RNA-seq data. Genome Biol (2016) 17:29. doi: 10.1186/s13059-016-0888-1
22. Park JE, Botting RA, Dominguez Conde C, Popescu DM, Lavaert M, Kunz DJ, et al. A cell atlas of human thymic development defines T cell repertoire formation. Science (2020) 367(6480):eaay3224. doi: 10.1126/science.aay3224
23. Fan J, Lee HO, Lee S, Ryu DE, Lee S, Xue C, et al. Linking transcriptional and genetic tumor heterogeneity through allele analysis of single-cell RNA-seq data. Genome Res (2018) 28:1217–27. doi: 10.1101/gr.228080.117
24. da Silva Almeida AC, Abate F, Khiabanian H, Martinez-Escala E, Guitart J, Tensen CP, et al. The mutational landscape of cutaneous T cell lymphoma and Sezary syndrome. Nat Genet (2015) 47:1465–70. doi: 10.1038/ng.3442
25. Folkes AS, Feng M, Zain JM, Abdulla F, Rosen ST, Querfeld C, et al. Targeting CD47 as a cancer therapeutic strategy: the cutaneous T-cell lymphoma experience. Curr Opin Oncol (2018) 30:332–7. doi: 10.1097/CCO.0000000000000468
26. Clark RA. Resident memory T cells in human health and disease. Sci Transl Med (2015) 7:269rv261. doi: 10.1126/scitranslmed.3010641
27. Watanabe R, Gehad A, Yang C, Scott LL, Teague JE, Schlapbach C, et al. Human skin is protected by four functionally and phenotypically discrete populations of resident and recirculating memory T cells. Sci Transl Med (2015) 7:279ra239. doi: 10.1126/scitranslmed.3010302
28. Tortola L, Jacobs A, Pohlmeier L, Obermair FJ, Ampenberger F, Bodenmiller B, et al. High-Dimensional T Helper Cell Profiling Reveals a Broad Diversity of Stably Committed Effector States and Uncovers Interlineage Relationships. Immunity (2020) 53:597–613.e596. doi: 10.1016/j.immuni.2020.07.001
29. McGirt LY, Degesys CA, Johnson VE, Zic JA, Zwerner JP, Eischen CM, et al. TOX expression and role in CTCL. J Eur Acad Dermatol Venereol (2016) 30:1497–502. doi: 10.1111/jdv.13651
30. Kopp KL, Ralfkiaer U, Gjerdrum LM, Helvad R, Pedersen IH, Litman T, et al. STAT5-mediated expression of oncogenic miR-155 in cutaneous T-cell lymphoma. Cell Cycle (2013) 12:1939–47. doi: 10.4161/cc.24987
31. Soroosh P, Doherty TA, So T, Mehta AK, Khorram N, Norris PS, et al. Herpesvirus entry mediator (TNFRSF14) regulates the persistence of T helper memory cell populations. J Exp Med (2011) 208:797–809. doi: 10.1084/jem.20101562
32. Netchiporouk E, Litvinov IV, Moreau L, Gilbert M, Sasseville D, Duvic M. Deregulation in STAT signaling is important for cutaneous T-cell lymphoma (CTCL) pathogenesis and cancer progression. Cell Cycle (2014) 13:3331–5. doi: 10.4161/15384101.2014.965061
33. Anderson MS, Su MA. Aire and T cell development. Curr Opin Immunol (2011) 23:198–206. doi: 10.1016/j.coi.2010.11.007
34. Pais Ferreira D, Silva JG, Wyss T, Fuertes Marraco SA, Scarpellino L, Charmoy M, et al. Central memory CD8(+) T cells derive from stem-like Tcf7(hi) effector cells in the absence of cytotoxic differentiation. Immunity (2020) 53:985–1000 e1011. doi: 10.1016/j.immuni.2020.09.005
35. Fritsch RD, Shen X, Sims GP, Hathcock KS, Hodes RJ, Lipsky PE, et al. Stepwise differentiation of CD4 memory T cells defined by expression of CCR7 and CD27. J Immunol (2005) 175:6489–97. doi: 10.4049/jimmunol.175.10.6489
36. Szabo PA, Miron M, Farber DL. Location, location, location: Tissue resident memory T cells in mice and humans. Sci Immunol (2019) 4(34):eaas9673. doi: 10.1126/sciimmunol.aas9673
37. Phyo ZH, Shanbhag S, Rozati S. Update on Biology of Cutaneous T-Cell Lymphoma. Front Oncol (2020) 10:765. doi: 10.3389/fonc.2020.00765
38. Collins N, Jiang X, Zaid A, Macleod BL, Li J, Park CO, et al. Skin CD4(+) memory T cells exhibit combined cluster-mediated retention and equilibration with the circulation. Nat Commun (2016) 7:1514. doi: 10.1038/ncomms11514
39. Wilcox RA, Wada DA, Ziesmer SC, Elsawa SF, Comfere NI, Dietz AB, et al. Monocytes promote tumor cell survival in T-cell lymphoproliferative disorders and are impaired in their ability to differentiate into mature dendritic cells. Blood (2009) 114:2936–44. doi: 10.1182/blood-2009-05-220111
40. Braun FK, Al-Yacoub N, Plotz M, Mobs M, Sterry W, Eberle J, et al. Nonsteroidal anti-inflammatory drugs induce apoptosis in cutaneous T-cell lymphoma cells and enhance their sensitivity for TNF-related apoptosis-inducing ligand. J Invest Dermatol (2012) 132:429–39. doi: 10.1038/jid.2011.316
41. Clay BS, Shilling RA, Bandukwala HS, Moore TV, Cannon JL, Welcher AA, et al. Inducible costimulator expression regulates the magnitude of Th2-mediated airway inflammation by regulating the number of Th2 cells. PloS One (2009) 4:e7525. doi: 10.1371/journal.pone.0007525
42. Guenova E, Watanabe R, Teague JE, Desimone JA, Jiang Y, Dowlatshahi M, et al. TH2 cytokines from malignant cells suppress TH1 responses and enforce a global TH2 bias in leukemic cutaneous T-cell lymphoma. Clin Cancer Res (2013) 19:3755–63. doi: 10.1158/1078-0432.CCR-12-3488
43. Miyagaki T, Sugaya M, Oka T, Takahashi N, Kawaguchi M, Suga H, et al. Placental Growth Factor and Vascular Endothelial Growth Factor Together Regulate Tumour Progression via Increased Vasculature in Cutaneous T-cell Lymphoma. Acta Derm Venereol (2017) 97:586–92. doi: 10.2340/00015555-2623
44. Tada K, Hamada T, Asagoe K, Umemura H, Mizuno-Ikeda K, Aoyama Y. Increase of DC-LAMP+ mature dendritic cell subsets in dermatopathic lymphadenitis of mycosis fungoides. Eur J Dermatol (2014) 24:670–5. doi: 10.1684/ejd.2014.2437
45. Nakazato J, Kishida M, Kuroiwa R, Fujiwara J, Shimoda M, Shinomiya N, et al. Serum levels of Th2 chemokines, CCL17, CCL22, and CCL27, were the important markers of severity in infantile atopic dermatitis. Pediatr Allergy Immunol (2008) 19:605–13. doi: 10.1111/j.1399-3038.2007.00692.x
46. Mishra A, La Perle K, Kwiatkowski S, Sullivan LA, Sams GH, Johns J, et al. Mechanism, Consequences, and Therapeutic Targeting of Abnormal IL15 Signaling in Cutaneous T-cell Lymphoma. Cancer Discovery (2016) 6:986–1005. doi: 10.1158/2159-8290.CD-15-1297
47. Adachi T, Kobayashi T, Sugihara E, Yamada T, Ikuta K, Pittaluga S, et al. Hair follicle-derived IL-7 and IL-15 mediate skin-resident memory T cell homeostasis and lymphoma. Nat Med (2015) 21:1272–9. doi: 10.1038/nm.3962
48. Maliniemi P, Laukkanen K, Vakeva L, Dettmer K, Lipsanen T, Jeskanen L, et al. Biological and clinical significance of tryptophan-catabolizing enzymes in cutaneous T-cell lymphomas. Oncoimmunology (2017) 6:e1273310. doi: 10.1080/2162402X.2016.1273310
49. Mackay LK, Minnich M, Kragten NA, Liao Y, Nota B, Seillet C, et al. Hobit and Blimp1 instruct a universal transcriptional program of tissue residency in lymphocytes. Science (2016) 352:459–63. doi: 10.1126/science.aad2035
50. Buffone A Jr, Mondal N, Gupta R, McHugh KP, Lau JT, Neelamegham S. Silencing alpha1,3-fucosyltransferases in human leukocytes reveals a role for FUT9 enzyme during E-selectin-mediated cell adhesion. J Biol Chem (2013) 288:1620–33. doi: 10.1074/jbc.M112.400929
51. Mizukawa Y, Takahashi R, Yamazaki Y, Kimishima M, Shiohara T. Fucosyltransferase VII-positive, skin-homing T cells in the blood and skin lesions of atopic dermatitis patients. Exp Dermatol (2008) 17:170–6. doi: 10.1111/j.1600-0625.2007.00656.x
52. Pink M, Ratsch BA, Mardahl M, Durek P, Polansky JK, Karl M, et al. Imprinting of Skin/Inflammation Homing in CD4+ T Cells Is Controlled by DNA Methylation within the Fucosyltransferase 7 Gene. J Immunol (2016) 197:3406–14. doi: 10.4049/jimmunol.1502434
53. Narducci MG, Scala E, Bresin A, Caprini E, Picchio MC, Remotti D, et al. Skin homing of Sezary cells involves SDF-1-CXCR4 signaling and down-regulation of CD26/dipeptidylpeptidase IV. Blood (2006) 107:1108–15. doi: 10.1182/blood-2005-04-1492
54. Andrews JM, Schmidt JA, Carson KR, Musiek AC, Mehta-Shah N, Payton JE. Novel cell adhesion/migration pathways are predictive markers of HDAC inhibitor resistance in cutaneous T cell lymphoma. EBioMedicine (2019) 46:170–83. doi: 10.1016/j.ebiom.2019.07.053
55. Muller WA. Localized signals that regulate transendothelial migration. Curr Opin Immunol (2016) 38:24–9. doi: 10.1016/j.coi.2015.10.006
56. Shimamura T, Yasuda J, Ino Y, Gotoh M, Tsuchiya A, Nakajima A, et al. Dysadherin expression facilitates cell motility and metastatic potential of human pancreatic cancer cells. Cancer Res (2004) 64:6989–95. doi: 10.1158/0008-5472.CAN-04-1166
57. Kumar BV, Ma W, Miron M, Granot T, Guyer RS, Carpenter DJ, et al. Human Tissue-Resident Memory T Cells Are Defined by Core Transcriptional and Functional Signatures in Lymphoid and Mucosal Sites. Cell Rep (2017) 20:2921–34. doi: 10.1016/j.celrep.2017.08.078
58. Masopust D, Soerens AG. Tissue-Resident T Cells and Other Resident Leukocytes. Annu Rev Immunol (2019) 37:521–46. doi: 10.1146/annurev-immunol-042617-053214
59. Gratz IK, Campbell DJ. Resident memory T cells show that it is never too late to change your ways. Nat Immunol (2020) 21:359–60. doi: 10.1038/s41590-020-0637-1
60. Farber DL, Yudanin NA, Restifo NP. Human memory T cells: generation, compartmentalization and homeostasis. Nat Rev Immunol (2014) 14:24–35. doi: 10.1038/nri3567
61. Fonseca R, Beura LK, Quarnstrom CF, Ghoneim HE, Fan Y, Zebley CC, et al. Developmental plasticity allows outside-in immune responses by resident memory T cells. Nat Immunol (2020) 21:412–21. doi: 10.1038/s41590-020-0607-7
62. Klicznik MM, Morawski PA, Hollbacher B, Varkhande SR, Motley SJ, Kuri-Cervantes L, et al. Human CD4(+)CD103(+) cutaneous resident memory T cells are found in the circulation of healthy individuals. Sci Immunol (2019) 4(37):eaav8995. doi: 10.1126/sciimmunol.aav8995
63. Mellor AL, Munn DH. IDO expression by dendritic cells: tolerance and tryptophan catabolism. Nat Rev Immunol (2004) 4:762–74. doi: 10.1038/nri1457
64. Kourepini E, Paschalidis N, Simoes DC, Aggelakopoulou M, Grogan JL, Panoutsakopoulou V, et al. TIGIT Enhances Antigen-Specific Th2 Recall Responses and Allergic Disease. J Immunol (2016) 196:3570–80. doi: 10.4049/jimmunol.1501591
65. Wu X, Schulte BC, Zhou Y, Haribhai D, Mackinnon AC, Plaza JA, et al. Depletion of M2-like tumor-associated macrophages delays cutaneous T-cell lymphoma development in vivo. J Invest Dermatol (2014) 134:2814–22. doi: 10.1038/jid.2014.206
66. Sugaya M, Miyagaki T, Ohmatsu H, Suga H, Kai H, Kamata M, et al. Association of the numbers of CD163(+) cells in lesional skin and serum levels of soluble CD163 with disease progression of cutaneous T cell lymphoma. J Dermatol Sci (2012) 68:45–51. doi: 10.1016/j.jdermsci.2012.07.007
67. Borcherding N, Voigt AP, Liu V, Link BK, Zhang W, Jabbari A, et al. Single-Cell Profiling of Cutaneous T-Cell Lymphoma Reveals Underlying Heterogeneity Associated with Disease Progression. Clin Cancer Res (2019) 25:2996–3005. doi: 10.1158/1078-0432.CCR-18-3309
Keywords: single-cell RNA sequencing, cutaneous T-cell lymphoma (CTCL), mycosis fungoides, tissue resident memory T cells, central memory T cells
Citation: Rindler K, Bauer WM, Jonak C, Wielscher M, Shaw LE, Rojahn TB, Thaler FM, Porkert S, Simonitsch-Klupp I, Weninger W, Mayerhoefer ME, Farlik M and Brunner PM (2021) Single-Cell RNA Sequencing Reveals Tissue Compartment-Specific Plasticity of Mycosis Fungoides Tumor Cells. Front. Immunol. 12:666935. doi: 10.3389/fimmu.2021.666935
Received: 11 February 2021; Accepted: 29 March 2021;
Published: 21 April 2021.
Edited by:
Per thor Straten, Herlev Hospital, DenmarkReviewed by:
Jürgen Christian Becker, German Cancer Research Center (DKFZ), GermanyCopyright © 2021 Rindler, Bauer, Jonak, Wielscher, Shaw, Rojahn, Thaler, Porkert, Simonitsch-Klupp, Weninger, Mayerhoefer, Farlik and Brunner. This is an open-access article distributed under the terms of the Creative Commons Attribution License (CC BY). The use, distribution or reproduction in other forums is permitted, provided the original author(s) and the copyright owner(s) are credited and that the original publication in this journal is cited, in accordance with accepted academic practice. No use, distribution or reproduction is permitted which does not comply with these terms.
*Correspondence: Patrick M. Brunner, cGF0cmljay5icnVubmVyQG1lZHVuaXdpZW4uYWMuYXQ=
†These authors have contributed equally to this work
Disclaimer: All claims expressed in this article are solely those of the authors and do not necessarily represent those of their affiliated organizations, or those of the publisher, the editors and the reviewers. Any product that may be evaluated in this article or claim that may be made by its manufacturer is not guaranteed or endorsed by the publisher.
Research integrity at Frontiers
Learn more about the work of our research integrity team to safeguard the quality of each article we publish.