
94% of researchers rate our articles as excellent or good
Learn more about the work of our research integrity team to safeguard the quality of each article we publish.
Find out more
REVIEW article
Front. Immunol. , 31 March 2021
Sec. T Cell Biology
Volume 12 - 2021 | https://doi.org/10.3389/fimmu.2021.652687
This article is part of the Research Topic T Cell Signaling Networks in Health and Disease View all 9 articles
 Hao-Yun Peng1,2
 Jason Lucavs1
 Darby Ballard1
 Jugal Kishore Das1
 Anil Kumar1
 Liqing Wang1,2Yijie Ren1
 Xiaofang Xiong1
 Jianxun Song1*
T cells undergo metabolic reprogramming and multiple biological processes to satisfy their energetic and biosynthetic demands throughout their lifespan. Several of these metabolic pathways result in the generation of reactive oxygen species (ROS). The imbalance between ROS generation and scavenging could result in severe damage to the cells and potential cell death, ultimately leading to T cell-related diseases. Interestingly, ROS play an essential role in T cell immunity. Here, we introduce the important connectivity between T cell lifespan and the metabolic reprogramming among distinct T cell subsets. We also discuss the generation and sources of ROS production within T cell immunity as well as highlight recent research concerning the effects of ROS on T cell activities.
The rapid invasion and spreading of foreign pathogens often catch our immune system off guard. As critical host-mediated immune cells, T cells must be rapidly responded to foreign substances and efficiently proliferate in a timely manner. To grow, proliferate, and differentiate, T cells undergo metabolic reprogramming to meet their bioenergetic needs. T cells can engage a variety of distinct metabolic pathways, including glycolysis, oxidative phosphorylation (OXPHOS), fatty acid synthesis, etc. Energy production from those pathways unavoidably generates reactive oxygen species (ROS), which cause damage to the cell. However, there is compelling evidence that ROS acts as a critical signaling component in T cell immunity. In the following sections, we will highlight the metabolic reprogramming of distinct T cell subsets, including thymocytes, naive T cells, effector T cells, differentiated T cells, and memory T cells. We will address the sites and sources of ROS production in T cells, as well as the emerging concepts surrounding the impact of ROS production on T cell development, activation, differentiation, and apoptosis.
T cells originate from bone marrow and mature in the thymus. While maturing in the thymus, thymocytes encounter steps of selection to ensure the generation of mature T cells with the following characteristics: “foreign” antigen recognition, self-antigen tolerization, and accurate surface marker expression to perform effector functions. It is estimated that 95–97% of thymocytes are eliminated due to not meeting these criteria (1). During the early stage of thymic maturation, the glucose transporters Glut1 and Glut4 are highly expressed, suggesting an increase in glycolysis (2–4). The expression of Glut1 and Glut4 is significantly reduced as thymocytes mature to a later stage (2–4). The mature thymocytes, called naive T (Tn) cells, leave the thymus, circulate into the bloodstream, and finally arrive at the secondary lymphoid tissues, such as the spleen and lymph nodes (LNs). Peripheral naive T cells remain in quiescence and only accumulate essential cellular building blocks (6, 7). Tn cells generate the minimal energy needed to function by metabolizing glucose to pyruvate. The pyruvate will then enter the tricarboxylic acid cycle (TCA cycle) and undergo oxidative phosphorylation (OXPHOS) (6, 8). Alternatively, Tn may also utilize fatty acid synthesis (FAO) to produce sufficient ATP levels (8).
Tn cells are activated by the binding of the T cell receptors (TCR) and the antigen peptides on the major histocompatibility complex (MHC) from antigen-presenting cells (APC) with the help of costimulatory molecules (9). This ligation further triggers multiple signaling pathways, and the activated T cells expand and transform into effector T (Teff) cells with the assistance of multiple cytokines. To meet the demand for rapid proliferation, clonal expansion, and effector functions, Teff cells shift from mainly conducting OXPHOS to aerobic glycolysis (7, 10–14). Many studies have shown that glutaminolysis, pentose phosphate pathway, lipid synthesis, and OXPHOS are enhanced in Teff cells as well (10, 12, 13).
CD8+ Teff cells produce large amounts of perforin and granzyme B to eliminate foreign pathogens, viral-infected cells, and tumor cells (15). In comparison, CD4+ Teff cells secrete an array of cytokines and recruit other immune cells. CD4+ Teff cells differentiate into functionally distinct subsets in different cytokine environment: Th1, Th2, Th9, Th17, etc. Different subsets of differentiated Teff show distinct metabolic profiles, shown in Figure 1. T helper 1 (Th1) cells eliminate intracellular pathogens by producing IFNγ and can activate macrophages (16). Deficiency of lactate dehydrogenase A (LDHA) has shown reduced IFN-γ levels under T helper 1 (Th1) conditions (13). Another study mentioned that upon defective Th1 conditions, T cells fail to upregulate glycolysis and OXPHOS (17). Th1 cells utilize some OXPHOS and mainly glycolysis by expressing high levels of Glut 1 (14, 18, 19). T helper 2 (Th2) cells protect against extracellular parasites by secreting cytokine IL-4, IL-5, and IL-13 (20). Studies have shown that treatment with glycolysis inhibitor 2-deoxyglucose (2-DG) impaired Th2 differentiation (20, 21). These cells utilize the aerobic glycolytic pathway by expressing the most Glut1 than other Teff cells to meet their developmental and functional needs (14, 20). T helper 9 (Th9) cells secrete IL-9 to eliminate extracellular parasites. There have been numerous discoveries pertaining to the metabolic pathways of other Teff cells; however, how Th9 cells modulate their metabolic pathways remains unclear. A study conducted by Wang has shown that Th9 cell differentiation is dependent upon the TAK1-SIRT1-mTOR-HIF1α-glycolysis pathway (22). T helper 17 (Th17) cells protect against extracellular bacteria and fungi with an imbalance of Th17 leading to autoimmune disease (23). Various studies have shown that Th17 cells uptake glucose and undergo glutaminolysis (14, 18, 23–25). T follicular B helper T (Tfh) cells are distinguished from other Teff cells by their unique role in memory B cell development and plasma cell maturation (26). Tfh cells use both aerobic glycolysis and OXPHOS but lower levels with respect to Th1 cells (18). Regulatory T (Treg) cells have immunosuppressive capacities not seen in other T cell subsets. Unlike other T cell subsets, Treg exhibited both OXPHOS and FAO to maintain function (18, 24, 25). The surviving population of Teff cells remodels into memory T (Tm) cells which will later respond to future threats the Tm cells have previously experienced (11). Unlike high glycolytic Teff cells, Tm cells depend on OXPHOS and FAO to meet their metabolic needs (6, 7, 11, 12, 14, 27). The distinct metabolic profiling of T cell subsets may imply their biosynthetic needs and support their differing functional properties.
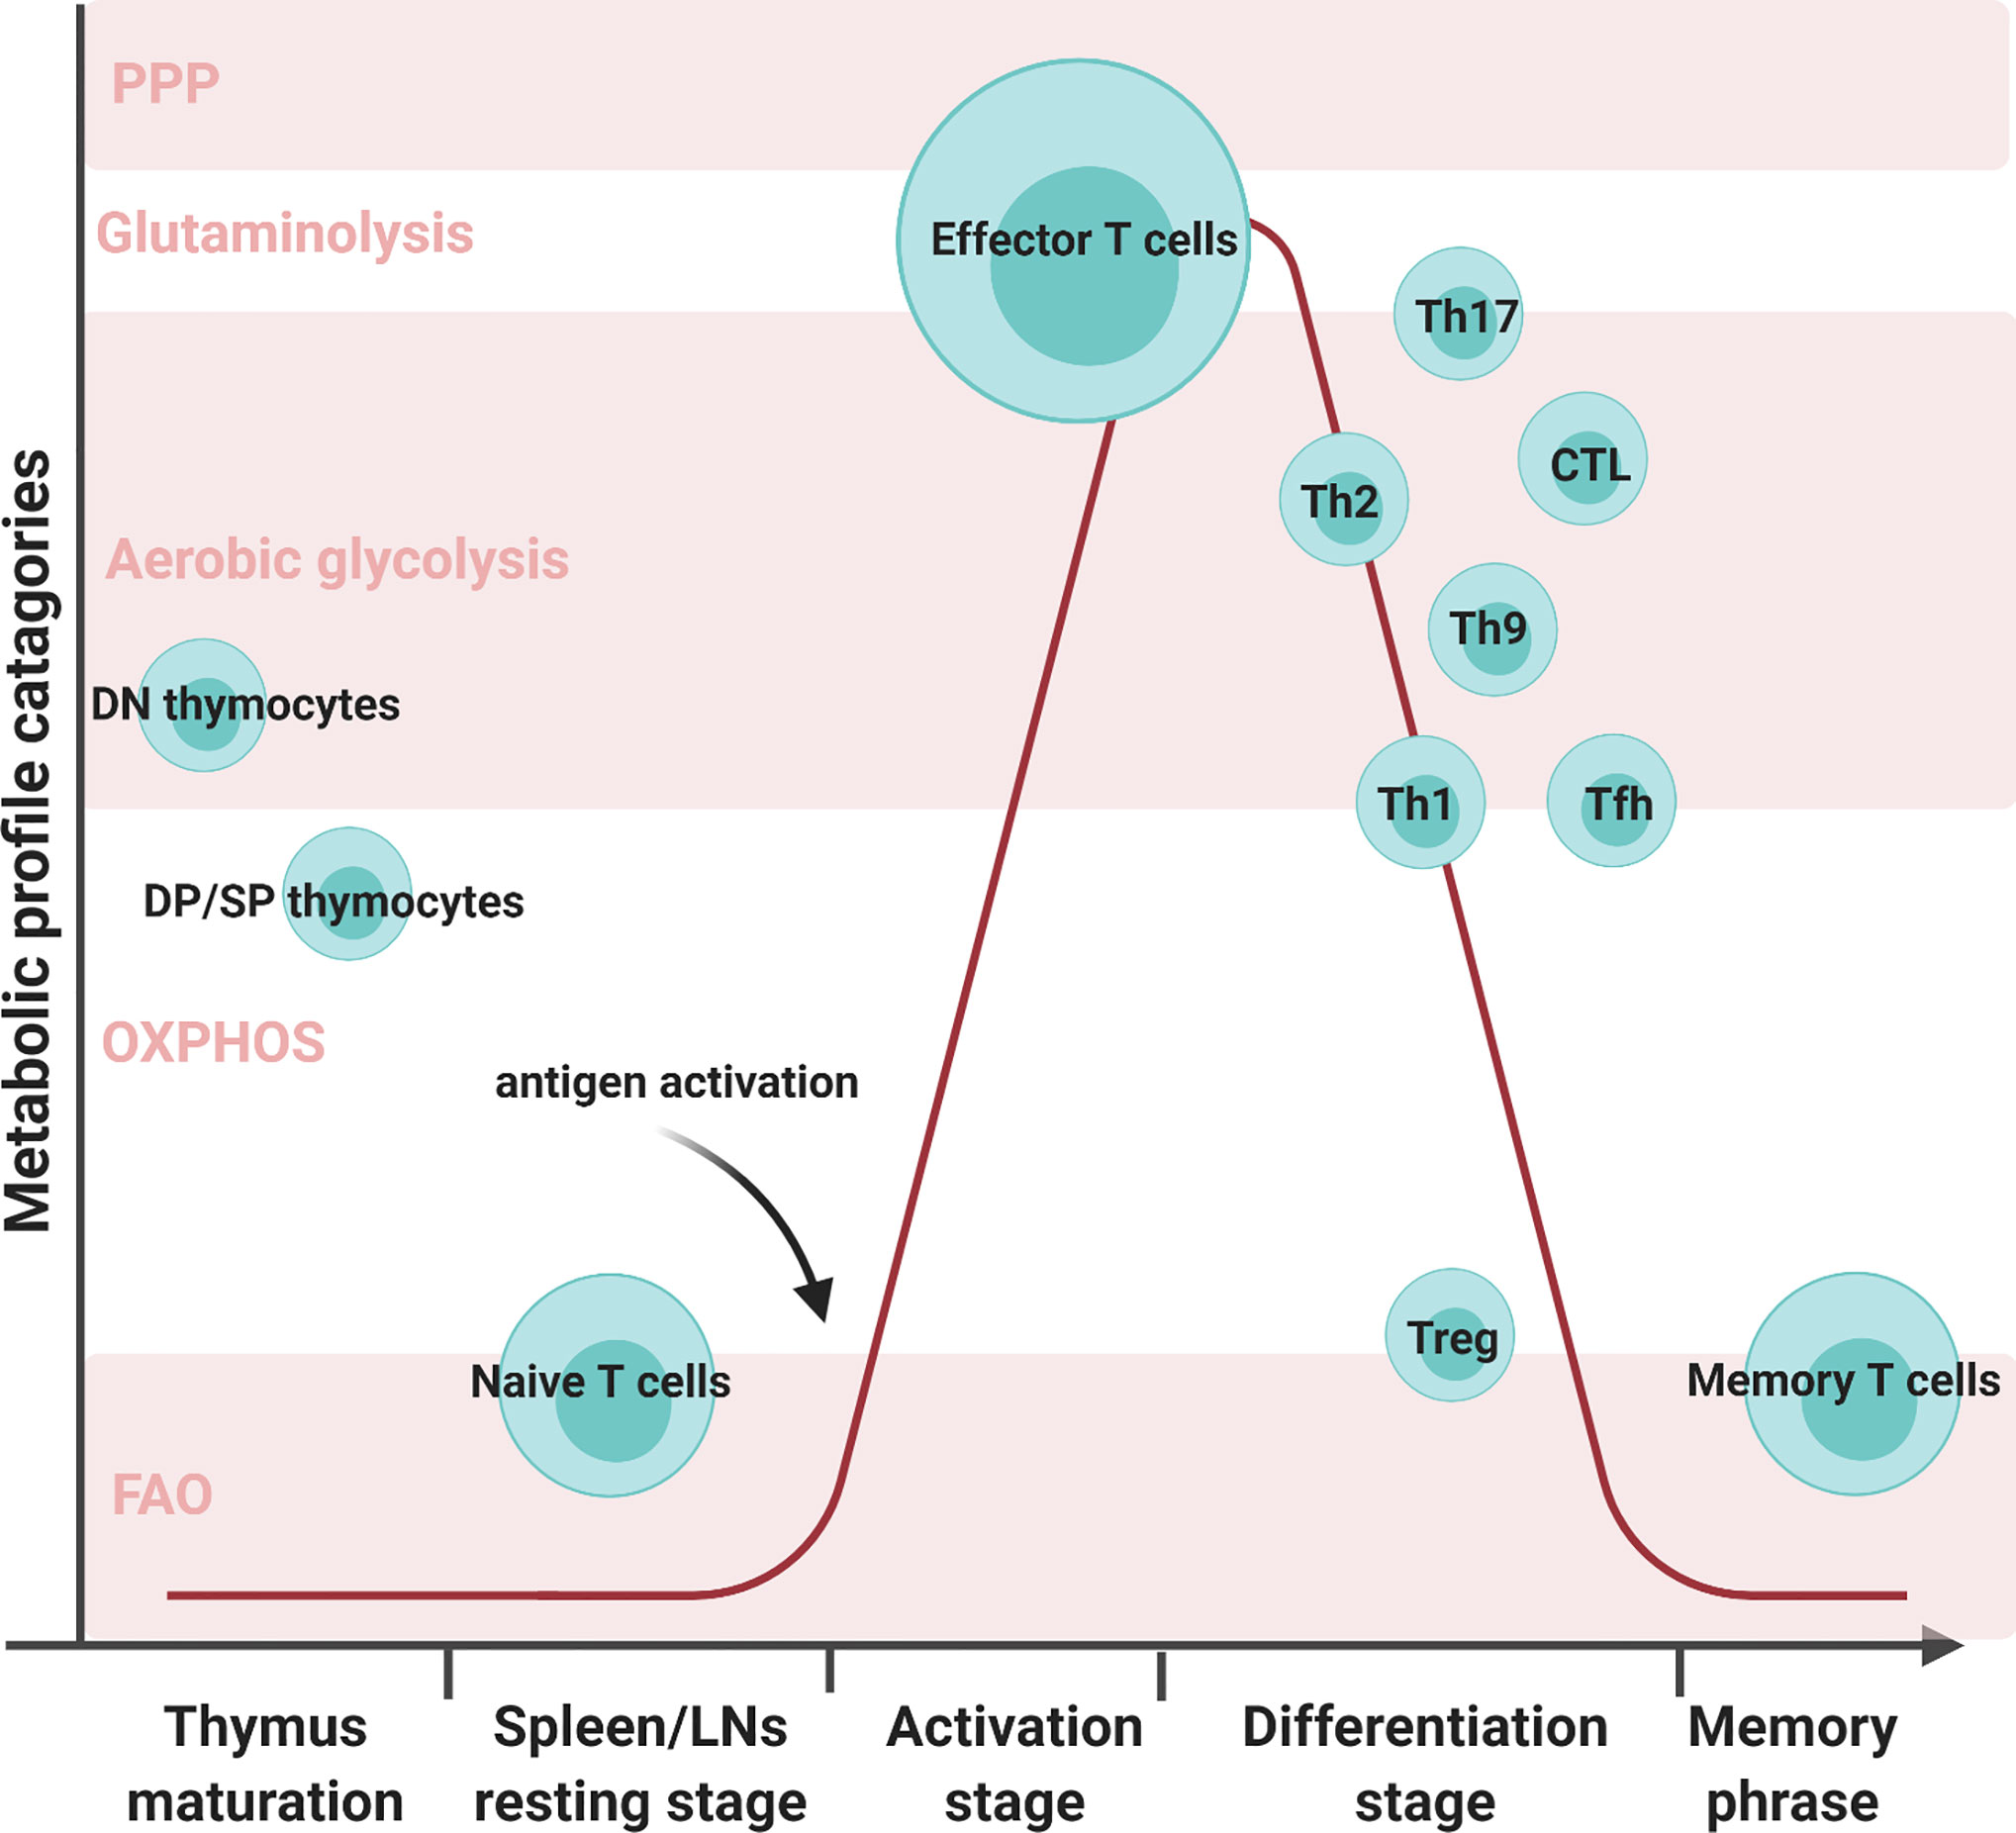
Figure 1 Various T cell subsets development with metabolic reprogramming status. There are five metabolic profile categories: the pentose phosphate pathway, glutaminolysis, aerobic glycolysis, oxidative phosphorylation (OXPHOS), and fatty acid oxidation (FAO). Different T cell subsets alter their metabolic status at different developmental stages. Double negative (DN) cells are the initial stage of thymocytes. These cells will mainly use aerobic glycolysis during proliferation. In later stages of thymocyte development, double-positive (DP) cells and single CD4 or CD8 T cells mature and prepare to migrate through the bloodstream to the secondary organs. During this stage, the matured thymocytes preferentially utilize OXPHOS and FAO to meet their metabolic needs. Naive T cells in spleens and LNs continue in quiescence as thymocytes to minimize energy consumption. Once encountering antigens, T cells activate and proliferate to face foreign assailants. In order to combat foreign pathogens, effector T cells transition their metabolism from OXPHOS to aerobic glycolysis. T cells will progress into the differentiation stage where there are multiple T-cell subsets, such as T helper 1 (Th1), T helper 2 (Th2), T helper 9 (Th9), T helper 17 (Th17), regulatory T (Treg), and T follicular B helper (Tfh) cells. Although all T cell subsets utilize aerobic glycolysis, the varying subsets employ different metabolic processes. Th17 can utilize glutaminolysis and both Th1 and Tfh can conduct OXPHOS in addition to aerobic glycolysis. Memory T cells exhibited both OXPHOS and FAO to maintain their function.
T cells rewire their metabolism by processing oxidative and catalytic activities to meet their demands at various points throughout their lifespan. Concomitantly, Reactive Oxygen Species (ROS), generated as a byproduct of the oxidative metabolism process, is a requisite secondary signaling factor in T cell immunity.
Reactive Oxygen Species (ROS) are a group of highly reactive, unstable radicals and non-free radical compounds containing oxygen. Examples of ROS include superoxide , hydrogen peroxide (H2O2), singlet oxygen, ozone, peroxynitrite (ONOO−), and hydroxyl radical (·OH), with superoxide and hydrogen peroxide being the most common under physiological conditions (28–30). Although superoxide is the original form of ROS, it is highly unstable, and upon forming, reacts with surrounding molecules to form hydrogen peroxide, peroxynitrite, and all other ROS. Under normal conditions, ROS levels are tightly regulated by various endogenous antioxidant enzymes, including superoxide dismutase (SODs), catalases (CAT), glutathione peroxidases, and multiple antioxidant molecules, such as pyruvate, α-ketoglutarate, and glutathione (GSH) (28, 29). Low to moderate ROS levels are essential for cell survival and proliferation (28, 31, 32). When excess ROS overwhelms the antioxidant systems, oxidative stress occurs, leading to harmful effects on cellular organisms, such as inducing DNA mutations (28, 31, 33), altering lipid metabolism (31, 34), and further inducing cell death (5). Although high ROS levels result in harm to the organism, a large body of research finds that ROS acts as one of the essential secondary messengers playing a role in T cell function (35, 36).
Various sources produce ROS in T cells, with the majority of production coming from mitochondria, NADPH oxidases (NOXs), lipid metabolism, and several other enzymes, such as cyclooxygenases and others (5, 28, 35, 37–46). In this section, the two sources that produce ROS in T cells, mitochondria and NOXs, will be discussed (Figure 2).
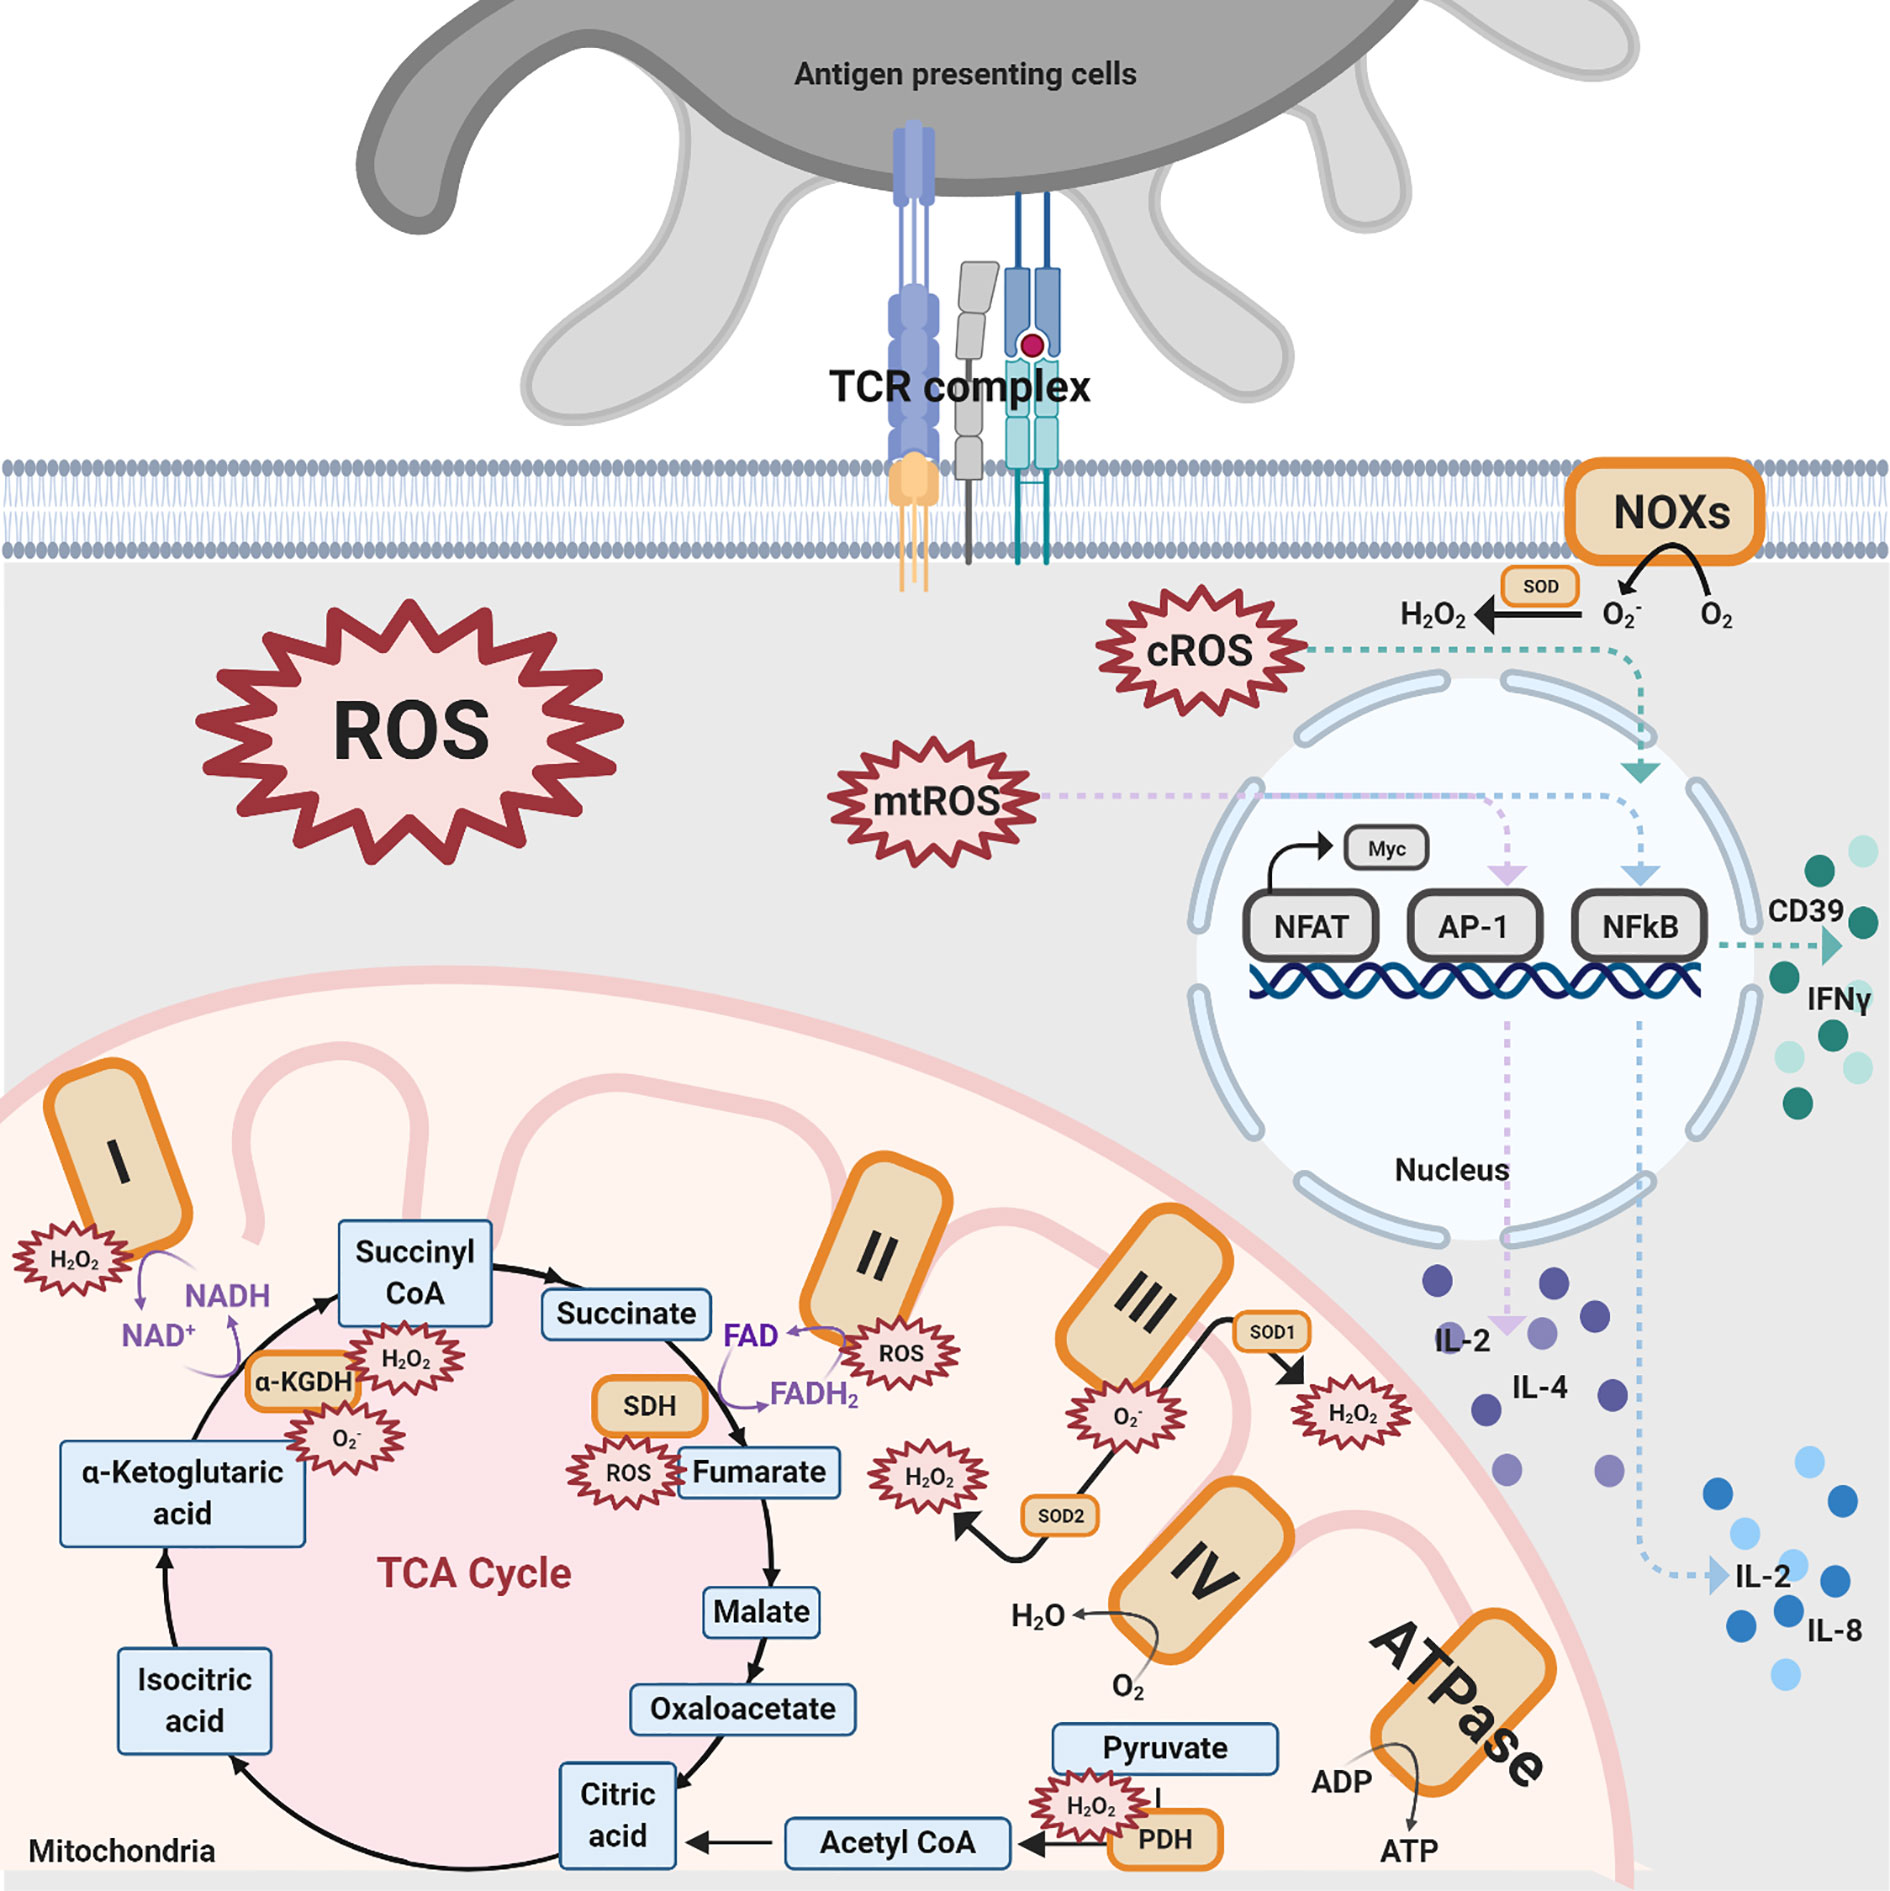
Figure 2 Different sources of ROS impacting T cell activation. There are three ROS generation sources mentioned in this review that impact T cell activation: NOXs, mitochondrial complexes for OXPHOS, and TCA enzymes. NOXs are a group of enzymes responsible for the transfer of electrons from oxygen to cytoplasmic superoxide. In this figure, black solid arrows indicate the production of these pathways while purple solid arrows indicate the electrons transfer reactions for coenzymes within the TCA cycle and mitochondrial complexes. Colored dashed arrows designate the inductions of transcription factors, such as NFAT, AP-1, NFkB, and further upregulate various cytokines. The orange-colored box denotes protein complexes while the compounds that are produced from the TCA cycle are shown in blue. The red spiked border indicates ROS generation.
Oxidative phosphorylation (OXPHOS) is one of the pathways by which ROS are generated in T cells. OXPHOS is a biological process that transports electrons, generates proton gradients, and utilizes oxygen or simple sugars to make adenosine triphosphate (ATP), the primary energy source of the cell. The multiple complexes and coenzymes of the electron transport chain (ETC) are needed to conduct OXPHOS. NADH: ubiquinone oxidoreductase (Mitochondrial complex I) transfers electrons from one of the coenzymes, defined as electron carriers, NADH to ubiquinone, which proceeds to pump the protons into the intermembrane space (47). The other coenzyme, reduced flavin adenine dinucleotide (FADH2), donates electrons through succinate dehydrogenase (Mitochondrial complex II). The electrons are then transported to ubiquinol-cytochrome c oxidoreductase (Mitochondrial complex III) and cytochrome c oxidase (Mitochondrial complex IV), where oxygen is reduced to water. During the process of electron donation, the protons within the matrix are pumped to the mitochondrial intermembrane space through complexes I, III, and IV (47). The proton gradient in the intermembrane space drives ATP synthase to produce ATP. However, OXPHOS is not a perfect mechanism. There is a 0.2–2% leakage of electrons in mitochondrial complexes I–III, primarily complexes I and III, resulting in the creation of superoxide and hydrogen peroxide (31, 47). Specifically, a total of 11 sites have been proven to generate ROS in the ETC, a finding which has been reviewed elsewhere (47, 48).
Superoxide can be generated in complex I through both directions of the reaction, meaning electron transfer from NADH to ubiquinone or reduced ubiquinone to NAD+ (5). When a complex I inhibitor, such as Rotenone, is introduced, the ROS production from the reverse electron transfer (RET) from NADH to ubiquinone is inhibited (40–43). There is supporting evidence highlighting that ROS production from complex II also plays an essential role despite the negligible amount produced by the complex under normal conditions (44, 45). However, the major ROS product generated from complex II is still under debate. The results from Siebels and Drose (46) support that hydrogen peroxide is the major product from complex II-generated ROS while the results from Grivennikova (44) identified superoxide as the major product. Complex III produces the second most amount of ROS where superoxide is converted into stable hydrogen peroxide by two superoxide dismutase (SOD) isoforms SOD1 in the intermembrane space and SOD2 in the matrix (31, 46).
The tricarboxylic acid (TCA) cycle takes place in the matrix of mitochondria and is an essential component of aerobic respiration. The TCA cycle finishes the catabolism of sugar by glycolysis and converts metabolic intermediate acetyl-CoA into multiple reduced coenzymes, providing electrons to OXPHOS as well as providing a pond of essential intermediates for ATP production. Increasing evidence has surfaced supporting the claim that OXPHOS is not the sole pathway within the mitochondria that produce ROS (49–59). In the process of decarboxylation of pyruvate to acetyl-CoA, the pyruvate dehydrogenase (PDH) complex is able to produce high levels of ROS. Inhibition of PDH leads to a decrease in the generation of ROS (54, 55). α-ketoglutarate dehydrogenase complex (α-KGDH), a TCA cycle enzyme, also plays a role in ROS creation (56, 57) with its reduced form generating superoxide and hydrogen peroxide (58, 59). Lastly, succinate-driven RET causes succinate accumulation and further induces ROS generation, with the inverse catalysis of succinate dehydrogenase (SDH) (49–53). In brief summary, three steps in the TCA cycle generate ROS, pyruvate to acetyl-CoA, α-ketoglutarate to succinyl-CoA, and fumarate to succinate.
Besides the mitochondria, NOXs transport electrons and produce cytosolic ROS, which is essential for T cell activities (35). There are seven isoforms of superoxide-generating enzyme NOXs: NOX1-5, DUOX1, and DUOX2 (60, 61). Deficient mouse models targeting GP91phox and NOX inhibitory compounds, shown in Table 1, are used to study T cell NOXs (62, 75, 76). In addition, it has been ascertained that NOX2 (GP91phox) is the main isoform in T cells (60, 74). Deficiency of NOX2 in Treg cells results in an increased number of Treg cells in the heart and vessels as well as and driving to a more anti-inflammatory phenotype, with an increased expression of IL-10 and decreased expression of IL-17 (76).
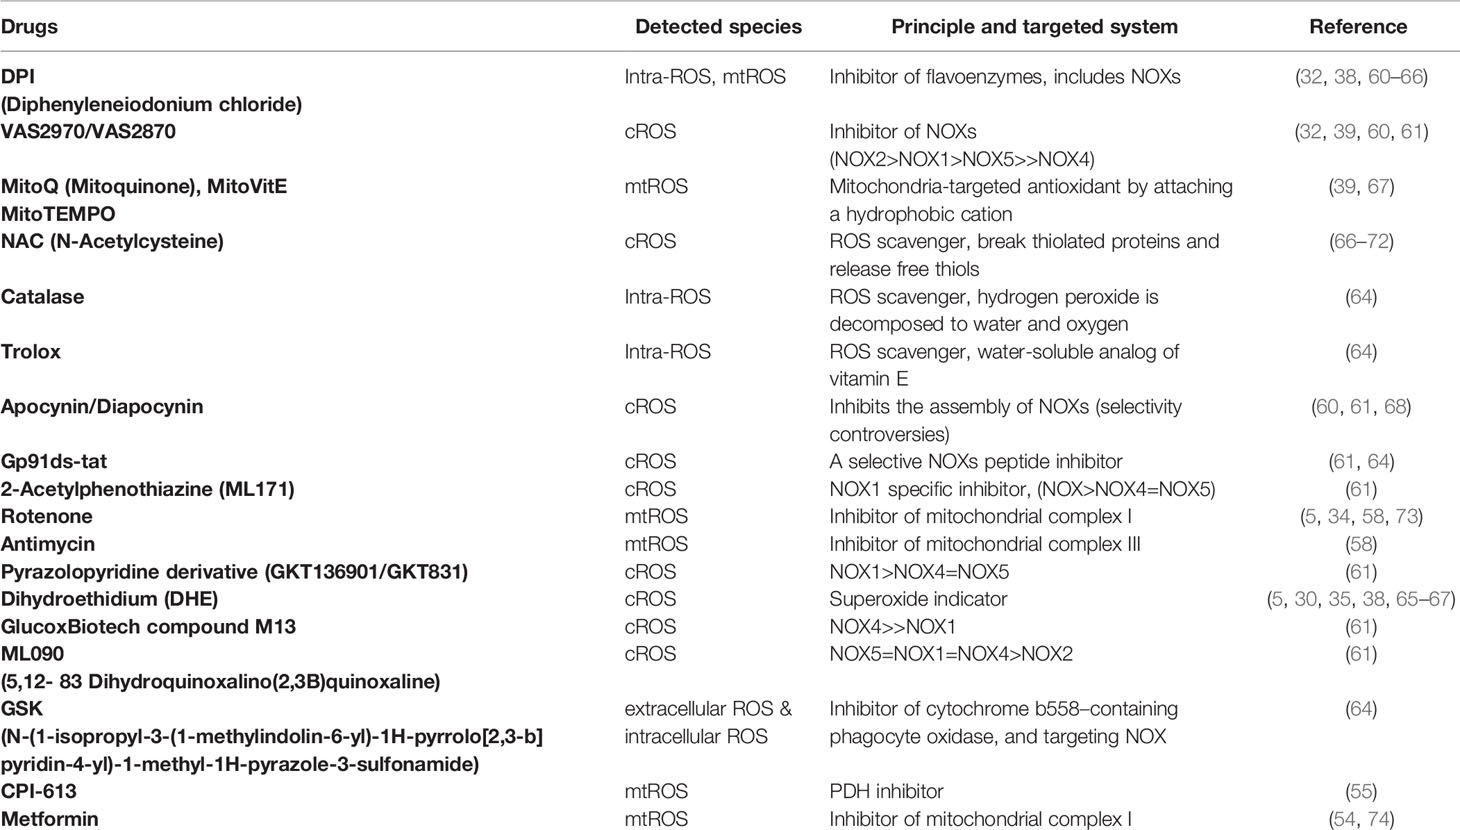
Table 1 Inhibitory compounds targeting mtROS and cytosolic ROS (cROS) in the review.
The thymus allows thymocytes to develop, mature, and expand by providing a distinctive microenvironment. Studying the thymic microenvironment may allow researchers to develop drugs targeting parathymic syndromes and thymus-related diseases, including myasthenia gravis (MG), pure red cell aplasia (PRCA), and hypogammaglobulinemia (77). Little is known as to how ROS might regulate T cell development within the thymus. There are some studies applying extracellular ROS to observe how ROS affects T cell development (60). The production of CD3 T cells in the thymus could be inhibited by hyperbaric oxygen in vivo, a treatment for tumors (60). An increased level of thymocyte survival and enhanced expression of TNF-α and IL-2 are observed with the treatment of Ganoderma atrum polysaccharide (PSG-1) by ameliorating ROS generation in immunosuppressed mice (78). Increasing ROS generation results in an increasing level of double-negative (DN) cells and declining levels of CD4 and CD8 single-positive (SP) cells in the thymus and further induces apoptosis in manganese superoxide dismutase 2 (SOD2) deficient mice (30). These results indicate that a moderate amount of ROS generation potentially influences thymic development.
TCR signaling pathways are affected by ROS, which trigger several proximal and distal signaling pathways in T cells (31, 79). There are studies showing that TCR stimulation induces the generation of an enormous amount of ROS, thus resulting in the activation of transcription factors nuclear factor of activated T cells (NFAT), activator protein-1 (AP-1), and nuclear factor kappa light chain enhancer of activated B cells (NF-kB) (80).
It is well established that mitochondrial ROS (mtROS) are associated with T cell activation. Mitochondrial ROS production enhances NFAT activation, leading to the induction of the transcription factor MYC (31, 79, 81). The generation of mtROS from mitochondrial complex I also induces the NFAT complex, the subunit transcription factor c-Jun in AP-1, and further increases the expression of IL-2 and IL-4 (73, 81). However, a conflicting study demonstrated that high levels of intracellular ROS, triggering the antioxidant glutathione to respond, leads to the inhibition of NFAT activation and the reduction of Myc expression (82). In addition, mtROS production, independent from complex III, has been seen to induce NF-kB and subsequently release IL-2 and IL-8 (31, 80).
NADPH oxidases (NOX) are essential enzyme complexes in the rapid generation of ROS upon T cell activation (9, 32, 38, 83–85). Inhibition of NADPH oxidase by the use of pharmacological compounds, such as diphenyleneiodonium chloride (DPI), apocynin1, and other antioxidants and inhibitors (shown in Table 1) results in a defective production of ROS. It has been revealed that NOX induces rapid generation of ROS, which then activates c-Jun N-terminal kinase (JNK) and NF-kB signaling, prompting an increase of IFN-γ and CD39 expression (32). However, contradictory results have surfaced where upon TCR activation the production of ROS is NADPH oxidase independent (31).
Multiple studies use numerous ROS inhibitors (shown in Table 1) or knockout mice to test the impact of mtROS and cytosolic ROS on T cells. Autoreactive CD4 T cells deficient in NOX-derived superoxide exhibited high levels of Th1 cytokine expression (86). When there is a copious amount of superoxide, Th1 cytokines and proinflammatory chemokines revert to normal levels via a decreasing IL-12Rβ2 expression and P-STAT4 activation (86). In addition, ROS showed an inhibitory effect on the levels of IFN-γ and T-bet expression as well as an enhancing effect on IL-4 expression, via ERK1/2 signaling, for in vitro murine Th1 cells (68, 87). Inhibition of Nox2 using GP91phox (Nox2)-deficient mice prompted an increase in mtROS generation, elevated Th2 differentiation, and enhanced Th2 cytokines: IL-4, IL-5, and IL-13 (68, 88, 89). As for Th9 cells, there is a review that has shown that SIRT1 and HIF1α modulate both Th9 differentiation and ROS generation. However, there is no current definitive link demonstrating how ROS impacts Th9 cells (90).
Th17 cells play a critical role in protecting against extracellular pathogens. Dysregulated Th17 cells and aberrant Th1 cells, either alone or together, are associated with inflammation in autoimmune diseases (87, 91). T cells that will differentiate into Th17 require moderate levels of ROS from either mitochondria or nitro-oxidative pathways (67, 92–95). Resveratrol, a plant phytoalexin, upregulates superoxide dismutase (SOD) within mitochondria, which modulates oxidative stress and leads to Th17 differentiation (92). A study conducted by Zhi has shown that MitoQ inhibits immediate early response geneX-1 (IEX-1) knockout T cells from differentiating to Th17 cells, but wild-type (WT) T cells show no effect when exposed to MitoQ (92). This study used a broader antioxidant, N-Acetylcysteine (NAC), and found that a non-specific antioxidant blocks both WT and IEX-1 KO T cells from differentiating into Th17 cells (92). It is suggested that mtROS is required for Th17 cell generation, especially for IEX-1 knockout T cells. The importance of mtROS has been illustrated in a recent paper showing that Th17 cell generation decreases when mtROS is inhibited by MitoQ (67). High glucose levels induce the formulation of mtROS, specifically mitochondrial superoxide production, in T cells, leading to TGF-β activation and Th17 cell differentiation (67). However, there are some dissenting opinions on how ROS impacts Th17 cell differentiation (87, 91). Treatment with ROS scavenger NAC, leading to a reduced level of ROS, augment differentiation of T cell to Th17 cells (91). Another study conducted by Abimannan has found that when treating the cells with pro-oxidant, PB (5-hydroxy-2-methyl-1, 4-naphthoquinone) and H2O2, the frequency of Th17 cells had been reduced in a dose-dependent manner (87). These two studies have demonstrated that the accumulation of ROS limits Th17 differentiation. Further investigation on ROS-regulated Th17 cell differentiation and ROS-mediated inflammatory response may improve the development of treatments for inflammatory and autoimmune diseases.
Treg cells play a critical role in cancer immunology, and an imbalance of Treg cells and Th17 cells leads to autoimmune disorders. ROS generation results in Treg cell-mediated immunosuppression and limits anti-tumor T cell response in the tumor microenvironment (69). Reduced ROS generation impairs Treg function and differentiation, and it is suggested that ROS is required for the suppressive function of Treg cells (69, 96). In an exogenous H2O2 environment, Treg cells are more resistant to oxidative-induced death compared to Teff cells and memory T cells (97). ROS generation is found to be greater in Treg cells in comparison to Teff cells (96). Excessive ROS levels have been observed in aged Treg cells from >18-month-year-old mice, whereas young Treg cells exhibit controlled ROS generation, normal proliferation, and controlled inflammation (96). Limitation of ROS generation by ROS scavenger NAC has been shown to promote proliferation and survival in aged Treg cells (96). Henceforth, the phenotypic connection between ROS generation and Treg cell differentiation is found. Future research may help us to unveil how the ROS-mediated mechanism underlying Treg cells’ differentiation and function.
Adequate levels of intracellular ROS, including NOX-derived ROS and mtROS, emerge to regulate activation-induced T cell death (AICD) by affecting the Fas ligand (FasL) and ERK-mediated pathways (Figure 3) (35, 63–65, 70, 74, 98).
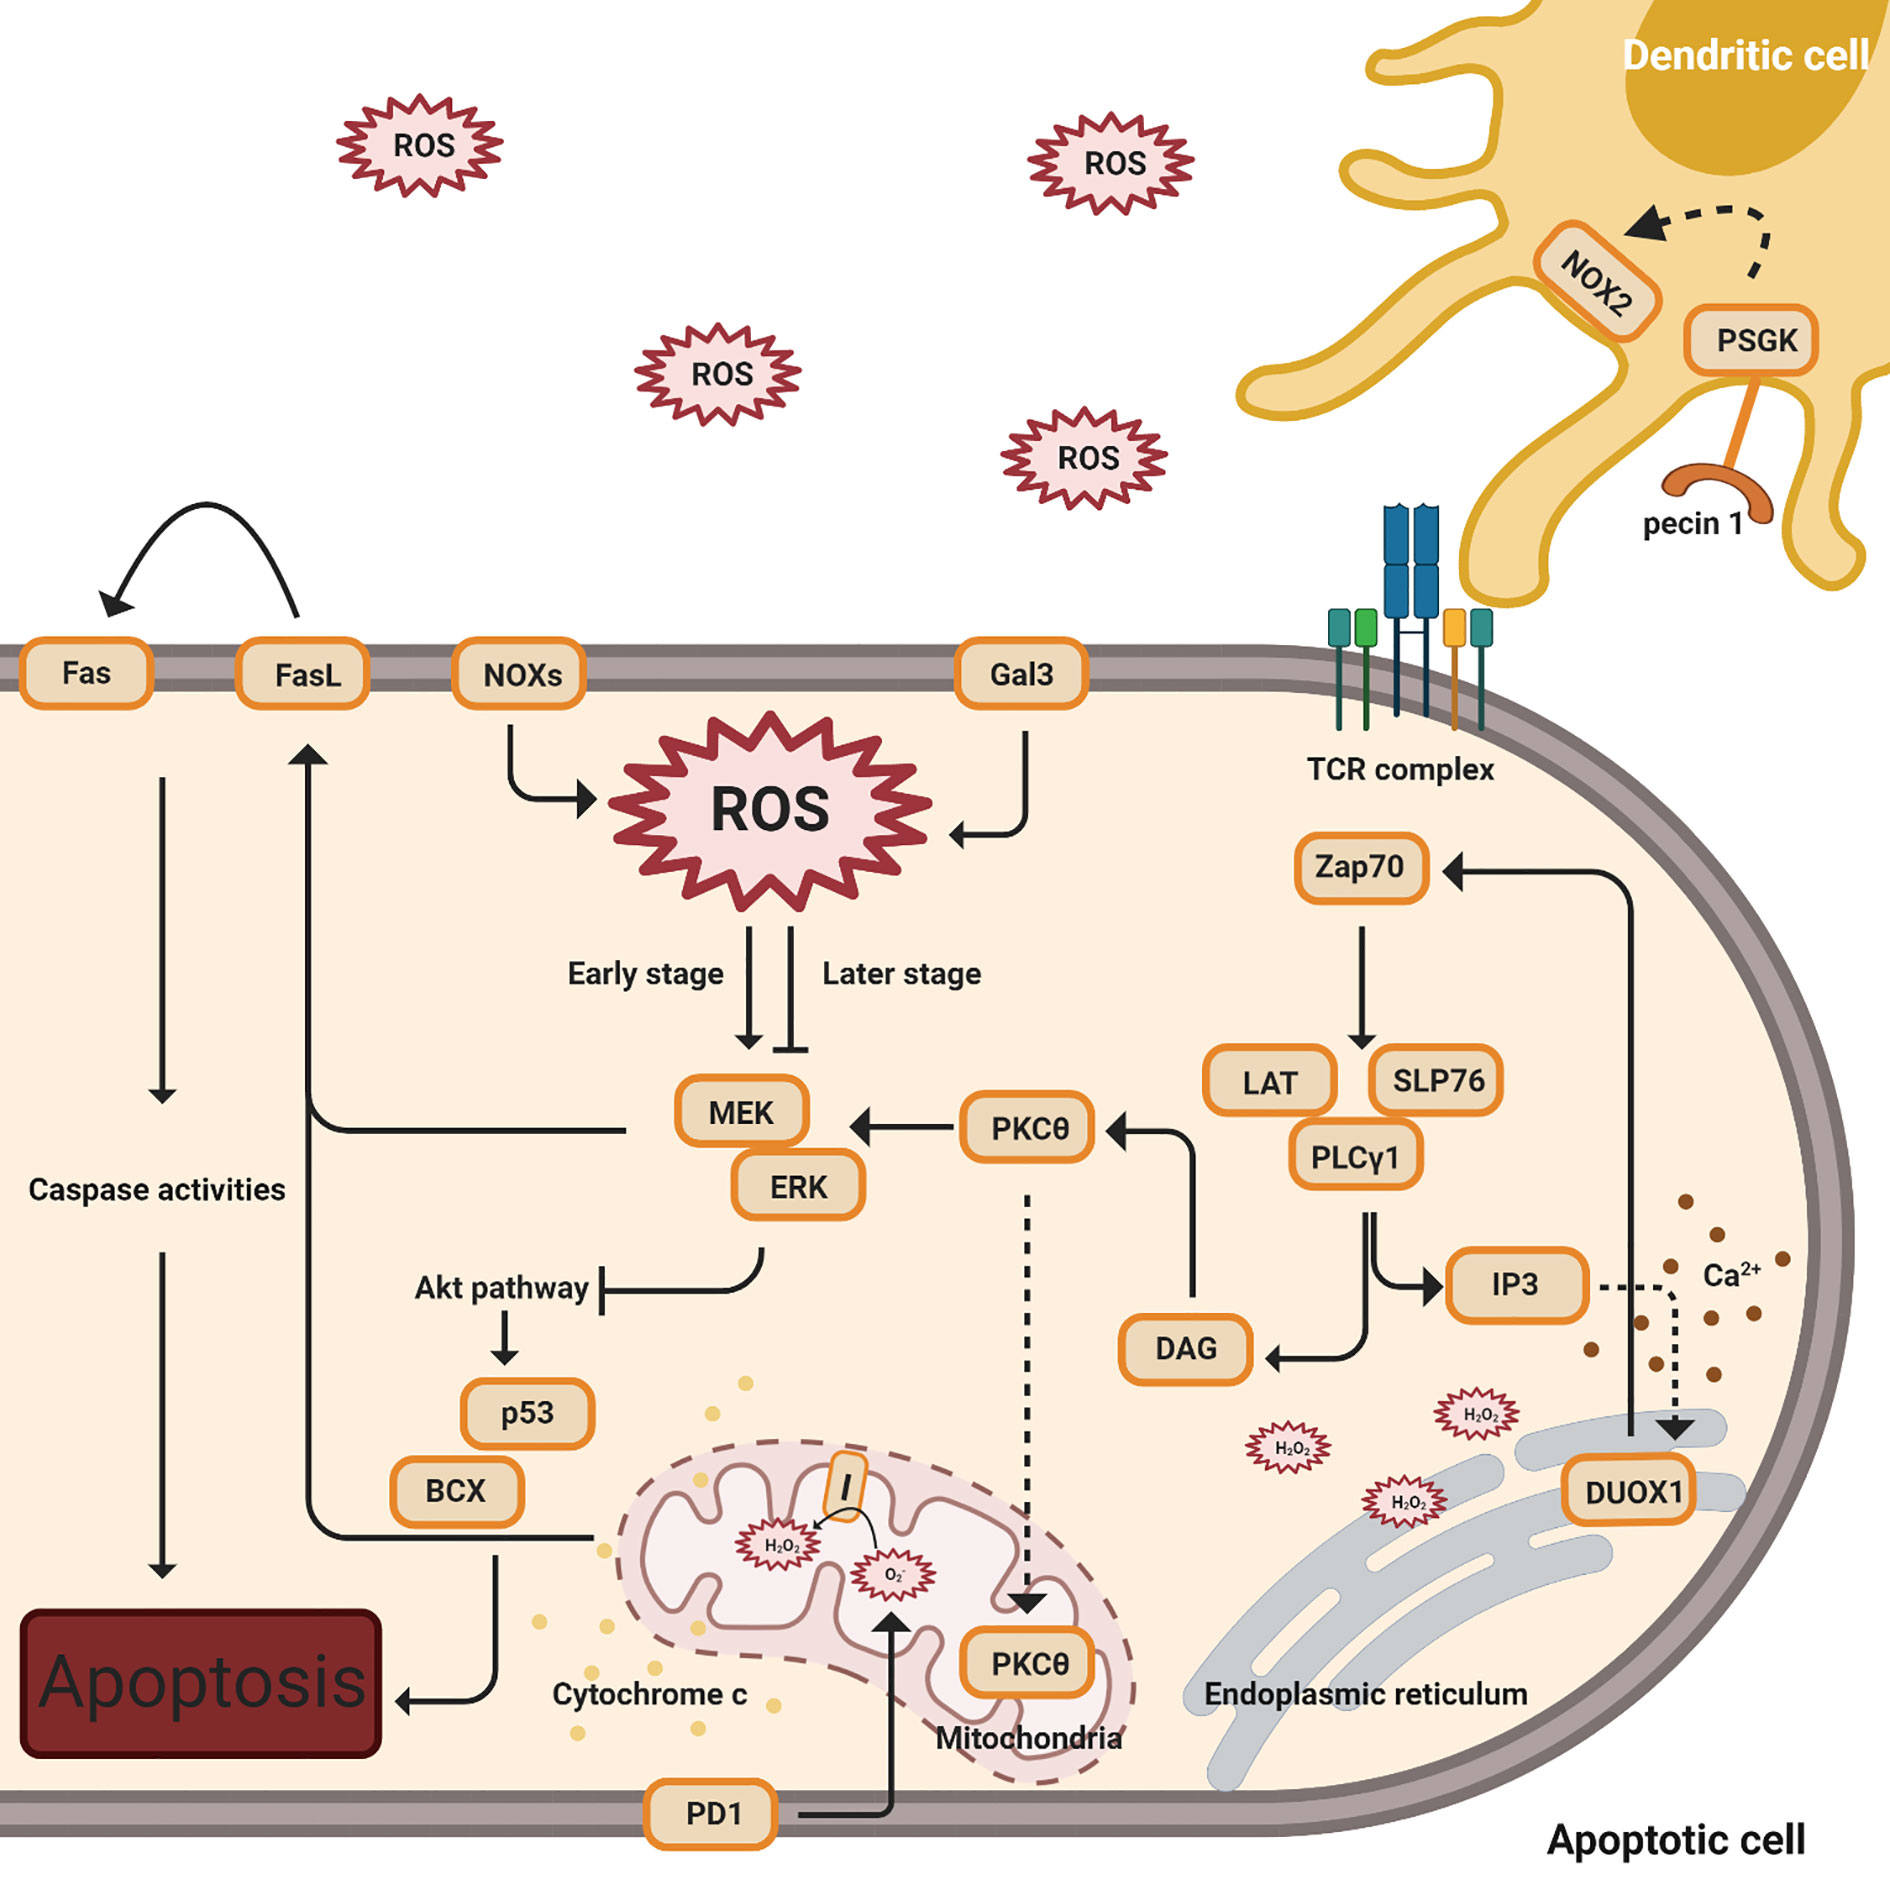
Figure 3 ROS regulation of activation-induced T cell death (AICD). This figure indicates multiple signal pathways involved in T cell death, including PD1 (below), Gal3, NOX2, and FasL-mediated (above) pathways. The orange color denotes protein complexes. Black solid arrows indicate the products and interactions of these pathways. The early stages denote TCR activation while the later stages indicate apoptosis. The dashed arrow affiliated with the PKCθ protein indicates translocation from the cytosol to the mitochondria. Cytochrome c release from the mitochondria to the cytosol is shown by yellow dots. The dashed line associated with IP3 designates the induction of calcium release (shown in brown dots) and the complexes’ impact on DUOX1 in the endoplasmic reticulum.
Following TCR stimulation, zeta chain-associated protein kinase 70 (ZAP70) is activated and phosphorylated (74, 99). ZAP70 phosphorylates the adaptor, linker of activated T cells (LAT) with the coupled recruitment of phospholipase Cγ1 (PLCγ1) and further generation of inositol 3,4,5-triphosphate (IP3) and diacylglycerol (DAG) (74, 99). IP3 binds to its receptor, IP3R1, resulting in a low concentration of calcium releasing into the ER, and this action induces Duox1, an isoform of NOX, to produce intracellular hydrogen peroxide (35). Intracellular H2O2, from NOX2 and NOX4, creates a positive feedback loop to enhance TCR signaling during T cell activation. While in later stages, as the cells undergo apoptosis, ginseng pectins selectively inhibit ERK activation, a part of the galectin-3 (Gal3) triggered pathways (35, 63, 65, 66, 70). An interesting study by Zhao has shown that walnut polyphenol extract (WPE) reduces ROS generation, decreasing the expressions of apoptosis-associated proteins Bax and p53 (98).
Separately, protein kinase cθ (PKCθ) is activated by DAG and translocates into the mitochondria, impacting the production of hydrogen peroxide from mitochondrial complex I (74). These proximal signaling eventually results in the induction of FasL (CD95) expression, a crucial signal for the induction of activation-induced cell death (AICD) (74). In addition, AICD, followed by the activation of FasL, is dependent on superoxide but not hydrogen peroxide (65).
Programmed death-1(PD-1) has an impact on ROS, independent of NOX, with a concomitant in the T cell apoptosis pathway (71). ROS levels have no impact in PD-1 low cells, while lower levels of ROS have been observed in PD-1 high cells when neither PD-1 nor PDL1 expression is blocked (71). In this study by Tkachev, they also investigated which ROS sources are affected by PD1 and demonstrated that PD1 regulates two sources of ROS, mitochondrial H2O2 and ROS upon FAO (71).
Excess effector T cells that have undergone apoptosis require removal by macrophages after a period of infection in order to conserve energy (64). The clearance of overreacted and apoptotic T cells is essential to purge in order to prevent autoimmune diseases. ROS generation is detected when dectin-1 on dendritic cells binds to the annexins on apoptotic cells (64).
Metabolic reprogramming of T cells is intertwined with T cell survival and proliferation. Although there have been numerous studies in the field, it is still unclear why different T cells’ subsets modulate distinct metabolic pathways: pentose phosphate pathway, glutaminolysis, aerobic glycolysis, OXPHOS, and FAO. Understanding T cell metabolic reprogramming is critical for future drug and clinical developments concerning immunological disease. It has been acknowledged for decades that ROS is generated as a byproduct during oxidative metabolism. While recent discoveries have demonstrated that low and moderate levels of ROS generated from mitochondria and NOXs are imperative in signaling T cell immunity, excess amounts of ROS result in mutation and cell damage. ROS production from oxidative phosphorylation had been studied decades prior, but there is emerging evidence that has shown multiple steps in the TCA cycle could also generate oxidative species. Both NOX-derived ROS and mtROS exhibit essential roles in the regulation of thymic development, T cell activation, T cell differentiation, and activation-induced T cell death. Such knowledge may help to reveal the impact of intracellular ROS on T cell immune response. Targeting the redox state in various T cell subsets by altering ROS could be a potential way to improve novel therapeutic strategies for treating immunological disorders. Further investigations are expected to elucidate the molecular mechanism of how ROS impacts T cell fate, metabolism, and function, with the inevitable goal being the illustration of possible novel therapies with the application of ROS scavengers in treating ROS-related diseases.
H-YP and JS contributed to the writing of the manuscript. JL, DB, JD, AK, LW, YR, and XX provided the editing of the manuscript. All authors contributed to the article and approved the submitted version.
This work was supported by the National Institute of Health Grant R01AI121180, R21AI128325, and R01CA221867 to JS.
The authors declare that the research was conducted in the absence of any commercial or financial relationships that could be construed as a potential conflict of interest.
1. Merkenschlager M, Graf D, Lovatt M, Bommhardt U, Zamoyska R, Fisher AG, et al. How many thymocytes audition for selection? J Exp Med (1997) 186(7):1149–58. doi: 10.1084/jem.186.7.1149
2. Brand K. Glutamine and glucose metabolism during thymocyte proliferation. Pathways of glutamine and glutamate metabolism. Biochem J (1985) 228(2):353–61. doi: 10.1042/bj2280353
3. Carbo R, Guarner V. Insulin effect on glucose transport in thymocytes and splenocytes from rats with metabolic syndrome. Diabetol Metab Syndr (2010) 2:64. doi: 10.1186/1758-5996-2-64
4. Swainson L, Kinet S, Manel N, Battini J-L, Sitbon M, Taylor N. Glucose transporter 1 expression identifies a population of cycling CD4+ CD8+ human thymocytes with high CXCR4-induced chemotaxis. Proc Natl Acad Sci USA (2005) 102(36):12867–72. doi: 10.1073/pnas.0503603102
5. Hernansanz-Agustin P, et al. Mitochondrial complex I deactivation is related to superoxide production in acute hypoxia. Redox Biol (2017) 12:1040–51. doi: 10.1016/j.redox.2017.04.025
6. Jones N, et al. Akt and STAT5 mediate naive human CD4+ T-cell early metabolic response to TCR stimulation. Nat Commun (2019) 10(1):2042. doi: 10.1038/s41467-019-10023-4
7. van der Windt GJ, et al. Mitochondrial respiratory capacity is a critical regulator of CD8+ T cell memory development. Immunity (2012) 36(1):68–78. doi: 10.1016/j.immuni.2011.12.007
8. Nicoli F, Papagno L, Frere JJ, Cabral-Piccin MP, Clave E, Gostick E, et al. Naive CD8(+) T-Cells Engage a Versatile Metabolic Program Upon Activation in Humans and Differ Energetically From Memory CD8(+) T-Cells. Front Immunol (2018) 9:2736. doi: 10.3389/fimmu.2018.02736
9. Padgett LE, Tse HM. NADPH Oxidase-Derived Superoxide Provides a Third Signal for CD4 T Cell Effector Responses. J Immunol (2016) 197(5):1733–42. doi: 10.4049/jimmunol.1502581
10. Chang CH, Curtis JD, Maggi LB Jr., Faubert B, Villarino AV, O'Sullivan D, et al. Posttranscriptional control of T cell effector function by aerobic glycolysis. Cell (2013) 153(6):1239–51. doi: 10.1016/j.cell.2013.05.016
11. Pearce EL, Walsh MC, Cejas PJ, Harms GM, Shen H, Wang L-S, Jones RG, et al. Enhancing CD8 T-cell memory by modulating fatty acid metabolism. Nature (2009) 460(7251):103–7. doi: 10.1038/nature08097
12. Gerriets VA, Rathmell JC. Metabolic pathways in T cell fate and function. Trends Immunol (2012) 33(4):168–73. doi: 10.1016/j.it.2012.01.010
13. Peng M, Yin N, Chhangawala S, Xu K, Leslie CS, et al. Aerobic glycolysis promotes T helper 1 cell differentiation through an epigenetic mechanism. Science (2016) 354(6311):481–4. doi: 10.1126/science.aaf6284
14. Michalek RD, et al. Cutting edge: distinct glycolytic and lipid oxidative metabolic programs are essential for effector and regulatory CD4+ T cell subsets. J Immunol (2011) 186(6):3299–303. doi: 10.4049/jimmunol.1003613
15. Bhat P, et al. Interferon-gamma derived from cytotoxic lymphocytes directly enhances their motility and cytotoxicity. Cell Death Dis (2017) 8(6):e2836. doi: 10.1038/cddis.2017.67
16. Geginat J, et al. Plasticity of human CD4 T cell subsets. Front Immunol (2014) 5:630. doi: 10.3389/fimmu.2014.00630
17. Kolev M, et al. Complement Regulates Nutrient Influx and Metabolic Reprogramming during Th1 Cell Responses. Immunity (2015) 42(6):1033–47. doi: 10.1016/j.immuni.2015.05.024
18. Ray JP, Staron MM, Shyer JA, Ho P-C, Marshall H-D, Gray SM, et al. The Interleukin-2-mTORc1 Kinase Axis Defines the Signaling, Differentiation, and Metabolism of T Helper 1 and Follicular B Helper T Cells. Immunity (2015) 43(4):690–702. doi: 10.1016/j.immuni.2015.08.017
19. Rashida Gnanaprakasam JN, Wu R, Wang R. Metabolic Reprogramming in Modulating T Cell Reactive Oxygen Species Generation and Antioxidant Capacity. Front Immunol (2018) 9:1075. doi: 10.3389/fimmu.2018.01075
20. Stark JM, Tibbitt CA, Coquet JM. The Metabolic Requirements of Th2 Cell Differentiation. Front Immunol (2019) 10:2318. doi: 10.3389/fimmu.2019.02318
21. Yang JQ, Kalim KW, Li Y, Zhang S, Hinge A, Filippi M-D, et al. RhoA orchestrates glycolysis for TH2 cell differentiation and allergic airway inflammation. J Allergy Clin Immunol (2016) 137(1):231–45.e4. doi: 10.1016/j.jaci.2015.05.004
22. Wang Y, Bi Y, Chen X, Li C, Li Y, Zhan Z, et al. Histone Deacetylase SIRT1 Negatively Regulates the Differentiation of Interleukin-9-Producing CD4(+) T Cells. Immunity (2016) 44(6):1337–49. doi: 10.1016/j.immuni.2016.05.009
23. Kono M, Maeda K, Stocton-Gavanescu I, Pan W, Umeda M, Katsuyama E, Burbano C, et al. Pyruvate kinase M2 is requisite for Th1 and Th17 differentiation. JCI Insight (2019) 4(12). doi: 10.1172/jci.insight.127395
24. Shi LZ, Wang R, Huang G, Vogel P, Neale G, Green DR, et al. HIF1alpha-dependent glycolytic pathway orchestrates a metabolic checkpoint for the differentiation of TH17 and Treg cells. J Exp Med (2011) 208(7):1367–76. doi: 10.1084/jem.20110278
25. Berod L, Friedrich C, Nandan A, Freitag J, Hagemann S, Harmrolfs K, et al. De novo fatty acid synthesis controls the fate between regulatory T and T helper 17 cells. Nat Med (2014) 20(11):1327–33. doi: 10.1038/nm.3704
26. Crotty S. Follicular helper CD4 T cells (TFH). Annu Rev Immunol (2011) 29:621–63. doi: 10.1146/annurev-immunol-031210-101400
27. Buck MD, O'Sullivan D, Klein Geltink RI, Curtis JD, Chang C-H, Sanin DE, et al. Mitochondrial Dynamics Controls T Cell Fate through Metabolic Programming. Cell (2016) 166(1):63–76. doi: 10.1016/j.cell.2016.05.035
28. Franchina DG, Dostert C, Brenner D. Reactive Oxygen Species: Involvement in T Cell Signaling and Metabolism. Trends Immunol (2018) 39(6):489–502. doi: 10.1016/j.it.2018.01.005
29. Nathan C, Cunningham-Bussel A. Beyond oxidative stress: an immunologist’s guide to reactive oxygen species. Nat Rev Immunol (2013) 13(5):349–61. doi: 10.1038/nri3423
30. Case AJ, McGill JL, Tygrett LT, Shirasawa T, Spitz DR, Waldschmidt TJ, Legge KL, et al. Elevated mitochondrial superoxide disrupts normal T cell development, impairing adaptive immune responses to an influenza challenge. Free Radic Biol Med (2011) 50(3):448–58. doi: 10.1016/j.freeradbiomed.2010.11.025
31. Sena LA, et al. Mitochondria are required for antigen-specific T cell activation through reactive oxygen species signaling. Immunity (2013) 38(2):225–36. doi: 10.1016/j.immuni.2012.10.020
32. Bai A, Moss A, Rothweiler S, Longhi MS, Wu Y, Junger WG, et al. NADH oxidase-dependent CD39 expression by CD8(+) T cells modulates interferon gamma responses via generation of adenosine. Nat Commun (2015) 6:8819. doi: 10.1038/ncomms9819
33. Gorrini C, Harris IS, Mak TW. Modulation of oxidative stress as an anticancer strategy. Nat Rev Drug Discovery (2013) 12(12):931–47. doi: 10.1038/nrd4002
34. Liu L, MacKenzie KR, Putluri N, Maletić-Savatić M, Bellen HJ. The Glia-Neuron Lactate Shuttle and Elevated ROS Promote Lipid Synthesis in Neurons and Lipid Droplet Accumulation in Glia via APOE/D. Cell Metab (2017) 26(5):719–737 e6. doi: 10.1016/j.cmet.2017.08.024
35. Kwon J, Shatynski KE, Chen H, Morand S, de Deken X, Miot F, et al. The nonphagocytic NADPH oxidase Duox1 mediates a positive feedback loop during T cell receptor signaling. Sci Signal (2010) 3(133):ra59. doi: 10.1126/scisignal.2000976
36. Murphy MP, Siegel RM. Mitochondrial ROS fire up T cell activation. Immunity (2013) 38(2):201–2. doi: 10.1016/j.immuni.2013.02.005
37. Hultqvist M, Olsson LM, Gelderman KA, Holmdahl R. The protective role of ROS in autoimmune disease. Trends Immunol (2009) 30(5):201–8. doi: 10.1016/j.it.2009.03.004
38. Jackson SH, et al. T cells express a phagocyte-type NADPH oxidase that is activated after T cell receptor stimulation. Nat Immunol (2004) 5(8):818–27. doi: 10.1038/ni1096
39. Li X, Fang P, Mai J, Choi ET, Wang H, Yang X-f. Targeting mitochondrial reactive oxygen species as novel therapy for inflammatory diseases and cancers. J Hematol Oncol (2013) 6:19. doi: 10.1186/1756-8722-6-19
40. Lambert AJ, Brand MD. Superoxide production by NADH:ubiquinone oxidoreductase (complex I) depends on the pH gradient across the mitochondrial inner membrane. Biochem J (2004) 382(Pt 2):511–7. doi: 10.1042/BJ20040485
41. Chance B, Hollunger G. The interaction of energy and electron transfer reactions in mitochondria. I. General properties and nature of the products of succinate-linked reduction of pyridine nucleotide. J Biol Chem (1961) 236:1534–43. doi: 10.1016/S0021-9258(18)64210-3
42. Hirst J, King MS, Pryde KR. The production of reactive oxygen species by complex I. Biochem Soc Trans (2008) 36(Pt 5):976–80. doi: 10.1042/BST0360976
43. Onukwufor JO, Berry BJ, Wojtovich AP. Physiologic Implications of Reactive Oxygen Species Production by Mitochondrial Complex I Reverse Electron Transport. Antioxid (Basel) (2019) 8(8):285. doi: 10.3390/antiox8080285
44. Grivennikova VG, Kozlovsky VS, Vinogradov AD. Respiratory complex II: ROS production and the kinetics of ubiquinone reduction. Biochim Biophys Acta Bioenerg (2017) 1858(2):109–17. doi: 10.1016/j.bbabio.2016.10.008
45. Hadrava Vanova K, Kraus M, Neuzil J, Rohlena J. Mitochondrial complex II and reactive oxygen species in disease and therapy. Redox Rep (2020) 25(1):26–32. doi: 10.1080/13510002.2020.1752002
46. Slot JW, et al. Intracellular localization of the copper-zinc and manganese superoxide dismutases in rat liver parenchymal cells. Lab Invest (1986) 55(3):363–71.
47. Zhao RZ, Jiang S, Zhang L, Yu Z-B. Mitochondrial electron transport chain, ROS generation and uncoupling (Review). Int J Mol Med (2019) 44(1):3–15. doi: 10.3892/ijmm.2019.4188
48. Brand MD. Mitochondrial generation of superoxide and hydrogen peroxide as the source of mitochondrial redox signaling. Free Radic Biol Med (2016) 100:14–31. doi: 10.1016/j.freeradbiomed.2016.04.001
49. Martinez-Reyes I, Chandel NS. Mitochondrial TCA cycle metabolites control physiology and disease. Nat Commun (2020) 11(1):102. doi: 10.1038/s41467-019-13668-3
50. Kamarajugadda S, Stemboroski L, Cai Q, Simpson NE, Nayak S, Tan M, et al. Glucose oxidation modulates anoikis and tumor metastasis. Mol Cell Biol (2012) 32(10):1893–907. doi: 10.1128/MCB.06248-11
51. Lu J, Tan M, Cai Q. The Warburg effect in tumor progression: mitochondrial oxidative metabolism as an anti-metastasis mechanism. Cancer Lett (2015) 356(2 Pt A):156–64. doi: 10.1016/j.canlet.2014.04.001
52. Zhang Y, Zhang M, Zhu W, Yu J, Wang Q, Zhang J, et al. Succinate accumulation induces mitochondrial reactive oxygen species generation and promotes status epilepticus in the kainic acid rat model. Redox Biol (2020) 28:101365. doi: 10.1016/j.redox.2019.101365
53. Scagliola A, . Mainini F, Cardaci S. The Tricarboxylic Acid Cycle at the Crossroad Between Cancer and Immunity. Antioxid Redox Signal (2020) 32(12):834–52. doi: 10.1089/ars.2019.7974
54. Woolbright BL, Rajendran G, Harris RA, Taylor JA III. Metabolic Flexibility in Cancer: Targeting the Pyruvate Dehydrogenase Kinase:Pyruvate Dehydrogenase Axis. Mol Cancer Ther (2019) 18(10):1673–81. doi: 10.1158/1535-7163.MCT-19-0079
55. O’Brien M, et al. Protein S-glutathionylation alters superoxide/hydrogen peroxide emission from pyruvate dehydrogenase complex. Free Radic Biol Med (2017) 106:302–14. doi: 10.1016/j.freeradbiomed.2017.02.046
56. Chen H, Denton TT, Xu H, Calingasan N, Flint Beal M, Gibson GE. Reductions in the mitochondrial enzyme alpha-ketoglutarate dehydrogenase complex in neurodegenerative disease - beneficial or detrimental? J Neurochem (2016) 139(5):823–38. doi: 10.1111/jnc.13836
57. Fernandez E, Bolanos JP. alpha-Ketoglutarate dehydrogenase complex moonlighting: ROS signalling added to the list: An Editorial highlight for ‘Reductions in the mitochondrial enzyme alpha-ketoglutarate dehydrogenase complex in neurodegenerative disease - beneficial or detrimental?’. J Neurochem (2016) 139(5):689–90. doi: 10.1111/jnc.13862
58. Starkov AA, Fiskum G, Chinopoulos C, Lorenzo BJ, Browne SE, Patel MS, et al. Mitochondrial alpha-ketoglutarate dehydrogenase complex generates reactive oxygen species. J Neurosci (2004) 24(36):7779–88. doi: 10.1523/JNEUROSCI.1899-04.2004
59. Tretter L, Adam-Vizi V. Generation of reactive oxygen species in the reaction catalyzed by alpha-ketoglutarate dehydrogenase. J Neurosci (2004) 24(36):7771–8. doi: 10.1523/JNEUROSCI.1842-04.2004
60. Augsburger F, Filippova A, Rasti D, Seredenina T, Lam M, Maghzal G, et al. Pharmacological characterization of the seven human NOX isoforms and their inhibitors. Redox Biol (2019) 26:101272. doi: 10.1016/j.redox.2019.101272
61. Kim M, Han CH, Lee MY. NADPH oxidase and the cardiovascular toxicity associated with smoking. Toxicol Res (2014) 30(3):149–57. doi: 10.5487/TR.2014.30.3.149
62. Li ,Y, Trush MA. Diphenyleneiodonium, an NAD(P)H oxidase inhibitor, also potently inhibits mitochondrial reactive oxygen species production. Biochem Biophys Res Commun (1998) 253(2):295–9. doi: 10.1006/bbrc.1998.9729
63. Lee YA, Kim AK, Min A, Shin MH. NOX4 activation is involved in ROS-dependent Jurkat T-cell death induced by Entamoeba histolytica. Parasite Immunol (2019) 41(11):e12670. doi: 10.1111/pim.12670
64. Bode K, et al. Dectin-1 Binding to Annexins on Apoptotic Cells Induces Peripheral Immune Tolerance via NADPH Oxidase-2. Cell Rep (2019) 29(13):4435–4446 e9. doi: 10.1016/j.celrep.2019.11.086
65. Devadas S, Zaritskaya L, Rhee SG, Oberley L, Williams MS. Discrete generation of superoxide and hydrogen peroxide by T cell receptor stimulation: selective regulation of mitogen-activated protein kinase activation and fas ligand expression. J Exp Med (2002) 195(1):59–70. doi: 10.1084/jem.20010659
66. Kwon J, Devadas S, Williams MS. T cell receptor-stimulated generation of hydrogen peroxide inhibits MEK-ERK activation and lck serine phosphorylation. Free Radic Biol Med (2003) 35(4):406–17. doi: 10.1016/S0891-5849(03)00318-6
67. Zhang D, Jin W, Wu R, Li J, Park S-A, Tu E, et al. High Glucose Intake Exacerbates Autoimmunity through Reactive-Oxygen-Species-Mediated TGF-beta Cytokine Activation. Immunity (2019) 51(4):671–81.e5. doi: 10.1016/j.immuni.2019.08.001
68. Shatynski KE, et al. Decreased STAT5 phosphorylation and GATA-3 expression in NOX2-deficient T cells: role in T helper development. Eur J Immunol (2012) 42(12):3202–11. doi: 10.1002/eji.201242659
69. Yu X, et al. SENP3 maintains the stability and function of regulatory T cells via BACH2 deSUMOylation. Nat Commun (2018) 9(1):3157. doi: 10.1038/s41467-018-05676-6
70. Xue H, et al. Selective effects of ginseng pectins on galectin-3-mediated T cell activation and apoptosis. Carbohydr Polym (2019) 219:121–9. doi: 10.1016/j.carbpol.2019.05.023
71. Tkachev V, et al. Programmed death-1 controls T cell survival by regulating oxidative metabolism. J Immunol (2015) 194(12):5789–800. doi: 10.4049/jimmunol.1402180
72. Yang Y, et al. Expression of GRIM-19 in unexplained recurrent spontaneous abortion and possible pathogenesis. Mol Hum Reprod (2018) 24(7):366–74. doi: 10.1093/molehr/gay020
73. Kaminski MM, et al. Mitochondrial reactive oxygen species control T cell activation by regulating IL-2 and IL-4 expression: mechanism of ciprofloxacin-mediated immunosuppression. J Immunol (2010) 184(9):4827–41. doi: 10.4049/jimmunol.0901662
74. Kaminski M, et al. Novel role for mitochondria: protein kinase Ctheta-dependent oxidative signaling organelles in activation-induced T-cell death. Mol Cell Biol (2007) 27(10):3625–39. doi: 10.1128/MCB.02295-06
75. Pollock JD, et al. Mouse model of X-linked chronic granulomatous disease, an inherited defect in phagocyte superoxide production. Nat Genet (1995) 9(2):202–9. doi: 10.1038/ng0295-202
76. Emmerson A, Trevelin SC, Mongue-Din H, Becker PD, Ortiz C, Smyth LA, et al. Nox2 in regulatory T cells promotes angiotensin II-induced cardiovascular remodeling. J Clin Invest (2018) 128(7):3088–101. doi: 10.1172/JCI97490
77. Rosenow EC,3, Hurley BT. Disorders of the thymus. A review. Arch Intern Med (1984) 144(4):763–70. doi: 10.1001/archinte.144.4.763
78. Li WJ, Li L, Zhen W-Y, Wang L-F, Pan M, Lv J-Q, et al. Ganoderma atrum polysaccharide ameliorates ROS generation and apoptosis in spleen and thymus of immunosuppressed mice. Food Chem Toxicol (2017) 99:199–208. doi: 10.1016/j.fct.2016.11.033
79. Lee JU, Kim LK, Choi JM. Revisiting the Concept of Targeting NFAT to Control T Cell Immunity and Autoimmune Diseases. Front Immunol (2018) 9:2747. doi: 10.3389/fimmu.2018.02747
80. Kaminski MM, Sauer SW, Kamiński M, Opp S, Ruppert T, Grigaravičius P, et al. T cell activation is driven by an ADP-dependent glucokinase linking enhanced glycolysis with mitochondrial reactive oxygen species generation. Cell Rep (2012) 2(5):1300–15. doi: 10.1016/j.celrep.2012.10.009
81. Vaeth ,M, Feske S. NFAT control of immune function: New Frontiers for an Abiding Trooper. F1000Res (2018) 7:260. doi: 10.12688/f1000research.13426.1
82. Mak TW, Grusdat M, Duncan GS, Dostert C, Nonnenmacher Y, Cox M, et al. Glutathione Primes T Cell Metabolism for Inflammation. Immunity (2017) 46(4):675–89. doi: 10.1016/j.immuni.2017.03.019
83. Bedard ,K, Krause KH. The NOX family of ROS-generating NADPH oxidases: physiology and pathophysiology. Physiol Rev (2007) 87(1):245–313. doi: 10.1152/physrev.00044.2005
85. Purushothaman ,D, Sarin A. Cytokine-dependent regulation of NADPH oxidase activity and the consequences for activated T cell homeostasis. J Exp Med (2009) 206(7):1515–23. doi: 10.1084/jem.20082851
86. Padgett LE, Anderson B, Liu C, Ganini D, Mason RP, Piganelli JD, et al. Loss of NOX-Derived Superoxide Exacerbates Diabetogenic CD4 T-Cell Effector Responses in Type 1 Diabetes. Diabetes (2015) 64(12):4171–83. doi: 10.2337/db15-0546
87. Abimannan T, et al. Oxidative stress modulates the cytokine response of differentiated Th17 and Th1 cells. Free Radic Biol Med (2016) 99:352–63. doi: 10.1016/j.freeradbiomed.2016.08.026
88. Seo YS, et al. Codonopsis lanceolata attenuates allergic lung inflammation by inhibiting Th2 cell activation and augmenting mitochondrial ROS dismutase (SOD2) expression. Sci Rep (2019) 9(1):2312. doi: 10.1038/s41598-019-38782-6
89. Kwon BI, et al. Enhanced Th2 cell differentiation and function in the absence of Nox2. Allergy (2017) 72(2):252–65. doi: 10.1111/all.12944
90. Yu Q, et al. SIRT1 and HIF1alpha signaling in metabolism and immune responses. Cancer Lett (2018) 418:20–6. doi: 10.1016/j.canlet.2017.12.035
91. Fu G, et al. Suppression of Th17 cell differentiation by misshapen/NIK-related kinase MINK1. J Exp Med (2017) 214(5):1453–69. doi: 10.1084/jem.20161120
92. Zhi L, et al. Enhanced Th17 differentiation and aggravated arthritis in IEX-1-deficient mice by mitochondrial reactive oxygen species-mediated signaling. J Immunol (2012) 189(4):1639–47. doi: 10.4049/jimmunol.1200528
93. Scavuzzi BM, Colado Simão AN, Veiga Iriyoda TM, Batisti Lozovoy MA, Stadtlober NP, da Rosa Franchi Santos LF, et al. Increased lipid and protein oxidation and lowered anti-oxidant defenses in systemic lupus erythematosus are associated with severity of illness, autoimmunity, increased adhesion molecules, and Th1 and Th17 immune shift. Immunol Res (2018) 66(1):158–71. doi: 10.1007/s12026-017-8960-9
94. Yarosz EL, Chang CH. The Role of Reactive Oxygen Species in Regulating T Cell-mediated Immunity and Disease. Immune Netw (2018) 18(1):e14. doi: 10.4110/in.2018.18.e14
95. Gerriets VA, Kishton RJ, Nichols AG, Macintyre AN, Inoue M, Ilkayeva O, et al. Metabolic programming and PDHK1 control CD4+ T cell subsets and inflammation. J Clin Invest (2015) 125(1):194–207. doi: 10.1172/JCI76012
96. Guo Z, Wang G, Wu B, Chou W-C, Cheng L, Zhou C, et al. DCAF1 regulates Treg senescence via the ROS axis during immunological aging. J Clin Invest (2020) 130(11):5893–908. doi: 10.1172/JCI136466
97. Mougiakakos D, Johansson CC, Kiessling R. Naturally occurring regulatory T cells show reduced sensitivity toward oxidative stress-induced cell death. Blood (2009) 113(15):3542–5. doi: 10.1182/blood-2008-09-181040
98. Zhao Y, Fan C, Zhang A, Zhang Y, Wang F, Weng Q, et al. Walnut Polyphenol Extract Protects against Malathion- and Chlorpyrifos-Induced Immunotoxicity by Modulating TLRx-NOX-ROS. Nutrients (2020) 12(3). doi: 10.3390/nu12030616
Keywords: T cells, cell metabolism, reactive oxygen species, immunity, disease
Citation: Peng H-Y, Lucavs J, Ballard D, Das JK, Kumar A, Wang L, Ren Y, Xiong X and Song J (2021) Metabolic Reprogramming and Reactive Oxygen Species in T Cell Immunity. Front. Immunol. 12:652687. doi: 10.3389/fimmu.2021.652687
Received: 12 January 2021; Accepted: 08 March 2021;
Published: 31 March 2021.
Edited by:
Isabel Merida, Consejo Superior de Investigaciones Científicas (CSIC), SpainReviewed by:
Valerie Gerriets, California Northstate University, United StatesCopyright © 2021 Peng, Lucavs, Ballard, Das, Kumar, Wang, Ren, Xiong and Song. This is an open-access article distributed under the terms of the Creative Commons Attribution License (CC BY). The use, distribution or reproduction in other forums is permitted, provided the original author(s) and the copyright owner(s) are credited and that the original publication in this journal is cited, in accordance with accepted academic practice. No use, distribution or reproduction is permitted which does not comply with these terms.
*Correspondence: Jianxun Song, anVzMzVAdGFtdS5lZHU=
Disclaimer: All claims expressed in this article are solely those of the authors and do not necessarily represent those of their affiliated organizations, or those of the publisher, the editors and the reviewers. Any product that may be evaluated in this article or claim that may be made by its manufacturer is not guaranteed or endorsed by the publisher.
Research integrity at Frontiers
Learn more about the work of our research integrity team to safeguard the quality of each article we publish.