 Meenu Wadhwa
 Chris Bird
 Eleanor Atkinson2
 Isabelle Cludts
 Peter Rigsby
94% of researchers rate our articles as excellent or good
Learn more about the work of our research integrity team to safeguard the quality of each article we publish.
Find out more
ORIGINAL RESEARCH article
Front. Immunol. , 15 April 2021
Sec. Cytokines and Soluble Mediators in Immunity
Volume 12 - 2021 | https://doi.org/10.3389/fimmu.2021.636420
This article is part of the Research Topic Contemporary Challenges in Immunologic Testing in Clinical and Research Laboratories View all 28 articles
The expanded availability of adalimumab products continues to widen patient access and reduce costs with substantial benefit to healthcare systems. However, the long-term success of these medicines is highly dependent on maintaining consistency in quality, safety and efficacy while minimizing any risk of divergence during life-cycle management. In recognition of this need and demand from global manufacturers, the World Health Organization (WHO) Expert Committee on Biological standardization established the WHO 1st International standard (IS) for Adalimumab (coded 17/236) in October 2019 with a defined unitage ascribed to each of the individual bioactivities evaluated in the study namely, TNF-α binding, TNF-α neutralization, complement dependent cytotoxicity and antibody-dependent cellular cytotoxicity. For development of the IS, two candidate standards were manufactured as per WHO recommendations. Analysis of extensive datasets generated by testing of a common set of samples including the candidate standards by multiple stakeholders including regulatory agencies using their own qualified assays in a large international collaborative study showed comparable biological activity for the tested candidates for the different activities. Use of a common standard significantly decreased the variability of bioassays and improved agreement in potency estimates. Data from this study clearly supports the utility of the IS as an important tool for assuring analytical assay performance, for bioassay calibration and validation, for identifying and controlling changes in bioactivity during life-cycle management and for global harmonization of adalimumab products. In addition, in a separate multi-center study which included involvement of hospital and clinical diagnostic laboratories, the suitability of the adalimumab IS for therapeutic drug monitoring assays was examined by analysis of data from testing of a common blind coded panel of adalimumab spiked serum samples representative of the clinical scenario along with the IS and in-house standards in diverse immunoassays/platforms. Both commercially available and in-house assays that are routinely used for assessing adalimumab trough levels were included. Excellent agreement in estimates for adalimumab content in the spiked samples was observed regardless of the standard or the method with inter-laboratory variability also similar regardless of the standard employed. This data, for the first time, provides support for the extended applicability of the IS in assays in use for therapeutic drug monitoring based on the mass content of the IS. The adalimumab IS, in fulfilling clinical demand, can help toward standardizing and harmonizing clinical monitoring assays for informed clinical decisions and/or personalized treatment strategies for better patient outcomes. Collectively, a significant role for the adalimumab IS in assuring the quality, safety and efficacy of adalimumab products globally is envisaged.
Increased knowledge of the pathogenesis of chronic immune conditions, inflammatory disorders and some cancers has led to targeted interventions which have radically changed treatment strategies in patients with significant impact on their quality of life. Among these is the anti-TNF product class comprising Infliximab (Remicade®, Janssen), etanercept (Enbrel®, Amgen/Pfizer), adalimumab (Humira®, AbbVie), certolizumab pegol (Cimzia®, UCB) and golimumab (Simponi®, Janssen), all proven to be highly successful for several diseases where the pathology has been intimately linked to over production of tumor necrosis factor-alpha (TNF-α), a pleiotropic cytokine involved in the regulation of immune and inflammatory responses.
Adalimumab (Humira®), the world’s first fully human IgG1 therapeutic monoclonal antibody (mAb), produced using phage display technology made history when initially approved for treatment of moderate-to-severe forms of rheumatoid arthritis (RA) in 2002 and 2003 by FDA and EMA respectively (1). Humira® is now indicated for use in moderate to severe polyarticular juvenile idiopathic arthritis (JIA), active psoriatic arthritis (PsA), active ankylosing spondylitis (AS), moderate to severe active adult Crohn’s disease (CD), moderate to severe active ulcerative colitis (UC), moderate to severe plaque psoriasis, uveitis and others (2–4). More recently, based on mounting evidence adalimumab is being explored for treatment of COVID-19 patients (5, 6). In terms of its function, adalimumab binds specifically to both transmembrane and soluble forms of TNF-α, the latter with high affinity preventing the interaction of TNF-α with its receptors, TNF-R1 (p55) and -R2 (p75) and modulating the signaling cascade associated with TNF-α bioactivity. The mechanism of action of adalimumab is thought to vary among diverse indications just like infliximab. In rheumatoid arthritis, adalimumab acts primarily by neutralizing soluble TNF-α, while in inflammatory bowel diseases such as Crohn’s disease and ulcerative colitis, binding to the membrane-bound form of TNF-α can trigger a range of biological effects such as alteration in levels of adhesion molecules, suppression of cytokine secretion and induction of apoptosis through reverse signaling. In addition, there can also be an interplay with Fc-mediated effector functions such as antibody dependent cellular cytotoxicity and complement mediated cytotoxicity (2, 4, 7).
While adalimumab was the third anti-TNF product to be approved for RA, the extension of the clinical use in various indications together with the ease and flexibility afforded by its subcutaneous route of administration has translated into commercial benefit. Acclaimed the bestselling product over the last three years, Humira® continues to achieve global sales in excess of US$19bn (8). Such high sales and the culmination of product exclusivity in Oct’18 in Europe stimulated intense biosimilar development and approvals both in Europe and USA. Until February 2021, 12 adalimumab biosimilars (7 unique biological products) have been approved (3 have been voluntarily withdrawn due to commercial reasons) in the EU and 6 in the US (Table 1) with the aim of reducing costs and widening patient access (4, 7, 9–12). Unlike USA, where patents expire in 2023 (8, 13), there has been an increased uptake of biosimilars in Europe since their launch with diminishing costs to healthcare systems. In Denmark, substantial cost-reductions of ~83% have been achieved within months of shifting to biosimilars (14) while in England, savings of up to 150 million GBP a year are expected by 2021 with implementation of biosimilars in the national health service, NHS (15) against the cost of > 500 million GBP for Humira® in 2017/2018. In Europe, no safety signals have been reported so far for biosimilars approved using strict criteria for biosimilarity (16–18) and product interchangeability is not a cause of any concern (19). However, product quality needs to be maintained post-approval in compliance with regulatory requirements to ensure equivalent safety and efficacy throughout the product’s lifecycle.
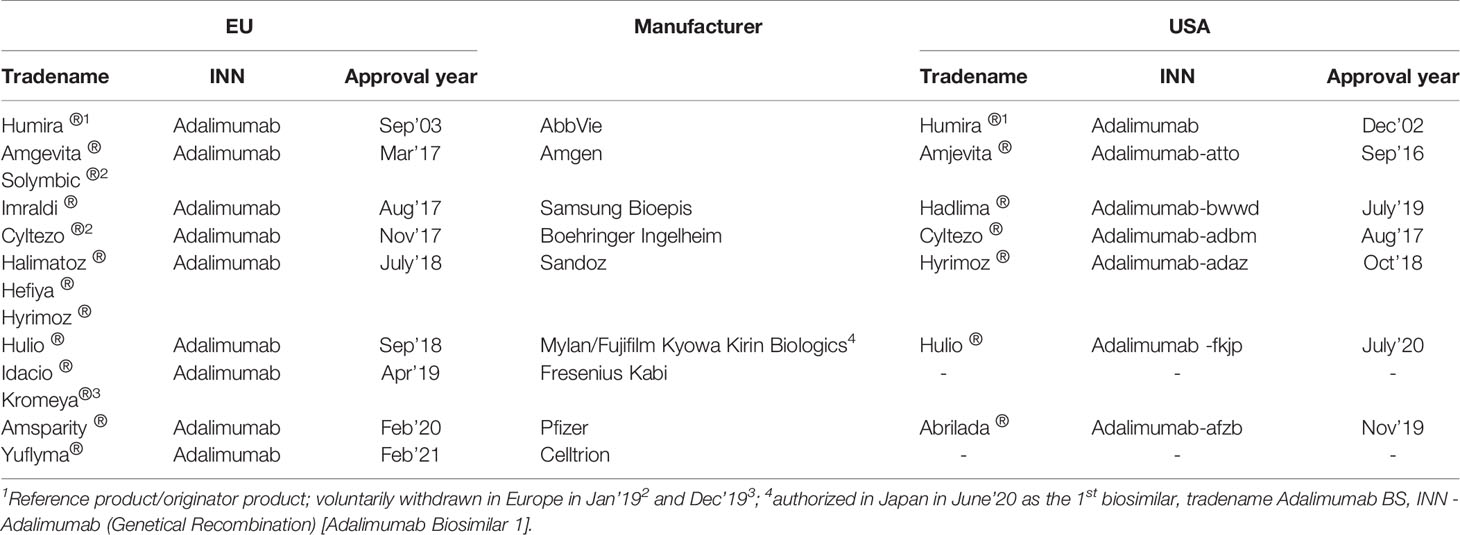
Table 1 Adalimumab products (originator and biosimilar) currently authorized in Europe and USA.
Despite achieving clinical success, concerns over immunogenicity and loss of efficacy which are evident with other TNF inhibitors have also arisen with adalimumab (20–22). For example, in Crohn’s disease, 10–30% of patients do not respond to the initial treatment (primary failure) with anti-TNF-α mAbs and up to 46% of patients lose response over time (secondary failure), potentially due to formation of anti-drug antibodies, ADA (22) As a result, routine therapeutic drug monitoring (TDM) for measuring trough drug levels and anti-drug antibodies is being actively considered in clinical practice (23, 24). Such an approach can improve clinical decision-making, by influencing drug selection, dose, frequency of administration and potentially allowing clinicians to alter treatment strategies for patients in clinical relapse or remission. For effective treatment, it is suggested that trough levels of adalimumab need to be within a certain therapeutic window (25, 26). The American Gastroenterology Association has provided recommendations on TDM in inflammatory bowel disease, IBD (27) while in Europe, a generalized therapeutic algorithm for treatment of inflammatory diseases has been proposed (28, 29). In other indications, there is no guidance on TDM despite clinical support largely due to absence of evidence from large prospective studies (30, 31) and the lack of robust TDM data for defining the algorithm for clinical treatment. Currently, access to standardized, validated analytical methods for timely and accurate results presents a significant challenge due to different analytical techniques in use in healthcare settings (32). Although ELISAs are the commonly used platform for quantitating levels of the therapeutic, the availability of a wide range of commercial kits and in-house assays makes standardization very difficult. In the UK, the National Institute for Health and Care Excellence (NICE) has advocated the need for assay standardization (NICE diagnostics guidance [DG22] (33).
The World Health Organization (WHO) has a core role in developing norms and standards for biological medicines. This comprises elaboration of both written and measurement standards which are widely used for harmonizing practices globally. In alignment with its guidelines on biosimilar monoclonal antibodies, WHO has recognized the need for reference standards for standardizing mAbs (particularly biosimilar targets) (34–36). This has included consideration of the evolving situation in emerging markets. Unfortunately, even today, many products manufactured in these regions and approved using local regulatory pathways may not strictly adhere with the biosimilarity principles and the rigorous comparability exercise required by stringent regulatory agencies (11, 16, 17, 37), or those defined by the WHO in its guidance on similar biotherapeutic products (34, 35). Consistent with this, the National Institute for Biological Standards and Control (NIBSC) in the UK, a WHO collaborating center which produces and distributes 95% of international standards (IS) for biological medicines and vaccines, is actively engaged in the production and development of mAb reference standards, with ISs for rituximab and infliximab already established (38, 39). Such standards with defined international units are primarily intended as tools for validation of in vitro biological activity assays, calibration of in-house proprietary bioactivity reference standards and for harmonizing product bioactivity where possible. The use of these publicly available ISs can facilitate potency assessment not only during different phases of product development but also across products from different manufacturing processes/manufacturers and help to understand and manage any drift in bioactivity among the plethora of marketed products as they evolve post-authorization. This alignment of bioactivity is particularly important in view of the product switching that may occur not only between the originator and biosimilar product but also between biosimilar products. In some instances, however, the ISs provide an additional opportunity from the clinical perspective as they can serve as a standard for calibrating in-house standards and assays that are used routinely for measuring therapeutic drug levels e.g., diagnostic assays, commercial kits. Establishing such standards for assuring the analytical performance of the different tests for clinical monitoring can be invaluable for generating accurate and reproducible results for drug levels and would allow evidence-based decision-making for dose optimization or for treatment withdrawal/switch with better patient outcomes (28, 29).
This article describes the strategy employed for the development of the 1st WHO IS for adalimumab, the third IS in the TNF product class, following WHO endorsement based on global need and priority and the results from two large, independent international collaborative studies with participation from various stakeholders (Tables 2 and 3). The data illustrates the suitability of a lyophilized candidate antibody preparation as an IS for in vitro bioactivity determination of adalimumab. In addition, for the first time, data on the extended role of the IS for assays in use for therapeutic drug monitoring is also available. This article, therefore, primarily highlights the applicability of the adalimumab IS in standardizing bioassays as well as assays for clinical monitoring of adalimumab levels.
Table 2 Bioassay study participants.

Table 3 Participants in adalimumab quantitation study.
Two bulk drug substance preparations of recombinant adalimumab from an originator and a biosimilar manufacturer with suitable certificates of analysis, each from a single batch were kindly donated to WHO for the purpose of developing the IS (see Acknowledgement). The materials were formulated and freeze-dried using two formulations; a) 25mM Sodium citrate tribasic dihydrate, 150mM Sodium chloride, 1% (v/v) clinical grade Human serum albumin, HSA, pH 6.5 and b) 10mM L-Histidine, 10mM L-Histidine hydrochloride monohydrate, 1% D-trehalose dihydrate, 0.01% Polysorbate-20, 1% (v/v) clinical grade HSA, pH 6.2 and tested for bioactivity in comparison with the bulk material in two different laboratories in cytotoxicity assays using WEHI-164 and L929 cell lines. Although both formulations proved to be suitable, the citrate formulation was selected for the final production fills since this provided a lyophilized preparation with marginally higher biological activity than the histidine formulation relative to the bulk material in both assays (Supplemental Table 1).
The production fills and lyophilization of the two candidates was performed at NIBSC using standardized procedures as specified in the WHO ECBS recommendations for International standards (40). Solutions with excipients (final compositions as shown in Supplemental Table 2), were prepared using nonpyrogenic water for irrigation (Baxter, Switzerland) and filtered using sterile nonpyrogenic filters (0.22μM Stericup filter system, Millipore, USA). The adalimumab content of 50 μg per ampoule was calculated from the dilution of the bulk material and assumed protein mass content provided by the manufacturer. A small batch containing a reduced amount of 40μg per ampoule was also included in the study to assess specifically the ability of the assays to distinguish a preparation with a lower amount. Optimized and controlled conditions were used for lyophilization and the glass ampoules sealed under dry nitrogen by heat fusion with storage at -20°C in the dark. Briefly, 1 ml of adalimumab solution containing approximate amounts of adalimumab (Table 4) was dispensed into 5 ml ampoules using an automated filling line (Bausch and Stroebel, Ilshofen, Germany) and freeze-dried in a Serail CS100 freeze-dryer (Le Coudray St Germer, France). The material was frozen over 120 minutes to -50°C and held for 6 hours at the same temperature prior to vacuum application. Primary drying was performed over 41 hours at -35°C and 100μbar vacuum followed by a ramp over 10 hours to 30°C and secondary drying for 36 hours at 30°C and 30μbar vacuum. The glass ampoules were sealed under dry nitrogen by heat fusion and stored at -20°C in the dark until shipment.
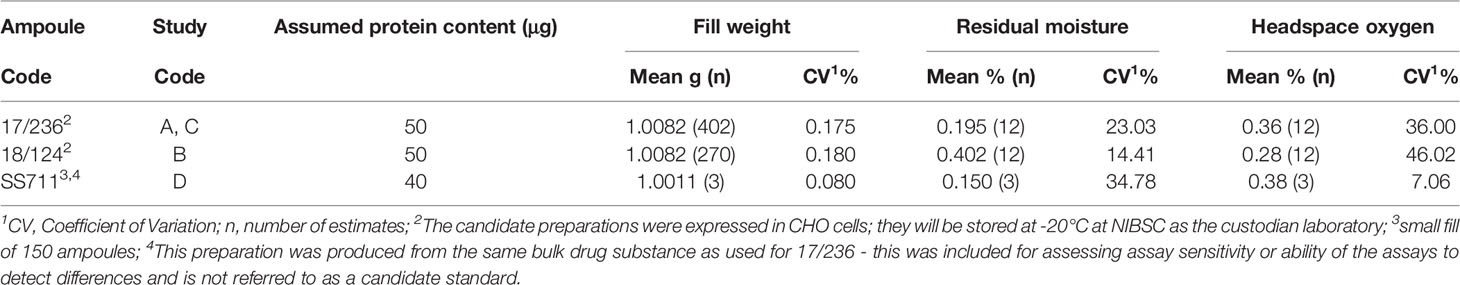
Table 4 Characteristics of the lyophilized preparations.
Table 4 provides the characteristics of the preparations and study codes. In all instances, the specifications for WHO International standards were met. Ampoule integrity was assessed by determining residual moisture by the coulometric Karl-Fischer method (Mitsubishi CA100) and headspace oxygen content by frequency modulated spectroscopy using the Lighthouse FMS-760 Instrument (Lighthouse Instruments, LLC). No evidence of microbial contamination was found using the total viable count method.
As mentioned in the Introduction, two independent collaborative studies for assessing the suitability of the IS for bioactivity and for therapeutic drug monitoring assays were organized. For confidentiality, all participant data are blind coded with a randomized laboratory number which is not related to the order of listing (Tables 2 and 3). Participants were encouraged to use their in-house qualified or validated methods and include routine controls and in-house reference standards where feasible. Participants were sent a study-specific protocol which provided information on the study aims and objectives, the study samples with specific instructions on their storage, reconstitution (where appropriate) and use and examples of suggested assay/plate layouts and a template for reporting of results. An independent statistical analysis of all data was performed at NIBSC.
For this study, data was contributed by twenty-six participants from thirteen countries These comprised 12 biopharmaceutical manufacturers, 2 contract research organizations, 9 national control laboratories, 2 pharmacopoeias and 1 commercial reagent supplier (Table 2). All were provided with a sample pack comprising five ampoules each of samples A to C for each assay type to be performed along with 5 ampoules of the 3rd TNF-α IS (coded 12/154) for the TNF-α neutralization bioassays. Sample D containing a reduced amount of the antibody relative to samples A to C was sent to a limited number of laboratories.
Data was requested for all samples assayed concurrently on at least three separate occasions using in-house routine methods, within a suggested layout which allocated samples across 3 plates allowing for testing of replicates. Prior to performing the assay runs for the study, participants were advised however to perform pilot assay(s) using the provided samples for each of the assay type they intended to perform to ensure suitable assay conditions and establish working range for the test samples. For TNF-α neutralization bioassays, this approach allowed selection of a suitable dose of TNF-α for optimal dose response curves. Typically, most participants provided data from a total of 9 assays which included the test samples, an in-house (IH) standard (where available) in two independent dilution series on each plate using freshly reconstituted ampoules for each assay. A summary of the bioassays in the study is provided in Table 5.
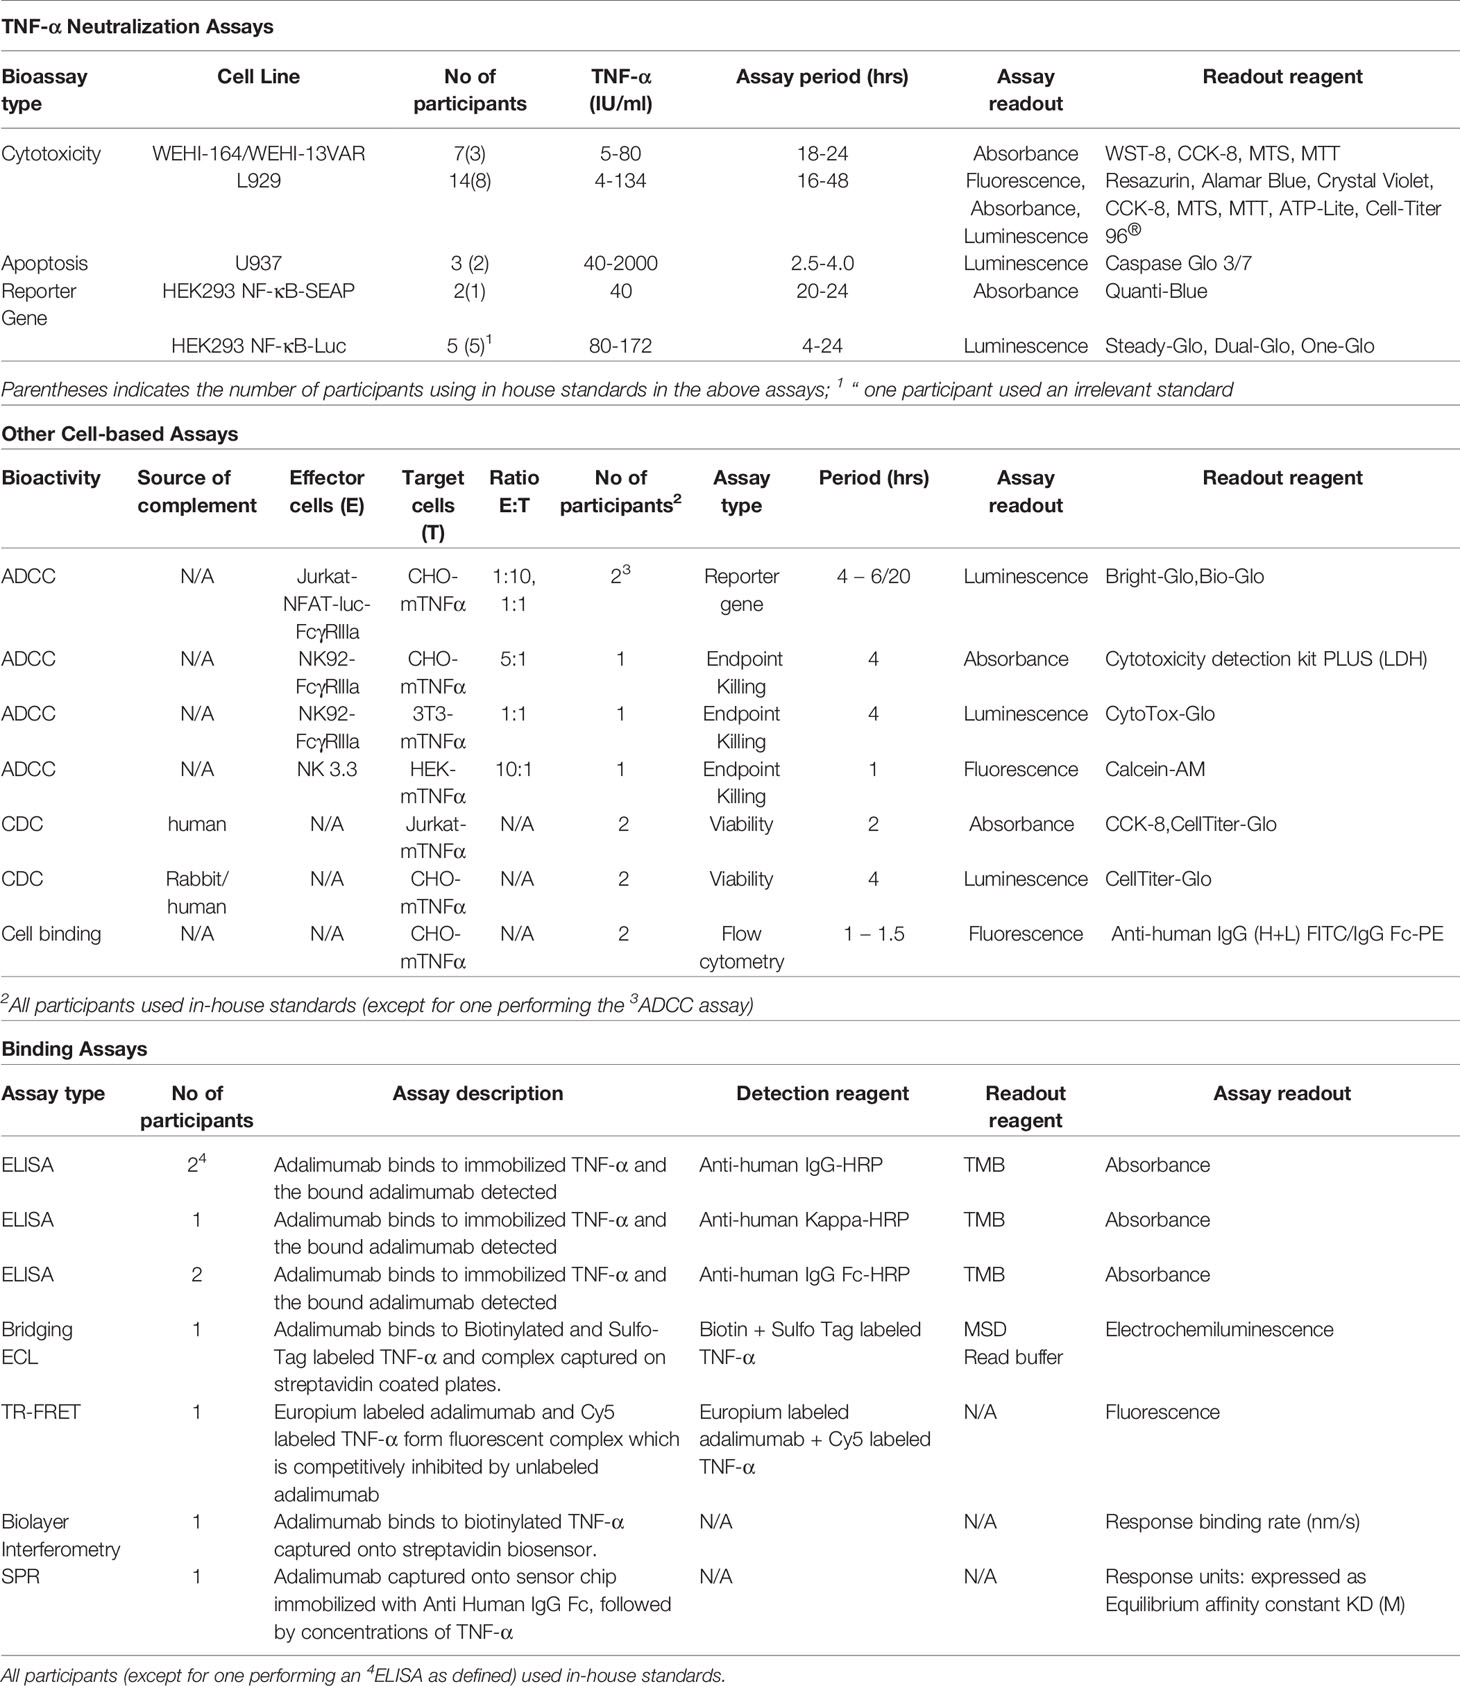
Table 5 Summary of the assays performed in the collaborative study for bioactivity.
Statistical analysis of dose-response curve data was performed using a four-parameter logistic (sigmoid curve) model (except for assays from three laboratories as specified below where a parallel line model was used)
where y denotes the assay response, x is the concentration, α is the upper asymptote, δ is the difference between upper and lower asymptotes, β is the slope factor and γ is the EC50 (50% effective concentration). Assay responses (absorbance, luminescence etc.) were log transformed for this analysis and it was therefore considered reasonable to combine data from all different readout formats to then derive assay validity (parallelism) criteria. Models were fitted using the R package ‘drc’ (41, 42). Parallelism (similarity) for a pair of dose-response curves was concluded by demonstrating equivalence of the parameters α, β and δ. Equivalence bound values and the methods for determining them are described in the Results section of this report.
Analysis of data from three laboratories (laboratories 4a - neutralization, 7 and 8 - both binding) was performed using a parallel line model due to testing of samples at fewer dilutions than other laboratories. Equivalence criteria applied to the β parameter in the sigmoid curve model analysis were used to confirm parallelism of the samples tested.
Relative potency estimates were calculated as the ratio of EC50 estimates in all cases where acceptable parallelism was concluded. All relative potency estimates were combined to generate unweighted geometric mean (GM) potencies for each laboratory and these laboratory means were used to calculate overall unweighted geometric mean potencies. Variability between assays and laboratories has been expressed using geometric coefficients of variation (GCV = {10s-1} × 100% where s is the standard deviation of the log10 transformed potencies).
For this study, data was contributed by sixteen participants from eight countries. These included 1 contract research organization, 2 national control laboratories, 1 academic laboratory, 6 commercial kit manufacturers, 2 hospital laboratories and 4 clinical diagnostic centers (Table 3). All participants were provided with a sample pack comprising 4 ampoules of the lyophilized candidate preparation, Sample A (Table 4) and a blind-coded panel of twenty-four human serum samples prepared by spiking two pools of normal human sera (First Link and Sigma-Aldrich respectively) with either variable amounts of reconstituted candidate A or the two adalimumab preparations supplied (for use as candidates), information on amounts spiked is provided in the Results section. The samples were stored at -40°C until dispatch or use.
Prior to the study, a survey was conducted which informed on the assays in use, the assay range, sample treatment (e.g., dilution), the standard, quality control samples and the sample number easily accommodated on a single plate which helped toward study design. All participating laboratories were provided with 1 sample pack, consisting of 4 ampoules of study sample A, and adequate amounts for the serum samples for each assay type they were intending to perform. Like the bioassay study, data was requested for all samples assayed concurrently in three independent assays used routinely with inclusion of dilutions of freshly reconstituted Sample A and their own in-house (IH)/kit standard where available in each assay. Prior to performing the assay runs for the study, participants were advised to perform a pilot assay using the candidate A to ensure appropriate assay conditions and optimal dose response curves for the kit/in-house standard and candidate A. A majority of participants provided data from a total of 3 assays which included evaluation of the candidate adalimumab preparation using freshly reconstituted ampoules for each assay, the test samples and a kit/in-house (IH) standard. Information on the assays which contributed to the study is tabulated and provided in the Results section.
Statistical analysis of adalimumab levels (µg/ml) in spiked serum samples relative to sample A and kit standards or in-house standards was performed using four-parameter logistic (sigmoid curve) models. All results determined relative to sample A assumed a concentration of 50μg of adalimumab per ampoule for this standard. Estimates were combined as unweighted geometric means (GM) for each laboratory and these laboratory means were used to calculate overall unweighted geometric mean estimates. Variability between laboratories has been expressed using geometric coefficients of variation (GCV = {10s-1} × 100% where s is the standard deviation of the log10 transformed estimates). Assessment of agreement in mean estimates for each pair of laboratories was performed by calculating Lin’s concordance correlation coefficient (43, 44) with log transformed data. Calculations for this were performed using the R package ‘DescTools’ (41). A value of 1 for this coefficient indicates perfect agreement between the two laboratories.
Ampoules of the candidate standard 17/236 were reconstituted and subjected to a series of freeze-thaw cycles (up to 4; n=9) or subjected separately to room temperature or 4°C for either a day or a week (n=6) and assayed concurrently against a freshly reconstituted ampoule. In addition, ampoules of the candidate standard 17/236 stored for 15 months at a range of different temperatures (45°C, 37°C, 20°C and 4°C) were tested in the L929 cytotoxicity assay alongside ampoules stored at the recommended temperature of -20°C and -70°C as baseline reference temperature. Further accelerated thermal degradation and real time stability studies for prediction of stability of the IS as per the Arrhenius equation (45) are ongoing.
The development of the IS involved multiple, sequential steps including selection of an optimal formulation, production of candidate standards, testing in two multi-center studies, data analysis and unitage assignment. Here the results of these studies which led to the recommendations to the WHO Expert Committee on Biological standardization (ECBS) and finally the establishment of the WHO IS in Oct’19 are presented.
WHO IS are manufactured using a strict process for lyophilization as defined in the WHO recommendations for production of reference standards (40). For maintaining stability over a long time, even decades in some cases, WHO IS are available in a lyophilized form in flame-sealed glass ampoules and contain limited amounts (μg) of the active substance unlike the high amounts (mg) in the clinical product. The characteristics of the two lyophilized candidate adalimumab preparations (coded 17/236 and 18/124), produced from generous donations of bulk drug substance from two manufacturers is given in Table 4 and Supplemental Table 2. As shown, all preparations have low moisture and oxygen headspace in compliance with the WHO specifications for IS (40). A citrate formulation, which showed maximal retention of bioactivity in pilot fills comparing two different formulations in different bioassays in two laboratories and conferred stability in an accelerated thermal degradation (ATD) study was selected for lyophilization. Potency data is shown in Supplemental Table 1.
A multi-centre, international collaborative study with 26 participants (Table 2) representing manufacturers, national control laboratories/regulatory agencies, contract research organizations, pharmacopoeias and commercial reagent suppliers was coordinated to evaluate the suitability of the two lyophilized candidate preparations to serve as an IS in a similar approach to other studies for WHO IS. For the study, all participants were requested to assess the activity of the candidate preparations (coded 17/236 - sample A and its duplicate sample C, 18/124 - sample B, Table 4), and their in-house reference standards using their own in-house qualified methods which largely comprised TNF-α neutralization assays, commonly used for lot release as well as other bioassays representative of the multiple bioactivities elicited by the antibody (Table 5). Details on the study design are provided in the Materials and Methods section. This practice allowed us to gain a valuable insight of the different types of cell- and non-cell based assay systems that are currently in use in different laboratories (Table 5) and provided information on the dose-response profile and bioactivity of the adalimumab preparations produced using different manufacturing processes, often included as in-house standards in the assay. Inclusion of an additional sample (sample D with a 20% lower adalimumab content compared with other samples), tested by a few laboratories contributed toward an increased understanding of the sensitivity of the different assays.
A summary of the bioassays is shown in Table 5 (further details of individual participant assays is provided in Supplemental Table 3). As highlighted in these tables, assessment of TNF-α binding (n=8) and TNF-α neutralization(n=26) in non-cell ligand binding and cell-based assays, attributed to the Fab region of the adalimumab was a major component of the study. For binding, direct ELISAs (n=5) using immobilized TNF-α to capture adalimumab and detection with HRP-conjugated anti-IgG (Fc specific), - anti-IgG1 or - anti-kappa chain, electrochemiluminescence (ECL), fluorescence resonance energy transfer (FRET), bio-layer interferometry and surface plasmon resonance (SPR) platforms and flow cytometry based binding assays using CHO cells engineered to express non-cleavable membrane bound TNF-α (n=2) were employed. For TNF-α neutralization, three different bioassays previously used in the studies for infliximab and etanercept ISs were used (39, 46). The predominant assay (n=21) was based on the inhibition of TNF-α induced cytotoxicity of either murine fibroblast, L929 (47), or fibrosarcoma, WEHI-164 or the WEHI-13 variant cell-lines (48) followed by the reporter-gene assay (n=7) in which adalimumab inhibited TNF-stimulated activation of NF-κB transcription factor, assessed by measuring luciferase or secreted embryonic alkaline phosphatase (SEAP) activity in the human embryonic kidney cell-line, HEK-293 transfected with appropriate TNF-α responsive NFκB regulated reporter-gene constructs. Inhibition of TNF-α mediated apoptosis by measuring caspase activation in the U937 cell-line, a human histiocytic lymphoma, which exhibits properties typical of macrophages (49) was also used (n=3). Since Fc-effector function may contribute to adalimumab’s mechanism of action in some indications, complement dependent cytotoxicity (CDC) and antibody dependent cytotoxicity (ADCC) assays were included in the study. However, only a limited number of laboratories performed the CDC (n=4) and ADCC assays (n=5), possibly due to the lack of cell-lines transfected with membrane bound TNF-α. In CDC, the lysis of CHO or Jurkat T cells engineered to express a non-cleavable mutant of membrane-bound TNF-α (45) in the presence of complement was assessed. For ADCC, engineered cells (CHO/3T3/HEK-293 with membrane-bound TNF-α) served as the target. While effectors in three laboratories were natural killer cell lines e.g., the NK92 transfected with CD16a (FcγRIIIa) or the NK3.3 (instead of the conventional primary cells), which subject to CD16 engagement and activation killed target cells (50, 51), two laboratories employed surrogate ADCC assays in which reporter gene containing effectors luminesce in response to crosslinking of CD16 by adalimumab (52) in the presence of target cells (with surface-bound TNF-α).
Data received from 51 different assays (from 26 laboratories), each typically performed on three independent occasions was reviewed and an independent statistical analysis performed. An “equivalence testing” approach was adopted with curve similarity for two samples assessed using pre-defined acceptable ranges for the differences in model parameters (α, upper asymptote, δ, asymptote difference and β, slope factor). These ranges were set using neutralization data for the coded duplicates, as model parameters are expected to be equivalent for these samples in each individual assay. Absolute differences in α, log10β and δ parameters for the coded duplicates A & C were calculated for each plate and upper equivalence bounds set as the 95th percentile of these values, taken from all laboratories performing neutralization assays. This gave upper bounds 0.078, 0.140 and 0.190 for the absolute difference in α, log10β and δ parameters respectively. The upper bound for log10β corresponds to a slope factor ratio of 1.38. For two dose-response curves to be concluded as parallel, equivalence had to be demonstrated for all three parameters (α, β and δ). The equivalence bounds applied were solely intended for use in data analysis of this study, in order to apply consistent criteria to all laboratories and assess their relative performance. The bounds should not be interpreted as suitable values for routine use in the assessment of assay validity within the collaborating laboratories. The percentage of invalid assays per lab is shown in Supplemental Table 4 illustrating the range in relative performance of the participating laboratories using the defined equivalence criteria. Applying the global analysis to neutralization assays meant that a majority of laboratories (18 out of 23) had ≤ 25% invalid assays, indicating that this global analysis worked well and assays were of high quality, even with stringent validity parameters applied. Examination of participant data demonstrated comparable behavior and dose response profiles for all study samples although a low percentage of non-parallelism was noted between samples (sample B, coded duplicate C or in-house standard) in a minority of assays across the study. Importantly, the resemblance in behavior across most assays regardless of the assay type or the samples including in-house standards (except those that were irrelevant) confirmed the suitability of the candidates as bioassay standards for calibration of different adalimumab products.
Potency estimates calculated relative to candidate standard sample A or relative to in-house reference standards where available (adalimumab manufactured in-house, n=9; Humira batch, n=7; research grade anti-TNF antibody, n=1; an irrelevant anti-TNF, n=1) for different assays from individual laboratories are summarized in Supplemental Tables 5–7. An overall summary of potency for each assay type is shown in Table 6 and boxplots of laboratory geometric mean (GM) relative potencies are shown in Figure 1.
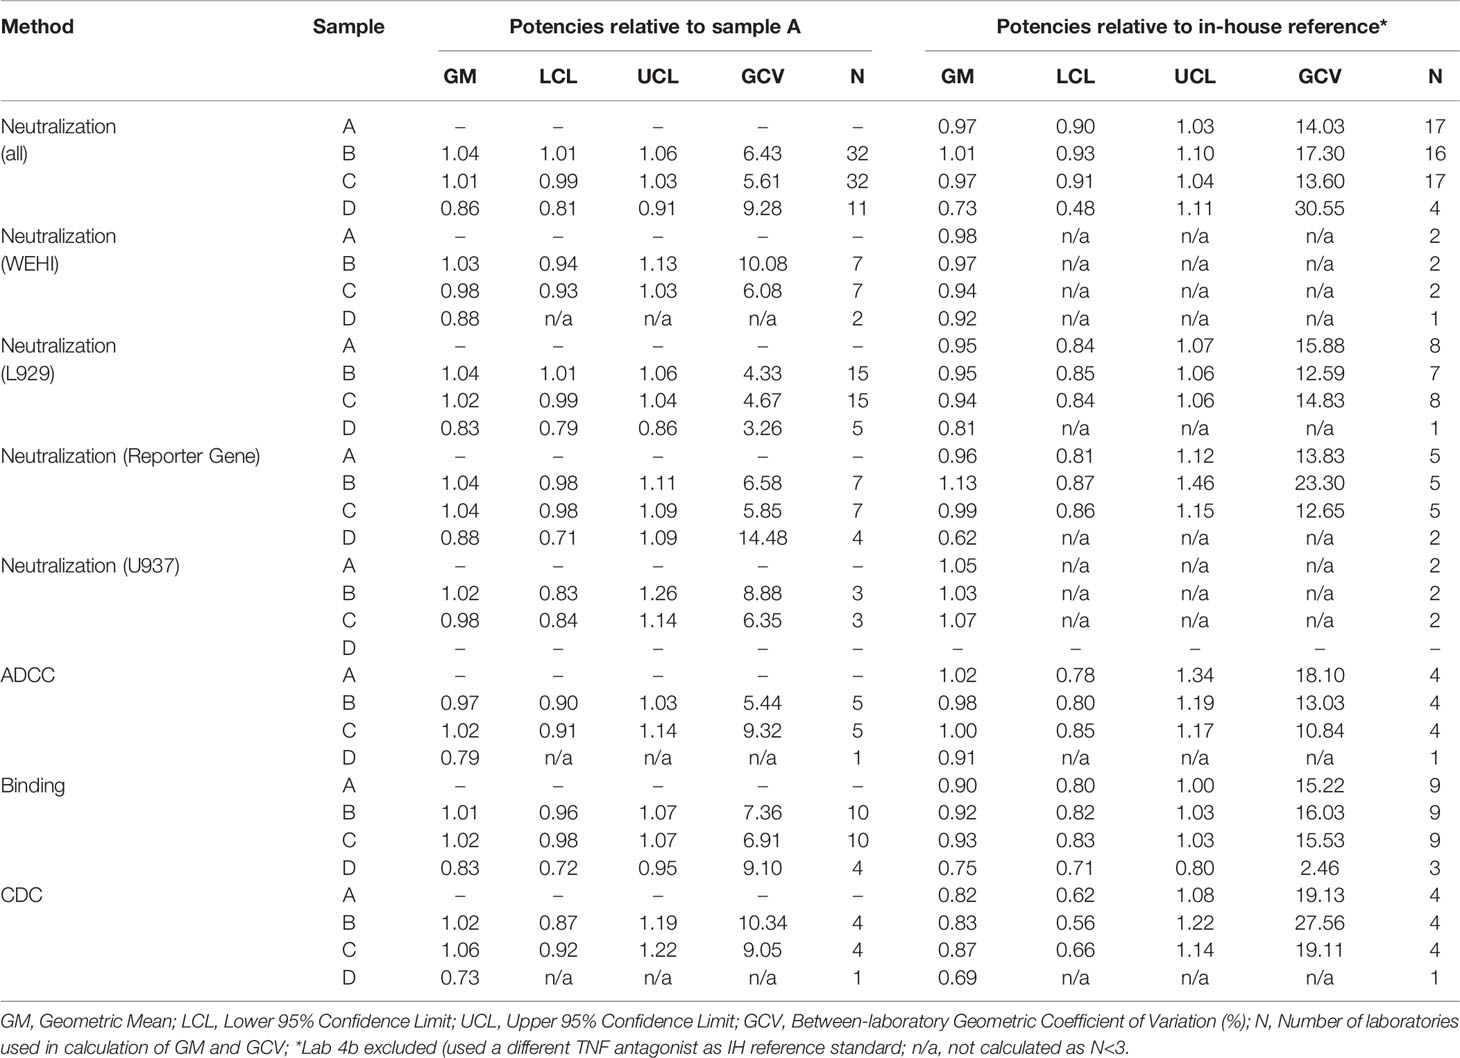
Table 6 Overall geometric mean relative potency estimates for all assays contributed to the study.
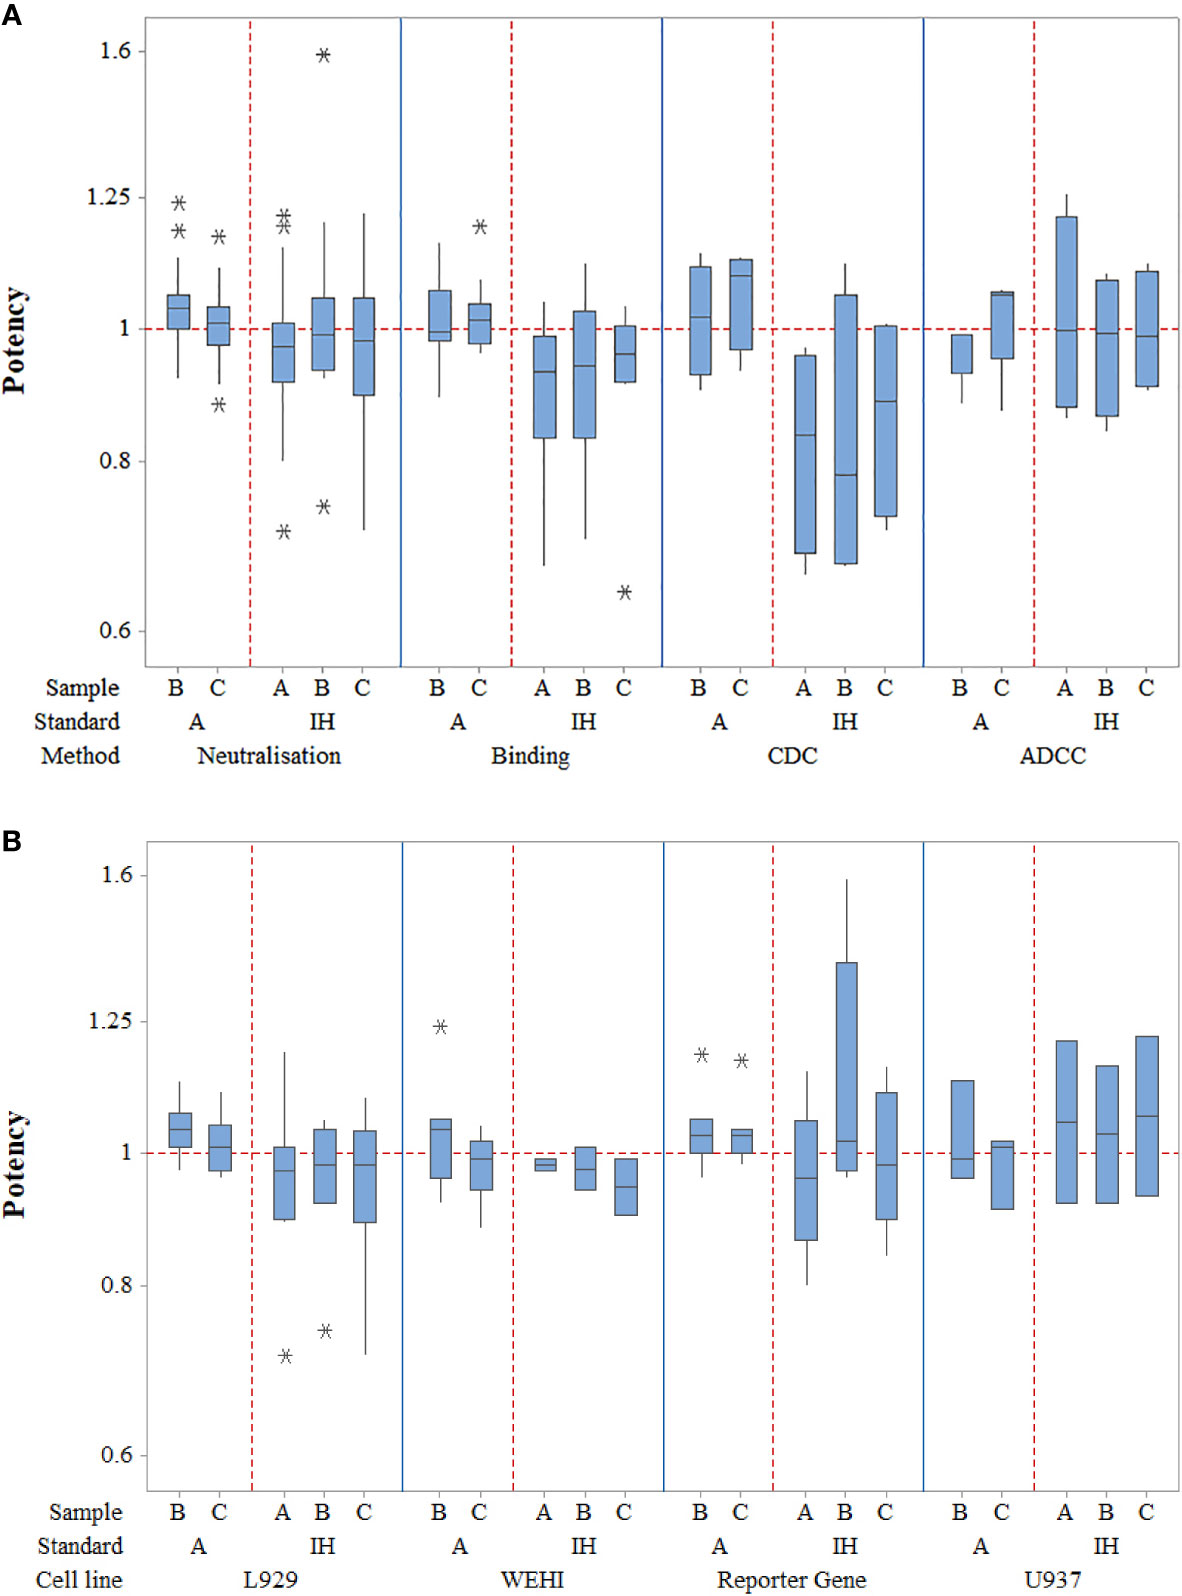
Figure 1 Laboratory geometric mean relative potency estimates for all different assay types (A) as well as for the different TNF-α cell-based neutralization assays (B). Boxes represent the interquartile range and the line shows the median. The bars represent the range and * shows outliers defined as 1.5 times the interquartile range.
In terms of neutralization activity, potency estimates for candidates A and its coded duplicate, C were identical and determined as 0.97 relative to the in-house standards; the inter-laboratory variability, expressed as % geometric coefficient of variation (GCV) was also similar at 14.03 and 13.60 respectively. For sample B, the potency was also very close at 1.01 with a GCV of 17.30%. Use of candidate A as a standard for determining relative potencies gave estimates of 1.04 and 1.01 for B and C, which again were very similar to those seen with in-house standards but the inter-laboratory variability was greatly reduced (6.43% and 5.61% respectively) relative to A in comparison with the higher values (17.30% and 13.60% respectively) for in-house standards. Intra-laboratory variability for the potencies of samples B and C relative to A ranged from 2.27% to 32.02% in neutralization assays, with a median value of 7.83% and the majority (63%) of values were less than 10% (87% less than 20%), demonstrating generally good intermediate precision in participating laboratories (n=26). Overall, the levels of variability in neutralization assays were comparable to those seen in binding assays regardless of the standard used. For binding assays, intra-laboratory GCV values ranged from 0.61% to 32.32% relative to sample A and 4.48% to 28.08% in comparison with in-house standards. Inter-laboratory GCV values for samples B and C were 7.36% and 6.91% versus A and 16.03% and 15.53% respectively versus in-house standards. All neutralization assays were fairly comparable in terms of their GCVs (<11%) when a common standard, A is used; the lowest inter-laboratory variability was observed in the L929 cytotoxicity assay with GCV of 4.33% and 4.67% for B and C relative to candidate A and 12.59% and 14.83% when the in-house standards were used. Since there were fewer valid assays using in-house standards for laboratories undertaking WEHI-164 and U937 assays, improvement of inter-laboratory GCV with use of sample A could not be determined. As for other assays, the inter-laboratory GCV for B and C in reporter gene assays was considerably reduced relative to A in comparison with in-house standards (6.58% and 5.85% vs. 23.30% and 12.65%). Overall, a higher level of inter-laboratory variability for potencies relative to in-house standards compared with potencies relative to A was evident.
Potency estimates using CDC and ADCC assays were consistent with values from neutralization and binding assays. Intra-laboratory variability was noted to be similar for CDC assays (2.71% to 36.07%) with a narrower range of %GCV for ADCC assays (6.9% to 23.84%) and a wider range for binding assays (0.61% to 32.32%) when assessed relative to sample A. However, when in-house standards were used, the intra-lab variability range was wider for ADCC assays compared with other assays. The inter-laboratory variability was higher for CDC as opposed to ADCC or binding assays regardless of the standard.
To conclude, the study data showed that the use of sample A as a reference standard to calculate the relative potency of sample B allowed a close agreement between laboratories for each of the bioactivities tested in comparison with in-house standards.
In laboratories which tested Sample D (n=11) in neutralization assays, the overall GM potency was 0.86 relative to A with a GCV of 9.28%, with potency less than 0.90 in all but two cases (0.94 and 1.07) consistent with the expected theoretical value (Table 6, Supplemental Table 5). Similar observations were noted in binding assays (range 0.77 to 0.94, n=4) and in the ADCC and CDC assays (Supplemental Tables 6 and 7) indicating that the assays where this sample was tested were adequately sensitive in detecting lower activity associated with reduced content.
To assess the inhibitory effect of adalimumab in TNF-α neutralization assays, geometric mean ED50 estimates were derived for each sample (Supplemental Table 8), these values varied between different laboratories and assay methods and no clear relationship with the TNF-α dose was observed. A summary of ED50 estimates for L929 assays from selected laboratories using a fixed TNF-α concentration of 20 IU is given in Table 7; the geometric mean ED50 value was used in the following equation:
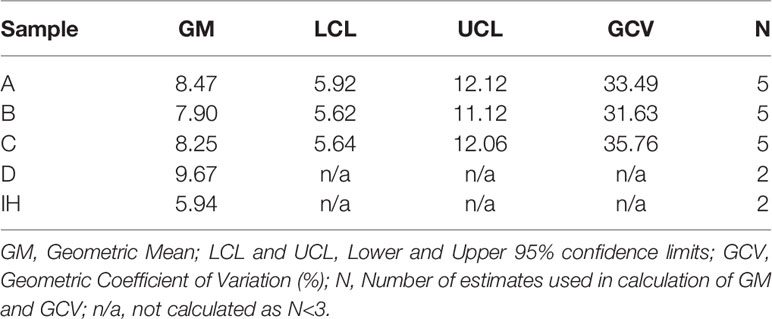
Table 7 Summary of ED50 estimates (ng) for selected L929 neutralization assays using a fixed amount of TNF-α (20IU).
Therefore, based on data from five laboratories (Table 7), 0.085 IU of candidate A, (code 17/236) inhibits the cytotoxic effect of 20 IU of TNF-α IS (code 12/154) in an L929 cytotoxicity assay. The arbitrary unitage of 500 IU for the adalimumab candidate A coded 17/236 was used to derive the inhibitory activity.
ISs are intended to be long-lasting stable preparations suitable for global distribution in their role as ‘higher order’ standards. Formulation and process development is therefore optimized to fulfill this requirement while preserving bioactivity for the standard’s intended use in supporting calibration and/or stability of secondary standards (manufacturer, regional, pharmacopoeia) in use for potency assays for clinical products world-wide. Post-reconstitution studies showed retention of potency after 1 week of storage at either 4˚C or 20˚C or after repeated freeze-thaw cycles (Supplemental Tables 9 and 10). ATD studies over 15 months indicated that the bioactivity of the candidate preparation 17/236 did not deteriorate (Supplemental Table 11) despite storage at elevated temperatures supporting its utility as an IS. With no loss in activity seen at high temperatures, no predicted loss in activity could be calculated. Further real time stability studies will be undertaken to monitor and predict potential loss of activity over time.
A separate study was designed to assess the suitability of a candidate adalimumab preparation to serve as the 1st WHO IS for assays measuring adalimumab levels in the clinical setting. A survey conducted prior to the study informed on dose range, sample dilution and matrix, the standard, quality control (QC) samples of the assays and facilitated study design. Sixteen participants from eight countries, listed in Table 3, representing national control laboratories, contract research organizations, commercial kit manufacturers, academia, hospital laboratories and clinical diagnostic centers contributed data. This data included results from testing of a panel of twenty-four human serum samples spiked with different amounts of adalimumab to assess the suitability of the IS in measuring levels in a serum matrix (i.e. conditions reflecting the clinical scenario) and also for evaluating assay analytical performance in instances where the same assay type/kit was used in multiple laboratories. All participants tested the blind-coded panel along with the candidate preparation, Sample A (Table 4) and the in-house (IH)/kit standard (and QC samples) where available concurrently on the same plate, in three independent assays, as per the study protocol after performing a pilot assay to ensure appropriate assay conditions and optimal dose response curves for assay standards.
A summary of the assay methods used by the study participants, all measuring free adalimumab is given in Table 8. As expected, ELISAs were the predominant assay, performed by twelve participants. A majority of the ELISAs were commercial kits (n=10) but in-house assays were also performed (n=2). ELISA formats varied (53–55). In some cases, other anti-TNF-α therapeutics could also be detected, however, most were specific for adalimumab. Adalimumab was captured either by immobilization of TNF-α or an anti-adalimumab antibody, both used in multiple laboratories and detected using different secondary antibodies which were mainly either anti-adalimumab antibodies or anti-human IgG antibodies. Rapid point-of-care devices based on the lateral flow immunoassay (LFI) technology (56) were used in two laboratories. In these assays, capillary action allows interaction between the adalimumab and TNF-α conjugated to gold colloid. This complex is then captured by immobilized anti-adalimumab antibody providing a visual response and a measurable read-out. ECL assays employing the stable sulfotag label that emits light on voltage stimulation, in an appropriate chemical environment were also used (n=2) though the format varied with one participant adopting the sequential ELISA-like approach (with immobilized TNF-α, followed by sample incubation and finally sulfotag-labeled anti-human IgG kappa light chain for detection) while the other using solution phase (samples were incubated simultaneously with biotin- and sulfotag-labeled TNF-α, transferred onto a streptavidin plate) for detecting antigen-antibody complexes by measuring the ECL signals (57).
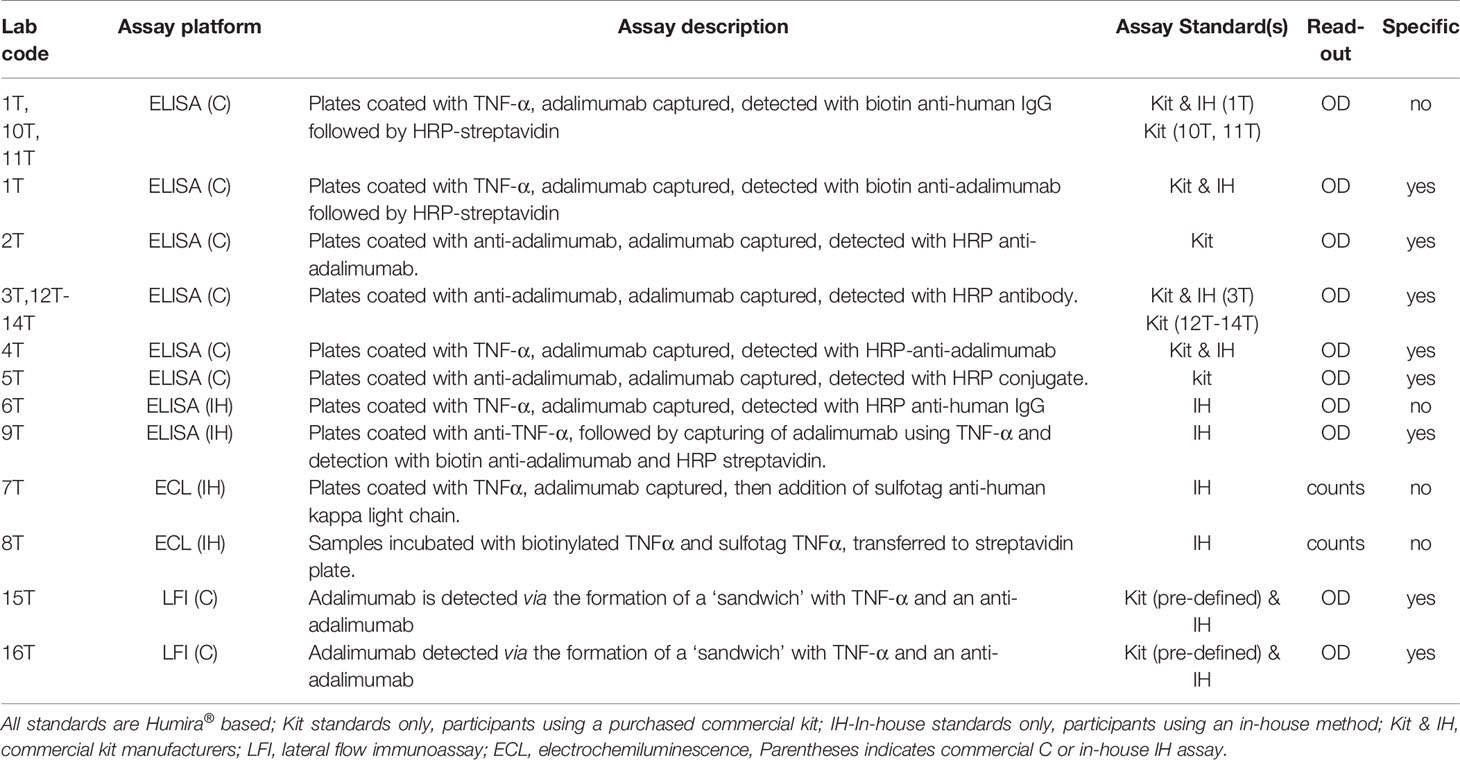
Table 8 Brief details of assays contributed for assessing adalimumab levels.
All study data was reviewed and statistically analyzed at NIBSC using the four-parameter logistic model so a consistent approach could be applied. Results from this analysis indicated that candidate sample A and the kit/in-house standards, which in all cases are essentially a dilution of batches of Humira® in appropriate matrix showed comparable dose-response profiles in all laboratories. The suitability of the candidate standard A in measuring levels in a serum matrix in assays in routine use was assessed by expressing levels of adalimumab (μg/ml) quantified in spiked serum samples relative to sample A or either the kit standards (labs 1Ta, 1Tb, 2T, 3T, 4T, 10T, 12T, 14T) or in-house standards (labs 6T, 7T, 8T, 9T, 15T, 16T) as appropriate. For all calculations using candidate A, a concentration of 50 μg per ampoule was assumed. Data from three laboratories was excluded from the main statistical analysis either due to limited data (only one assay) or for non-adherence to study protocol but all data were incorporated when comparing results from laboratories using the same assay.
A summary of combined geometric mean estimates (μg/ml) for samples S1-S24 spiked with adalimumab and a low concentration of anti-adalimumab (ADA) for samples S21-S24, calculated relative to kit/in-house standards and candidate sample A as standard is shown in Table 9.
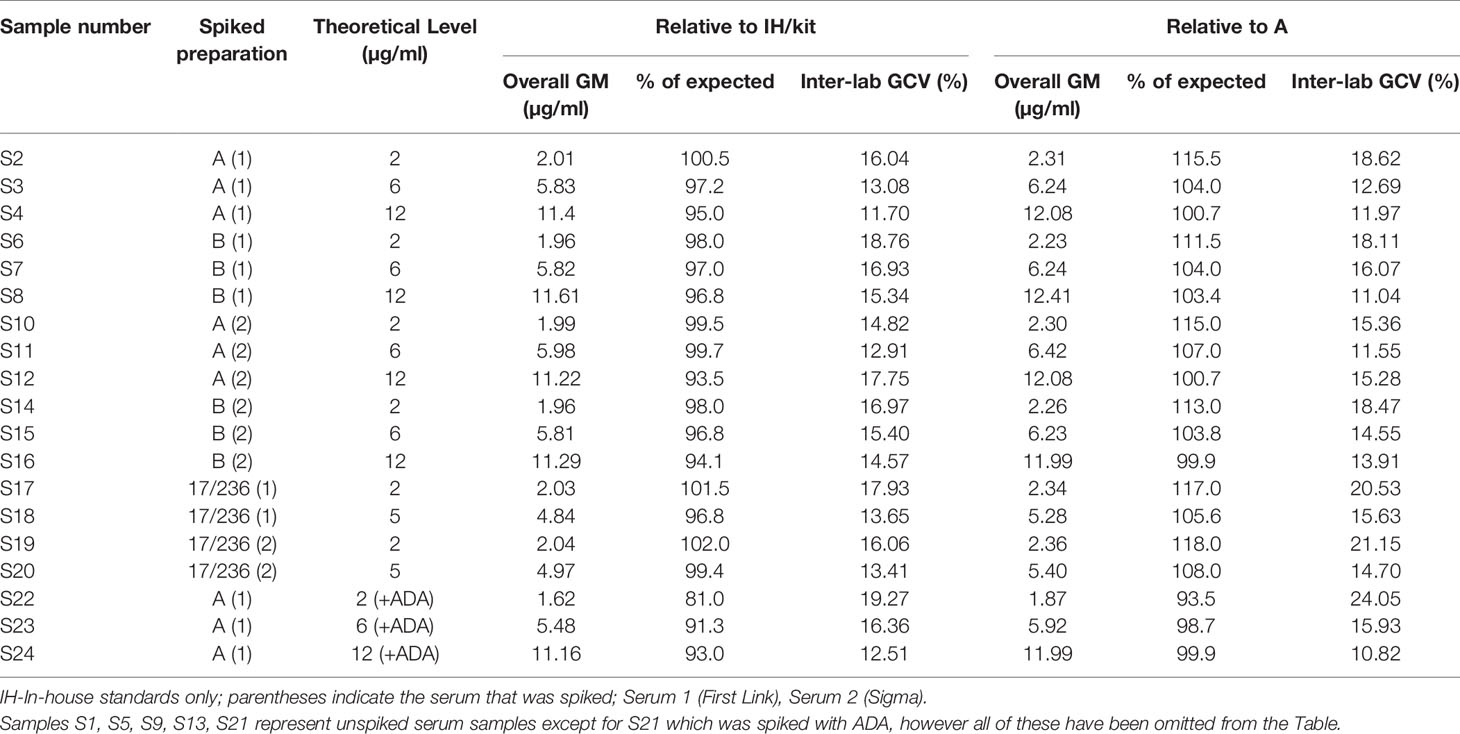
Table 9 Summarized estimates for adalimumab content of spiked serum samples.
Individual laboratory geometric mean estimates (μg/ml) for samples S1-S24, calculated relative to kit/in-house standards and sample A as standard are summarized in Supplemental Tables 12 and 13 respectively and illustrated in Figure 2. Compared with the theoretical levels, experimentally determined adalimumab levels are systematically higher in a majority of samples (except S22-S24) in most laboratories when calculated relative to A and are lower relative to the kit/in-house standard but this is marginal in both instances. Inter-laboratory variability was comparable regardless of the standard used (median GCV is 15.40% with range 11.70% to 19.27%; median GCV is 15.36% with range 10.82% to 24.05%, Table 9) with extreme adalimumab concentrations (2 and 12 μg/ml) showing a large variation. As an example, the estimates for S12 spiked with 12 μg/ml adalimumab ranged from 7.75 to 14.9 μg/ml and 9.06 to 15.2 μg/ml with a GCV of 17.75% and 15.28% relative to kit/in-house standards and sample A respectively.
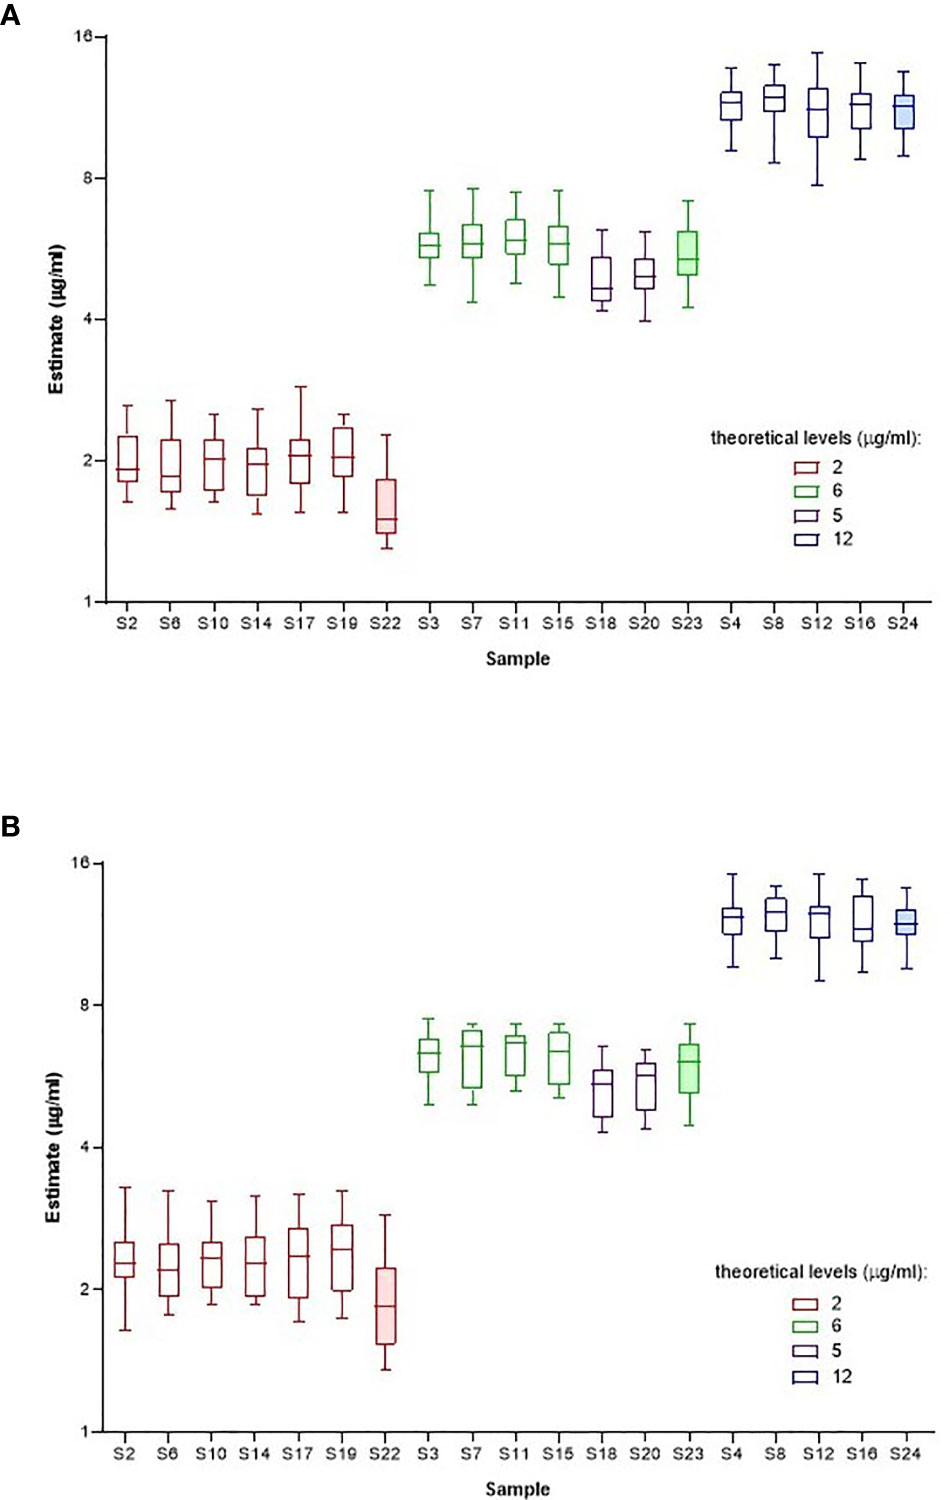
Figure 2 Laboratory geometric mean content estimates (µg/ml) for spiked samples S1-S24 calculated relative to kit or in-house standards (A) and Sample A (B). Boxes represent the interquartile range and the line shows the median. The bars represent the range from the maximum to minimum values.
All study assays were described as detecting only ‘free’ adalimumab. To assess the effect of a low ADA concentration on adalimumab detection, four samples (S21 to S24) containing adalimumab, at 0, 2, 6 or 12 μg/ml were spiked with ADA at 0.5 μg/ml. Although adalimumab levels were slightly reduced in ADA samples compared with similar samples without ADA, the highest impact of ADA was mainly noted at the lowest concentration of adalimumab (2 μg/ml) where the ADA spiked sample showed a decreased adalimumab content relative to counterpart samples devoid of ADA (Figure 2).
The study also provided an opportunity, although very limited, to review the results obtained when different laboratories used the same test kit. In the first case, the data obtained by 3 participants (manufacturer and 2 hospital or clinical diagnostic labs) using a commercial ELISA kit points to differences in results obtained by the kit manufacturer and users. Unlike the manufacturer who reported higher levels relative to candidate A, all determined results for the kit users regardless of the standard were lower than the expected theoretical content. However, both users reported similar levels when using candidate A except at the lowest concentrations of adalimumab (2 μg/ml). In the second case, data from 4 participants using a different commercial ELISA (manufacturer and 3 hospital or clinical diagnostic labs) were examined. Similar results for the spiked samples were seen between the manufacturer and a kit user irrespective of the standard used. These results were also consistent with those obtained by other kit users (only 1 assay performed), except at the lower concentration (2 μg/ml). For samples with higher adalimumab amounts, there was a tendency toward better alignment in estimates seen with other laboratories when candidate A was used.
Concordance in log transformed laboratory geometric mean estimates (μg/ml) for the samples calculated relative to kit/in-house standards or sample A as standard is summarized in Table 10 (values equal to or exceeding 0.90 are shaded). There was generally excellent concordance between laboratories for estimates in spiked serum samples relative to either candidate sample A, the kit standard or in-house reference standards irrespective of the method employed.
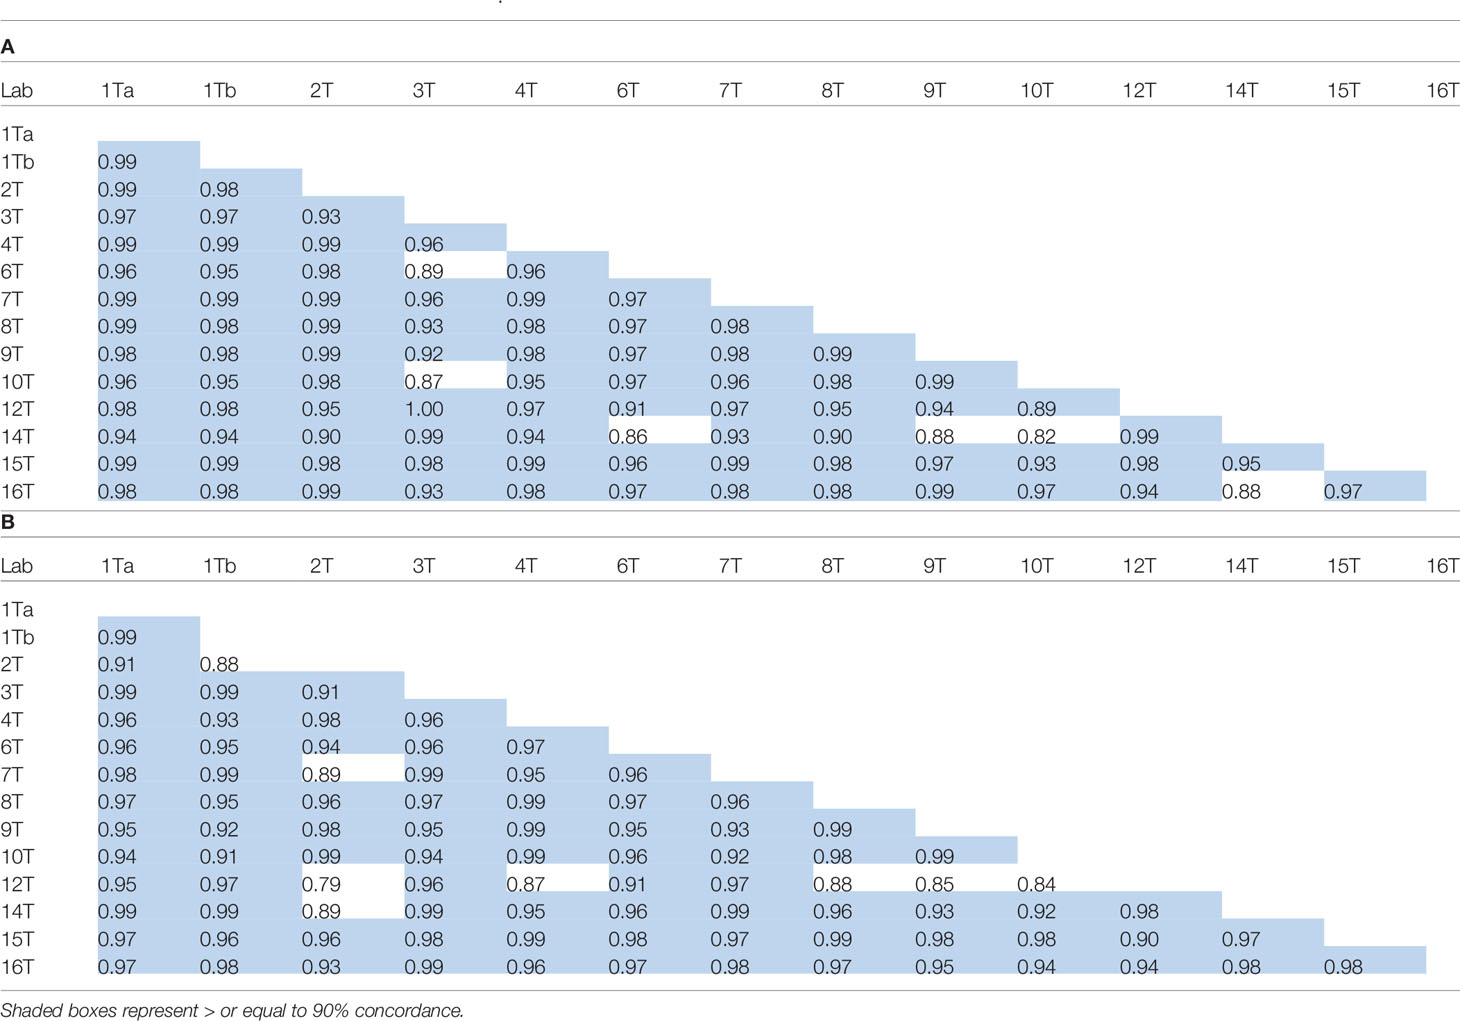
Table 10 Concordance correlation coefficients for log transformed laboratory geometric mean content estimates (μg/ml) of spiked samples S1-S24 calculated relative to kit or in-house standards (A) and Sample A (B).
In most assays, determined levels were quite similar to the theoretical content of the samples except for some variation at the extreme adalimumab concentrations. For ELISAs (n=10), values were generally in good agreement with some notable exceptions. For example, a higher value was consistently determined for all samples containing 12 μg/ml in the ELISA in one laboratory (14T) while the ELISA used in another laboratory (10T) indicated a lower value across all concentrations. In both cases, the estimates were improved relative to A. The two ECL assays showed highly consistent and similar estimates for most samples except for those with 12 μg/ml adalimumab. As point-of-care tests, LFI is rapidly gaining momentum - both laboratories reported results that were very similar and close to the theoretical levels of adalimumab in the spiked serum samples for the two assays but discrepancies were observed in samples with 12 μg/ml; one participant consistently reporting very low levels. While one participant showed comparable results regardless of the standard used for calculating adalimumab levels, the other laboratory showed slightly elevated levels relative to candidate A as opposed to the kit standard. Overall, the comparative evaluation of data by assay types (ELISA n=10, ECL n=2, LFI n=2) showed that the geometric mean content obtained in ELISAs for the spiked samples is similar to levels seen with the other assay types except for LFI at the higher concentration of adalimumab (12 μg/ml). To conclude, the utility of Sample A as the common reference standard for the different platforms can only help toward provision of robust and reproducible results and in aligning and harmonizing adalimumab levels across laboratories using the same or different assays.
With a significant number of biosimilar products available for clinical use in EU, the potential for benefits in terms of patient access and reduced costs continues to increase. However, the fierce competition means that the issue of product sustainability is gaining dominance. As a result, manufacturers, whether originator (reference) or biosimilar, are exploring opportunities to drive product selection and commercialization where possible by developing novel approaches (e.g., injector pens, subcutaneous formulation) that provide added value to the patient/prescriber. This is often in parallel with the inevitable post-authorization manufacturing changes that continue for many products, including monoclonal antibodies with modern quality systems and regulatory oversight ensuring that product quality and clinical performance remain unaffected throughout the product’s lifecycle (58–60). Unlike Remicade® (infliximab) and Humira® where a multitude of post-approval changes including site transfers and scale-ups (58–60) did not alter product quality, shifts in quality attributes, particularly in the glycan profiles which influenced functional activity but did not impact clinically were revealed (following extensive interrogation) in batches of a few originator products e.g., Mabthera® (rituximab), Enbrel® (etanercept) (61). However, in the case of Herceptin® (trastuzumab), the downward drift in the proportion of afucosylated glycans and ADCC was thought to be associated with a reduced event-free survival rate in breast cancer patients (three year follow up of a phase 3 study) in comparison with a biosimilar trastuzumab (62, 63). Such examples of drift are extremely rare but with the emergence of biosimilars, concerns regarding product quality both pre- and post-authorization (with potential for divergence from alignment with the originator product at approval as per the biosimilarity paradigm) with impact on clinical performance have resurfaced (64). Consequently, with the current positioning of 8 adalimumab biosimilars in the EU (and of at least 6 in US following product launch in 2023), mitigating measures to minimize this risk and assure consistency in product quality of both originator and biosimilar products are required. The recent establishment (Oct’19) of the adalimumab IS with defined units for individual bioactivities (binding, TNF-α neutralizing, CDC and ADCC) as described here offers a practical solution toward preserving a reliable link between bioassay data and clinical studies throughout the product’s life-cycle subject to its effective utilization as an important tool by key stakeholders (regulators and pharmaceutical industry) for bioassay calibration and validation and for identifying changes in bioactivity and/or controlling drifts where needed.
Results from the multi-center study involving a plethora of assays reflective of the varied mechanism of action of adalimumab in different inflammatory diseases (65) conclusively indicated that both candidate preparations were biologically active, exhibited comparable behavior as illustrated by similarity in dose-response curves in the different functional assays and were suitable for use as reference standards. These findings were not unexpected given both are lyophilizates of approved originator and biosimilar products and have been extensively assessed in comparability studies for regulatory approval. In this study, data analysis was based on setting of equivalence bounds and consistent criteria were applied to assays from all laboratories to assess their relative performance. We found that a large proportion of participant data was of high quality with validity between 75-85% for the different bioassays despite the stringent validity parameters applied for analysis (based on data from coded duplicates) and showed good intermediate precision which resulted in all participant data contributing to the overall potency estimates.
Product testing for potency evaluation requires inclusion of a product-specific reference standard within the bioassay. Therefore, to control product quality in compliance with regulatory guidance, manufacturers develop and establish extensively characterized in-house reference standard(s) for controlling the quality of their specific product for use in a range of applications including potency testing for lot release, for managing changes (e.g. manufacturing processes, tests) and product stability (66). The bioactivity of such “in house” reference standards can vary and their use in deriving relative potency estimates can result in disparate and highly variable potency estimates for a sample when tested in different assays or laboratories. Indeed, a close examination of the bioassay data revealed that when participants’ in-house standards were used, there was a tendency toward discrepant relative potency estimates for the samples in some laboratories reflecting the diversity and differences between in-house standards. This was broadly seen for the multiple activities tested, both Fab- (e.g., binding, neutralization) and Fc-related (e.g., CDC, ADCC) but was most notable for CDC assays which showed the greatest variability in potency (inter-laboratory GCV of 27.56% and 19.11% for samples B and C respectively) across the four laboratories where tested. The low potency largely confined to two laboratories may potentially be related to differences in the critical quality attributes of the in house standards that preferentially influence CDC as opposed to other bioactivities, i.e., differences in Fc glycan pattern, particularly the terminal galactose content, may affect CDC activity (67–69), although an association with particular assay systems cannot be ruled out. Remarkably, ADCC data was quite consistent and associated with a GCV of <19% for samples A, B and C relative to the in-house standards, similar to data from binding assays.
In contrast to the above, a publicly available common reference standard for potency determination can provide consistent and harmonized potency estimates and reduce inter-laboratory variability. This paradigm was also illustrated here as shown (Table 6) by the excellent agreement in potency estimates for all the tested activities of adalimumab, when the candidate preparation coded 17/236 was used as a common standard despite differences in assay methodologies across participants. A close agreement in potency estimates for TNF binding and neutralization assays, regardless of the method, was also seen in the case of infliximab when a common standard was used (39). In this study, however, this finding was also extended to other in vitro cell-based assays and seems interesting given the complexity of some of these assays. ADCC assays, for example, are highly influenced by the target cell, the effector cell type, the expression of FcγRIIIa receptors, receptor polymorphism, the assay conditions, the readout employed and importantly the glycosylation pattern of the mAb, in particular the degree of afucosylation (50, 52, 62, 69). In this study, three differently engineered target cells (CHO, 3T3 or HEK) expressing membrane bound TNF were used in combination with either engineered Jurkat T cell effectors resulting in a ‘surrogate ADCC assay’ based on effector cell activation or NK cell-lines which promote cellular lysis and provide an end-point killing assay which is considered more physiological and reflects better the mechanism of action of ADCC (70, 71). Interestingly, despite the diversity in the target and effector cells used, the individual potencies in the ADCC assays were quite consistent among laboratories relative to A with values of 0.98 - 0.99 for B (except in one lab with a value of 0.88 and GCV of 18.07%) and 1.04 - 1.07 for C and a GCV of < 25%. Overall, the geometric mean potency estimates from ADCC assays relative to either A or to in-house standards were very close to 1 and very similar to those derived from neutralization assays with low inter-laboratory variability, from 5.44% for B to 9.32% for C, relative to sample A. In fact, sample A reduced the inter-laboratory variability across a range of in vitro bioassays and binding assays. For TNF-α neutralization bioassays which employed the 3rd WHO IS for TNF-α (12/154) as the critical reagent (to reduce assay variability) rather than using differently sourced TNF-α, inter-laboratory GCVs of less than 7% relative to A were easily achievable with slightly larger GCVs of less than 10% in all other assays. Furthermore, Sample D, which contained 20% less adalimumab, showed equivalent lower potency estimates in most of the assays where tested. To conclude, there were improvements in potency values and inter-laboratory variability for potency estimates expressed relative to a common standard, sample A in comparison with the in-house standards.
On the basis of the large data set in this study and the stability of sample A on storage (with no degradation at elevated temperatures over 15 months), the suitability of sample A (coded 17/236) to serve as an IS for bioactivity of adalimumab products was confirmed. Therefore, arbitrary independent units of 500 IU, which are not related to any specific method of determination, were assigned for each of the individual bioactivities (binding, TNF-α neutralizing, CDC and ADCC) ascribed to the adalimumab IS (coded 17/236) consistent with other mAb ISs. This approach in consideration of a strategy for a future replacement standard, would allow assignment of independent units for each activity of the replacement standard (when calibrated against the 1st IS to maintain continuity with the IU) in view of the expected variation in the relative ratio of individual bioactivities of different adalimumab products.
From the perspective of adalimumab therapy, the value of routinely measuring trough drug levels for optimizing clinical efficacy is currently being explored (72, 73). Several factors including ADA formation can contribute to sub-therapeutic serum levels and loss of response in some patients (21, 28). Consensus is emerging that while low dosage/concentration of TNF inhibitors may decrease efficacy and increase the risk of ADA, overtreatment should be avoided given the increased risks of side-effects and the significant costs of the medication (31). Therefore, well-defined therapeutic target ranges are needed to guide effective treatment while allowing dose tapering/intensification or a switch to another product within the same product class or another product class with a different mechanism of action, in instances, where a risk to the patient is perceived (28, 31, 73). In several studies, serum adalimumab levels associated with clinical response/efficacy have been proposed (24–26, 29, 74). For example, in adults with RA, adalimumab trough concentrations of 5-8 mcg/ml are thought to be adequate for response to treatment, higher concentrations providing no additional benefit (30, 31, 74). However, optimal cut-off values still need to be established for the different prescribed indications. Accumulating evidence suggests that TDM improves patient outcomes and is cost-effective for inflammatory bowel diseases such as Crohn’s but this is not the case for other indications (29, 72, 73). Poor study design (e.g. retrospective, small size), selection bias (lack of heterogeneity), lack of standardized treatment, ill-defined timing of blood sampling (confounded by ADA) and importantly, the heterogeneity in the assays used for clinical testing have all contributed to inconclusive data (29, 30, 73). Rheumatologists have stipulated requirements for implementing TDM in clinical practice; reliable methods for quantifying therapeutic and ADA, the need for evidence-based guidelines or algorithms to define various therapeutic options (e.g., predicting responsiveness, failure or dose tapering) and finally, the need for patient-specific dosing schedules for adjusting clinical response (73). In the UK, assessment by NICE has concluded that further research needs to be completed on the clinical effectiveness of using TDM ELISA tests for TNF-alpha inhibitors in RA as there is currently insufficient evidence to recommend routine adoption of these tests (75). A similar stance has been adopted by the British Rheumatology association but paradoxically, in Scotland, a national TDM service for adalimumab and infliximab has been introduced. In another development, the European League Against Rheumatism have set up a taskforce to review the evidence on TDM in RA with support from a recently launched clinical trial with the aim of providing recommendations or advice to clinicians (76).
Most commercial kits for quantitation of adalimumab are ELISA-based although point-of-care testing kits (LFI) which are rapid and offer a distinct advantage over other methods have also become available and could be integrated into routine clinical practice (77). However, novel quantitative approaches are also being explored in several laboratories (78, 79). A recently published comparative assessment of the performance of three adalimumab ELISAs and one LFI concluded that the LFI is a reliable alternative to ELISA, and further indicated that some assays systematically measure higher/lower values than others, such differences most likely attributed to variation in ELISA reagents and/or protocols e.g. differences in diluent, in dilution practices and in detection reagents (56). Other publications assessing commercial or in-house adalimumab assays demonstrated good linear correlations between the various assays for recovery and quantitation of adalimumab (50, 80–82). However, the absolute drug concentrations in the analyzed clinical samples (or spiked serum samples) were variable (52, 80–82) and not always interchangeable emphasizing the need to use the same assay to follow patients longitudinally in clinical practice in the absence of a common standard and urging caution when comparing study results from different kits. This conclusion was also drawn in two recent studies comparing commercial assays for measurement of infliximab (all ELISAs) and adalimumab (one LFI, two ELISAs) trough levels. In the infliximab case, despite an excellent correlation of infliximab levels between assays, a substantial variation in some results and systematic biases of infliximab trough levels was noted which could result in divergent therapeutic decisions for some patients (83). Similarly, in the comparative study measuring adalimumab levels in patient sera, a lack of interchangeability between methods was observed, with greater differences noted as ADA levels increased (84). This disagreement in results, evident also in other studies, has led to calls from several groups for the need for standardization of assays for detection of levels of anti-TNFs and ADA in clinical samples (32, 33, 73).
The suitability of the candidate, sample A as reference standard for assays in use for clinical monitoring of adalimumab levels was therefore assessed using some of the above-mentioned methods. Serum samples were spiked with adalimumab preparations (A, B) and levels quantified relative to the assay’s standard or to sample A with the intention of measuring levels in a serum matrix to evaluate assay analytical performance in conditions reflecting the clinical scenario. This also allowed us to assess whether candidate A when used as a common standard would harmonize levels and improve inter-laboratory variability. Overall, the adalimumab content in the spiked serum samples was found to be mostly comparable and consistent with the theoretical content. Some variability in results between laboratories/assays was observed, which was expected as the methodologies used in the study are diverse. However, inter-laboratory assay variability was also comparable regardless of the standard used. Evaluation of correlation coefficients showed excellent inter-laboratory concordance for the spiked samples (equal to or > 0.90 in most laboratories) regardless of the standard or the method employed. Such concordance was also seen when the same ELISA was used in different laboratories e.g., ELISA manufacturer and different users, although some unexpected variability was observed in one of the two instances where the same assay was performed by different users, implicating either batch differences in kit standard and/or analyst-dependent assay discrepancies. All study assays were described as detecting only “free” adalimumab and consistent with this; slightly lower levels of adalimumab were seen in samples spiked with both ADA and adalimumab (at 2μg/ml) relative to their counterpart samples.
Despite the caveat that only a limited number of assay systems were evaluated in the present study, it is evident from the study data that the candidate preparation 17/236 is suitable for use in the tested assay systems and, therefore, can be used for assuring the analytical performance of the different bioanalytical tests available in clinical laboratories and for qualification of in house standards based on the assumed mass content of the ampoule. As TDM relies on accurate quantification of the therapeutic, the use of the 1st WHO IS for adalimumab would allow comparisons of results across different immunoassays/platforms and enable further research, where possible on clinical effectiveness of TDM tests in various indications. Additionally, a common standard will facilitate standardization and harmonization of clinical monitoring assays and, in turn, improve treatment strategies for patients thus fulfilling the demand from clinicians and healthcare organizations (32, 33, 73).
In the long-term, standardization of ADA assays for adalimumab is also anticipated. NIBSC has initiated development of reference antibody/panels for standardizing ADA assays for several therapeutics (e.g., infliximab, adalimumab, rituximab) as part of a WHO program on developing standards for immunogenicity assays for biotherapeutics (85). The 1st reference panel of human antibodies against erythropoietin, established by the WHO is currently available from NIBSC (86). Presently, efforts are underway for standardizing infliximab ADA assays (subject to a successful collaborative study and establishment by WHO of the reference antibody/panel) and will be followed soon after by adalimumab ADA assays. It is anticipated that the reference antibody/panels would help in selection of suitable assays, benchmarking of in-house positive controls/standards where appropriate, facilitate pharmacovigilance and assist in harmonizing and validating ADA detection assays which would be beneficial for TDM practice (87, 88).
To summarize, the recent establishment of the WHO IS for adalimumab based on the results of the international collaborative study allows it to be effectively used by stakeholders world-wide in several ways to promote not only product quality but also clinical monitoring in adalimumab treated patients. In its role as a publicly available ‘primary’ standard supporting bioassay performance with 500 IU each for its individual bioactivities (binding, TNF-a neutralizing, CDC and ADCC), the IS will firstly facilitate calibration of secondary standards (manufacturer’s, regional) with traceability to IU and serve as a stability monitoring tool for these local standards. This will help in supporting development of products of consistent quality pre- and post-marketing globally as illustrated in Figure 3 which shows comparative data of TNF-alpha neutralization activity of the IS 17/236 with marketed adalimumab products; 2 biosimilar products and the originator product in a HEK Blue CD40L reporter gene assay. Secondly, based on its proven ability to harmonize potency values between laboratories, the IS will serve as a ‘benchmark’ for harmonizing bioactivity across products and increase confidence in the rapidly expanding biosimilar market. Thirdly, the IS can be successfully exploited as an important tool in identifying changes in bioactivity and potentially controlling drifts where needed during the life-cycle management of both innovator and biosimilar products. This will assist in harmonizing bioactivity across different products over time and also assure more confidence in the rapidly expanding landscape of biosimilar products. Lastly, the IS can support independent potency testing as required in investigations relating to falsified medicines and post-marketing surveillance activities where necessary. It should be realized that the adalimumab IS with some features in common with other mAb ISs, is a distinct and separate entity from the reference medicinal product (used for biosimilarity determinations) and should not be misused as a reference medicinal product for determining biosimilarity or to define product specific activity or to change current dosing (in mass units) or revise product labeling (36, 38, 39, 89).
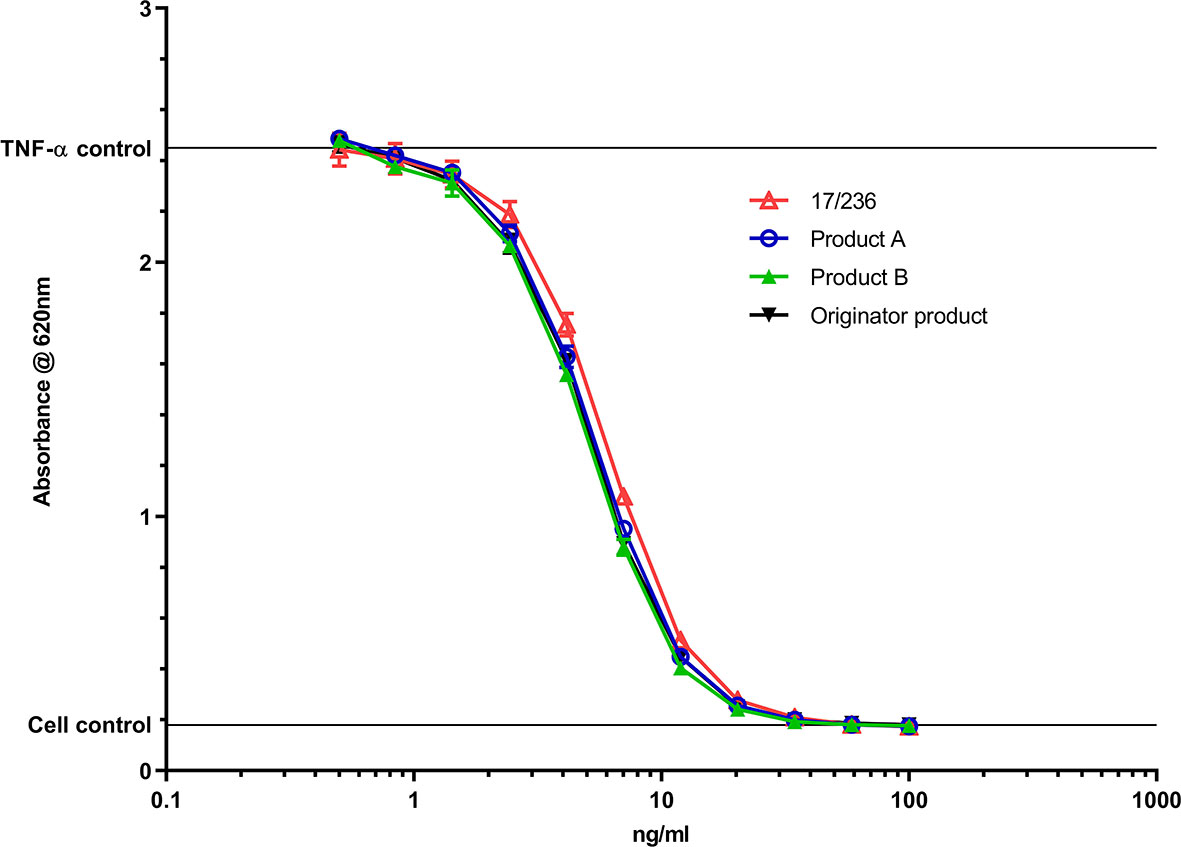
Figure 3 Comparison of TNF-α neutralization activity of the IS 17/236 with 2 biosimilar adalimumab products (a single batch) and the originator product in a HEK Blue CD40L reporter gene assay. Product A – Hulio®; Product B – Hyrimoz®. A fixed concentration of 40IU/ml of TNF-α IS (12/154) was used in the assay.
From the perspective of clinical monitoring, the mass units of the adalimumab IS will allow calibration of secondary (manufacturer-specific) standards in assays routinely used for quantitating adalimumab in the clinical setting, encourage development of innovative and effective assay systems and assist in assuring analytical assay performance and validation where needed. Importantly, the common standard will facilitate harmonization of clinical assays and assist in formulating treatment algorithms for informed clinical decision-making for better patient outcomes.
To conclude, it is anticipated that the WHO IS will have a significant impact in creating safe and effective adalimumab products of consistent quality, in building more confidence in their prescribing and uptake while enabling progress toward personalized treatment options and effective disease management for realization of full patient benefit.
The original contributions presented in the study are included in the article/Supplementary Material. Further inquiries can be directed to the corresponding author.
All authors listed have made a substantial, direct, and intellectual contribution to the work and approved it for publication.
This paper is based on independent research commissioned and funded by the National Institute for Health Research (NIHR) Policy Research Program (NIBSC Regulatory Science Research Unit), UK. The views expressed in the publication are those of the author(s) and not necessarily those of the NHS, the NIHR, the Department of Health, ‘arms’ length bodies or other government departments.
The authors declare that the research was conducted in the absence of any commercial or financial relationships that could be constructed as a potential conflict of interest.
We are very grateful to Abbvie, USA, and Samsung Bioepis, Korea for their kind donations of adalimumab for use as candidate materials and to the participating laboratories for their relentless support and willingness in performing the laboratory tests within the strict study timelines and for their helpful comments and discussions. We are also grateful to Paul Matejtschuk and Kiran Malik (Analytical and Biological Sciences division, NIBSC) for their enormous contribution toward selection of suitable formulation and lyophilization conditions and staff in the Standards Processing Division for their excellent support and service in preparing the candidate materials and for dispatching the study samples. We are greatly indebted to our participants and thank them enormously as without their contribution, the development of the IS would have been impossible to achieve.
The Supplementary Material for this article can be found online at: https://www.frontiersin.org/articles/10.3389/fimmu.2021.636420/full#supplementary-material
1. Frenzel A, Schirrmann T, Hust M. Phage display-derived human antibodies in clinical development and therapy. MAbs (2016) 8(7):1177–94. doi: 10.1080/19420862.2016.1212149
2. Marušič M, Klemenčič A. Adalimumab – General considerations. J Pharmacol Clin Toxicol (2018) 6(2):1104–11.
3. Humira European Public Assessment Report (EPAR), European Medicines Agency. Available at: https://www.ema.europa.eu/en/medicines/human/EPAR/humira (Accessed 11thNov’20).
4. Kronthaler U, Fritsch C, Hainzl O, Seidl A, da Silva A. Comparative functional and pharmacological characterization of Sandoz proposed biosimilar adalimumab (GP2017): rationale for extrapolation across indications. Expert Opin Biol Ther (2018) 18(8):921–30. doi: 10.1080/14712598.2018.1495193
5. Mahase E. Covid-19: Anti-TNF drug adalimumab to be trialled for patients in the community. BMJ (2020) 371:m3847. doi: 10.1136/bmj.m3847
6. Robinson PC, Richards D, Tanner HL, Feldmann M. Accumulating evidence suggests anti-TNF therapy needs to be given trial priority in COVID-19 treatment. Lancet Rheumatol (2020) 2(11):E653–655. doi: 10.1016/S2665-9913(20)30309-X
7. Lee JJ, Yang J, Lee C, Moon Y, Ahn S, Yang J. Demonstration of functional similarity of a biosimilar adalimumab SB5 to Humira(®). Biologicals (2019) 58:7–15. doi: 10.1016/j.biologicals.2018.12.002
8. Urquhart L. Top companies and drugs by sales in 2019. Nat Rev Drug Discov (2020) 19(4):228. doi: 10.1038/d41573-020-00047-7
9. Cohen S, Genovese MC, Choy E, Perez-Ruiz F, Matsumoto A, Pavelka K, et al. Efficacy and safety of the biosimilar ABP 501 compared with adalimumab in patients with moderate to severe rheumatoid arthritis: a randomised, double-blind, phase III equivalence study. Ann Rheum Dis (2017) 7 6(10):1679–87. doi: 10.1136/annrheumdis-2016-210459
10. Lee N, Lee JJ, Yang H, Baek S, Kim S, Kim S, et al. Evaluation of similar quality attribute characteristics in SB5 and reference product of adalimumab. MAbs (2019) 11(1):129–44. doi: 10.1080/19420862.2018.1530920
11. FDA website. Available at: https://www.fda.gov/drugs/biosimilars/biosimilar-product-information (Accessed 11th Nov’20).
12. EMA website. Available at: https://www.ema.europa.eu/en/human-regulatory/overview/biosimilar-medicines-overview (Accessed 11th Nov’20).
13. Gellad WF, Good CB. Adalimumab and the Challenges for Biosimilars. JAMA (2019) 322(22):2171–2. doi: 10.1001/jama.2019.16275
14. Jensen TB, Kim SC, Jimenez-Solem E, Bartels D, Christensen R, Andersen JT. Shift from Adalimumab Originator to Biosimilars in Denmark. JAMA Internal Med (2020) 180(6):902–3. doi: 10.1001/jamainternmed.2020.0338
15. NHS England website. Available at: https://www.england.nhs.uk/2018/10/nhs-set-to-save-150-million-by-switching-to-new-versions-of-most-costly-drug/ (Accessed 11th Nov’20).
16. European Medicines Agency. Guideline on similar biological medicinal products containing monoclonal antibodies – non-clinical and clinical issues (2015). EMEA/CHMP/BMWP/42832/2005 Rev. 1. Available at: https://www.ema.europa.eu/en/similar-biological-medicinal-products-containing-biotechnology-derived-proteins-active-substance-non (Accessed 11th Nov’20).
17. European Medicines Agency. Guideline on similar biological medicinal products containing biotechnology-derived proteins as active substance: quality issues (revision 1) (2014). Available at: https://www.ema.europa.eu/en/similar-biological-medicinal-products-containing-biotechnology-derived-proteins-active-substance (Accessed 11th Nov’20). CHMP/BWP/247713/2012.
18. Wolff-Holz E, Tiitso K, Vleminckx C, Weise M. Evolution of the EU Biosimilar Framework: Past and Future. BioDrugs (2019) 33(6):621–34. doi: 10.1007/s40259-019-00377-y
19. Kurki P, van Aerts L, Wolff-Holz E, Giezen T, Skibeli V, Weise M. Interchangeability of Biosimilars: A European Perspective. BioDrugs (2017) 31(2):83–91. doi: 10.1007/s40259-017-0210-0
20. Murdaca G, Spanò F, Contatore M, Guastalla A, Penza E, Magnani O, et al. Immunogenicity of infliximab and adalimumab: what is its role in hypersensitivity and modulation of therapeutic efficacy and safety? Expert Opin Drug Saf (2016) 15:43–52. doi: 10.1517/14740338.2016.1112375
21. Bartelds GM, Krieckaert CL, Nurmohamed MT, van Schouwenburg PA, Lems WF, Twisk JW, et al. Development of antidrug antibodies against adalimumab and association with disease activity and treatment failure during long-term follow-up. JAMA (2011) 305(14):1460–8. doi: 10.1001/jama.2011.406
22. Roda G, Jharap B, Neeraj N, Colombel JF. Loss of Response to Anti-TNFs: Definition, Epidemiology, and Management. Clin Transl Gastroenterol (2016) 7:e135. doi: 10.1038/ctg.2015.63
23. Mitrev N, Van de Casteele N, Seow CH, Andrews JM, Connor SJ, Moore GT, et al. Consensus statements on therapeutic drug monitoring of anti-tumour necrosis factor therapy in inflammatory bowel diseases. Aliment Pharmacol Ther (2017) 46(11-12):1037–53. doi: 10.1111/apt.14368
24. Gonczi L, Kurti Z, Rutka M, Vegh Z, Farkas K, Lovasz BD, et al. Drug persistence and need for dose intensification to adalimumab therapy; the importance of therapeutic drug monitoring in inflammatory bowel diseases. Gastroenterology (2017) 17(1):97. doi: 10.1186/s12876-017-0654-1
25. Carlsen A, Omdal R, Leitao KO, Isaksen K, Hetta AK, Karlsen L, et al. Subtherapeutic concentrations of infliximab and adalimumab are associated with increased disease activity in Crohn’s disease. Therap Adv Gastroenterol (2018) 11:1–11. doi: 10.1177/1756284818759930
26. Wilkinson N, Tsakok T, Dand N, Bloem K, Duckworth M, Baudry D, et al. Defining the Therapeutic Range for Adalimumab and Predicting Response in Psoriasis: A Multicentre Prospective Observational Cohort Study. Invest Dermatol (2019) 139(1):115–23. doi: 10.1016/j.jid.2018.07.028
27. Feuerstein JD, Nguyen GC, Kupfer SS, Falck-Ytter Y, Singh S. American Gastro-enterological Association Institute Clinical Guidelines Committee. American Gastroenterological Association Institute Guideline on Therapeutic Drug Monitoring in Inflammatory Bowel Disease. Gastroenterology (2017) 153(3):827–34. doi: 10.1053/j.gastro.2017.07.032
28. Dreesen E, Bossuyt P, Mulleman D, Gils A, Pascal-Salcedo D. Practical recommendations for the use of therapeutic drug monitoring of biopharmaceuticals in inflammatory diseases. Clin Pharmacol (2017) 9:101–11. doi: 10.2147/CPAA.S138414. eCollection2017
29. Steenholdt C, Brynskov J, Thomsen OØ, Munck LK, Fallingborg J, Christensen LA. Pedersen G, et al. Individualised therapy is more cost-effective than dose intensification in patients with Crohn’s disease who lose response to anti-TNF treatment: a randomised, controlled trial. Gut (2014) 63:919–27. doi: 10.1136/gutjnl-2013-305279
30. l’Ami MJ, Krieckaert CL Nurmohamed MT, van Vollenhoven RF, Rispens T, Boers M, Wolbink GJ. Successful reduction of overexposure in patients with rheumatoid arthritis with high serum adalimumab concentrations: an open-label, non-inferiority, randomised clinical trial. Ann Rheum Dis (2018) 77(4):484–7. doi: 10.1136/annrheumdis-2017-211781
31. Mulleman D, Balsa A. Adalimumab concentration-based tapering strategy: as good as the recommended dosage. Ann Rheum Dis (2018) 77(4):473–5. doi: 10.1136/annrheumdis-2017-212376
32. Kalden JR, Schulze-Koops H. Immunogenicity and loss of response to TNF inhibitors: implications for rheumatoid arthritis treatment. Nat Rev Rheumatol (2017) 13(12):707–18. doi: 10.1038/nrrheum.2017.187
33. National Institute for Health and Care Excellence. Diagnostics guidance [DG22]: Therapeutic monitoring of TNF-alpha inhibitors in Crohn’s disease (LISA-TRACKER ELISA kits, IDKmonitor ELISA kits, and Promonitor ELISA kits) (2016). Available at: https://www.nice.org.uk/guidance/dg22 (Accessed 11th Nov’20).
34. WHO Expert Committee on Biological Standardization. Sixtieth report. Guidelines on evaluation of similar biotherapeutic products (SBPs). WHO Tech Rep Ser (2009) 977:Annex2. https://www.who.int/biologicals/biotherapeutics/similar_biotherapeutic_products/en/.
35. WHO Expert Committee on Biological Standardization. Sixty sixth report. WHO Guidelines on evaluation of monoclonal antibodies as SBPs. WHO Tech Rep Ser (2016) 1004:Annex 2.
36. WHO Expert Committee on Biological Standardization. Sixty sixth report. Report of a WHO informal consultation on international standards for biotherapeutic products. WHO Tech Rep Ser (2016) 999:13–5.
37. Mysler E, Pineda C, Horiuchi T, Singh E, Mahgoub E, Coindreau J, et al. Clinical and regulatory perspectives on biosimilar therapies and intended copies of biologics in rheumatology. Rheumatol Int (2016) 36(5):613–25. doi: 10.1007/s00296-016-3444-0
38. Prior S, Hufton SE, Fox B, Dougall T, Rigsby P, Bristow A, et al. International standards for monoclonal antibodies to support pre- and post-marketing product consistency: Evaluation of a candidate International Standard for the bioactivities of rituximab. MAbs (2018) 10(1):129–42. doi: 10.1080/19420862.2017.1386824
39. Metcalfe C, Dougall T, Bird C, Rigsby P, Behr-Gross ME, Wadhwa M, et al. The first World Health Organization International Standard for infliximab products: A step towards maintaining harmonized biological activity. MAbs (2019) 11(1):13–25. doi: 10.1080/19420862.2018.1532766
40. WHO Expert Committee on Biological Standardization. Recommendations for the preparation, characterization and establishment of international and other biological reference standards. WHO Tech Rep Ser (2006) 932:73–130.
41. R Core Team. R: A language and environment for statistical computing. Vienna, Austria: R Foundation for Statistical Computing (2018). Available at: https://www.R-project.org.
42. Ritz C, Baty F, Streibig JC, Gerhard D. Dose-Response Analysis Using R. PloS One (2015) 10(12):e0146021. doi: 10.1371/journal.pone.0146021
43. Lin L. A concordance correlation coefficient to evaluate reproducibility. Biometrics (1989) 45:255–68. doi: 10.2307/2532051
44. Lin L. A note on the concordance correlation coefficient. Biometrics (2000) 56:324– 325. doi: 10.1111/j.0006-341X.2000.00324.x
45. Kirkwood TB. Predicting the stability of biological standards and products. Biometrics (1977) 33(4):736–42. doi: 10.2307/2529472
46. Wadhwa M, Bird C, Dilger P, Rigsby P, Jia H, Gross ME, et al. Establishment of the first WHO International Standard for etanercept, a TNF receptor II Fc fusion protein: Report of an international collaborative study. J Immunol Methods (2017) 447:14–22. doi: 10.1016/j.jim.2017.03.007
47. Meager A, Leung H, Woolley J. Assays for tumour necrosis factor and related cytokines. J Immunol Methods (1989) 116:1–17. doi: 10.1016/0022-1759(89)90306-2
48. Khabar KS, Siddiqui S, Armstrong JA. WEHI-13VAR: a stable and sensitive variant of WEHI 164 clone 13 fibrosarcoma for tumor necrosis factor bioassay. Immunol Lett (1995) 46:107–10. doi: 10.1016/0165-2478(95)00026-2
49. Minafra L, Di Cara G, Albanese NN, Cancemi P. Proteomic differentiation pattern in the U937 cell line. Leuk Res (2011) 35:226–36. doi: 10.1016/j.leukres.2010.07.040
50. Mitoma H, Horiuchi T, Tsukamoto H, Tamimoto Y, Kimoto Y, Uchino A, et al. Mechanisms for cytotoxic effects of anti-tumor necrosis factor agents on transmembrane tumor necrosis factor alpha-expressing cells: comparison among infliximab, etanercept, and adalimumab. Arthritis Rheumatol (2008) 58:1248–57. doi: 10.1002/art.23447
51. Kornbluth J, Flomenberg N, Dupont B. Cell surface phenotype of a cloned line of human natural killer cells. J Immunol (1982) 129(6):2831–7.
52. Cheng ZJ, Garvin D, Paguio A, Moravec R, Engel L, Fan F, et al. Development of a robust reporter-based ADCC assay with frozen, thaw-and-use cells to measure Fc effector function of therapeutic antibodies. J Immunol Methods (2014) 414:69–81. doi: 10.1016/j.jim.2014.07.010
53. Desvignes C, Edupuganti SR, Darrouzain F, Duveau AC, Loercher A, Paintaud G, et al. Development and validation of an enzyme-linked immunosorbent assay to measure adalimumab concentration. Bioanalysis (2015) 7(10):1253–60. doi: 10.4155/bio.15.30
54. van Bezooijen JS, Koch BCP, van Doorn MBA, Prens EP, van Gelder T, Schreurs MWJ. Comparison of Three Assays to Quantify Infliximab, Adalimumab, and Etanercept Serum Concentrations. Ther Drug Monit (2016) 38(4):432–8. doi: 10.1097/FTD.0000000000000310
55. Ogrič M, Žigon P, Drobne D, Štabuc B, Sodin-Semrl S, Čučnik S, et al. Routinely utilized in-house assays for infliximab, adalimumab and their anti-drug antibody levels. Immunol Res (2018) 66(6):726–36. doi: 10.1007/s12026-018-9050-3
56. Rocha C, Afonso J, Lago P, Arroja B, Vieira AI, Dias CC, et al. Accuracy of the new rapid test for monitoring adalimumab levels. Therap Adv Gastroenterol (2019) 12:1–11. doi: 10.1177/1756284819828238
57. Cludts I, Spinelli FR, Morello F, Hockley J, Valesini G, Wadhwa M. Anti-therapeutic antibodies and their clinical impact in patients treated with the TNF antagonist adalimumab. Cytokine (2017) 96:16–23. doi: 10.1016/j.cyto.2017.02.015
58. Schneider CK. Biosimilars in rheumatology: the wind of change. Ann Rheumatol Dis (2013) 72:315–8. doi: 10.1136/annrheumdis-2012-202941
59. Vezér B, Buzás Z, Sebeszta M, Zrubka Z. Authorized manufacturing changes for therapeutic monoclonal antibodies (mAbs) in European Public Assessment Report (EPAR) documents. Curr Med Res Opin (2016) 32(5):829–34. doi: 10.1185/03007995.2016
60. Tebbey PW, Varga A, Naill M, Clewell J, Venema J. Consistency of quality attributes for the glycosylated monoclonal antibody Humira® (adalimumab). MAbs (2015) 7(5):805–11. doi: 10.1080/19420862.2015.1073429
61. Schiestl M, Stangler T, Torella C, Cepeljnik T, Toll H, Grau R. Acceptable changes in quality attributes of glycosylated biopharmaceuticals. Nat Biotechnol (2011) 29:310–2. doi: 10.1038/nbt.1839
62. Kim S, Song J, Park S, Ham S, Paek K, Kang M, et al. Drifts in ADCC-related quality attributes of Herceptin®: Impact on development of a trastuzumab biosimilar. MAbs (2017) 9:704–14. doi: 10.1080/19420862.2017.1305530
63. Pivot X, Pegram M, Cortes J, Lüftner D, Lyman GH, Curigliano G, et al. Three-year follow-up from a phase 3 study of SB3 (a trastuzumab biosimilar) versus reference trastuzumab in the neoadjuvant setting for human epidermal growth factor receptor 2-positive breast cancer. Eur J Cancer (2019) 120:1–9. doi: 10.1016/j.ejca.2019.07.015
64. Ramana S, Grampp G. Drift, evolution, and divergence in biologics and biosimilars manufacturing. BioDrugs (2014) 28(4):363–72. doi: 10.1007/s40259-014-0088-z
65. Billmeier U, Dieterich W, Neurath MF, Atreya R. Molecular mechanism of action of anti-tumor necrosis factor antibodies in inflammatory bowel diseases. World J Gastroenterol (2016) 22(42):9300–13. doi: 10.3748/wjg.v22.i42.9300
66. Lamanna WC, Holzmann J, HP C, Guo X, Schweigler M, Stangler T, et al. Maintaining consistent quality and clinical performance of biopharmaceuticals. Expert Opin Biol Ther (2018) 18(4):369–79. doi: 10.1080/14712598.2018.1421169
67. Peschke B, Keller CW, Weber P, Quast I, Lünemann JD. Fc-Galactosylation of Human Immunoglobulin Gamma Isotypes Improves C1q Binding and Enhances Complement-Dependent Cytotoxicity. Front Immunol (2017) 8:646. doi: 10.3389/fimmu.2017.00646
68. Reusch D, Tejada ML. Fc glycans of therapeutic antibodies as critical quality attributes. Glycobiology (2015) 25(12):1325–34. doi: 10.1093/glycob/cwv065
69. Jefferis R. Recombinant antibody therapeutics: the impact of glycosylation on mechanisms of action. Trends Pharmacol Sci (2009) 30(7):356–62. doi: 10.1016/j.tips.2009.04.007
70. Gurjar SA, Derrick JP, Dearman RJ, Thorpe R, Hufton S, Kimber I, et al. Surrogate CD16-expressing effector cell lines for determining the bioactivity of therapeutic monoclonal antibodies. J Pharm BioMed Anal (2017) 143:188–98. doi: 10.1016/j.jpba.2017.06.004
71. Hsieh YT, Aggarwal P, Cirelli D, Gu L, Surowy T, Mozier NM. Characterization of FcγRIIIA effector cells used in in vitro ADCC bioassay: Comparison of primary NK cells with engineered NK-92 and Jurkat T cells. J Immunol Methods (2017) 441:56–66. doi: 10.1016/j.jim.2016.12.002
72. Sparrow MP, Papamichael K, Ward MG, Riviere P, Laharie D, Paul S, et al. Therapeutic Drug Monitoring of Biologics During Induction to Prevent Primary Non-Response. J Crohns Colitis (2020) 14(4):542–56. doi: 10.1093/ecco-jcc/jjz162
73. Mehta P, Manson JJ. What is the clinical relevance of TNF Inhibitor immunogenicity in the management of patients with rheumatoid arthritis? Front Immunol (2020) 11:589. doi: 10.3389/fimmu.2020.00589
74. Pouw MF, Krieckaert C, Nurmohamed MT, van der Kleij D, Aarden L, Rispens T, et al. Key findings towards optimising adalimumab treatment: the concentration–effect curve. Ann Rheum Dis (2015) 74:513–8. doi: 10.1136/annrheumdis-2013-204172
75. National Institute for Health and Care Excellence. Diagnostics guidance [DG36], in: Therapeutic monitoring of TNF-alpha inhibitors in rheumatoid arthritis (2019). Available at: https://www.nice.org.uk/guidance/dg36 (Accessed 11th Nov’20).
76. Perry M, Abdullah A, Frleta M, MacDonald J, McGucken A. The potential value of blood monitoring of biologic drugs used in the treatment of rheumatoid arthritis. Ther Adv Musculoskelet Dis (2020) 12:1759720X20904850. doi: 10.1177/1759720X20904850
77. Cherry M, Dutzer D, Nasser Y, Berger AE, Roblin X, Paul S. Point-of-Care Assays Could Be Useful for Therapeutic Drug Monitoring of IBD Patients in a Proactive Strategy with Adalimumab. J Clin Med (2020) 9(9):2739. doi: 10.3390/jcm9092739
78. Wang SL, Hauenstein S, Ohrmund L, Shringarpure R, Salbato J, Reddy R, et al. Monitoring of adalimumab and antibodies-to-adalimumab levels in patient serum by the homogeneous mobility shift assay. J Pharm BioMed Anal (2013) 78-79:39–44. doi: 10.1016/j.jpba.2013.01.031
79. Jourdil JF, Némoz B, Gautier-Veyret E, Romero C, Stanke-Labesque F. Simultaneous Quantification of Adalimumab and Infliximab in Human Plasma by Liquid Chromatography-Tandem Mass Spectrometry. Ther Drug Monit (2018) 40(4):417–24. doi: 10.1097/FTD.0000000000000514
80. Ruiz-Argüello B, Ruiz del Agua A, Torres N, Monasterio A, Martí A, Nagore D. Comparison study of two commercially available methods for the determination of infliximab, adalimumab, etanercept and anti-drug antibody levels. Clin Chem Lab Med (2013) 6:1–3. doi: 10.1515/cclm-2013-0461
81. Bodini G, Giannini EG, Furnari M, Marabotto E, Baldissarro I, Del Nero L, et al. Comparison of two different techniques to assess adalimumab trough levels in patients with Crohn’s disease. J Gastrointestin Liver Dis (2015) 24(4):451–6. doi: 10.15403/jgld.2014.1121.244.adb
82. Van de Casteele N. Assays for measurement of TNF antagonists in practice. Frontline Gastroenterol (2017) 8:236–42. doi: 10.1136/flgastro-2016-100692
83. Bertin D, Serrero M, Grimaud JC, Desjeux A, Desplat-Jego S. Monitoring of infliximab trough levels and anti-infliximab antibodies in inflammatory bowel diseases: A comparison of three commercially available ELISA kits. Cytokine (2020) 126:154859. doi: 10.1016/j.cyto.2019.154859
84. Laserna-Mendieta EJ, Salvador-Martín S, Arias-González L, Ruiz-Ponce M, Menchén LA, Sánchez C, et al. Comparison of a new rapid method for the determination of adalimumab serum levels with two established ELISA kits. Clin Chem Lab Med (2019) 57(12):1906–14. doi: 10.1515/cclm-2019-0202
85. WHO Expert Committee on Biological Standardization. Sixty-seventh report. Proposed First WHO international standards (or reference panels) for antibodies for use in immunogenicity assessments of biotherapeutic products. WHO Tech Rep Ser (2017) 1004:53–4.
86. Wadhwa M, Mytych DT, Bird C, Troy E, Barger T, Dougall T, et al. Establishment of the first WHO erythropoietin antibody reference panel: report of an international collaborative study. J Immunol Methods (2016) 435:32–42. doi: 10.1016/j.jim.2016.05.005
87. Wadhwa M, Thorpe R. Harmonization and standardization of immunogenicity assessment of biotherapeutic products. Bioanalysis (2019) 11(17):1593–604. doi: 10.4155/bio-2019-0202
88. Little R, Sparrow MP. Anti-drug antibodies and the benefit of assay validation. Aliment Pharmacol Ther (2021) 53(1):194–5. doi: 10.1111/apt.16159
Keywords: international standard, biosimilars, potency, clinical monitoring, unit, product life-cycle, adalimumab
Citation: Wadhwa M, Bird C, Atkinson E, Cludts I and Rigsby P (2021) The First WHO International Standard for Adalimumab: Dual Role in Bioactivity and Therapeutic Drug Monitoring. Front. Immunol. 12:636420. doi: 10.3389/fimmu.2021.636420
Received: 01 December 2020; Accepted: 19 March 2021;
Published: 15 April 2021.
Edited by:
Luis Eduardo Coelho Andrade, Federal University of São Paulo, BrazilReviewed by:
Aldo Tagliabue, Italian National Research Council, ItalyCopyright © 2021 Wadhwa, Bird, Atkinson, Cludts and Rigsby. This is an open-access article distributed under the terms of the Creative Commons Attribution License (CC BY). The use, distribution or reproduction in other forums is permitted, provided the original author(s) and the copyright owner(s) are credited and that the original publication in this journal is cited, in accordance with accepted academic practice. No use, distribution or reproduction is permitted which does not comply with these terms.
*Correspondence: Meenu Wadhwa, TWVlbnUuV2FkaHdhQG5pYnNjLm9yZw==
Disclaimer: All claims expressed in this article are solely those of the authors and do not necessarily represent those of their affiliated organizations, or those of the publisher, the editors and the reviewers. Any product that may be evaluated in this article or claim that may be made by its manufacturer is not guaranteed or endorsed by the publisher.
Research integrity at Frontiers
Learn more about the work of our research integrity team to safeguard the quality of each article we publish.