 Anqi Lin1†
 Jian Zhang
 Peng Luo
94% of researchers rate our articles as excellent or good
Learn more about the work of our research integrity team to safeguard the quality of each article we publish.
Find out more
ORIGINAL RESEARCH article
Front. Immunol. , 08 March 2021
Sec. Cancer Immunity and Immunotherapy
Volume 12 - 2021 | https://doi.org/10.3389/fimmu.2021.630773
This article is part of the Research Topic Cancer Immunotherapies: From Efficacy to Resistance Mechanisms View all 42 articles
Immune checkpoint blockade (ICB) therapy has significantly progressed the treatment of bladder cancer (BLCA). Multiple studies have suggested that specific genetic mutations may serve as immune biomarkers for ICB therapy. Additionally, the nuclear receptor corepressor 1 (NCOR1) gene is a new player in the field of immune tolerance and the development of immune cells. In the ICI-treated-cohort, NCOR1 mutations may be used as a biomarker to predict the prognosis of BLCA patients receiving ICIs. The overall survival (OS) of the NCOR1-mutant (NCOR1-MT) group was significantly longer than that of NCOR1-wild-type (NCOR1-WT) group (P = 0·031; HR [95%CI]: 0·25 [0·12–0·52]). In the TCGA-BLCA-cohort, compared with NCOR1-WT, NCOR1-MT was associated with known predictors of ICB therapy efficacy, such as higher tumor mutational burden (TMB), neoantigen load and the number of mutations in the DNA damage-repair pathway. In addition, NCOR1-MT tumors had highly infiltrating TILs, activated antitumor immunity, and a high expression of immune-related genes, suggesting that NCOR1 mutations may serve as a potential biomarker to guide ICB therapy in BLCA.
Bladder cancer is the ninth most common malignant tumor worldwide, with approximately 540,000 new cases and 180,000 deaths each year (1). Due to its high recurrence rate after treatment and its biological behavior of malignant progression, routine treatment (such as intravesical bacillus Calmette-Guerin or platinum-based chemotherapy) frequently fails (2). For example, the median overall survival (OS) in relapsed or refractory bladder cancer patients with cisplatin is only 14–15 months; thus, alternate treatment strategies are needed (3). In recent years, immune checkpoint blockade (ICB) therapies, especially anti-programmed cell death (ligand) 1 (anti-PD-(L)1) and anti-cytotoxic T lymphocyte-associated antigen 4 (anti-CTLA-4), have provided new hope for bladder cancer patients. The United States Food and Drug Administration has approved five PD-(L)1 inhibitors for use as second-line or first-line treatment for advanced bladder cancer (3). In advanced bladder cancer, the overall response rates for immune checkpoint inhibitors (ICIs) are 13–24% (4–6), but most patients do not benefit from ICIs. Therefore, screening biomarkers for immunotherapy is particularly important to predict treatment response.
In addition to tumor mutational burden (TMB), microsatellite instability, mismatch repair gene deficiency, T-cell inflamed and IFN-γ gene expression profiles (GEPs), and DNA damage response (DDR) and antigen presentation defects may serve as potential biomarkers for ICB therapy (7). Studies have shown a correlation between specific genetic mutations and the efficacy of immunotherapy (8–10). POLE mutations are not only associated with high TMB and highly expressed immune checkpoint genes but are also linked to more durable clinical benefit from ICIs (11). Truncated mutations in PBRM1 are associated with improved clinical outcomes in patients with metastatic renal clear cell carcinoma receiving ICIs (12). TET1, SERPINB3 or SERPINB4 mutations are associated with improved antitumor immune responses in different tumors (e.g., pan-cancer and melanoma) (10). In addition, changes in the genome and epigenome are the main driving forces for the pathogenesis of bladder cancer, which suggests that specific genetic mutations may have potential value as biomarkers predicting treatment response in bladder cancer (3, 13).
Recently, research has suggested that nuclear receptor corepressor 1 (NCOR1) plays an essential role in immune tolerance and T cell development (14, 15). The deletion of NCOR1 leads to immune tolerance in dendritic cells (DCs), the differentiation trend of regulatory T cells (Tregs) and the upregulated expression of genes related to immune depletion (15). In addition, NCOR1-histone deacetylase (NCOR1-HDAC) complexes can inhibit Treg activity (14).
In this study, based on the ICI-treated bladder cancer cohort with mutation and immunotherapy prognosis data (reporter by Samstein et al.), we analyzed the efficacy of ICIs based on NCOR1 alteration status. The results indicated that NCOR1 mutations may be a potential biomarker for bladder cancer patients receiving ICIs. In addition to prolonged OS after treatment with ICIs, NCOR1 mutations were associated with higher tumor immunogenicity, activated antitumor immunity, a number of mutations in the DDR pathway, immune cells and upregulated expression of immune-related genes.
To assess the association between NCOR1 mutations and the prognosis of bladder cancer patients receiving ICIs, we collected an ICI-treated cohort [Samstein et al. (16)] with clinical and mutation data. With the clinical data after ICI therapies (targeting PD-1/PD-L1 and CTLA-4) and mutation data for cancer (n = 210), Kaplan–Meier (KM) analysis was performed for the ICI-treated cohort based on NCOR1 alteration status. The exclusion criteria for further analysis were samples with missing follow-up time or missing mutation data (n = 5). Data licensed under Creative Commons 3.0 from http://research-pub.gene.com/IMvigor210CoreBiologies/ were downloaded via the IMvigor210CoreBiologies package (17); the data included the genome, transcriptome, and corresponding clinical characteristics of patients with metastatic urothelial cancer (mUC) who received atezolizumab (an anti-PD-L1 agent).
The mutation data of the bladder cancer samples reported by Samstein et al. were sequenced by targeted next-generation sequencing (NGS; MSK-IMPACT). The neoantigen load (NAL) data in The Cancer Genome Atlas Urothelial Bladder Carcinoma (TCGA-BLCA) cohort were obtained from a literature review (18). The mutation data of the TCGA-BLCA cohort were downloaded using the “TCGAbiolinks” package in R software (19). Consistent with other literature (20), non-synonymous mutations in TCGA-BLCA were used as raw mutation counts and divided by 38 Mb to quantify TMB. The “ComplexHeatmap (21)” R package was used to visualize the mutational (top 20 mutational rate genes) and clinical profiles of the ICI-treated and TCGA-BLCA cohorts. The R package “Maftools (22)” was used to visualize NCOR1 mutation sites.
The “TCGAbiolinks” R package was used to download the gene expression data (Illumina HiSeq, RNA-Seq) of the TCGA-BLCA cohort (19). In this study, the GEPs of the TCGA-BLCA cohort were analyzed using the CIBERSORT (23) algorithm and the LM22 gene set to infer 22 human immune cell type proportions. In addition, we compared the expression of immune-related genes between the NCOR1-wild-type (NCOR1-WT) and NCOR1-mutant (NCOR1-MT) patients in the TCGA-BLCA cohort. The immune-related gene sets, functional classification and immune-related scores are available in the literature (18). The expression levels of these immune genes were quantified as log2 (FPKM + 1). Additionally, we used the ESTIMATE algorithm to calculate the stromal and immune scores and tumor purity of the TCGA-BLCA cohort (24).
The Broad GDAC Firehose website (http://gdac.broadinstitute.org/) was used to download the Affymetrix SNP 6.0 microarray data (hg19; germline/potential false-positive calls were removed) from TCGA-BLCA, and the data (CNV segments) were uploaded to the GenePattern (25) web portal (https://cloud.genepattern.org/gp/pages/index.jsf) with Genomic Identification of Significant Targets In Cancer 2.0 (GISTIC 2.0) analysis. GISTIC 2.0 analysis was estimated by default settings, with a confidence level of 0.99 and the removal of data from the X-chromosome before analysis. The R package “Maftools (22)” was used to visualize the CNV analysis results of GISTIC 2.0.
The R package “edgeR” was used to estimate gene expression changes (Raw Count) in the TCGA-BLCA cohort (26). Functional pathway analysis and GSEA were performed with the “clusterProfiler” R package (27) and MSigDB database of the Broad Institute (28). Gene Ontology (GO), Kyoto Encyclopedia of Genes and Genomes (KEGG) and Reactome terms were identified with a cutoff of P <0.05. Enrichment P values were based on 1,000 permutations. The gene sets related to the DDR pathway were collected from MSigDB (28). Detailed data are described in Additional File: Table S1. This DDR gene set was used to evaluate the number of non-synonymous mutations in the DDR pathway in the TCGA-BLCA cohort based on NCOR1 alteration status.
For comparisons of TMB, NAL, immune cell abundance, immune-related gene expression profile, age, MSI score, and mutation counts of the DDR pathway between the NCOR1-WT and NCOR1-MT patients in TCGA were estimated by the Mann–Whitney U test. Differences in the mutation status, sex, sample type and drug type between the NCOR1-WT and NCOR1-MT patients in the ICI-treated cohort were analyzed by Fisher’s exact test. Fisher’s exact test was also used to compare the mutation status, sex, race, ethnicity and clinical stage between the NCOR1-WT and NCOR1-MT patients in the TCGA-BLCA cohort. The KM method was used to generate survival curves for the subgroups in the ICI-treated cohort, and the log-rank test was used to determine the statistical significance of differences. P <0.05 was considered significant, and all statistical tests were two-sided. All statistical tests and visual analyses were completed in R software (version 3.6.1). In addition, the “ggpubr” R package was used to visualize boxplots (29). The false discovery rate (FDR) of CNV visualization was less than 0.05.
To explore the association between NCOR1 mutations and the efficacy of ICIs in bladder cancer patients, we used cBioportal to download the ICI-treated bladder cancer cohort (Samstein et al.), including 215 patients receiving ICIs (PD-(L)1 and/or CTLA-4 inhibitors. The exclusion criteria for the ICI-treated cohort before further survival analysis were bladder cancer samples with missing follow-up time or missing mutation data (n = 5). Survival analysis showed that the OS of NCOR1-MT patients after ICI treatment was significantly longer than that of NCOR1-WT patients (log-rank test P = 0.031; hazard ratio (HR) = 0.25, 95% CI: 0.12−0.52); median OS (15 months versus not reached; Figure 1A). Moreover, we found that the TCGA-BLCA patients had prolonged OS times compared with the NCOR1-WT patients in the ICI-treated BLCA cohort (P < 0.001, HR = 0.52, 95% Cl: 0.39–0.7; Figure S1). Although there was a significant difference between the two groups, the proportion of stage IV patients of the TCGA-BLCA cohort (33.09%) was also significantly lower than that of the ICI-treated cohort (94%). Thus, the difference between the proportion of stage IV patients may contribute to the difference in the KM analysis. Mutations or deletions of NCOR1 have been described in bladder cancer (30). Thus, deep deletions of NCOR1 have been taken into account. In another ICI-treated cohort (Mariathasan et al.), there were no significant differences in OS between patients with and without whole genomic alteration of NCOR1 (Figure S2A). In the TCGA-BLCA cohort, patients with NCOR1-WT had a worse OS compared with NCOR1-DEL patients (P = 0.032, HR = 4.08; 95CI: 2–8.35; Figure S2B).
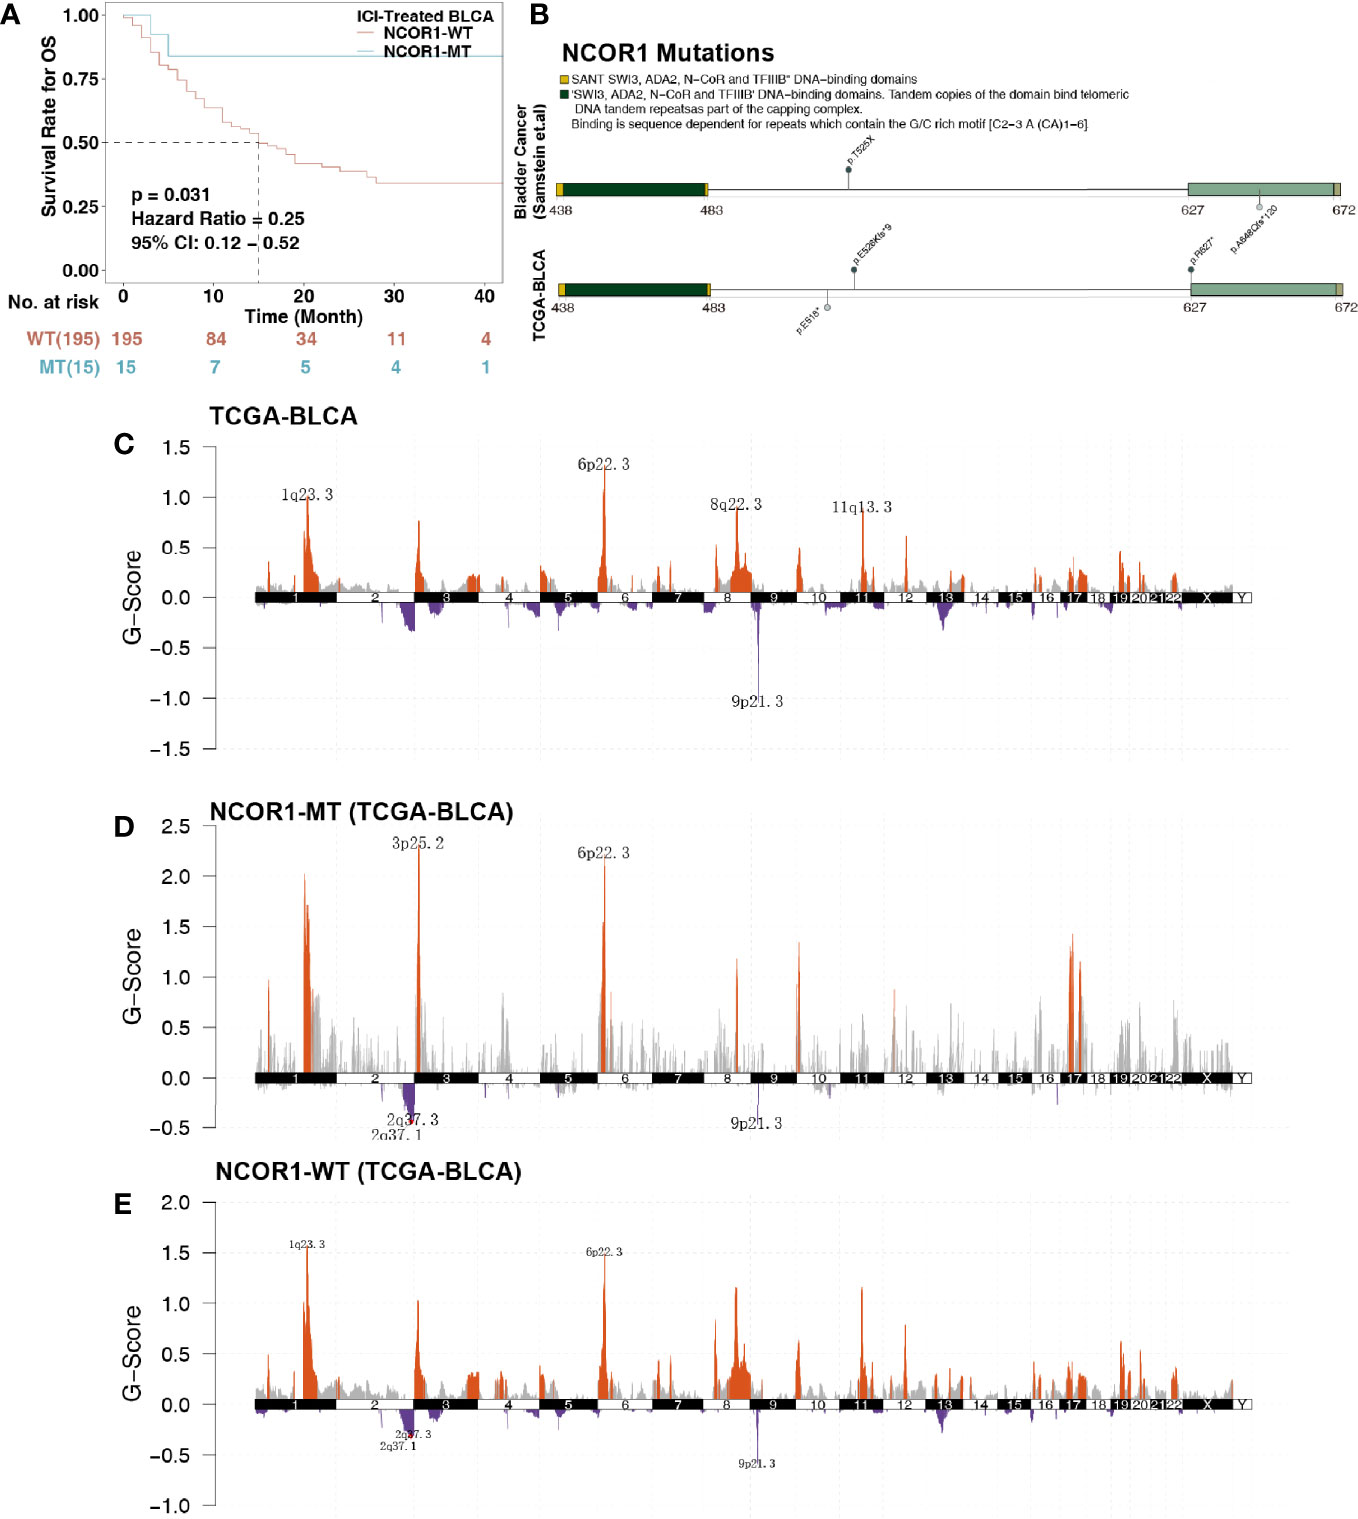
Figure 1 Survival curves and genetic characteristics of patients with BLCA stratified by NCOR1 status. (A) Kaplan–Meier estimates of OS in the ICI-treated BLCA cohort comparing patients with NCOR1-MT with their respective counterparts without NCOR1-MT. Patients (BLCA) who harbored NCOR1 mutations showed a better prognosis for ICI-based immunotherapy (P < 0.031, log-rank test). (B) Lollipop plot shows the distribution of NCOR1 mutations in the ICI-treated cohort (top panel) and TCGA-BLCA cohort (bottom panel). GISTIC 2.0 analysis showing the most consistent and relevant cytoband alterations in TCGA-BLCA (C), NCOR1-MT (D) and NCOR1-WT (E). The annotated cytobands met the criterion of false discovery rate (FDR) ≤0.05. ICIs, Immune checkpoint inhibitors; OS, overall survival; BLCA, bladder urothelial carcinoma; NCOR1, nuclear receptor corepressor 1; TCGA, The Cancer Genome Atlas; MT, mutant; WT, wild-type.
NCOR1 is a transcriptional coregulatory protein that includes conserved sequences, such as the DAD, SW13, ADA2, NCOR1, and SANT domains. The interaction between the DAD domain and histone deacetylase 3 (HDAC3) is a necessary condition for the activity of HDAC3. The changed amino acid coordinates of NCOR1 mutations in the ICI-treated and TCGA-BLCA cohorts are shown in Figure 1B. We found that NCOR1 somatic mutations (p. R627 * and p. A648Qfs * 120) occurred in the DAD domain. However, NCOR1 mutations did not include any functional hotspot mutations from 3D Hotspots (https://www.3dhotspots.org). Common and significant CNVs in NCOR1-MT and NCOR1-WT patients were identified using GISTIC 2.0. CNV analysis showed that the NCOR1-MT group had significant amplifications at 3p25, and 1q23.3 was identified in only the NCOR1-WT group. The annotated cytobands met the criterion of FDR ≤0.05.
Based on the NCOR1 mutation status, the association between the clinical characteristics of patients and the top 20 mutations was analyzed. In the ICI-treated cohort, sex, sample type, drug type, and MSI score were not significantly different between the NCOR1-MT and NCOR1-WT patients. The detailed baseline characteristics of patients with or without an NCOR1 mutation are summarized in Supplemental Table S2. In the TCGA-BLCA cohort, compared with the NCOR1-WT group, the proportion of males in the NCOR1-MT group was larger (80.0 versus 76.0%, P <0.05). Most of the NCOR1 mutations in the ICI-treated and TCGA-BLCA cohorts were missense mutations (50.0 and 61.0%), nonsense mutations (27.8 and 22.0%) and frameshift mutations (22.2 and 12.2%). The gene mutation profiles of the ICI-treated cohort are summarized in Figure 2A, and the results show that FAT1 (27.0 versus 9.0%, P <0.05) and CDKN2A (27.0 versus 8%, P <0.05) have higher mutation frequencies in NCOR1-MT patients. In the TCGA-BLCA cohort, TTN, KMT2D, MUC16, PIK3CA, SYNE1, HMCN1, EP300, MACF1, FLG and ELF3 had higher mutation frequencies in NCOR1-MT patients.
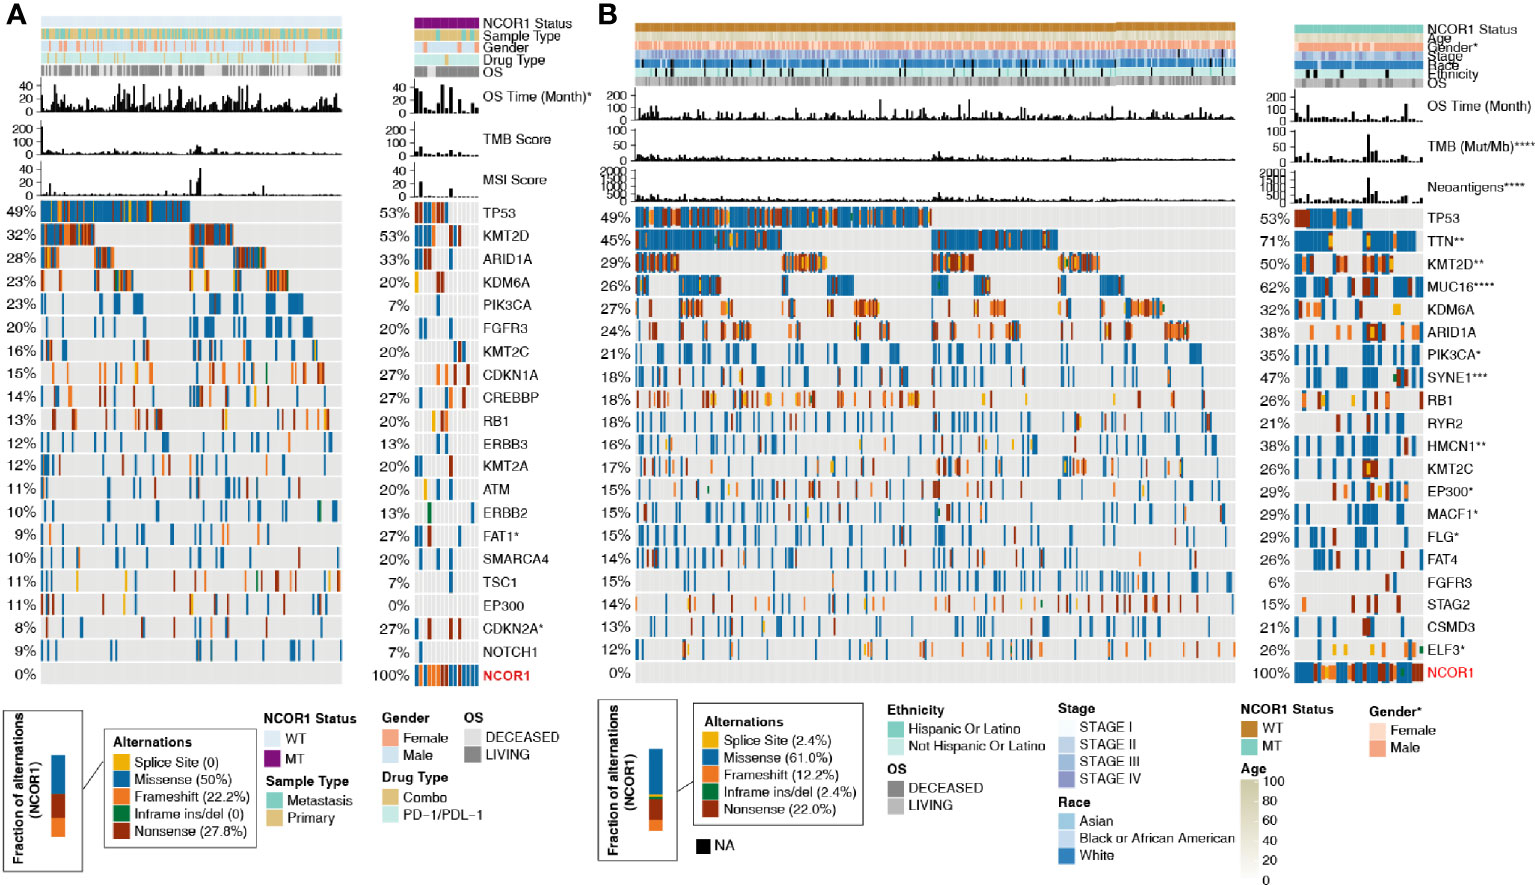
Figure 2 Mutational landscape, clinical information of BLCA patients and the characteristics of the NCOR1 mutations in patients. (A) The top 20 frequently mutated genes in BLCA in the Samstein cohort (ICI-treated). The genes were ranked by the mutation frequency in BLCA patients. The asterisks indicate a significant difference between NCOR1-MT and NCOR1-WT. The mutation rates, sex, drug type, and sample type were evaluated using Fisher’s exact test. The TMB and MSI scores were evaluated using the Mann–Whitney U test. (B) The top 20 frequently mutated genes in BLCA in the TCGA-BLCA cohort. The genes were ranked by the mutation frequency in BLCA patients. The mutation rates, clinical stage, race, sex and ethnicity were evaluated using Fisher’s exact test. TMB, NAL and age were evaluated using the Mann–Whitney U test. (*P < 0.05, **P < 0.01, ***P < 0.001, and ****P < 0.0001). BLCA, Bladder urothelial carcinoma; NCOR1, nuclear receptor corepressor 1; TMB, tumor mutation burden; NAL, neoantigen load; MT, mutant; WT, wild-type; MSI, microsatellite instability.
Based on the results of the current study, enhanced tumor immunogenicity predicts improved clinical response to ICIs. We compared the TMB and NAL between NCOR1-MT and NCOR1-WT tumors (Figures 3A–C), and the results showed that TMB [8.0 (4.8–16) Mb/Mut versus 3.7 (2.1–6.2) Mb/Mut] and NAL [170.0 (95.0–310.0) Mb versus 71.0 (40.0–130.0) Mb] were significantly increased in NCOR1-MT tumors. Based on the number of non-synonymous mutations in the DDR pathway related to the efficacy of ICIs (31–33), we used a DDR gene set (Supplementary Table) to compare the difference in the number of mutations in the DDR pathway between NCOR1-MT and NCOR1-WT tumors. Figure 3C shows that NCOR1-MT tumors had a significantly increased number of DDR pathway mutations (such as BER, HR, MMR, SSB, DSB, NER, and NHEJ, all P < 0.05). Additionally, the NCOR1-MT group had significantly higher TMB, NAL and DDR mutations compared with NCOR1-depletion (NCOR1-DEL) or no-alteration group (Figure S3).
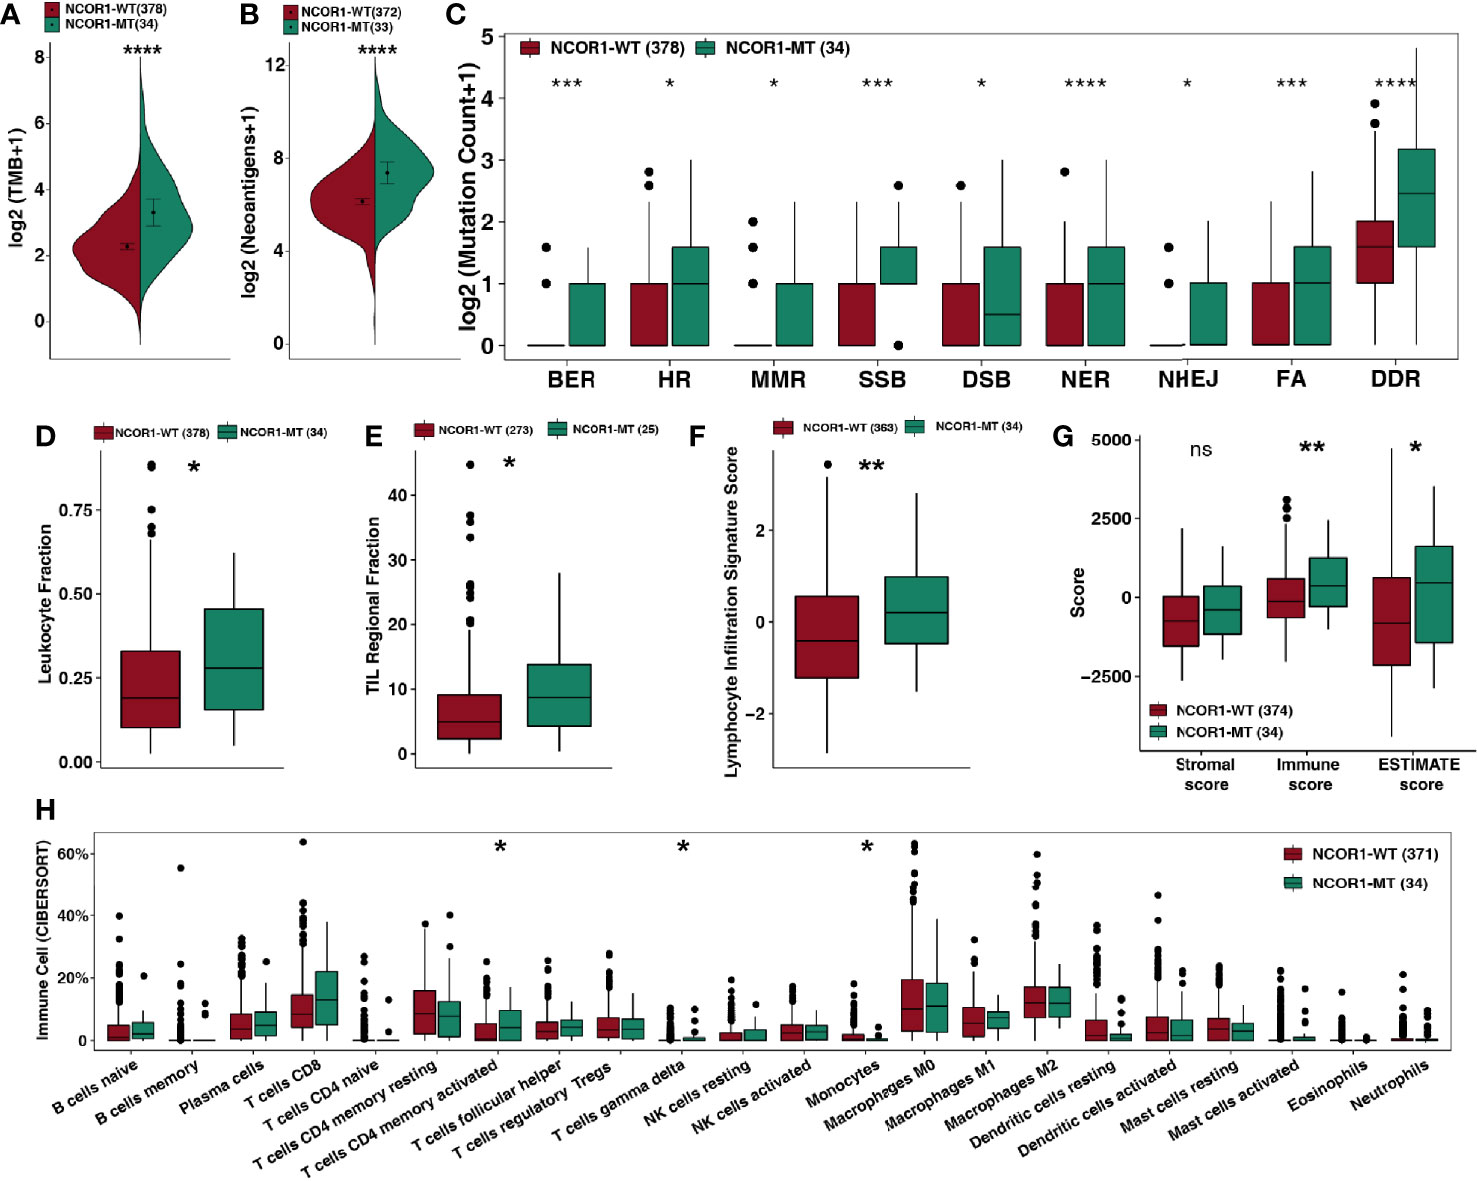
Figure 3 NCOR1 mutations were associated with enhanced tumor immunogenicity, higher immune scores and activated immune cells. (A, B) Comparison of TMB (A) and NAL (B) between NCOR1-MT and NCOR1-WT tumors in the TCGA-BLCA cohort. (C) Comparison of DNA damage-related gene set alterations between NCOR1-MT and NCOR1-WT tumors in the TCGA-BLCA cohort. (D–G), Comparison of leukocyte fraction (D), TIL regional fraction (E), lymphocyte infiltration signature score (F) and ESTIMATE-derived scores (G) between NCOR1-MT and NCOR1-WT tumors in the TCGA-BLCA cohort. (H) Comparison of immune cells between NCOR1-MT and NCOR1-WT tumors in the TCGA-BLCA cohort. Gene expression profiles were prepared using standard annotation files, and data were uploaded to the CIBERSORT web portal (http://cibersort.stanford.edu/), with the algorithm run using the LM22 signature and 1,000 permutations. (*P < 0.05, **P < 0.01, ***P < 0.001, and ****P < 0.0001, ns, not significant. (A–H) Mann–Whitney U test). TMB, tumor mutation burden; TCGA, The Cancer Genome Atlas; LUAD, lung adenocarcinoma; BLCA, bladder urothelial carcinoma; NCOR1, nuclear receptor corepressor 1; MT, mutant; WT: wild-type.
The above results suggest that the genome in NCOR1-MT tumors may be more unstable and may more easily accumulate mutations.
The TME is one of the important factors affecting the efficacy of ICIs and includes indicators such as tumor-infiltrating lymphocytes (TILs), the immune score, the stromal score and the cytolytic (CYT) score. Based on the NCOR1 mutation status, we compared the immune-related score (Figures 3D–F) calculated by Thorsson et al. The results showed that NCOR1-MT tumors had a higher leukocyte fraction score [0.28 (0.16–0.46) versus 0.19 (0.1–0.33); P <0.05], TIL regional fraction score [8.7 (4.3–14) versus 4.9 (2.3–9.1); P <0.05] and leukocyte infiltration signature score [0.2 (−0.47–0.98) versus −0.41 (−1.2–0.56); P < 0.01]. Similarly, the results of the ESTIMATE algorithm suggested that NCOR1-MT tumors have a higher immune score [370 (−290–1,200) versus −120 (−650–580); P < 0.01) and tumor purity [460 (−1400–1600) versus −810 (−2,100–620); P < 0.05]. The analysis results based on the CIBERSORT algorithm showed that activated CD4+ memory T cells and gamma delta T cells were highly infiltrated in NCOR1-MT tumors (all P < 0.05).
Studies suggest that specific GEPs are related to the clinical response to ICIs. According to the classification of immune gene function by Rooney et al. (34) and Thorsson et al., we compared the differences between immune-related GEPs in NCOR1-MT and NCOR1-WT tumors. NCOR1-MT tumors were associated with significantly upregulated expression of genes related to activated immune cells (such as B cells, CD4+ regulatory T cells, CD8+ T cells, macrophages, neutrophils and NK cells; Figures 4A, B). NCOR1-MT tumors had higher expression of antigen presentation-, cytolytic activity- and IFN response-related genes (Figure 4C). The results of the analysis of stimulating immune-related genes (Figures 4D, E) showed that chemokines, cytokines, and tumor necrosis factor receptor superfamily (TNFRSF)-related genes, including the well-known CXCL9, CXCL10, and IFNG genes (all P < 0.05), were significantly upregulated in NCOR1-MT tumors. NCOR1-MT tumors had significantly increased expression levels of immune checkpoint-related genes, such as CD274, CTLA4, LAG3, PDCD1, PDCD1LG2, and TIGIT (Figure 4F; P < 0.05). In addition, NCOR1-MT tumors had significantly increased expression levels of immune-depletion-related genes, such as HAVCR2 and IDO1 (Figure 4F; all P < 0.05).
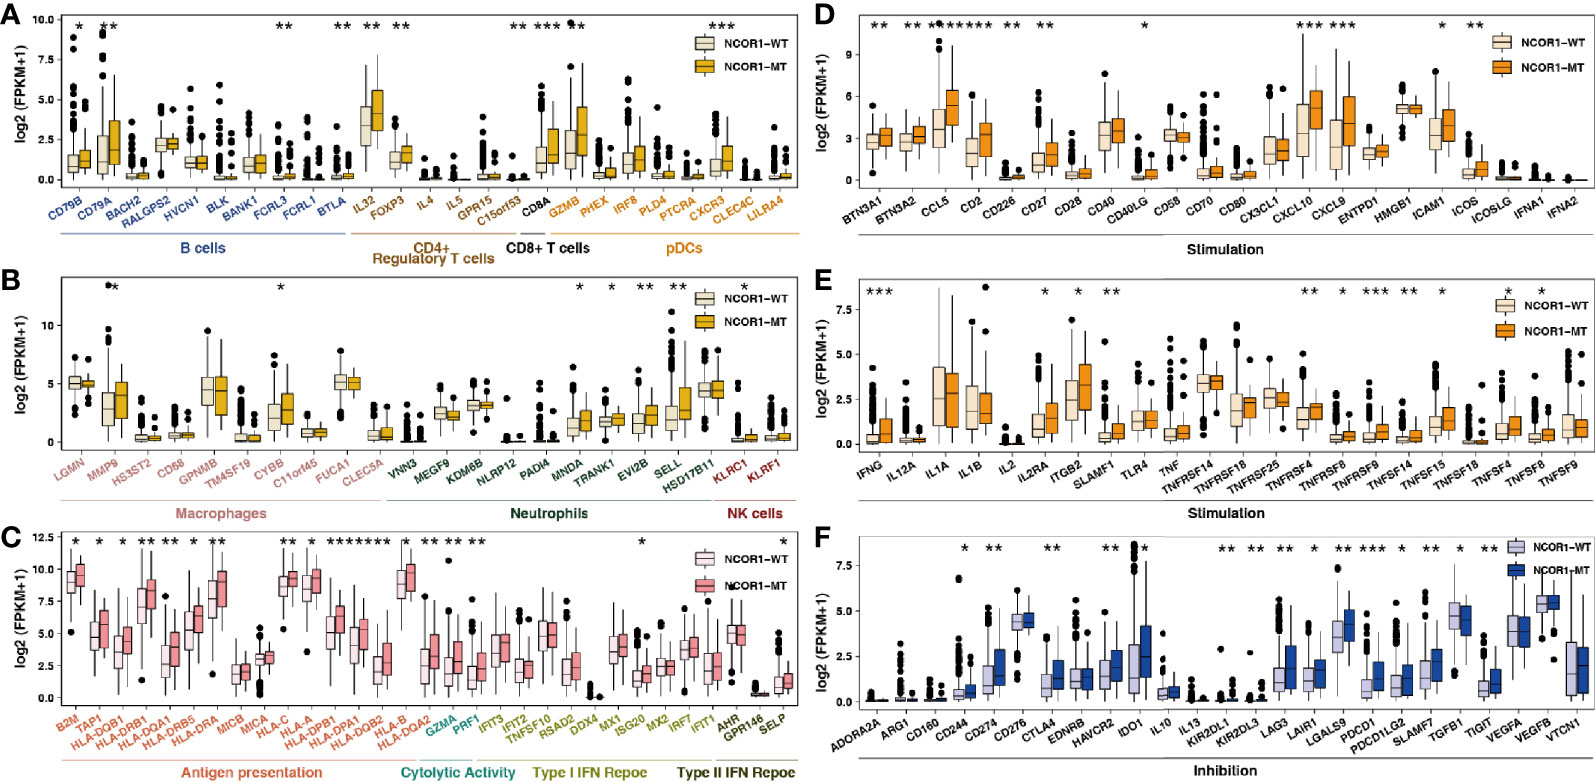
Figure 4 NCOR1 mutations were associated with activated antitumor immunity. The expression levels of immune-related genes, such as immune cells (A, B), antigen presentation-related genes, cytolytic activity-associated genes, IFN-response genes (C), stimulation-related genes (D, E) and inhibition-related genes (F) in NCOR1-MT tumors versus NCOR1-WT tumors in TCGA-BLCA. (*P < 0.05, **P < 0.01, ***P < 0.001, and ****P < 0.0001, (A–F: Mann–Whitney U test). TCGA, The Cancer Genome Atlas; LUAD, lung adenocarcinoma; BLCA, bladder urothelial carcinoma; NCOR1, nuclear receptor corepressor 1; MT, mutant; WT, wild-type.
Further analysis of the differences in the potential biological mechanisms between NCOR1-MT and NCOR1-WT tumors and the results of GSEA (Figures 5A–D) showed that oncogenic signaling pathways, such as the MAPK1/MAPK3, PI3K/AKT, and FGFR4 pathways, were significantly downregulated in the NCOR1-MT group. Similarly, metabolic-related pathways, such as cholesterol ester transport, intestinal cholesterol absorption, and medium-chain fatty acid metabolic process, were significantly downregulated in the NCOR1-MT group (Figures 5A, C). In contrast, immune response-related pathways, such as antigen processing and presentation via MHC class Ib, positive regulation of MHC class II biosynthetic process, dendritic cell chemotaxis, immune response to tumor cells, natural killer cell-mediated cytotoxicity, interferon-gamma production, response to interferon-gamma, and B cell-mediated immunity, were significantly upregulated in the NCOR1-MT group (Figures 5A, D).
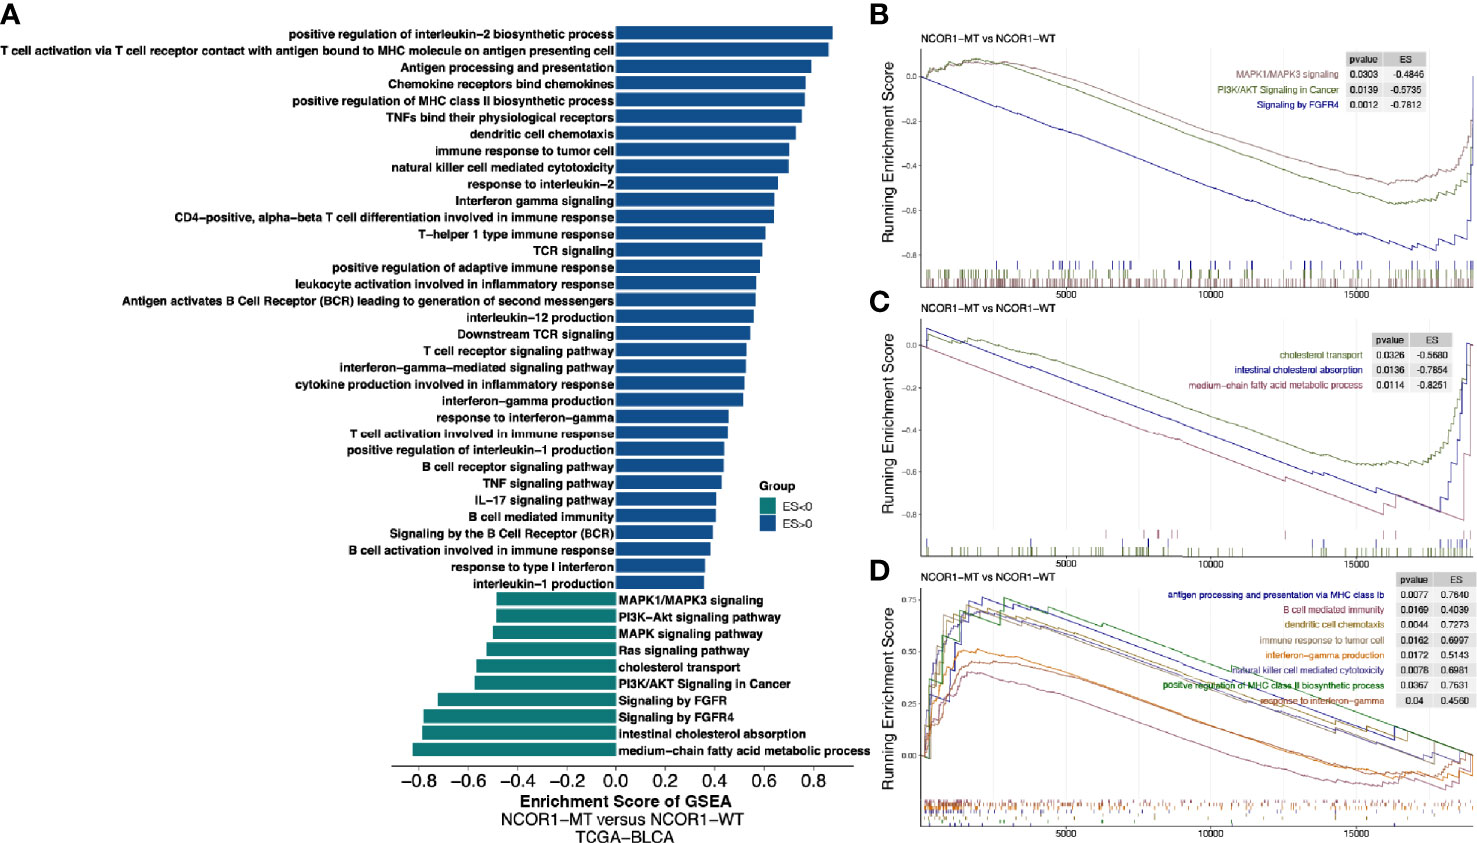
Figure 5 Transcriptome biological function traits of NCOR1-MT and NCOR1-WT tumors in the TCGA-BLCA cohort. (A) Differences in pathway activities scored by GSEA between NCOR1-MT and NCOR1-WT tumors in the TCGA-BLCA cohort. The enrichment results with significant associations between NCOR1-MT and NCOR1-WT tumors are shown. The blue bar indicates that the ES of the pathway is more than 0, while the green bar indicates that the ES of the pathway is less than 0. (B–D) GSEA of the hallmark gene sets downloaded from MSigDB. All transcripts were ranked by the log2 (fold change) between NCOR1-MT and NCOR1-WT tumors in the TCGA-BLCA cohort. Each run was performed with 1,000 permutations. The enrichment results with significant associations between NCOR1-MT and NCOR1-WT tumors are shown. NCOR1, nuclear receptor corepressor 1; MT, mutant; WT, wild-type; ES, enrichment score; GSEA, gene-set enrichment analysis.
Bladder cancer is one of the most common urinary system cancers worldwide, but traditional treatments have not significantly improved the 5-year survival rate (3). In recent years, immunotherapy (especially targeted PD-(L)1 and/or CTLA-4) has shown excellent prospects in bladder cancer. However, most patients with bladder cancer do not have an effective antitumor immune response, and guidance for immunotherapy lacks precise biomarkers. In this study, we found that compared with NCOR1-WT patients, NCOR1-MT patients have a significantly better OS. Based on the NCOR1 mutation status, we explored possible factors that may affect the difference in immunotherapy efficacy in tumor patients. We aimed to illustrate the interactions between NCOR1 mutations and the mechanisms of improved response to ICIs. We found some possible mechanisms that may help to improve clinical outcomes in NCOR1-MT bladder cancer (Figure 6): higher tumor immunogenicity (such as TMB, NAL, the number of DDR pathway mutations and the upregulated expression of antigen presentation-related genes); highly infiltrating TILs in the TME (such as CD4 + T cells and delta gamma T cells); upregulated expression of immune-related genes (such as immune-cell inflamed-related genes, IFN-γ, CYT, immune checkpoints and chemokines); and higher immune scores (such as TIL regional fraction score, leukocyte fraction score and leukocyte infiltration signature score). In addition, the GSEA results suggested that immune response-related pathways were significantly enriched in NCOR1-MT tumors. In contrast, oncogenic signaling pathways and metabolic-related pathways were significantly downregulated in NCOR1-MT tumors. Overall, these data indicate an association between NCOR1 mutations and improved survival after ICIs.
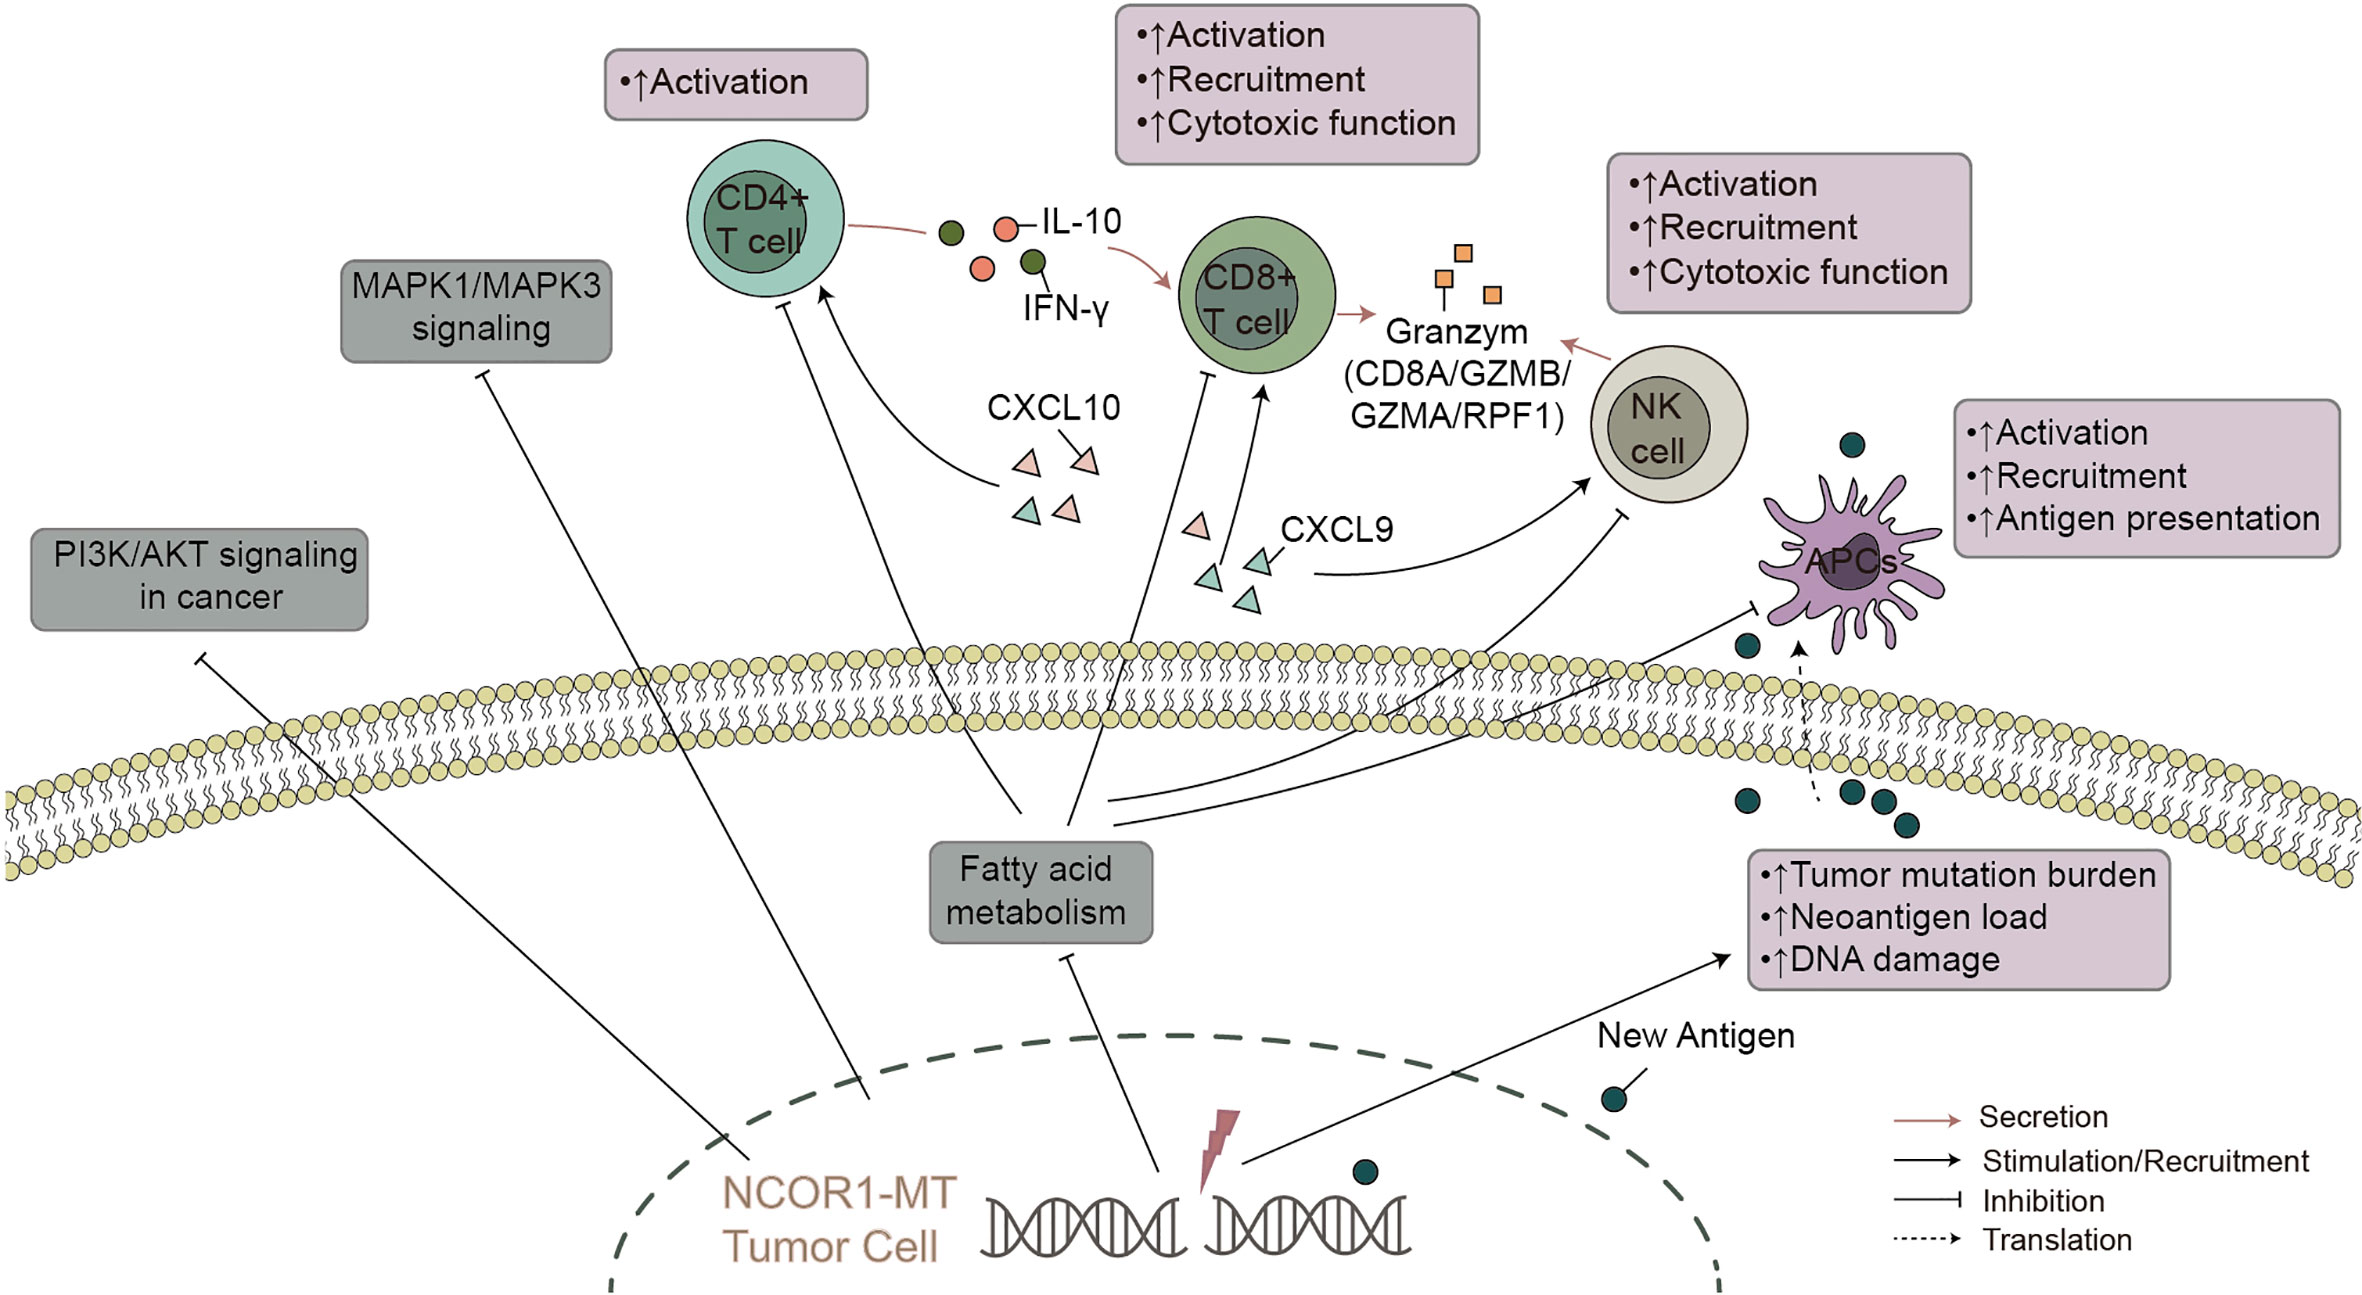
Figure 6 The possible mechanism underlying the improved efficacy and prognosis in NCOR1-MT BLCA receiving ICIs. NCOR1, nuclear receptor corepressor 1; MT, mutant; BLCA, bladder urothelial carcinoma; ICIs, immune checkpoint inhibitors.
Specific genetic mutations have been determined to predict the response to ICB therapy. For instance, mutations in the interferon signaling pathway genes JAK1/2, B 2M, IFNGR1, IFNGR2, and APLNR indicate that patients with melanoma are resistant to immunotherapy (35, 36); mutations in genes related to the DDR pathway, such as POLE, POLD1, MLH1, MSH2, PMS2, MSH6, BRCA1, BRCA2, TP53, PRKDC, LIG3, RAD17, RAD51C, FANCF, and ERCC1, are associated with higher TMB and improved response to ICIs (37, 38).
Regarding the regulation of the immune response, it has been reported that NCOR1 plays an important role in immune tolerance and the development of T cells. In previous studies, NCOR1 depletion upregulated a wide variety of tolerogenic genes in activated DCs ex vivo and in vivo, which consequently resulted in an increased frequency of FoxP3+ Tregs (15). Furthermore, a previous study suggested that NCOR1-HDAC complexes can inhibit the enhancing activity of Tregs (14). Therefore, we explored various mechanisms of the response to ICIs based on NCOR1 status in bladder cancer, which may serve as a future potential biomarker. NCOR1-MT tumors were related to longer OS in bladder cancer patients after ICI treatment. Then, we investigated certain factors predicting the response to ICIs, such as tumor immunogenicity, immune-related scores, immune cells, immune-related GEPs and the DDR pathway.
Multiple studies have demonstrated that tumor immunogenicity results in a promising response to ICIs (39–41). For example, high TMB has predictive value in a variety of cancers (40, 41). In addition, genome somatic mutations may produce new antigenic peptides. It is generally believed that tumors carrying more mutations may produce more new epitopes that are recognized by TILs. High NAL tumors could be more effective for ICIs, which has been shown in melanoma and non-small cell lung cancer (NSCLC) (39). DDR pathway mutations mediate genomic variation, high heterogeneity, and instability in tumors, which has been emphasized in ICIs. For example, tumors with mutations in the DDR pathway can accumulate a large amount of uncorrected DNA damage, leading to high TMB and independently relating to the efficacy of ICIs (31, 32). Hypothetically, the immunogenicity of tumors will also be affected by components related to the TME, such as the efficiency of antigen processing and presentation of professional antigen-presenting cells (pAPCs) (42). MHC-II molecules are mainly expressed by pAPCs such as DCs, B cells, and macrophages. Raw peptide antigens derived from foreign sources are presented to CD4+ T cells by MHC-II molecules. The expression of tumor-specific MHC-II molecules is associated with enhancing the ICI treatment response (43). Overall, higher immunogenicity (TMB, NAL, DDR pathway mutations and the expression of antigen presentation-related genes) may be an underlying mechanism related to NCOR1-MT tumors and promising responses to ICIs.
In addition to tumor immunogenicity, the TME, including TILs, chemokines, and cytokines, is also one of the most important factors affecting the efficacy of ICIs. TILs are a group of tumor-infiltrating and antigenic cell groups (such as T cells, B cells, NK cells, macrophages and DCs) that can exist in tumor nests and between tumors. Multiple studies have demonstrated that highly infiltrating TILs (such as CD8+ T cells and CD4+ T cells) are associated with improved ICI efficacy in a variety of tumors (3, 4, 6). In addition, specific chemokines play a vital role in recruiting immune cells to enhance antitumor immunogenicity. Notably, the CXCL9/CXCL10/CXCL11/CXCR3 axis recruits cytotoxic lymphocytes, NK cells, NKT cells, and macrophages to infiltrate tumor tissue and increases cytotoxic activity against tumor cells (44, 45). IFN-γ not only recruits immune cells to initiate antitumor proliferation and cause tumor apoptosis (46) but also mediates CD8+ T cells to promote iron death in tumor cells (47). Collectively, these data indicate that highly infiltrated TILs (CD4 + memory T cells) and the upregulated expression of immune cell-related genes (such as B cells, CD4 + regulatory T cells, CD8 + T cells, macrophages, neutrophils and NK cells), chemokines (CXCL9/CXCL10) and cytokines (IFN-γ) may improve the immune response in NCOR1-MT cells.
Recent studies suggest that T-cell inflamed and IFN-γ-related GEPs resulted in efficacy against ICIs (48). For example, the increased expression of CD8A, CD8B, GZMA, GZMB, and PRF1 is a predictor of higher CYT and better immune therapy response (48). Additionally, the upregulated expression of immune checkpoints is positively associated with response to ICIs (49, 50). Ahad et al. found that NCOR1 directly represses the tolerogenic program in conventional dendritic cells (cDCs), inhibiting the transcription of tolerogenic genes (e.g., IL-10, IDO, TGFBR1, IL-27 and PD-L1). In contrast, the depletion of NCoR1 in cDCs can lead to the development of Tregs, and cDCs can eventually become tolerogenic DCs. Consistent with the findings of Ahad et al., we found that patients with NCOR1-MT have a higher expression of immune depletion-related genes (such as CD274, CTLA4, LAG3, PDCD1, PDCD1LG2, TIGIT and IDO1).
The GSEA results also suggested that patients with NCOR1-MT have a better prognosis after ICI treatment. For example, immune-related response pathways, such as antigen presentation, IFN-γ production, and NK-mediated cytotoxic activity against tumors, were significantly upregulated in NCOR1-MT patients. There is a growing body of evidence demonstrating that the transportation and uptake of fatty acids can promote cancer metastasis and progression (51). Notably, the combination of cholesterol with the TCRβ transmembrane region can inhibit the cytotoxic activity of T cells against tumors (52). Our data are also consistent with the hypothesis that NCOR1-MT is associated with the development of an antitumor immune response (51–53).
This study analyzed the prognosis of ICI treatment and NCOR1 mutations in patients with bladder cancer and attempted to elucidate the underlying mechanism of NCOR1-MT as a biomarker for screening the predominant population of bladder cancer preferred for immunotherapy; however, there are still some limitations. First, this study included only one ICI-treated cohort of bladder cancer, which may introduce bias when screening biomarkers for the prognosis of ICIs of bladder cancer. Second, targeted sequencing (MSK-IMPACT) was used to detect somatic mutations in the ICI-treated cohort and included significantly fewer gene mutations than does whole-exome sequencing (WES). Third, there is currently no direct evidence of NCOR1 transcriptomics, CNV and protein levels and other data related to the prognosis of ICI treatment of bladder cancer patients. Fourth, there were some co-occurrence/mutually exclusive genes accompanying NCOR1 mutations. We hope to conduct relevant cell or animal experiments in the future to verify how NCOR1 mutations at different sites affect the efficacy of immunotherapy, explore the relationship between NCOR1 mutations and the TME, provide typical cases to further support this hypothesis and determine the role of other mutated genes that accompany NCOR1 mutations.
NCOR1 mutations may be a potential biomarker for predicting the prognosis of bladder cancer patients undergoing ICI treatment. In addition to prolonged OS after ICIs, NCOR1-MT positively correlated with many known predictive biomarkers of immunotherapy, including TMB, NAL, immune-related GEPs, immune cells and DDR pathway mutations. This result has translational relevance by providing a comprehensive profile of NCOR1 status in bladder cancer and a basis for further biomarker studies targeting NCOR1.
The original contributions presented in the study are included in the article/Supplementary Material. Further inquiries can be directed to the corresponding authors.
AL wrote the manuscript. PL and JZ designed the research. AL and ZQ performed the research. AL, ZQ, PL, and JZ, Writing—review and editing. All authors contributed to the article and approved the submitted version.
This work was supported by grants from the Science and Technology Project of Education Department of Jiangxi Province (Number 180812) and the Science and Technology Project of Health and Family Planning Commission of Jiangxi Province (Number 20195361).
The authors declare that the research was conducted in the absence of any commercial or financial relationships that could be construed as a potential conflict of interest.
We thank the biotrainee, Dr. Jianming Zeng (University of Macau), XiaoYa HuaTu, Lianchuan Biotechnology Limited (subsidiary of LC Sciences, Hangzhou, China), and Haplox Biotechnology Co., Ltd.
The Supplementary Material for this article can be found online at: https://www.frontiersin.org/articles/10.3389/fimmu.2021.630773/full#supplementary-material
Supplementary Table 2 | The detailed baseline characteristics of patients with or without NCOR1 mutations.
Supplementary Figure 1 | Kaplan–Meier estimates of OS in the ICI-treated BLCA cohort and TCGA-BLCA cohort.
Supplementary Figure 2 | Kaplan–Meier estimates of OS in the ICI-treated BLCA cohort (Mariathasan et al; (A) and TCGA-BLCA cohort (B).
Supplementary Figure 3 | Differences in TMB, NAL, or the counts of DDR mutations between the NCOR1-MT, NCOR1-DEL and no-alteration groups.
ICB, Immune checkpoint blockade; BLCA, bladder cancer; OS, overall survival; NCOR1-MT, NCOR1-mutant; NCOR1-WT, NCOR1-wild-type; anti-PD-(L)1, anti-programmed cell death (ligand) 1; anti-CTLA-4, anti-cytotoxic T lymphocyte-associated antigen 4; ICIs, immune checkpoint inhibitors; TMB, tumor mutational burden; GEPs, gene expression profiles; DDR, DNA damage response; NCOR1, nuclear receptor corepressor 1; DCs, dendritic cells; Tregs, regulatory T cells; NCOR1-HDAC, NCOR1-histone deacetylase; KM, Kaplan–Meier; NGS, next-generation sequencing; NAL, neoantigen load; TCGA-BLCA, The Cancer Genome Atlas Urothelial Bladder Carcinoma; GISTIC, Genomic Identification of Significant Targets In Cancer; GSEA, Gene set enrichment analysis; GO, Gene Ontology; KEGG, Kyoto Encyclopedia of Genes and Genomes; FDR, false discovery rate; HDAC3, histone deacetylase 3; TILs, tumor-infiltrating lymphocytes; CYT, cytolytic; TNFRSF, tumor necrosis factor receptor superfamily; NSCLC, non-small cell lung cancer; pAPCs, professional antigen presenting cells; cDCs, conventional dendritic cells; WES, whole-exome sequencing.
1. Feigin VL, Abajobir AA, Abate KH, Abd-Allah F, Abdulle AM, Abera SF, et al. Global, regional, and national burden of neurological disorders during 1990–2015: a systematic analysis for the Global Burden of Disease Study 2015. Lancet Neurol (2017) 16:877–97. doi: 10.1016/S1474-4422(17)30299-5
2. Kamat AM, Hahn NM, Efstathiou JA, Lerner SP, Malmström P-U, Choi W, et al. Bladder cancer. Lancet (2016) 388:2796–810. doi: 10.1016/S0140-6736(16)30512-8
3. Cheng W, Fu D, Xu F, Zhang Z. Unwrapping the genomic characteristics of urothelial bladder cancer and successes with immune checkpoint blockade therapy. Oncogenesis (2018) 7:2. doi: 10.1038/s41389-017-0013-7
4. Rosenberg JE, Hoffman-Censits J, Powles T, van der Heijden MS, Balar AV, Necchi A, et al. Atezolizumab in patients with locally advanced and metastatic urothelial carcinoma who have progressed following treatment with platinum-based chemotherapy: a single-arm, multicentre, phase 2 trial. Lancet (2016) 387:1909–20. doi: 10.1016/S0140-6736(16)00561-4
5. Sharma P, Callahan MK, Bono P, Kim J, Spiliopoulou P, Calvo E, et al. Nivolumab monotherapy in recurrent metastatic urothelial carcinoma (CheckMate 032): a multicentre, open-label, two-stage, multi-arm, phase 1/2 trial. Lancet Oncol (2016) 17:1590–8. doi: 10.1016/S1470-2045(16)30496-X
6. Balar AV, Galsky MD, Rosenberg JE, Powles T, Petrylak DP, Bellmunt J, et al. Atezolizumab as first-line treatment in cisplatin-ineligible patients with locally advanced and metastatic urothelial carcinoma: a single-arm, multicentre, phase 2 trial. Lancet (2017) 389:67–76. doi: 10.1016/S0140-6736(16)32455-2
7. Wang S, He Z, Wang X, Li H, Liu XS. Antigen presentation and tumor immunogenicity in cancer immunotherapy response prediction. eLife (2019) 8:e49020. doi: 10.7554/eLife.49020
8. Riaz N, Havel JJ, Kendall SM, Makarov V, Walsh LA, Desrichard A, et al. Recurrent SERPINB3 and SERPINB4 mutations in patients who respond to anti-CTLA4 immunotherapy. Nat Genet (2016) 48:1327–9. doi: 10.1038/ng.3677
9. Wang F, Zhao Q, Wang Y-N, Jin Y, He M-M, Liu Z-X, et al. Evaluation of POLE and POLD1 Mutations as Biomarkers for Immunotherapy Outcomes Across Multiple Cancer Types. JAMA Oncol (2019) 5:1504. doi: 10.1001/jamaoncol.2019.2963
10. Wu HX, Chen YX, Wang ZX, Zhao Q, He MM, Wang YN, et al. Alteration in TET1 as potential biomarker for immune checkpoint blockade in multiple cancers. J ImmunoTherapy Cancer (2019) 7:264. doi: 10.1186/s40425-019-0737-3
11. Mehnert JM, Panda A, Zhong H, Hirshfield K, Damare S, Lane K, et al. Immune activation and response to pembrolizumab in POLE-mutant endometrial cancer. J Clin Invest (2016) 126:2334–40. doi: 10.1172/JCI84940
12. Miao D, Margolis CA, Gao W, Voss MH, Li W, Martini DJ, et al. Genomic correlates of response to immune checkpoint therapies in clear cell renal cell carcinoma. Science (2018) 359:801–6. doi: 10.1126/science.aan5951
13. Weinstein JN, Akbani R, Broom BM, Wang W, Verhaak GW. Cancer Genome Atlas Research Network. Comprehensive molecular characterization of urothelial bladder carcinoma. Nature (2014) 507(7492):315. doi: 10.1038/nature12965
14. Müller L, Hainberger D, Stolz V, Ellmeier W. NCOR1—a new player on the field of T cell development. J Leukocyte Biol (2018) 104:1061–8. doi: 10.1002/JLB.1RI0418-168R
15. Ahad A, Stevanin M, Smita S, Mishra GP, Gupta D, Waszak S, et al. NCoR1: Putting the Brakes on the Dendritic Cell Immune Tolerance. iScience (2019) 19:996–1011. doi: 10.1016/j.isci.2019.08.024
16. Samstein RM, Lee C-H, Shoushtari AN, Hellmann MD, Shen R, Janjigian YY, et al. Tumor mutational load predicts survival after immunotherapy across multiple cancer types. Nat Genet (2019) 51:202–6. doi: 10.1038/s41588-018-0312-8
17. Mariathasan S, Turley SJ, Nickles D, Castiglioni A, Yuen K, Wang Y, et al. TGFβ attenuates tumour response to PD-L1 blockade by contributing to exclusion of T cells. Nature (2018) 554:544–8. doi: 10.1038/nature25501
18. Thorsson V, Gibbs DL, Brown SD, Wolf D, Bortone DS, Ou Yang T-H, et al. The Immune Landscape of Cancer. Immunity (2018) 48:812–830.e14. doi: 10.1016/j.immuni.2018.03.023
19. Colaprico A, Silva TC, Olsen C, Garofano L, Cava C, Garolini D, et al. TCGAbiolinks: an R/Bioconductor package for integrative analysis of TCGA data. Nucleic Acids Res (2016) 44:e71–1. doi: 10.1093/nar/gkv1507
20. Chalmers ZR, Connelly CF, Fabrizio D, Gay L, Ali SM, Ennis R, et al. Analysis of 100,000 human cancer genomes reveals the landscape of tumor mutational burden. Genome Med (2017) 9:34. doi: 10.1186/s13073-017-0424-2
21. Gu Z, Eils R, Schlesner M. Complex heatmaps reveal patterns and correlations in multidimensional genomic data. Bioinformatics (2016) 32:2847–9. doi: 10.1093/bioinformatics/btw313
22. Mayakonda A, Lin D-C, Assenov Y, Plass C, Koeffler HP. Maftools: efficient and comprehensive analysis of somatic variants in cancer. Genome Res (2018) 28:1747–56. doi: 10.1101/gr.239244.118
23. Newman AM, Liu CL, Green MR, Gentles AJ, Feng W, Xu Y, et al. Robust enumeration of cell subsets from tissue expression profiles. Nat Methods (2015) 12:453–7. doi: 10.1038/nmeth.3337
24. Yoshihara K, Shahmoradgoli M, Martínez E, Vegesna R, Kim H, Torres-Garcia W, et al. Inferring tumour purity and stromal and immune cell admixture from expression data. Nat Commun (2013) 4:2612. doi: 10.1038/ncomms3612
25. Reich M, Liefeld T, Gould J, Lerner J, Tamayo P. GenePattern 2.0 - Nature Genetics. Nat Genet (2006) 38(5):500–1. doi: 10.1038/ng0506-500
26. Robinson MD, McCarthy DJ, Smyth GK. edgeR: a Bioconductor package for differential expression analysis of digital gene expression data. Bioinformatics (2010) 26:139–40. doi: 10.1093/bioinformatics/btp616
27. Yu G, Wang L-G, Han Y, He Q-Y. clusterProfiler: an R Package for Comparing Biological Themes Among Gene Clusters. OMICS: A J Integr Biol (2012) 16:284–7. doi: 10.1089/omi.2011.0118
28. Subramanian A, Tamayo P, Mootha VK, Mukherjee S, Ebert BL, Gillette MA, et al. Gene set enrichment analysis: A knowledge-based approach for interpreting genome-wide expression profiles. Proc Natl Acad Sci (2005) 102:15545–50. doi: 10.1073/pnas.0506580102
29. Kassambara A. ggpubr: “ggplot2” Based Publication Ready Plots. R package version 0.1.7. (2018). Available at: https://CRANR-projectorg/package=ggpubr, doi:R package version 0.1.8.
30. Noblejas-López M, del M, Morcillo-García S, Nieto-Jiménez C, Nuncia-Cantarero M, Győrffy B, et al. Evaluation of transcriptionally regulated genes identifies NCOR1 in hormone receptor negative breast tumors and lung adenocarcinomas as a potential tumor suppressor gene. PloS One (2018) 13:e0207776. doi: 10.1371/journal.pone.0207776
31. Teo MY, Seier K, Ostrovnaya I, Regazzi AM, Kania BE, Moran MM, et al. Alterations in DNA Damage Response and Repair Genes as Potential Marker of Clinical Benefit From PD-1/PD-L1 Blockade in Advanced Urothelial Cancers. J Clin Oncol (2018) 36:1685–94. doi: 10.1200/JCO.2017.75.7740
32. Wang J, Wang Z, Zhao J, Wang G, Zhang F, Zhang Z, et al. Co-mutations in DNA damage response pathways serve as potential biomarkers for immune checkpoint blockade. Cancer Res (2018) 78(22):6486–96. doi: 10.1158/0008-5472.CAN-18-1814 canres.1814.2018.
33. Luo P, Lin A, Li K, Wei T, Zhang J. DDR Pathway Alteration, Tumor Mutation Burden, and Cisplatin Sensitivity in Small Cell Lung Cancer: Difference Detected by Whole Exome and Targeted Gene Sequencing. J Thoracic Oncol (2019) 14:e276–9. doi: 10.1016/j.jtho.2019.08.2509
34. Rooney MS, Shukla SA, Wu CJ, Getz G, Hacohen N. Molecular and Genetic Properties of Tumors Associated with Local Immune Cytolytic Activity. Cell (2015) 160:48–61. doi: 10.1016/j.cell.2014.12.033
35. Gao J, Shi LZ, Zhao H, Chen J, Xiong L, He Q, et al. Loss of IFN-γ Pathway Genes in Tumor Cells as a Mechanism of Resistance to Anti-CTLA-4 Therapy. Cell (2016) 167:397–404.e9. doi: 10.1016/j.cell.2016.08.069
36. Zaretsky JM, Garcia-Diaz A, Shin DS, Escuin-Ordinas H, Hugo W, Hu-Lieskovan S, et al. Mutations Associated with Acquired Resistance to PD-1 Blockade in Melanoma. New Engl J Med (2016) 375:819–29. doi: 10.1056/NEJMoa1604958
37. Howitt BE, Shukla SA, Sholl LM, Ritterhouse LL, Watkins JC, Rodig S, et al. Association of Polymerase e–Mutated and Microsatellite-Instable Endometrial Cancers With Neoantigen Load, Number of Tumor-Infiltrating Lymphocytes, and Expression of PD-1 and PD-L1. JAMA Oncol (2015) 1:1319. doi: 10.1001/jamaoncol.2015.2151
38. Le DT, Uram JN, Wang H, Bartlett BR, Kemberling H, Eyring AD, et al. PD-1 Blockade in Tumors with Mismatch-Repair Deficiency. New Engl J Med (2015) 372:2509–20. doi: 10.1056/NEJMoa1500596
39. Snyder A, Makarov V, Merghoub T, Yuan J, Zaretsky JM, Desrichard A, et al. Genetic Basis for Clinical Response to CTLA-4 Blockade in Melanoma. New Engl J Med (2014) 371:2189–99. doi: 10.1056/NEJMoa1406498
40. Büttner R, Longshore JW, López-Ríos F, Merkelbach-Bruse S, Normanno N, Rouleau E, et al. Implementing TMB measurement in clinical practice: considerations on assay requirements. ESMO Open (2019) 4:e000442. doi: 10.1136/esmoopen-2018-000442
41. Wang L, Yan K, Zhou J, Zhang N, Wang M, Song J, et al. Relationship of liver cancer with LRP1B or TP53 mutation and tumor mutation burden and survival. J Clin Oncol (2019) 37:1573–3. doi: 10.1200/JCO.2019.37.15_suppl.1573
42. Mellman I, Steinman RM. Dendritic Cells. Cell (2001) 106:255–8. doi: 10.1016/S0092-8674(01)00449-4
43. Rodig SJ, Gusenleitner D, Jackson DG, Gjini E, Giobbie-Hurder A, Jin C, et al. MHC proteins confer differential sensitivity to CTLA-4 and PD-1 blockade in untreated metastatic melanoma. Sci Trans Med (2018) 10:eaar3342. doi: 10.1126/scitranslmed.aar3342
44. Tokunaga R, Zhang W, Naseem M, Puccini A, Berger MD, Soni S, et al. CXCL9, CXCL10, CXCL11/CXCR3 axis for immune activation – A target for novel cancer therapy. Cancer Treat Rev (2018) 63:40–7. doi: 10.1016/j.ctrv.2017.11.007
45. Vitiello GA, Miller G. Targeting the interleukin-17 immune axis for cancer immunotherapy. J Exp Med (2020) 217(1):e20190456. doi: 10.1084/jem.20190456
46. Fritzell S, Eberstål S, Sandén E, Visse E, Darabi A, Siesjö P. IFNγ in combination with IL-7 enhances immunotherapy in two rat glioma models. J Neuroimmunol (2013) 258:91–5. doi: 10.1016/j.jneuroim.2013.02.017
47. Stockwell BR, Jiang X. A Physiological Function for Ferroptosis in Tumor Suppression by the Immune System. Cell Metab (2019) 30:14–5. doi: 10.1016/j.cmet.2019.06.012
48. Jiang P, Gu S, Pan D, Fu J, Sahu A, Hu X, et al. Signatures of T cell dysfunction and exclusion predict cancer immunotherapy response. Nat Med (2018) 24:1550–8. doi: 10.1038/s41591-018-0136-1
49. Powles T, Eder JP, Fine GD, Braiteh FS, Loriot Y, Cruz C, et al. MPDL3280A (anti-PD-L1) treatment leads to clinical activity in metastatic bladder cancer. Nature (2014) 515:558–62. doi: 10.1038/nature13904
50. El-Khoueiry AB, Sangro B, Yau T, Crocenzi TS, Kudo M, Hsu C, et al. Nivolumab in patients with advanced hepatocellular carcinoma (CheckMate 040): an open-label, non-comparative, phase 1/2 dose escalation and expansion trial. Lancet (2017) 389:2492–502. doi: 10.1016/S0140-6736(17)31046-2
51. Kim Y-S, Jung J, Jeong H, Lee J-H, Oh HE, Lee ES, et al. High Membranous Expression of Fatty Acid Transport Protein 4 Is Associated with Tumorigenesis and Tumor Progression in Clear Cell Renal Cell Carcinoma. Dis Markers (2019) 2019:1–7. doi: 10.1155/2019/5702026
52. Swamy M, Beck-Garcia K, Beck-Garcia E, Hartl FA, Morath A, Yousefi OS, et al. A Cholesterol-Based Allostery Model of T Cell Receptor Phosphorylation. Immunity (2016) 44:1091–101. doi: 10.1016/j.immuni.2016.04.011
Keywords: nuclear receptor corepressor 1 (NCOR1), mutations, immune checkpoint inhibitor, bladder cancer, tumor microenvironment
Citation: Lin A, Qiu Z, Zhang J and Luo P (2021) Effect of NCOR1 Mutations on Immune Microenvironment and Efficacy of Immune Checkpoint Inhibitors in Patient with Bladder Cancer. Front. Immunol. 12:630773. doi: 10.3389/fimmu.2021.630773
Received: 19 November 2020; Accepted: 20 January 2021;
Published: 08 March 2021.
Edited by:
Nathalie Labarriere, Institut National de la Santé et de la Recherche Médicale (INSERM), FranceReviewed by:
Fonteneau Jean-francois, INSERM U1232 Centre de Recherche en, Cancérologie et Immunologie Nantes Angers (CRCINA), FranceCopyright © 2021 Lin, Qiu, Zhang and Luo. This is an open-access article distributed under the terms of the Creative Commons Attribution License (CC BY). The use, distribution or reproduction in other forums is permitted, provided the original author(s) and the copyright owner(s) are credited and that the original publication in this journal is cited, in accordance with accepted academic practice. No use, distribution or reproduction is permitted which does not comply with these terms.
*Correspondence: Jian Zhang, YmxhY2t0aWdlckAxMzkuY29t; Peng Luo, bHVvcGVuZ0BzbXUuZWR1LmNu
†These authors have contributed equally to this work
Disclaimer: All claims expressed in this article are solely those of the authors and do not necessarily represent those of their affiliated organizations, or those of the publisher, the editors and the reviewers. Any product that may be evaluated in this article or claim that may be made by its manufacturer is not guaranteed or endorsed by the publisher.
Research integrity at Frontiers
Learn more about the work of our research integrity team to safeguard the quality of each article we publish.